Article

Modelling Pressure Dynamic of Oil–Gas Two-Phase Flow in Three-Zone Composite Double-Porosity Media Formation with Permeability Stress Sensitivity

National Key Laboratory of Oil & Gas Reservoir Geology and Exploitation, Southwest Petroleum University, Chengdu 610500, China
*
Author to whom correspondence should be addressed.
Energies 2025, 18(9), 2209; https://doi.org/10.3390/en18092209 (registering DOI)
Submission received: 20 March 2025 / Revised: 22 April 2025 / Accepted: 24 April 2025 / Published: 26 April 2025
(This article belongs to the Topic Exploitation and Underground Storage of Oil and Gas)

Abstract

:
In view of the flow zoning phenomenon existing in condensate gas reservoirs and the complex pore structure and strong heterogeneity of carbonate rock reservoirs, this study investigates the pressure dynamic behavior during the development process of such gas reservoirs by establishing corresponding models. The model divides the reservoir into three zones. The fluid flow patterns and reservoir physical property characteristics in the three regions are different. In particular, the fracture system in zone 1 has permeability stress sensitivity. The model is solved and the sensitivity analysis of the key parameters is carried out. The research results show that reservoir flow can be divided into 12 stages. Stress sensitivity affects all stages except the wellbore storage stage and becomes increasingly obvious over time. The closed boundary causes fracture closure from the lack of external energy, reducing effective flow channels and triggering the boundary response stage earlier. The increased condensate oil increases the flow resistance and pressure loss, and shortens the duration of the flow stage. The research suggests that improving reservoir conditions and enhancing fluid fluidity can reduce pressure loss and increase production capacity, providing valuable theoretical and practical guidance for the development of carbonate rock condensate gas reservoirs.

1. Introduction

Compared to conventional dry gas reservoirs, condensate gas reservoirs have a special retrograde condensate phenomenon, which causes complex phase changes of underground fluid in the development process and significantly reduces oil and gas recovery. In addition, because condensate gas reservoirs occupy a large proportion of global natural gas reserves, scholars have extensively studied the reverse condensate phenomenon. Since Katz et al. discussed the use of the term “retrograde condensation” in the context of its application to the petroleum industry [1], researchers have begun to investigate the complex flow behaviors in condensate gas reservoirs. Muskat was the first to propose the “condensate banking effect” [2]. Building on the work of Jones et al. [3], Fevang and Whitson established a three-zone composite model for condensate gas reservoirs and introduced a pseudo-pressure function for gas well productivity prediction [4]. Gringarten et al. verified the existence of the three-zone composite phenomenon in condensate gas reservoirs through experiments and numerical simulations [5]. More recently, in 2020, Mithani et al. investigated the phenomenon of condensate blockage and its dynamic behavior below the dew point pressure [6], based on well-test interpretation and numerical modeling of example wells. It can be found from previous studies that the three-zone composite phenomenon is common in the development process of condensate gas reservoirs. Therefore, scholars put forward a development method with the core idea of maintaining pressure and carried out related research to reduce the impact of reverse condensation phenomenon on production [7,8,9].
Compared with conventional sandstone reservoirs, the physical properties of carbonate reservoirs are more complicated because of their special geological characteristics. Carbonate reservoirs are mainly composed of calcite, dolomite and other minerals, which are highly heterogeneous. Moreover, the reservoir develops many types of pores (such as intergranular pores and solution pores) and natural fractures, forming a double porosity system represented by matrix and fractures [10]. Meanwhile, the stress sensitivity of the reservoir has a critical impact on the permeability and productivity of carbonate condensate gas reservoirs. Scholars have carried out a lot of research on stress sensitivity. The research results show that the increase of effective stress will lead to the decrease of porosity and permeability [11,12,13], and permeability is more sensitive to stress changes [14,15]. For carbonate reservoirs with double porous media, strong stress sensitivity will lead to fracture closure and pore shrinkage [16]. Studies have shown that the influence of stress sensitivity on fracture permeability is greater than that on pore permeability [17,18].
In particular, deep carbonate condensate gas reservoirs have complex pore media, high temperature and pressure, strong interlayer heterogeneity and unstable lateral distribution [19]. These factors make the pressure retaining development of condensate gas reservoir difficult and low benefit. Therefore, during the development of carbonate condensate gas reservoir, formation pressure will drop below the dew point pressure and condensate will be precipitated. Due to the different pressure drop of gas reservoir in different areas, the condensate content in the area is different and the fluid flow mode is different, forming the gas reservoir flow zonation phenomenon. In addition, due to the strong lateral heterogeneity and complex pore-fracture structure of carbonate reservoirs, there are obvious differences in the lithology, porosity and fracture development degree in different regions, which will lead to the zonation of reservoir physical properties. Scholars have carried out a lot of model research on this kind of reservoir with double porosity media and multi-zone compound. Barenblatt et al. were the first to view the rock layers as a dual-porosity system, explaining the relationship between fractures and matrix pores from the perspective of fluid exchange [20]. Warren and Root further proposed a dual-porosity characteristic model, emphasizing that while the matrix pore volume is large [21], its flow capacity is limited, with high-permeability fractures serving as the primary flow pathways. Nie et al. proposed a dual-permeability flow model where both fractures and matrix act as directly connected pathways to the well bottom [22]. Recently, Ji et al. proposed a percolation model featuring dual permeability and quadruple porosity to better represent the complex behavior of carbonate reservoirs [23]. Du et al. proposed a wellbore-connected testing interpretation model [24]. Li et al. established a model for composite reservoirs and dual-porosity media [25]. Zhang et al. developed a model that considers stress sensitivity and dual media [26].
To sum up, carbonate condensate gas reservoirs not only have spatial partitioning of fluid properties and flow behavior due to pressure changes, but also have natural heterogeneity and significant stress sensitivity due to geological structure. Currently, there are very few dynamic pressure models addressing the zonation of flow behavior and reservoir properties in carbonate condensate gas reservoirs and models that further incorporate stress sensitivity on this basis are almost nonexistent. Therefore, the purpose of this study is to establish a new model to analyze the effects of complex reservoir structure, complex fluid properties and significant fracture permeability stress sensitivity on pressure dynamics in carbonate condensate gas reservoirs. In this study, a pressure dynamic model was established considering the influence of dual-porosity media, composite reservoir structure, composite fluid properties and fracture permeability stress sensitivity of the inner reservoir. The model was derived and solved and the influences of fracture permeability stress sensitivity, reservoir zone fluid properties and reservoir zone physical properties on pressure dynamic curves are analyzed in detail. This study can provide theoretical support and guidance for the development of composite condensate gas reservoirs with dual-porosity media and three zones considering fracture permeability stress sensitivity, which is represented by carbonate condensate gas reservoirs.

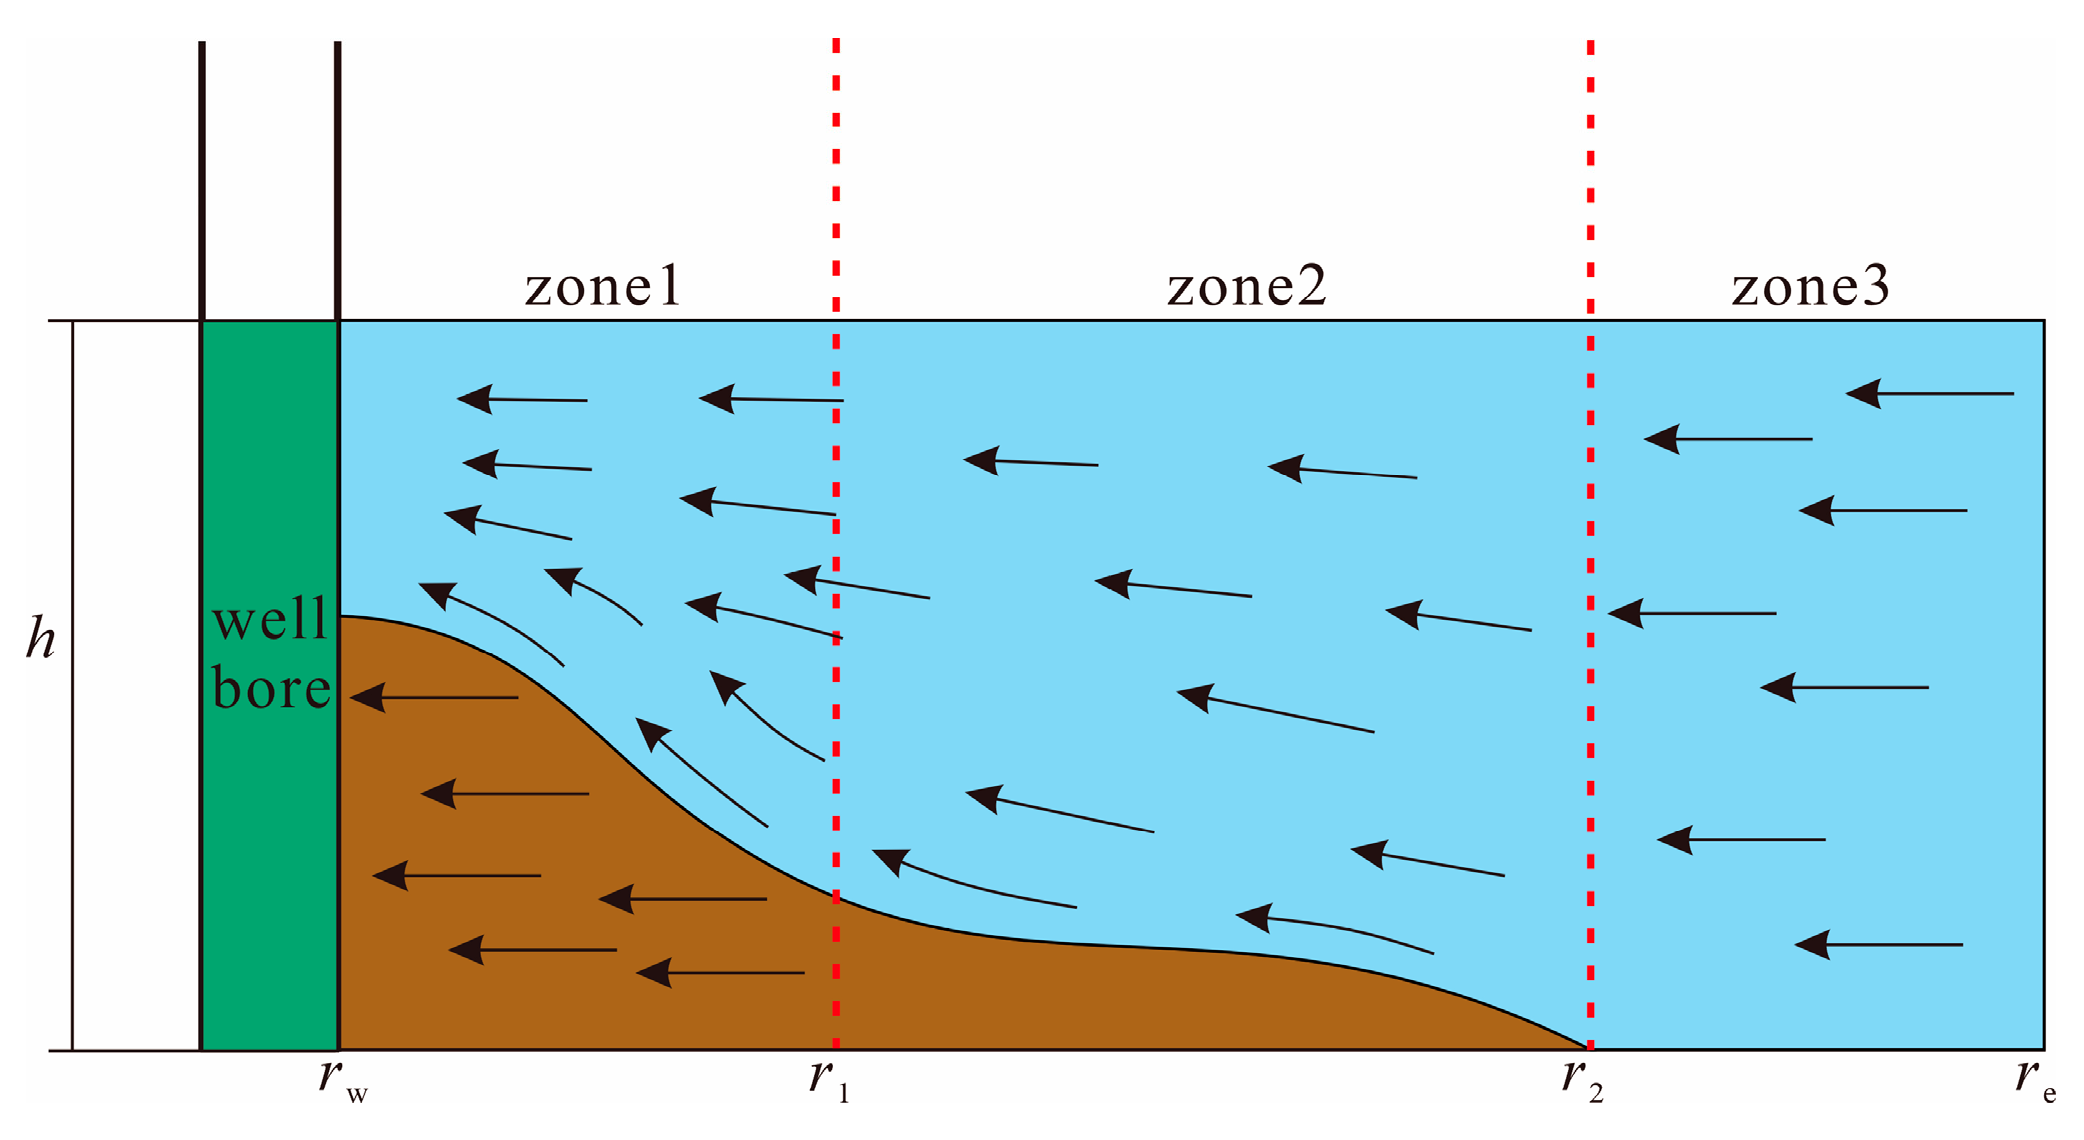
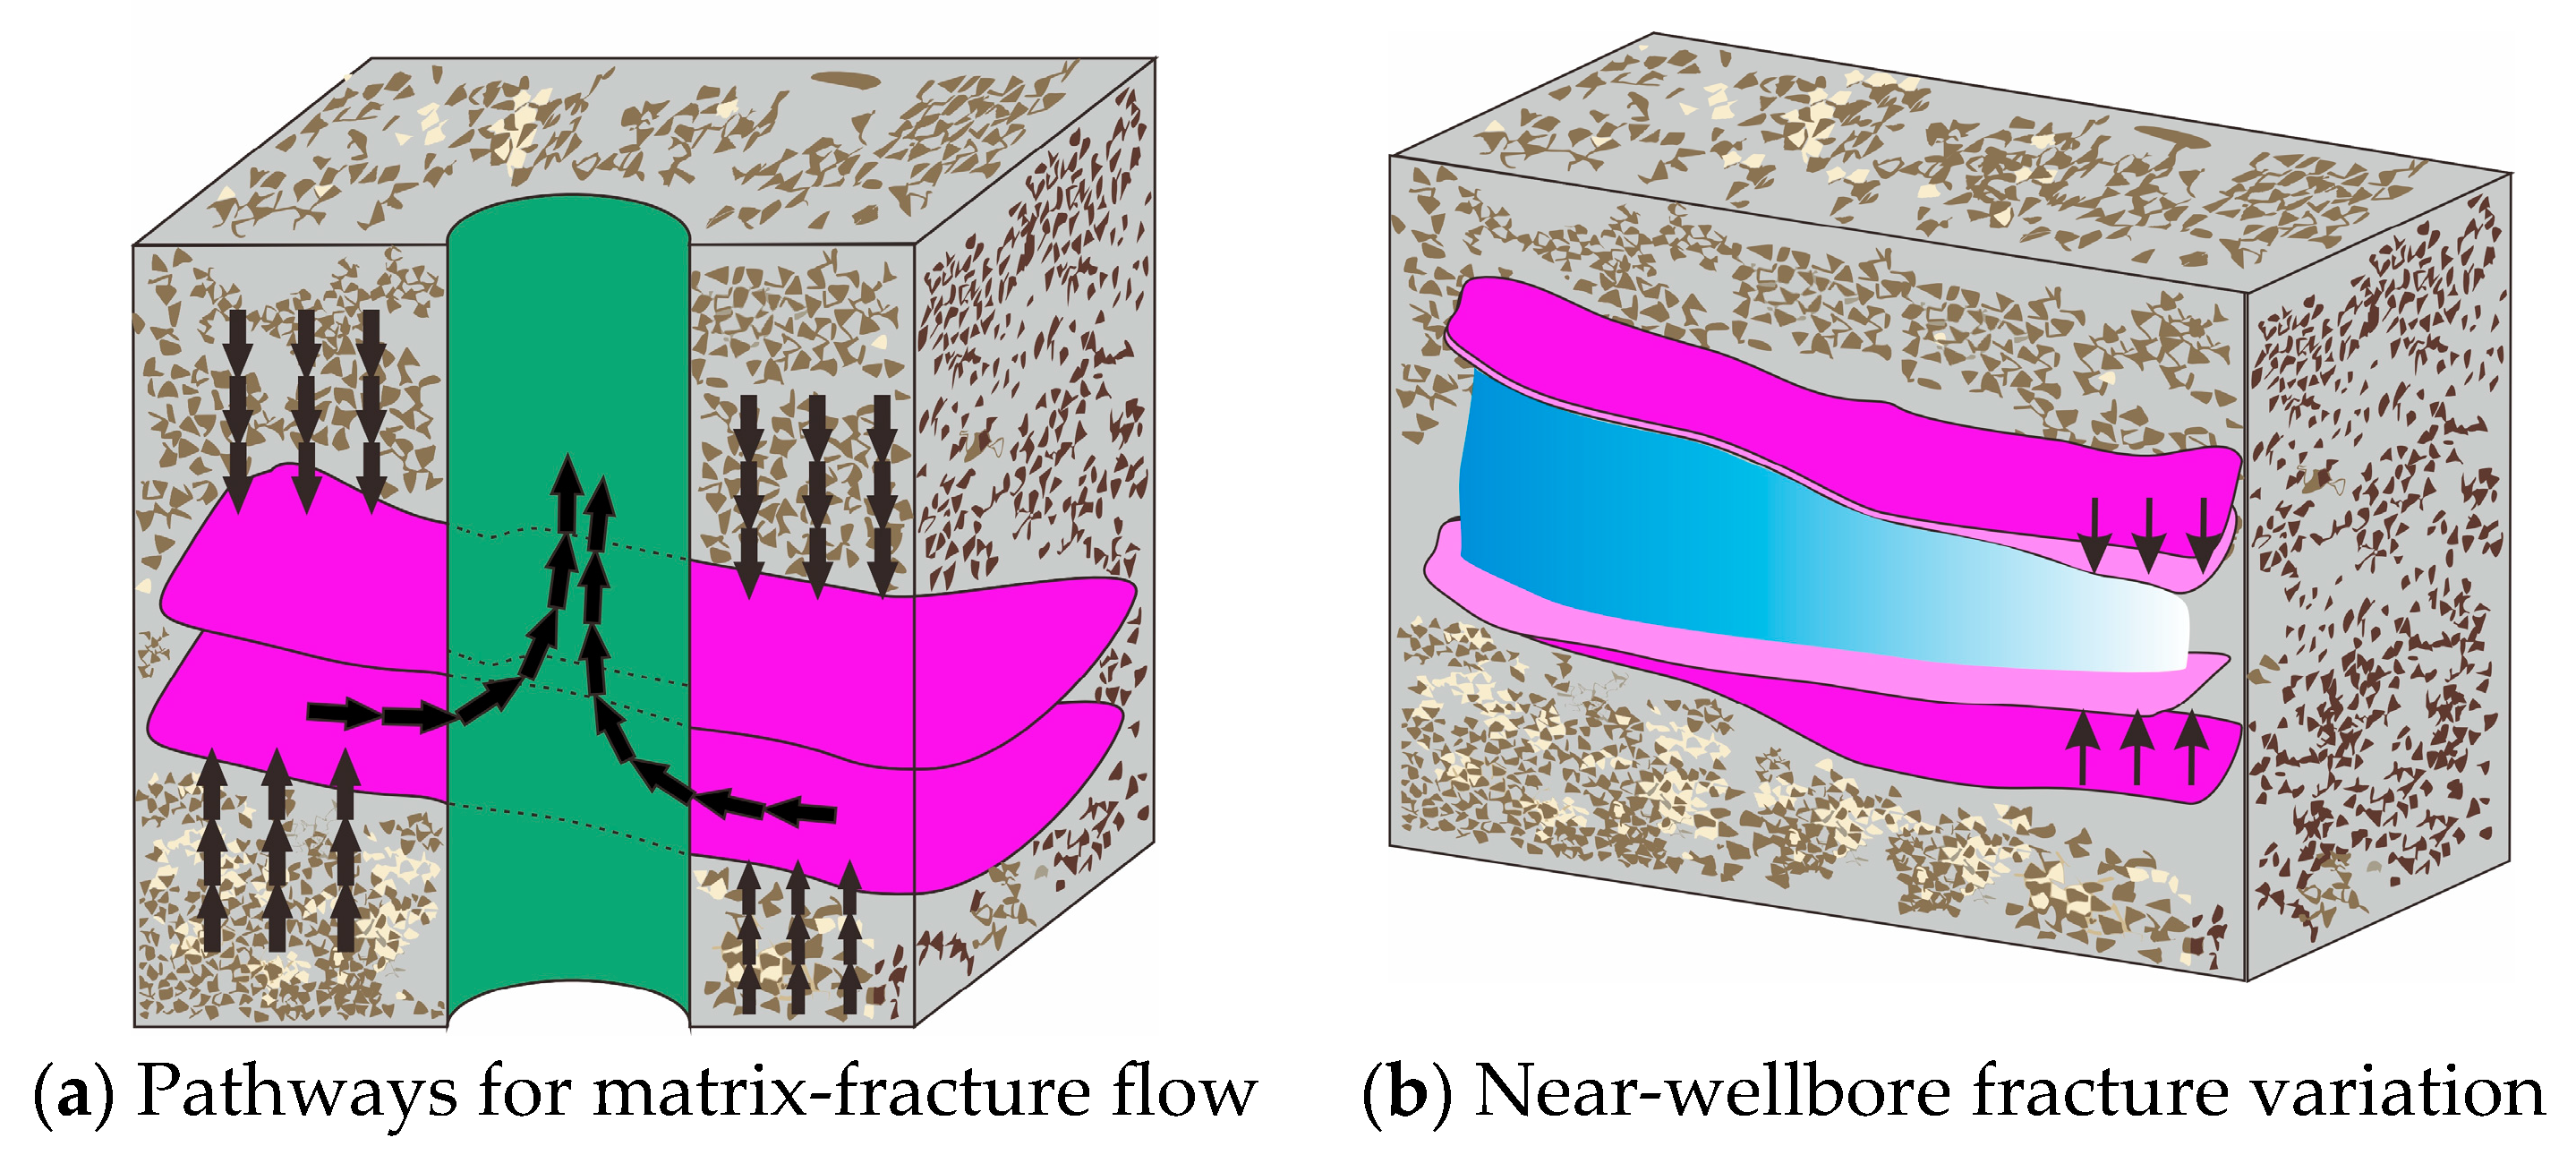
2. Physical Model Description

Based on the analysis of the zoning phenomenon of reservoir rock physical properties and fluid properties during the development of carbonate rock condensate gas reservoirs in the introduction, we establish a three-zone composite physical model of double porosity media as shown in Figure 1. Based on radial distance, the model divides the reservoir into three zones: the near-wellbore zone (zone 1), the intermediate zone (zone 2), and the far-well zone (zone 3). Each zone exhibits distinct reservoir properties. In the model, the formation pressures in zone 1 and zone 2 have both dropped below the dew point pressure, resulting in the accumulation of condensate. Among them, in zone 1, due to the large pressure drop, a large amount of condensate oil precipitates, forming a two-phase flow of oil and gas; however, the saturation of condensate oil in zone 2 has not reached the critical value for flow. Therefore, it is mainly manifested as single-phase gas flow containing immobile condensate oil. The formation pressure in zone 3 is always higher than the dew point pressure and it is always single gas flow. As a result, the fluid properties and flow patterns in the three major zones are all different, as shown in Figure 2 for details. The reservoir medium consists of a matrix-fracture dual-porosity system and its flow path satisfies the assumptions of the Warren–Root model (flow path is shown in Figure 3a): that is, the fluid in the matrix only flows to the fractures and not to the wellbore, and the fractures are the main flow channels. This is based on the research in the introduction on the influence of stress sensitivity on permeability and porosity, as well as the comparative analysis of the influence of stress sensitivity on fracture permeability and matrix permeability. In the model, stress sensitivity is considered to only affect fracture permeability. Moreover, since the pressure drop is the greatest in zone 1 during the development of condensate gas reservoirs, stress sensitivity is considered to only exist in the fracture medium of zone 1 (the fracture variation under stress is shown in Figure 3b). Other assumptions include vertical wells producing at a constant rate under planar radial Darcy flow, with rock compressibility and fluid compressibility considered. The isothermal flow process accounts for the skin effect and wellbore storage effect. Boundary conditions encompass three conventional types (infinite, constant-pressure and closed boundaries), with inter-zone interfaces satisfying pressure and flux continuity conditions.

3. Mathematical Model and Solution

3.1. Dimensional Model

Given that the formation interior shows obvious flow zoning characteristics in space, that is, there are different zones dominated by oil and gas two-phase flow and single-phase gas flow, this study differs from the method adopted by Fevang and Whitson to unify the regional pressure relationship using a single complex function. Innovatively, the pseudo-pressure function proposed by Hussainy and Fetkovich was introduced [27,28]. The relationship between the real pressure and the pseudo-pressure in the single-phase gas zone and the oil-gas two-phase zone was established for each zone, as shown in Equations (1) and (2) and the flow control equations in different flow zones were derived based on this.
ψ = 2 p μ z d p
ψ = k r o μ o B o d p
where ψ is the pseudo-pressure; p is the pressure; μ is the viscosity; z is the compressibility factor; kro is the oil phase relative permeability; and Bo is the oil formation volume factor.
For dual-porosity three-zone composite formations, the flow governing equation for zone 1 incorporating stress-dependent fracture permeability considerations can be expressed as:
2 ψ f 1 r 2 + 1 r ψ f 1 r + γ ψ ψ f 1 r 2           + α λ m t λ f t e γ ψ ( ψ f i ψ f 1 ) ( ψ m 1 ψ f 1 ) = e γ ψ ( ψ f i ψ f 1 ) ϕ f 1 C f t 1 λ f t ψ f 1 t α ( ψ m 1 ψ f 1 ) = ϕ m 1 C m t 1 λ m t ψ m 1 t
where ψf1 and ψm1 are the pseudo-pressure of the fracture system and matrix system in zone 1; ψfi is initial pseudo-pressure; the r is the radial distance; γψ is the permeability modulus; a is the shape factor; λft and λmt are the fluid mobility in the fracture system and matrix system in zone 1; фf1 and фm1 are the porosity of the fracture system and matrix system in zone 1; and Cft1 and Cmt1 are the composite compressibility of the fracture system and matrix system in zone 1.
The flow governing equation for zone 2 can be expressed as:
2 ψ f 2 r 2 + 1 r ψ f 2 r + α k m 2 k f 2 ( ψ m 2 ψ f 2 ) = S g ϕ f 2 μ 2 C f t 2 k f 2 ψ f 2 t α ( ψ m 2 ψ f 2 ) = S g ϕ m 2 μ 2 C m t 2 k m 2 ψ m 2 t
where ψf2 and ψm2 are the pseudo-pressure of the fracture system and matrix system in zone 2; kf2 and km2 are the fluid permeability of the fracture system and matrix system in zone 2; μ2 is the viscosity of fluid in zone 2; Sg is the gas saturation in zone 2; фf2 and фm2 are the porosity of the fracture system and matrix system in zone 2; and Cft2 and Cmt2 are the composite compressibility of the fracture system and matrix system in zone 2.
The flow governing equation for zone 3 can be expressed as:
2 ψ f 3 r 2 + 1 r ψ f 3 r + α k m 3 k f ( ψ m 3 ψ f 3 ) = ϕ f 3 μ 3 C f t 3 k f 3 ψ f 3 t α ( ψ m 3 ψ f 3 ) = ϕ m 3 μ 3 C m t 3 k m 3 ψ m 3 t
where ψf3 and ψm3 are the pseudo-pressure of the fracture system and matrix system in zone 3; kf3 and km3 are the fluid permeability of the fracture system and matrix system in zone 3; μ3 is the viscosity of fluid in zone 3; фf3 and фm3 are the porosity of the fracture system and matrix system in zone 3; and Cft3 and Cmt3 are the composite compressibility of the fracture system and matrix system in zone 3.
Initial conditions:
ψ f t = 0 = ψ m t = 0 = ψ i
where t is the time.
Inner boundary conditions (neglecting skin effect and wellbore storage effect):
r ψ f r r = r w = q 2 π k 1 e γ ψ ( ψ i ψ f 1 ) h
where rw is the wellbore radius; k1 is the permeability of zone 1; q is the flow rate; and h is the reservoir thickness.
There are two interface zones; the boundary conditions for zone 1 and zone 2 are expressed as:
k 1 e γ ψ ( ψ i ψ f 1 ) μ 1 ψ f 1 r r = r 1 = k 2 μ 2 ψ f 2 r r = r 1
where r1 is the radial size of zone 1.
The boundary conditions for zone 2 and zone 3 are expressed as:
ψ f 2 r = r 2 = ψ f 3 r = r 2 k 2 μ 2 ψ f 2 r r = r 2 = k 3 μ 3 ψ f 3 r r = r 2
where r2 is the radial size of zone 2.
Consider three types of boundary conditions; the first type, an infinite boundary, can be represented as:
ψ f 3 r = ψ i
The second type, the constant pressure boundary, is represented as follows:
ψ f 3 r = r e = ψ i
The third type, the closed boundary, is represented as:
ψ f 3 r r = r e = 0
where re is the radial distance of reservoir boundary.

3.2. Dimensionless Model

By applying the chain rule of differentiation in conjunction with the dimensionless variables defined in Table 1, the dimensional model can be transformed into its dimensionless form.
It is worth noting that symbols with the subscript “D” represent the dimensionless variables corresponding to the above-mentioned dimensional variables. The dimensionless governing flow equation for zone 1 is given by:
2 ψ f 1 D r D 2 + 1 r D ψ f 1 D r D γ ψ D ψ f 1 D r D 2         + ε 1 e γ ψ D ψ f 1 D ( ψ m 1 D ψ f 1 D ) = ω 1 e γ ψ D ψ f 1 D ψ f 1 D t D ε 1 ( ψ m 1 D ψ f 1 D ) = ( 1 ω 1 ) ψ m 1 D t D
where ω1 is the elastic storage ratio of natural fracture of zone 1; and ԑ1 is the inter-porosity fluid flow factor of zone 1.
The dimensionless governing flow equation for zone 2 is expressed as:
2 ψ f 2 D r D 2 + 1 r D ψ f 2 D r D + ε 2 ( ψ m 2 D ψ f 2 D ) = η 12 S g ω 2 ψ f 2 D t D ε 2 ( ψ m 2 D ψ f 2 D ) = S g η 12 ( 1 ω 2 ) ψ m 2 D t D
where ω2 is the elastic storage ratio of natural fracture of zone 2; ԑ2 is inter-porosity fluid flow factor of zone 2; and η12 is ratio of hydraulic diffusivity coefficients between zone 1 and zone 2.
The dimensionless governing flow equation for zone 3 is expressed as:
2 ψ f 3 D r D 2 + 1 r D ψ f 3 D r D + ε 3 ( ψ m 3 D ψ f 3 D ) = η 13 ω 3 ψ f 3 D t D ε 3 ( ψ m 3 D ψ f 3 D ) = η 13 ( 1 ω 3 ) ψ m 3 D t D
where ω3 is the elastic storage ratio of natural fracture of zone 3; ԑ2 is the inter-porosity fluid flow factor of zone 3; and η13 is the ratio of hydraulic diffusivity coefficients between zone 1 and zone 3.
Dimensionless initial condition:
ψ f D t D = 0 = ψ m D t D = 0 = 0
Dimensionless inner boundary condition:
e γ ψ D ψ f 1 D ψ f 1 D r D r D = r w D = 1 ψ w D = ψ f 1 D r D = r w D
The dimensionless boundary condition between zone 1 and zone 2 is given by:
ψ f 1 D r = r 1 D = ψ f 2 D r = r 1 D ψ f 1 D r D r = r 1 D = 1 M 12 ψ f 2 D r D r = r 1 D
where M12 is the mobility ratio between zone 1 and zone 2.
The dimensionless boundary condition between zone 2 and zone 3 is given by:
ψ f 2 D r = r 2 D = ψ f 3 D r = r 2 D ψ f 2 D r D r = r 2 D = 1 M 23 ψ f 3 D r D r = r 2 D
where M23 is the mobility ratio between zone 2 and zone 3.
The dimensionless boundary conditions for the infinite, constant pressure and closed boundaries can be represented as follows:
ψ f 3 D r D = 0
ψ f 3 D r = r e D = 0
ψ f 3 D r D r = r e D = 0

3.3. Linearization of Nonlinear Models

The dimensionless model exhibits strong nonlinear characteristics. According to the regular perturbation theory [29], the introduction of a perturbation transformation based on Equation (23) enables the linearization of the nonlinear governing equations.
ψ f 1 D ( r D , t D ) = 1 γ ψ D ln ( 1 γ ψ D ζ f D ( r D , t D ) )
where ζfD is the pseudo-pressure obtained after the regular perturbation transformation.
Consequently, the equations related to stress sensitivity in the dimensionless model above can be reformulated as:
2 ζ f D r D 2 + 1 r D ζ f D r D + ε 1 ( ψ m 1 D ζ f D ) = ω 1 ζ f D t D ε 1 ( ψ m 1 D ζ f D ) = ( 1 ω 1 ) ψ m 1 D t D
ζ f D t D = 0 = ψ f 2 D t D = 0 = ψ m D t D = 0 = 0
ζ f D r D r D = r w D = 1
ψ w D = ζ f D r D = r w D
ζ f D r = r 1 D = ψ f 2 D r = r 1 D ζ f D r D r = r 1 D = 1 M 12 ψ f 2 D r D r = r 1 D

3.4. Model Solution

Applying the Laplace transform with respect to tD to the linearized dimensionless flow governing equations and incorporating the initial condition, the dimensionless governing equations in Laplace space are obtained as follows. In these equations, variables with a tilde above them represent the Laplace transforms of the corresponding original variables.
2 ζ ˜ f D r D 2 + 1 r D ζ ˜ f D r D = s f 1 ( s ) ζ ˜ f D r w D r D r 1 D
2 ψ ˜ f 2 D r D 2 + 1 r D ψ ˜ f 2 D r D = s f 2 ( s ) ψ ˜ f 2 D t D r 1 D r D r 2 D
2 ψ ˜ f 3 D r D 2 + 1 r D ψ ˜ f 3 D r D = s f 3 ( s ) ψ ˜ f 3 D t D r 2 D r D r e D
Among them,
f 1 ( s ) = s ( 1 ω 1 ) ω 1 + ε 1 s ( 1 ω 1 ) + ε 1
f 2 ( s ) = S g η 12 S g η 12 ω 2 s ( 1 ω 2 ) + ε 2 S g η 12 s ( 1 ω 2 ) + ε 2
f 3 ( s ) = η 13 ω 3 s η 13 ( 1 ω 3 ) + ε 3 s η 13 ( 1 ω 3 ) + ε 3
The boundary conditions in Laplace space are expressed as:
ζ ˜ f D r D r D = r w D = 1 s
ζ ˜ w D = ζ ˜ f D r D = r w D
ψ ˜ f 2 D r = r 2 D = ψ ˜ f 3 D r = r 2 D ψ ˜ f 2 D r D r = r 2 D = 1 M 23 ψ ˜ f 3 D r D r = r 2 D
ψ ˜ f 3 D r D = 0
ψ ˜ f 3 D r = r e D = 0
ψ ˜ f 3 D r D r = r e D = 0
The solutions to Equations (29)–(31) can be expressed as:
ζ ˜ f D = A I 0 ( r D s f 1 ( s ) ) + B K 0 ( r D s f 1 ( s ) ) r w D r D r 1 D ψ ˜ f 2 D = C I 0 ( r D s f 2 ( s ) ) + D K 0 ( r D s f 2 ( s ) ) r 1 D r D r 2 D ψ ˜ f 3 D = E I 0 ( r D s f 3 ( s ) ) + F K 0 ( r D s f 3 ( s ) ) r 2 D r D r e D
Taking a closed outer boundary reservoir as an example, by incorporating the inner boundary condition, interface conditions and the corresponding closed outer boundary condition into Equation (42), we obtain the following system of linear equations under closed outer boundary conditions:
s f 1 ( s ) A I 1 ( r s f 1 ( s ) ) B K 1 ( s f 1 ( s ) ) = 1 s A I 0 ( r 1 D s f 1 ( s ) ) + B K 0 ( r 1 D s f 1 ( s ) ) = C I 0 ( r 1 D s f 2 ( s ) ) + D K 0 ( r 1 D s f 2 ( s ) ) C I 0 ( r 2 D s f 2 ( s ) ) + D K 0 ( r 2 D s f 2 ( s ) ) = E I 0 ( r 2 D s f 3 ( s ) ) + F K 0 ( r 2 D s f 3 ( s ) ) s f 3 ( s ) E I 1 ( r e D s f 3 ( s ) ) F K 1 ( r e D s f 3 ( s ) ) = 0 s f 1 ( s ) A I 1 ( r 1 D s f 1 ( s ) ) B K 1 ( r 1 D s f 1 ( s ) ) = s f 2 ( s ) 1 M 12 C I 1 ( r 1 D s f 2 ( s ) ) D K 1 ( r 1 D s f 2 ( s ) ) s f 2 ( s ) C I 1 ( r 2 D s f 2 ( s ) ) D K 1 ( r 2 D s f 2 ( s ) ) = s f 3 ( s ) 1 M 23 E I 1 ( r 2 D s f 3 ( s ) ) F K 1 ( r 2 D s f 3 ( s ) )
It is evident that the governing equations for reservoirs with different outer boundary types can be universally represented by the following matrix equation:
a 11 a 12 0 0 0 0 a 21 a 22 a 23 a 24 0 0 a 31 a 32 a 33 a 34 0 0 0 0 a 43 a 44 a 45 a 46 0 0 a 53 a 54 a 55 a 56 0 0 0 0 a 65 a 66 A B C D E F = 1 s 0 0 0 0 0
By solving the above matrix using Gaussian elimination, the expressions for coefficients A and B can be obtained. Substituting these into Equation (42) yields the general form of the Laplace-space perturbed pressure solution in zone 1. By incorporating the inner boundary condition, the Laplace-space bottomhole perturbed pressure solution can finally be derived.
By applying the Duhamel superposition principle [30], the Laplace-space solution for bottomhole pressure considering the skin effect and wellbore storage effect can be obtained. This principle is mathematically expressed as Equation (45). Subsequently, the Stehfest numerical inversion method is used to perform the numerical inversion of the Laplace-space bottomhole pressure solution [31]. Finally, the real-space solution for bottomhole pressure is derived by transforming the inverted results using the regular perturbation transformation relationship.
ζ ˜ f D 0 = s ζ ˜ f D + S s { 1 + C D s [ s ζ ˜ f D + S ] }
where ζ ˜ f D 0 is the pseudo-pressure in Laplace space that accounts for wellbore storage and skin effects; S is skin factor; and CD is the dimensionless wellbore storage coefficient.

4. Analysis of Pressure Dynamic Curve and Sensitivity Factors

Since the 20th century, well test analysis has gradually become an important tool for judging the production capacity of wells and studying reservoir parameters in oil and gas reservoir development. In particular, since Ramey introduced the log-log type curve matching method, the theory of well test analysis has undergone a significant advancement. Up to now, well test analysis has also been an important means to evaluate underground reservoirs and optimize the development of oil and gas reservoirs. The current mainstream method for interpreting well tests is to draw the double logarithmic curves of the measured pressure-time relationship and the pressure-derivative time-relationship and fit them with the pressure dynamic curve plates composed of different reservoir parameters, thereby obtaining the important parameters of the actual reservoir. The advantage of using the double logarithmic curve fitting method lies in that the double logarithmic curve compresses the size, enabling the early and late pressure changes to be clearly displayed in the same graph [32]. Furthermore, the pressure derivative curves at different flow stages will present significantly different characteristics, thus enabling accurate identification of different flow stages of the fluid [33]. In this chapter, by plotting the log-log analysis curve of pressure and pressure derivative versus time under three-zone composite flow conditions during the development of carbonate rock condensate gas reservoirs, the flow stages in the production process are identified and the effects of various reservoir parameters on the pressure dynamic curve are systematically analyzed.

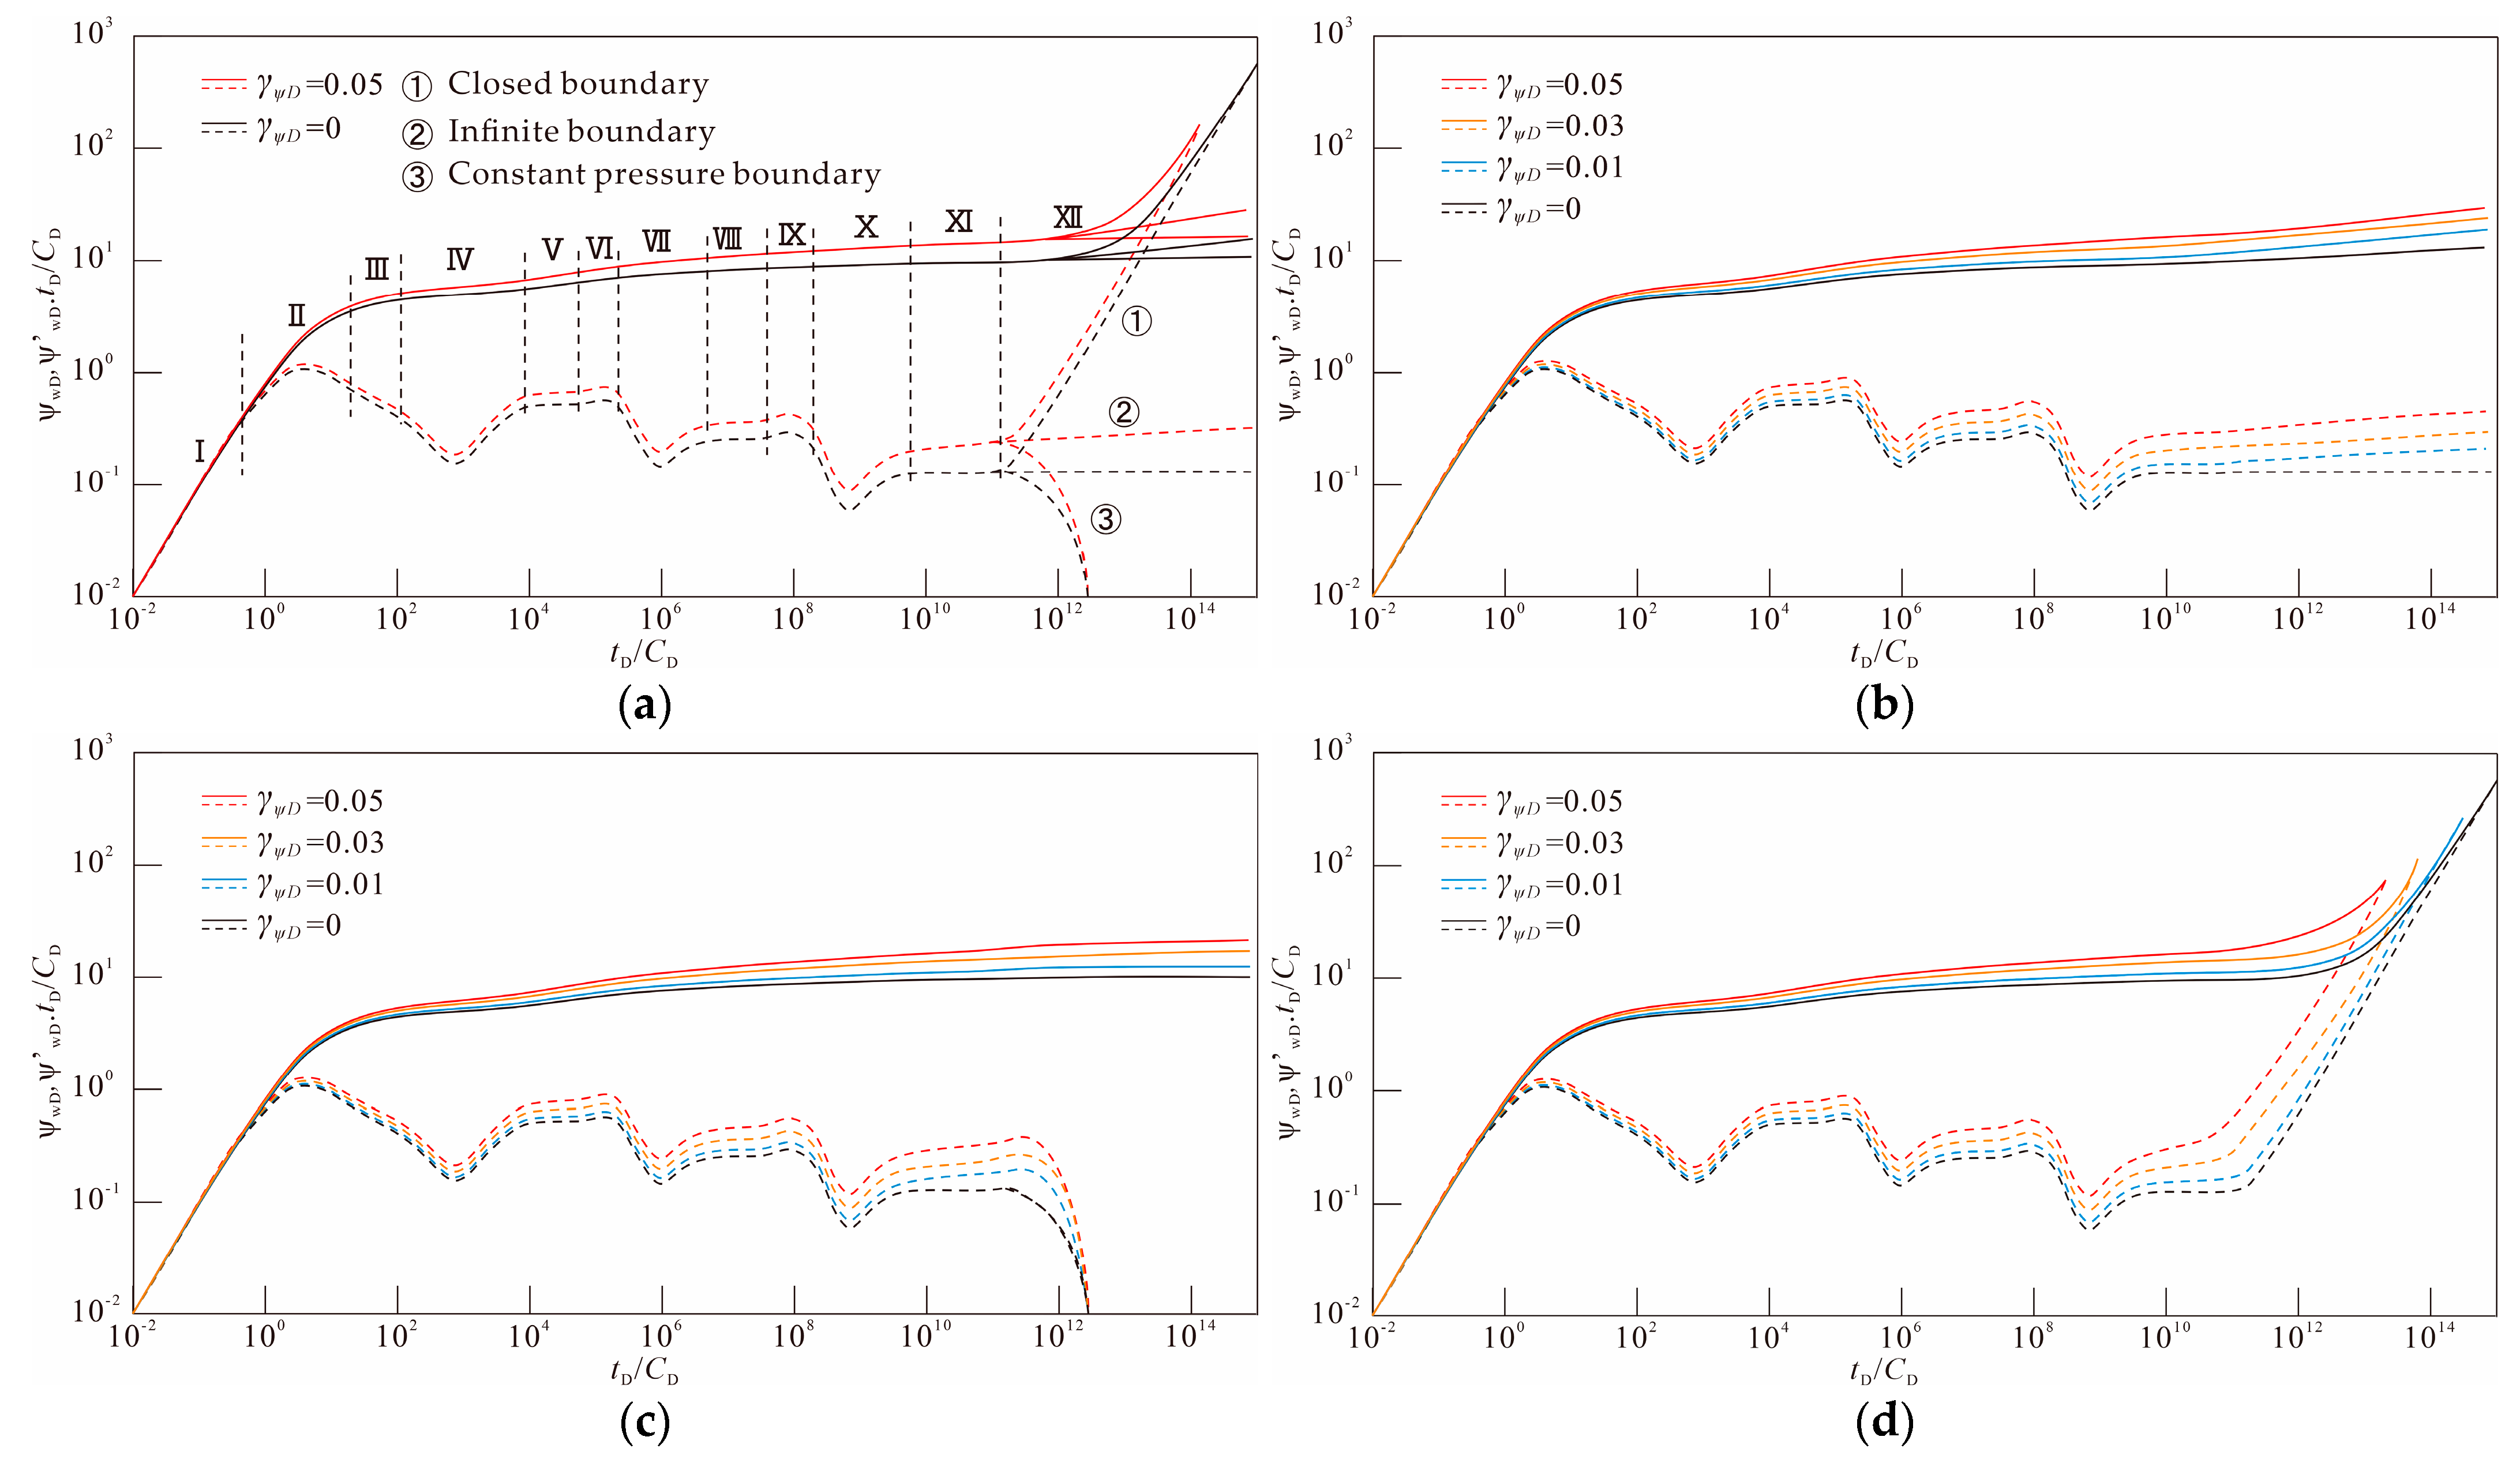
4.1. Identification of the Flow Stage and Effect of the Permeability Modulus

The pressure dynamic curves during the development process of carbonate rock condensate gas reservoirs with double-porosity media considering reservoir physical property zoning and fluid property zoning are shown in Figure 4a. The black and red curves in the figure represent the pressure dynamic curves without and with consideration of stress sensitivity, respectively, while the solid and dashed lines indicate the pressure and pressure derivative curves, respectively. The analysis shows that, similarly, the pressure dynamic curves with and without the consideration of permeability stress sensitivity show the flow characteristics of fluid in the wellbore, zone 1, zone 2 and zone 3. The entire fluid flow can be divided into 12 stages in detail. The curve characteristics and fluid flow descriptions of these 12 flow stages are shown in Table 2. Through the comparative analysis of Figure 4b–d, it can be known that as the permeability modulus increases, the pressure dynamic curves under the three boundary conditions show an upward trend as a whole and the upward shift amplitude further intensifies over time. It is notable that in stage XII, the curve responses at each boundary show significant differences: at the infinite boundary, the pressure derivative curve no longer remains horizontal but continuously shifts upward with the increase of the permeability modulus; under the constant pressure boundary, although the curve also moves upward, it then gradually decreases and eventually tends to a vertical line. Under the closed boundary, the curve bends significantly to the left, loses the characteristic of the unit slope and the degree of curvature deepens with the increase of the permeability modulus.
The magnitude of γψD is directly proportional to the strength of stress sensitivity. Through the above comparative analysis of the curve changes of permeability modulus under different boundary conditions, it can be known. Stress sensitivity affects the entire stage of fluid flow in the formation and the influence keeps increasing over time. Permeability stress sensitivity accelerates the rate of pressure loss by continuously reducing the effective permeability and increasing the flow resistance. The difference is that since the infinite boundary and the constant pressure boundary can continuously obtain external energy supply, the pressure wave can continuously diffuse outward without being bound by the boundary. The effect of stress sensitivity is only manifested as the increase in overall flow resistance and the acceleration of pressure drop rate caused by the decrease in permeability and will not significantly expose the boundary effect in advance: the infinite boundary remains in an “infinite energy supply” state throughout the entire testing process and the pressure propagation always maintains infinite diffusion. Although the boundary at constant pressure will eventually be felt, the supply at constant pressure can partially offset the increase in resistance caused by the decrease in permeability and weaken the explicit influence of stress sensitivity. This is completely different from the closed boundary. Because there is no external supply, the decrease in permeability not only increases resistance but also compresses the effective seepage channels, significantly reaching and strengthening the boundary response earlier. Just as obtained from the research of Cheng and Wang et al. [34,35], permeability stress sensitivity will promote fracture closure, significantly reduce the effective permeability and increase the formation pressure loss.

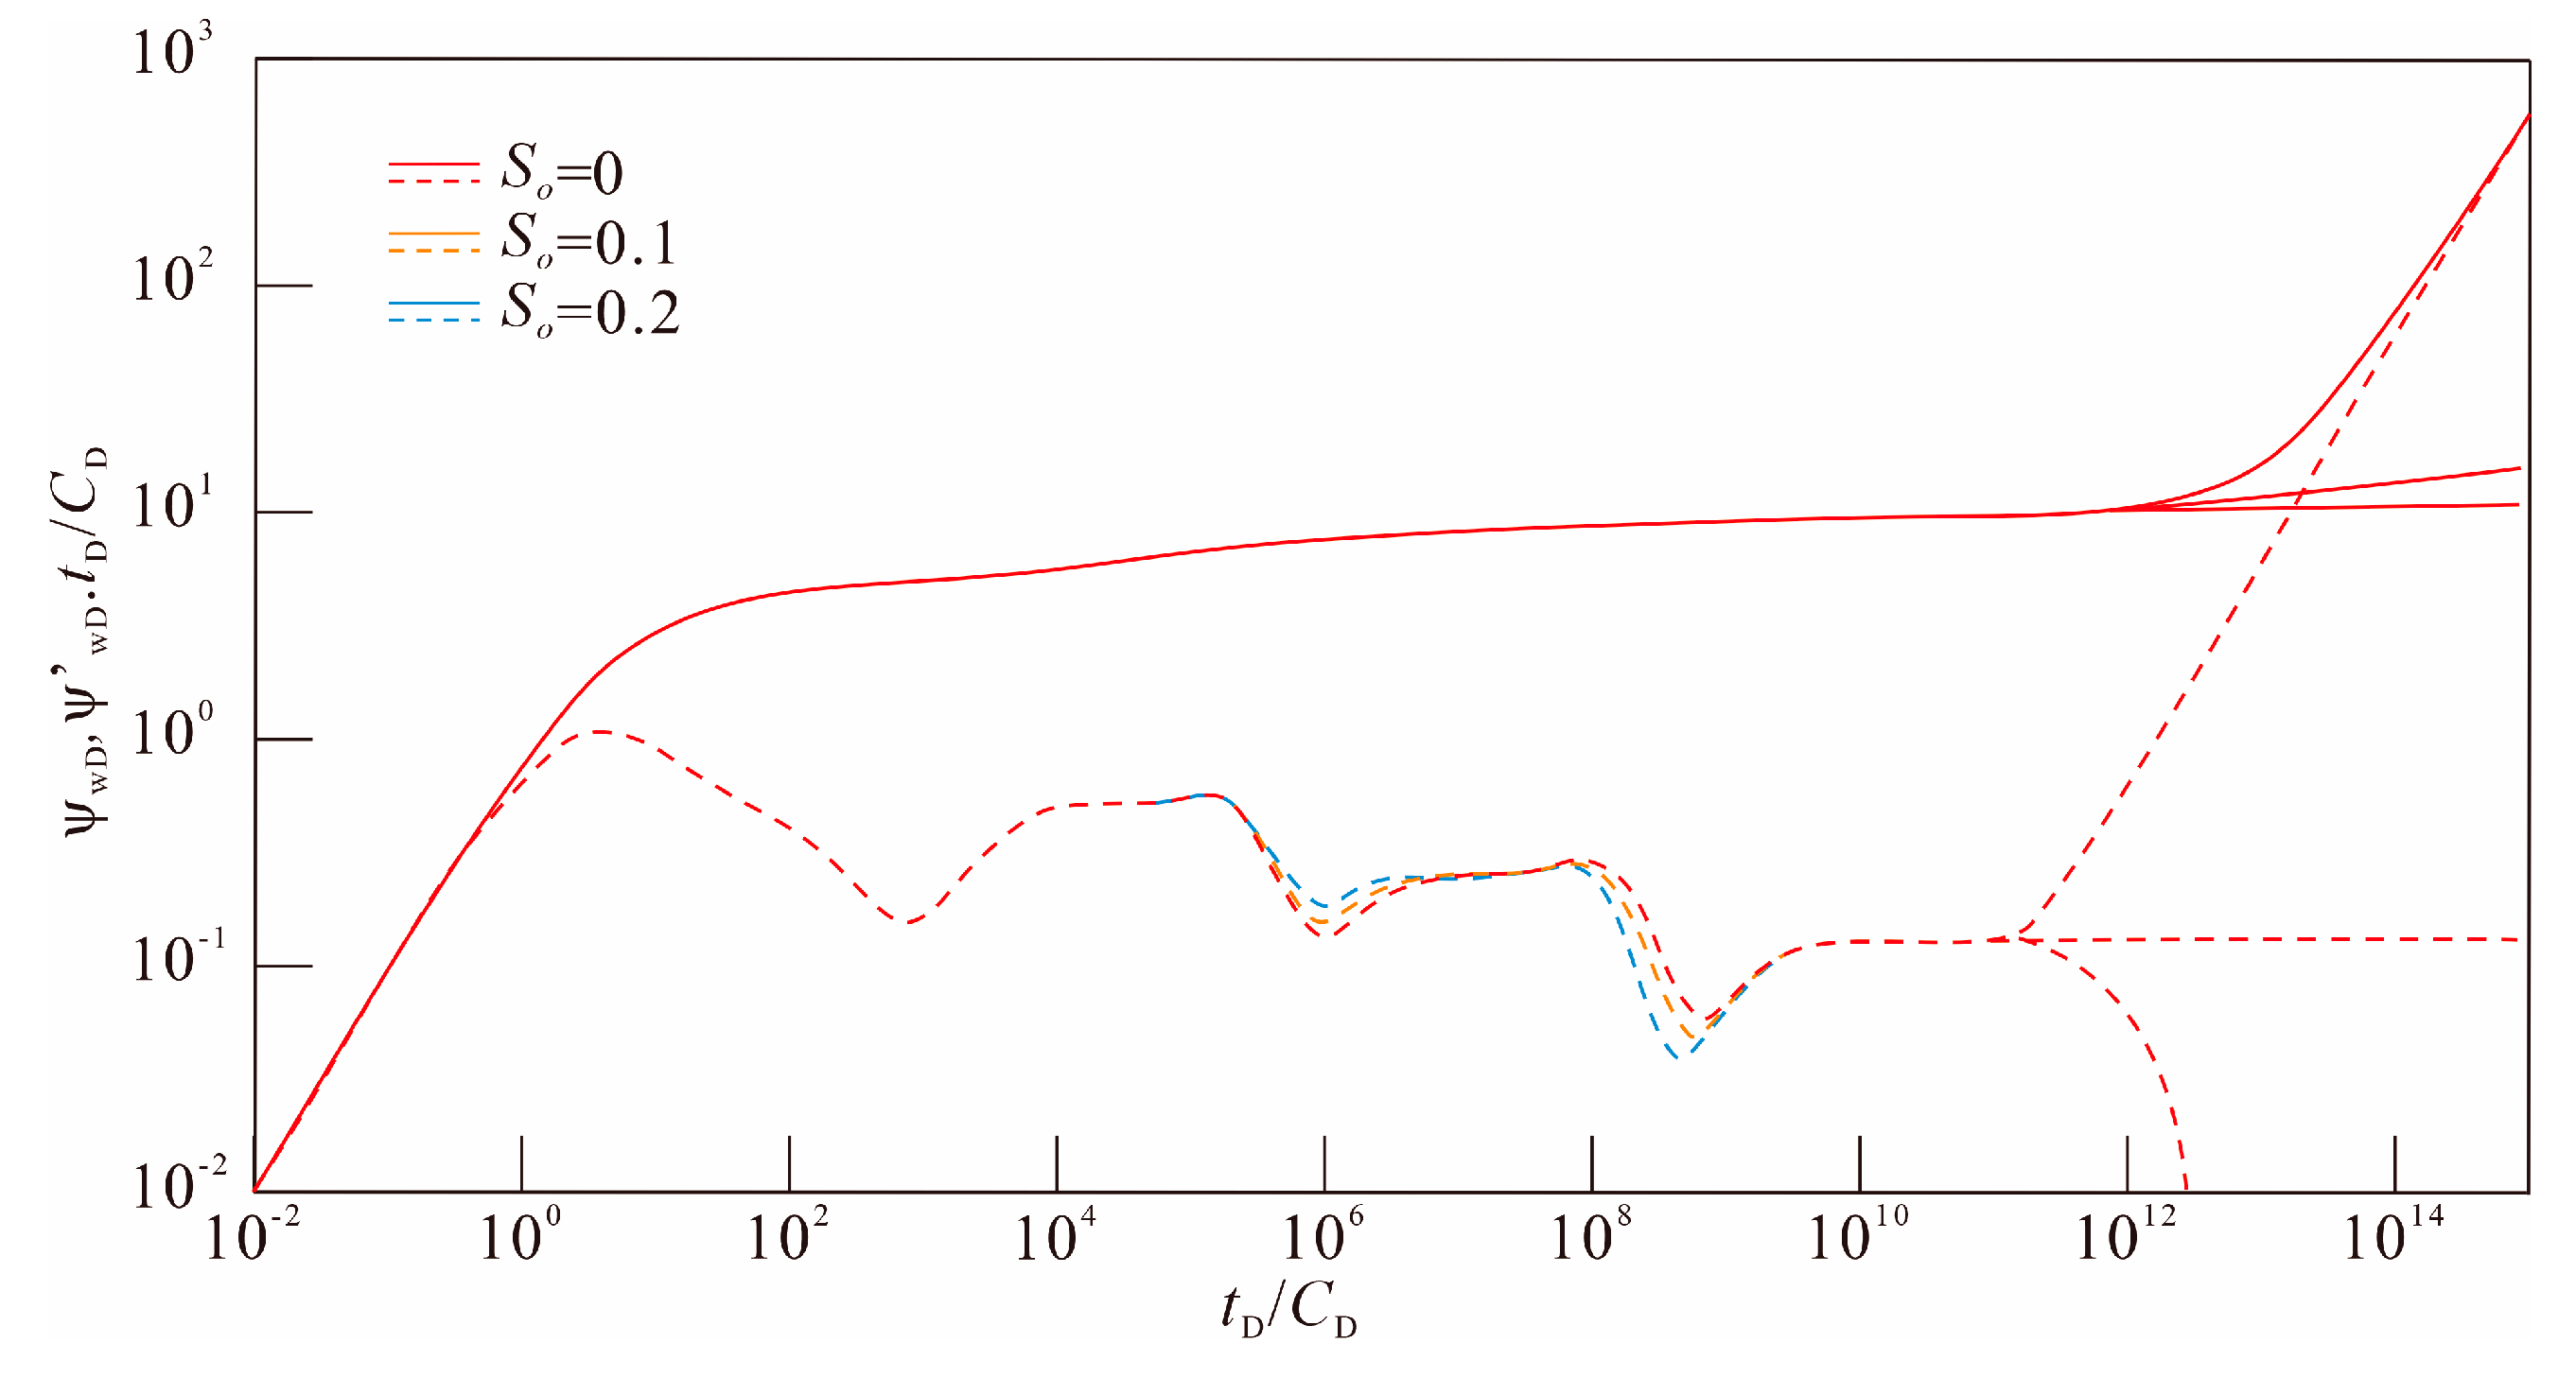
4.2. Effect of the Immobile Condensate Saturation in Zone 2

The pressure dynamic curves corresponding to different immobile condensate saturations are shown in Figure 5. The magnitude of So is directly proportional to the content of immobile condensate saturation in zone 2. The curve analysis shows that the saturation of condensate in the zone 2 affects the pressure dynamic curve shape of the whole Stage VII to Stage X. With the increase of condensate oil saturation, the pressure derivative curves of Stage VII shift upward, while the pressure derivative curve of Stage X shifts leftward and downward. The sensitivity analysis further reveals that the pressure loss of gas flow in zone 2 increases with the increase of the immobile condensate saturation in zone 2. This might be due to the precipitation of condensate oil blocking the tiny pores, reducing the relative permeability of the gas and hindering the flow of the gas. As Sabea et al. pointed out in their study [36], the precipitation of condensate oil would lead to the blockage of the pores in the reservoir and the relative permeability of the gas phase would significantly decrease, thereby significantly reducing the flow efficiency of the gas and resulting in an increase in pressure loss. The difference lies in that our research also found that the increase in condensate oil content led to a shortened duration of the flow stage in zone 2, thereby causing the fluid flow in the subsequent stages to occur earlier.

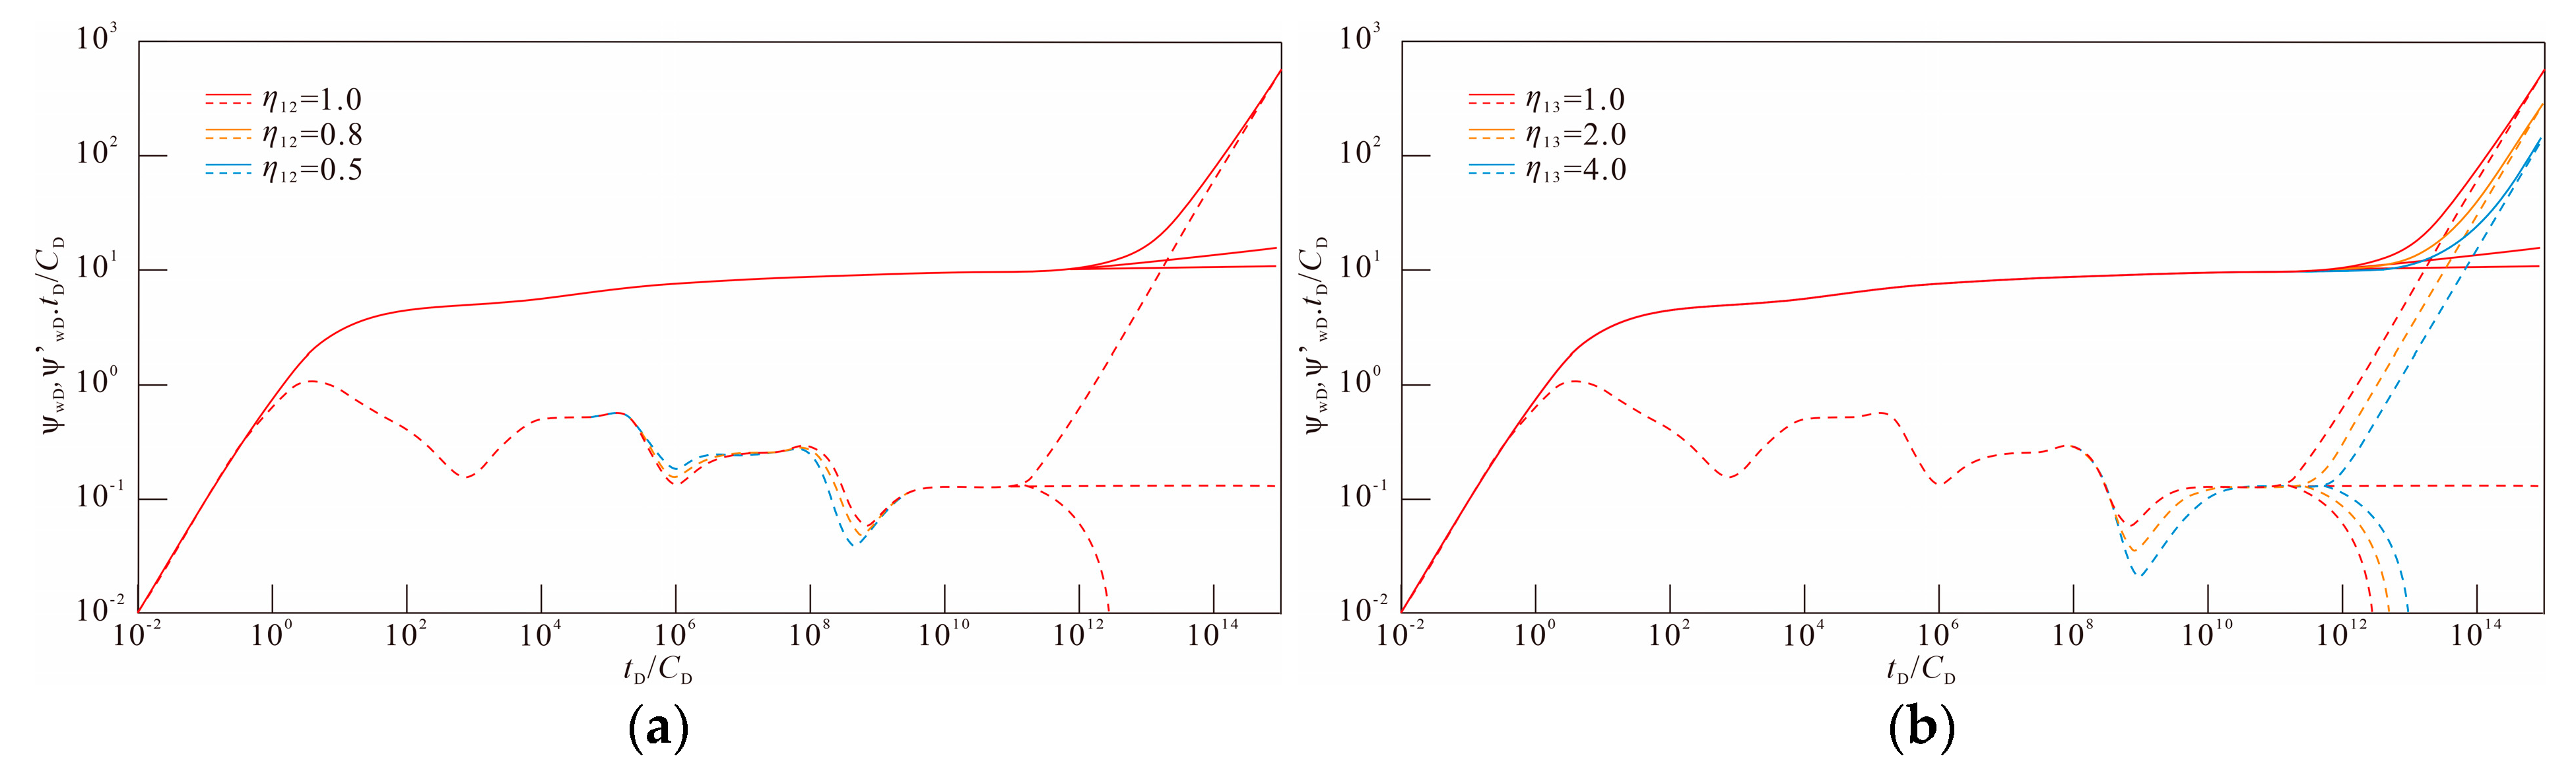
4.3. Effect of the Hydraulic Diffusivity Coefficient Ratio

The pressure dynamic curves corresponding to different hydraulic diffusivity coefficients ratio are shown in Figure 6. Compared with the reservoir in zone 1, a greater value of η12 and η13 indicate that the greater the porosity development degree and the elastic storage capacity of reservoir in zone 2 and zone 3. According to Figure 6a, the magnitude of η12 affects the pressure dynamic curve shape of the whole Stage VII to Stage X. With the decrease of the ratio, the pressure derivative curves of Stage VII shifts upward, while the pressure derivative curve of Stage X shifts leftward and downward. According to Figure 6b, when η13 decreases, the pressure dynamic curves in both Stages X shift upward, which is similar to the influence of η12 on the shape of the curve. The difference is that the pressure derivative curve in Stage XI and Stage XII also shifts to the left. The sensitivity analysis further revealed that the lower the elastic storage capacity of reservoir, the greater the fluid flow resistance and the shorter the duration of fluid flow in that zone.

4.4. Effect of the Mobility Ratio

Figure 7a and Figure 7b, respectively, show the influence of M12 and M23 on the pressure dynamic curve. The magnitudes of these two parameters indicate the ease of fluid flow in their respective zones. The larger the values, the more difficult fluid flow becomes in zones 2 and 3. Figure 7a shows that the decrease in M12 values causes the pressure dynamic curves to decrease within Stage VI and all subsequent stages. Figure 7b shows that the decrease in M23 values caused the curves to decrease within Stage IX and all subsequent stages. Combining the effects of the two parameters, it can be concluded that, when a well is produced at a constant rate, the greater the flow capacity of fluids in zone 2 and zone 3, the lower the flow resistance encountered by fluids within the zone, and consequently, the smaller the formation pressure loss caused by fluid flow.

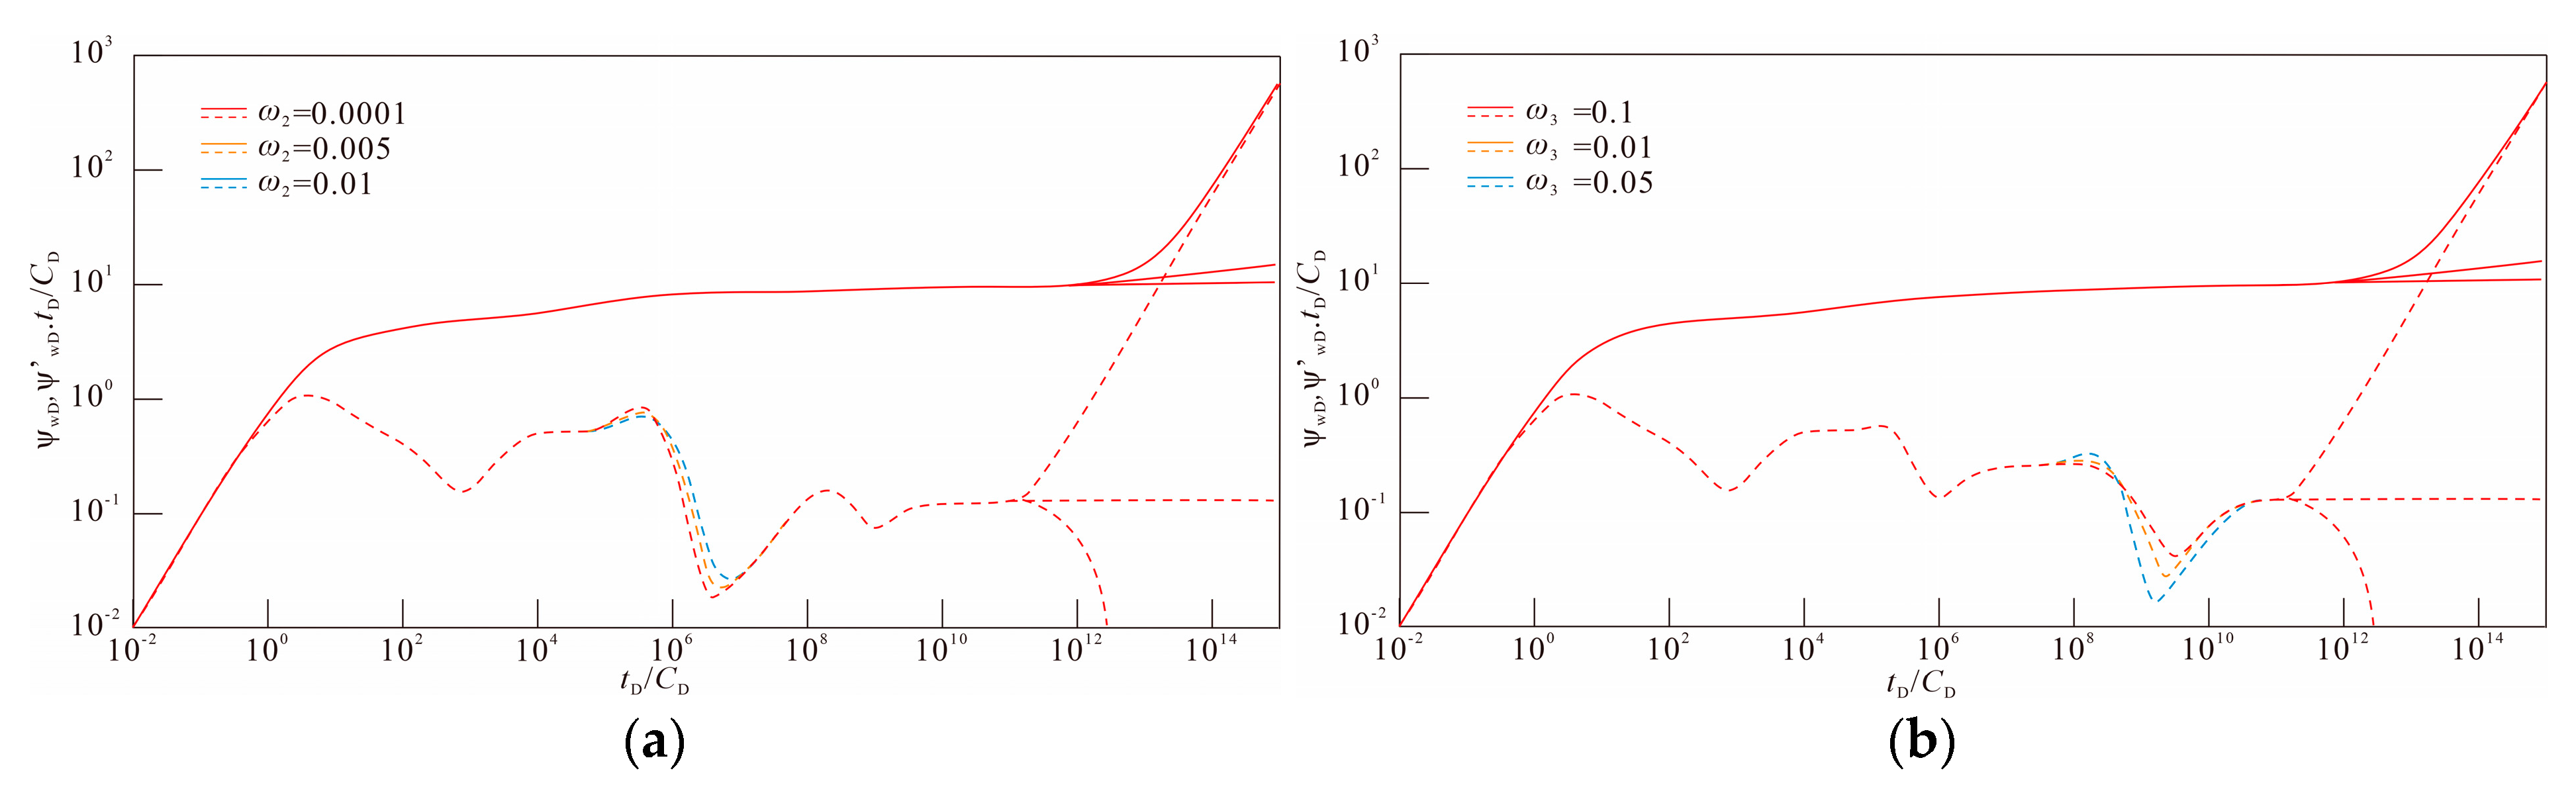
4.5. Effect of the Elastic Storage Ratio of Natural Fracture

Figure 8a and Figure 8b, respectively, show the influence of ω2 and ω3 on the pressure dynamic curve. These two parameters measure the fluid storage capacity of the fracture systems in their respective zones; higher values indicate greater storage capacity. Figure 8a shows that the decrease in ω2 values causes the concavity in the Stage VII pressure dynamic curve to become wider and deeper. Figure 8b shows the effect of ω3 on the pressure dynamic curve, which changes in a similar way to Figure 8a, but the effect occurs at Stage X. Combining the effects of the two parameters shows that the stronger the ability of the fracture system to store fluid, the later the inter-porosity fluid flow that occurs and the shorter the duration of that flow.

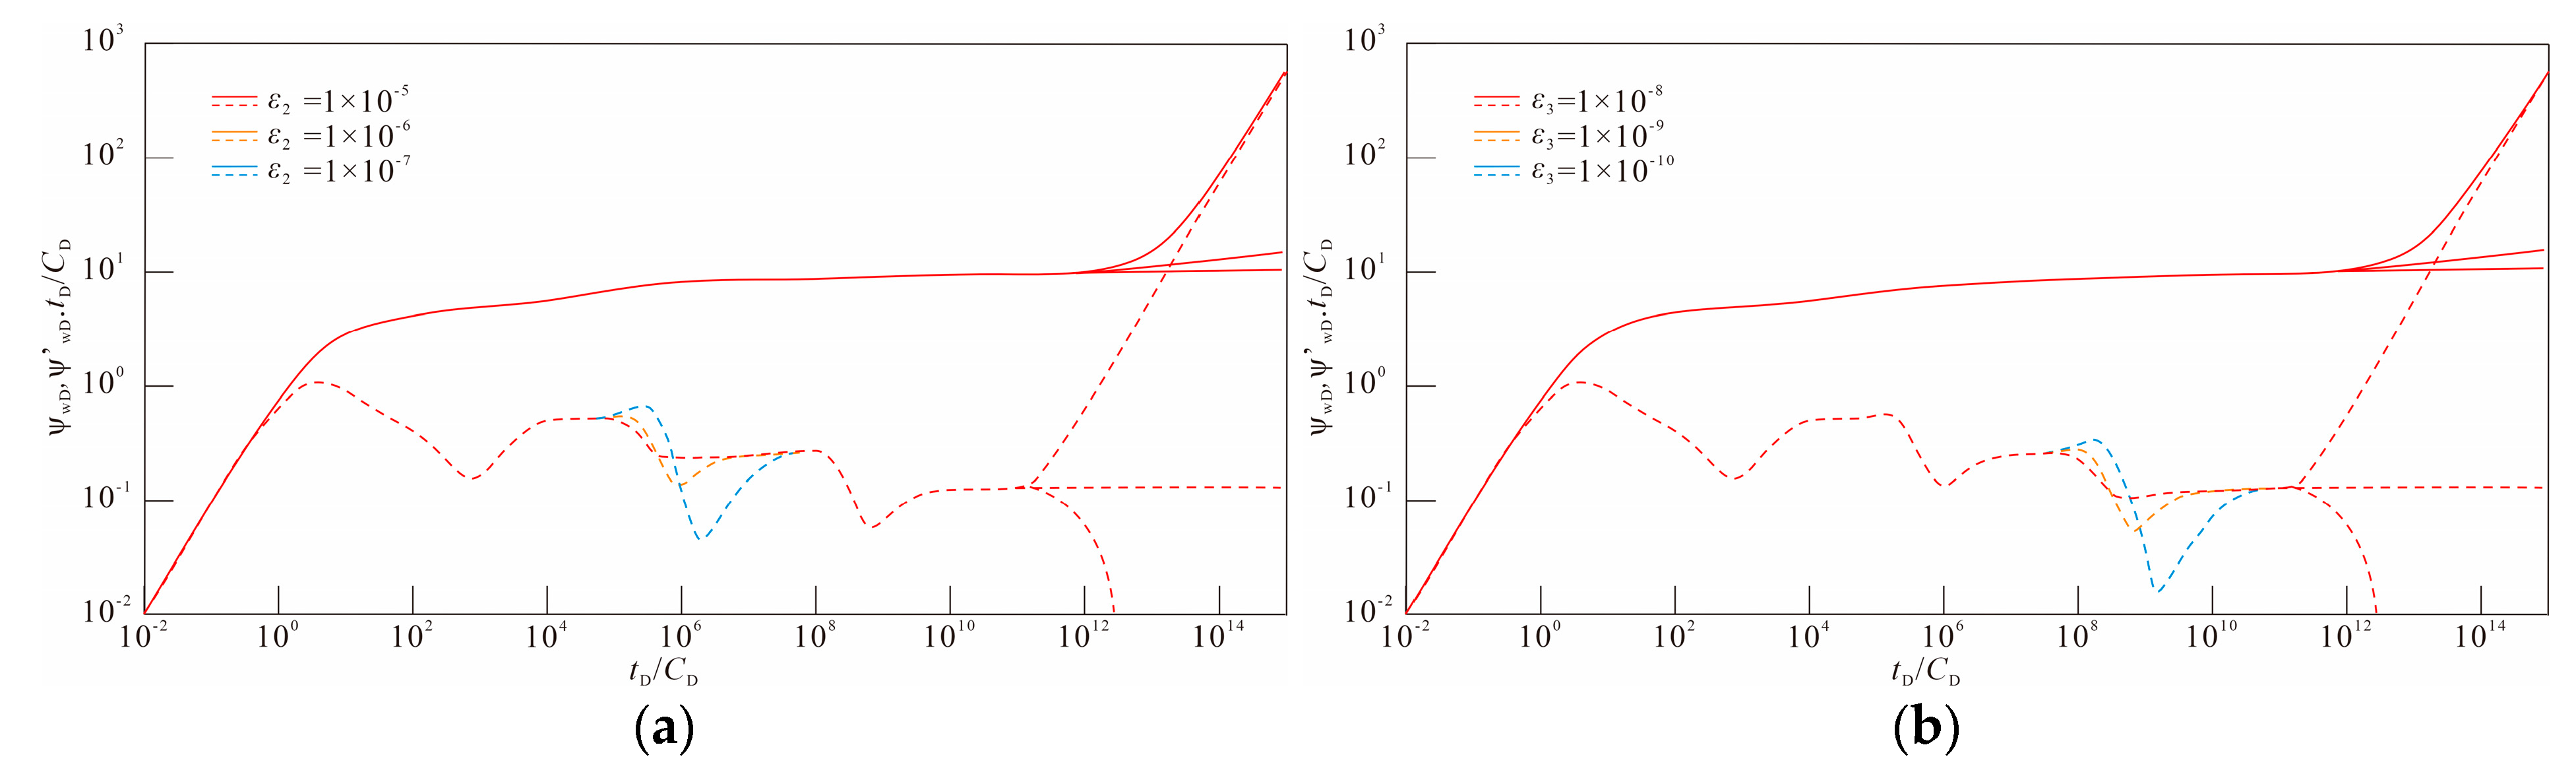
4.6. Effect of the Inter-Porosity Fluid Flow Factor

Figure 9a and Figure 9b, respectively, show the influence of ε2 and ε3 on the pressure dynamic curve. These two parameters measure the flow ability of fluid from matrix system to fracture system in zone 2 and zone 3. The higher the value, the stronger the inter-porosity fluid flow from the matrix to the fractures. Figure 9a indicates that increasing ε2 narrows and shallows the concavity of the Stage VII pressure dynamic curve, causing a pronounced leftward shift. Once ε2 rises beyond a certain level, the concavity completely disappears. Figure 9b shows the effect of ε3 on the pressure dynamic curve, which changes in a similar way to Figure 9a, but the effect occurs at Stage X. Combining the effects of the two parameters reveals that the stronger the capacity for inter-porosity fluid flow, the shorter the duration of the inter-porosity flow period.

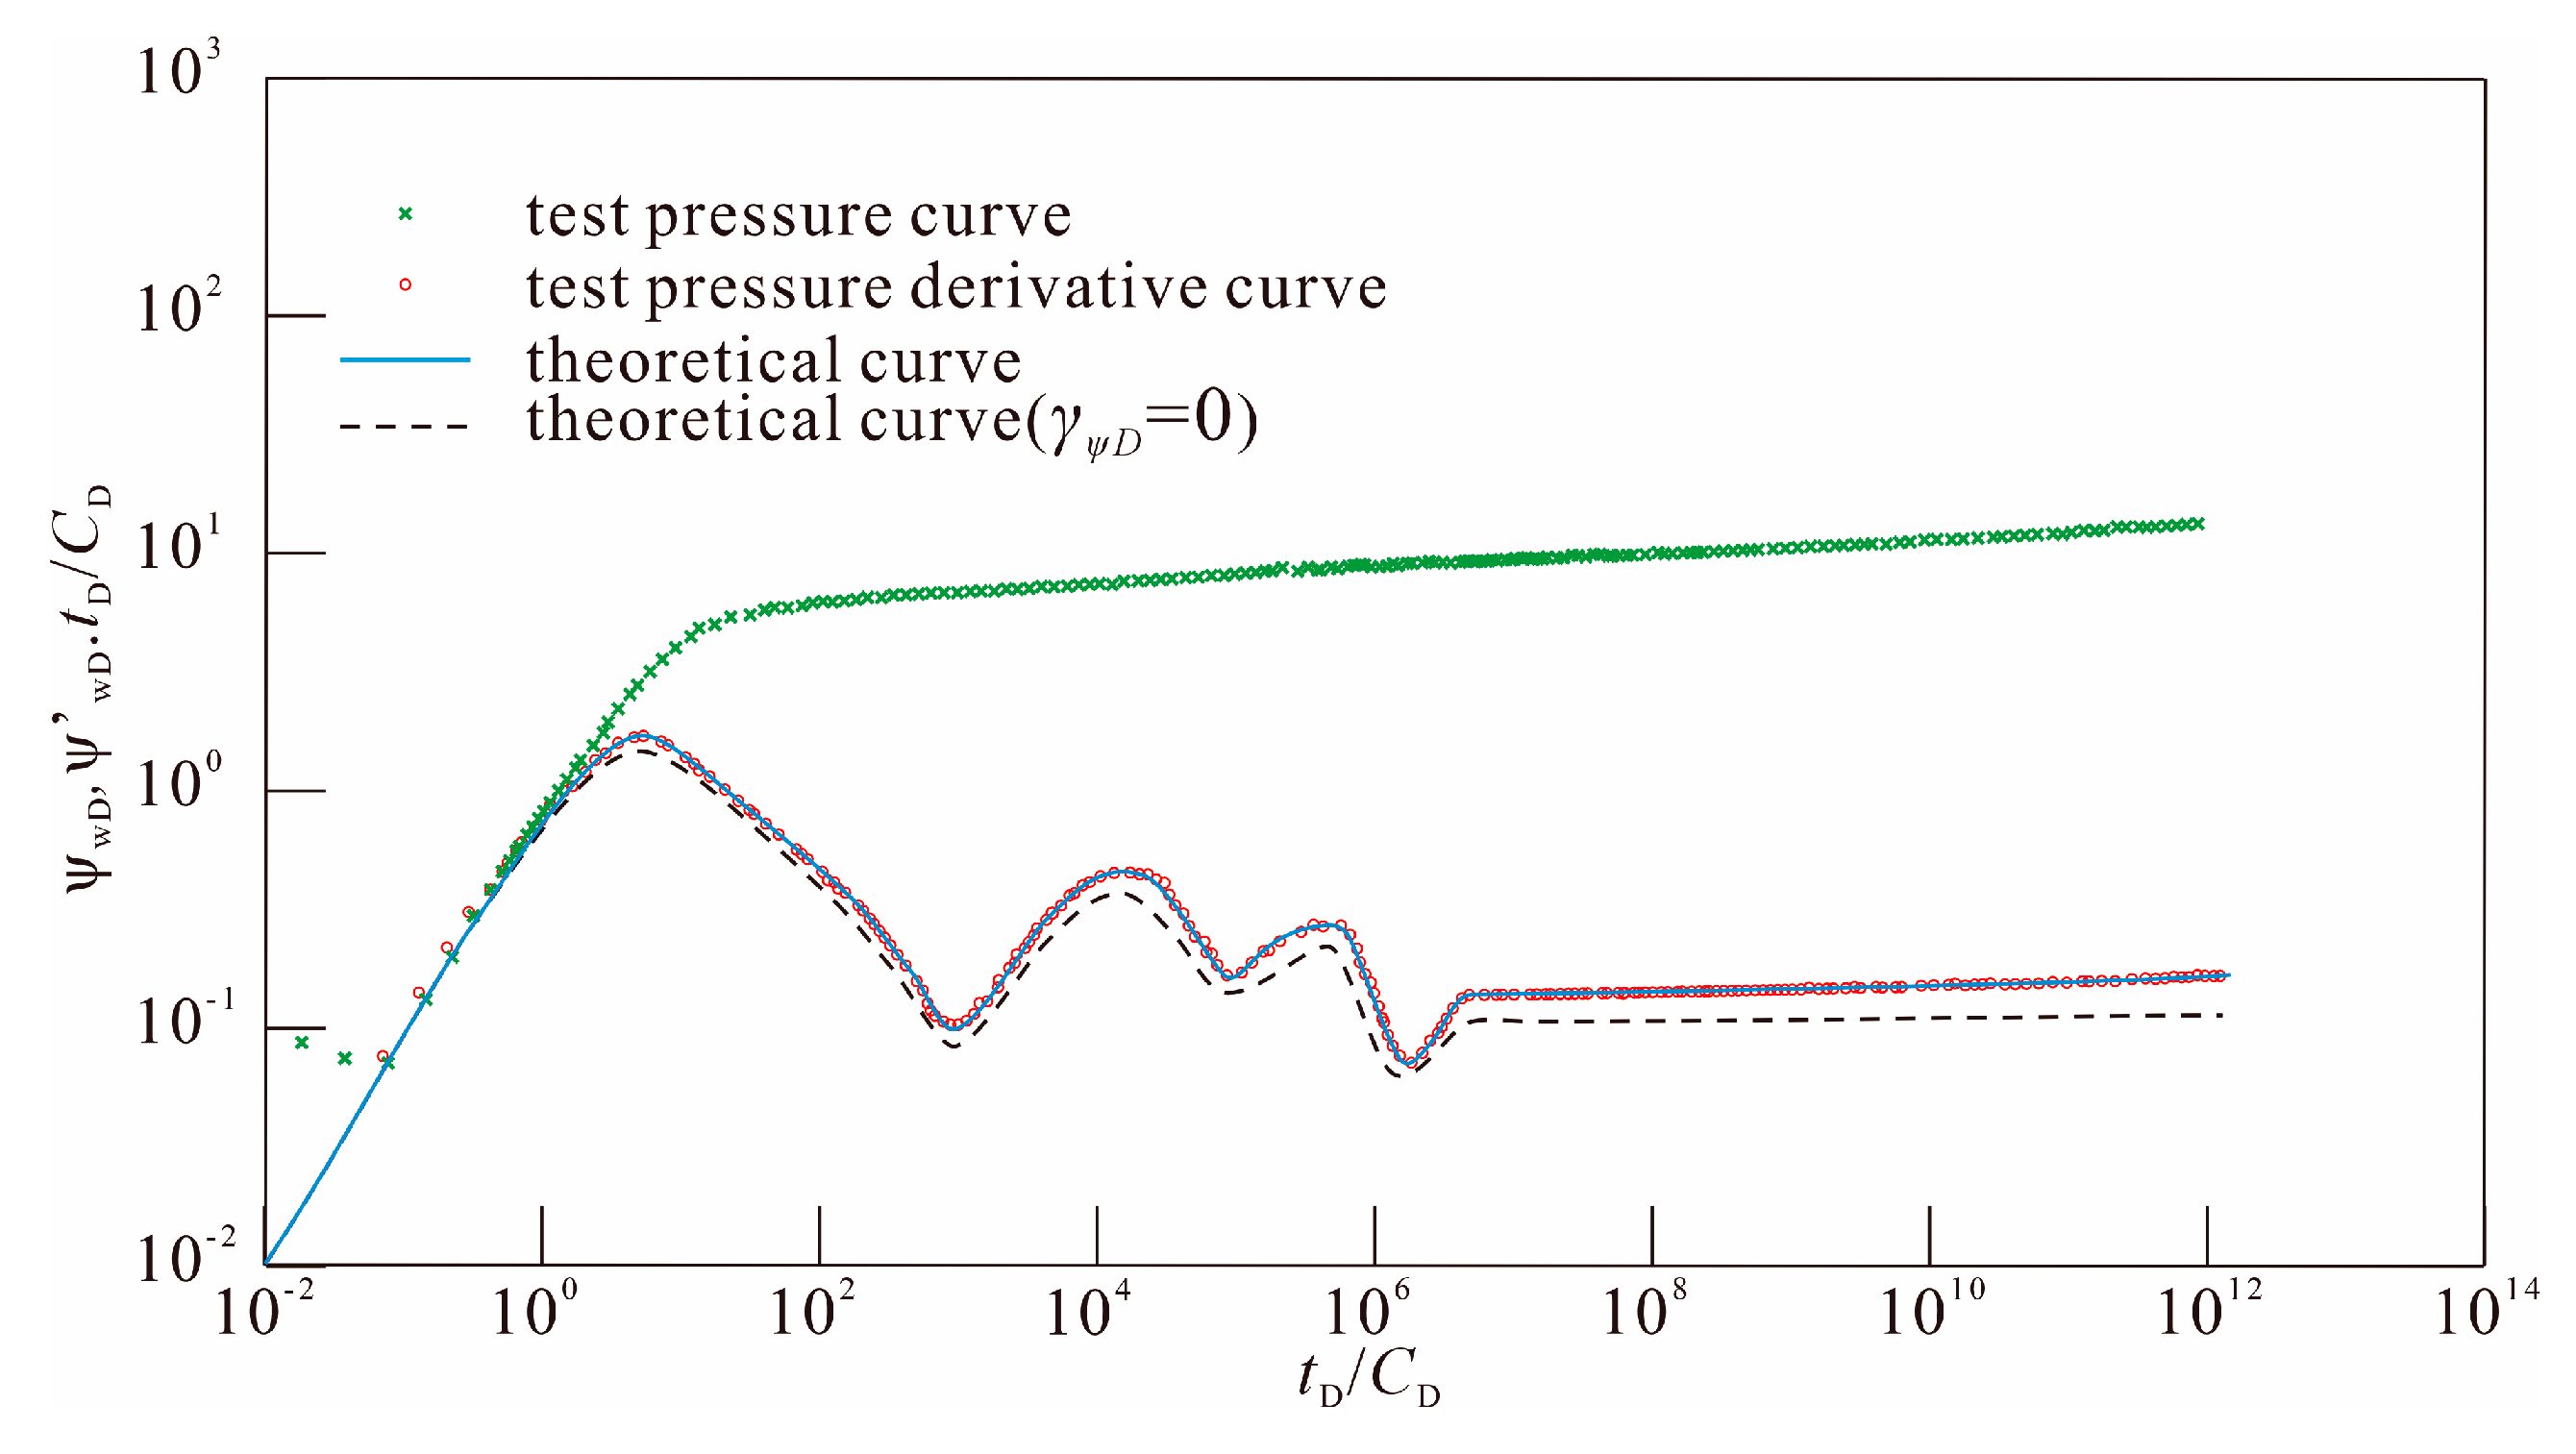
5. Well-Test Interpretation

The Tarim Basin is located in the northwest of China. It is the largest inland sedimentary basin in China, with an area of approximately 560,000 square kilometers. Geologically, the basin has a complex structural framework, with many uplifts and depressions, and is mainly composed of thick carbonate rock strata from the Paleozoic era. Due to the long-term dynamic tectonic evolution of the basin, including multiple orogeny and faults, extensive carbonate rock reservoirs and well-developed fracture systems have been formed. These reservoirs are usually located at important burial depths and have undergone intense diagenesis and tectonic deformation. Due to the existence of natural fractures, the matrix porosity is low and the permeability is high. The Tarim Basin has developed a set of naturally fractured carbonate reservoirs, classified as condensate gas layers, with a depth of 8225.3 m and a temperature of 152.04 °C. The initial pressure is 76.6 MPa and the upper dew-point pressure is 40.69 MPa. To date, this reservoir has been in production for 8 years. The current reservoir pressure around the wellbore is 33.43 MPa, which is below the upper dew-point pressure, indicating the presence of oil and gas two-phase flow within the reservoir. Within this formation, there is a pressure testing well that has been tested for 888 h. The basic formation characteristics of this well are as follows: the productive layer is buried at depths ranging from 8174.42 m to 8324.42 m, with a reservoir thickness of 150 m and a wellbore diameter of 0.178 m. The daily production rates for gas and oil are 2.05 × 10⁴ m3/d and 54.36 m3/d, respectively. The viscosity of the natural gas is 0.021 mPa·s, with a compressibility factor of 0.076 MPa−1 and a volume factor of 0.003. The viscosity of the condensate oil is 1.52 mPa·s and the compressibility factor of the crude oil is 0.0043 MPa−1. In the matrix of the formation, the porosity is 0.063, while the fracture porosity is 0.006. The matrix compressibility is 0.0011 MPa−1 and the fracture compressibility is 0.07 MPa−1. The volume factor of the condensate oil is 1.34 and the oil saturation in the first zone is 0.46. Based on pressure data, a well-test interpretation was conducted, with the well-test fitting curve shown in Figure 10. The fitting results indicate significant stress sensitivity within the formation, causing the actual pressure derivative curve to deviate upwards compared to the theoretical curve that does not account for stress sensitivity (as shown by the dashed line in Figure 10). The interpretation parameters obtained from the fitting analysis are as follows: the elastic storage coefficient is 0.052, the skin factor is 0.8, the inter-porosity fluid flow factor in zones 1, 2 and 3 are 3.1 × 10⁻⁵, 6.3 × 10⁻⁷ and 9.4 × 10⁻⁸, respectively. The elastic storage ratio of natural fracture among zones 1, 2 and 3 are 0.043, 0.048 and 0.051. The wellbore storage coefficient is 0.516 m3/MPa, the formation permeability is 0.0307 μm2, the flow coefficient for zone 2 is 274.71 μm2·m/(mPa·s) and the flow coefficient for zone 3 is 457.86 μm2·m/(mPa·s). The immobile condensate oil content in zone 2 is 0.14, the dimensionless permeability modulus is 0.026 and the corresponding dimensioned permeability modulus is 0.000383 MPa−1.

6. Conclusions

In this study, based on the flow behavior zoning and reservoir physical property zoning phenomena of carbonate rock condensate gas reservoirs, combined with the significant permeability stress sensitivity and complex pore structure characteristics of carbonate rocks, we established double-porosity media oil and gas two-phase three-zone composite model considering permeability stress sensitivity. The model was solved by using mathematical and physical methods and the pressure dynamic curve for modern well-test interpretation was plotted. Through the pressure dynamic curve, 12 flow stages in the reservoir were identified and the sensitivity analysis and practical application of the relevant reservoir parameters were carried out. The main understandings and conclusions we have obtained are as follows:
(1)
The pressure dynamic curve is subdivided into twelve flow stages. Except for Stage I, stress sensitivity has a significant influence on the stress response and its effect gradually increases over time. The shape of the pressure curve in Stage XII is significantly affected by boundary conditions: under the conditions of infinite boundary and constant pressure boundary, the strong stress sensitivity accelerates the loss of formation pressure; under the condition of closed boundary, due to the lack of external energy supply, the strong stress sensitivity leads to the closure of fractures, the reduction of effective fluid channels, the early appearance of boundary responses and the early rise of the pressure derivative curve. This indicates that the interaction between boundary conditions and stress sensitivity has a decisive influence on the dynamic changes of reservoir pressure and needs to be fully considered in model analysis and engineering applications.
(2)
The increased condensate saturation enhances flow resistance within zone 2, leading to greater pressure loss, and also causes the transitional gas flow from zone 3 to zone 2 to commence earlier. This effect is clearly reflected by both the elevation and leftward shift of the pressure derivative curve during the corresponding flow stages. Overall, increased condensate saturation significantly alters flow characteristics and pressure response in zone 2.
(3)
The greater the degree of reservoir development in the zone, the smaller the resistance to fluid flow in the zone. The smaller the pressure loss caused by the flow, the longer the flow lasts. At the corresponding stage, both the decline and the right shift of the pressure derivative curve clearly reflect this influence. Overall, the transformation of the reservoir can extend the production life of the gas reservoir.
(4)
The stronger the flow capacity of the fluid within the area, the smaller the resistance the fluid flow encounters and the smaller the pressure loss generated by the flow within the same production time. At the corresponding stage, the decline of the pressure derivative curve clearly reflects this influence. That is to say, during the production process, measures to improve the fluidity of the fluid can be taken to significantly reduce the pressure loss generated during the flow process, thereby increasing production capacity.
Our study provides a comprehensive framework for well-test interpretation and development optimization in stress-sensitive, dual-porosity carbonate condensate gas reservoirs. However, our research also has certain limitations: on the one hand, the model does not consider the influence of horizontal well production on pressure dynamics; on the other hand, the flow near the wellbore does not take into account the high-velocity non-Darcy flow and is only assumed to be the Darcy flow. It is hoped that these limitations will be addressed in future research.

Author Contributions

All authors contributed to the study. G.-T.S.: investigation, methodology, validation, visualization, writing—original draft and writing—review and editing. R.-S.N.: data curation, methodology, resources and supervision. All authors have read and agreed to the published version of the manuscript.

Funding

This research received no external funding.

Data Availability Statement

The datasets used and analyzed during the current study are available from the corresponding author on reasonable request.

Conflicts of Interest

The authors report no conflicts of interest.

References

  1. Katz, D.L.; Kurata, F. Retrograde condensation. Ind. Eng. Chem. 1940, 32, 817–827. [Google Scholar] [CrossRef]
  2. Muskat, M. Some theoretical aspect s of cycling–Part 2: Retrograde condensation about well bores. Oil Gas J. 1950, 48, 53–55. [Google Scholar]
  3. Jones, J.; Vo, D.; Raghavan, R. Interpretation of pressure-buildup responses in gas-condensate wells. SPE Form. Eval. 1989, 4, 93–104. [Google Scholar] [CrossRef]
  4. Fevang, Ø.; Whitson, C.H. Modeling gas-condensate well deliverability. SPE Reserv. Eng. 1996, 11, 221–230. [Google Scholar] [CrossRef]
  5. Gringarten, A.; Al-Lamki, A.; Daungkaew, S.; Mott, R.; Whittle, T. Well Test Analysis in Gas-Condensate Reservoirs. In Proceedings of the SPE Annual Technical Conference and Exhibition, Dallas, TX, USA, 1 October 2000; p. SPE-62920-MS. [Google Scholar]
  6. Mithani, A.H.; Motaei, E. Tracking Condensate Banking in Tight Gas Reservoirs Through Well Test Analysis: Right Well Test Design Leads to Factual Reservoir Characterization. In Proceedings of the Abu Dhabi International Petroleum Exhibition and Conference, Abu Dhabi, UAE, 9 November 2020; p. D021S028R001. [Google Scholar]
  7. Wang, W.; Zhu, W.; Li, M. Gas–Liquid flow behavior in condensate gas wells under different development stages. Energies 2023, 16, 950. [Google Scholar] [CrossRef]
  8. Jing, W.; Li, A.; Zhou, S.; Zhang, L.; Zhong, J.; Cui, S.; Sun, H.; Yao, J. Experimental study on the influence of fractured-vuggy porous media on condensate gas depletion production. Pet. Sci. Technol. 2024, 42, 3284–3300. [Google Scholar] [CrossRef]
  9. Zhao, L.; Zhang, L.; Su, Y.; Tan, X.; Li, C.; Wang, S. In-situ CT study on the effect of cyclic gas injection and depletion exploitation on the phase behavior of fractured condensate gas reservoirs. Front. Earth Sci. 2024, 12, 1418821. [Google Scholar] [CrossRef]
  10. Pang, M.; Ba, J.; Carcione, J.M.; Balcewicz, M.; Siegert, M.; Tang, G.; Saenger, E.H. Structural and elastic properties of carbonate rocks with different pore types based on digital and theoretical rock physics. J. Geophys. Res. Solid Earth 2025, 130, e2024JB030538. [Google Scholar] [CrossRef]
  11. McLatchie, A.; Hemstock, R.; Young, J. The effective compressibility of reservoir rock and its effects on permeability. J. Pet. Technol. 1958, 10, 49–51. [Google Scholar] [CrossRef]
  12. Vairogs, J.; Hearn, C.; Dareing, D.W.; Rhoades, V. Effect of rock stress on gas production from low-permeability reservoirs. J. Pet. Technol. 1971, 23, 1161–1167. [Google Scholar] [CrossRef]
  13. Thomas, R.D.; Ward, D.C. Effect of overburden pressure and water saturation on gas permeability of tight sandstone cores. J. Pet. Technol. 1972, 24, 120–124. [Google Scholar] [CrossRef]
  14. Petunin, V.; Tutuncu, A.; Prasad, M.; Kazemi, H.; Yin, X. An Experimental Study for Investigating the Stress Dependence of Permeability in Sandstones and Carbonates. In Proceedings of the ARMA US Rock Mechanics/Geomechanics Symposium, San Francisco, CA, USA, 26 June 2011; p. ARMA-11-279. [Google Scholar]
  15. Al-Ameri, N.J.; Hamd-Allah, S.M.; Abass, H.H. Stress-Dependent Petrophysical Properties of High Heterogeneous Carbonate Tight oil Reservoirs. In Proceedings of the Abu Dhabi International Petroleum Exhibition and Conference, Abu Dhabi, United Arab Emirates, 9 November 2020; p. D012S116R105. [Google Scholar]
  16. Cheng, Y.; Chunqiu, G.; Pengyu, C.; Haidong, S.; Chengqian, T.; Cheng, M.; Yuzhong, X.; Xiang, L. Stress sensitivity of carbonate gas reservoirs and its microscopic mechanism. Pet. Explor. Dev. 2023, 50, 166–174. [Google Scholar] [CrossRef]
  17. Abass, H.; Ortiz, I.; Khan, M.; Beresky, J.; Sierra, L. Understanding stress dependant permeability of matrix, natural fractures, and hydraulic fractures in carbonate formations. In Proceedings of the SPE Kingdom of Saudi Arabia Annual Technical Symposium and Exhibition, Dhahran, Saudi Arabia, 7 May 2007; p. SPE-110973-MS. [Google Scholar]
  18. Chen, Y.; Li, K.; Ni, J.; Hou, Q. Four-Dimensional Geological Modeling of Stress-Sensitive Reservoirs of Abnormally High-Pressure Carbonates. In Proceedings of the International Petroleum Technology Conference, Virtual, 16 March 2021; p. D012S045R151. [Google Scholar]
  19. Liu, Y.; Pan, Y.; Xiong, Y.; Sun, Y.; Liang, B.; Sun, L. Study on the Mechanism of Stress Sensitivity and Retrograde Condensation Coupling Effect on Reservoir Depletion Development in Fractured-Vuggy Carbonate Rocks. SPE J. 2025, 30, 198–209. [Google Scholar] [CrossRef]
  20. Barenblatt, G.; Zheltov, Y.P.; Kochina, I. Basic concepts in the theory of seepage of homogeneous liquids in fissured rocks. J. Appl. Math. Mech. 1960, 24, 852–864. [Google Scholar] [CrossRef]
  21. Warren, J.E.; Root, P.J. The behavior of naturally fractured reservoirs. Soc. Pet. Eng. J. 1963, 3, 245–255. [Google Scholar] [CrossRef]
  22. Nie, R.-S.; Meng, Y.-F.; Jia, Y.-L.; Zhang, F.-X.; Yang, X.-T.; Niu, X.-N. Dual porosity and dual permeability modeling of horizontal well in naturally fractured reservoir. Transp. Porous Media 2012, 92, 213–235. [Google Scholar] [CrossRef]
  23. Ji, A.; Chen, Z. Study on Seepage Model of the Dual-Permeability Quadruple-Media Homogeneous Reservoirs. In Proceedings of the 2020 International Conference on Computer Information and Big Data Applications (CIBDA), Guiyang, China, 17–19 April 2020; pp. 281–285. [Google Scholar]
  24. Du, X.; Zhang, Y.; Zhou, C.; Su, Y.; Li, Q.; Li, P.; Lu, Z.; Xian, Y.; Lu, D. A novel method for determining the binomial deliverability equation of fractured caved carbonate reservoirs. J. Pet. Sci. Eng. 2022, 208, 109496. [Google Scholar] [CrossRef]
  25. Li, B.; Yin, H.; Xing, C. Well Test Model for Double-Porosity Media Three-Zone Composite Reservoir Considering Interface Resistance. In Proceedings of the International Conference on Computational & Experimental Engineering and Sciences, Shenzhen, China, 26–29 May 2023; pp. 715–730. [Google Scholar]
  26. Zhang, C.; Chen, S.; Zhu, S.; Yan, X.; Wang, H.; Wang, Y.; Li, J.-S.; Nie, R.-S. Modelling pressure dynamics of oil–gas two-phase flow in double-porosity media formation with permeability-stress sensitivity. Sci. Rep. 2024, 14, 24418. [Google Scholar] [CrossRef]
  27. Al-Hussainy, R.; Ramey, H., Jr.; Crawford, P. The flow of real gases through porous media. J. Pet. Technol. 1966, 18, 624–636. [Google Scholar] [CrossRef]
  28. Fetkovich, M. The isochronal testing of oil wells. In Proceedings of the SPE Annual Technical Conference and Exhibition, Las Vegas, NV, USA, 30 September 1973; p. SPE-4529-MS. [Google Scholar]
  29. Pedrosa, O.A., Jr. Pressure transient response in stress-sensitive formations. In Proceedings of the SPE Western Regional Meeting, Oakland, CA, USA, 2 April 1986; p. SPE-15115-MS. [Google Scholar]
  30. Wei, C.; Li, H.; Luo, H.; Li, Y.; Cheng, S. Generalized analytical solutions of vertically fractured wells in commingled reservoirs: Field case study. SPE J. 2024, 29, 1419–1433. [Google Scholar] [CrossRef]
  31. Gao, Y.; Zhu, W.; Chu, H.; Yue, M. A Novel Method for Calculating Average Formation Pressure of Gas-Reservoir-Type Underground Natural Gas Storage. Acid Gas Inject. Field Data Simul. 2025, 411–426. [Google Scholar] [CrossRef]
  32. Pirard, Y.; Bocock, A. Pressure derivative enhances use of type curves for the analysis of well tests. In Proceedings of the SPE International Oil and Gas Conference and Exhibition in China, Beijing, China, 17 March 1986; p. SPE-14101-MS. [Google Scholar]
  33. Renard, P.; Glenz, D.; Mejias, M. Understanding diagnostic plots for well-test interpretation. Hydrogeol. J. 2009, 17, 589–600. [Google Scholar] [CrossRef]
  34. An, C.; Killough, J.; Mi, L. Stress-dependent permeability of organic-rich shale reservoirs: Impacts of stress changes and matrix shrinkage. J. Pet. Sci. Eng. 2019, 172, 1034–1047. [Google Scholar] [CrossRef]
  35. Huzhen, W.; Tiancheng, L.; Zhuangzhuang, S.; Chunyao, W.; Zhenyu, L.; Zhijun, Z.; Changjun, D.; Zhiming, Z. Formation pressure distribution and productivity prediction of fractured horizontal wells in stress sensitive reservoirs. Front. Energy Res. 2022, 10, 978134. [Google Scholar] [CrossRef]
  36. Sabea, H.J.; Al-Fatlawi, O. Studying the impact of condensate blockage on gas production: A review. Mater. Today Proc. 2022, 61, 942–947. [Google Scholar] [CrossRef]
Figure 1. Conceptual model of a three-zone composite reservoir.
Energies 18 02209 g001
Figure 2. Flow zone partitioning in condensate gas reservoirs.
Energies 18 02209 g002
Figure 3. The description of the double porosity media model. (a) The green part represents the wellbore, the purple part represents the fractures and the black arrows indicate the direction of fluid flow; (b) the purple and light purple parts represent the fractures that are not affected and those that are affected by stress, respectively, with the black arrows indicating the direction of stress.
Energies 18 02209 g003
Figure 4. The effect of γψD on pressure dynamic curves. (a) Flow stage identification; (bd) effect of γψD on pressure response curves under infinite, constant pressure and closed boundary conditions, respectively.
Energies 18 02209 g004
Figure 5. The effect of So on pressure dynamic curves.
Energies 18 02209 g005
Figure 6. The effect of η12 (a) and η13 (b) on pressure dynamic curves.
Energies 18 02209 g006
Figure 7. The effect of M12 (a) and M23 (b) on pressure dynamic curves.
Energies 18 02209 g007
Figure 8. The effect of ω2 (a) and ω3 (b) on pressure dynamic curves.
Energies 18 02209 g008
Figure 9. The effect of ε2 (a) and ε3 (b) on pressure dynamic curves.
Energies 18 02209 g009
Figure 10. Well-test fitting curves of the example well.
Energies 18 02209 g010
Table 1. Dimensionless variable definition.
SymbolFormulaSymbolFormula
ψjlD ψ j l D = 2 π k 1 h ( ψ i ψ j l ) q ,   j = f , m ;   l = 1 , 2 , 3 M12 M 12 = k f 1 μ 1 μ 2 k f 2
rD r D = r r w M23 M 23 = k f 2 μ 2 μ 3 k f 3
tD t D = λ f t t ( ϕ m 1 C m t 1 + ϕ f 1 C f t 1 ) r w 2 γψD γ ψ D = γ ψ q 2 π k 1 h
ε1 ε 1 = α λ m t λ f t r w 2 ωl ω l = ϕ f l C f t l ϕ m l C m t l + ϕ f l C f t l ,   l = 1 ,   2 ,   3
εl ε l = α k m l k f l r w 2 ,   l = 2 ,   3 η1l η 1 l = λ f t μ l ( ϕ m l C m t l + ϕ f l C f t l ) k f l ( ϕ m 1 C m t 1 + ϕ f 1 C f t 1 )   l = 2 ,   3
Table 2. Identification of the flow stage.
Flow StageCharacteristics of Pressure Log-Log CurvesDescription of Fluid Flow
Stage IBoth the pressure curve and the pressure derivative curve are straight lines with slope one.Fluid flows into the wellbore and is stored in it.
Stage IIPressure derivative curve reaches its maximum value, presenting a hump-shaped feature. Fluid flows from the fracture system in zone 1 to the wellbore.
Stage IIIThe increase of the pressure curve slows down and the decrease of the derivative curve slows down.The pseudo-radial flow of the fluid in the fracture system of zone 1.
Stage IVThe pressure derivative curve shows the first concave shape feature.Fluid undergoes inter-porosity flow from the matrix system to the fracture system in zone 1.
Stage VThe pressure derivative curve is a horizontal straight line and its value is 0.5.Fluid exhibits radial flow within the entire reservoir media system of zone 1.
Stage VIThe pressure derivative curve undergoes the first sudden change.Fluid undergoes transitional flow from zone 2 to zone 1.
Stage VIIThe pressure derivative curve shows the second concave shape feature.Fluid undergoes inter-porosity flow from the matrix system to the fracture system in zone 2.
Stage VIIIThe pressure derivative curve is a horizontal straight line.Fluid exhibits radial flow within the entire reservoir media system of zone 2.
Stage IXThe pressure derivative curve undergoes the second sudden change.Fluid undergoes transitional flow from zone 3 to zone 2.
Stage XThe pressure derivative curve shows the third concave shape feature.Fluid undergoes inter-porosity flow from the matrix system to the fracture system in zone 3.
Stage XIThe pressure derivative curve is a horizontal straight line.Fluid exhibits radial flow within the entire reservoir media system of zone 3.
Stage XIIUnder the conditions of infinite boundaries, closed boundaries and constant pressure boundaries, the pressure derivative curves respectively exhibit the characteristics of linearity, continuous increase and rapid decrease.Fluid exhibits a response at the boundary.
Disclaimer/Publisher’s Note: The statements, opinions and data contained in all publications are solely those of the individual author(s) and contributor(s) and not of MDPI and/or the editor(s). MDPI and/or the editor(s) disclaim responsibility for any injury to people or property resulting from any ideas, methods, instructions or products referred to in the content.

