Article

Energy Recovery from Municipal Biodegradable Waste in a Circular Economy

by
Anna Marciniuk-Kluska
1 and
Mariusz Kluska
2,*
1
Faculty of Social Sciences, University of Siedlce, 39 Zytnia Str., 08-110 Siedlce, Poland
2
Faculty of Sciences, University of Siedlce, 54 3-Maja Str., 08-110 Siedlce, Poland
*
Author to whom correspondence should be addressed.
Energies 2025, 18(9), 2210; https://doi.org/10.3390/en18092210 (registering DOI)
Submission received: 26 March 2025 / Revised: 14 April 2025 / Accepted: 24 April 2025 / Published: 26 April 2025
(This article belongs to the Special Issue Energy Markets and Energy Economy)

Abstract

:
Faced with the challenges of the energy crisis and the need to reduce greenhouse gas emissions, Poland needs to increase the share of renewable energy sources in the energy mix. Development trends in the waste-to-energy market reflect the global energy transition. Poland generates about 13 million tonnes of municipal waste annually, a significant percentage of which is biodegradable waste that should be converted into biogas or used in thermal processes to produce electricity and heat. Despite the benefits of recovering energy from waste, there are technological, economic, and regulatory barriers that limit the development of this sector in Poland. Creating an efficient waste management system is one of the most important challenges today in terms of energy, the environment, and the economy. The circular economy is a fundamental element of the European Union’s environmental policy, including the European Green Deal, the main objective of which is to combat the carbon footprint. The amount of energy produced is decisively influenced by the structure of the deposited waste and the share of the calorific fraction in the total mass of municipal waste. This study aimed to develop forecasts for biodegradable municipal waste, using the simulation and optimisation of the exponential Brownian smoothing constant, and to estimate the value of recovered energy. The forecasts were based on data on selective waste collection from different provinces of Poland. The study reveals that the forecast for biodegradable municipal waste in the coming years shows an increasing trend, amounting to 2,696,500 tonnes in 2030, which will allow for a significant increase in energy recovery.

1. Introduction

Today’s challenges related to environmental protection and energy transition are driving the search for innovative waste management methods and energy recovery [1,2,3,4,5]. As a result of growing problems related to environmental pollution and the depletion of natural resources, a circular economy plays a key role, with the objective of minimising waste and reusing it as secondary raw materials. This economy is a fundamental element of the European Union’s environmental policy, including the Green Deal, which assumes climate neutrality by 2050. One of the key aspects of this strategy is to reduce landfills and to develop modern methods of transforming waste into energy or raw materials for reuse [6,7,8,9,10,11]. In order to optimally achieve the energy transition, it is necessary to create forecasts in all areas related to environmental protection and energy recovery. As an element of novelty, such a forecast was created in this study.
This study aimed to develop forecasts for biodegradable municipal waste in Poland by 2030 and to estimate the value of recovered energy. The forecasts were developed using the simulation and optimisation of the smoothing constant with the exponential Brownian smoothing (ESM; also known as the exponential moving average, EMA) method. The forecasts were developed using selective waste collection data for individual provinces of Poland.
The theoretical foundations justifying the need for forecasts are presented in the second section below, followed by a section on the materials of the study, divided into subsections that make it possible to clearly present statistical analyses of the use of renewable resources and the mechanisms and technology of municipal waste collection in Poland. The fourth section presents the methodological design with reference to specific methodological elements. These elements include the method used and its selection, calculation formulae, methodological assumptions, and the data collection process. The results obtained are then discussed with reference to the literature and specific aspects of the closed loop economy model related to municipal waste reduction, decarbonisation measures, implications of renewable energy use, energy recovery mechanisms, recycling, and pollution taxation. Finally, the section ‘Summary and Development Prospects’ presents the results, the practical implications of the study, policy proposals, and recommendations for the future.

2. Theoretical Background

In these problems, waste conversion, including both incineration processes and more advanced technologies such as gasification or pyrolysis, is becoming increasingly important. These processes allow not only the disposal of waste but also the recovery of energy, which makes them an important element of the energy policies of many countries [12,13,14,15]. In Poland, as in other countries of the EU, regulations are being implemented to limit the landfilling of waste and promote its energy use. As part of legislative and strategic measures at the national level, solutions are being developed to increase the efficiency of energy recovery from waste and to implement new chemical recycling technologies that can provide an alternative to traditional waste management methods [16,17,18].
Proper waste management is a comprehensive system involving the generation, collection, transportation, processing, and disposal of waste. Municipal, industrial, and hazardous waste pose a huge challenge in terms of their proper management [19,20,21,22,23,24,25]. The European Union has issued numerous directives aimed at increasing the level of recycling and minimising waste sent to landfill. It is particularly important to reduce plastic waste, which represents one of the major threats to terrestrial and aquatic ecosystems [26,27,28]. OECD reports show that about 258 million tonnes of plastic waste are generated annually worldwide, of which only 18% is recycled. In Poland, according to Statistics Poland, 13.4 million tonnes of municipal waste were generated in 2023, half of which was recycled [29].
The main component of plastic waste is polyolefin waste, which has significant raw material and energy potential [30,31,32,33,34]. It can be used to produce alternative fuels, which aligns with the strategy of decarbonising transport and industry [35,36,37,38,39,40]. Using these raw materials can contribute to reducing the consumption of fossil fuel and greenhouse gas emissions [35,41,42,43,44]. Therefore, new technologies are being developed to enable the efficient processing of polyolefin waste into secondary raw materials. It should be emphasised that polyolefins, including polyethylene and polypropylene, constitute the dominant part of plastic production, and their effective disposal is crucial for a circular economy [45,46,47].
Thermal waste conversion is one of the key elements of modern waste management [48,49,50,51,52,53]. This includes several methods, such as incineration, pyrolysis, gasification, and plasma processes. Modern waste incineration plants are designed to minimise the emission of harmful substances such as dioxins and furans, while maximising the energy potential of waste [54,55,56]. At the same time, research is being conducted into new methods of thermal waste conversion that can increase process efficiency and reduce pollutant emissions.
Legal regulations pertaining to waste management are crucial for the effective implementation of the circular economy strategy [57,58,59,60,61,62]. With Directive 2008/98/EC, the European Union has introduced a waste hierarchy in which waste prevention is prioritised, followed by reuse and recycling [28]. In addition, the directive imposes an obligation to reduce the landfilling of biodegradable waste. In Poland, waste management is regulated by, among others, the Waste Law and the Environmental Protection Law, which implement EU regulations and define the principles of waste handling. The development of thermal waste conversion technology can contribute to a reduction in waste management costs and lower expenses related to energy purchases. The construction and operating costs of incineration plants are high, but the long-term benefits, such as the reduction in landfilling, the recovery of recyclables, and energy production, can compensate for these outlays. In addition, financial support mechanisms, such as EU funds for the development of green infrastructure, can be an important factor in supporting the development of the sector [63,64,65,66,67,68,69].

3. Study Materials

This research was based on data obtained from Statistics Poland for 2007–2023 [29] and Eurostat for 2019–2023 [70]. Municipal waste contains a significant amount of bio-waste. Depending on local circumstances and the season, the bio-waste content in municipal waste can be 30–35%. Proper management of bio-waste helps to achieve high recycling rates. The construction of about 100 such plants is planned in Poland in the coming years. Currently, most of the municipal waste collected (40%) is landfilled.
The share (%) of renewable energy in the EU-27 countries reached very high values in 2022; in the case of Malta, it was as high as 100% [71]. The countries with a share of more than 85% were Latvia, Portugal, Cyprus, Lithuania, Luxembourg, and Austria (Figure 1). The largest increases in the share of renewable energy sources (RES) occurred in countries that had a lower use of renewables in previous years. Examples of such countries include Greece, where the share of renewable energy sources in total energy production increased by 20.3 p.p.; Ireland, with an increase of 18.5 p.p.; and the Netherlands, with an increase of 17 p.p. For the EU-27 as a whole, the increase in the share of RES in 2019–2022 was 6.4 p.p., while for Poland, it was only 2.9 p.p.
Total energy consumption in the EU-27 countries fell by 3.8% between 2019 and 2022. Energy consumption decreased in 22 countries, with final consumption in Germany and France decreasing by about 5%. The largest decreases were found in Luxembourg (20%) and the Netherlands (10.8%). The largest increases, on the other hand, were found in Malta (8.4%), Bulgaria (1.4%), and Romania (0.9%). In Poland, the decrease in final energy consumption during the period in question amounted to 1%. The percentage share of energy production from RES in Poland in 2022 differed from that of the EU-27. Solid biofuels dominated in both Poland and the EU, but in the case of Poland, their share was much higher at 64.5%, while in the EU, it was 40.3%. A comparable proportion share was found on the use of wind energy, namely, 12.6% in Poland and 14.9% in the EU, followed by liquid biofuels in Poland (8.0%) and water energy in the EU (9.8%; Figure 2).
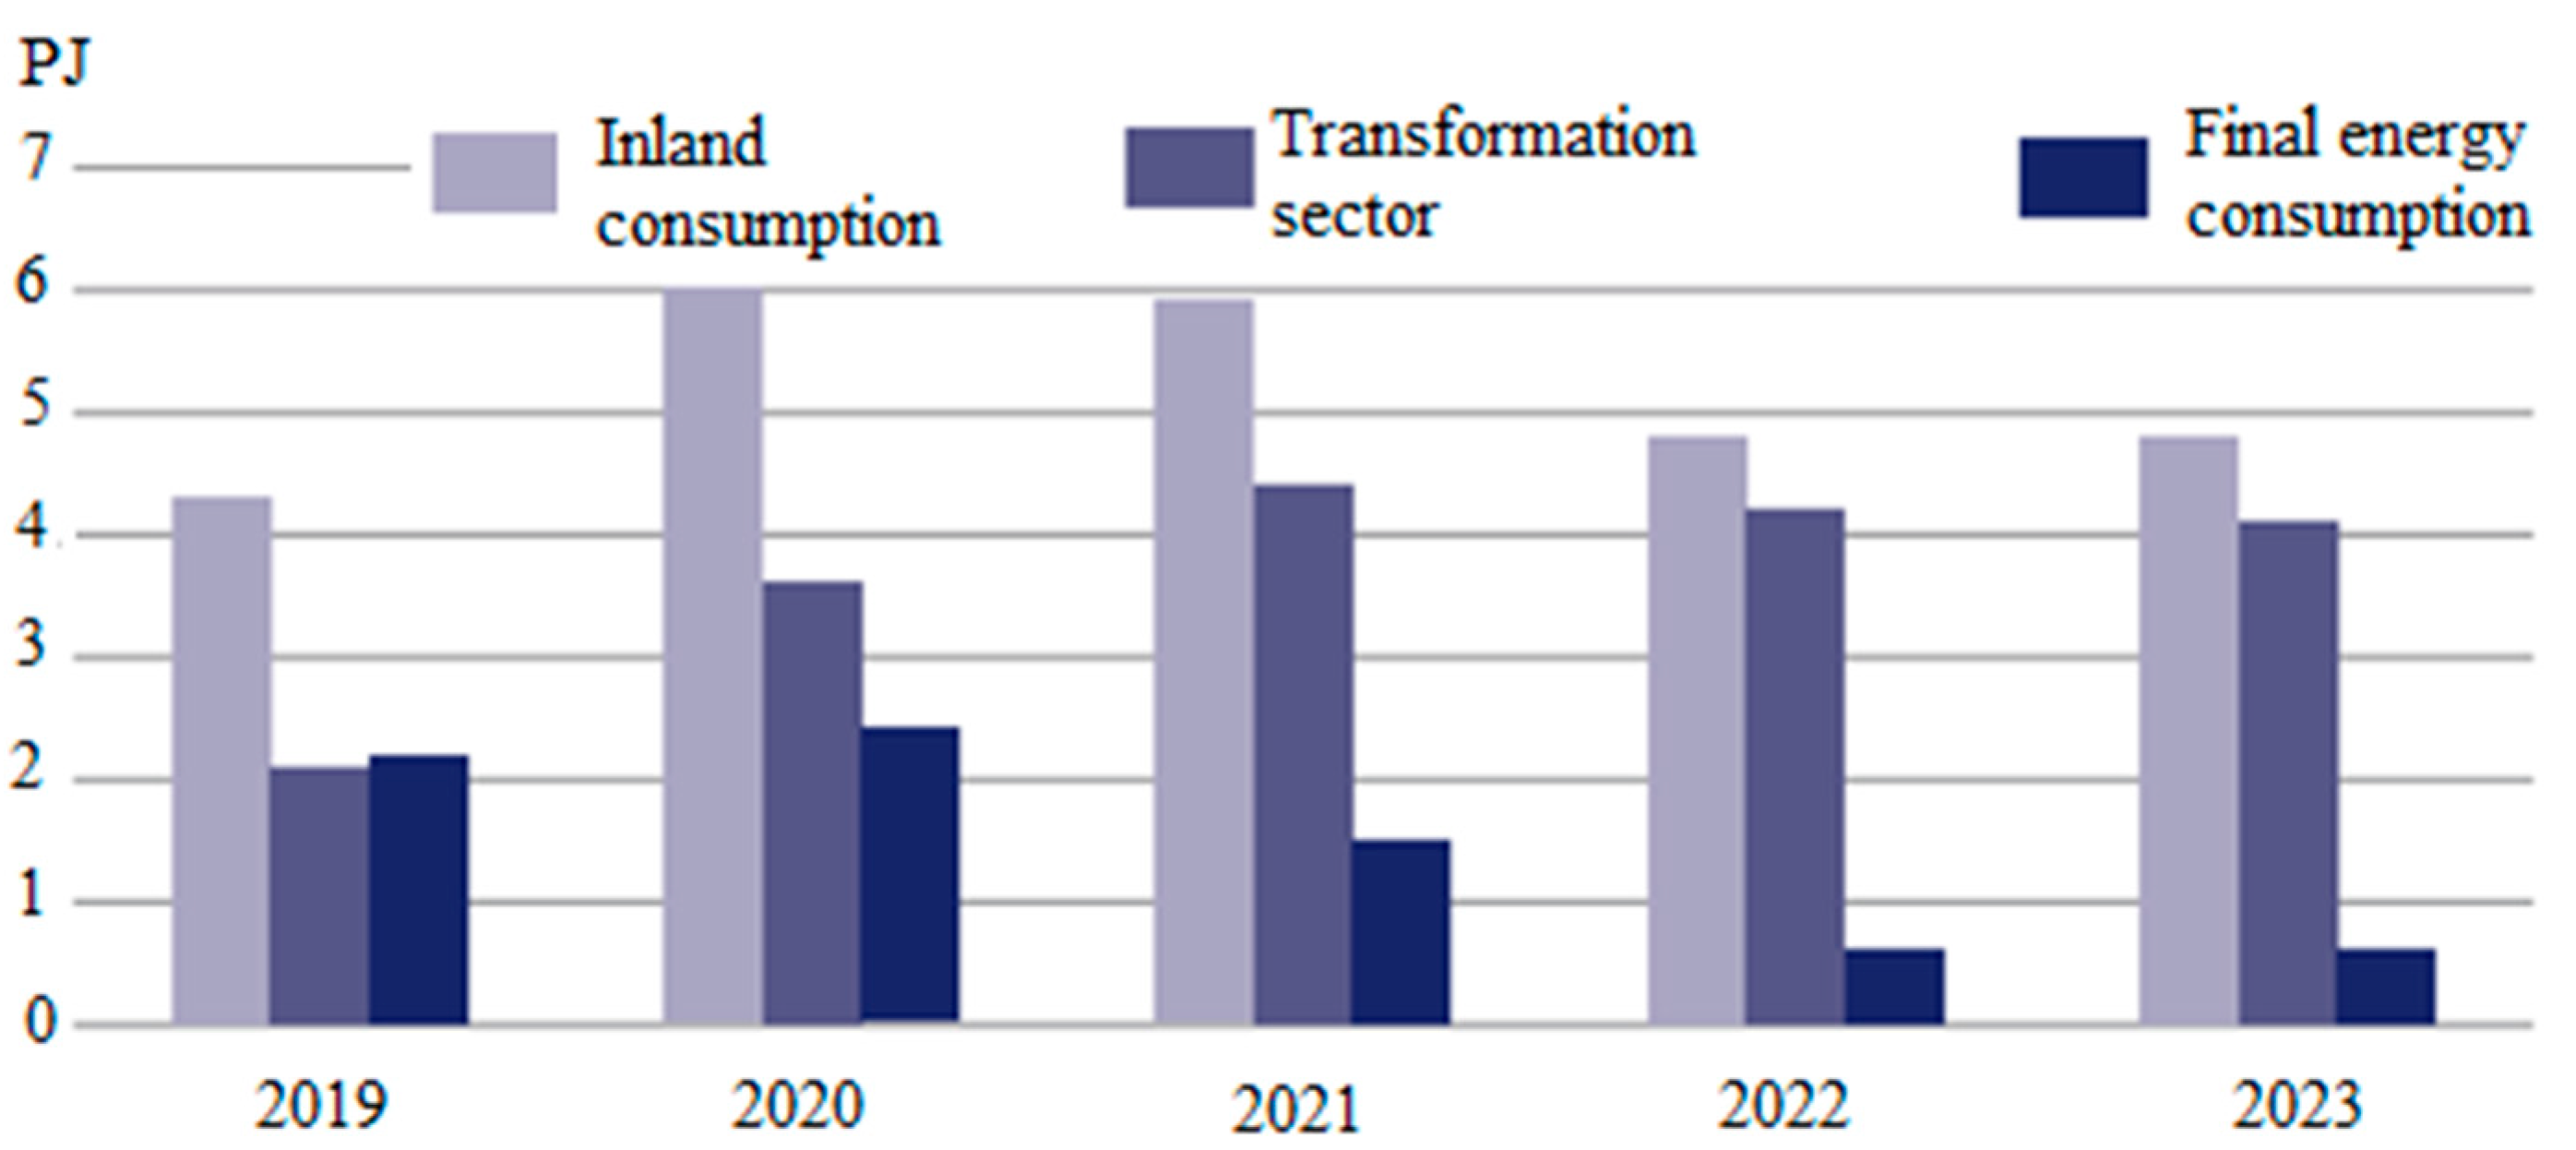
According to the National Statistical Reporting on Fuel and Energy Management, renewable municipal waste energy also includes waste fuels derived from combustible municipal and industrial waste. Waste of biological origin, incinerated in appropriately facilities, falls under the category of renewable fuels. This is waste from the service sector, hospitals, and households (Figure 3).
Between 2019 and 2023, there was a 12% increase in the total domestic consumption of renewable municipal waste (from 4.3 PJ to 4.8 PJ) and a 73% decrease in final consumption (from 2.2 PJ to 0.6 PJ). During these years, there was a 95.2% increase in the consumption per energy conversion input (from 2.1 PJ to 4.1 PJ). In 2023, renewable municipal waste was mainly used in industrial (57%) and utility (29%) power plants and combined heat and power (CHP) plants, as well as in manufacturing activities (9%). The energy balance of municipal waste (biodegradable) is shown in Table 1. In 2017–2023, there was a 24% increase in the domestic consumption of municipal waste (from 3.87 PJ to 4.81 PJ) and a 76% decrease in final consumption (from 2.45 PJ to 0.6 PJ). In the years in question, there was a slight increase in total consumption in services and trade by 25%, while in the mineral industry, there was a decrease of 23%. There was also an almost 3-fold increase in energy consumption per energy conversion input (from 1.42 PJ to 4.11 PJ) in industrial and commercial thermal power plants.
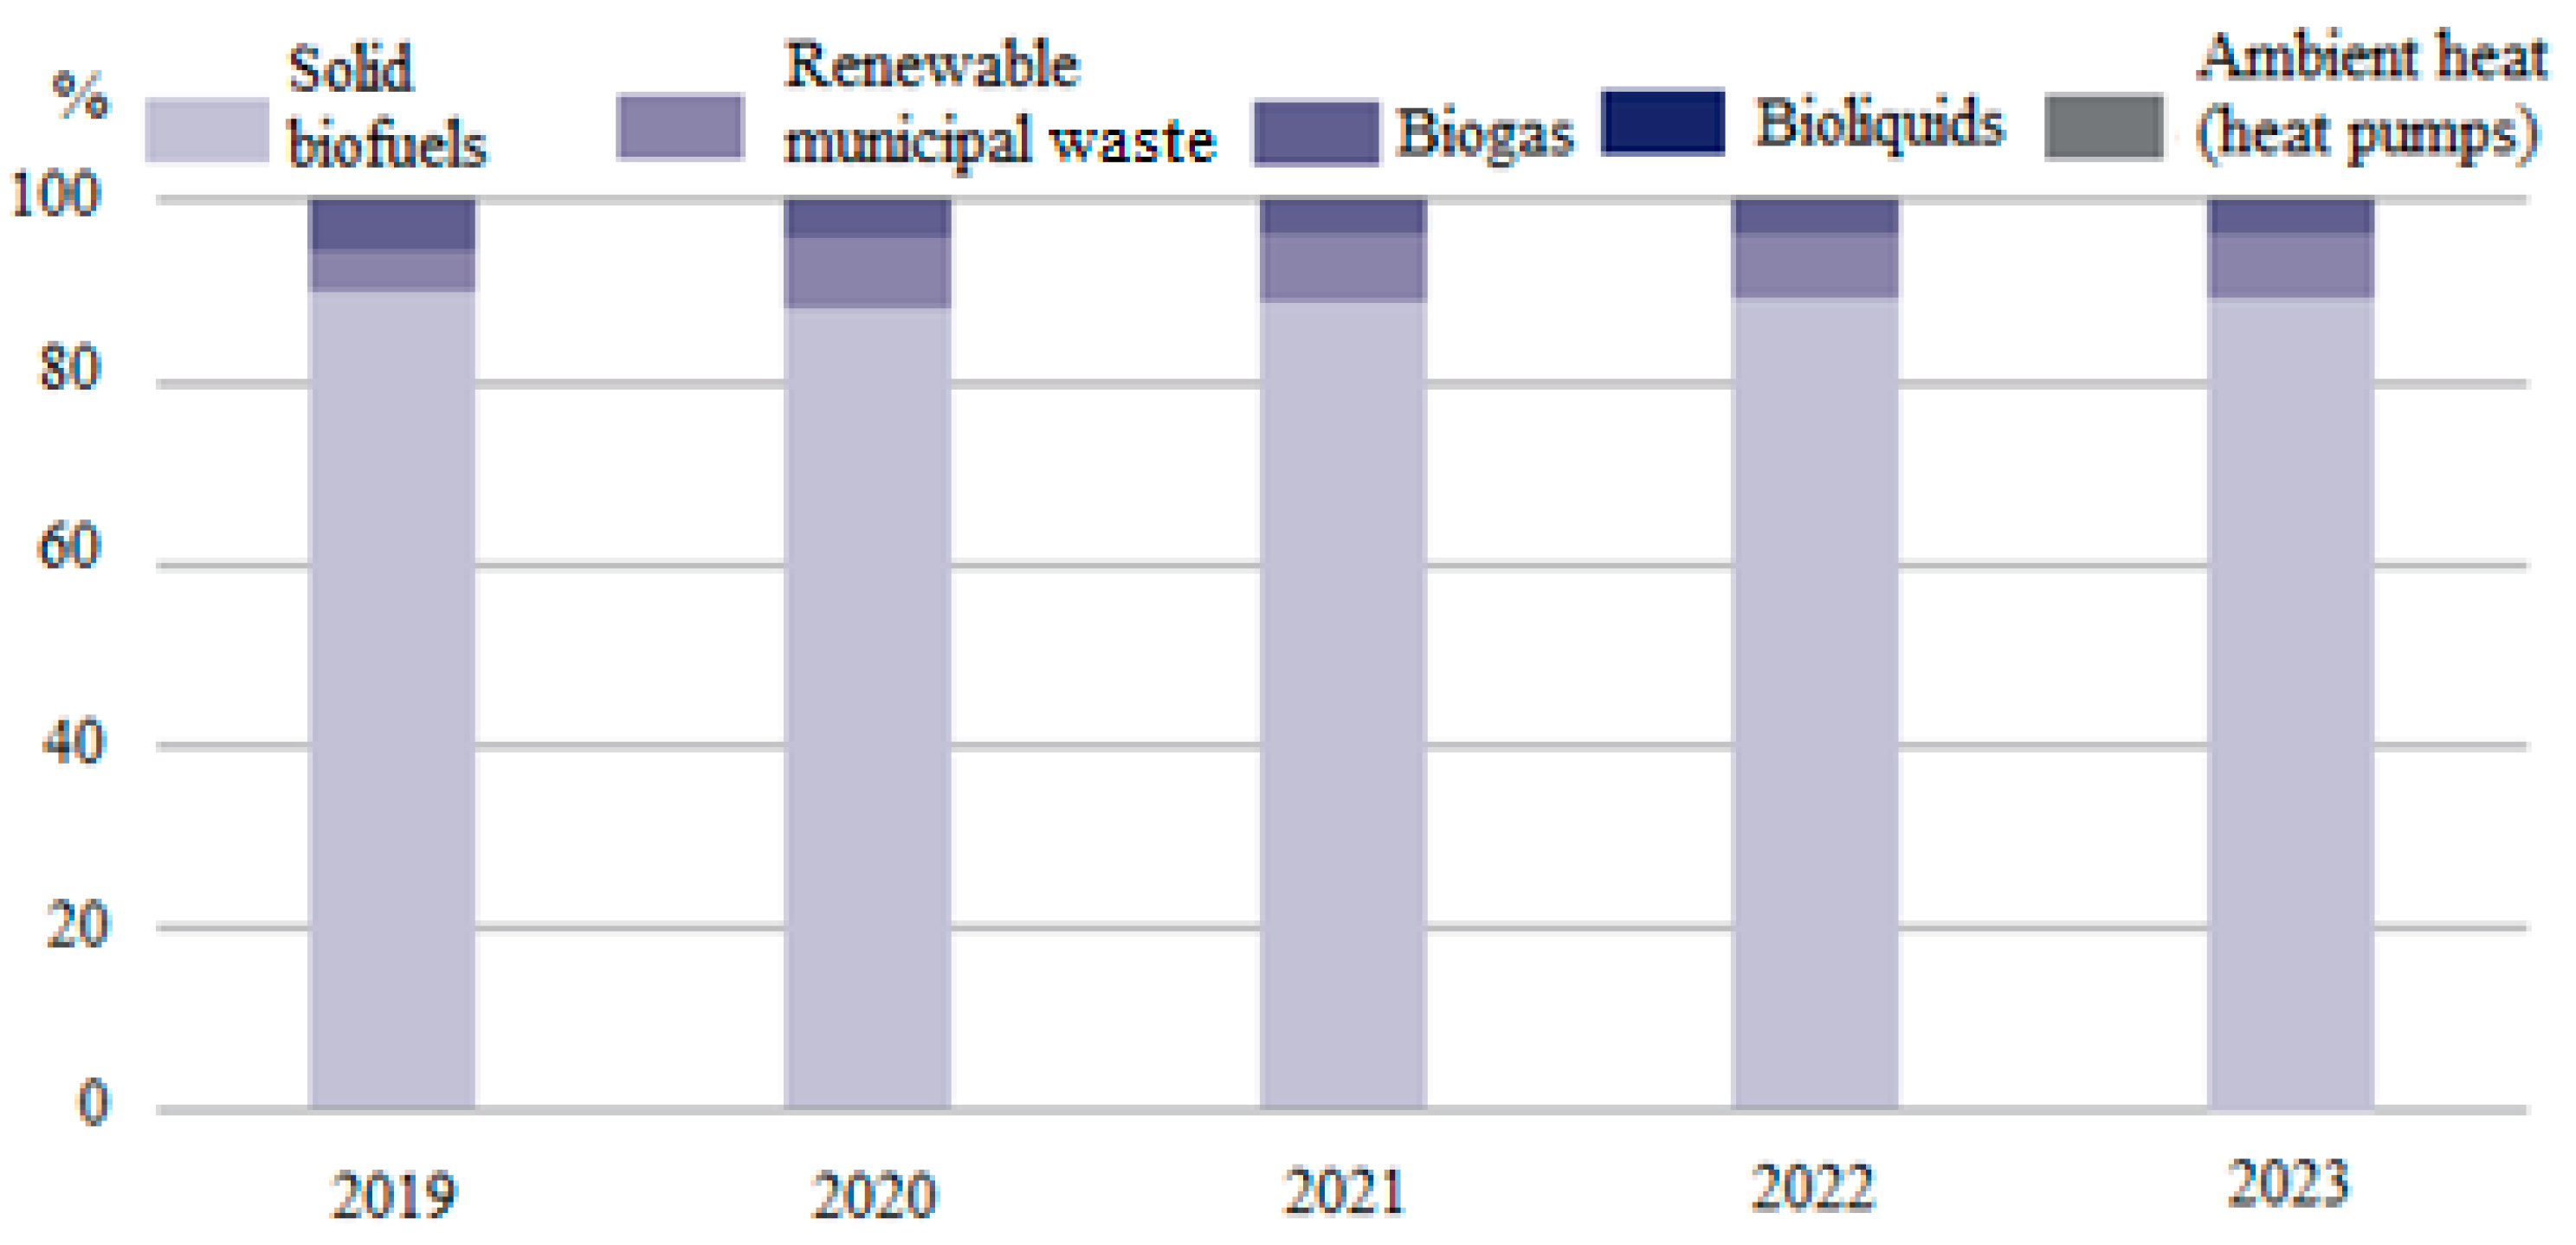
In 2017–2023, an increase in heat production from RES was recorded, reaching 24.75 TJ in 2023. It should be noted that the share of solid biofuels in heat production remained at a similar level during this period (89.6% in 2017 and 89.3% in 2023). At the same time, there was an increase in the production of renewable energy from municipal waste by 3.3 p.p. (from 457 TJ in 2017 to 1680 TJ in 2023).
A different trend was observed in the case of biogas, the share of which in the production of heat decreased from 3.9% in 2019 to 2.7% in 2023. The total share of heat pumps and liquid biofuels in the analysed period did not exceed 0.1% (Figure 4).
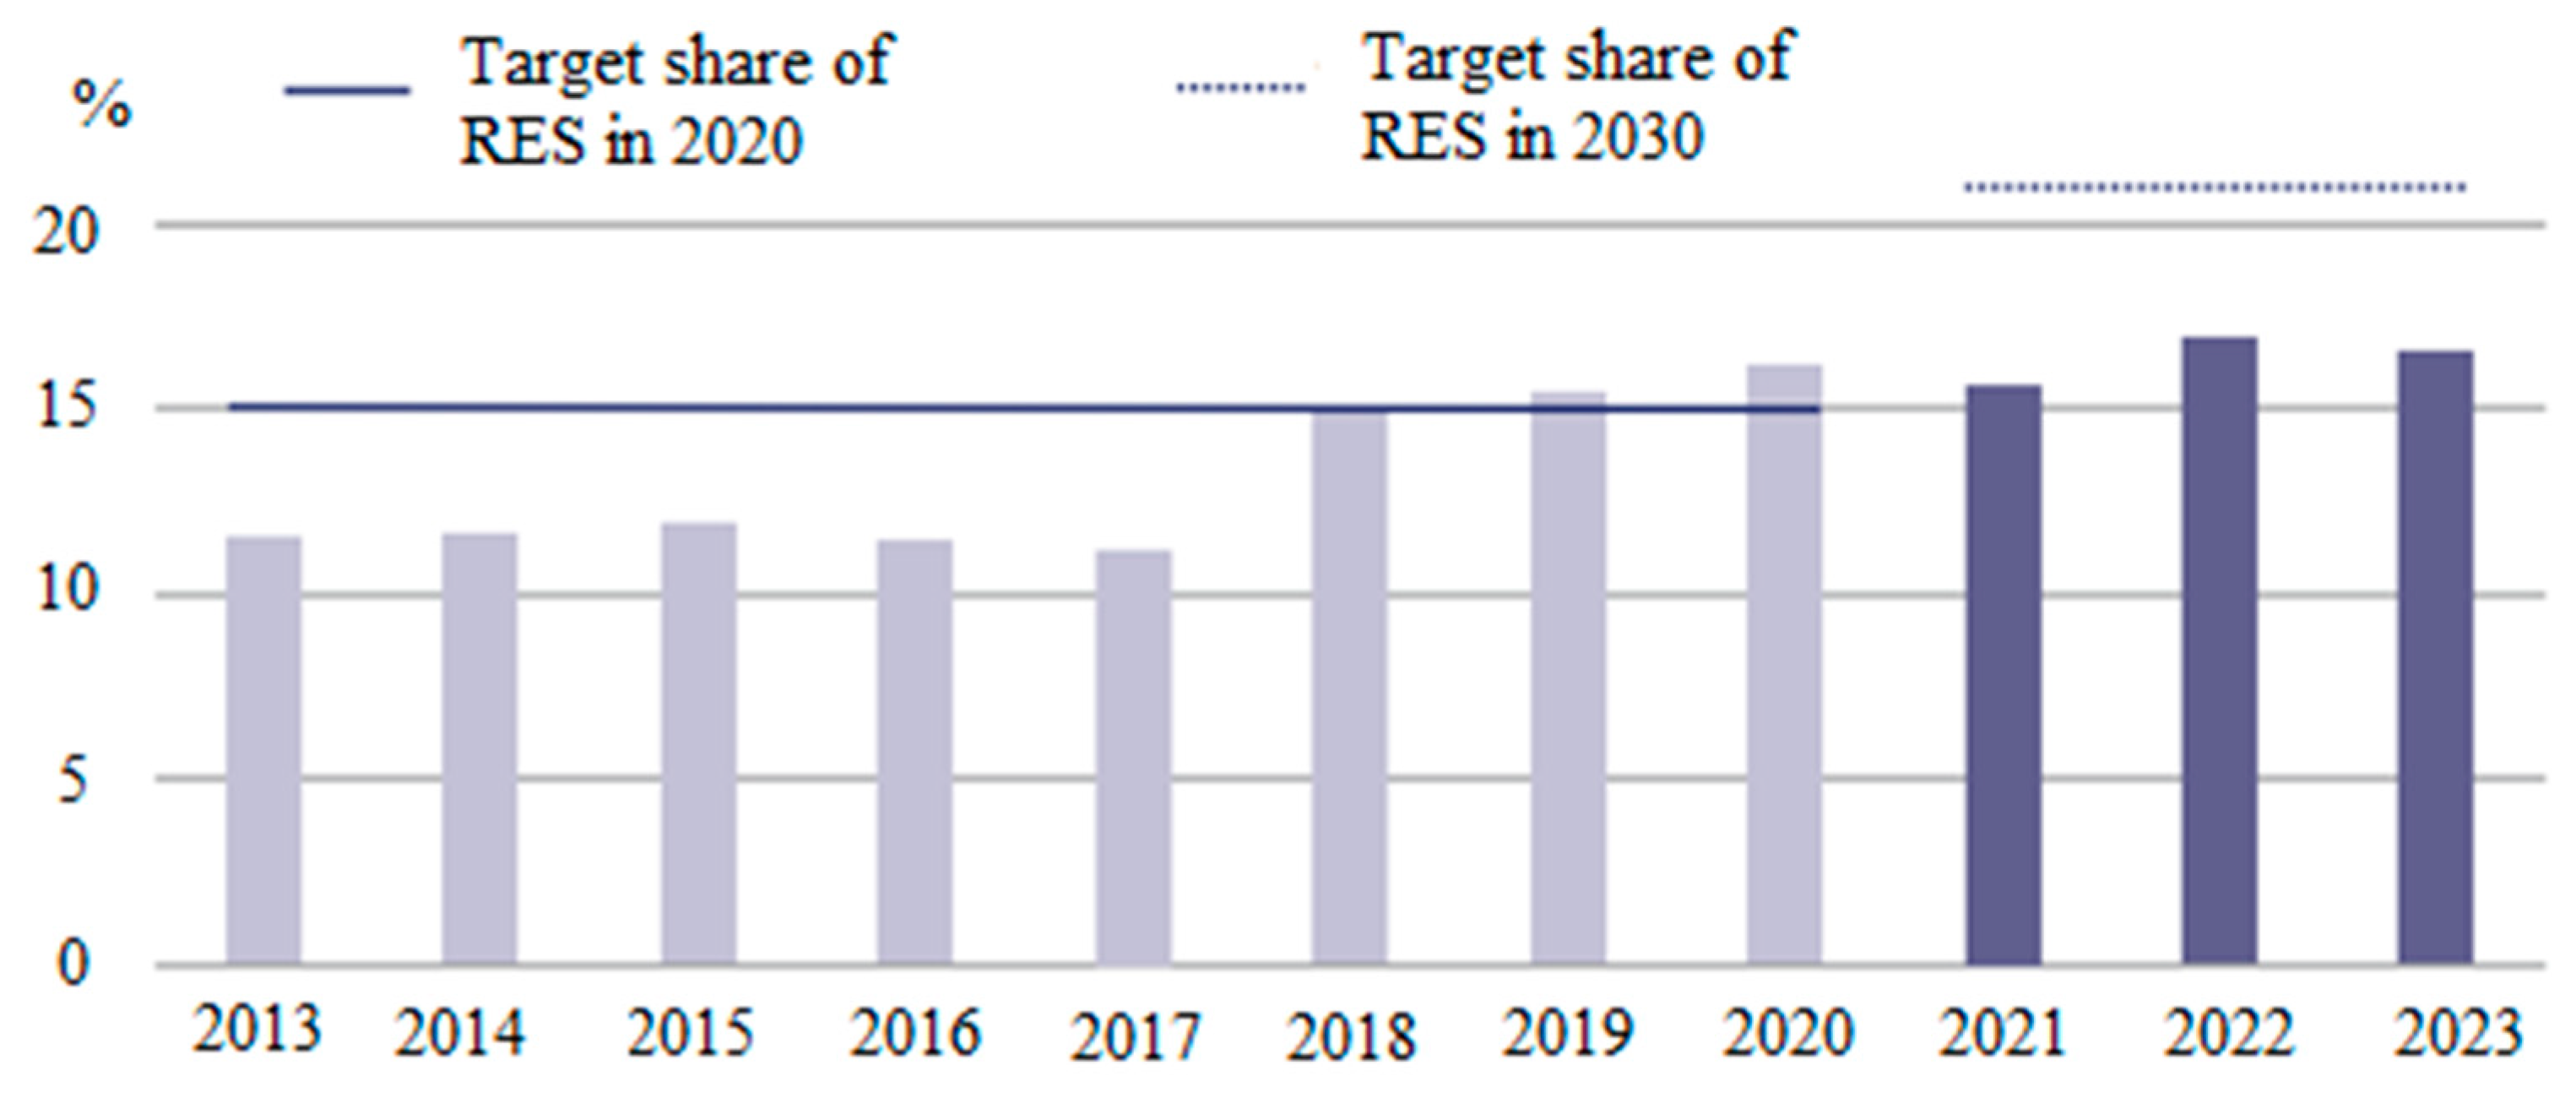
The share of RES in a country’s gross total energy consumption measures the extent to which renewable fuels have replaced nuclear and fossil fuels. This indicator also illustrates the progress of EU-27 countries in terms of the Europe 2030 Strategy’s renewable energy goals. This goal is to increase the share of renewable energy in gross final energy consumption from 21% to 23% in 2030 (Figure 5). In 2023, the share of renewable energy in gross final energy consumption was only 16.5%.
Large-scale waste incineration is one of the most important technologies used for municipal waste management in the most industrialised countries in the world. Waste incineration has become the dominant technology in Japan and Switzerland, with a market share of more than 70%. Developing countries, i.e., Brazil, Argentina, Chile, Egypt, Ethiopia, India, Pakistan, Malaysia, and Vietnam, are also increasingly opting for incineration plants. One of the main reasons for this is the problem of locating landfills and the need to reduce the environmental impact of the municipal waste management system.
The world’s first waste incineration plant was built in Nottingham, England, in 1874, i.e., 151 years ago. There are currently over 2500 waste incineration plants in the world (using various technologies), with about 1200 plants located in Japan and more than 500 plants in Europe. The capacity and thermal and electrical output of the incineration plants located in Poland, both those in operation and those under development, are shown in Figure 6.
Between 2020 and 2022, all incineration plants in Poland showed an increase in achieved capacity, energy recovery, and energy efficiency (Table 2). Two incineration plants reached the maximum processing capacity of 100%, while the capacity of the remaining plants ranged from 58% to 94%.
Most municipal waste is sent to landfills, but this is neither an economical nor an environmentally friendly form of waste management. The landfilling of the calorific fraction is illegal and subject to high financial penalties. A significant portion of non-renewable waste with a high calorific value can be processed into Refuse-Derived Fuel (RDF), also known as alternative fuel. In Poland, the annual production of Pre-RDF and RDF amounts to approx. 4.5 million tonnes. Municipal waste should be utilised locally for heating. Fully utilising the potential of the energy fraction would allow for the production of about 10% of the heat currently generated in Poland, most of which is produced by coal combustion.
In 2021, in Poland, there was a clear difference between the western provinces and eastern provinces. Significantly more municipal waste was generated per capita in western Poland than in the eastern part of the country. With an average of 360 kg per capita in Poland in 2021, 24% of municipalities collected less than 200 kg of municipal waste per capita in rural areas, while in 58% of municipalities, the amount of waste generated was at most 400 kg per capita. On the other hand, 16% of municipalities collected up to 600 kg of waste per capita. The largest amounts of municipal waste were generated in tourist municipalities (as many as nine of them collected more than 1000 kg of municipal waste per capita).
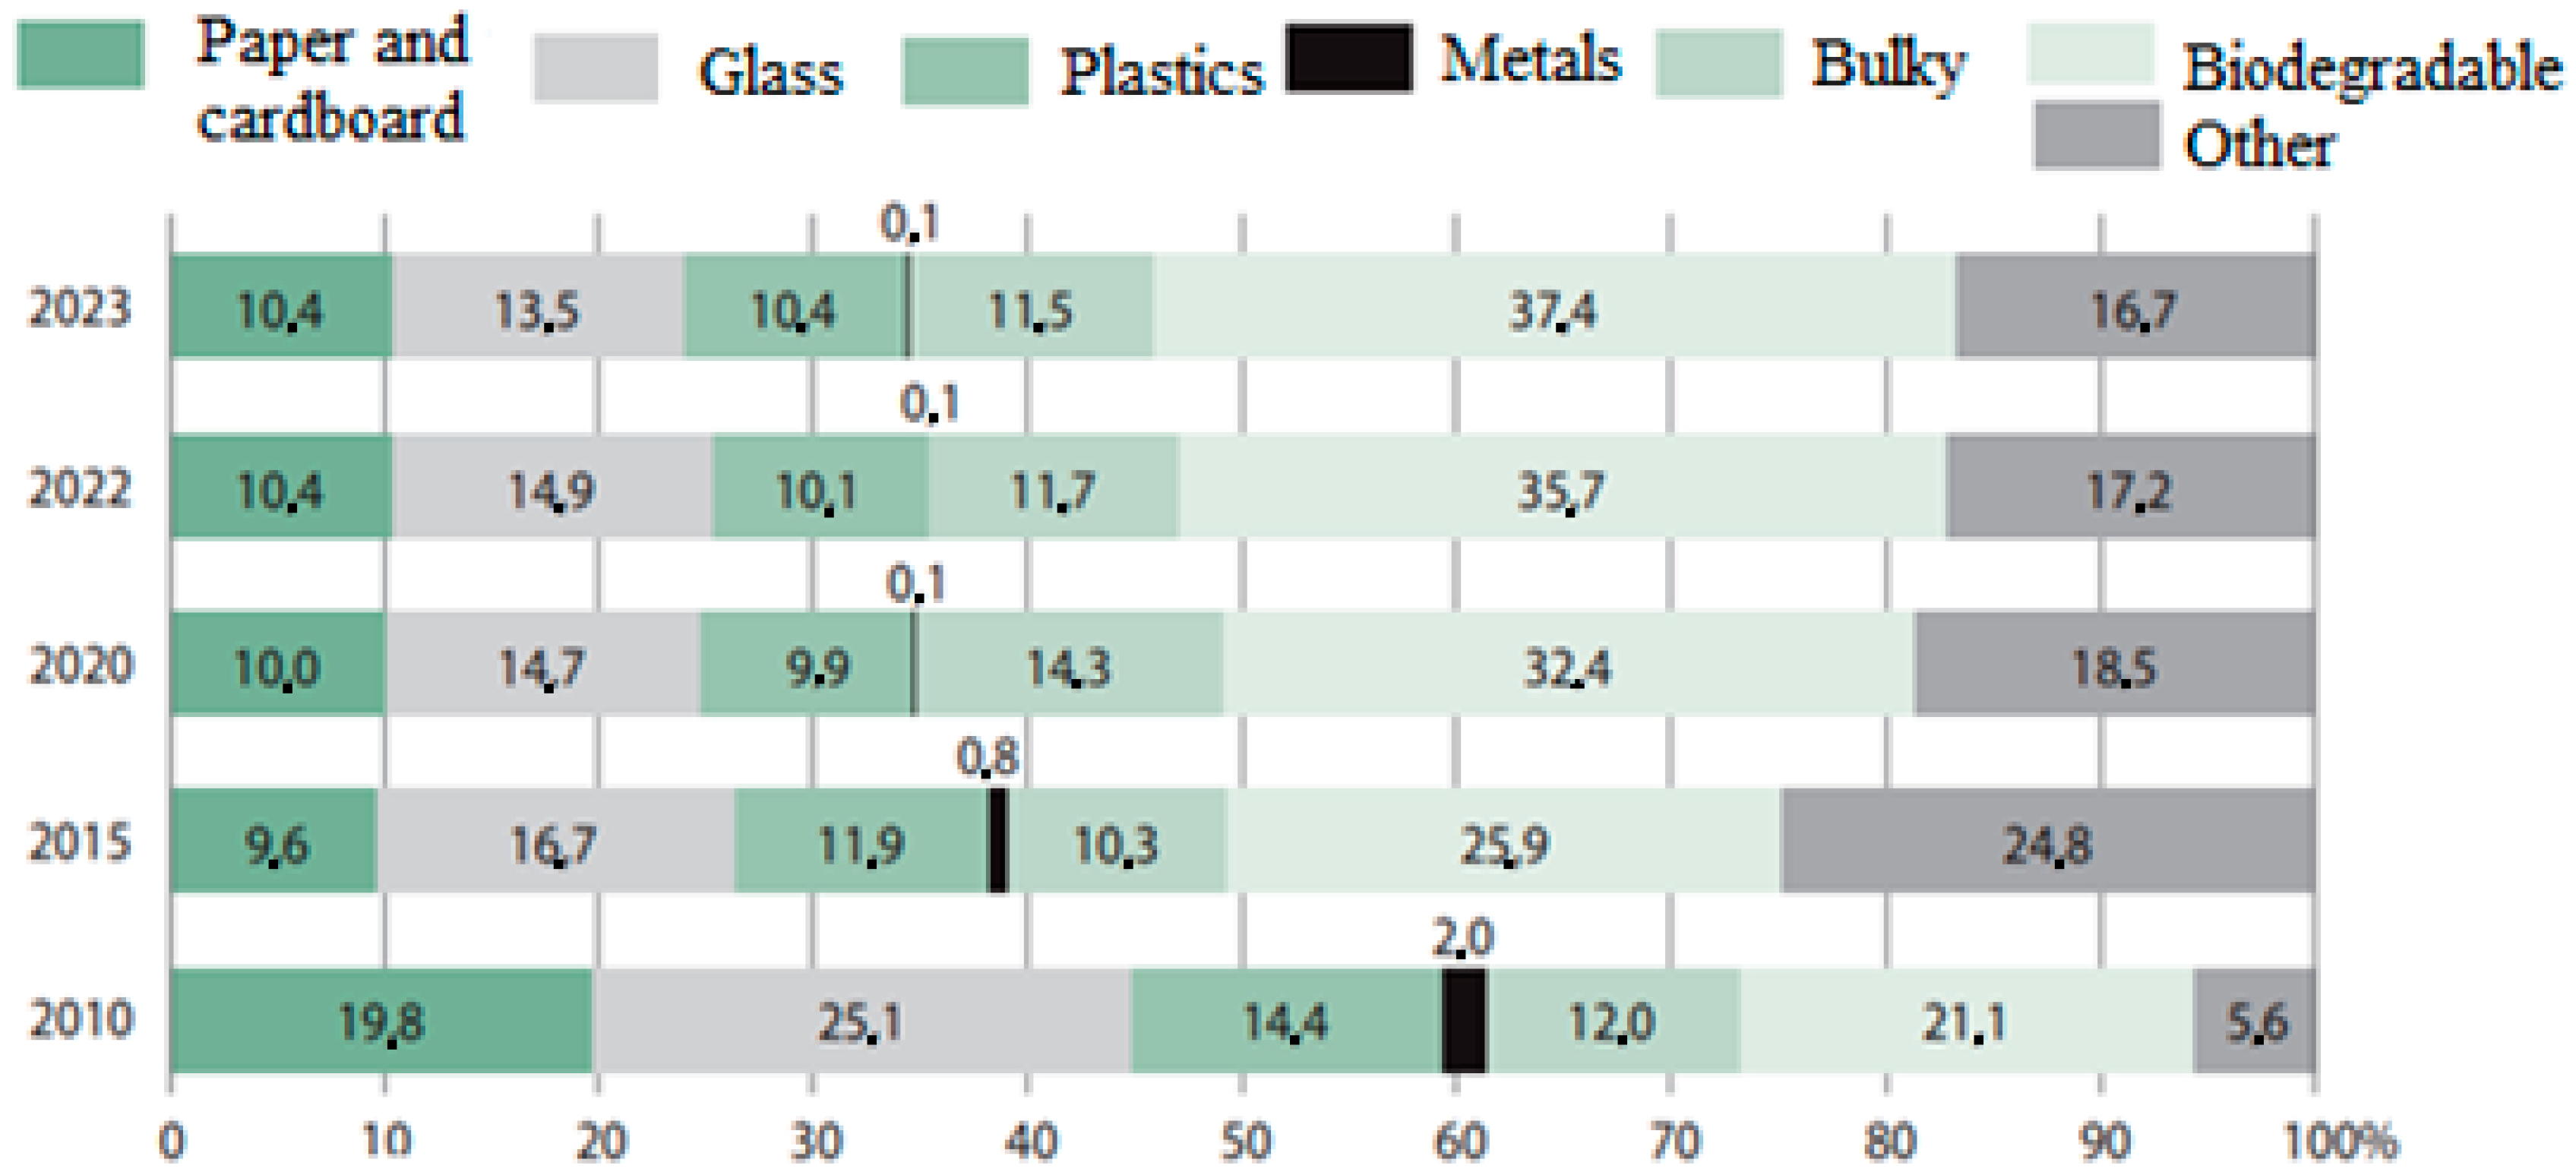
In Poland, in 2023, only 61% of the 13.4 million tonnes of municipal waste generated was allocated for recovery, and of that only 2.1 million tonnes (15.8%) was allocated for material recycling. Recyclable materials were obtained from selectively collected municipal waste, as well as from mixed municipal waste. A total of 2.7 million tonnes (20%) were diverted to thermal conversion with energy recovery, while 4.1 million tonnes (30.2%) were diverted to landfilling. As a result of the disposal (through incineration) of landfill gas, 137.7 million MJ of thermal energy and 115.4 million KWh of electric energy were recovered. The amount of municipal waste collected selectively is increasing every year (Figure 7). It is worth mentioning that in 2005, selective collection in Poland accounted for only 3% of collected municipal waste (295,000 tonnes).
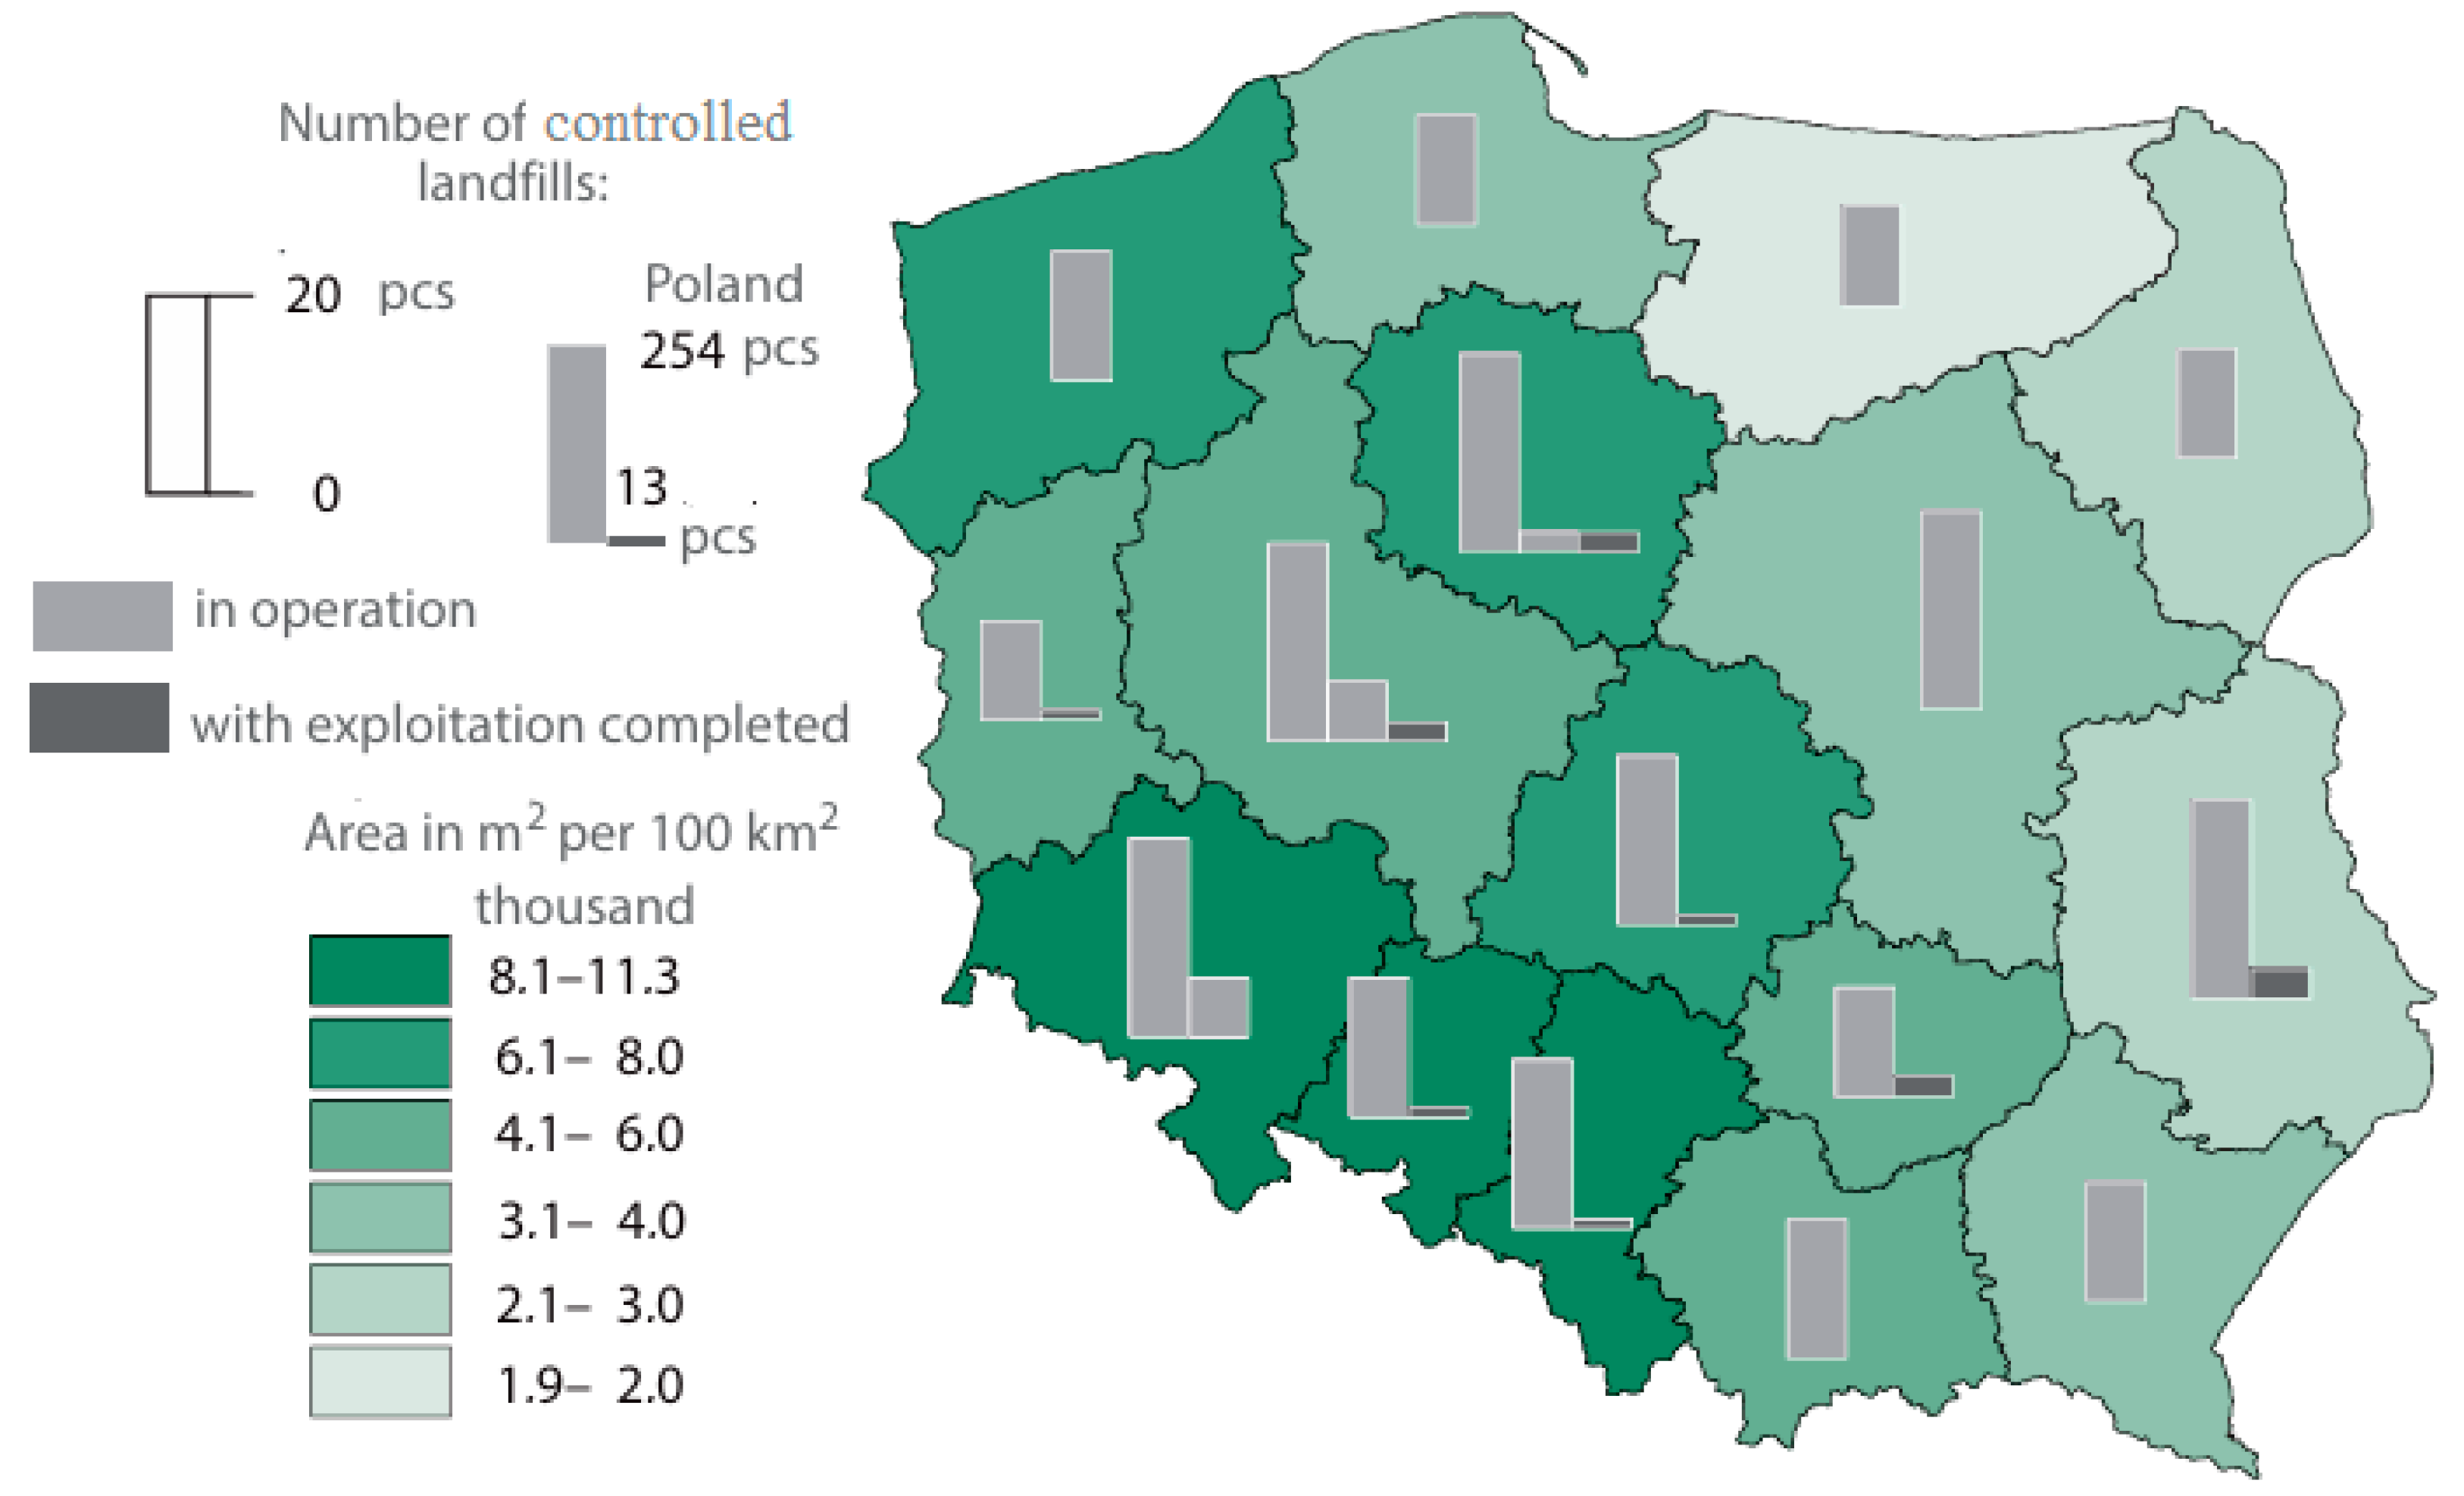
The amount of selectively collected waste varies greatly and largely depends on how local authorities organise their waste collection system. In 2023, mixed waste was the main waste stream requiring disposal by landfilling. Despite the downward trend, the share of this waste handling process is still high, reaching 30.1% in 2023. The number of active landfills and their surface area are steadily decreasing. In 2023, there were 254 operating landfills accepting municipal waste (a decrease of 5 compared to the previous year). At the same time, another 13 landfills were closed in 2023 (Figure 8).
In 2023, 93% of municipal landfills were equipped with degassing facilities, 34% of which were facilities with gas directly released into the atmosphere, 40% were facilities for gas neutralisation through incineration without energy recovery, and 26% were facilities with energy recovery. About 115 million kWh of electricity and 138 million MJ of thermal energy were recovered through the combustion of captured gas.
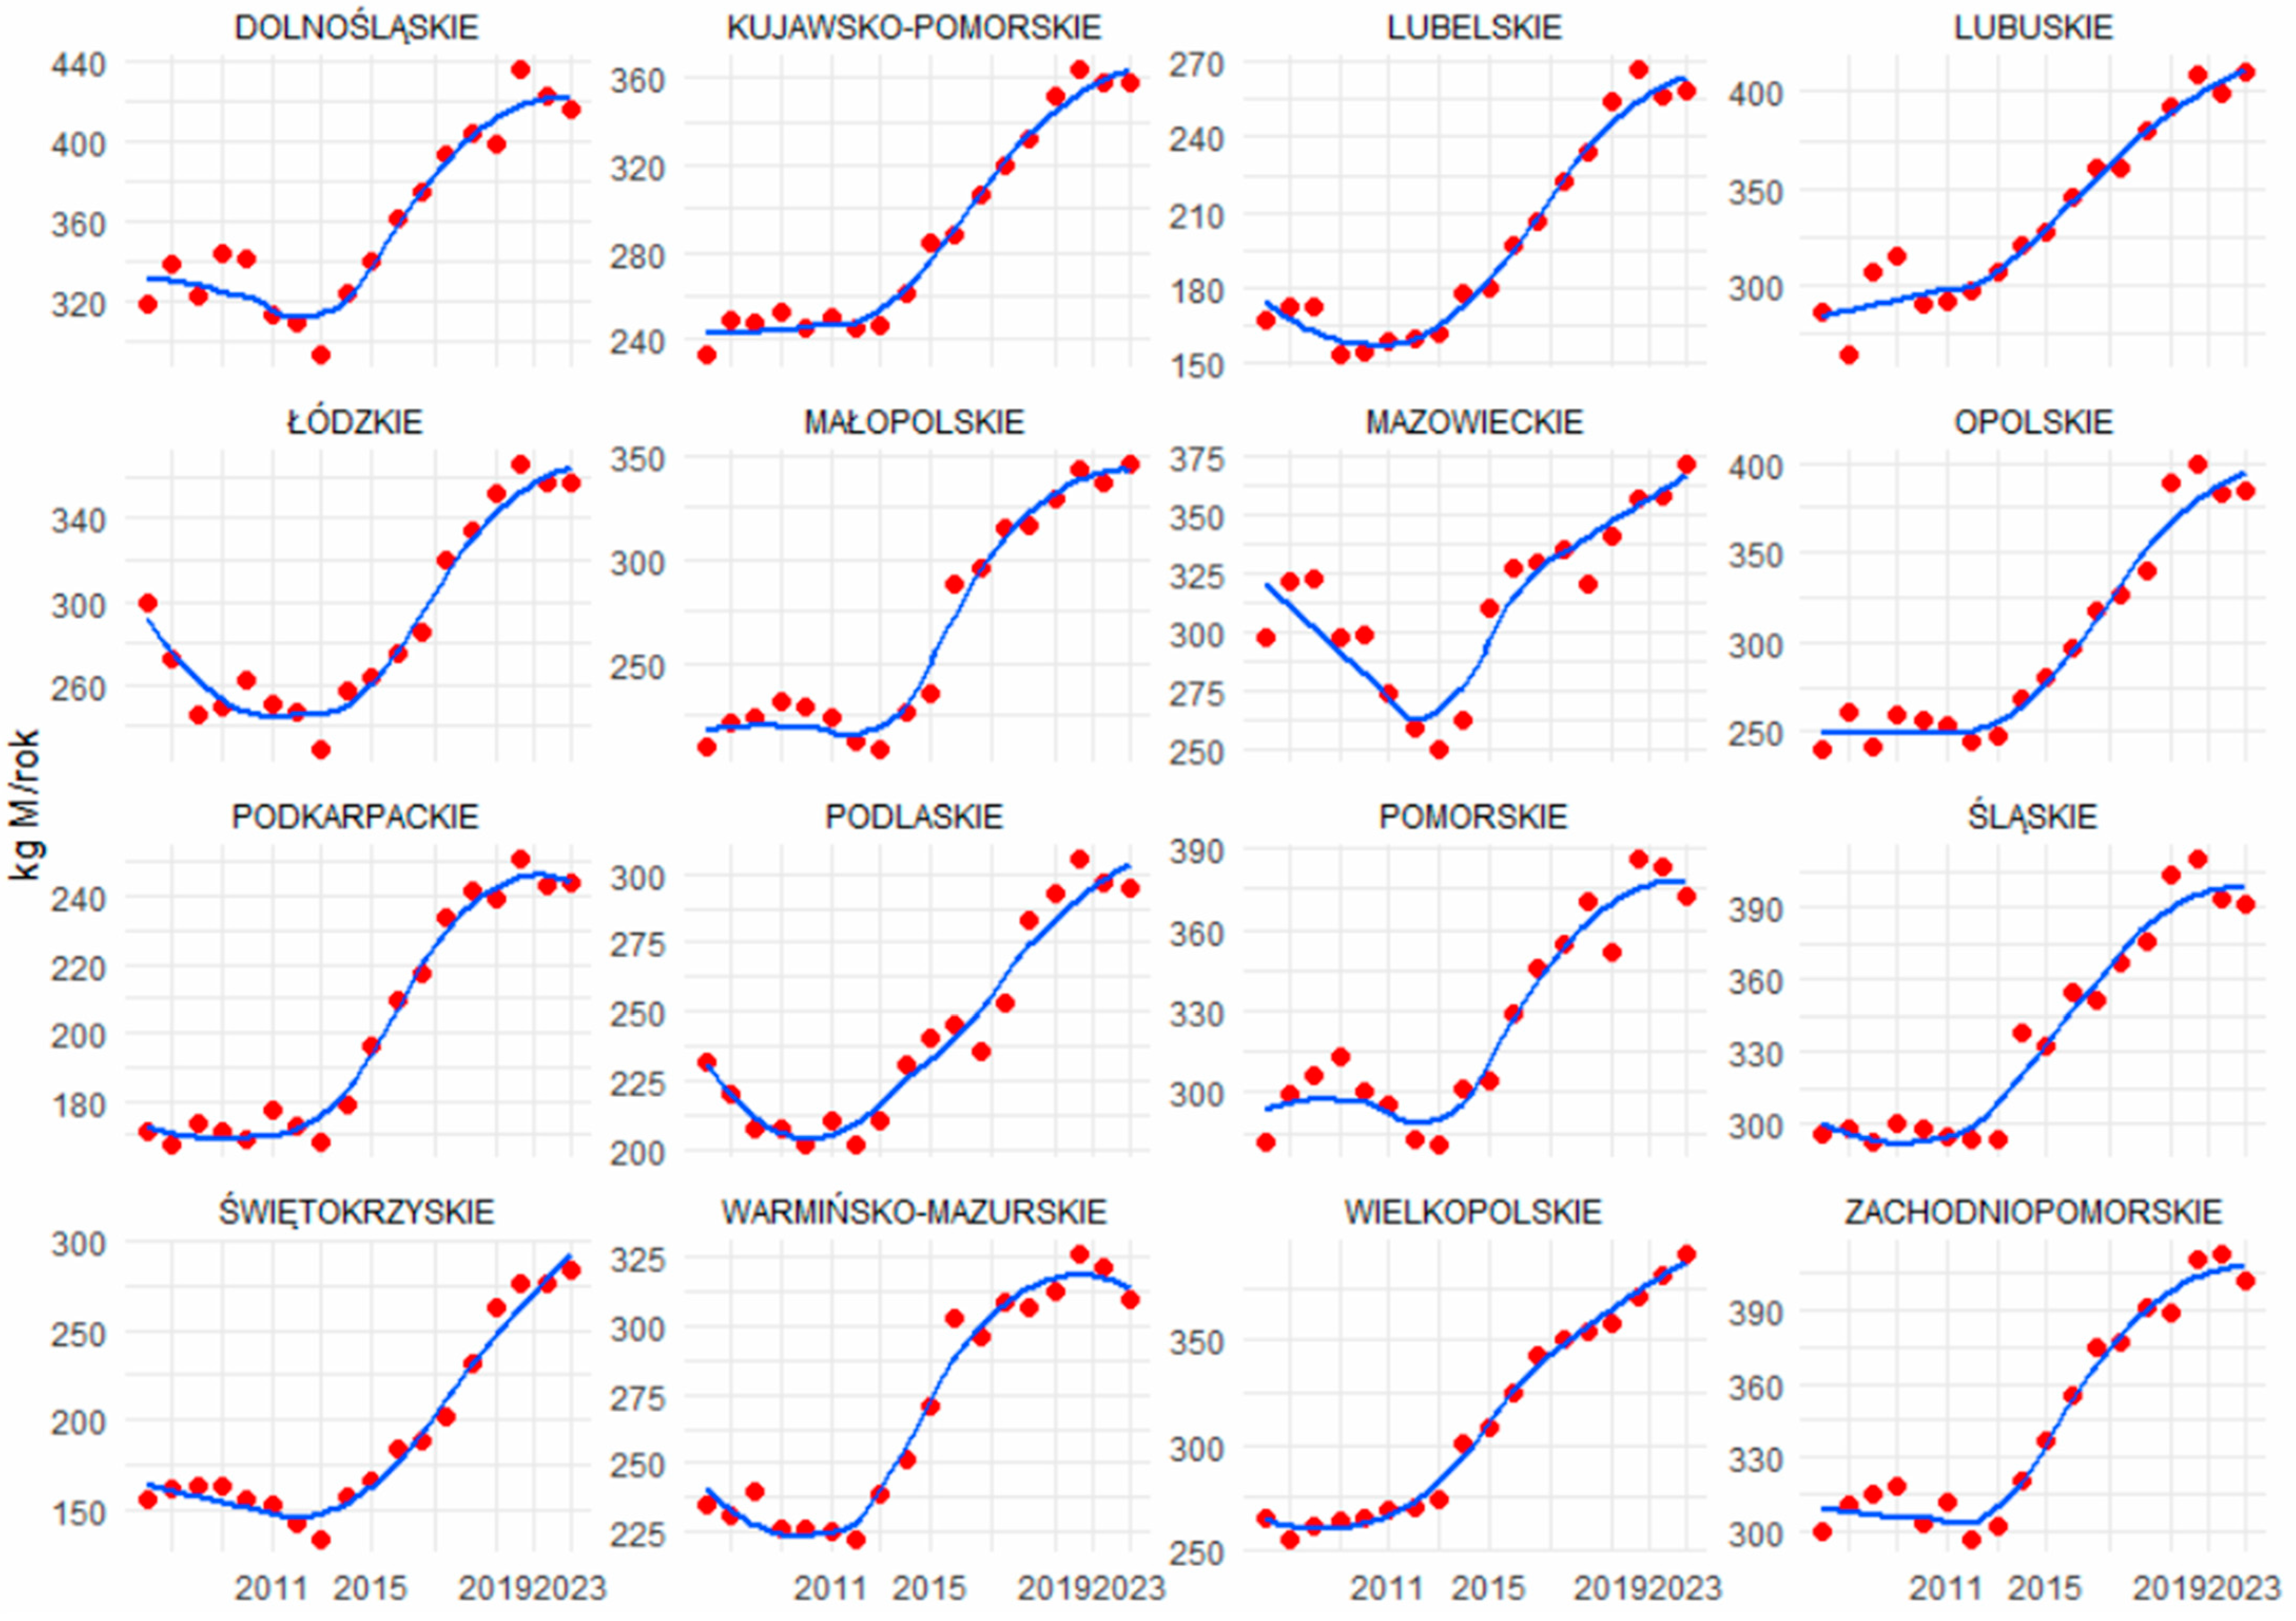
The situation in terms of the amount of waste collected in different provinces in Poland varies (Figure 9). The provinces where the amount of waste is increasing include Małopolskie, Mazowieckie, Wielkopolskie, and Świętokrzyskie. On the other hand, the provinces where the amount of waste has noticeably decreased include the Śląskie Province, where the population decreased by more than 26,000 in a year.

4. Research Methodology

In order to build forecasts for biodegradable municipal waste in Poland for 2024–2030, data from 2007 to 2023 were used, employing the exponential smoothing method (ESM).
This model can be applied when there is a trend and large random fluctuations that synthesise the impact of certain factors (including inflation, fires, armed conflicts, floods, and COVID-19). Exponential smoothing involves smoothing the series using a weighted moving average, with weights calculated according to the exponential law. The parameter α (smoothing constant) is a number belonging to the interval (0–1); with α ≠ 1, the weights decrease exponentially. In the ESM, we assume that the first word of the expired forecast is equal to the first value of the time series or the average of several (3–5) initial real values of the time series. When constructing a forecast for the next period (n + 1), it is assumed that it will be equal to the forecast determined for the previous period n, after correcting it by a certain fraction α of its absolute ex post error. In order to optimise the smoothing constant α, Solver—one of the advanced analytical tools—was used, which enables finding optimal solutions to decision-making problems by modifying variables so that they meet certain constraints, i.e., minimising the mean square error of the ex post forecast.
The forecast for period (n + 1) in this model was calculated using the formula:
y n + 1 P = α y n + 1 α y n 1 P
Projections for more distant periods, were calculated using the formula:
y T P = y n P + T n Δ ¯
where
Δ ¯ —average increment of expired forecasts, which we calculate from the formula:
α—smoothing constant.
Δ ¯ = ( y t P y t 1 P ) n 1
Expired forecasts were constructed using the relationship:
y t P * = α y t 1 + 1 α y t 1 P   for   t =   2 , 3 , 4 , , n
When forecasting the amount of electricity generated from bio-waste, the simulation of the optimal size of the smoothing constant in the adaptive model consisted in inserting parameters (smoothing constants) in the fragments of the adaptive model (which are a source of uncertainty) and then solving the model [73]. The choice of parameter should minimise the mean square error of the ex post forecast or the mean relative error of the ex post expired forecasts [74].
However, exponential smoothing has some disadvantages that limit its applicability and accuracy. One of the main disadvantages is the limitation by its simple structure and assumptions. It assumes that the data are stationary, meaning that they have a constant mean and variance over time. It also assumes that the future is a linear function of the past, meaning that it does not include non-linear relationships or complex dynamics. Therefore, it may not work well with data that have structural breaks, cycles, or non-linear trends. Another disadvantage of exponential smoothing is that it is biased towards past data, especially when the smoothing factor is low. This means that it may not react quickly enough to new information or changes in the data. It may also underestimate or overestimate the forecast, depending on whether the data are trending up or down. For example, if the data are increasing over time, exponential smoothing may lag and underestimate the forecast.

5. Results and Discussion

Using the above relationships and CSO data, forecasts for biodegradable municipal waste were calculated for 2007–2023. The exact calculations are shown in Table 3.
A forecast for which the calculated ex ante or ex post forecast errors were determined for periods prior to the period of the forecast being evaluated is considered sufficient, is an acceptable forecast, and can be used in practice.
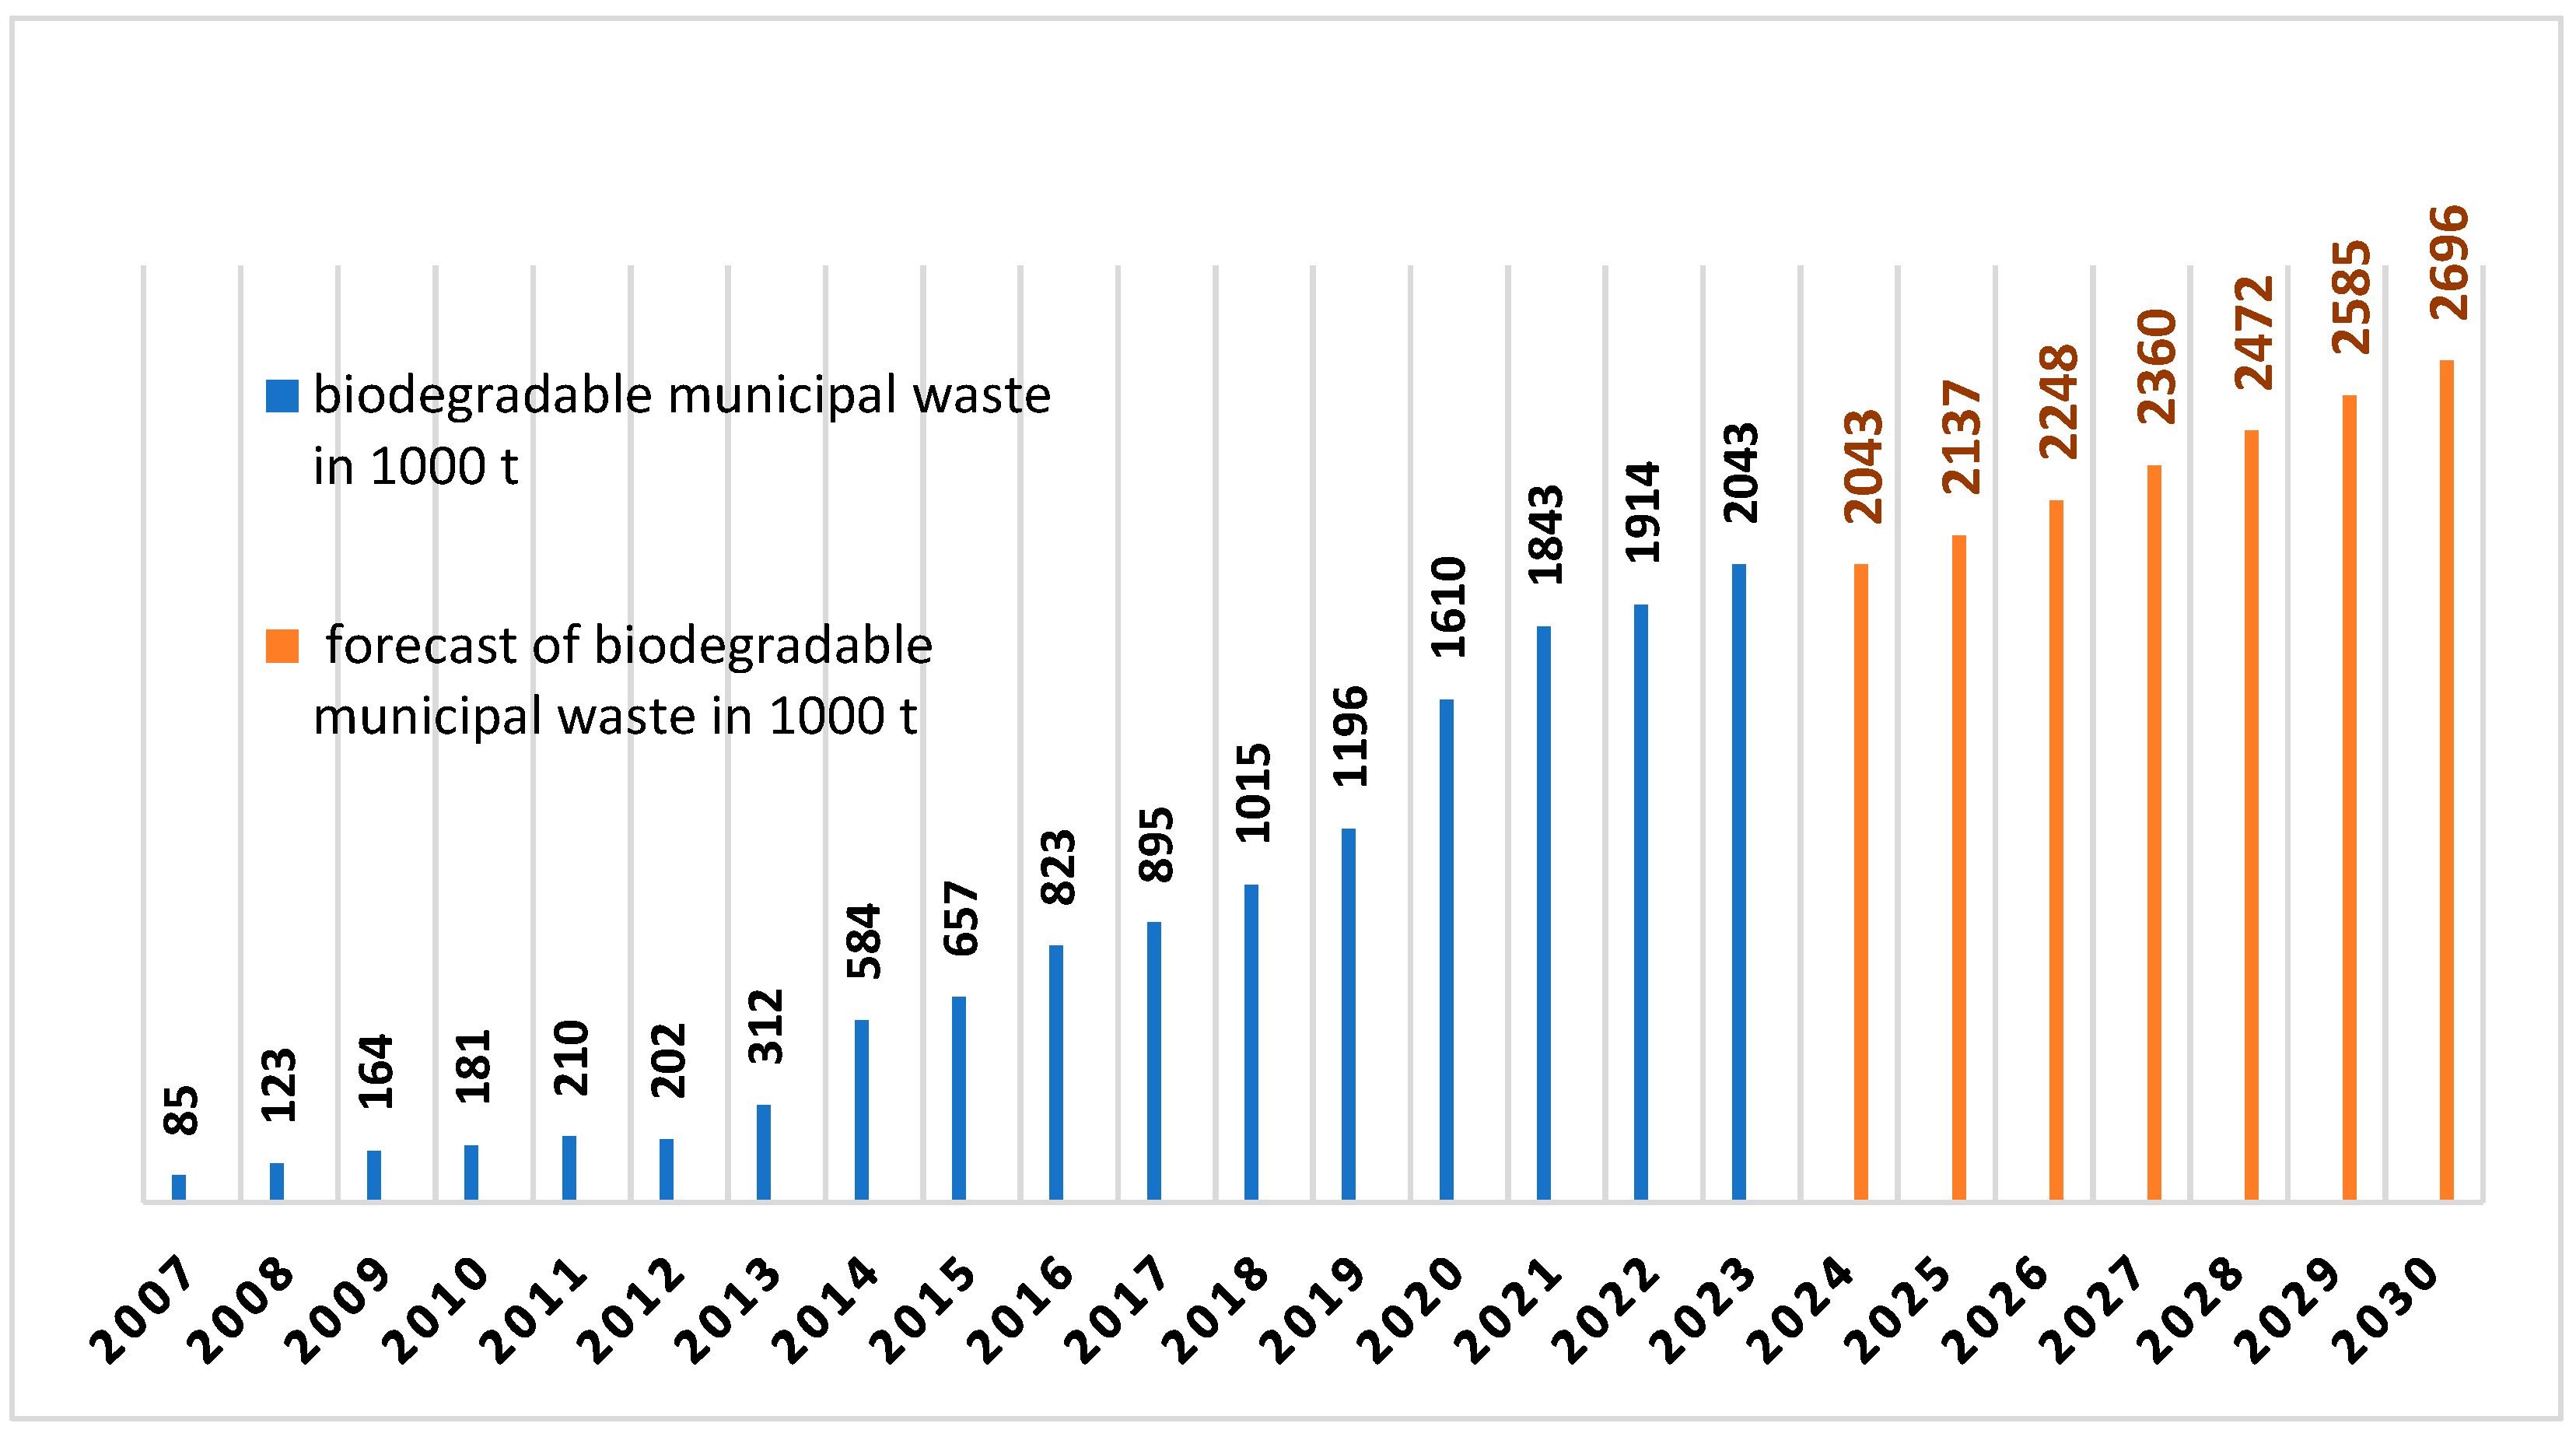
In order to estimate the necessary capacity of facilities for the thermal processing of biodegradable waste in Poland, forecasts of the consumption of this waste until 2030 were built based on the exponential smoothing method (Table 4 and Figure 10).
The forecasts of the amount of biodegradable waste are steadily increasing in the following years, and in 2030, they will reach 2,696,500 tonnes. The calculated errors, including the relative error of the forecast (between 5.86% and 7.74%), decrease in subsequent years, indicating that the forecasts are acceptable and sufficiently precise.
Only the waste that has been pre-treated is sent for thermal conversion, which is about 50% of the residual waste and sorting residues of the collected waste. The minimum necessary capacity for a thermal conversion facility is assumed to be the residue from the processing of municipal waste (25% by weight), which does not interfere with the possibility of achieving the required recycling rates. Considering the current combined capacities of eight installations for the thermal conversion of municipal waste and processing residues, the co-incineration plants, and the cement plants, thermal treatment plants are lacking capacity. The processing capacity of cement plants only provides a reserve of 600,000 to 800,000 tonnes per year. Due to increasing recycling requirements, the calorific value of fuels produced from municipal waste may steadily decrease, which would limit their suitability for energy recovery in cement plants. The addition of high-calorific waste will therefore be necessary to meet the requirements of the cement plants.
Increasing demand for electricity poses a challenge for the energy economy, which necessitates taking measures to ensure the amount of energy required in the future. According to the forecast of demand for fuels and energy until 2040, in appendix no. 1 to the Energy Policy of Poland until 2040, the projected increase in demand for electricity in the next 20 years will increase by about 29% (from about 165 TWh in 2020 to about 230 TWh in 2040) [75]. In the municipal waste management system, there will always be a stream of so-called residual waste after separate collection, the fuel properties of which need to be exploited to keep the amount of landfilled waste below 10%. This implies the need to build a dozen or so new thermal waste conversion facilities to complete the municipal waste management system. At present, Poland lacks 2–2.5 million Mg of capacity in thermal waste processing facilities. This is the estimated investment gap in the sector. According to a report published last year by the Institute of Environmental Protection, in 2034, the estimated gap may be as high as 3.5 million Mg [76].
The technology, location, and size of a given thermal waste treatment facility, in addition to environmental requirements and public acceptance, should take into account the size of the municipal waste stream that is generated in a given area. This will allow the estimation of the energy potential of the waste [77].
The developed forecasts for biodegradable municipal waste for the coming years show a clear upward trend. This means that energy recovery from biodegradable municipal waste will increase significantly in the coming years. Similar trends of increased energy recovery were obtained by other authors [1,2,8,9]. The development trends in the market for energy recovery from waste are linked to the trend of the global energy transition, i.e., the gradual replacement of conventional, non-renewable energy sources by their renewable alternatives. RES technologies are becoming an increasingly important part of the national energy mix with each passing year, and in some countries, they already dominate over conventional sources (coal and oil).
The use of alternative fuels brings tangible benefits to the environment. This means that industrial production is in line with the idea of sustainable development. This idea is also supported by the European Commission, which has announced a package on the circular economy. One of the goals of this package is to strive for synergy between waste management, climate and energy policy, and innovative solutions based on industrial symbiosis. Poland is also undertaking measures in this regard, including the development of the “National Waste Management Plan 2030”. Recovering energy from municipal waste is a key element of the circular economy strategy. Poland has great potential in this area, but harnessing it requires investment, regulatory changes, and greater public awareness. The implementation of modern technologies and the development of the biogas market may significantly affect Poland’s energy security in the future.
Decarbonisation, in the light of European Union policy, refers to the process of reducing carbon dioxide (and other greenhouse gas) emissions into the atmosphere in all sectors of the economies of the member states. Decarbonisation has significant economic costs, especially for industries dependent on fossil fuels. Decarbonisation solutions are lacking, or the available technologies only work on a small scale. Additionally, the implementation of new technologies is slow, and existing infrastructure requires significant adaptation. One existing global initiative is the Paris Agreement to foster global cooperation in the area of decarbonising economies. However, existing differences in national interests and capabilities hinder international progress and cooperation.
The decarbonisation process has a number of positive effects that affect various aspects of social, economic, and environmental life. A positive effect is the reduction in climate change and air pollution levels. A less obvious effect may be increased energy security—by switching to alternative energy sources, dependence on imported fossil fuels is reduced and the stability of energy supply is increased. The energy transition inherent in decarbonisation efforts creates new jobs, stimulates economic growth, and allows the development of new technologies and innovations in various sectors of the economy. Another positive effect is financial savings, i.e., increasing energy efficiency and switching to cheaper alternative energy and fuel sources. This leads to significant savings for both households and businesses, resulting in a more competitive economy.
Studies on waste generation forecasts have been conducted for waste management planning at national [78,79], regional [80], and household [81] levels. In these studies, groups of variables described by economic, social, and infrastructure indicators were used for modelling. Predictions of the magnitude of the mass accumulation index mainly used statistical methods in the form of linear regression models [82], multiple regression [83], rough set theory [84], multivariate grey models [85], and artificial neural networks [86]. However, the existing studies lack comparisons of forecast accuracy for different predictive models.

6. Summary and Development Prospects

Effective waste management and the implementation of modern waste conversion methods are a key element of environmental protection and sustainable development policy. Energy recovery from municipal waste is an important part of Poland’s energy transition towards sustainable development and a circular economy. The developed forecast of biodegradable municipal waste for the coming years shows an increasing trend, reaching 2696,500 tonnes in 2030, which will allow for a significant increase in energy recovery. Energy recovery from municipal waste and the development of renewable energy are key elements of the energy transition and the circular economy. In the future, the number of thermal waste conversion facilities should be increased, and biogas plants and modern waste processing technologies should be promoted. Investments in innovation, regulatory changes, and public education will also be crucial to enable the full potential of waste as an energy source to be harnessed.
Policy decisions affecting the development of renewable energy, such as the following, are also very important:
  • EU Renewable Energy Directive (RED III)—the European Union has committed to achieving a share of 42.5% of energy from renewable sources by 2030.
  • Energy Efficiency Directive (EED)—the directive aims to reduce primary and final energy consumption by 11.7% by 2030 compared to projections for 2020.
  • Polish Energy Policy until 2040 (PEP2040)—the Polish energy strategy assumes an increase in the share of renewable energy sources in the energy mix and the development of low-carbon technologies.
  • Supporting investment in renewable energy sources—this refers to subsidies, tax breaks, and financial support programmes.
In conclusion, both the development of energy recovery technologies from municipal waste and policy decisions supporting renewable energy will be necessary to achieve climate goals and ensure sustainable development.

Author Contributions

Conceptualization, M.K. and A.M.-K.; methodology, A.M.-K.; validation, M.K.; formal analysis, M.K. and A.M.-K.; investigation, M.K. and A.M.-K.; resources, A.M.-K. and M.K.; data curation, A.M.-K.; writing—original draft preparation A.M.-K. and M.K.; writing—review and editing, M.K.; visualization, A.M.-K.; supervision, M.K.; funding acquisition, M.K. All authors have read and agreed to the published version of the manuscript.

Funding

Ministry of Science, 142/23/B.

Data Availability Statement

The original contributions presented in this study are included in the article. Further inquiries can be directed to the corresponding author.

Conflicts of Interest

The authors declare no conflicts of interest.

References

  1. Trindade, A.B.; Palácio, J.C.E.; González, A.M.; Orozco, D.J.R.; Lora, E.E.S.; Renó, M.L.G.; Olmo, O.A. Advanced exergy analysis and environmental assessment of the steam cycle of an incineration system of municipal solid waste with energy recovery. Energy Convers. Manag. 2018, 157, 195–214. [Google Scholar] [CrossRef]
  2. Jonek-Kowalska, I. Towards the reduction of CO2 emissions. Paths of pro-ecological transformation of energy mixes in European countries with an above-average share of coal in energy consumption. Resour. Policy 2022, 77, 102701. [Google Scholar] [CrossRef]
  3. Soares, R.R.; Miyamaru, E.S.; Martins, G. Environmental performance of the allocation and urban solid waste treatment with energetic reuse through life cycle assessment at CTR-Caieiras. Eng. Sanitária Ambient. 2017, 22, 993–1003. [Google Scholar] [CrossRef]
  4. Balezentis, T. Shrinking ageing population and other drivers of energy consumption and CO2 emission in the residential sector: A case from Eastern Europe. Energy Policy 2020, 140, 111433. [Google Scholar] [CrossRef]
  5. Kumar, A.; Samadder, S.R. A review of technological options of waste to energy for effective management of municipal solid waste. Waste Manag. 2017, 69, 407–422. [Google Scholar] [CrossRef]
  6. Themelis, N.J.; Ulloa, P.A. Methane generation in landfills. Renew. Energy 2007, 32, 1243–1257. [Google Scholar] [CrossRef]
  7. Miłek, D.; Nowak, P.; Latosińska, J. The Development of Renewable Energy Sources in the European Union in the Light of the European Green Deal. Energies 2022, 15, 5576. [Google Scholar] [CrossRef]
  8. Lino, F.A.M.; Ismail, K.A.R. Evaluation of municipal solid waste treatment as a renewable energy resource in Campinas, Brazil. Sustain. Energy Technol. Assess. 2018, 29, 19–25. [Google Scholar] [CrossRef]
  9. Rybak, A.; Rybak, A.; Joostberens, J.; Kolev, S.D. Cluster Analysis of the EU-27 Countries in Light of the Guiding Principles of the European Green Deal, with Particular Emphasis on Poland. Energies 2022, 15, 5082. [Google Scholar] [CrossRef]
  10. Santos, R.E.; Santos, I.F.S.; Barros, R.M.; Bernal, A.P.; Tiago Filho, G.L.; Silva, F.G.B. Generating electrical energy through urban solid waste in Brazil: An economic and energy comparative analysis. J. Environ. Manag. 2019, 231, 198–206. [Google Scholar] [CrossRef]
  11. Guar, V.K.; Sharma, P.; Awasthi, M.K.; Dussap, C.G.; Pandey, A. Assessing the impact of industrial waste on environment and mitigation strategies: A comprehensive review. J. Hazard. Mater. 2020, 398, 123019. [Google Scholar] [CrossRef] [PubMed]
  12. Szopik-Depczyńska, K.; Kędzierska-Szczepaniak, A.; Szczepaniak, K.; Cheba, K.; Gajda, W.; Ioppolo, G. Innovation in sustainable development: An investigation of the EU context using 2030 agenda indicators. Land Use Policy 2018, 79, 251–262. [Google Scholar] [CrossRef]
  13. Rokicki, T.; Perkowska, A.; Klepacki, B.; Bórawski, P.; Bełdycka-Bórawska, A.; Michalski, K. Changes in Energy Consumption in Agriculture in the EU Countries. Energies 2021, 14, 1570. [Google Scholar] [CrossRef]
  14. Dalmo, F.C.; Simão, N.M.; Nebra, S.; Sant’ana, P.H.M. Energy recovery from municipal solid waste of inter-municipal public consortia identified in São Paulo State. Waste Manag. Res. 2019, 37, 301–310. [Google Scholar] [CrossRef]
  15. Silva, L.J.V.B.; Santos, I.F.S.; Mensah, J.H.R.; Gonçalves, A.T.T.; Barros, R.M. Incineration of municipal solid waste in Brazil: An analysis of the economically viable energy potential. Renew. Energy 2020, 149, 1386–1394. [Google Scholar] [CrossRef]
  16. Singh, J.; Laurenti, R.; Sinha, R.; Frostell, B. Progress and challenges to the global waste management system. Waste Manag. Res. 2014, 32, 800–812. [Google Scholar] [CrossRef]
  17. Marciniuk-Kluska, A.; Kluska, M. Forecasting Energy Recovery from Municipal Waste in a Closed-Loop Economy. Energies 2023, 16, 2732. [Google Scholar] [CrossRef]
  18. Lino, F.A.M.; Ismail, K.A.R. Recycling and thermal treatment of MSW in a developing country. IOSR J. Eng. 2017, 7, 30–38. [Google Scholar]
  19. Bórawski, P.; Bełdycka-Bórawska, A.; Szymańska, E.J.; Jankowski, K.J.; Dubis, B.; Dunn, J.W. Development of Renewable Energy Sources Market and Biofuels in The European Union. J. Clean. Prod. 2019, 228, 467–484. [Google Scholar] [CrossRef]
  20. Pin, B.V.R.; Barros, R.M.; Lora, E.E.S.; Santos, I.F.S. Waste management studies in a Brazilian microregion: GHG emissions balance and LFG energy project economic feasibility analysis. Energy Strategy Rev. 2018, 19, 31–43. [Google Scholar] [CrossRef]
  21. Golwala, H.; Zhang, X.; Mdlskander, S.; Smith, A.L. Solid waste: An overlooked source of microplastics to the environment. Sci. Total Environ. 2021, 769, 144581. [Google Scholar] [CrossRef] [PubMed]
  22. Lopes, E.J.; Okamura, L.A.; Maruyama, S.A.; Yamamoto, C.I. Evaluation of energy gain from the segregation of organic materials from municipal solid waste in gasification processes. Renew. Energy 2018, 116, 623–629. [Google Scholar] [CrossRef]
  23. Jacobson, M.Z.; Delucchi, M.A. Providing All Global Energy with Wind, Water, and Solar Power, Part I: Technologies, Energy Resources, Quantities and Areas of Infrastructure, and Materials. Energy Policy 2011, 39, 1154–1169. [Google Scholar] [CrossRef]
  24. Wolde-Rufael, Y.; Weldemeskel, E.M. Environmental policy stringency, renewable energy consumption and CO2 emissions: Panel cointegration analysis for BRIICTS countries. Int. J. Green Energy 2020, 17, 568–582. [Google Scholar] [CrossRef]
  25. Klinghoffer, N.B.; Castaldi, M.J. Waste to Energy Conversion Technology; Woodhead Publishing: Cambridge, UK, 2013. [Google Scholar]
  26. European Environment Agency (EEA). Bio-Waste in Europe—Turning Challenges into Opportunities; EEA Report No 4/2020; European Environment Agency: Copenhagen, Denmark, 2020. [Google Scholar]
  27. European Commission. Circular Economy Action Plan. Available online: https://ec.europa.eu/environment/circular-economy/ (accessed on 23 January 2025).
  28. European Union. Directive 2008/98/EC of the European Parliament and of the Council of 19 November 2008 on waste and repealing certain directives. Off. J. Eur. Union L 2008, 312, 3–30. [Google Scholar]
  29. Central Statistical Office (CSO). 2025. Available online: https://stat.gov.pl/ (accessed on 26 January 2025). (In Polish)
  30. Dalmo, F.C.; Simão, N.M.; Lima, H.Q.; Jimenez, A.C.M.; Nebra, S.; Martins, G.; Palacios-Bereche, R.; Sant’ana, P.H.M. Energy recovery overview of municipal solid waste in São Paulo State, Brazil. J. Clean. Prod. 2019, 212, 461–474. [Google Scholar] [CrossRef]
  31. Kuo, W.C.; Lasek, J.; Słowik, J.; Głód, K.; Jagustyn, B.; Li, Y.H.; Cygan, A. Low-temperature pre-treatment of municipal solid waste for efficient application in combustion systems. Energy Convers. Manag. 2019, 196, 525–535. [Google Scholar] [CrossRef]
  32. Bajan, B.; Łukasiewicz, J.; Mrówczyńska-Kamińska, A. Energy Consumption and Its Structures in Food Production Systems of the Visegrad Group Countries Compared with Eu-15 Countries. Energies 2021, 14, 3945. [Google Scholar] [CrossRef]
  33. Astrup, T.F.; Tonini, D.; Turconi, R.; Boldrin, A. Life cycle assessment of thermal Waste-to-Energy technologies: Review and recommendations. Waste Manag. 2015, 37, 104–115. [Google Scholar] [CrossRef]
  34. Beal, C.M.; King, C.W. The zero-emissions cost of energy: A policy concept. Prog. Energy 2022, 3, 023001. [Google Scholar] [CrossRef]
  35. Van Eygen, E.; Feketitsch, J.; Laner, D.; Rechberger, H.; Fellner, J. Comprehensive analysis and quantification of national plastic flows: The case of Austria. Resour. Conserv. Recycl. 2017, 117, 183–194. [Google Scholar] [CrossRef]
  36. Pavi, S.; Kramer, L.E.; Gomes, L.P.; Miranda, L.A.S. Biogas production from co-digestion of organic fraction of municipal solid waste and fruit and vegetable waste. Bioresour. Technol. 2017, 228, 362–367. [Google Scholar] [CrossRef] [PubMed]
  37. Sebastian, R.M.; Kumar, D.; Alappat, B.J. A technique to quantify incinerability of municipal solid waste. Resour. Conserv. Recycl. 2019, 140, 286–296. [Google Scholar] [CrossRef]
  38. Jimenez, A.C.M.; Bereche, R.P.; Nebra, S.A. Three municipal solid waste gasification technologies analysis for electrical energy generation in Brazil. Waste Manag. Res. 2019, 37, 631–642. [Google Scholar] [CrossRef]
  39. Rajaeifar, M.A.; Ghanavati, H.; Dashti, B.B.; Heijungs, R.; Aghbashlo, M.; Tabatabaei, M. Electricity generation and GHG emission reduction potentials through different municipal solid waste management technologies: A comparative review. Renew. Sust. Energy Rev. 2017, 79, 414–439. [Google Scholar] [CrossRef]
  40. Gajdzik, B.; Wolniak, R.; Grebski, W.W. An econometric model of the operation of the steel industry in Poland in the context of process heat and energy consumption. Energies 2022, 15, 7909. [Google Scholar] [CrossRef]
  41. Nordi, G.H.; Palacios-Bereche, R.; Gallego, A.G.; Nebra, S.A. Electricity production from municipal solid waste in Brazil. Waste Manag. Res. 2017, 35, 709–720. [Google Scholar] [CrossRef]
  42. Lopes, E.J.; Queiroz, N.; Yamamoto, C.I.; Costa Neto, P.R. Evaluating the emissions from the gasification processing of municipal solid waste followed by combustion. Waste Manag. 2018, 73, 504–510. [Google Scholar] [CrossRef]
  43. Rincón-Moreno, J.; Ormazábal, M.; Álvarez, M.; Jaca, C. Advancing circular economy performance indicators and their application in Spanish companies. J. Clean. Prod. 2021, 279, 123605. [Google Scholar] [CrossRef]
  44. Donati, F.; Aguilar-Hernandez, G.A.; Sigüenza-Sánchez, C.P.; de Koning, A.; Rodrigues, J.F.; Tukker, A. Modeling the circular economy in environmentally extended input-output tables: Methods, software and case study. Resour. Conserv. Recycl. 2020, 152, 104508. [Google Scholar] [CrossRef]
  45. Ratner, S.; Gomonov, K.; Revinova, S.; Lazanyuk, I. Eco-design of Energy Production Systems: The Problem of Renewable Energy Capacity Recycling. Appl. Sci. 2020, 10, 4339. [Google Scholar] [CrossRef]
  46. Van Eygen, E.; Feketitsch, J.; Laner, D.; Rechberger, H.; Fellner, J. Kompleksowa analiza i kwantyfikacja krajowych przepływów plastiku: Przypadek Austrii. Resour. Conserv. Recycl. 2017, 117, 183–194. [Google Scholar] [CrossRef]
  47. Krausmann, F.; Lauk, C.; Haas, W.; Wiedenhofer, D. Od wydobycia zasobów do odpływów odpadów i emisji: Społeczno-ekonomiczny metabolizm światowej gospodarki, 1900–2015. Glob. Environ. Change 2018, 52, 131–140. [Google Scholar] [CrossRef] [PubMed]
  48. Lyulyov, O.; Chygryn, O.; Pimonenko, T.; Zimbroff, A.; Makiela, Z.; Kwilinski, A. Green competitiveness forecasting as an instrument for sustainable business transformation. Forum Sci. Oeconomia 2024, 12, 8–20. [Google Scholar]
  49. Confederation of European Waste-To-Energy Plants (CEWEP). Calculation Tool for Potential Impacts on Waste Amounts for Thermal Treatment. Peer Review. Alemanha. 2018. Available online: https://www.cewep.eu/circular-economy-calculator/ (accessed on 30 December 2021).
  50. Rodrigues, L.F.; Santos, I.F.S.; Santos, T.I.S.; Barros, R.M.; Tiago Filho, G.L. Energy and economic evaluation of MSW incineration and gasification in Brazil. Renew. Energy 2022, 188, 933–944. [Google Scholar] [CrossRef]
  51. Tabata, T. Waste-to-energy incineration plants as greenhouse gas reducers: A case study of seven Japanese metropolises. Waste Manag. Res. 2013, 31, 1110–1117. [Google Scholar] [CrossRef]
  52. Ferreira, C.R.N.; Infiesta, L.R.; Monteiro, V.A.L.; Starling, M.C.V.M.; Silva Junior, W.M.; Borges, V.L.; Carvalho, S.R.; Trovó, A.G. Gasification of municipal refuse-derived fuel as an alternative to waste disposal: Process efficiency and thermochemical analysis. Process Saf. Environ. Prot. 2021, 149, 885–893. [Google Scholar] [CrossRef]
  53. Nordi, G.H.; Palacios-Bereche, R.; Gallego, A.G.; Nebra, S.A. Energetic analysis of electricity production in Rankine cycles from municipal solid waste in Brazil. In Proceedings of the International Solid Waste Association Congress, São Paulo, Brazil, 8–11 September 2014. [Google Scholar]
  54. Pietrzak, M.B.; Igliński, B.; Kujawski, W.; Iwański, P. Energy transition in Poland—Assessment of the renewable energy sector. Energies 2021, 14, 2046. [Google Scholar] [CrossRef]
  55. Lima, P.M.; Colvero, D.A.; Gomes, A.P.; Wenzel, H.; Schalch, V.; Cimpan, C. Environmental assessment of existing and alternative options for management of municipal solid waste in Brazil. Waste Manag. 2018, 78, 857–870. [Google Scholar] [CrossRef]
  56. Themelis, N.J.; Barriga, M.E.D.; Estevez, P.; Velasco, M.G. Guide to Recovering Energy and Materials from Solid Waste, Translation of the original 2013 version; Earth Engineering Center, Columbia University: New York, NY, USA, 2016; 228p. [Google Scholar]
  57. Commission Implementing Decision (EU) 2021/19 of 18 December 2020 Laying down a Common Methodology and a Format for Reporting on Reuse in Accordance with Directive 2008/98/EC of the European Parliament and of the Council (OJ L 10, 12.1.2021, pp. 1–7). Available online: https://eur-lex.europa.eu/eli/dec_impl/2021/19/oj/eng (accessed on 30 January 2025).
  58. Commission Decision 2000/532/EC of 3 May 2000 Replacing Decision 94/3/EC Establishing a List of Wastes Pursuant to Article 1(a) of Council Directive 75/442/EEC on Waste and Council Decision 94/904/EC Establishing a List of Hazardous Waste Pursuant to Article 1(4) of Council Directive 91/689/EEC on Hazardous Waste (OJ L 226, 6.9.2000, pp. 3–24). Available online: https://eur-lex.europa.eu/eli/dec/2000/532/oj/eng (accessed on 30 January 2025).
  59. Commission Implementing Decision (EU) 22019/2000 of 28 November 2019 Laying down a Format for Reporting of Data on Food Waste and for Submission of the Quality Check Report in Accordance with Directive 2008/98/EC of the European Parliament and of the Council (OJ L 310, 2.12.2019, pp. 39–45). Available online: https://eur-lex.europa.eu/eli/dec_impl/2019/2000/oj/eng (accessed on 30 January 2025).
  60. Commission Delegated Decision (EU) 2019/1597 of 3 May 2019 Supplementing Directive 2008/98/EC of the European Parliament and of the Council as Regards a Common Methodology and Minimum Quality Requirements for the Uniform Measurement of Levels of Food Waste (OJ L 248, 27.9.2019, pp. 77–85). Available online: https://eur-lex.europa.eu/eli/dec_del/2019/1597/oj/eng (accessed on 30 January 2025).
  61. Commission Directive (EU) 2015/1127 of 10 July 2015 Amending Annex II to Directive 2008/98/EC of the European Parliament and of the Council on Waste and Repealing Certain Directives (OJ L 184, 11.7.2015, pp. 13–15). Available online: https://eur-lex.europa.eu/eli/dir/2015/1127/oj/eng (accessed on 30 January 2025).
  62. Commission Implementing Decision (EU) 2019/1004 of 7 June 2019 Laying down Rules for the Calculation, Verification and Reporting of Data on Waste in Accordance with Directive 2008/98/EC of the European Parliament and of the Council and Repealing Commission Implementing Decision C(2012) 2384 (OJ L 163, 20.6.2019, pp. 66–100). Available online: https://eur-lex.europa.eu/eli/dec_impl/2019/1004/oj/eng (accessed on 30 January 2025).
  63. Carneiro, M.L.N.M.; Gomes, M.S.P. Energy, exergy, environmental and economic analysis of hybrid waste-to energy plants. Energy Convers. Manag. 2019, 179, 397–417. [Google Scholar] [CrossRef]
  64. Marco-Fondevila, M.; Benito-Bentué, D.; Scarpellini, S. “Old” financial instruments in “new” circular models: Applied environmental accounting in the banking sector for reporting in a circular economy. Rev. Contab.-Span. Account. Rev. 2023, 26, 34–45. [Google Scholar] [CrossRef]
  65. Colvero, D.A.; Ramalho, J.; Gomes, A.P.D.; Matos, M.A.A.; Tarelho, L.A.C. Economic analysis of a shared municipal solid waste management facility in a metropolitan region. Waste Manag. 2020, 102, 823–837. [Google Scholar] [CrossRef] [PubMed]
  66. Luz, F.C.; Rocha, M.H.; Lora, E.E.S.; Venturini, O.J.; Andrade, R.V.; Leme, M.M.V.; Olmo, O.A. Techno-economic analysis of municipal solid waste gasification for electricity generation in Brazil. Energy Convers. Manag. 2015, 103, 321–337. [Google Scholar] [CrossRef]
  67. Zaman, A.U. A comprehensive study of the environmental and economic benefits of resource recovery from global waste management systems. J. Clean. Prod. 2016, 124, 41–50. [Google Scholar] [CrossRef]
  68. Sadeleer, I.; Brattebø, H.; Callewaert, P. Waste prevention, energy recovery or recycling—Directions for household food waste management in light of circular economy policy. Resour. Conserv. Recycl. 2020, 160, 104908. [Google Scholar] [CrossRef]
  69. Jedelhauser, M. The Future of Waste Incineration in a Modern Circular Economy; Info: Waste Incineration; Naturschutzbund Deutschland (NABU): Berlin, Germany, 2020. [Google Scholar]
  70. Available online: https://ec.europa.eu/eurostat (accessed on 30 January 2025). (In Polish).
  71. Available online: https://www.statista.com/topics/4961/renewable-energy-in-europe/ (accessed on 10 February 2025).
  72. Available online: https://stat.gov.pl/obszary-tematyczne/srodowisko-energia/energia/energia-ze-zrodel-odnawialnych-w-2023-roku,10,7.html (accessed on 30 January 2025). (In Polish)
  73. Witkowski, M.; Klimanek, T. Economic Forecasting and Simulation in Examples and Tasks; Wydawnictwo Uniwersytetu Ekonomicznego w Poznaniu: Poznan, Poland, 2006; s. 178. (In Polish) [Google Scholar]
  74. Radzikowska, B. Forecasting Methods. A Collection of Tasks; Wyd. AE we Wrocławiu: Wrocław, Poland, 2000; s.18. (In Polish) [Google Scholar]
  75. Available online: https://www.gov.pl/afttachmen (accessed on 13 April 2025). (In Polish)
  76. Available online: https://www.gov.pl/attachment/3c8a2fd6-a0a4-4b7f-b301-0b8569f1eaf7 (accessed on 13 April 2025). (In Polish)
  77. Klimek, P. Evaluation of the Energy Potential of Municipal Solid Waste Depending on Waste Treatment Technology. Nafta-Gaz, (2013), nr 12, 909–914. (In Polish). Available online: https://www.inig.pl/magazyn/nafta-gaz/NAFTA-GAZ-2013-12-05.pdf (accessed on 30 January 2025).
  78. Boas Berg, A.; Radziemska, M.; Adamcová, D.; Zloch, J.; Vaverková, M.D. Assessment strategies for municipal selective waste collection-regional waste management. J. Ecol. Eng. 2018, 19, 33–41. [Google Scholar] [CrossRef]
  79. Mazzanti, M.; Zoboli, R. Waste generation, waste disposal and policy effectiveness: Evidence on decoupling from the European Union. Resour. Conserv. Recycl. 2008, 52, 1221–1234. [Google Scholar] [CrossRef]
  80. Vieira, V.H.A.D.M.; Matheus, D.R. The impact of socioeconomic factors on municipal solid waste generation in São Paulo, Brazil. Waste Manag. Res. 2017, 36, 79–85. [Google Scholar] [CrossRef]
  81. Nęcka, K.; Szul, T.; Knaga, J. Identification and analysis of sets variables for of municipal waste management modelling. Geosciences 2019, 9, 458. [Google Scholar] [CrossRef]
  82. Boer, E.D.; Jędryczak, A.; Kowalski, Z.; Kulczycka, J.; Szpadt, R. A review of municipal solid waste composition and quantities in Poland. Waste Manag. 2010, 30, 369–377. [Google Scholar] [CrossRef] [PubMed]
  83. Tałałaj, I.A.; Walery, M. The effect of gender and age structure on municipal waste generation in Poland. Waste Manag. 2015, 40, 3–8. [Google Scholar] [CrossRef] [PubMed]
  84. Szul, T.; Knaga, J.; Nęcka, K. Application of rough set theory to establish the amount of waste in Households in Rural Areas. Ecol. Chem. Eng. S 2017, 24, 311–325. [Google Scholar] [CrossRef]
  85. Intharathirat, R.; Salam, P.A.; Kumar, S.; Untong, A. Forecasting of municipal solid waste quantity in a developing country using multivariate grey models. Waste Manag. 2015, 39, 3–14. [Google Scholar] [CrossRef]
  86. Maryam, A.; Ali, E.H. Forecasting municipal solid waste generation using artificial intelligence modelling approaches. Waste Manag. 2017, 56, 13–22. [Google Scholar]
Figure 1. Renewable energy in total primary energy (%) in 2019 and 2022 [72]. Source: Renewable energy in 2023, CSO, Warsaw, Rzeszów 2024.
Energies 18 02210 g001
Figure 2. Renewable energy production (%) by carrier in Poland in 2022 [72].
Energies 18 02210 g002
Figure 3. Consumption of energy from renewable municipal waste by sector in 2019–2023. Source: Renewable energy in 2023, CSO, Warsaw, Rzeszów 2024.
Energies 18 02210 g003
Figure 4. Share of RES in heat production in 2023. Source: Energy from Renewable Sources in 2023, CSO, Warsaw 2024.
Energies 18 02210 g004
Figure 5. Share of renewable energy in final energy consumption in 2013–2023. Source: authors’ own compilation based on Energy from Renewable Sources in 2023, CSO, Warsaw 2024.
Energies 18 02210 g005
Figure 6. Distribution of incineration plants in Poland with indication of their capacity and thermal and electrical output. [t = tonnes] Source: Energy recovery from waste, System Heat Warehouse, 2022.
Energies 18 02210 g006
Figure 7. Share of municipal waste by fraction collected selectively in 2010–2023. Source: Environmental Protection, CSO, Warsaw 2024.
Energies 18 02210 g007
Figure 8. Controlled municipal waste landfills by voivodships in Poland in 2023. Source: Environmental Protection, CSO, Warsaw 2023.
Energies 18 02210 g008
Figure 9. Values of the municipal waste accumulation index (in kg/M year) in the individual provinces of Poland—how much waste was generated by a statistical person in the province in the years 2011–2023. Source: Local database, CSO, Warsaw 2012–2024. Red dots—municipal waste accumulation rate. Blue curve—trend line.
Energies 18 02210 g009
Figure 10. Biodegradable municipal waste forecast for 2024–2030 (in thousand tons). Source: this study.
Energies 18 02210 g010
Table 1. Dynamics of the balance of renewable energy carriers from municipal waste in 2019–2023.
Specification201720182019202020212022202320/1921/2022/2123/22
w PJw%
Acquisition3.874.174.276.016.224.874.811411047899
Domestic consumption3.874.124.276.016.224.854.801411047899
Consumption per batch of transformations1.421.542.063.584.414.264.111741239796
Final energy consumption2.452.572.222.431.810.610.6110753498
Manufacturing activities2.412.552.212.421.450.540.551096037102
Trade and services0.040.020.010.010.370.060.0510037001683
Source: compiled on the basis of CSO data 2017–2023.
Table 2. Energy recovery, energy efficiency, and achieved capacity of incineration plants in Poland in 2020–2022.
IncineratorsEnergy RecoveryAchieved Capacity [%]
2020 [GJ/rok]2020 [GJ/Mg]2021 [GJ/rok]2021 [GJ/Mg]2022 [GJ/rok]2022 [GJ/Mg]
Krakowski Holding 1,394,8226.21,440,3996.21,433,6896.291–94
ZUO Szczecin 810,0005.6875,5585.3961,4405.5100
Prezero Poznań 785,0003.6816,5923.9915,8474.4100
PUHPLECHBiałystok410,0005.1548,7354.9544,6884.990–93
PGE Rzeszów 250,0003.4288,0933.4461,6245.377–90
MPO Warszawa 220,0006.7277,1907.3277,1908.058–69
MZGOK Konin590,0007.2115,3781.4831,4919.787–91
Pronatura Bydgoszcz805,0005.0--868,1845.391
Source: authors’ own elaboration based on CSO waste database 2020–2024.
Table 3. Calculation of projections of expired biodegradable municipal waste with simulation of parameter α, using MWW method for 2007–2023 (in tons).
YeartytytP* α = 0.9(yt − ytP*)2ytP*·α = 0.99(yt − ytP*)2ytP* − yt − 1P*
2007185,175124,1501,519,019,445124,1501,519,019,445
20082123,12889,0731,159,800,23885,5651,411,020,589−38,584.9
20093164,146119,7231,973,383,738122,7531,713,366,83437,187.9
20104181,295159,703466,196,258163,732308,466,99040,978.9
20115210,045179,136955,357,493181,119836,674,84817,387.6
20126201,629206,95428,348,322209,75566,031,00928,636.1
20137311,787202,16212,017,721,436201,71112,116,844,776−8044.7
20148583,670300,82580,001,484,582310,68674,520,026,981108,975.8
20159657,048555,38510,335,169,093580,9405,792,326,540270,253.7
201610822,864646,88130,969,911,885656,28627,748,087,94575,346.3
201711895,395805,2668,123,254,728821,1985,505,136,302164,911.8
2018121,015,378886,38216,639,903,527894,65314,574,478,79873,454.6
2019131,196,3731,002,47837,595,245,8201,014,17033,197,790,384119,517.6
2020141,610,0351,176,984187,533,362,1751,194,551172,626,751,567180,380.6
2021151,842,9941,566,73076,321,876,3481,605,88056,222,981,447411,328.9
2022161,913,6641,815,3679,662,247,9611,840,6235,335,054,671234,742.7
2023172,042,6861,903,83419,279,634,4761,912,93416,835,546,36372,311.0
Source: compiled using CSO data 2007–2023.
Table 4. Forecast errors and forecasts of biodegradable municipal waste consumption until 2030.
Specification2024202520262027202820292030
Forecasts of biodegradable municipal waste, in thousand t2042.62137.22249.12360.92472.82584.62696.5
Mean square error of ex-post forecasts, in thousand t158.1
Relative error of forecasts ex post, in %7.747.407.036.696.396.125.86
Source: this study.
Disclaimer/Publisher’s Note: The statements, opinions and data contained in all publications are solely those of the individual author(s) and contributor(s) and not of MDPI and/or the editor(s). MDPI and/or the editor(s) disclaim responsibility for any injury to people or property resulting from any ideas, methods, instructions or products referred to in the content.