Review

Long-Term Analysis of Hydropower’s Pivotal Role in Sustainable Future of Greece

by
John K. Kaldellis
Soft Energy Applications & Environmental Protection Laboratory, Mechanical Engineering Department, University of West Attica, 250 Thivon & P. Ralli Street, 12241 Athens, Greece
Energies 2025, 18(9), 2214; https://doi.org/10.3390/en18092214
Submission received: 7 March 2025 / Revised: 18 April 2025 / Accepted: 24 April 2025 / Published: 27 April 2025

Abstract

:
Hydropower, a proven renewable electricity generation technology, has satisfied approximately 16% of the global annual electricity consumption up to the present day. In Greece, hydropower applications throughout the last thirty years have covered almost 6–10% of the mainland’s annual electricity demand. The present work examines the long-term performance and the current status of hydropower applications in Greece as well as their potential contribution to accomplishing the national energy targets set in compliance with the European Directives. A dedicated visualization of large hydropower (LHP) plants’ main characteristics is also performed. Moreover, a critical evaluation of the existing LHP plants’ energy yield-based time evolution is carried out, attempting to provide insights into any fundamental trends and similarities. The analysis reveals that the majority of Greek LHP plants are primarily used to meet the corresponding mainland’s peak load demand. To this end, acknowledging the power balancing service capacity of pumped hydro storage stations, the prospects and the challenges for the specific energy storage technology’s deployment are also emphasized.

1. Introduction

The global urgency for renewable energy has intensified as the world grapples with the severe consequences of climate change and energy supply insecurity [1]. Many governments worldwide have made a growing commitment to decarbonization and the integration of renewable energy sources (RESs) into their energy mix [2]. This commitment stems from the recognition that RESs can mitigate the adverse impacts of climate change, reduce the energy sector’s environmental footprint, and enhance energy supply security by diversifying the energy mix and reducing reliance on finite fossil fuels. Beyond environmental and energy benefits, RESs also present a strategic opportunity for nations to reduce their political and economic dependence on imported energy sources [3]; thus, they are critical, not only for advancing environmental sustainability, but also for addressing a range of interconnected socio-economic and geopolitical risks [4]. In more detail, by encouraging renewable energy applications, energy systems can become more resilient and adaptable, enabling nations to mitigate vulnerabilities associated with fossil fuel reliance, such as price volatility, resource depletion and geopolitical tensions. Moreover, integrating RESs into energy systems enhances energy security by diversifying energy portfolios, reducing dependency on imports and ensuring reliable energy access, especially in regions susceptible to supply disruptions [5], while addressing the complexities of modern energy systems.
Hydroelectric Power Stations hold a distinct position within this spectrum due to their unique advantages, including reliability, substantial storage capacity and multi-purpose functionality. In particular, large hydroelectric projects enhance energy supply security by storing significant amounts of energy, allowing for on-demand electricity generation to offset the intermittency of variable renewables like solar and wind energy [6]. Their ability to quickly respond to supply–demand fluctuations also makes them a significant source of flexibility, boosting the resiliency of energy systems [7]. Additionally, their multi-purpose nature benefits the water sector by supporting water supply and flood control. This dual role highlights the critical importance of hydropower systems in driving the global energy transition while addressing broader resource management challenges [8].

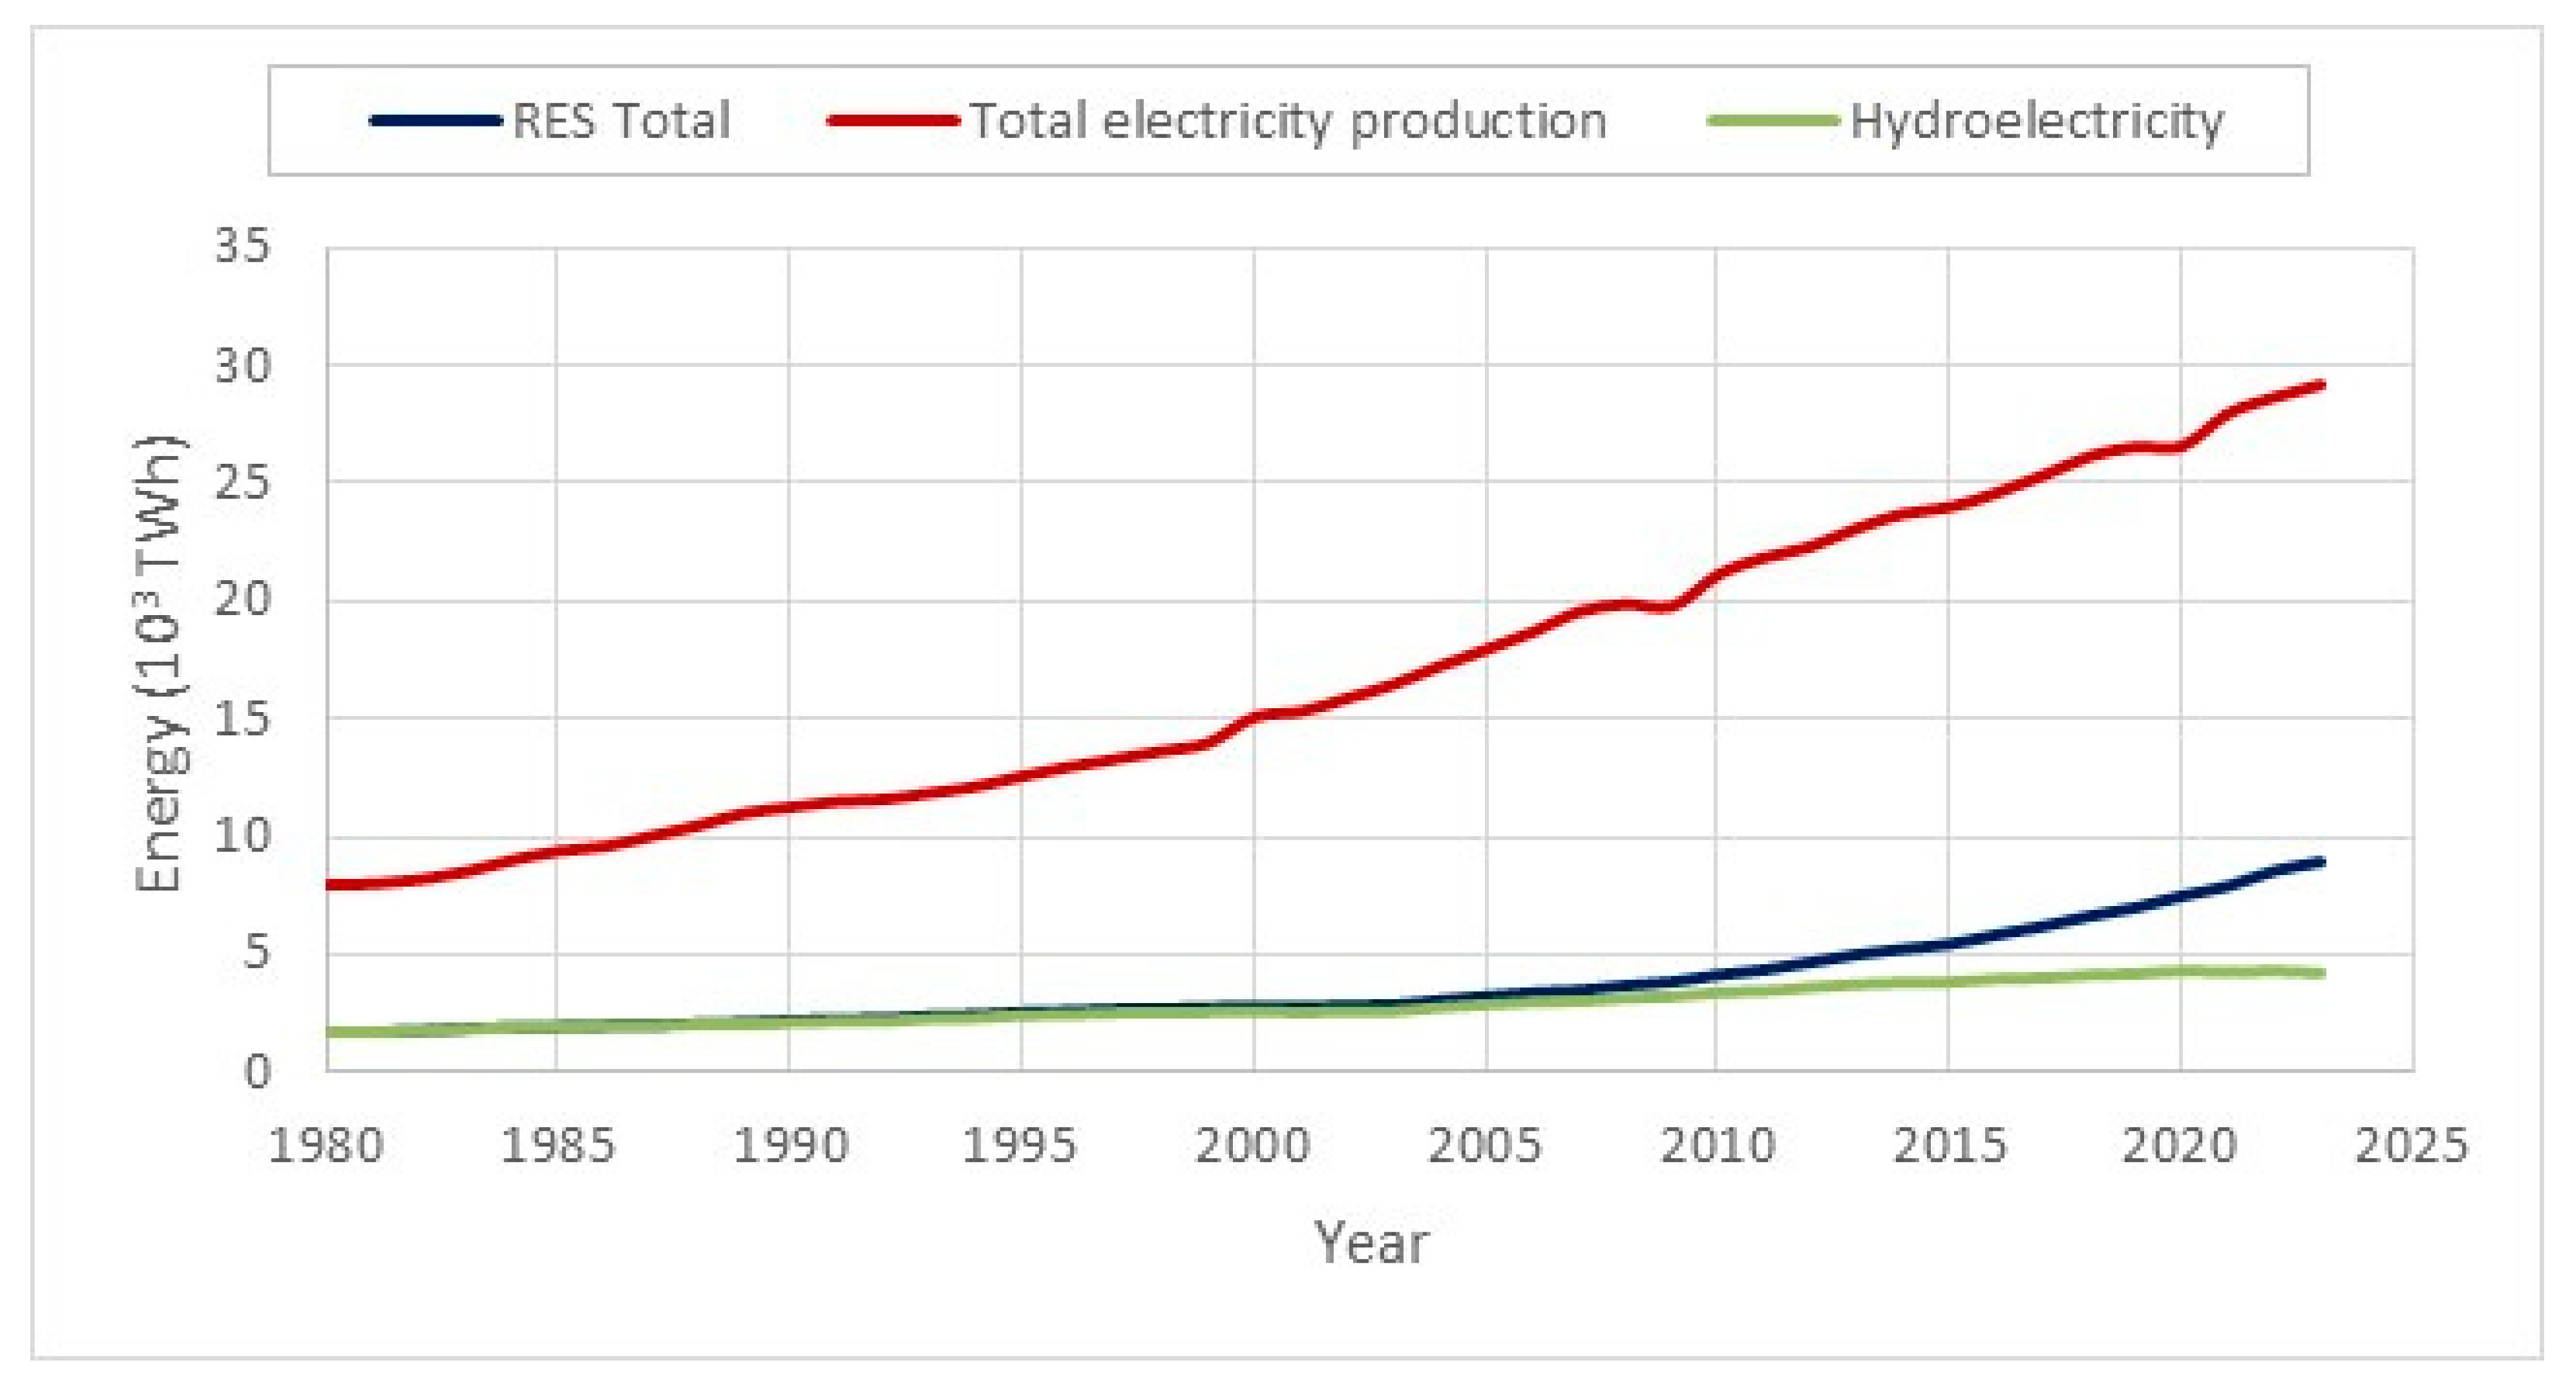
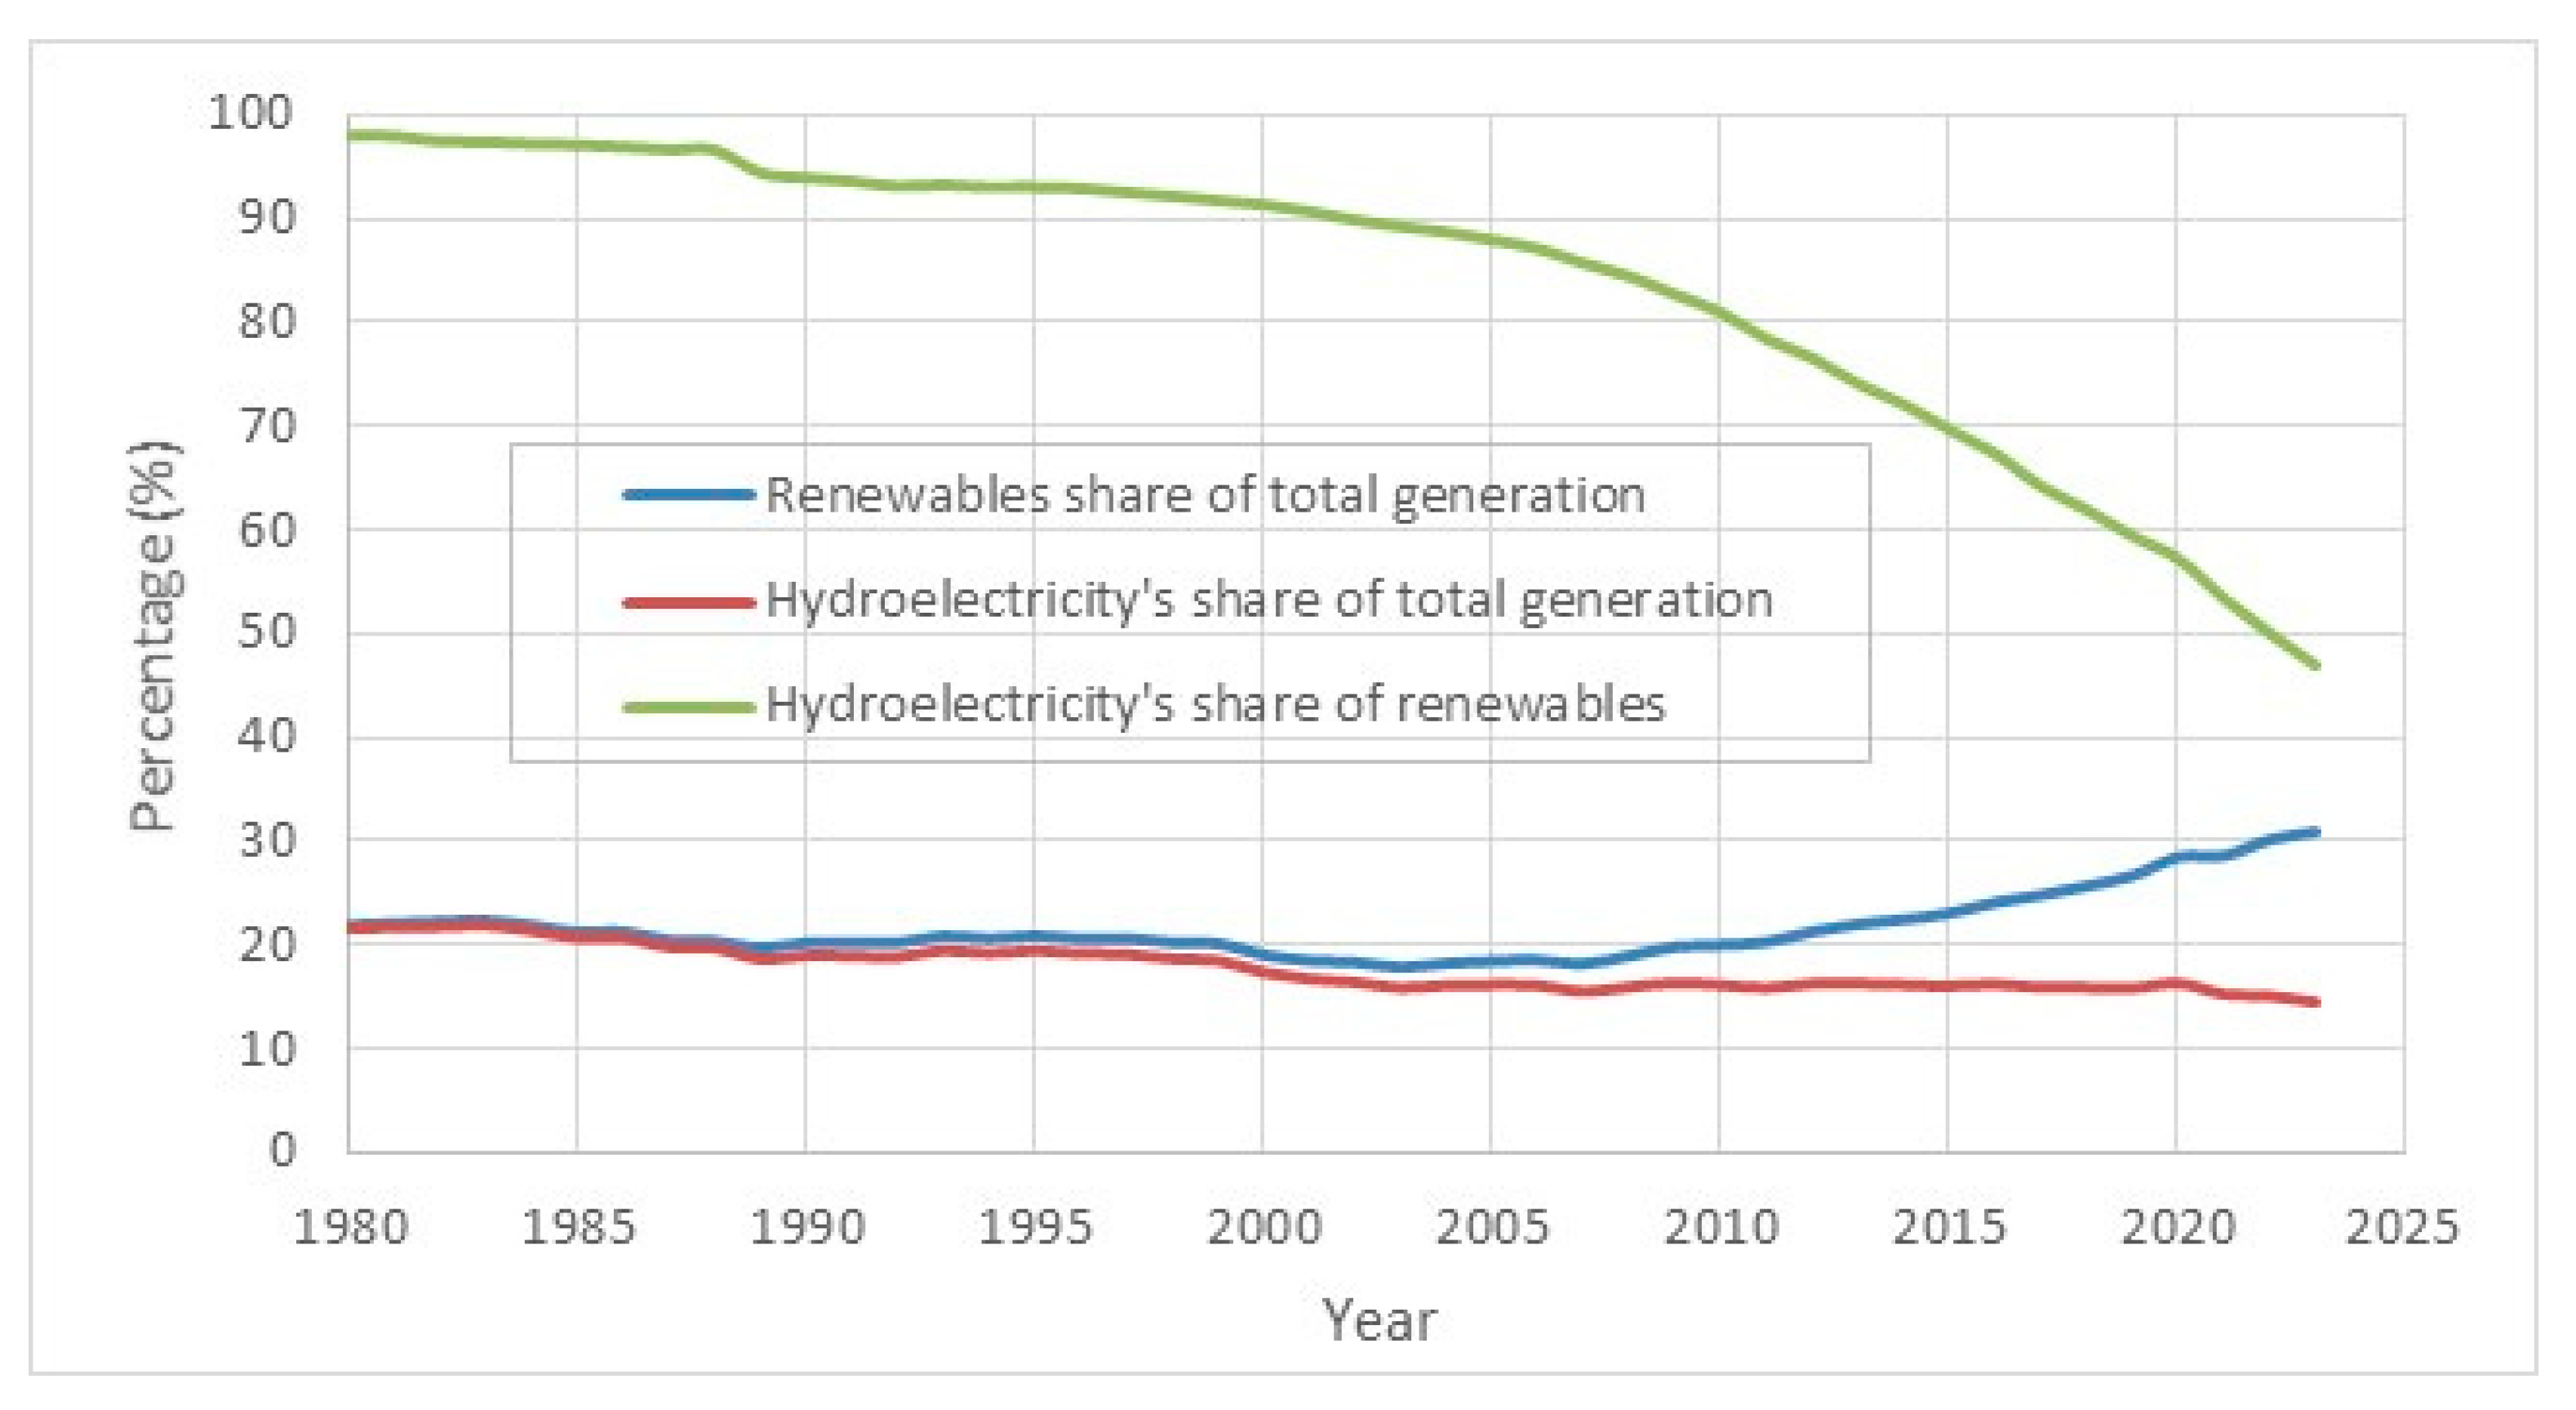
Hydropower in the Global Electricity Generation Mix

It is well accepted that energy consumption is strongly intertwined with economic prosperity [9,10]. Until now, carbon-containing fuels have held the major share in the global primary energy mix [11], while, on the other hand, they have been the main factor responsible for the progressing environmental deterioration [12]. In the same context, the ceaseless growth of the global energy demand and the need to close the electricity access gap between the developed and the developing countries have put humanity under pressure [13].
Hydropower has been one of the earliest and most widely adopted renewable energy technologies, playing a crucial role in global electricity generation. According to available data [14], as of 1980, hydroelectricity contributed 1722.6 TWhe, accounting for over 98% of renewable energy generation and approximately 22% of total global electricity production. Although in recent decades, its relative contribution has declined with the rapid expansion of solar and wind energy, hydropower remains the largest source of renewable electricity globally, generating over 4235.6 TWhe annually by 2023 (Figure 1), representing more than 15% of the global electricity consumption [15,16].
Despite the substantial solar and wind energy increase in the planet’s primary energy fuel mix [11,14], hydropower also stands out, representing 7% of the global primary energy consumption [15,16], being a renewable and cost-effective energy source that contributes to greenhouse gas (GHG) emissions abatement [15].
Actually, over the past 40 years, total renewable electricity generation has more than tripled, with hydropower consistently contributing more than 50% of this output. In 2023, however, for the first time, hydropower’s share of renewable energy generation fell below 50% [14], dropping to 47% (Figure 2).
The global cumulative installed hydropower (both large and small) capacity was equal to 1406 GWe, rising by 6.7% from the corresponding value in 2019. China was the global leader with over 422 GWe of installed capacity, followed by Brazil (110 GWe), the United States of America (103 GWe), Canada (83 GWe), Russia (52 GWe), India (52 GWe) and Japan (50 GWe). Nevertheless, there is still a large potential for further deployment. In Europe, close to 50% of the relevant technical potential has already been exploited, whereas in Asia and Africa, the technical potential remains highly untapped, with the pertinent percentages being only 24% and 11%, respectively [14,17].
The global distribution of hydroelectricity production varies significantly, with certain regions and countries playing pioneering roles. Europe experienced a large growth trajectory in hydropower development between 1990 and 2000, increasing its production from 414.8 TWhe in 1990 to 722.3 TWhe in 2000. However, growth stagnated over the next two decades, with production reaching 759.2 TWhe by 2023. In the Americas, hydroelectricity production has seen a small but rather steady expansion in the past decade. In contrast, Asia and, particularly, China, has become the global leader in hydropower, increasing its generation from 250.6 TWhe in 1980 to nearly 1918.4 TWhe by 2023, now accounting for over 45% of global hydroelectricity production [14].
As of 2023, seven countries—Russia, Norway, Sweden, France, Austria, Italy and Switzerland—account for nearly 75% of Europe’s total hydroelectricity production (759.2 TWhe). Smaller nations like Greece have also tapped into their hydroelectric potential, though to a much lesser extent. Within the European Union, Greece ranks 12th in total hydroelectric energy production, generating 4.7 TWhe, which contributes 1.45% of the European Union’s total output (Figure 3).

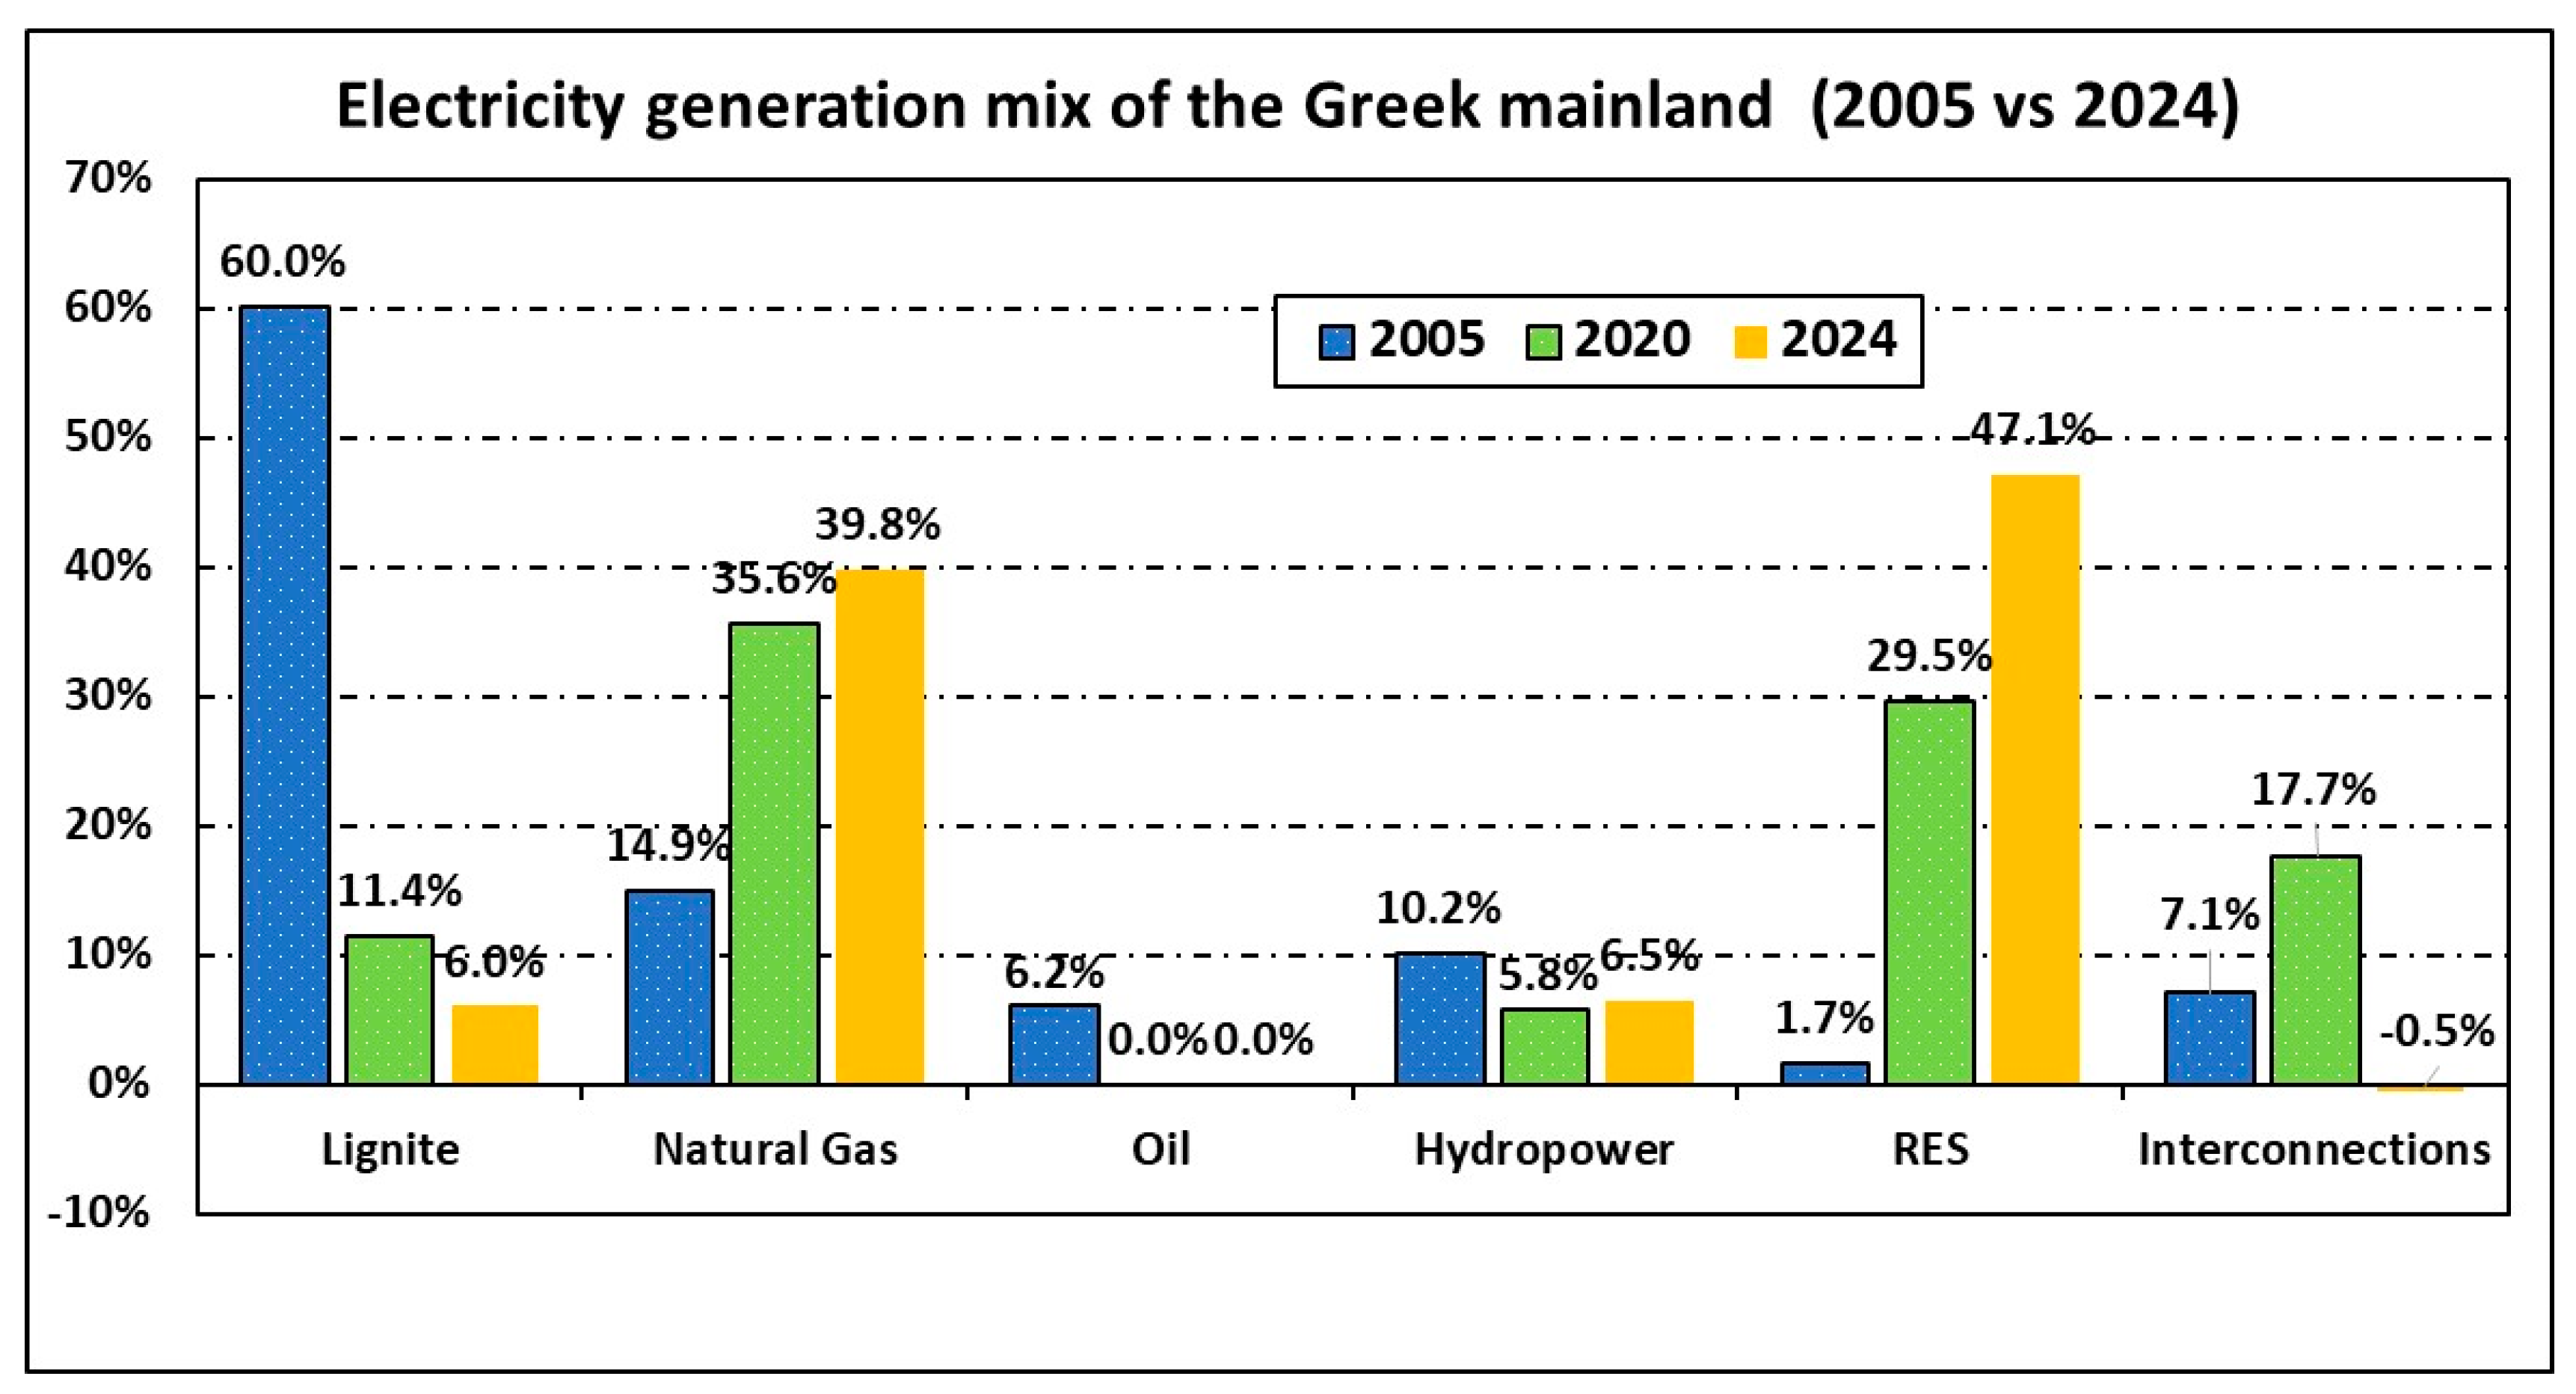
2. Hydropower in the Greek Electricity Generation System

Despite significant transformations in Greece’s energy landscape [18] and an increasing emphasis on renewable energy integration, hydropower has not seen equivalent growth. Over the past 40 years, the share of hydroelectric production in Greece’s total electricity generation has remained relatively stable, averaging around 9%, with 2024 reflecting a similar value at 8%. While hydropower remains a vital component of Greece’s energy mix, the country faces several challenges in fully realizing its potential. Key obstacles include adapting aging infrastructure to changing climatic conditions, renovating facilities and addressing complex policy and regulatory hurdles. Overcoming these barriers is critical to maximize hydropower’s benefits, not only in supporting Greece’s decarbonization efforts but also in enhancing the resilience of its energy system. This is also particularly important in mitigating the impacts of climate change-induced water scarcity and droughts, which also affect the reliability of other renewable sources [19].
In view of the Greek electricity generation sector’s decarbonization process, the final National and Climate Energy Plan (NECP), published in 2024 after the original (2019) and the revised (October 2023) versions [20], in compliance with the European Directives [21], ratified the national energy targets principally expressed through the reduction in GHG emissions by up to 58% by 2030 compared to the pertinent emissions of the reference year 2005 [20]. In 2024, the Greek electricity generation system was largely (approximately 40%) based on imported natural gas (Figure 4), with the total RES contribution, including the hydropower applications, exceeding, for the first time, 50%. The individual hydropower plants’ (both LHP and SHP) contribution was limited to almost 8.1%. On the other hand, the contribution of lignite-based power plants, which was the principal fuel for the electricity generation locomotive in the previous decades, was drastically decreased (slightly over 6% in 2024 compared to 60% in 2005) [22]. Moreover, mainly owing to the water shortage problems that plague the non-interconnected Greek islands [23], LHP plants have not been developed in their territory.
In this framework, acknowledging that significant progress has been noted in the development of solar and wind energy applications during the last decade [24,25], there exists a strong imperative for the amplification of hydropower applications’ deployment to meet the national energy targets set. The previous statement is also bolstered by the power balancing services that pumped hydro storage (PHS) stations can provide to the national electricity grid, expressed through their primary frequency control capability [26,27,28].
In view of the ratification of Greek Law 2244/1994 that firstly permitted the RES-based plants’ development by private companies, Kaldellis [19] investigated in depth the progress of the Greek hydropower applications (referring to both small- and large-scale ones) for the time period 1995–2005, also carrying out a comparison with the appropriate global and European statuses. A dedicated analysis was conducted based on long-term data from the existing hydropower plants. In turn, Farmaki et al. [29] investigated the Greek decarbonization transition process and the country’s energy policy through the prism of raising awareness on the complex issue of the need for a sustainable water resource management policy in post-lignite areas that is in compliance with the European Union (EU)’s water policy. The current work expands the research work conducted by Kaldellis [19] for the period 1995–2005, serving as a tool that provides a clear-cut picture of the hydropower applications’ evolution in Greece during the last thirty (1995–2024) years. This is the first ever systematic long-term analysis describing the energy status of all sixteen LHPs in Greece, on an annual and monthly basis, during the last thirty years. For this purpose, a flexible data methodological approach has been constructed in this sense, dealing with the research subject from an integrated energy yield perspective and thus supporting the unveiling of the specific technology’s future prospects. The extent of the data used also contributes to the strength of the present analysis, compared to previous research attempts. Hence, this paper provides an in-depth analysis of the hydroelectric production and energy storage capacity of large hydropower plants in Greece. It investigates year-to-year variations, their underlying causes, and the barriers to optimizing hydropower’s contribution to Greece’s decarbonization, sustainability and energy security goals.
The rest of the present work is organized on the following basis: Section 3 scrutinizes in depth the existing Greek LHP plants’ current status, “supported” by a graphical visualization of their geographic distribution and their fundamental technical characteristics. Next, Section 4 and Section 5 critically review the existing Greek LHP plants’ long-term contribution to the Greek electricity system, revealing the associated opportunities and challenges. In view of the PHS stations’ power balancing capability, Section 6 firstly conducts a dedicated literature review and then provides insights on their status and future prospects for the Greek electricity generation system. Finally, the worthwhile conclusions drawn set the foundations for any future work that could be carried out in the specific scientific domain.

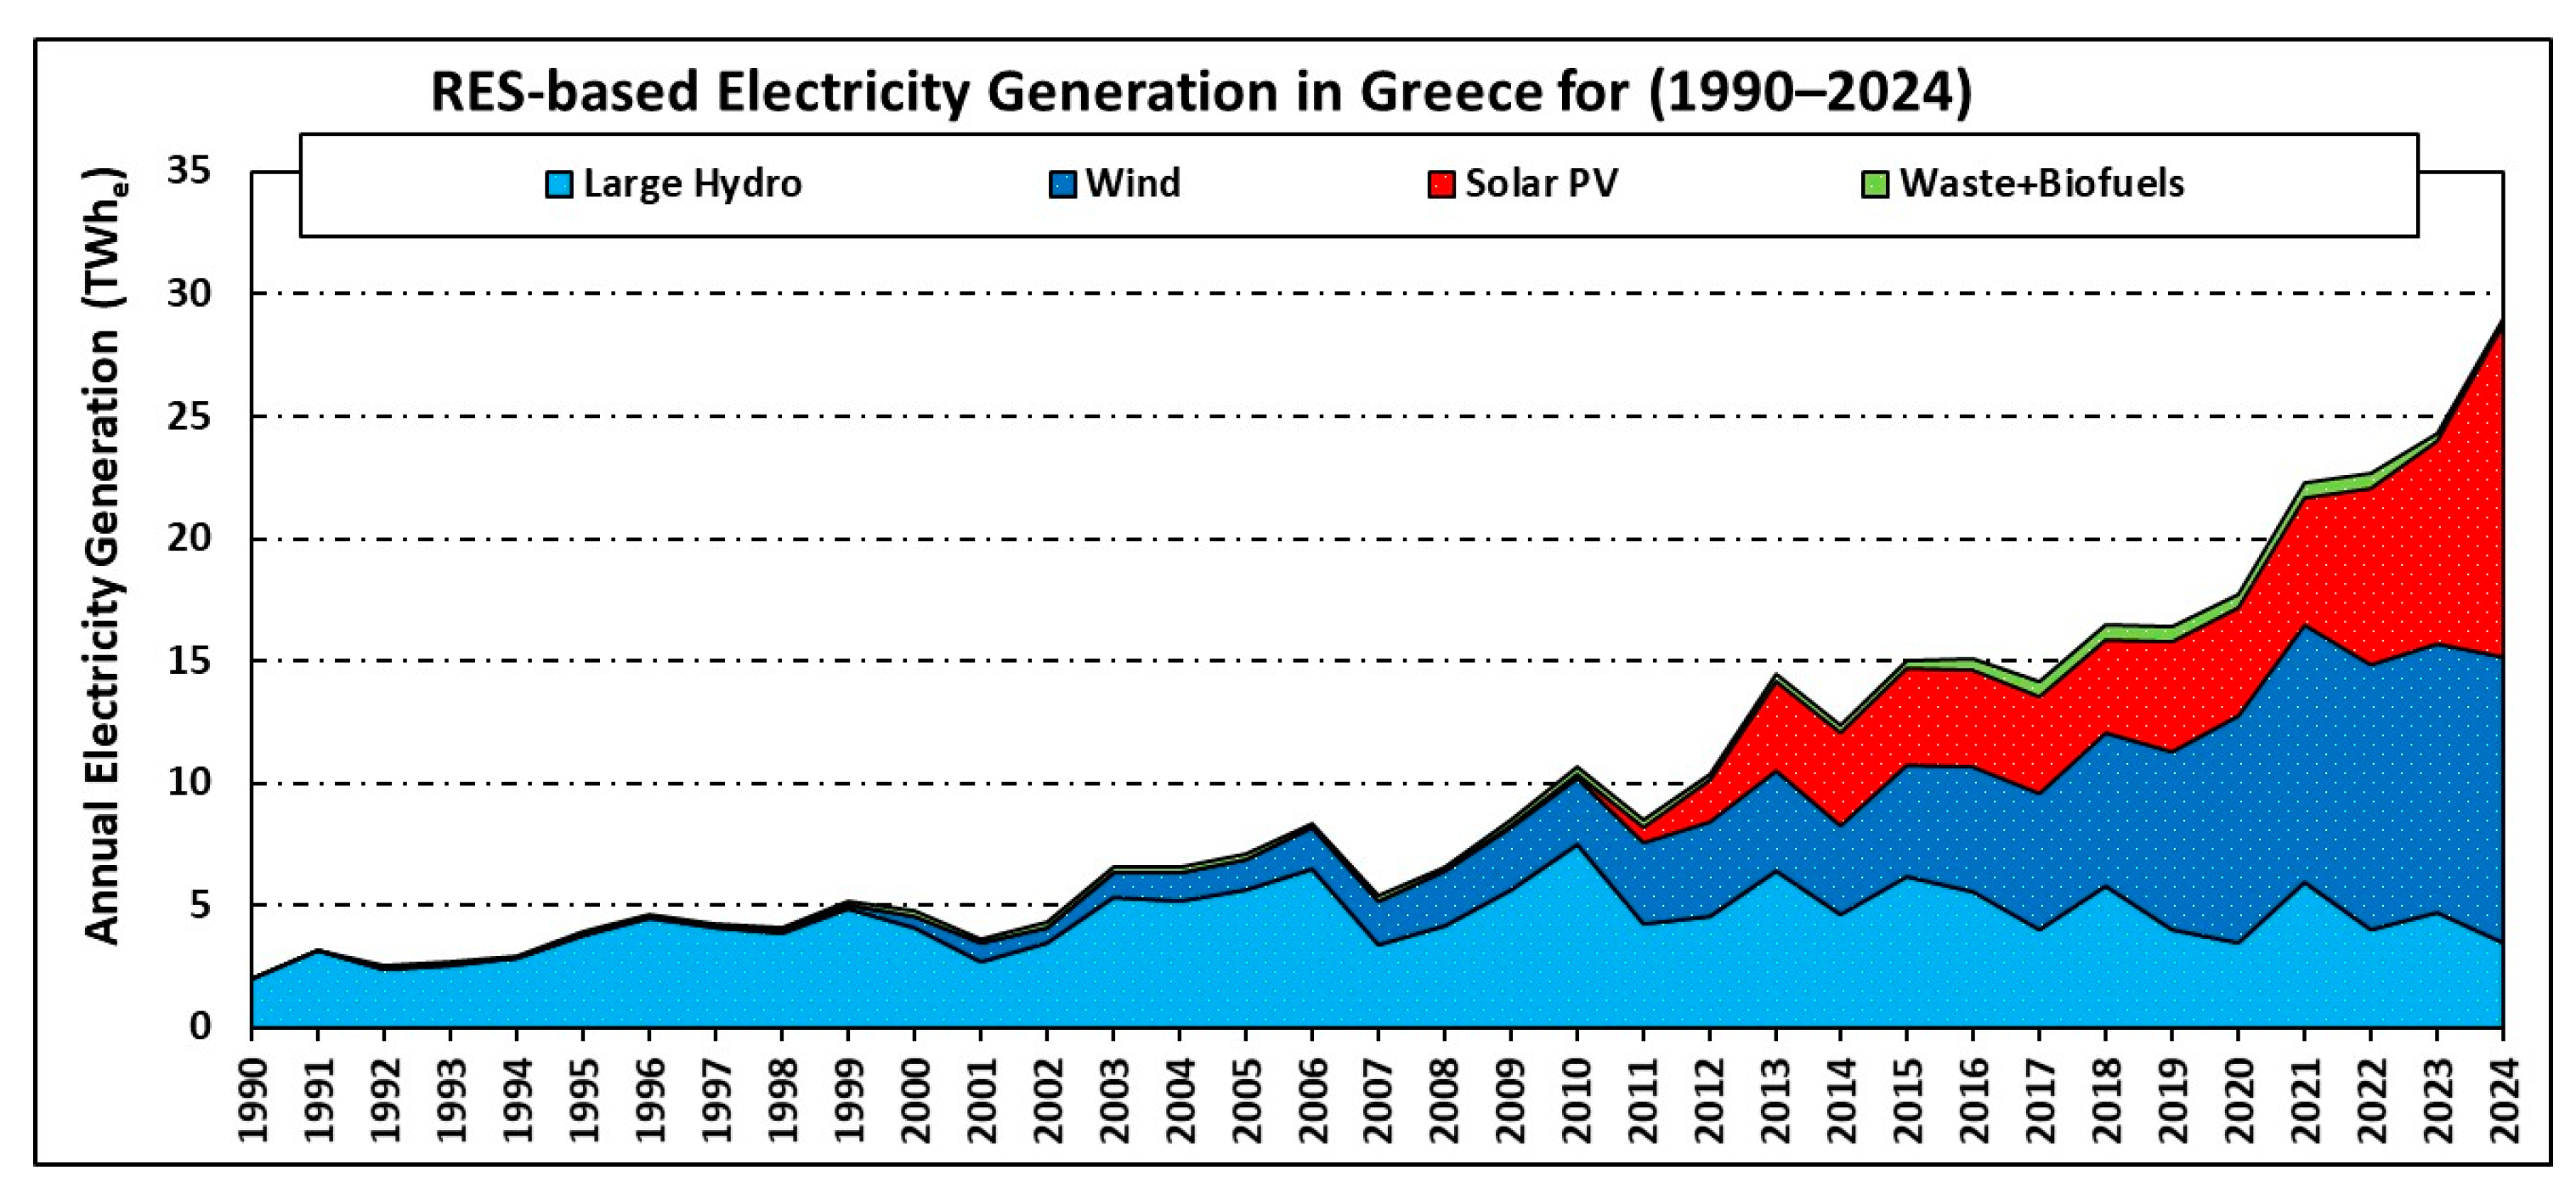
3. The Current Status of Hydropower Applications in the Greek Territory

In Greece, lignite has been the only proven, remarkable, indigenous fossil fuel source for decades [30]. Following World War II, the country deployed the project of its domestic electrification based on low-calorific-value indigenous lignite [31]. Up until 2005, this specific fuel was highly recognized for its leading role in the national electricity system’s development (accounting for an average share of 55%), boosting, in this context, the population’s standard of living [32]. Nevertheless, on top of the European climate and energy policy emergence [21] and owing also to specific attributes of the Greek political system, the use of lignite has been transformed, from a key tool for the country’s electrification, to an environmental and economic issue, having also social and political implications [31,33]. A turn to more environmentally friendly energy resources was thus rendered as an imperative and has been attempted over recent years.
Following the previous analysis, Figure 5 gives an overview of the electricity generation evolution by source in Greece as well as of the pertinent RES contributions in the time period 1990–2024. In 1990, lignite’s contribution to the total electricity generation approached 72%, whereas RESs (actually hydropower) only accounted for slightly over 5% of the total electricity generation, offering slightly above 2.1 TWhe vs. 35 TWhe of the country’s electricity production. Nonetheless, at the end of 2020, the specific figure approached 37%, while in 2024, the RES contribution exceeded 50%. Among the RESs deployed up to 2024, hydro, wind and solar energy were the main contributors (Figure 6) [20,22].
At the end of 2024 (Figure 7), the total cumulative installed LHP plants’ capacity (including PHS stations) was 3161 MWe, with 3.43 TWhe being generated (accounting for approximately 7% of the national electricity generation mix). This capacity [22] corresponds to sixteen (16) large power plants demarcated in the interconnected mainland’s electricity generation system [34], since 2013.
Numerous rivers travel across the Greek mainland, flowing out to the Aegean Sea (Figure 8), with the most important of them being cited in Table 1. Among them, it is the Acheloos River that has the most significant annual average water flow rate (approximately 190 m3 s−1), followed by the Axios River (approximately 160 m3 s−1) and the Evros and Strimon rivers (approximately 110 m3 s−1 for both of them) [19,36]. The significant flow rates of most of the Greek rivers justify the ongoing development of hydropower applications in the Greek territory and reveal the prospects for their further exploitation.
Figure 9a,b give an overview of the geographic distribution of the sixteen LHP plants installed in the Greek territory along with their main characteristics (installed capacity, start-up year, number and type of turbines and turbine head). The Agras LHP plant (with installed capacity equal to 50 MWe) was the first one erected, by the initially Greek State-controlled Public Power Corporation (PPC) S.A., in 1954. The power plant consists of two (2) Francis hydro turbines, each one with a 25 MWe nameplate capacity and a 158 m turbine head. The Kremasta LHP plant has the greatest installed capacity (437.2 MWe) and was constructed by the PPC S.A. in 1966. The specific power plant has four (4) Francis hydro turbines (each with a nameplate capacity equal to 109.3 MWe) and a turbine head of 76 m. The more recently constructed LHP plant (Ilarion LHP plant, with an installed capacity equal to 153 MWe) began its commercial operation in late 2013 [34]. With regard to their geographic distribution, half of the existing LHP plants are installed in North Greece (Macedonia), whereas each of the geographical districts of Central Greece and Epirus contains three LHP plants. Finally, the remaining two LHP plants are installed in the Peloponnesus and Thessaly regions.

4. Thirty-Year-Long Energy Analysis of the Greek Large Hydropower Plants

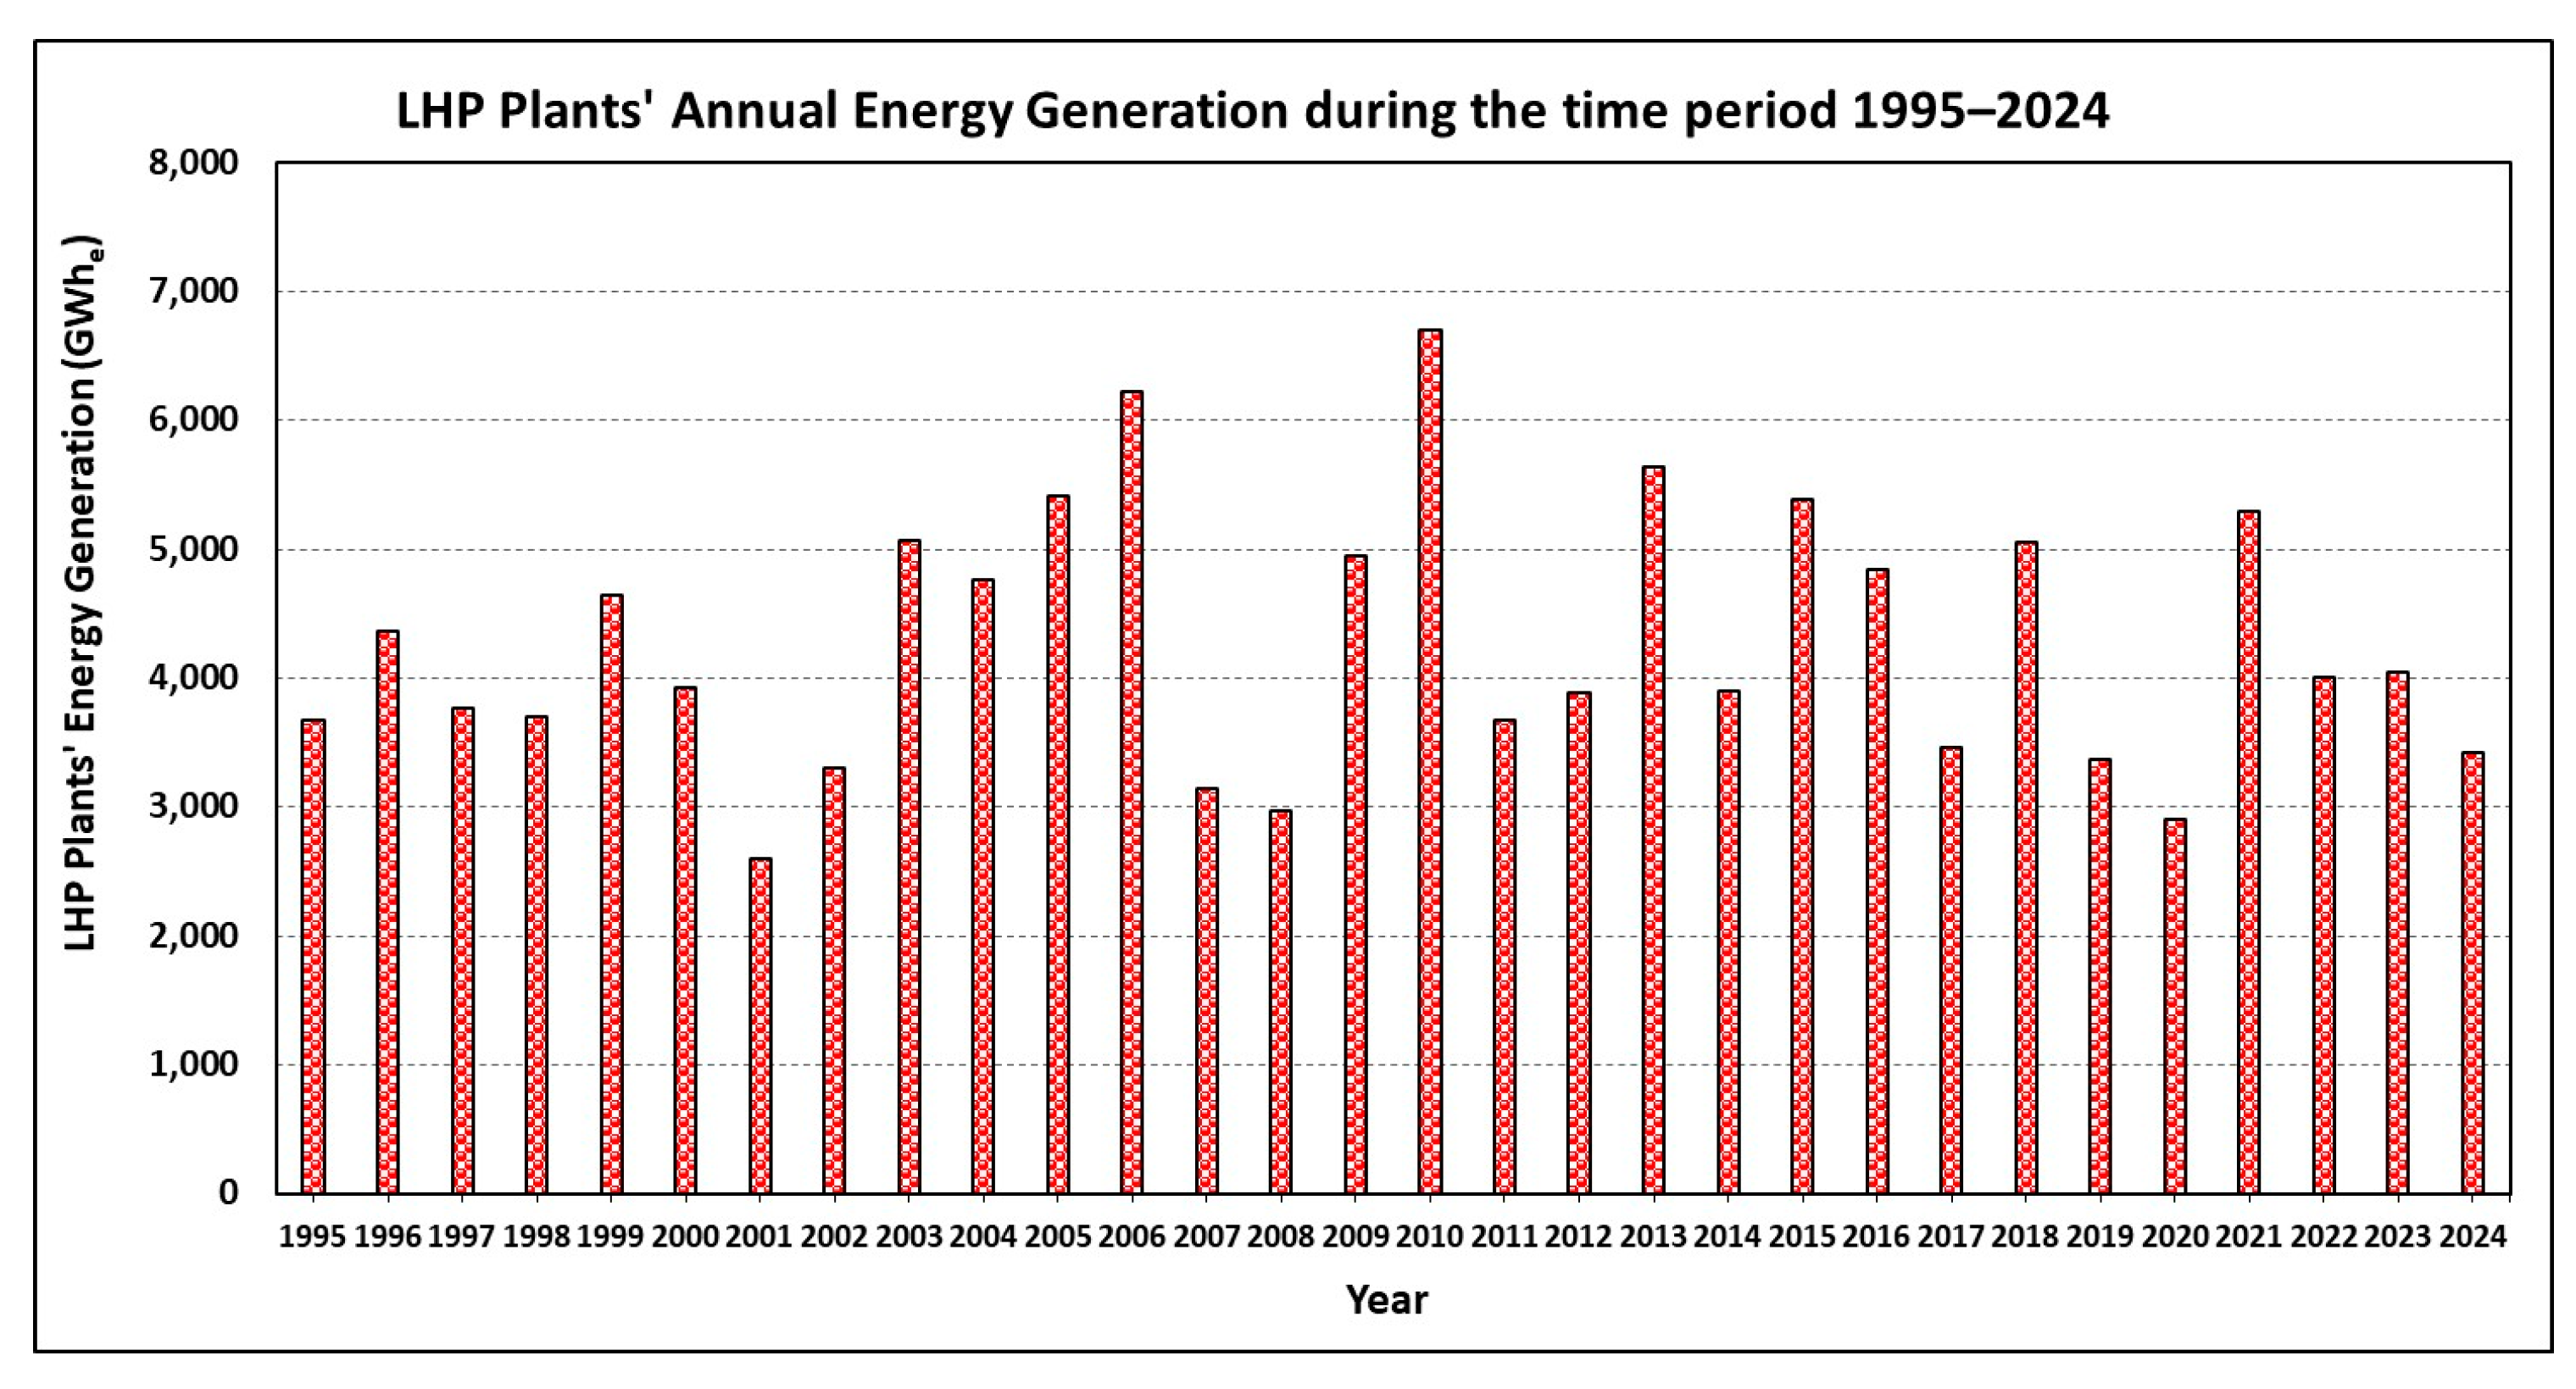
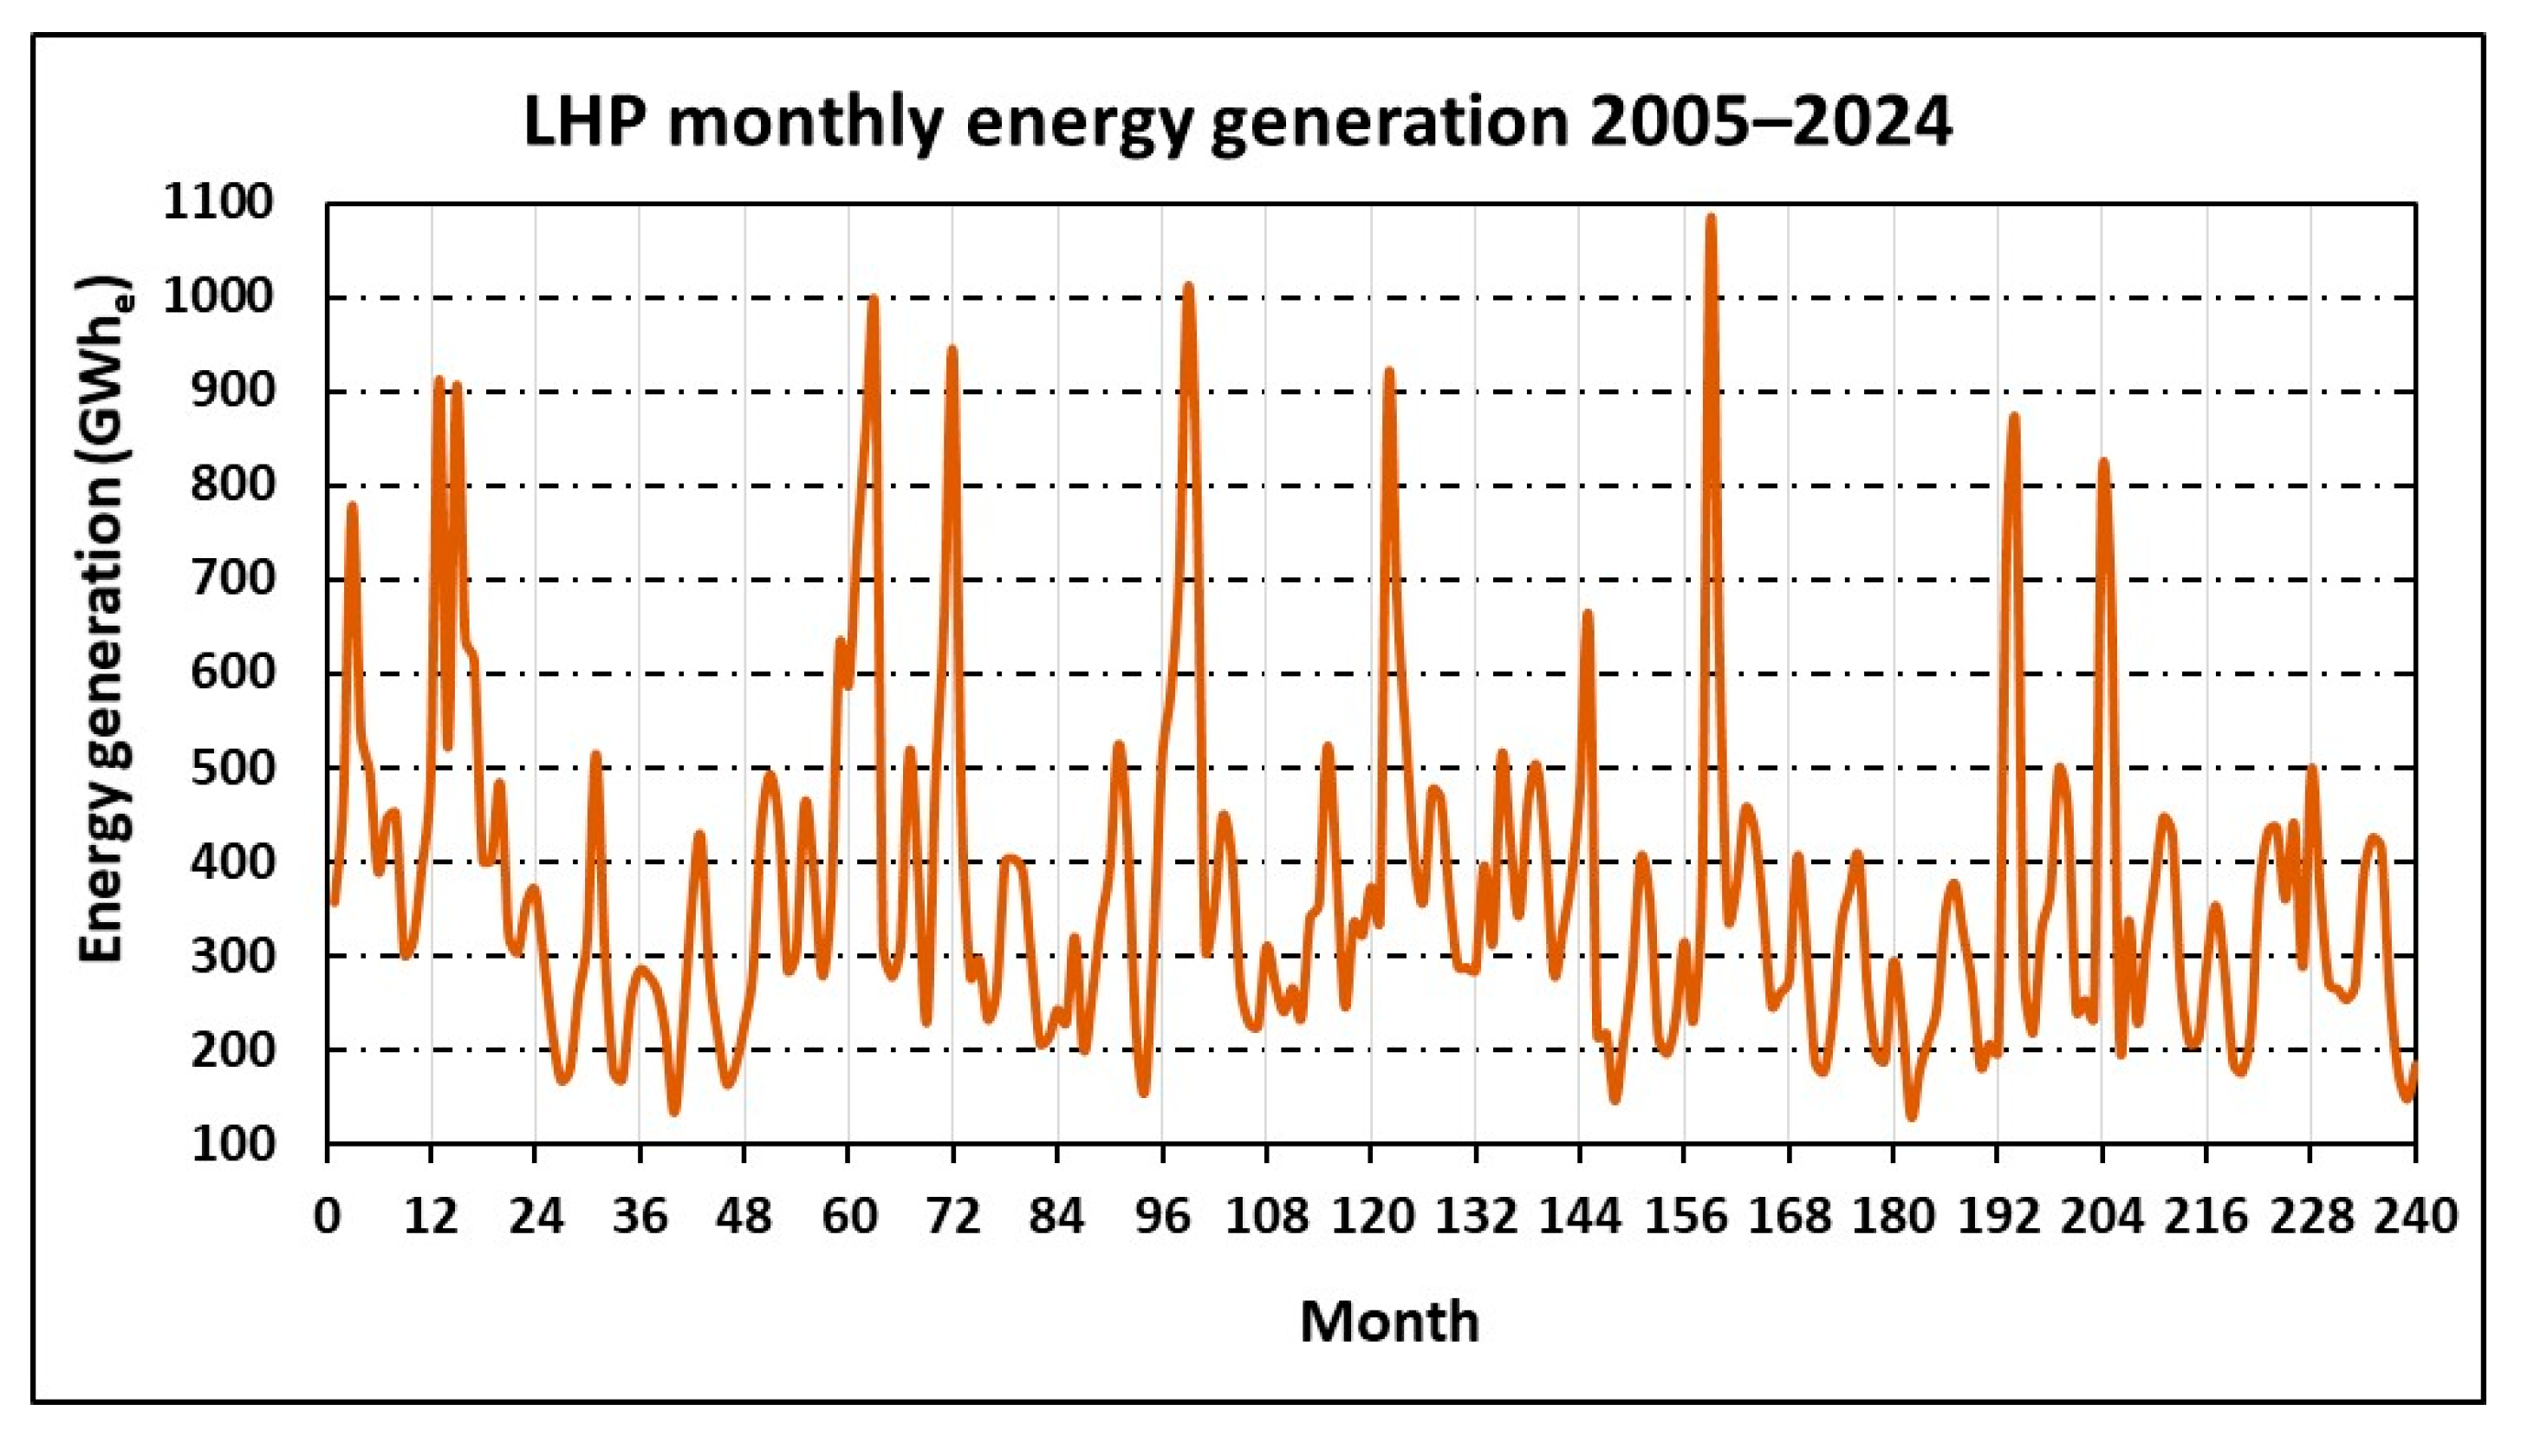
4.1. Energy Yield Time Variation

The total annual as well as the monthly electricity generation variations in the Greek LHP plants for the time period of analysis are portrayed in Figure 10 and Figure 11. Based on Figure 10, the LHP plants present a remarkable fluctuation from year to year during the entire time period of analysis. Thus, the annual electricity yield varies between 2.9 and 6.7 TWhe, while the thirty-year average is approximately 4.3 TWhe. Regarding the monthly energy generation of LHP plants (Figure 11), a significant fluctuation can be noticed, mainly related to the respective Greek mainland’s total annual energy demand fluctuation and the corresponding annual precipitation geographic variation [39] during the time period examined. More specifically, monthly energy yield values near or even more than 1 TWhe have been detected; however, the vast majority of the values obtained vary between 200 and 400 GWhe.

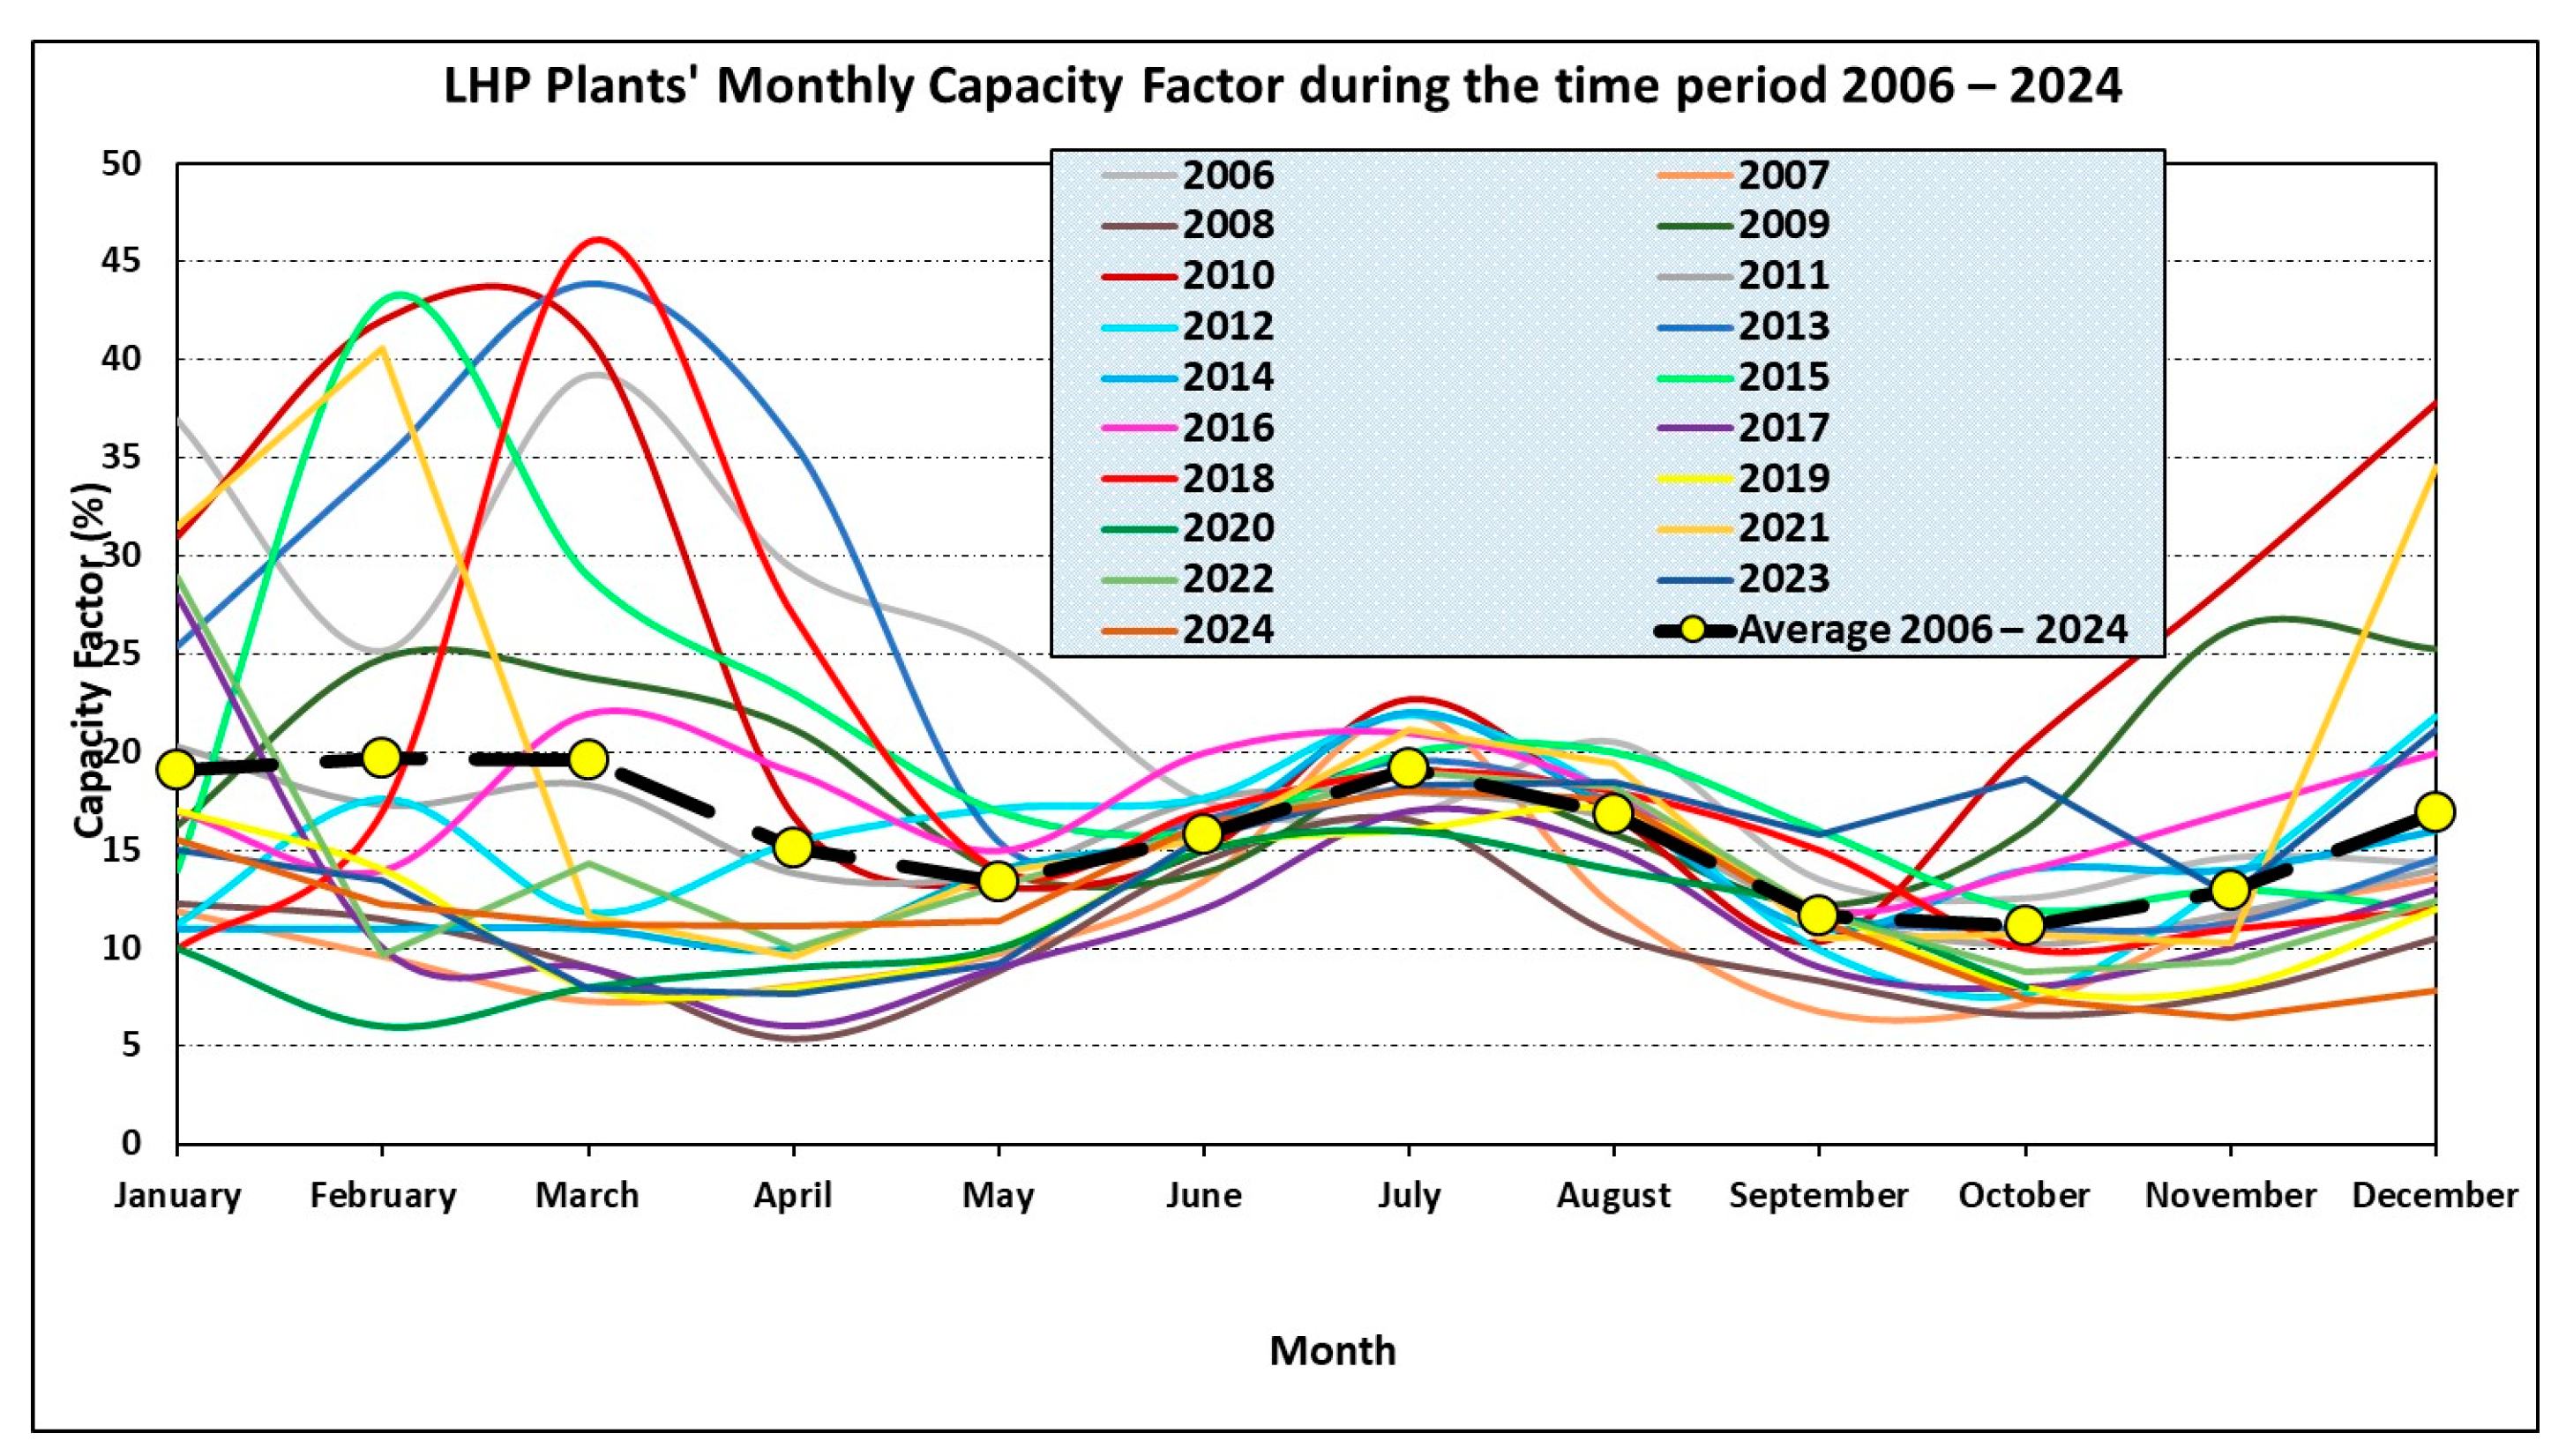
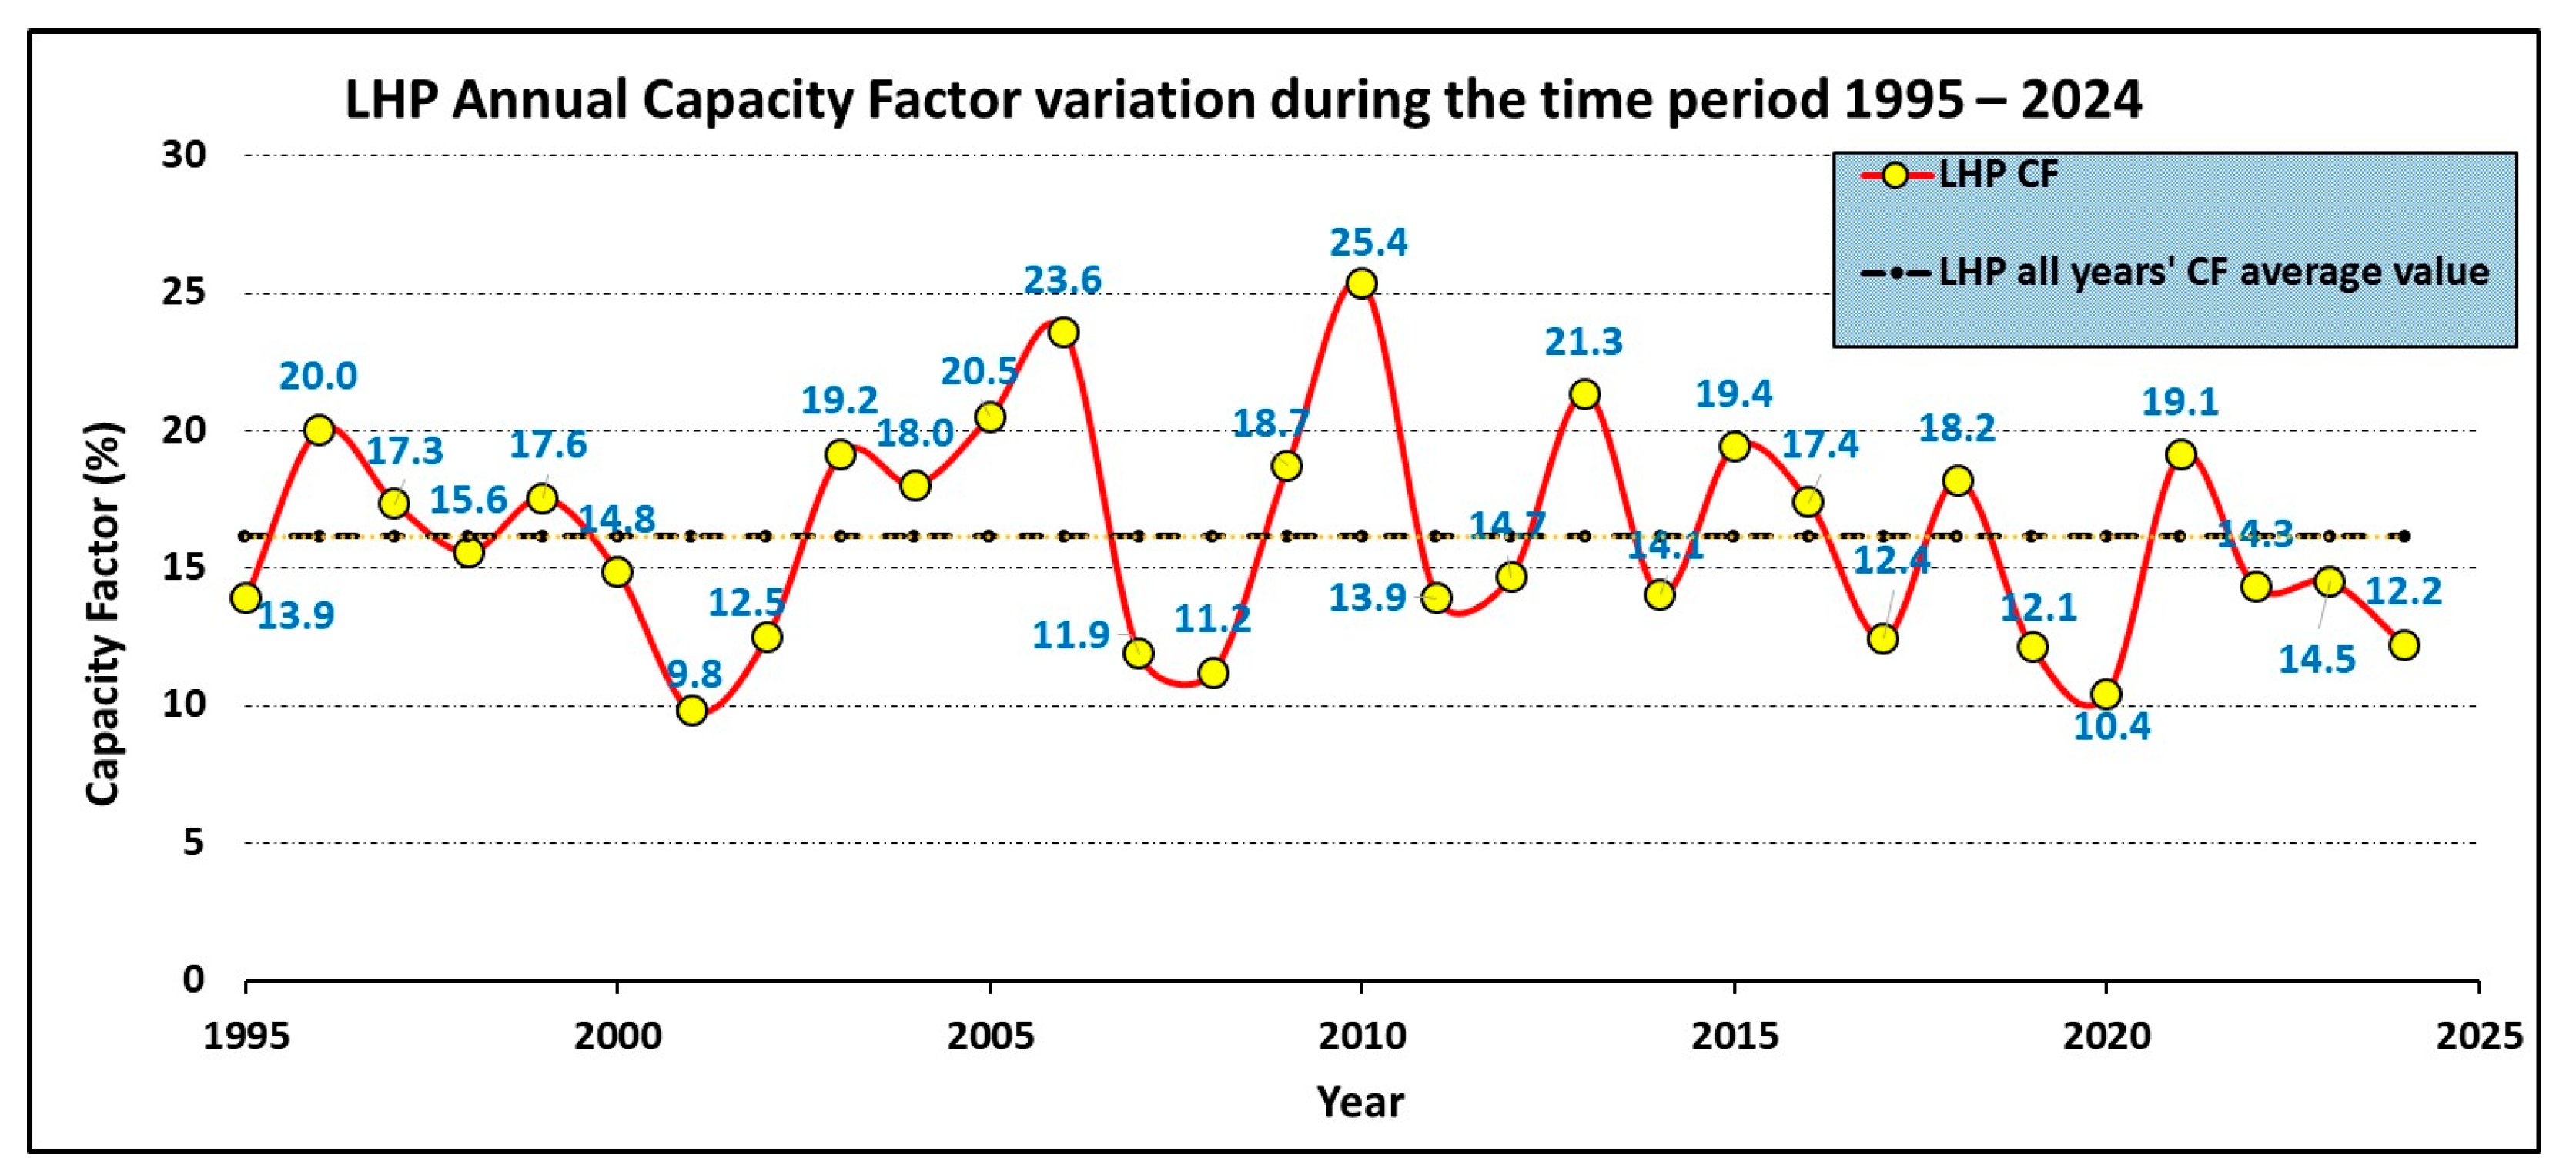
4.2. Capacity Factor Time Evolution

The utilization degree expressed via the capacity factor (CF) of a hydropower plant is considered to be one of the most critical evaluation criteria for the viability of a corresponding investment [40,41]. Actually, taking into consideration that the nominal power of the existing LHPs is given, the water flow availability is the main parameter affecting the energy yield and, thus, the capacity factor of every LHP (utilization degree). The CF of a power plant with rated power P0 for a given time period Δt can be defined using Equation (1) [19]:
C F = E ( Δ t ) P O Δ t
where E(Δt) is the power plant’s energy yield during the given time period of analysis Δt, estimated using the power plant output time distribution “P(t)”:
E Δ t = t o t o + Δ t P t . d t
Δt is the given time period (e.g., equal to 8760 h for a one-year time period (8784 h for a leap year) or equal to 720 h for a 30-day monthly period).
Figure 12 visualizes the monthly CF variation of the Greek LHP plants during the time period 2006–2024. As can be observed, in the months December to April, a remarkable fluctuation in the corresponding CF values occurs from year to year, since CF values more than double the pertinent average one can be noticed. The erstwhile deviation is smoothed in the remaining months of each year since the relevant monthly CF values are close to the average ones.
To highlight the entirely diversified exploitation of the local available hydropower potential by the Greek LHP plants, one may collate their corresponding annual CF values for the time period of analysis. The pertinent discrepancies are depicted in Figure 13. Actually, the average annual LHP plants’ CF values are in the range [10–25.5%], with the average for all thirty years of the LHP plants’ CF values being equal to 16.14%. This fairly modest long-term value can be mainly attributed to the fact that the vast majority of LHP plants are principally used to satisfy the peak load demand of the Greek interconnected electricity system [19,22], since the base load was covered for many years by local lignite (1995–2015) and recently by imported natural gas.
Moreover, the remarkable fluctuation that characterizes the monthly average energy generation of Greek LHP plants can also be detected in the corresponding monthly average CF evolution during the time period of analysis (Figure 14). More precisely, LHP plants are, to a great extent, interlinked with the total monthly national load demand, with their monthly average CF presenting significant fluctuation around the average for all months of the LHP plants’ CF values. The relevant fluctuation range for the Greek LHP plants’ monthly average CF is [11–20%]. What is really interesting is that, on top of the high CF values appearing during the rainy period (January to March), equally high values of CF appear during July, mainly due to the peak load demand of the national grid related to the mass utilization of air conditioners.

5. Thirty Years’ Long Contribution of Large Greek Hydropower Plants: Prospects and Challenges

5.1. Detailed Utilization Analysis of LHPs

Expanding the analysis further, Figure 15, Figure 16 and Figure 17 portray the annual average utilization factor, expressed via the CF (see Equation (1)), of all existing Greek LHP plants during the time period 1995–2024. To give the general outline, the annual average CF has values in the range [5–50%], underlining that the existing Greek LHP plants present considerably variable annual energy generation. The long-term thirty-year average CF value of all LHP plants is equal to 16.14% (being meanwhile quite low compared to the International Standards [19]).
Furthermore, categorizing the existing LHP plants based on the river basin (Figure 8 and Figure 9) on which each one of them is erected, one can notice the following:
(a)
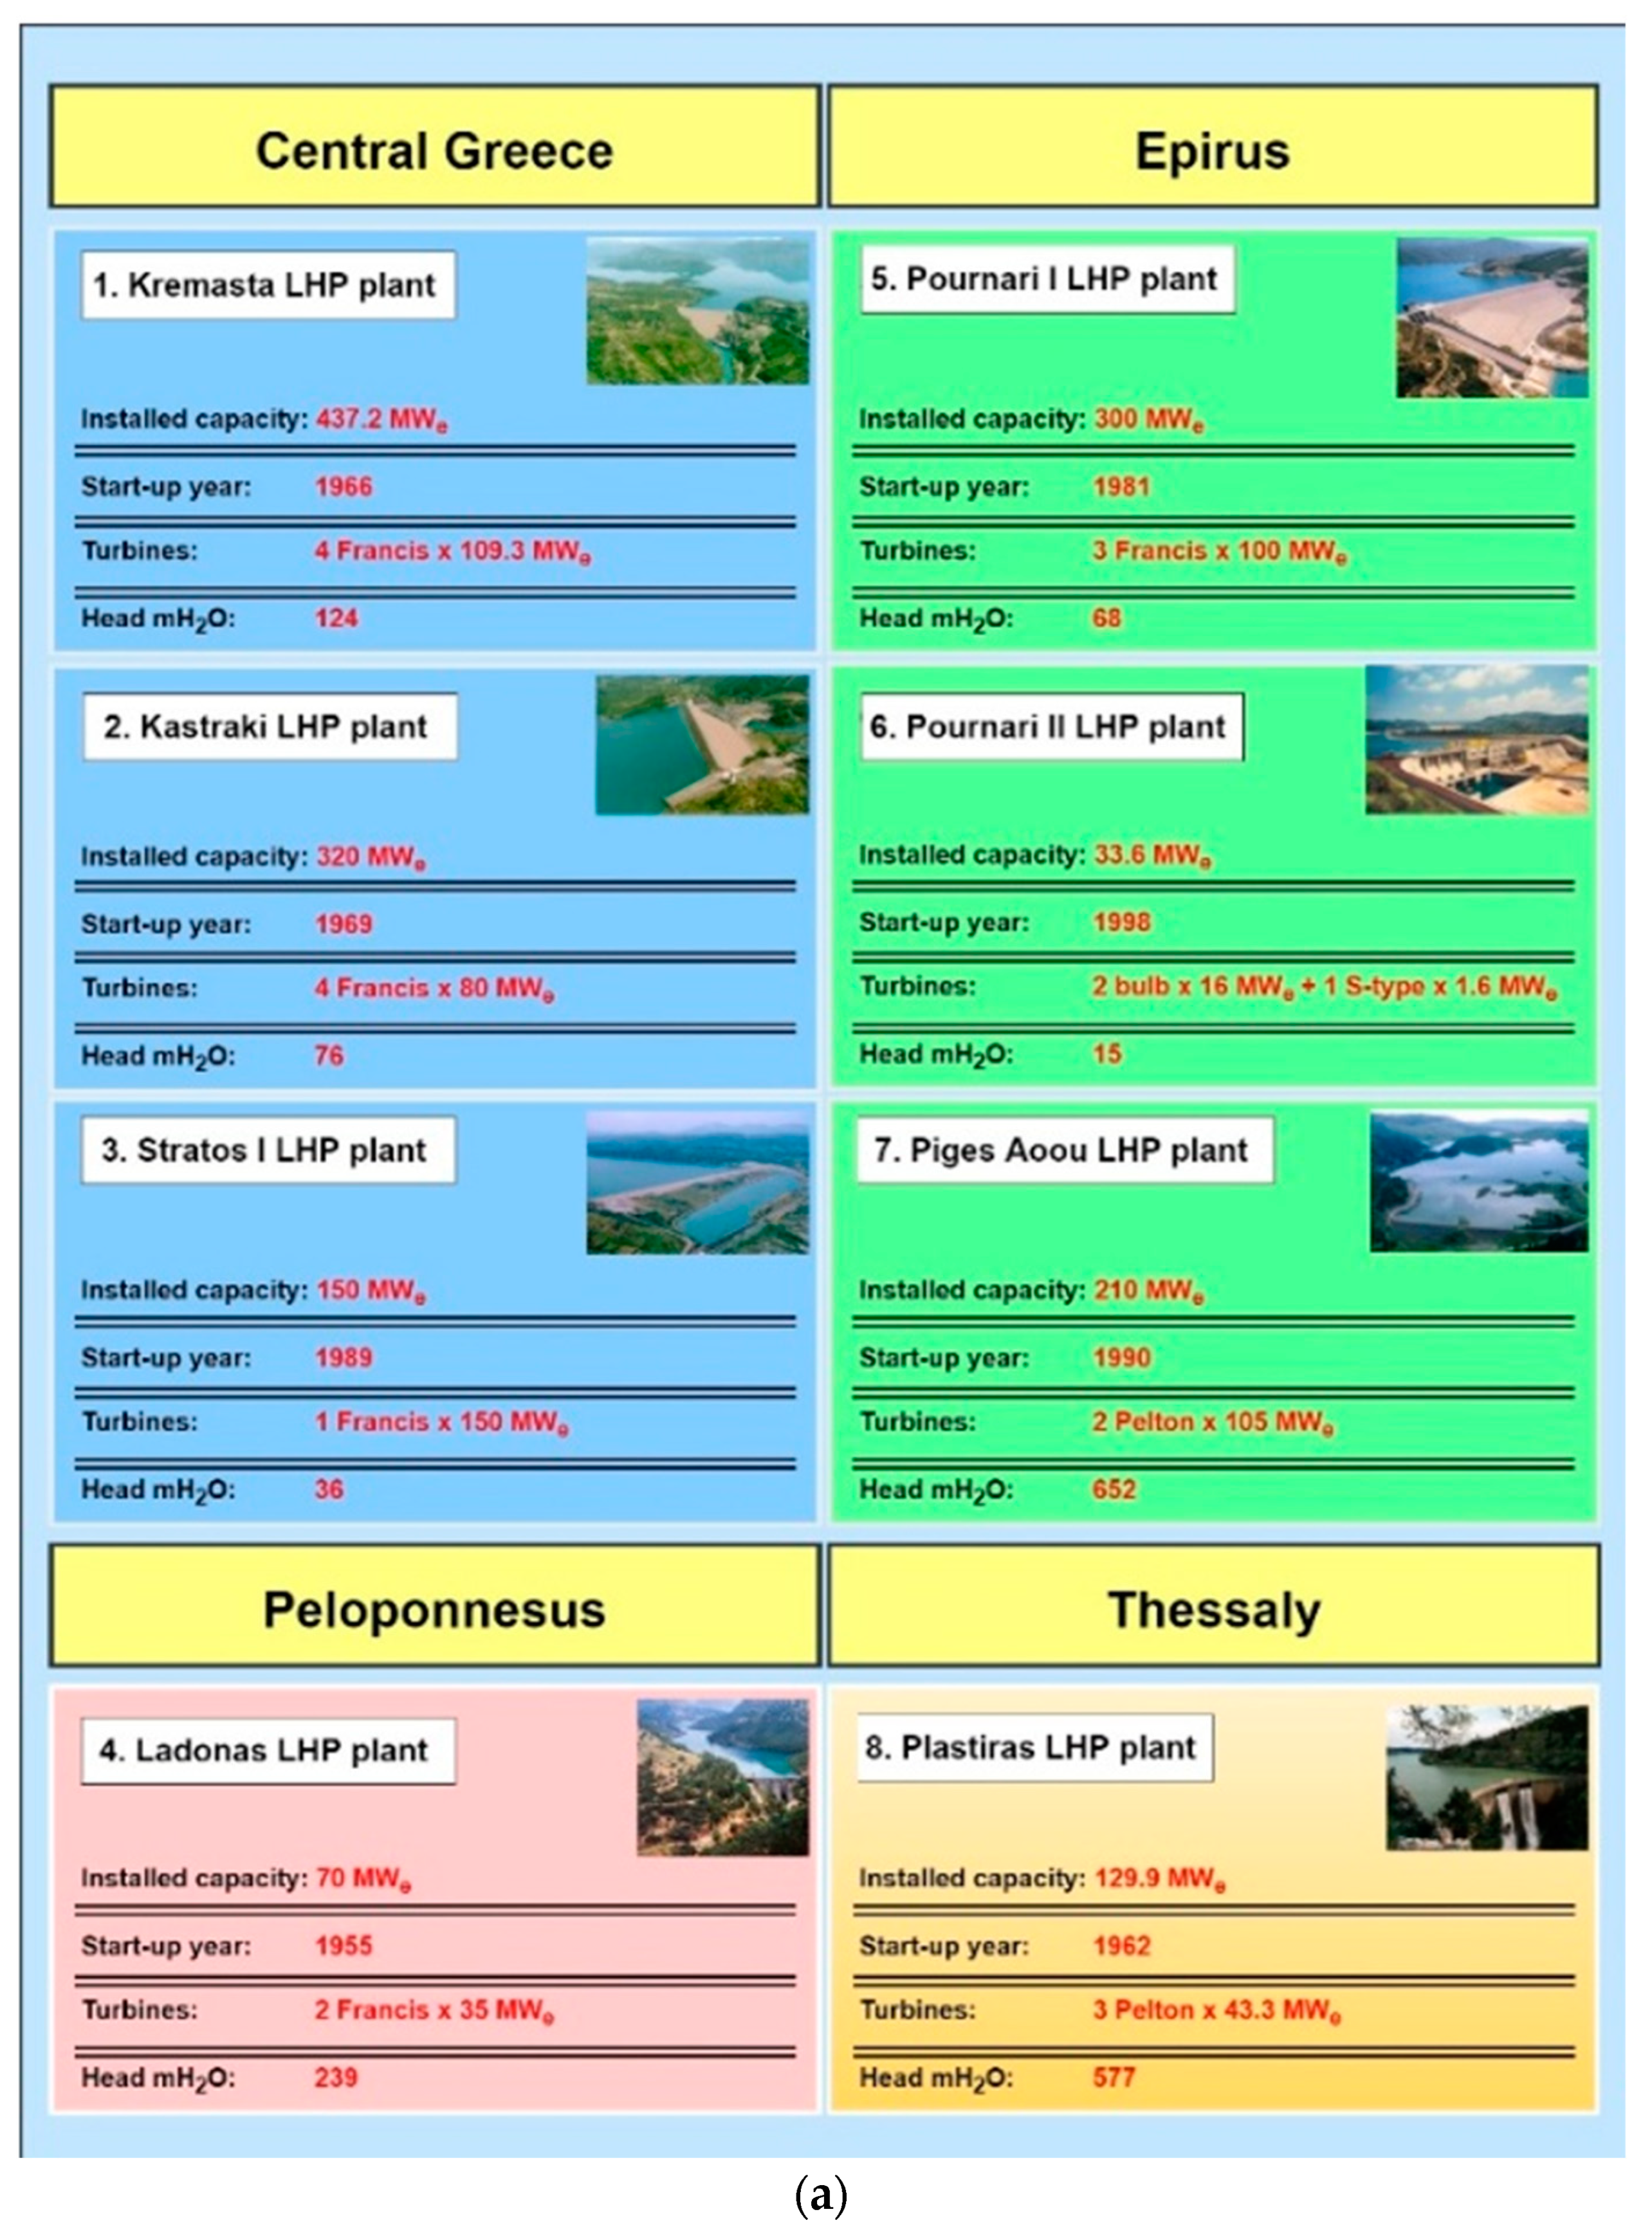
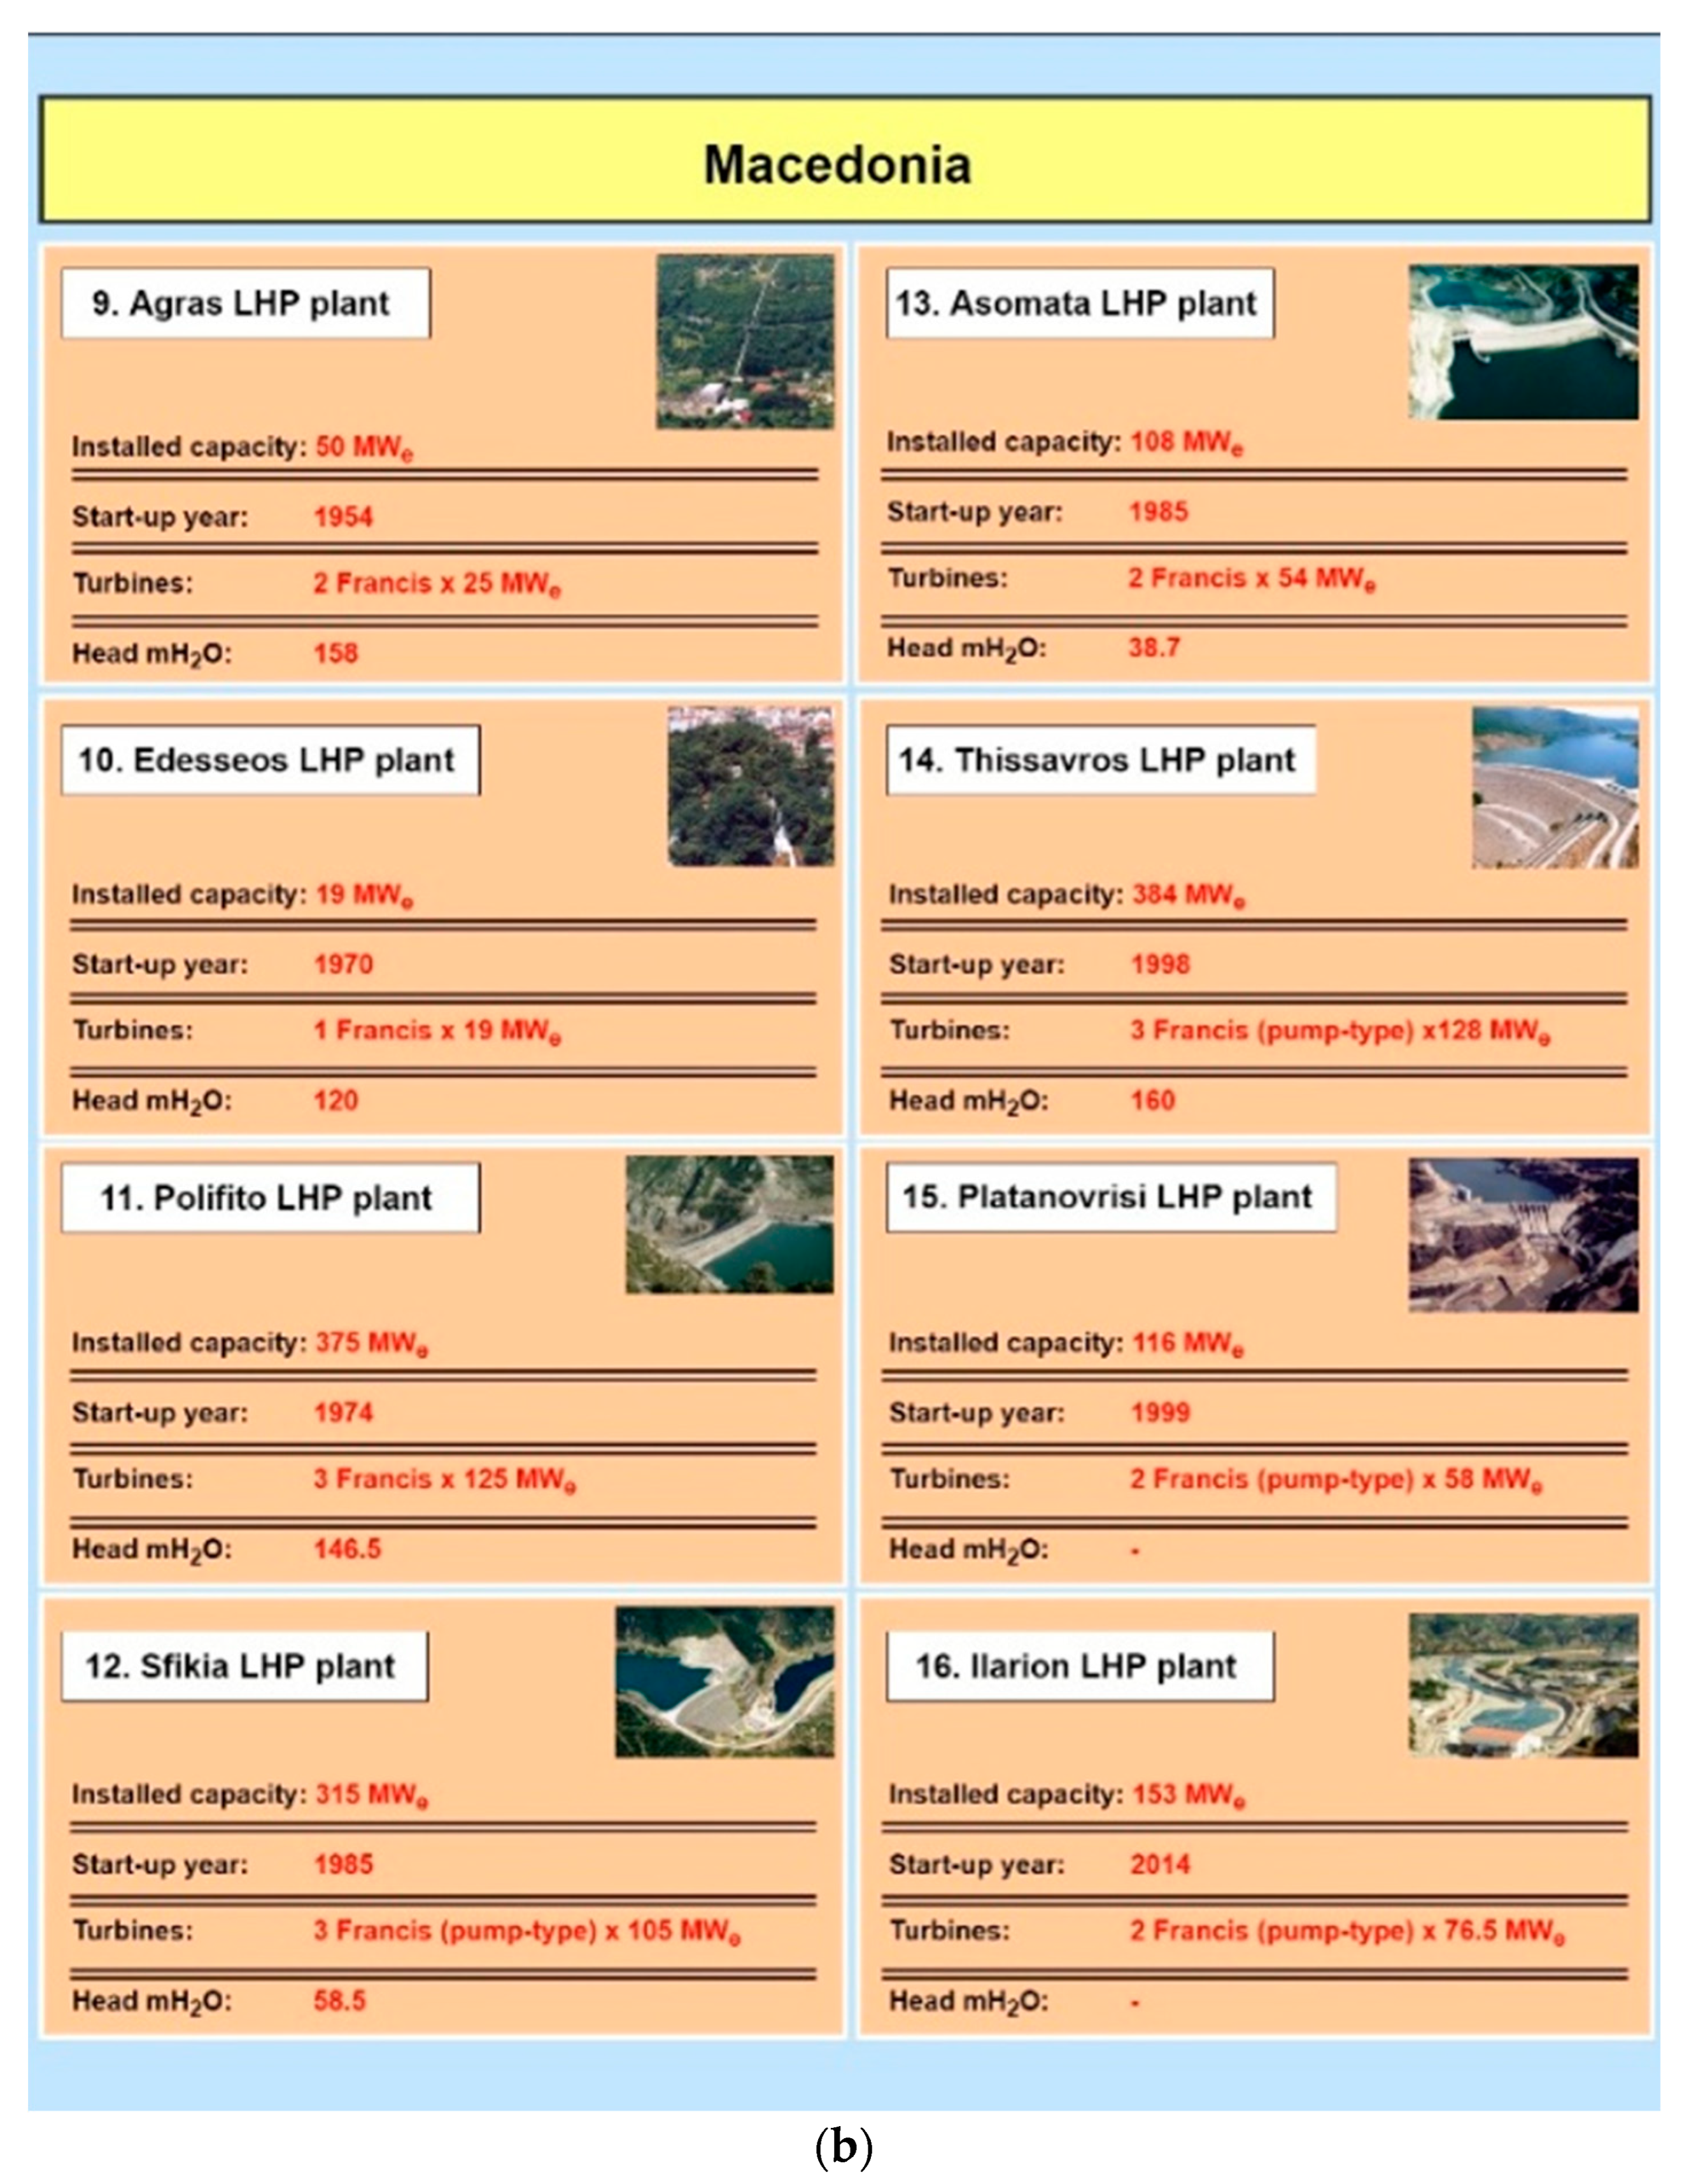
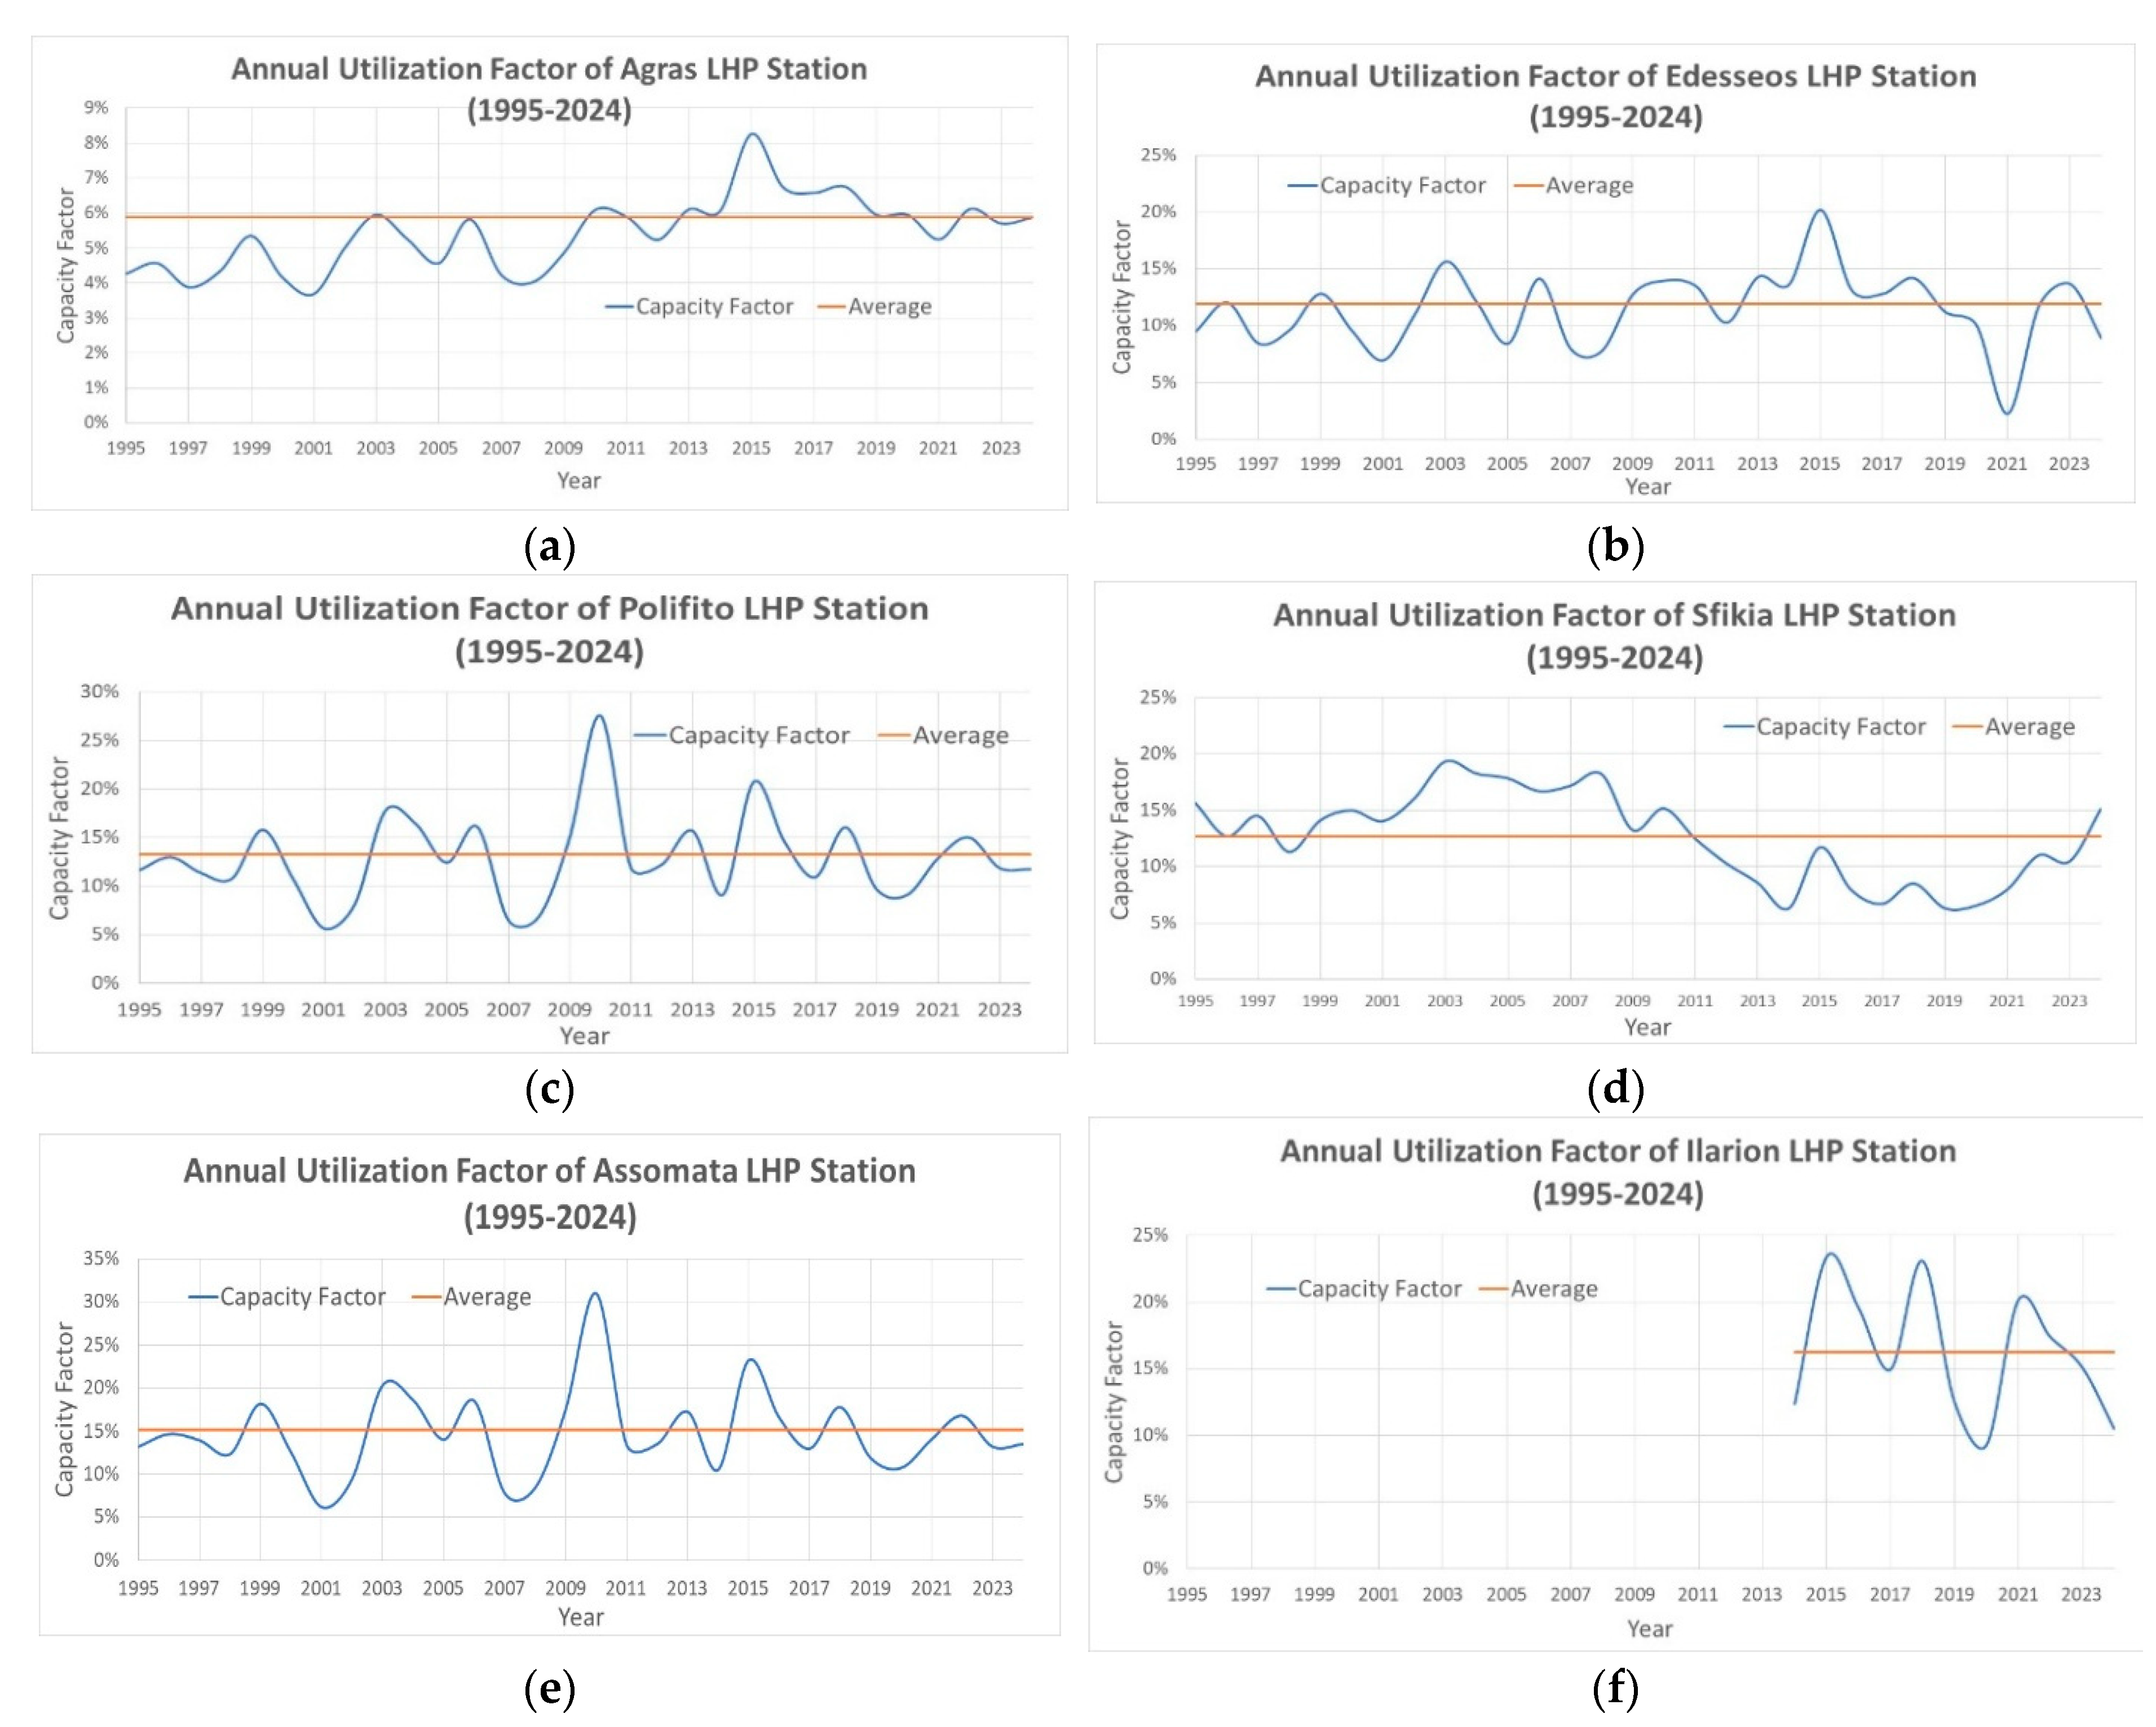
The Aliakmon River basin contains the LHP plants of Agras (50 MWe), Assomata (108 MWe), Edesseos (19 MWe), Ilarion (153 MWe), Polifito (375 MWe) and Sfikia (315 MWe) (Figure 15). Note that Agras and Edesseos LHP stations have been erected on the Edesseos River, which is a tributary that terminates at the Aliakmon River after the LHP of Sfikia. The quite low long-term utilization degree of the Agras (the oldest Greek LHP erected in 1954) and Edesseos LHP plants (in the order of 5% and 10%, respectively) is worthwhile to notice, since these LHP plants, despite the fact that they were erected for serving an electricity generation scope, have been mainly operated for irrigation activities of the local communities.
On the other hand, the almost similar performance of the Polifito and Sfikia LHP plants is also noticeable, since the Sfikia LHP plant can also operate as a PHS station (see also Section 6.2). Albeit the small discrepancies noted among their annual average CF values, their long-term average CF value is the same (approximating 13%), underlining the highly common utilization pattern implemented by the incumbent authorities. The Assomata LHP has almost the same CF time variation as the LHP of Polifito, being the last one sitted of the four LHPs in the (end of) Aliakmon River basin. Finally, the Ilarion LHP is the first one sitted (near Aliakmon source) of the abovementioned four LHPs, having started its commercial operation at the end of 2013 and presenting similar CF variations to those of the Polifito and Assomata LHPs.
(b)
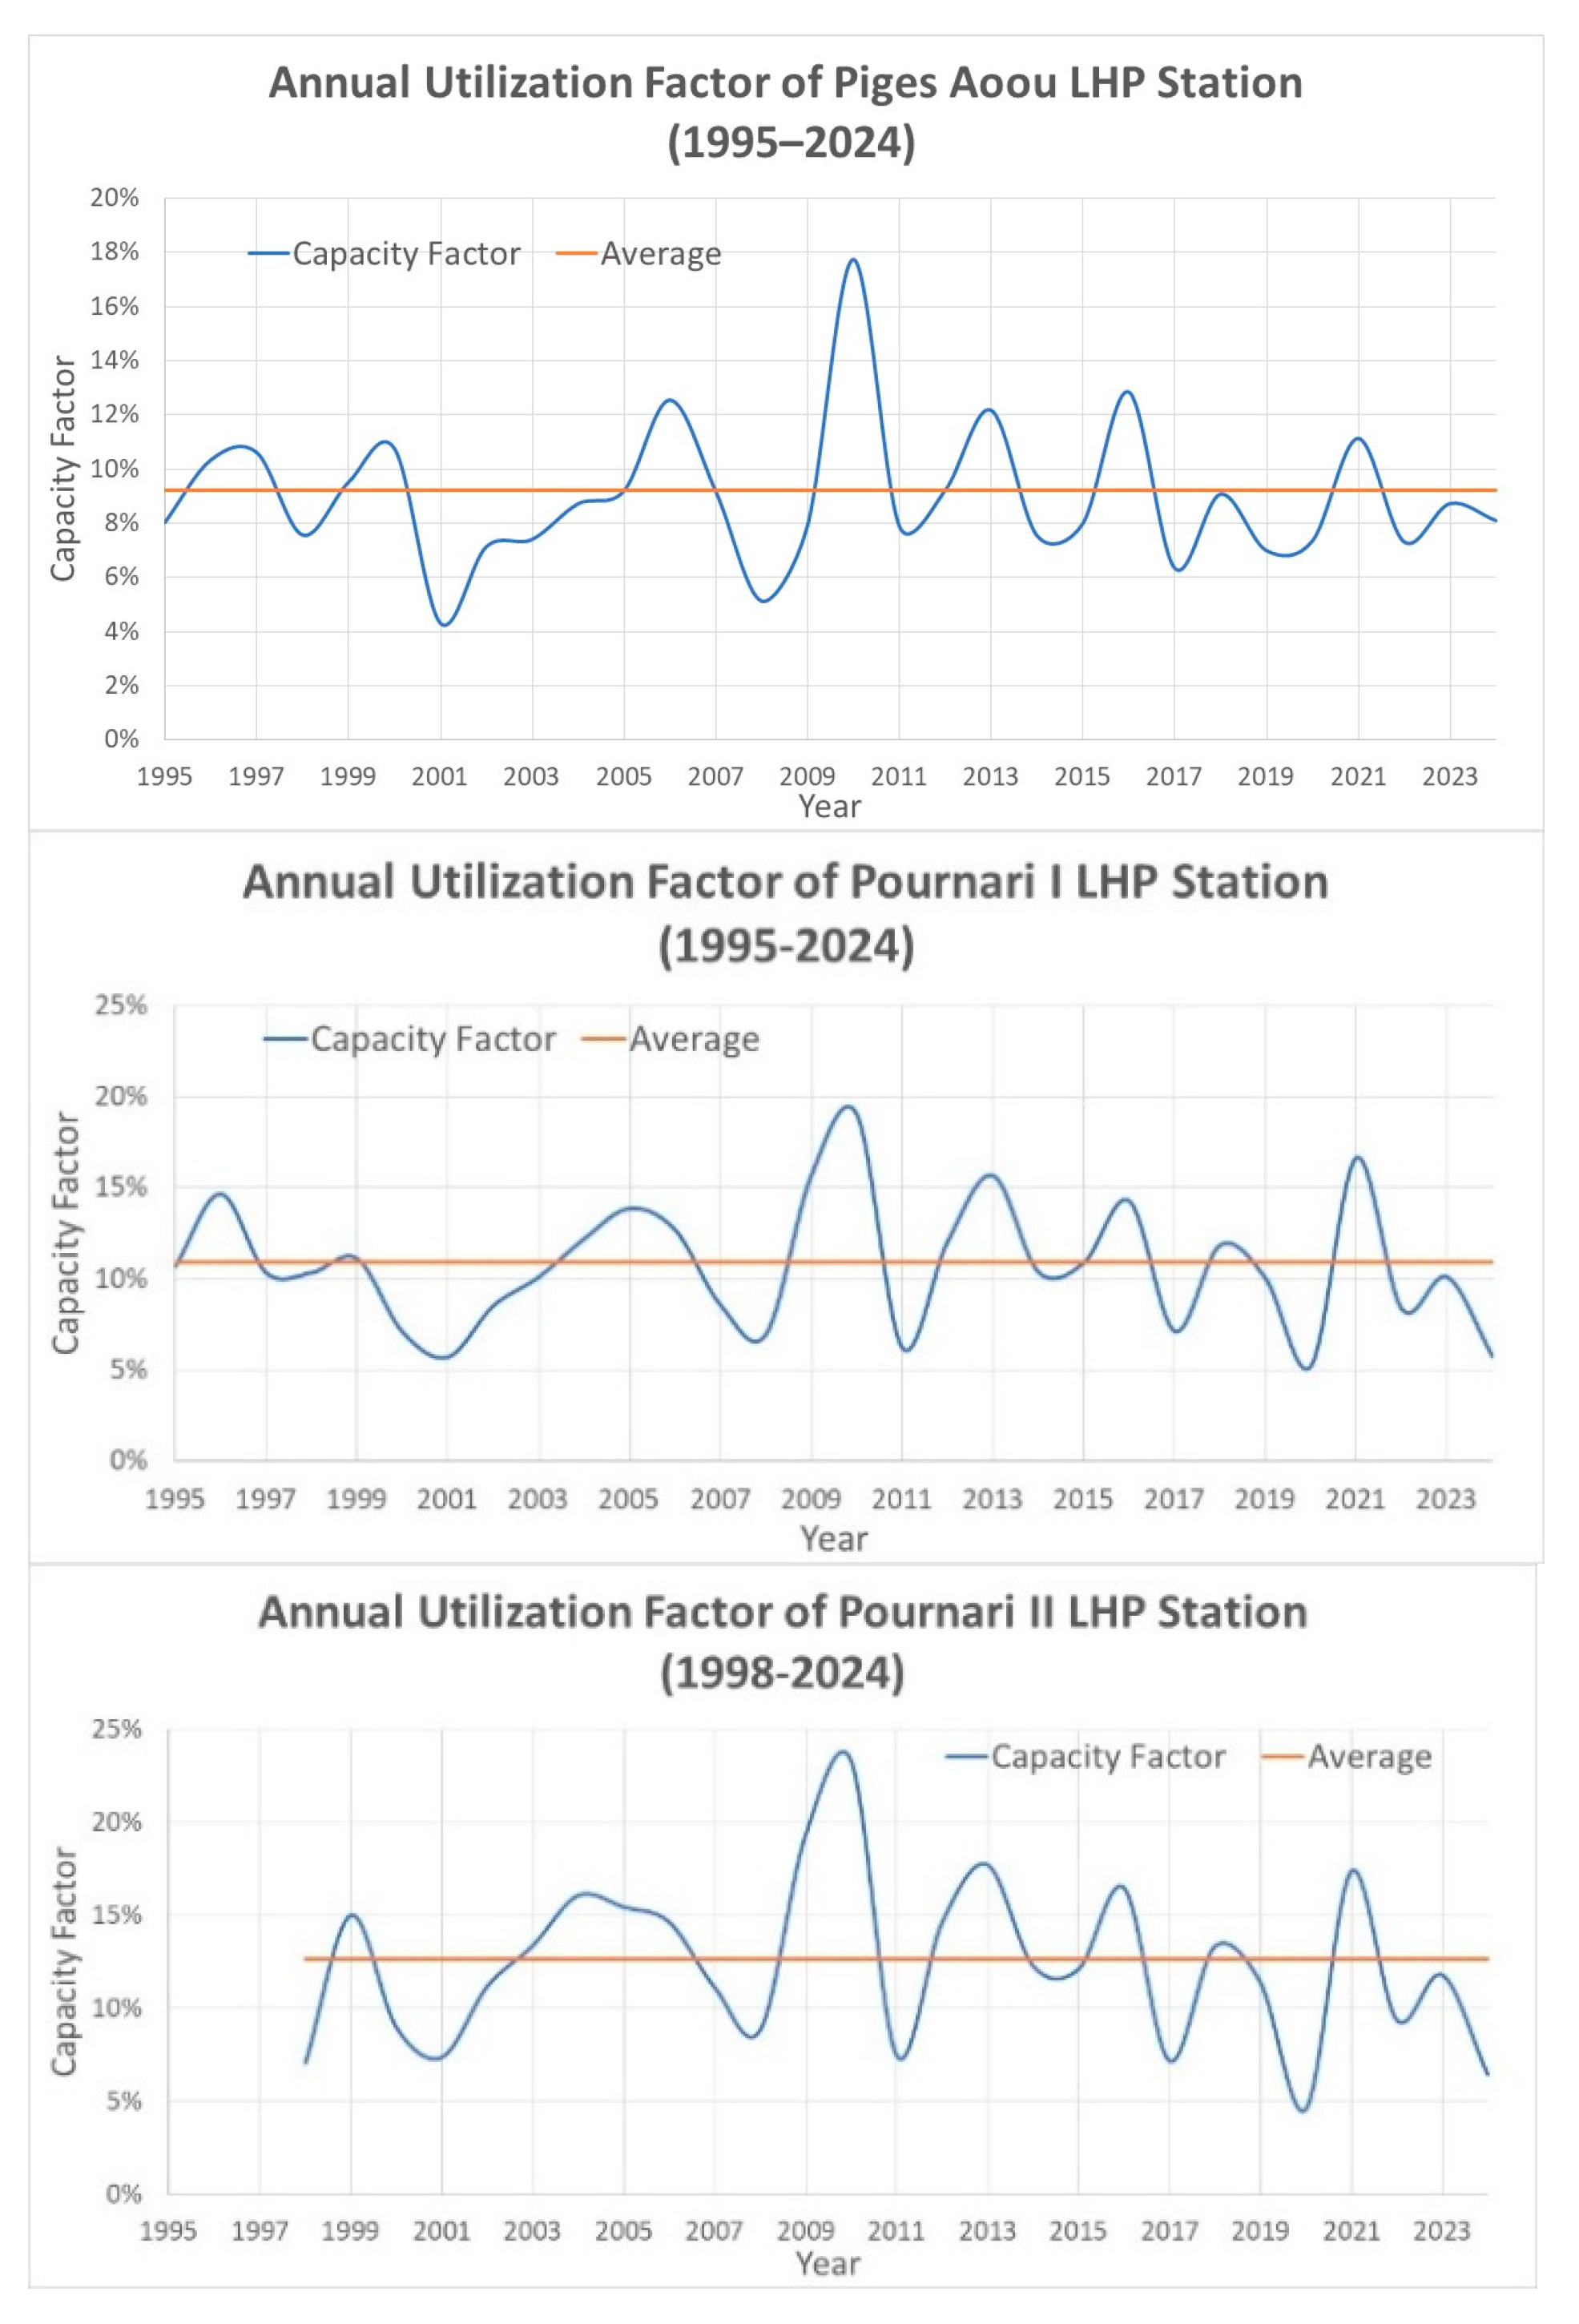
The Arachthos River basin, being in the western part of Greece, contains the LHP plants of Piges Aoou (210 MWe), Pournari I (300 MWe), and Pournari II (33.6 MWe) (Figure 16). Pournari II is the smallest and the youngest one, having started its operation in 1998, and it is the last on the Arachthos River and presents the highest (13%) utilization factor in comparison with the other two LHPs. The three annual average CF curves follow the same pattern, fluctuating almost entirely below the long-term average value (16.14%). The long-term average CF values for the three LHP plants are approximately 9%, 11% and 13%, correspondingly.
(c)
The Achelous River basin, also in the western part of Greece, includes the biggest LHP plant, of Kremasta (437.2 MWe), and the LHPs of Kastraki (320 MWe) and Stratos I (150 MWe) (Figure 17). The LHP plants of the specific river basin are characterized by remarkably increased annual average CF values compared to the long-term average (16.14%), underlining the quite significant exploitation of the corresponding local hydropower potential. Suffice it to say that their long-term annual average CF values are in the order of 21–23%, and they present almost the same time variation for the entire thirty-year period.
(d)
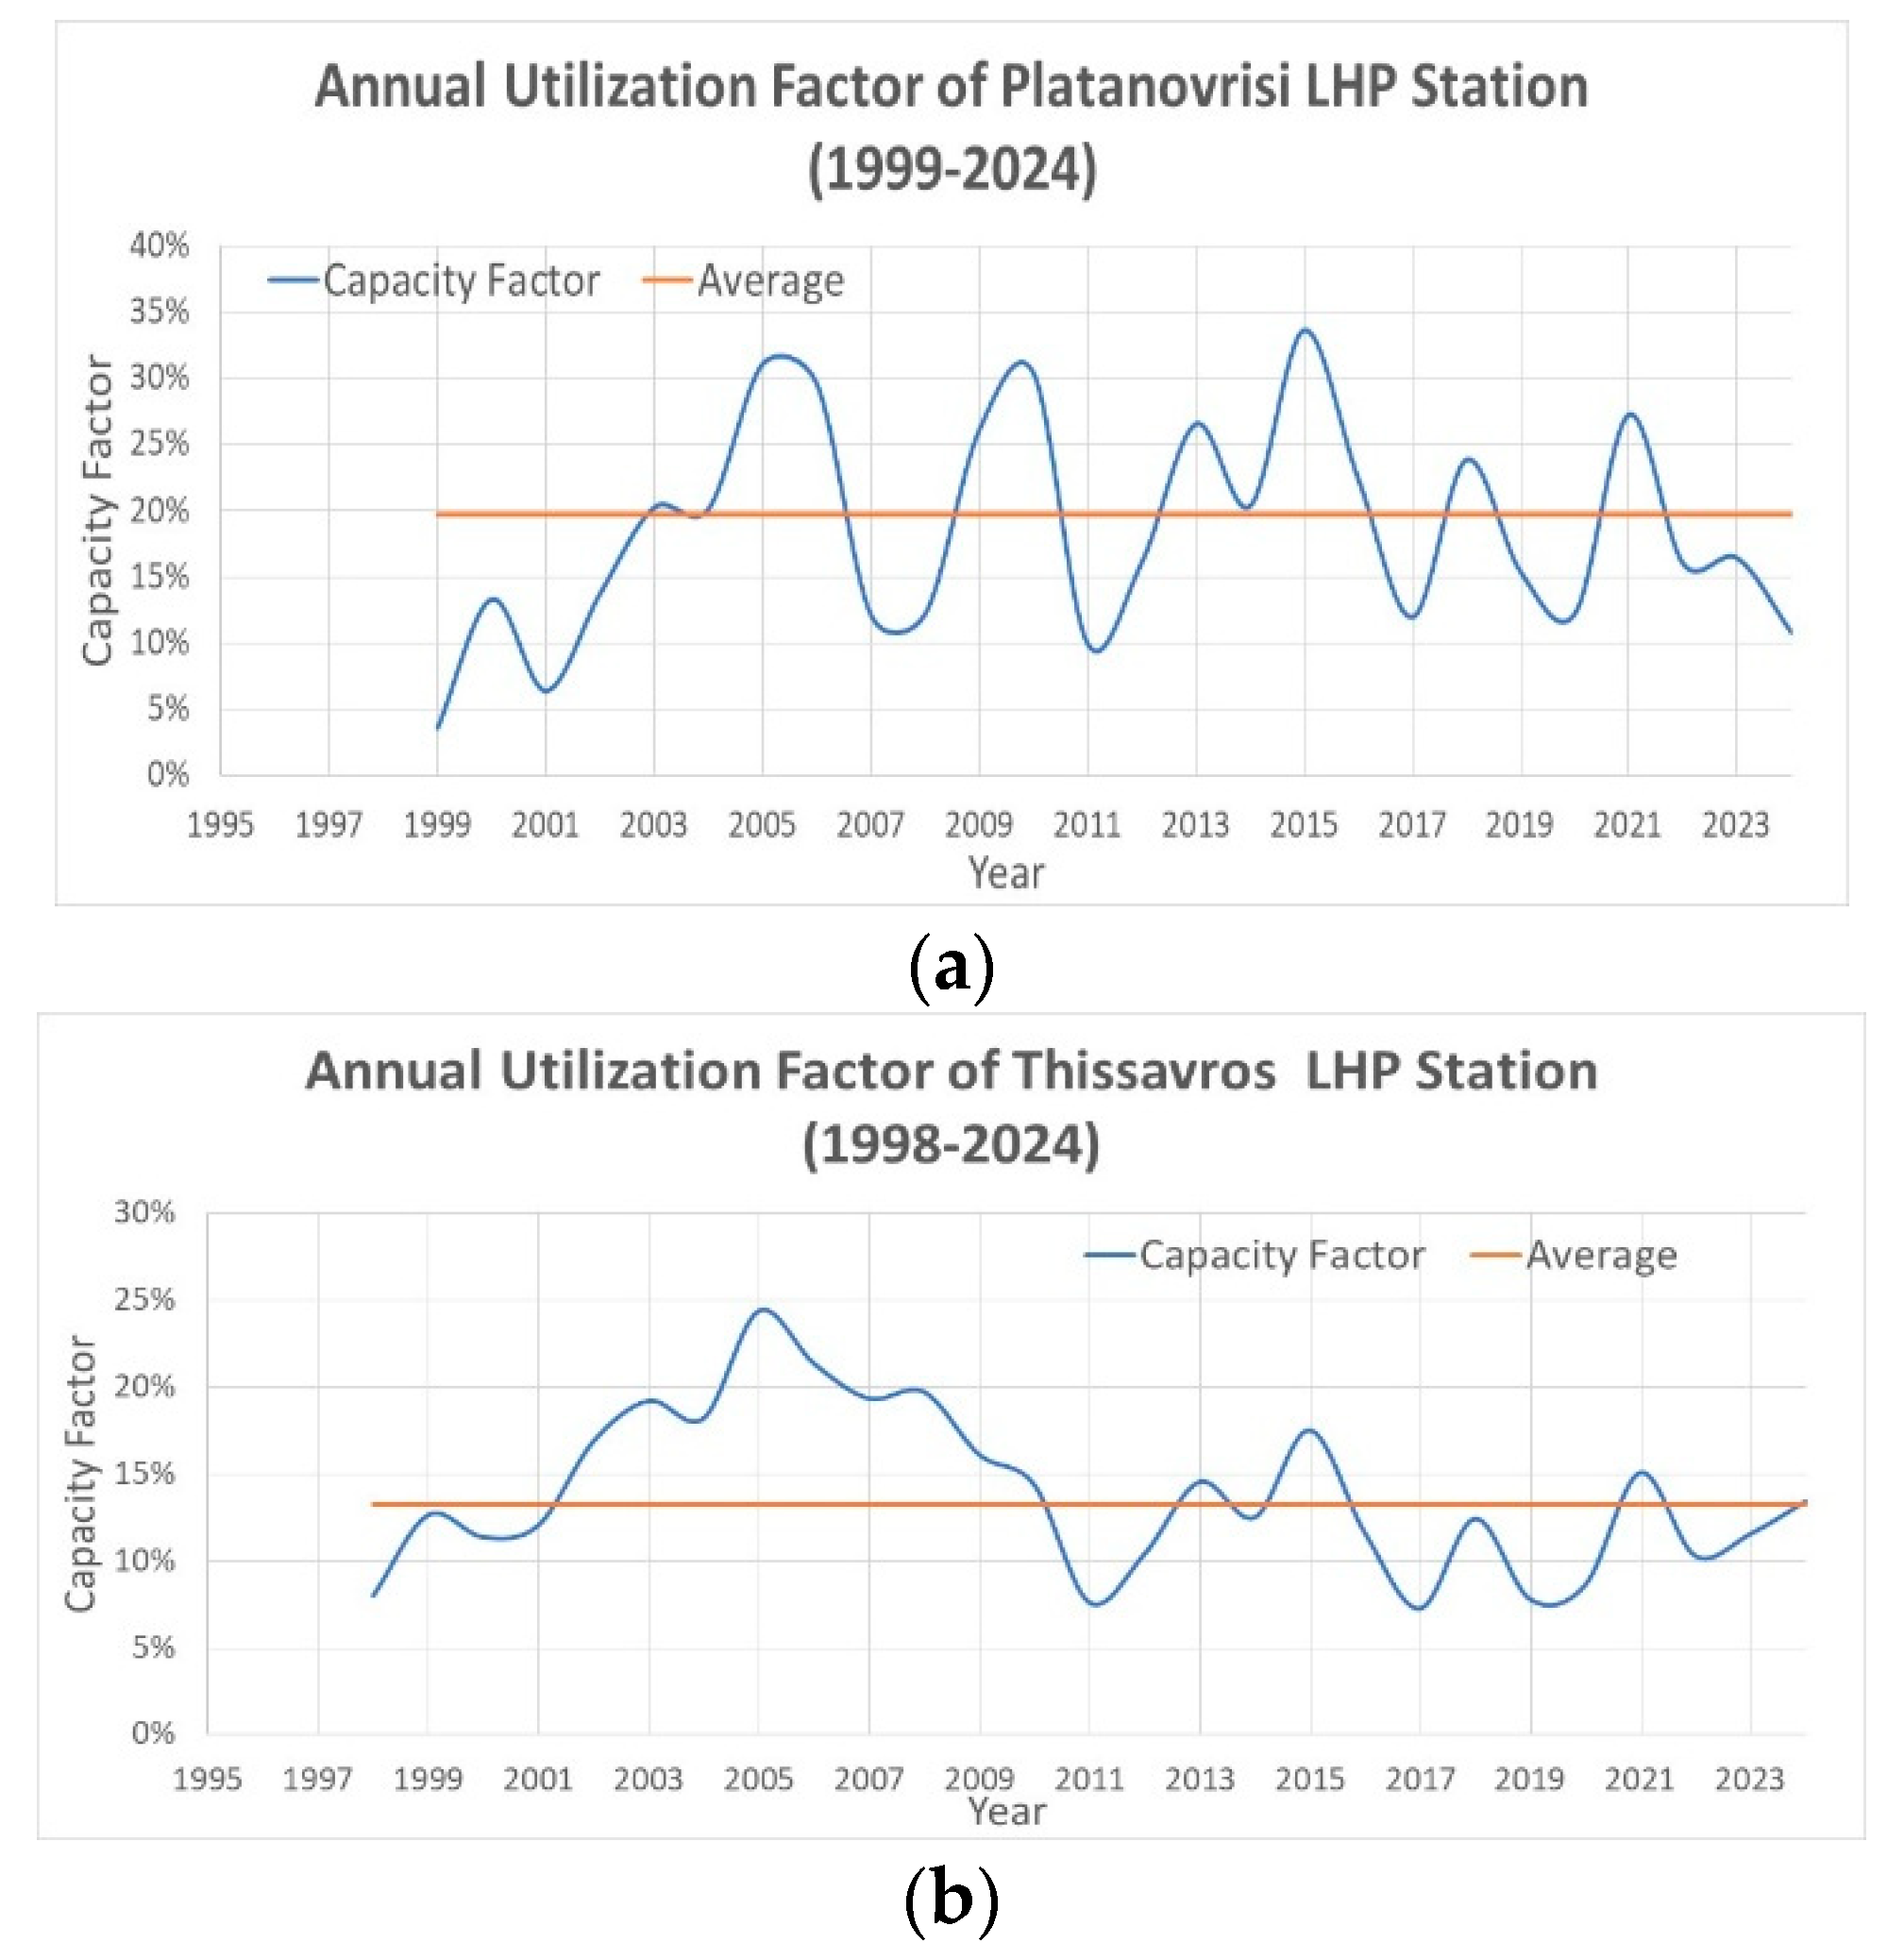
The Nestos River basin, being in the northern part of Greece, encompasses the LHP plants of Thissavros (384 MWe) and Platanovrisi (116 MWe) (Figure 18a,b). Similarly to the previous case, the LHP plants of this river basin also present quite comparable behavior, especially during the last decade, with annual average CF values around the long-term average (16.14%). More precisely, the annual average CF values of the Platanovrisi LHP plant are constantly greater (with the exception of the years 2001, 2002, 2007, 2008 and 2024) compared to those of the Thissavros LHP plant (which can also operate as a PHS station). The same is also applicable for the long-term average CF value (18.2% for the Platanovrisi LHP plant and 14.5% for the Thissavros LHP plant).
(e)
Finally, Figure 19 and Figure 20 visualize the annual average CF time series for the Ladonas (70 MWe) and the Tavropos (or Plastiras) (129.9 MWe) LHP plants, respectively, which were erected in the basins of the Ladonas River (Peloponnesus) and Tavropos River (Thessaly). The Ladonas LHP plant, despite its small installed capacity, demonstrates exceptionally high annual average CF values, with its long-term average value (exceeding 33.5%) being more than twofold the commensurate value for all LHP plants (16.14%). On the other hand, the Tavropos LHP plant presents annual average CF values that fluctuate around the long-term average value.
While summarizing, an important remark that should be made is that the outcome of the aforementioned analysis is, in general terms, in agreement with that of the former analysis conducted by Kaldellis (2008) [19] concerning the relatively low utilization degree of the to-date erected LHP plants during the time period 1995–2005. Hence, the specific long-term behavior for each LHP plant remains almost similar during the next twenty years. This low utilization degree of most LHPs definitely affects their economic performance, since the initial invested capital was met with relatively low energy yields for such a long period.

5.2. Detailed Energy Yield Analysis of LHPs

The present sub-section thoroughly examines the long-term (1995–2024) contribution of the existing large Greek hydropower plants to the national electricity system on the basis of their annual electricity generation. The analysis is conducted under the scope of unveiling the future prospects for local hydropower exploitation and addressing the way any associated challenges could be dealt with.
For a representative energy generation-based comparison of the existing Greek LHP plants, one could use the performance criterion of the average LHP plant. Thus, on the basis of its long-term (1995–2024) annual average electricity generation value (slightly exceeding 280 GWhe), one may discriminate three discrete categories (Figure 21, Figure 22 and Figure 23):
  • The first category contains the LHP plants of Agras (50 MWe), Assomata (108 MWe), Edesseos (19 MWe), Ilarion (153 MWe), Plastiras (129.9 MWe), Platanovrisi (116 MWe), Piges Aoou (210 MWe) and Pournari II (33.6 MWe). The specific category’s LHP plants have annual electricity generation values (Figure 21) that, in general terms, fluctuate below the corresponding long-term average, underlining that they have operated on the basis of mainly participating in local electricity grid management during the time period of analysis. Among them, the Agras, the Edesseos and the Pournari II, being the three smallest LHP plants, present the smaller variation, with their long-term annual electricity generation values being less than 50 GWhe. The remaining LHP plants of this category, with nominal power higher than 100 ΜWe, present greater variation with regard to the aforementioned LHP plants, with their long-term annual electricity generation value being in the range [150–250] GWhe. Moreover, the LHPs of this specific group present a mixed annual energy yield tendency (either slightly increasing or decreasing for the 30-year period examined).
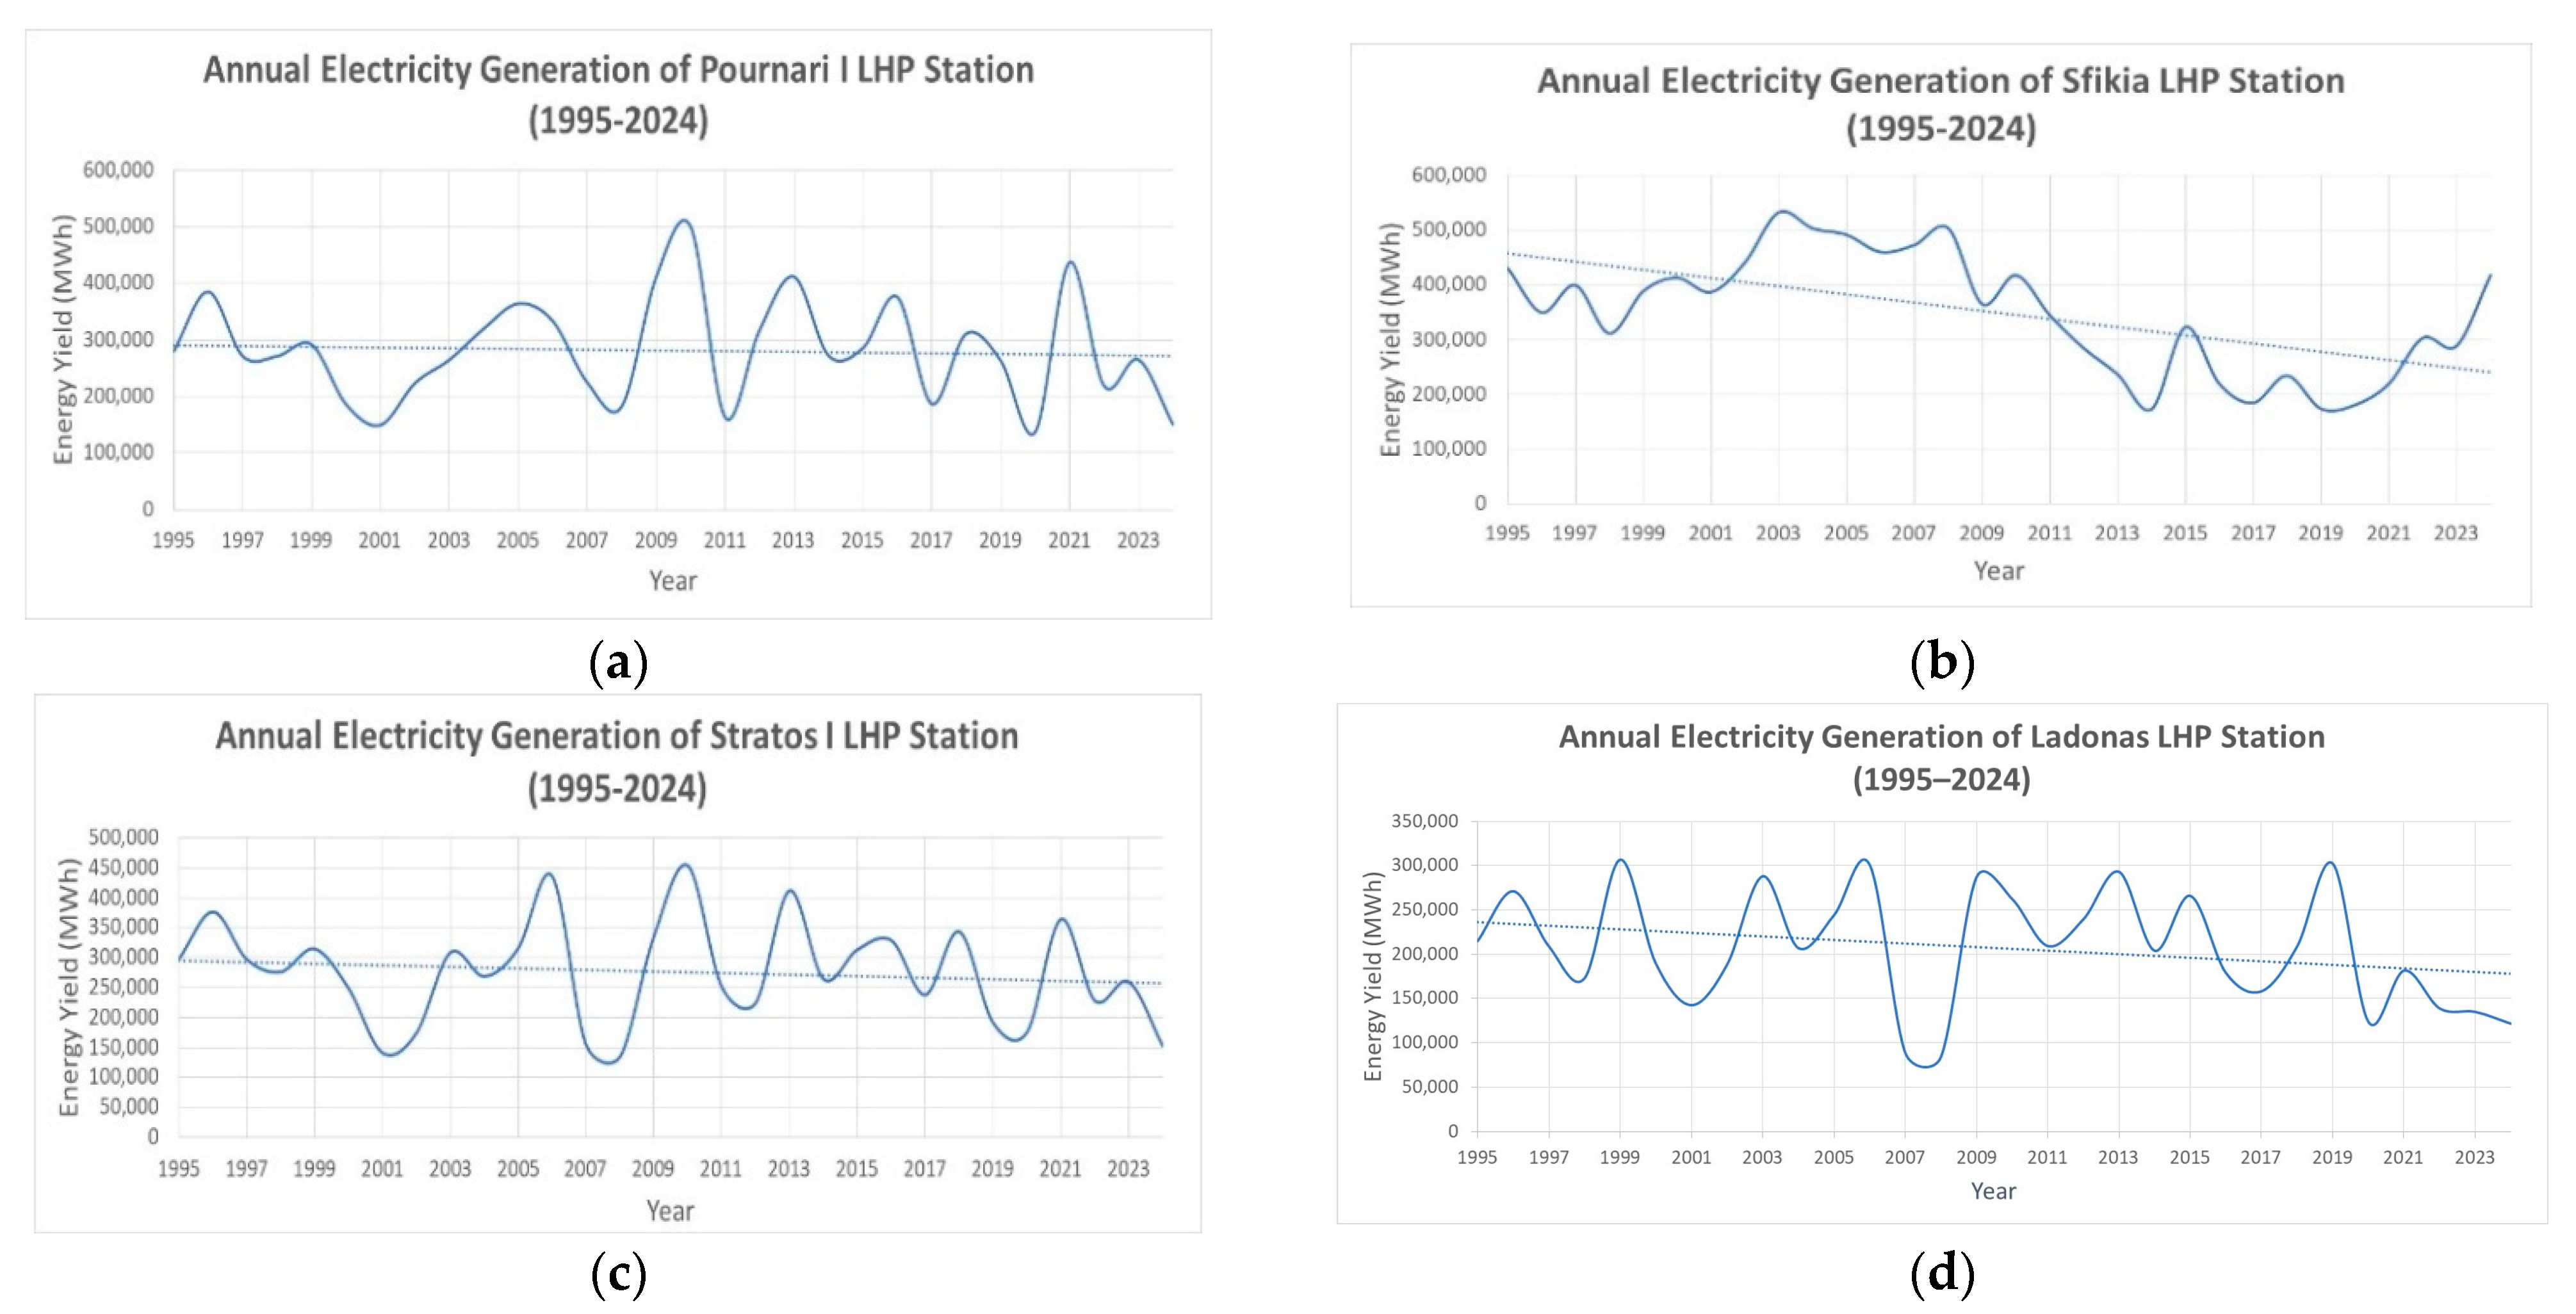
  • The second category comprises the LHP plants of Ladonas (70 MWe), Pournari I (300 MWe), Sfikia (315 MWe) and Stratos I (150 MWe). The main trait of this category is that the corresponding LHP plants’ long-term annual electricity generation values (Figure 22) fluctuate around the average (280 GWhe), contributing to a greater (than the first category’s LHP plants) extent to the national load demand coverage. Among them, the Ladonas LHP plant’s (which has the smallest installed capacity of this second group of LHP plants) energy generation-based performance is noticeable, considering that it presents a long-term annual average electricity generation value almost equal to 220 GWhe and a corresponding long-term annual average CF value in the order of 35% (Figure 19). On the other hand, the Sfikia LHP plant, which has the highest installed capacity among the second category’s LHP plants, has a long-term annual average energy generation value in the order of 350 GWhe and a corresponding long-term annual average CF value in the order of 13% (Figure 15d), greatly bringing into question the viability of its financial investment up to now [42], excluding its energy storage contribution. Note also that all four LHPs present a negative long-term annual energy yield tendency.
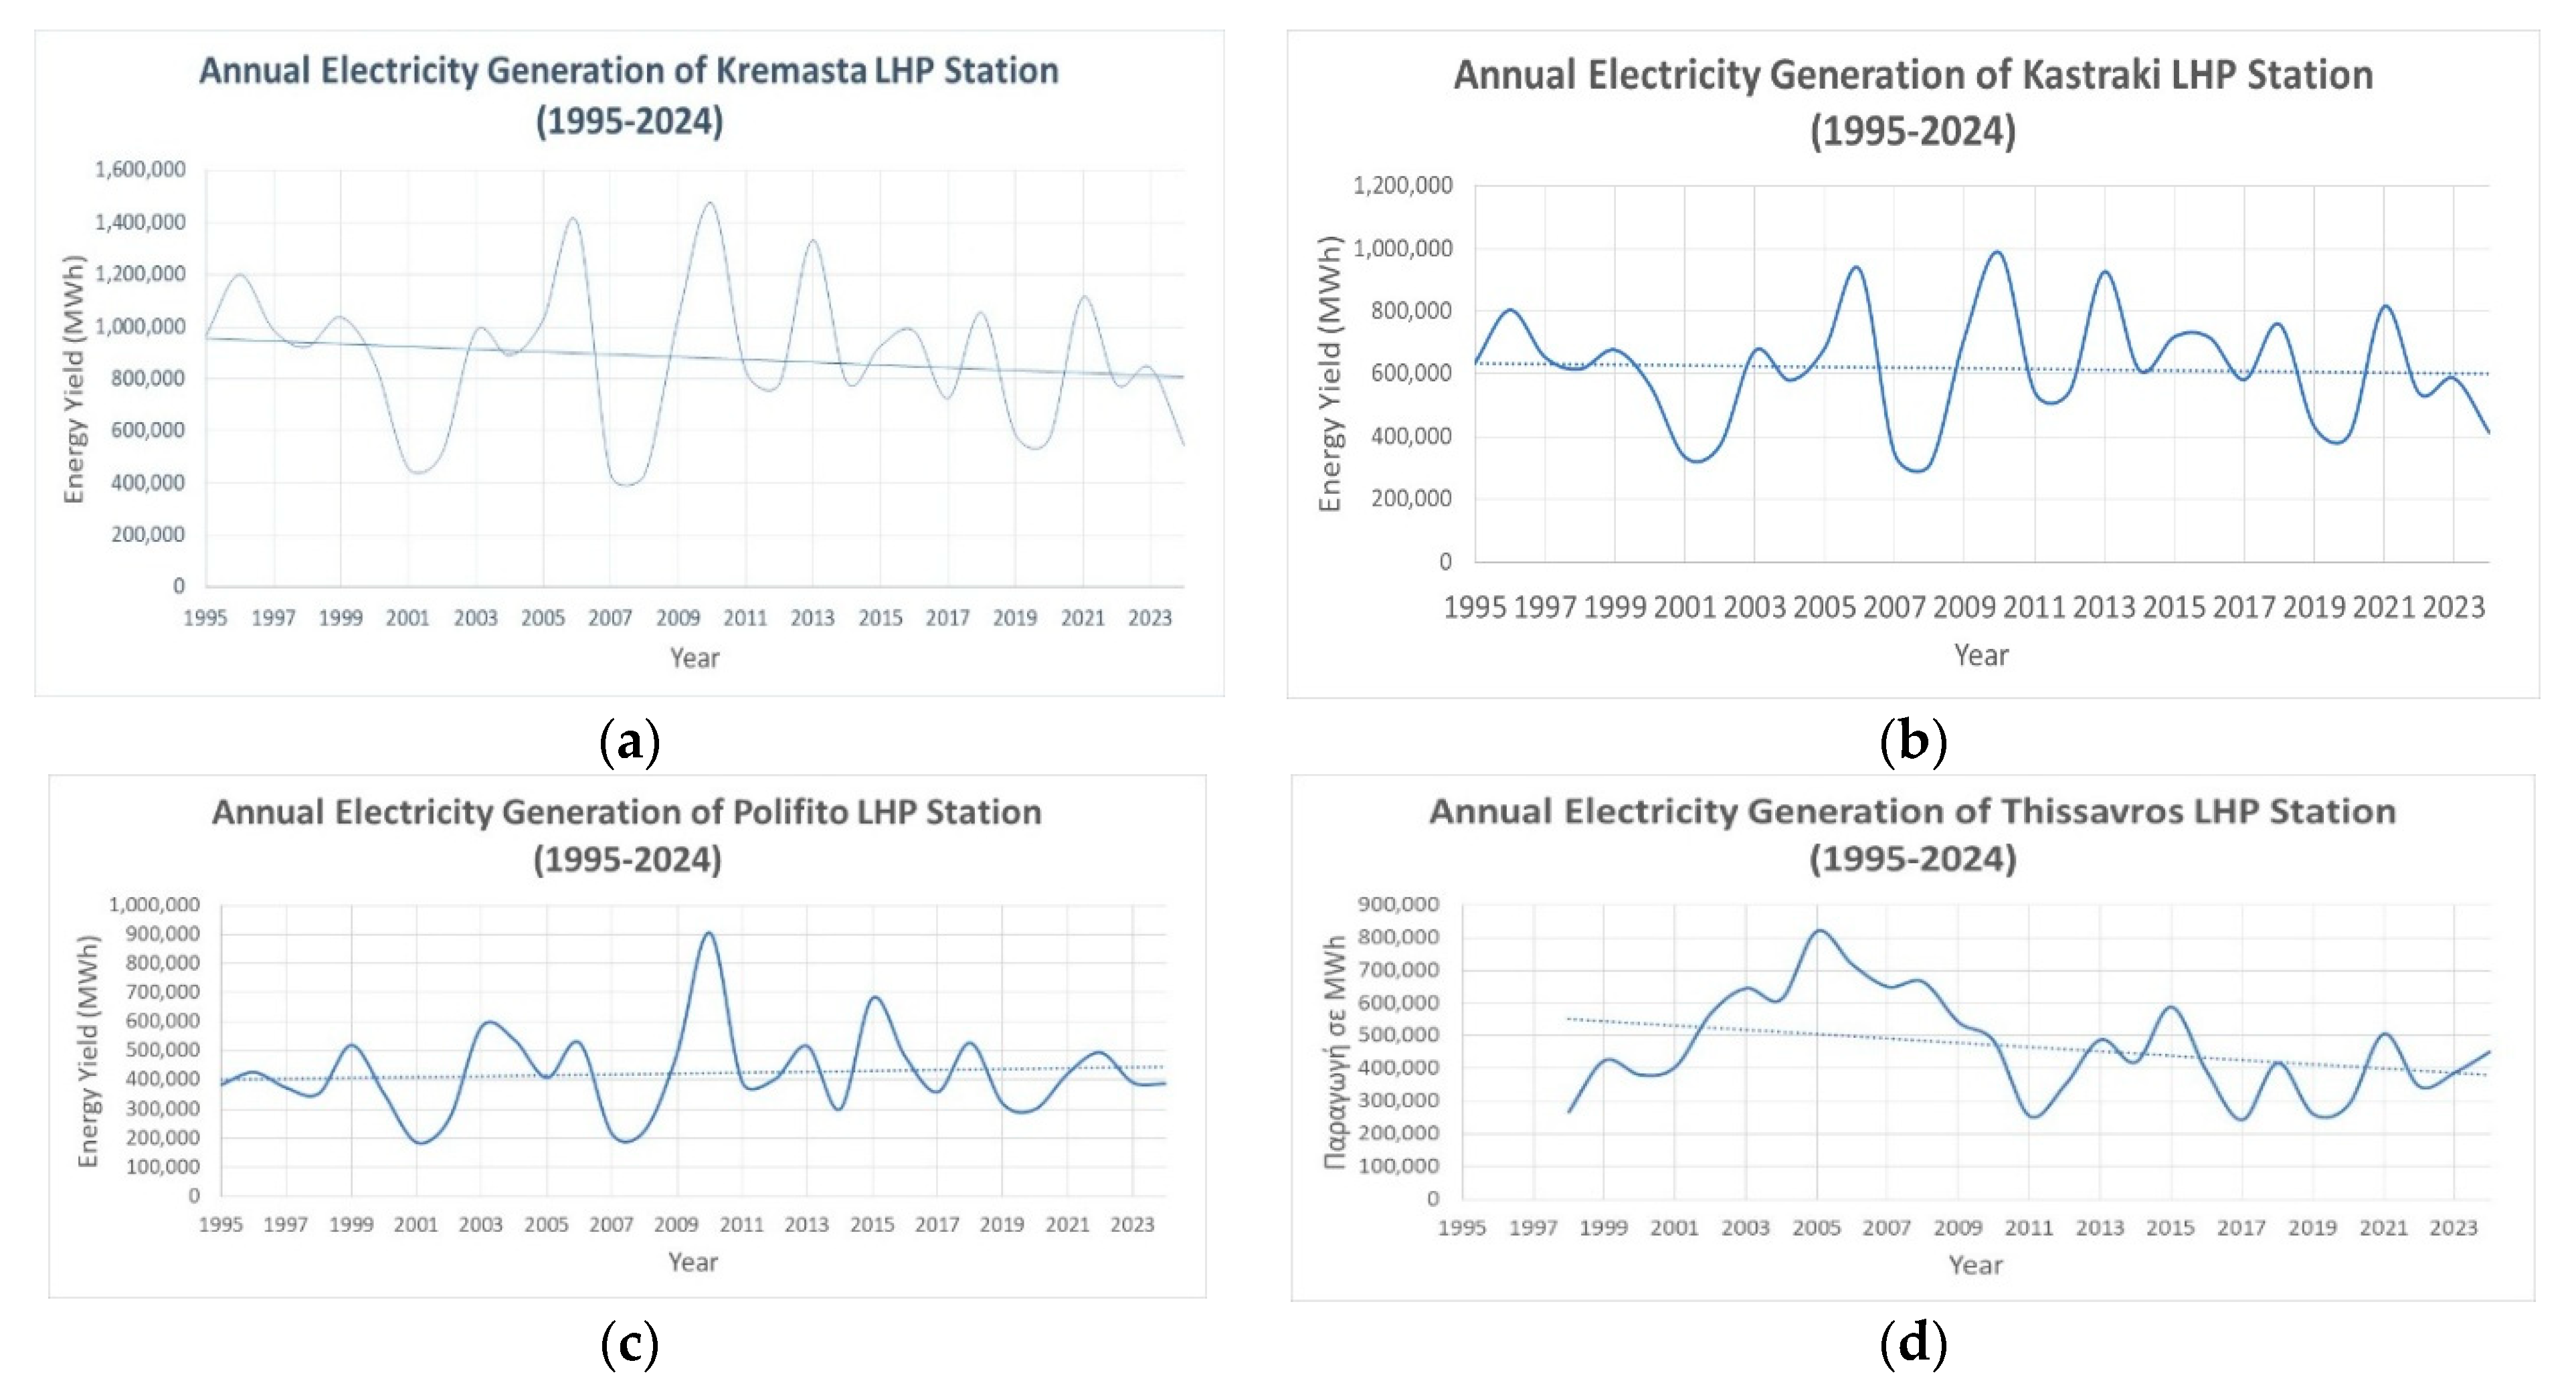
  • The third category encompasses the biggest LHP plants of Greece, i.e., the LHPs of Thissavros (384 MWe), Kastraki (320 MWe), Kremasta (437.2 MWe) and Polifito (375 MWe). The LHP plants of this category demonstrate (Figure 23) long-term annual electricity generation values significantly above the pertinent average one, strongly pinpointing their remarkable contribution to the national electricity grid balance. The greatest contribution has been realized by the Kremasta LHP plant, which presented the highest annual electricity generation values by far, while its long-term average value approached 900 GWhe. It is indicative that for the years 2006 and 2010, the specific LHP plant’s annual electricity generation was in the order of 1400–1450 GWhe, covering almost 3% of the corresponding national electricity demand and presenting an annual CF equal to 37% (Figure 17). As shown in the results in Figure 23, excluding Polifito, all the other LHP stations also present a negative long-term annual energy yield trend.

5.3. Critical Analysis of the LHPs’ Development

To further solidify the understanding of the Greek LHP plants’ current status, it should be underlined that the initially Greek State-controlled PPC S.A. (currently a private company), which was the developer of all Greek LHP plants in the previous years, in view of the ongoing electricity market liberalization process that started with Greek Law 2244/1994 (“market liberalization”) [42,43], is no longer allowed to deploy new LHP installations without being engaged in competitive auctions. This can be further justified by the fact that this specific situation has been exacerbated by the continuous transformation (privatization) that has taken place in the company’s organizational structure, especially following the company’s entrance into the Athens Stock Exchange in 2001. It is also noticeable that, in the majority of the Greek geographical districts, many agricultural cooperatives and local municipalities frequently exert control over the available water potential utilization and raise objections by exerting their political influence. As a direct consequence, electricity generation is not set as a priority target in several locations, hence leading several LHP plants to present exceptionally low CF values during the last thirty years (see also Figure 15, Figure 16, Figure 17, Figure 18, Figure 19 and Figure 20).
Furthermore, the absence of investment interest by the PPC S.A. can also be justified by the increased investment cost that has to be secured [42] as well as the negative attitude of local people toward new large hydropower (including significant reservoirs) developments in certain Greek regions [44,45]. The last statement can be principally ascribed to the strong environmental and social implications that characterize the erection of the water dams that comprise the main civil engineering constituent of an LHP infrastructure [29,46,47]. In the same context, one should also take into account that the development of hydropower plants can also have socio-economic ramifications associated with the modifications occurring in riverine habitats and the geomorphology [48,49,50,51]. The still under-development Glystra-Mesochora LHP plant (comprised of two (2) Francis turbines, each one with a 90 MWe installed capacity) stands out as a representative example of the previous statements, consisting of an unexploited investment of up to now EUR 500 million (in present values). This LHP plant’s erection began in 1986, and it was, to a major extent, completed in 2001 (only some minor complementary activities concerning the dam’s construction remain to be completed at present (2025)). Nonetheless, the intense opposition of local communities has hindered the plant’s completion. It is worth noticing that six rejection decisions have been issued by the relevant licensing authorities to date [52].
Nonetheless, by acknowledging the environmental benefits interlinked with the use of hydropower for electricity generation [19] and the extensive (more than 50–70 years) lifetime of the existing Greek LHP plants, one can state that they consist, along with the corresponding volume of the water stored in dams, of an “energy capital” for the initially Greek State-controlled PPC S.A. In the same vein, it is also noticeable that they are characterized by quite fair fixed (in the order of 2000–3500 EUR/MWe) and low variable maintenance costs (in the order of 2–3 EUR/MWhe) [24,53]. The investment cost of an LHP is considerably affected by the water reservoir’s size and the dam height and type, while the construction of the electric grid infrastructure (transmission lines and substations) to supply power to the power grid should also be included.

6. The Large Hydropower Plants’ Capability of Providing Power Balancing/Ancillary Services to the Electricity Grid

6.1. Literature Review

Acknowledging that modern power systems are in a transitional process toward accommodating ever-growing quantities of variable RESs (mainly solar energy and wind energy) [27,54], new challenges are raised for the existing electricity grids, mainly concerning energy supply security as well as the frequency and voltage regulations [55,56]. The aforementioned challenges have to be addressed in an appropriate way by the existing electricity generation units in the framework of a continuous power supply to consumers, while also conforming to prespecified electrical quality standards. Hence, in the context of the primary frequency control (active power balance), the need to modify, accordingly, the operational regimes of the existing controllable electricity generation units (such as the hydropower ones) in order to mitigate any instabilities of the electricity grid and provide ancillary services is derived [57,58]. More precisely, the power output of the existing electricity generation units should be automatically modified in response to any grid frequency change.
Hydropower units are suited to undertake the power response in primary frequency control [26], owing to many technical considerations, such as their high ramp-up and ramp-down rates and their capability for power regulation, grid flexibility and versatility [26,27,57,59,60]. Furthermore, in 2025, hydropower plants comprised almost 30% of the global flexible power supply installed capacity based on the hour-to-hour ramping needs’ criteria, having capabilities similar to those of natural gas-fired power plants [61].
On the other hand, energy storage technologies are technological assets that can also alleviate the aforementioned peculiarities of modern power systems [62]. Among them, PHS systems are considered the most promising and mature bulk energy storage technology [63], owing to their capability for handling substantial energy quantities and their extensive discharge duration [57,64,65,66]. In 2024, PHS systems had a global cumulative installed capacity approximately equal to 190 GWe, accounting for over 94% of the total global installed energy storage capacity and being able to store up to 10 TWhe. Furthermore, with more than one hundred (100) projects registered in the pipeline, the PHS capacity is anticipated to increase by approximately 35% by 2030, reaching a total of 240 GWe [67].
PHS systems are suitable technological solutions for applications where robust spinning reserve, frequency control and energy management are required [28]. In this sense, they can assist in decreasing the electricity transmission grids’ congestion and the variable RES curtailment [67,68]. Typically, in a PHS system, during time periods of low demand that are characterized by low electricity generation costs, excess or off-peak energy is used to pump water to an upper reservoir (Figure 24). During time periods of either energy generation deficit or peak load demand (when the electricity generation cost can be extremely high), water is released from the upper reservoir to feed the hydropower turbines located downstream [28].
Several researchers have dealt with the optimum operation of PHS stations in the context of providing the aforementioned services. Ichimura and Kimura [69] reviewed the status of PHS stations in Japan to mitigate RES fluctuations following the country’s electricity system reforms. Platero et al. [70] presented a novel method for the operation of hydropower plants to amplify the grid’s power quality. Šćekić et al. [64] investigated the use of PHS systems for flexibility amelioration in the liberalized electricity market and especially in modern power systems characterized by high RES penetration. A novel algorithm was deployed in this sense. Danso et al. [71] examined the flexibility that could be provided by large PHS stations in the West Africa region to integrate scheduled large shares of variable RESs in the local electricity grid. Xu et al. [72] attempted to quantify the comprehensive benefits of hydropower in decreasing the wind power fluctuation in a hybrid power system consisting of coal-fired, wind and hydroelectricity generation units.

6.2. The Prospects of PHS Stations in the Greek Electricity System

In view of the increasing penetration of variable RESs into the Greek electricity generation mix through the prism of the national energy targets established through the NECP [20], the Greek LHP plants can provide power balancing (or power regulation) services to the national electricity grid, boosting the supply side flexibility and thus mitigating any potential mismatches between power supply and load demand. In the Greek mainland, the LHP plants of Sfikia (315 MWe) and Thissavros (384 MWe) (see also Section 2) are also capable of being operated as PHS stations [34].
In the same context of power balancing services provision and considering also the associated technical limitations that dictate the maximum instantaneous wind and photovoltaic power penetration to the national electricity grid to not overpass a specific percentage of the corresponding load demand (e.g., 60% for the Greek interconnected system [73] and 25–30% for the Greek insular isolated electricity grids [23]), PHS schemes could stand out as a significant supporting tool. More precisely, during off-peak load demand hours, the excess energy generated (as of the end of 2024), mainly by the almost 9 GWp of PV-based installations and by the 5.4 GWe wind power fleet (which would be otherwise curtailed due to the imposed power grid limitations), could be exploited for feeding the pump units of PHS systems, charging the upper reservoirs. Note that during 2024, the average load demand of the mainland grid was 5.7 GWe, and the peak load demand during the noons of July was approximately 10.8 GWe. Moreover, during 2024, almost 1 TWhe of green electricity was curtailed due to low demand during high RES production hours, while in 2025, the corresponding curtailments of green electricity are expected to approach 3 TWhe, i.e., 10–13% of the total RES generation for the same period. On the contrary, the energy stored could be exploited during peak load demand hours to alleviate any potential power deficit. In this sense, the solar and wind energy curtailments could be significantly decreased [24,73], thus leading to optimized electricity generation schemes. Similar configurations have also been dealt with by other researchers in the field for the isolated electricity grids of the Greek non-interconnected islands of the Aegean Archipelagos [68,74,75,76,77,78,79].
Recently, increased interest is appearing in the development of energy storage installations based on PHS technology, since the final version of the NPEC plan submitted to the EU NPEC by the Greek government includes 1.7 GWe of pumped hydro systems power by 2030. For existing hydropower stations operating in the same river, the additional cost of transforming two consecutive LHPs to pumped storage power stations is not very high, since the necessary water reservoirs already exist. However, until now, there has been no significant activity, excluding private investment planning in Central Greece (650 MWe), which is facing significant social reaction by the nearby communities, while the two already existing PHS stations of Sfikia and Thissavros remain practically unexploited.
Finally, for a more comprehensive analysis of the existing Greek LHP plants’ operation, the pertinent lifecycle environmental gain can be used as an evaluation indicator. In this framework, one may consider the hypothetical case study of totally substituting the operation of the existing Greek lignite and natural gas-based power plants with the corresponding LHP plants. The carbon intensity, that is, the amount of CO2 emitted into the atmosphere per unit of electricity generated by the considered technologies [80,81], could be utilized in this context (Table 2). Thus, considering that, for the year 2024, lignite, natural gas and hydropower represented, accordingly, 6%, 39.8% and 6.5% of the corresponding year’s electricity generation mix, whereas the Greek mainland’s total load demand was approximately equal to 52 TWhe (see also Figure 2, Figure 5 and Figure 10), the avoidable CO2 emissions can be found in the range (12–16) million tons, strongly highlighting the tremendous environmental gain that can be realized.

7. Conclusions

The Greek territory possesses a considerable hydropower potential that can remarkably contribute to covering the continuously increasing national electricity demand. Nonetheless, the deployment of large-scale hydropower applications has experienced a notable stagnation during recent years. The driving factors for this can be identified in the local societies’ negative attitude toward new hydropower applications and the pertinent high investment cost necessitated in comparison to the low cost of PV-based installations.
In this context, the present work critically examines the progress noted in the Greek hydropower sector during the last thirty years through the prism of the national energy targets set in accordance with the European Directives. A dedicated analysis of the annual energy yield of all the LHPs for a thirty-year period is demonstrated, along with the time evolution of the corresponding annual and monthly utilization (capacity) factor values. According to the official data analyzed, the Greek LHPs offered, annually, 2.6 to 6.7 TWhe for the entire 1995–2024 period. Moreover, the power balancing services that pumped hydro storage stations can provide through their primary frequency control were underscored, collating the national total load demand with the total solar and wind fleet power output time series. In this sense, in an attempt to exploit any excess generated by the existing thermal and wind/solar power plants, a hybrid power plant configuration has been proposed.
The analysis conducted unveiled that the majority of Greek large hydropower plants are mainly used for satisfying the corresponding national peak load demand, without serving an electricity generation scope. The aforementioned have led the existing large-scale installations to be characterized by remarkably low capacity factors, in the order of 16%, and the initially Greek State-controlled PPC S.A. to defer any new developments. Hence, with the interest in the further deployment of the sector being gradually attenuated, a widely accepted national water resource management plan is rendered more than imperative.
Recapitulating, the potential of Greek hydropower, along with the corresponding volume of the water stored in dams, constitutes an “energy capital” for the incumbent authority (PPC S.A.), while it is also important to acknowledge the extensive (more than 50–70 years) lifetime of hydropower applications. This highly under-exploited but quite promising hydropower potential necessitates significant institutional reform actions to be undertaken to deal with the intrinsic challenges (both technological and political) and revitalize the sector’s deployment. In this context, the underlying technology’s prospects will be further unveiled, paving the way for new investments to be realized. Moreover, setting electricity generation as a priority for hydropower applications can lead to exceptional utilization degrees, thus assisting the country in increasing its independence from imported fuels and accomplishing the recently ratified national energy targets of zero-carbon electricity generation.

Funding

This research received no external funding.

Data Availability Statement

Data used in the current study are open, being available from the corresponding organizations.

Acknowledgments

The author would like to thank G. Tzanes and P. Triantafyllou for their support in gathering the available data from the corresponding organizations.

Conflicts of Interest

The author declares no conflicts of interest.

Abbreviations

The following abbreviations are used in this manuscript:
CFcapacity factor
EUEuropean Union
GHGgreenhouse gas
HPSHydroelectric Power Station
LHPlarge hydropower
NECPNational Energy and Climate Plan
PHSpumped hydro storage
PPCPublic Power Corporation
RESrenewable energy source
SHPSmall Hydropower

References

  1. Wagner, B.; Hauer, C.; Habersack, H. Current hydropower developments in Europe. Curr. Opin. Environ. Sustain. 2019, 37, 41–49. [Google Scholar] [CrossRef]
  2. Jianzhong, X.; Assenova, A.; Erokhin, V. Renewable Energy and Sustainable Development in a Resource-Abundant Country: Challenges of Wind Power Generation in Kazakhstan. Sustainability 2018, 10, 3315. [Google Scholar] [CrossRef]
  3. Bilgen, S.; Kaygusuz, K.; Sari, A. Renewable Energy for a Clean and Sustainable Future. Energy Sources 2004, 26, 1119–1129. [Google Scholar] [CrossRef]
  4. World Economic Forum. Global Risks Report. 2024. Available online: www.weforum.org (accessed on 7 February 2025).
  5. Tzanes, G.; Zafirakis, D.; Makropoulos, C.; Kaldellis, J.K.; Stamou, A.I. Energy vulnerability and the exercise of a data-driven analysis protocol: A comparative assessment on power generation aspects for the non-interconnected islands of Greece. Energy Policy 2023, 177, 113515. [Google Scholar] [CrossRef]
  6. Kapsali, M.; Kaldellis, J.K. Combining hydro and variable wind power generation by means of pumped-storage under economically viable terms. Appl. Energy 2010, 87, 3475–3485. [Google Scholar] [CrossRef]
  7. Lovins, A.B. Reliably integrating variable renewables: Moving grid flexibility resources from models to results. Electr. J. 2017, 30, 58–63. [Google Scholar] [CrossRef]
  8. International Renewable Energy Agency. The Changing Role of Hydropower: Challenges and Opportunities; International Renewable Energy Agency: Abu Dhabi, United Arab Emirates, 2023. [Google Scholar]
  9. Matuszewska-Janica, A.; Żebrowska-Suchodolska, D.; Ala-Karvia, U.; Hozer-Koćmiel, M. Changes in Electricity Production from Renewable Energy Sources in the European Union Countries in 2005–2019. Energies 2021, 14, 6276. [Google Scholar] [CrossRef]
  10. Waheed, R.; Sarwar, S.; Wei, C. The survey of economic growth, energy consumption and carbon emission. Energy Rep. 2019, 5, 1103–1115. [Google Scholar] [CrossRef]
  11. Kaldellis, J.K.; Boulogiorgou, D. Wind Energy Contribution in the Planet Energy Balance and Future Prospects. In Reference Module in Earth Systems and Environmental Sciences; Elsevier: Oxford, UK, 2021. [Google Scholar]
  12. Van Asselt, H. Governing fossil fuel production in the age of climate disruption: Towards an international law of ‘leaving it in the ground’. Earth Syst. Gov. 2021, 9, 100118. [Google Scholar] [CrossRef]
  13. Topolewski, L. Relationship between Energy Consumption and Economic Growth in European Countries: Evidence from Dynamic Panel Data Analysis. Energies 2021, 14, 356. [Google Scholar] [CrossRef]
  14. U.S. Energy Information Administration. Independent Statistics and Analysis. 2024. Available online: https://www.eia.gov/ (accessed on 7 February 2025).
  15. Berga, L. The Role of Hydropower in Climate Change Mitigation and Adaptation: A Review. Engineering 2016, 2, 313–318. [Google Scholar] [CrossRef]
  16. Chala, G.T.; Ma’Arof, M.I.N.; Sharma, R. Trends in an increased dependence towards hydropower energy utilization—A short review. Cogent. Eng. 2019, 6, 1–14. [Google Scholar] [CrossRef]
  17. International Hydropower Association (IHA). World Hydropower Outlook. 2024. Available online: www.hydropower.org (accessed on 7 February 2025).
  18. Manolopoulos, D.; Kitsopoulos, K.; Kaldellis, J.K.; Bitzenis, A. The evolution of renewable energy sources in the electricity sector of Greece. Int. J. Hydrogen Energy 2016, 41, 12659–12671. [Google Scholar] [CrossRef]
  19. Kaldellis, J.K. Critical evaluation of the hydropower applications in Greece. Renew. Sustain. Energy Rev. 2008, 12, 218–234. [Google Scholar] [CrossRef]
  20. Ministry of Environment and Energy. National Energy and Climate Plan. 2024. Available online: https://ec.europa.eu (accessed on 23 November 2024).
  21. European Commission (EC). 2030 Climate Target Plan. 2021. Available online: https://ec.europa.eu/clima (accessed on 24 December 2021).
  22. Independent Power Transmission Operator (IPTO). Monthly Energy Bulletin. December 2024. Available online: https://www.admie.gr (accessed on 8 February 2025). (In Greek).
  23. Triantafyllou, P.; Koroneos, C.; Kondili, E.; Kollas, P.; Zafirakis, D.; Ktenidis, P.; Kaldellis, J.Κ. Optimum Green Energy Solution to Address the Remote Islands’ Water-Energy Nexus: The Case Study of Nisyros Island. Heliyon 2021, 7, 1–8. [Google Scholar] [CrossRef] [PubMed]
  24. Dianellou, A.; Christakopoulos, T.; Caralis, G.; Kotroni, V.; Lagouvardos, K.; Zervos, A. Is the Large-Scale Development of Wind-PV with Hydro-Pumped Storage Economically Feasible in Greece? Appl. Sci. 2021, 11, 2368. [Google Scholar] [CrossRef]
  25. Loumakis, S.; Giannini, E.; Maroulis, Z. Renewable Energy Sources Penetration in Greece: Characteristics and Seasonal Variation of the Electricity Demand Share Covering. Energies 2019, 12, 2441. [Google Scholar] [CrossRef]
  26. Abdellatif, D.; AbdelHady, R.; Ibrahim, A.M.; El-Zahab, E.A. Conditions for economic competitiveness of pumped storage hydroelectric power plants in Egypt. Renew. Wind. Water Sol. 2018, 5, 1–14. [Google Scholar] [CrossRef]
  27. Yang, W.; Yang, J.; Guo, W.; Norrlund, P. Response time for primary frequency control of hydroelectric generating unit. Int. J. Electr. Power Energy Syst. 2016, 74, 16–24. [Google Scholar] [CrossRef]
  28. Zafirakis, D.; Chalvatzis, K.J.; Baiocchi, G.; Daskalakis, G. The value of arbitrage for energy storage: Evidence from European electricity markets. Appl. Energy 2016, 184, 971–986. [Google Scholar] [CrossRef]
  29. Farmaki, P.; Tranoulidis, A.; Kouletsos, T.; Giourka, P.; Katarachia, A. Mining Transition and Hydropower Energy in Greece-Sustainable Governance of Water Resources Management in a Post-Lignite Era: The Case of Western Macedonia, Greece. Water 2021, 13, 1878. [Google Scholar] [CrossRef]
  30. Kaldellis, J.K.; Kapsali, M. Evaluation of the long-term environmental performance of Greek lignite-fired power stations. Renew. Sustain. Energy Rev. 2014, 31, 472–485. [Google Scholar] [CrossRef]
  31. Vlassopoulos, C. Persistent lignite dependency: The Greek energy sector under pressure. Energy Policy 2020, 147, 1–7. [Google Scholar] [CrossRef]
  32. Kaldellis, J.K.; Zafirakis, D.; Kondili, E. Contribution of lignite in the Greek electricity generation: Review and future prospects. Fuel 2009, 88, 475–489. [Google Scholar] [CrossRef]
  33. Marinakis, V.; Flamos, A.; Stamtsis, G.; Georgizas, I.; Maniatis, Y.; Doukas, H. The Efforts towards and Challenges of Greece’s Post-Lignite Era: The Case of Megalopolis. Sustainability 2020, 12, 10575. [Google Scholar] [CrossRef]
  34. Public Power Corporation (PPC) of Greece S.A. Hydroelectric projects—Renewable Energy Sources. 2024. Available online: https://www.dei.gr (accessed on 17 December 2024).
  35. DAPEEP. RES and CHP Report. Concise Fact Sheet. December 2024. 2025. Available online: https://www.dapeep.gr (accessed on 23 January 2025). (In Greek).
  36. Poulos, S.E. The Greek Rivers’ Sedimentary Potential. In Proceedings of the 5th Greek Conference on Oceanography and Fishing, Kavala, Greece, 15–18 April 1997; pp. 481–482. (In Greek). [Google Scholar]
  37. Argyrakis, I. Hydroelectric Power Plants of PPC S.A. and their contribution to the Energy Supply. Technical Chamber of Greece. Available online: https://portal.tee.gr/portal/page/portal/teelar/EKDILWSEIS/damConference/eisigiseis/5.1.pdf (accessed on 7 February 2025). (In Greek).
  38. Ioakimidis, C.S.; Gerbelova, H.; Bagheri, A.; Koutra, S.; Koukouzas, N. Strategic Planning for Carbon Capture and Storage Implementation in the Electricity Sector of Greece: A TIMES Based Analysis. Processes 2021, 9, 1913. [Google Scholar] [CrossRef]
  39. Hellenic National Meteorological Service (HNMS). Climatic Atlas of Greece. 2024. Available online: http://climatlas.hnms.gr/sdi/ (accessed on 8 December 2024).
  40. Anagnostopoulos, J.S.; Papantonis, D.E. Optimal sizing of a run-of-river small hydropower plant. Energy Convers. Manag. 2007, 48, 2663–2670. [Google Scholar] [CrossRef]
  41. Kaldellis, J.K. The contribution of small hydro power stations to the electricity generation in Greece: Technical and economic considerations. Energy Policy 2007, 35, 2187–2196. [Google Scholar] [CrossRef]
  42. Kaldellis, J.K.; Vlachou, D.S.; Korbakis, G. Techno-economic evaluation of small hydro power plants in Greece: A complete sensitivity analysis. Energy Policy 2005, 33, 1969–1985. [Google Scholar] [CrossRef]
  43. Kaldellis, J.K. The future of renewable energy applications under the current Greek electricity production market circumstances. In Proceedings of the NTUA-RENES Unet, 2nd National Conference for the Application of Renewable Energy Sources, Athens, Greece, 19–21 March 2001; pp. 282–289. [Google Scholar]
  44. Kaldellis, J.K.; Kapsali, M.; Katsanou, E. Renewable energy applications in Greece—What is the public attitude? Energy Policy 2012, 42, 37–48. [Google Scholar] [CrossRef]
  45. Malesios, C.; Arabatzis, G. Small hydropower stations in Greece: The local people’s attitudes in a mountainous prefecture. Renew. Sustain. Energy Rev. 2010, 14, 2492–2510. [Google Scholar] [CrossRef]
  46. Farmaki, P.M.; Tranoulidis, A.C. Greek Hydropower production and the European Union (EU) Water Framework Directive: Potentially conflicting interests and sustainable governance of river basins. In Proceedings of the 5th International Electronic Conference on Water Sciences, Virtual, 16–30 November 2020. [Google Scholar]
  47. Zhang, Y.; Tang, W.; Duffield, C.F.; Zhang, L.; Hui, F.K.P. Environment Management of Hydropower Development: A Case Study. Energies 2021, 14, 2029. [Google Scholar] [CrossRef]
  48. Botelho, A.; Ferreira, P.; Lima, F.; Costa Pinto, L.M.; Sousa, S. Assessment of the environmental impacts associated with hydropower. Renew. Sustain. Energy Rev. 2017, 70, 896–904. [Google Scholar] [CrossRef]
  49. Llamosas, C.; Sovacool, B.K. The future of hydropower? A systematic review of the drivers, benefits and governance dynamics of transboundary dams. Renew. Sustain. Energy Rev. 2021, 137, 110495. [Google Scholar] [CrossRef]
  50. Peters, R.; Berlekamp, J.; Lucía, A.; Stefani, V.; Tockner, K.; Zarfl, C. Integrated Impact Assessment for Sustainable Hydropower Planning in the Vjosa Catchment (Greece, Albania). Sustainability 2021, 13, 1514. [Google Scholar] [CrossRef]
  51. De Faria, F.A.M.; Davis, A.; Severnini, E.; Jaramillo, P. The local socio-economic impacts of large hydropower plant development in a developing country. Energy Econ. 2017, 67, 533–544. [Google Scholar] [CrossRef]
  52. Water Resources and Environment of Thessaly. The Mesochora Large Hydropower Project. Available online: https://www.ypethe.gr/page/yie-mesohoras (accessed on 7 January 2024). (In Greek).
  53. International Renewable Energy Agency (IRENA). Renewable Power Generation Costs in 2023. 2024. Available online: https://www.irena.org (accessed on 2 January 2025).
  54. Hunt, J.D.; Zakeri, B.; Lopes, R.; Barbosa, P.S.F.; Nascimento, A.; de Castro, N.J.; Brandão, R.; Schneider, P.S.; Wada, Y. Existing and new arrangements of pumped-hydro storage plants. Renew. Sustain. Energy Rev. 2020, 129, 109914. [Google Scholar] [CrossRef]
  55. Pitorac, L.; Vereide, K.; Lia, L. Technical Review of Existing Norwegian Pumped Storage Plants. Energies 2020, 13, 4918. [Google Scholar] [CrossRef]
  56. Tungadio, D.H.; Sun, Y. Load frequency controllers considering renewable energy integration in power system. Energy Rep. 2019, 5, 436–453. [Google Scholar] [CrossRef]
  57. Kougias, I.; Aggidis, G.; Avellan, F.; Deniz, S.; Lundin, U.; Moro, A.; Muntean, S.; Novara, D.; Pérez-Díaz, J.I.; Quaranta, E.; et al. Analysis of emerging technologies in the hydropower sector. Renew. Sustain. Energy Rev. 2019, 113, 1–18. [Google Scholar] [CrossRef]
  58. Yang, W.; Norrlund, P.; Saarinen, L.; Witt, A.; Smith, B.; Yang, J.; Lundin, U. Burden on hydropower units for short-term balancing of renewable power systems. Nat. Commun. 2018, 9, 1–12. [Google Scholar] [CrossRef] [PubMed]
  59. Min, C.G.; Kim, M.K. Flexibility-Based Reserve Scheduling of Pumped Hydroelectric Energy Storage in Korea. Energies 2017, 10, 1478. [Google Scholar] [CrossRef]
  60. Pérez-Díaz, J.I.; Chazarra, M.; García-González, J.; Cavazzini, G.; Stoppato, A. Trends and challenges in the operation of pumped-storage hydropower plants. Renew. Sustain. Energy Rev. 2015, 44, 767–784. [Google Scholar] [CrossRef]
  61. International Energy Agency (IEA). Hydropower Special Market Report. Analysis and Forecast to 2030. 2024. Available online: https://iea.blob.core.windows.net (accessed on 2 January 2025).
  62. Kaldellis, J.K.; Zafirakis, D. Optimum energy storage techniques for the improvement of renewable energy sources-based electricity generation economic efficiency. Energy 2007, 32, 2295–2305. [Google Scholar] [CrossRef]
  63. Ali, S.; Stewart, R.A.; Sahin, O. Drivers and barriers to the deployment of pumped hydro energy storage applications: Systematic literature review. Clean. Eng. Technol. 2021, 5, 100281. [Google Scholar] [CrossRef]
  64. Šćekić, L.; Mujović, S.; Radulović, V. Pumped Hydroelectric Energy Storage as a Facilitator of Renewable Energy in Liberalized Electricity Market. Energies 2020, 13, 6076. [Google Scholar] [CrossRef]
  65. Zafirakis, D.; Chalvatzis, K.J.; Baiocchi, G.; Daskalakis, G. Modeling of financial incentives for investments in energy storage systems that promote the large-scale integration of wind energy. Appl. Energy 2013, 105, 138–154. [Google Scholar] [CrossRef]
  66. Deane, J.P.; Ó Gallachóir, B.P.; McKeogh, E.J. Techno-economic review of existing and new pumped hydro energy storage plant. Renew. Sustain. Energy Rev. 2010, 14, 1293–1302. [Google Scholar] [CrossRef]
  67. International Hydropower Association (IHA). Pumped Storage Hydropower. 2024. Available online: https://www.hydropower.org/factsheets/pumped-storage (accessed on 2 January 2025).
  68. Kaldellis, J.K.; Kavadias, K.A. Optimal wind-hydro solution for Aegean Sea islands’ electricity-demand fulfilment. Appl. Energy 2001, 70, 333–354. [Google Scholar] [CrossRef]
  69. Ichimura, S.; Kimura, S. Present status of pumped hydro storage operations to mitigate renewable energy fluctuations in Japan. Glob. Energy Interconnect. 2019, 2, 423–428. [Google Scholar] [CrossRef]
  70. Platero, C.A.; Sánchez, J.A.; Nicolet, C.; Allenbach, P. Hydropower Plants Frequency Regulation Depending on Upper Reservoir Water Level. Energies 2019, 12, 1637. [Google Scholar] [CrossRef]
  71. Danso, D.K.; François, B.; Hingray, B.; Diedhiou, A. Assessing hydropower flexibility for integrating solar and wind energy in West Africa using dynamic programming and sensitivity analysis. Illustration with the Akosombo reservoir, Ghana. J. Clean. Prod. 2021, 287, 1–17. [Google Scholar] [CrossRef]
  72. Xu, B.; Zhang, J.; Yuan, S.; Li, H.; Chen, D.; Zhang, J. Comprehensive Regulation Benefits of Hydropower Generation System in Reducing Wind Power Fluctuation. Water 2021, 13, 2987. [Google Scholar] [CrossRef]
  73. Anagnostopoulos, J.S.; Papantonis, D.E. Study of pumped storage schemes to support high RES penetration in the electric power system of Greece. Energy 2012, 45, 416–423. [Google Scholar] [CrossRef]
  74. Bouzounierakis, N.; Katsigiannis, Y.; Fiorentzis, K.; Karapidakis, E. Effect of Hybrid Power Station Installation in the Operation of Insular Power Systems. Inventions 2019, 4, 38. [Google Scholar] [CrossRef]
  75. Nikolaou, T.; Stavrakakis, G.S.; Tsamoudalis, K. Modeling and Optimal Dimensioning of a Pumped Hydro Energy Storage System for the Exploitation of the Rejected Wind Energy in the Non-Interconnected Electrical Power System of the Crete Island, Greece. Energies 2021, 13, 2705. [Google Scholar] [CrossRef]
  76. Katsaprakakis, D.A. Hybrid power plants in non-interconnected insular systems. Appl. Energy 2016, 164, 268–283. [Google Scholar] [CrossRef]
  77. Papaefthymiou, S.V.; Papathanassiou, S.A. Optimum sizing of wind-pumped-storage hybrid power stations in island systems. Renew. Energy 2014, 64, 187–196. [Google Scholar] [CrossRef]
  78. Caralis, G.; Rados, K.; Zervos, A. On the market of wind with hydro-pumped storage systems in autonomous Greek islands. Renew. Sustain. Energy Rev. 2010, 14, 2221–2226. [Google Scholar] [CrossRef]
  79. Anagnostopoulos, J.S.; Papantonis, D.E. Simulation and size optimization of a pumped-storage power plant for the recovery of wind-farms rejected energy. Renew. Energy 2008, 33, 1685–1694. [Google Scholar] [CrossRef]
  80. Kaldellis, J.K.; Apostolou, D. Life cycle energy and carbon footprint of offshore wind energy. Comparison with onshore counterpart. Renew. Energy 2017, 108, 72–84. [Google Scholar] [CrossRef]
  81. Ardente, F.; Beccali, M.; Cellura, M.; Lo Brano, V. Energy performances and life cycle assessment of an Italian wind farm. Renew. Sustain. Energy Rev. 2008, 12, 200–217. [Google Scholar] [CrossRef]
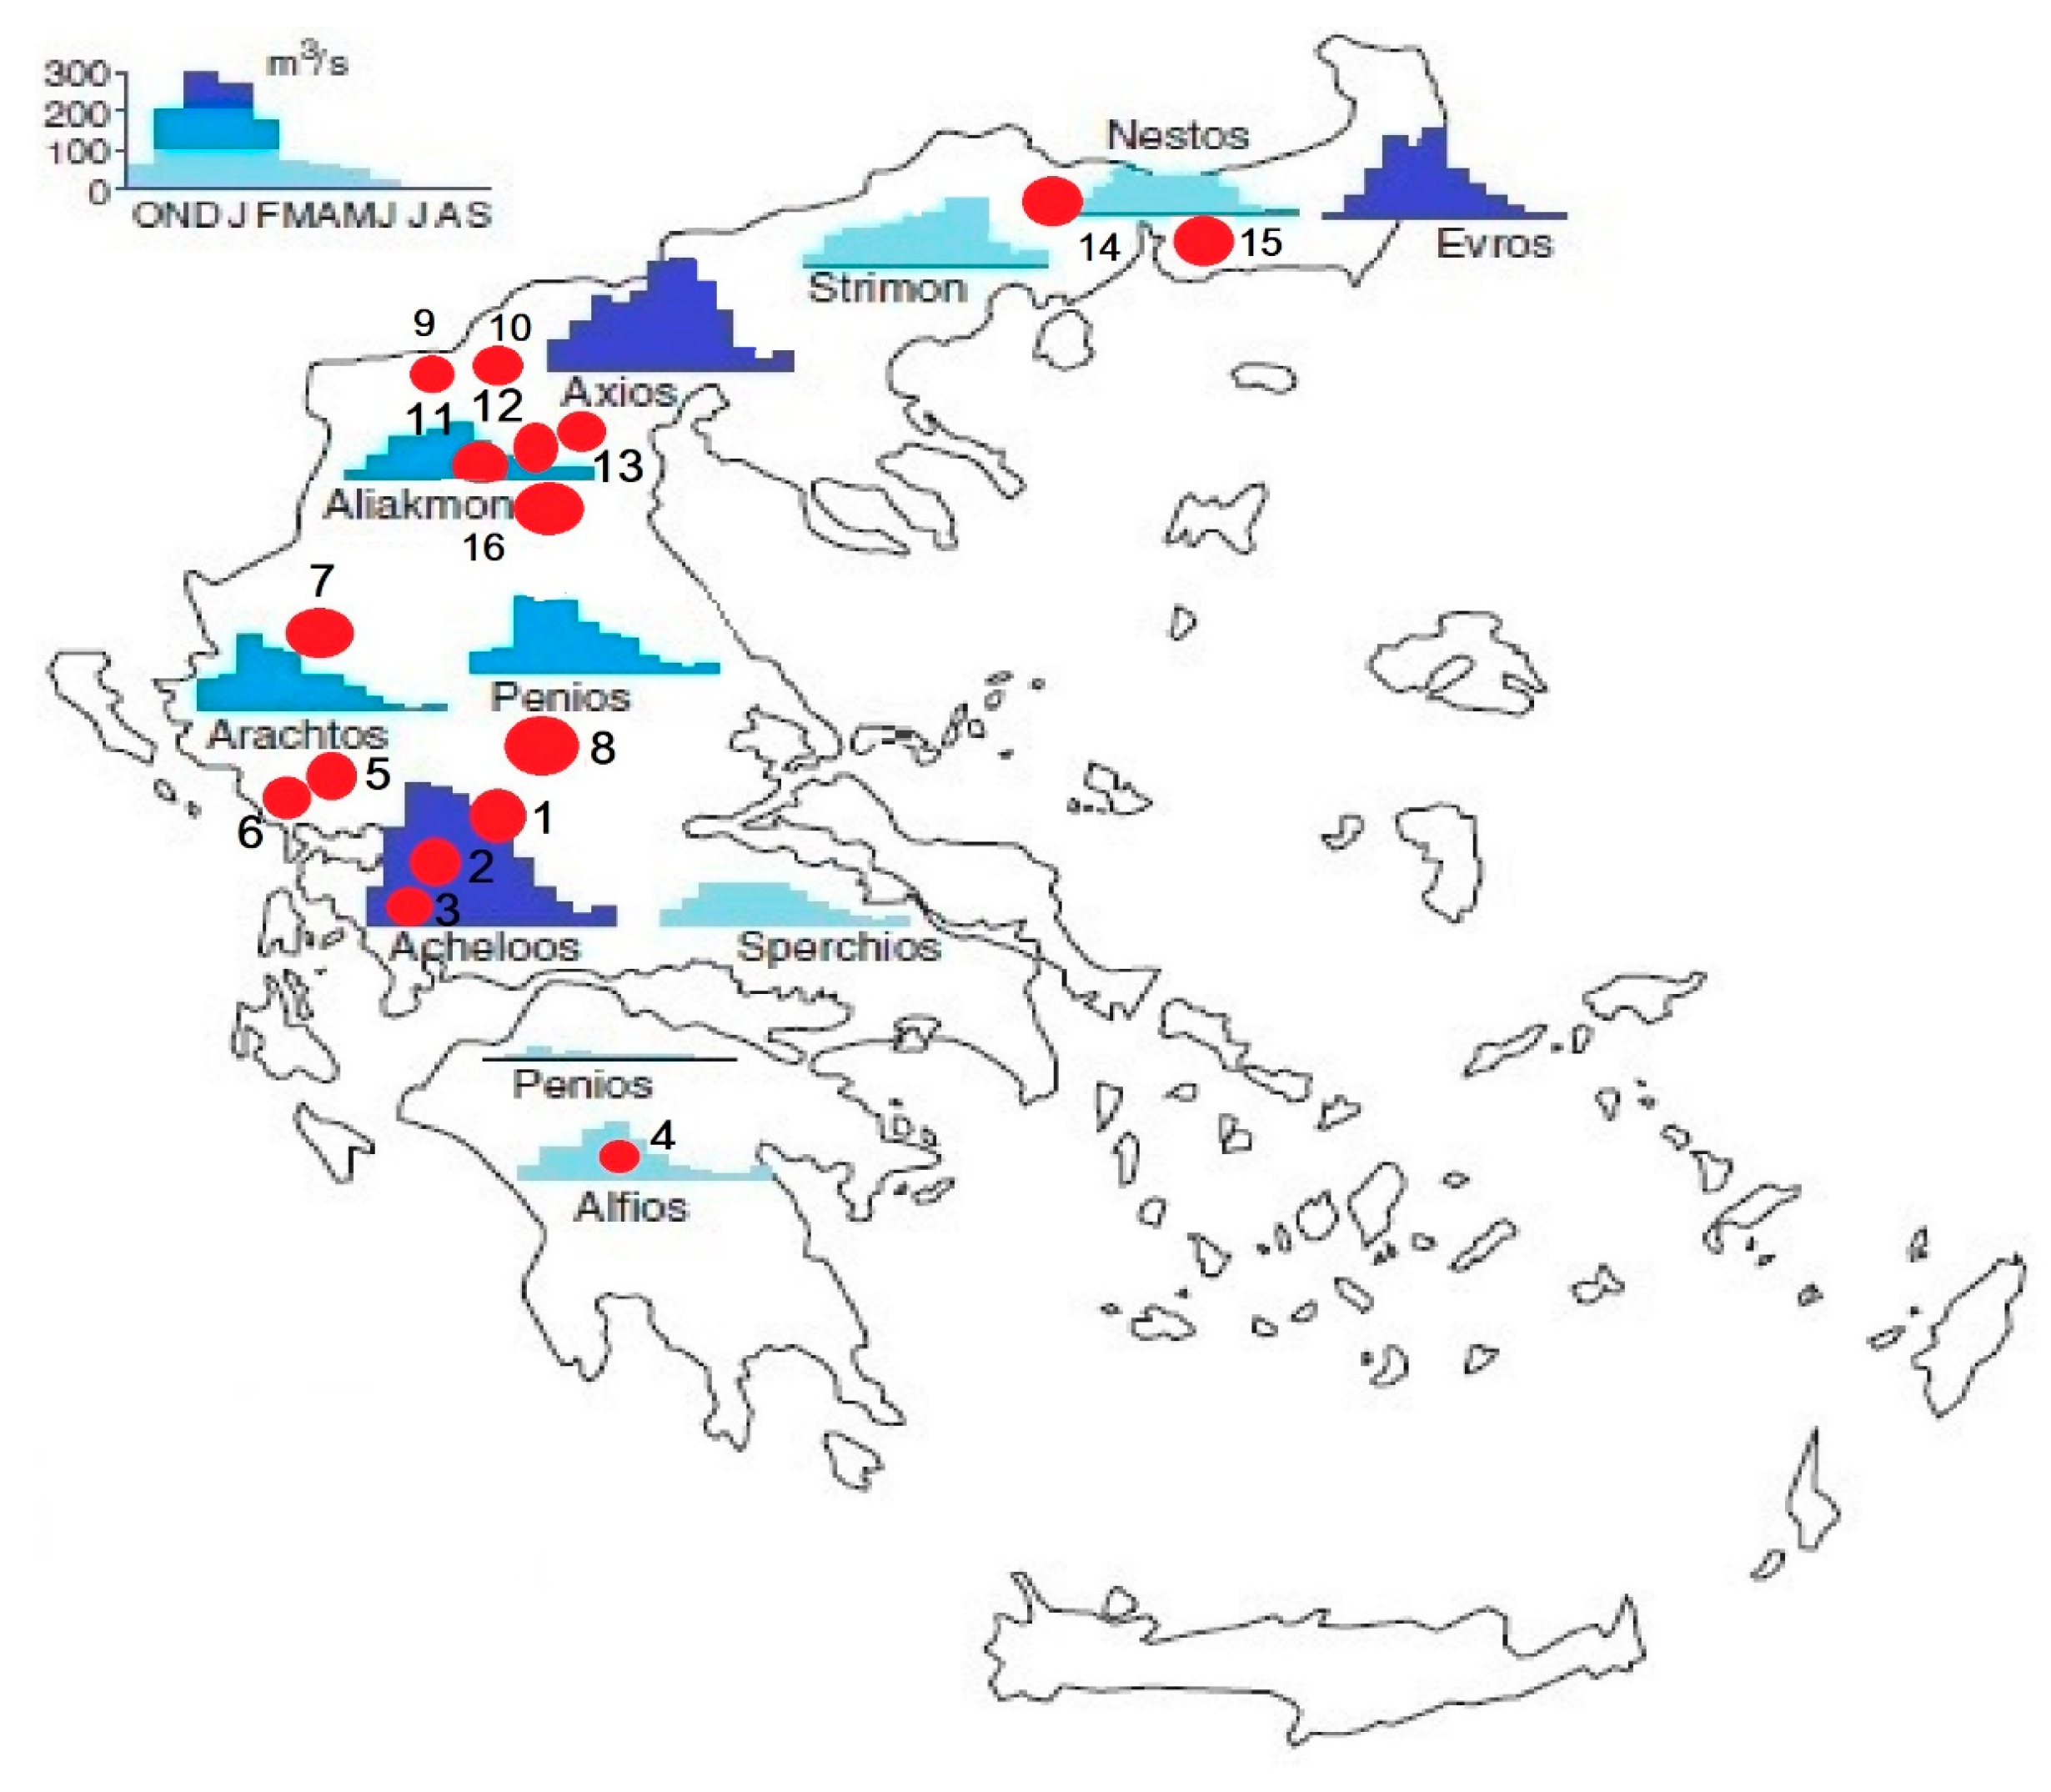
Figure 1. The world’s total energy production vs. hydroelectricity and total electricity production originated in RESs (including hydro).
Energies 18 02214 g001
Figure 2. Hydroelectricity’s share of total production and of renewables, and the RES share of total worldwide production.
Energies 18 02214 g002
Figure 3. The hydroelectric production (i.e., ≥0.1 TWhe) across European Union countries during 2023 and their cumulative share (green line-right hand axis) of total hydroelectricity production.
Energies 18 02214 g003
Figure 4. Electricity generation mix of the Greek mainland in 2005 vs. 2024 (data used: [22]).
Energies 18 02214 g004
Figure 5. Electricity generation evolution by source in Greece and the pertinent RES contributions in the time period 1990–2024 (based on available data provided by [14,20,22]).
Energies 18 02214 g005
Figure 6. RES electricity generation by source in Greece during the period 1990–2024.
Energies 18 02214 g006
Figure 7. Time evolution (1995–2024) of the Greek cumulative installed hydropower (large-scale) capacity (in MWe) (data used: DAPEEP [35]; IPTO [22]).
Energies 18 02214 g007
Figure 8. Annual average water flow rates of the major Greek rivers (adapted by Kaldellis [19]) as conjugated with the geographic distribution of the existing LHP plants in the Greek territory.
Energies 18 02214 g008
Figure 9. (a). Main characteristics of the existing LHPs in the Greek territories of Central Greece, Thessaly, Peloponnesus and Epirus (data used: Kaldellis [19], Argyrakis [37], PPC [34] and Ioakimidis et al. [38]). (b) Main characteristics of the existing LHPs in the Greek territory of Macedonia (data used: Kaldellis [19], Argyrakis [37], PPC [34] and Ioakimidis et al. [38]).
Energies 18 02214 g009aEnergies 18 02214 g009b
Figure 10. Greek LHP plants’ annual energy generation (in GWhe) during the time period 1995–2024.
Energies 18 02214 g010
Figure 11. Greek LHP plants’ monthly energy generation during the time period 2005–2024.
Energies 18 02214 g011
Figure 12. Monthly capacity factor variation of all Greek LHP plants for the time period 2006–2024.
Energies 18 02214 g012
Figure 13. Greek LHP plants’ annual average capacity factor during the time period of analysis.
Energies 18 02214 g013
Figure 14. Greek LHP plants’ monthly average capacity factor during the time period 2005–2024.
Energies 18 02214 g014
Figure 15. (a) Agras LHP Station CF Time Evolution for 1995–2024, (b) Edesseos LHP Station CF Time Evolution for 1995–2024, (c) Polifito LHP Station CF Time Evolution for 1995–2024, (d) Sfikia LHP Station CF Time Evolution for 1995–2024, (e) Assomata LHP Station CF Time Evolution for 1995–2024, (f) Ilarion LHP Station CF Time Evolution for 1995–2024.
Energies 18 02214 g015
Figure 16. Capacity Factor Time Evolution of LHPs of Arachthos River basin (1995–2024).
Energies 18 02214 g016
Figure 17. Capacity Factor Time Evolution of LHPs of Achelous River basin (1995–2024).
Energies 18 02214 g017
Figure 18. (a). Capacity Factor Time Evolution of Platanovrisi LHP of Nestos River basin (1995–2024), (b) Capacity Factor Time Evolution of Thissavros LHP of Nestos River basin (1995–2024).
Energies 18 02214 g018
Figure 19. Ladonas LHP Station Capacity Factor Time Evolution for 1995–2024.
Energies 18 02214 g019
Figure 20. Tavropos LHP Station Capacity Factor Time Evolution for 1995–2024.
Energies 18 02214 g020
Figure 21. (a) Agras LHP Station Energy Yield Time Evolution for 1995–2024, (b) Pournari II LHP Station Energy Yield Time Evolution for 1995–2024, (c) Edesseos LHP Station Energy Yield Time Evolution for 1995–2024, (d) Piges Aoou LHP Station Energy Yield Time Evolution for 1995–2024, (e) Assomata LHP Station Energy Yield Time Evolution for 1995–2024, (f) Platanovrisi LHP Station Energy Yield Time Evolution for 1995–2024, (g) Ilarion LHP Station Energy Yield Time Evolution for 1995–2024, (h) Tavropos LHP Station Energy Yield Time Evolution for 1995–2024.
Energies 18 02214 g021
Figure 22. (a) Pournari I LHP Station Energy Yield Time Evolution for 1995–2024, (b) Sfikia LHP Station Energy Yield Time Evolution for 1995–2024, (c) Stratos I LHP Station Energy Yield Time Evolution for 1995–2024, (d) Ladonas LHP Station Energy Yield Time Evolution for 1995–2024.
Energies 18 02214 g022
Figure 23. (a) Kremasta LHP Station Energy Yield Time Evolution for 1995–2024, (b) Kastraki LHP Station Energy Yield Time Evolution for 1995–2024, (c) Polifito LHP Station Energy Yield Time Evolution for 1995–2024, (d) Thissavros LHP Station Energy Yield Time Evolution for 1995–2024.
Energies 18 02214 g023
Figure 24. Schematic diagram of a pumped hydro storage system.
Energies 18 02214 g024
Table 1. The most important Greek rivers and their annual average water flow rates (data used: Kaldellis [19]; Poulos [36]).
River Geographical DistrictAnnual Average Water Flow Rate (m3 s−1)
EvrosEast Macedonia–Thrace ~110
NestosEast Macedonia–Thrace ~90
StrimonMacedonia ~110
AxiosMacedonia ~160
AliakmonMacedonia~80
PeniosThessaly ~80
ArachthosEpirus ~70
AcheloosCentral Greece ~190
SperchiosCentral Greece ~60
AlfiosPeloponnesus ~70
Penios (Iliakos)Peloponnesus ~15
Table 2. Carbon intensity of various electricity generation technologies (data used: Kaldellis and Apostolou [80]; Ardente et al. [81]).
Electricity Generation TechnologyCarbon Intensity (g CO2/kWhe)
Coal–lignite900–1200
Natural gas400–500
Hydropower15–40 1
1 The carbon intensity of hydropower plants corresponds to the relevant CO2 emissions realized mainly during their erection.
Disclaimer/Publisher’s Note: The statements, opinions and data contained in all publications are solely those of the individual author(s) and contributor(s) and not of MDPI and/or the editor(s). MDPI and/or the editor(s) disclaim responsibility for any injury to people or property resulting from any ideas, methods, instructions or products referred to in the content.

