Abstract
A cost effective catalyst is of great importance for consideration of MgH2 as potential hydrogen storage material. In this regard, we investigated the catalytic role of alkaline metal fluoride on the hydrogen storage behavior of MgH2. Samples were synthesized by admixing 5 mol % MgF2 into MgH2 powder using planetary ball mill. Hydrogenation measurements made at 335 °C showed that in comparison to only 70% absorption by pure MgH2, catalyzed material absorbed 92% of theoretical capacity in less than 20 min and desorbed completely in almost the same time. Sorption studies done at lower temperatures revealed that complete absorption at temperature as low as 145 °C is possible. This is due to uniform distribution of MgF2 nano particles within the MgH2 powder. X-ray diffraction patterns also showed the presence of stable MgF2 phase that does not decompose upon hydrogen absorption-desorption. Cyclic measurements done at 310 °C showed negligible loss in the overall storage capacity with cycling. These results reveal that the presence of the chemically inert and stable MgF2 phase is responsible for good reversible characteristic and improved kinetics.
1. Introduction
Magnesium hydride is a potential candidate for hydrogen storage because of its high gravimetric and volumetric capacities. Pure magnesium’s low environmental impact and abundant availability makes it very attractive for hydrogen storage application. However, high working temperature and slow kinetics limit its potential as hydrogen storage material for practical applications. Therefore, research is required to circumvent these difficulties and make MgH2 a viable hydrogen storage material. Nano-structuring of MgH2 is one of the most adopted methods to improve the hydrogenation performance [1]. However, this method has a limitation to achieve the nanocrystalline size (<5 nm) required for destabilization of MgH2 [2].
Further improvements in sorption behaviour have been achieved by adding a wide variety of pure transition metals [3,4], their oxides [5] and halides [6,7,8]. The remarkable catalytic effect of transition metal oxide, Nb2O5 has been well reported. However, during cycling at elevated temperatures, reduction of Nb2O5 occurs with augmentation of MgO content [5]. Later, it was found that some transition metal halides, such as FeF3, CrCl3, NiF2, NbCl5 and TiCl3 possess better catalytic activity than pure metals or their oxides [6,7,8]. In the case of halides, Malka et al. [9] showed that fluorides are better catalysts than chlorides for MgH2. Addition of transition metal fluorides during milling helps to lower the hydrogen release temperature and increase the rate of hydrogen uptake by MgH2. It has been shown by different groups [7,8,9] that during milling of MgH2 with transition metal fluorides, the formed MgF2 phase replaces the original oxide layer and provides a reactive and protective fluorinated surface for hydrogen uptake. This compound possesses high affinity with hydrogen because of the F-anion, which weakens the Mg-H bonding and improves the sorption properties [9].
However, not much work has been done on direct use of MgF2 as an additive for MgH2. Ivanov et al. [10] reported that addition of 5 wt % MgF2 to pure Mg during milling leads to 5 wt % hydrogen absorption in over 20 h but has an insignificant effect on dehydrogenation kinetics of MgH2. Loss in absorption capacity from the second cycle onwards was also observed. Recently, Ma et al. [11] investigated the catalytic effects of MgF2 and TiH2 to understand the kinetic improvements obtained when MgH2 was ball milled with 4 mol % TiF3. They reported that sole addition of 6 mol % MgF2 has negligible catalytic effect on MgH2 at an operating temperature of 150 °C.
The limited and inconsistent results attained on catalytic effect of MgF2 on MgH2 shows that more work needs to be done to understand this system both from hydrogenation and material perspective. The present work is aimed to investigate the microstructural, morphological and hydrogenation behaviour of MgH2 when MgF2 is used as additive.
2. Results
2.1. Comparison of Undoped and 5 mol % MgF2 Doped MgH2 at 335 °C
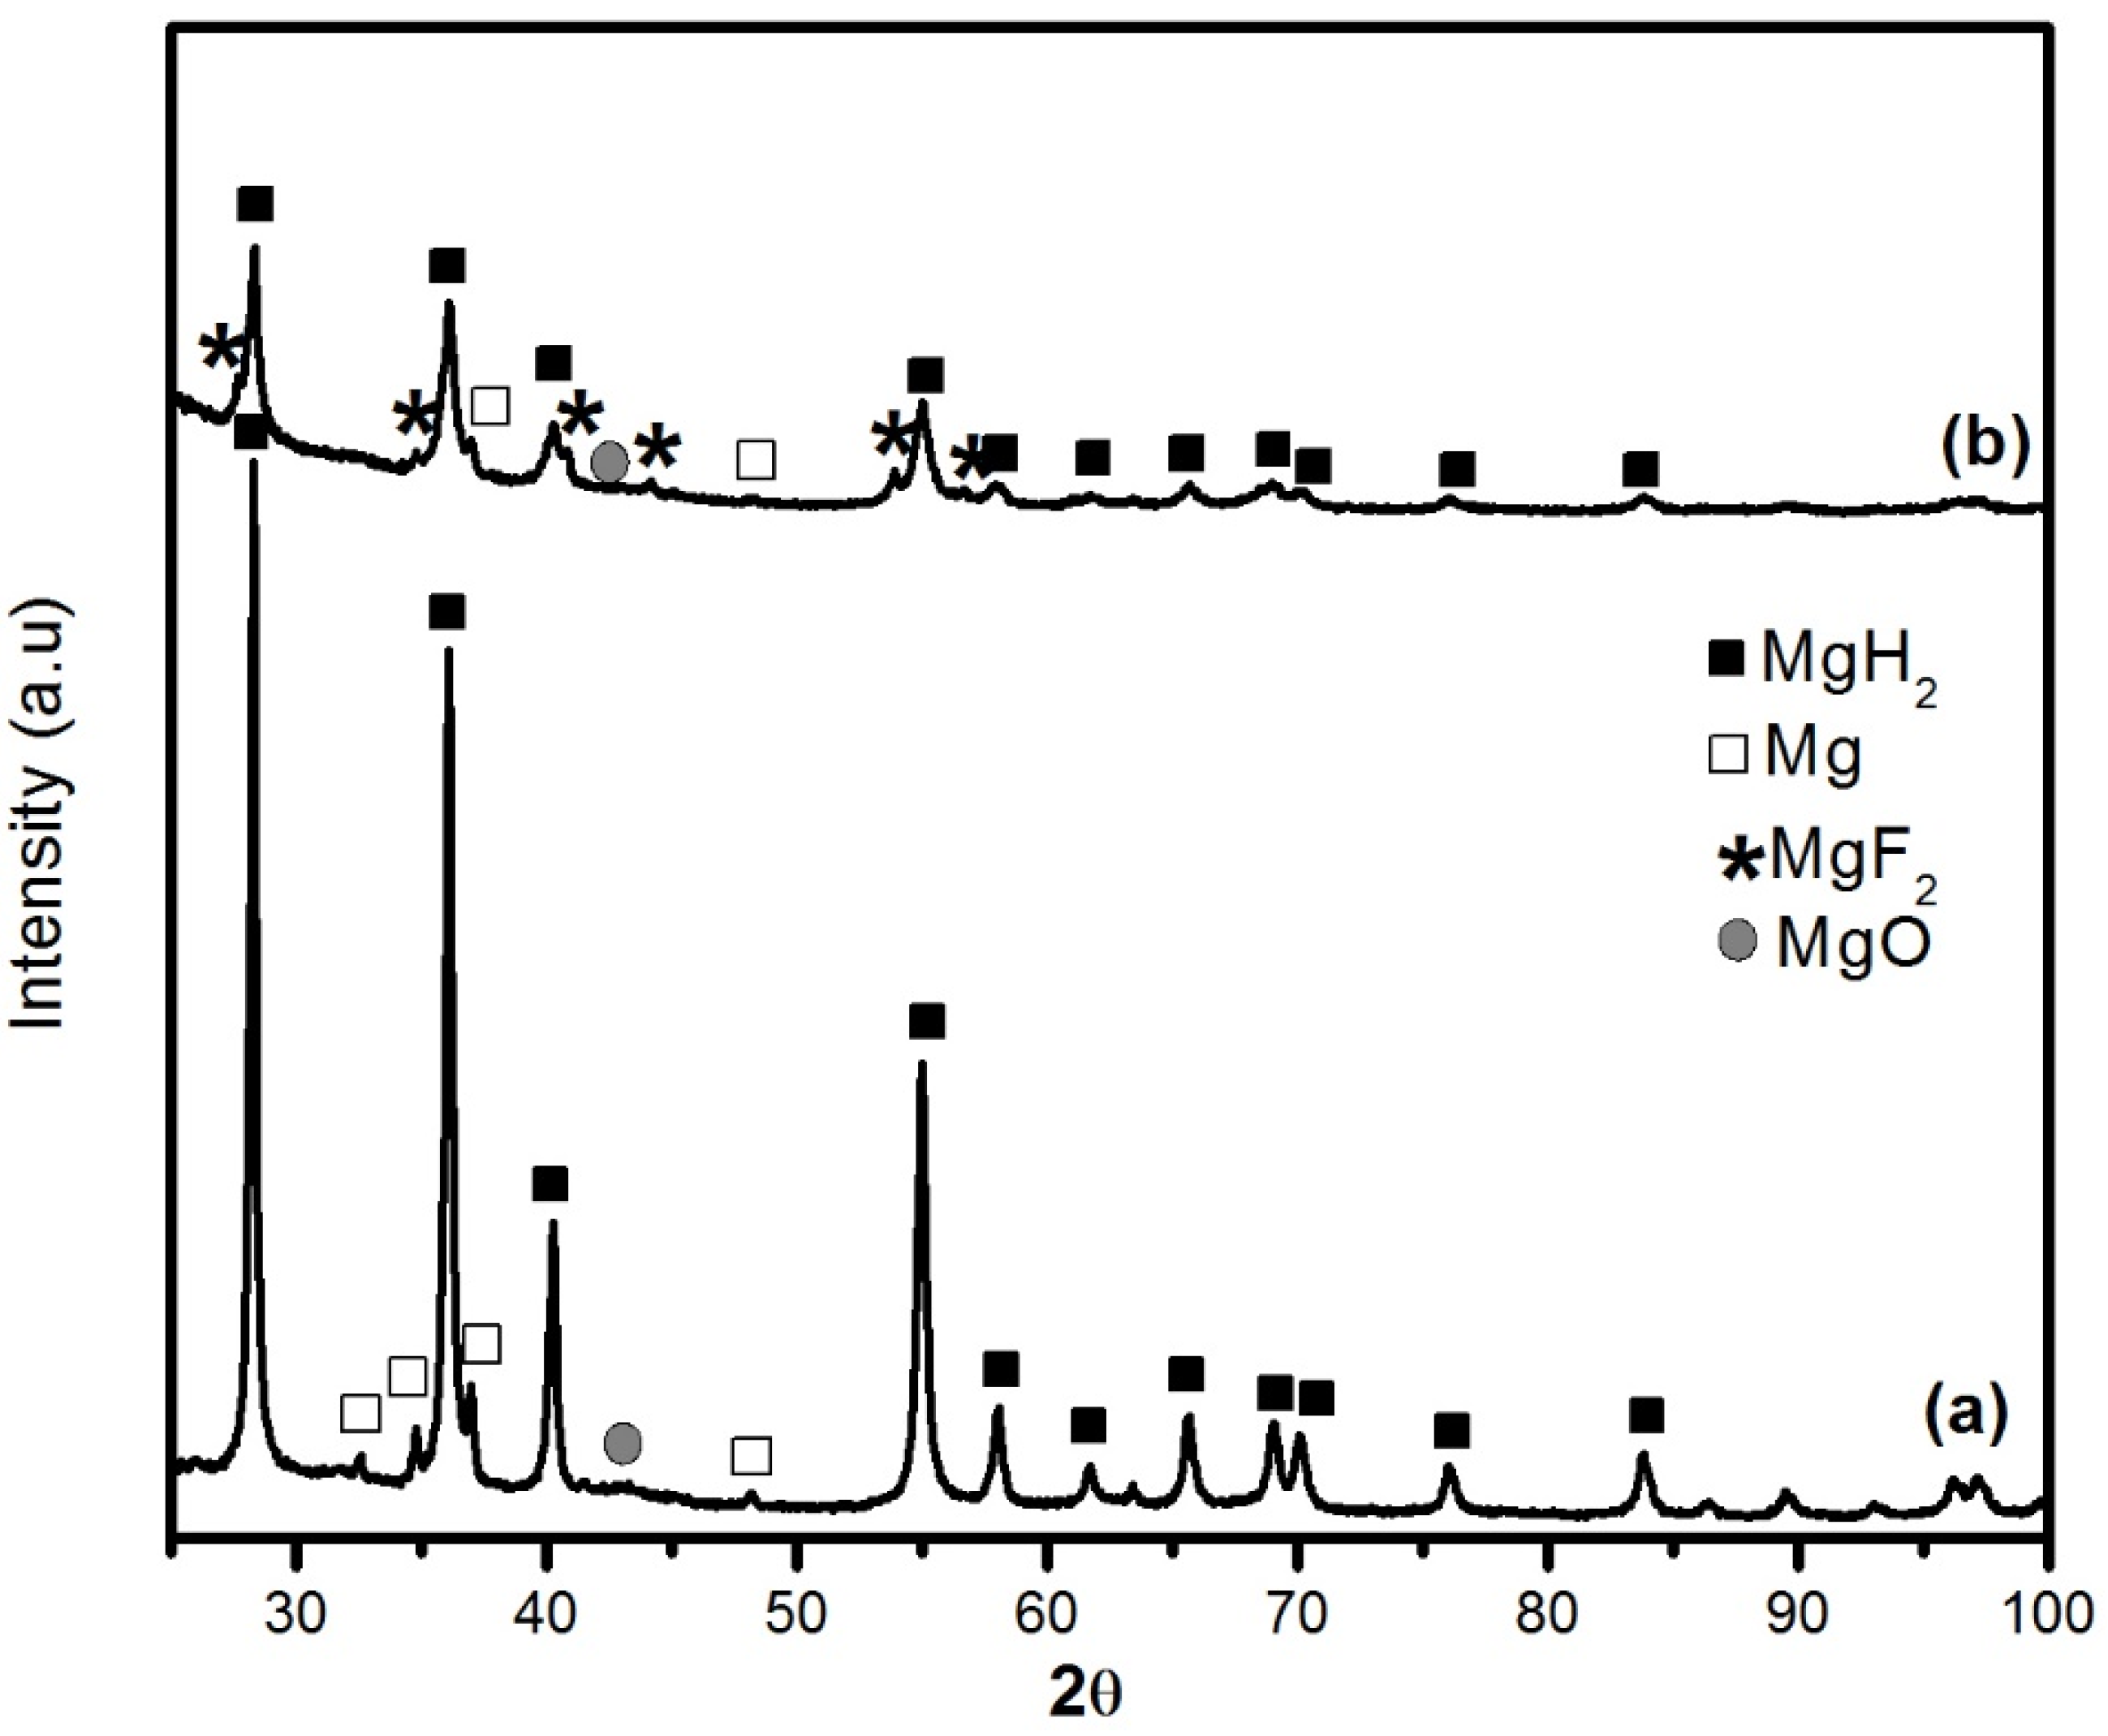
The X-ray diffraction (XRD) patterns of MgH2 without and with 5 mol % MgF2 prepared by 1 h ball milling are shown in Figure 1. For the undoped sample, the diffraction pattern peaks are associated with main phase of β-MgH2 and some unreacted Mg. There is no evidence of the metastable γ-MgH2 phase. This is due to the short milling time and low milling intensity. A broad peak centered at 43° is attributed to MgO. The crystallite size of β-MgH2 is evaluated from Rietveld refinement to be 23.4 ± 0.3 nm. Milling with MgF2 additive was even more effective for reduction of crystallite size of MgH2 that was evaluated as 10.9 ± 0.3 nm. During milling there is physical interaction between the different species during the repeating collisions. Therefore, the MgF2 has also some mechanical effect on MgH2. Unfortunately, the alloying of brittle-brittle system is poorly understood [12]. However, from the present experiment it seems that addition of small amount of MgF2 improves crystallite size reduction but the exact mechanism is still unclear.
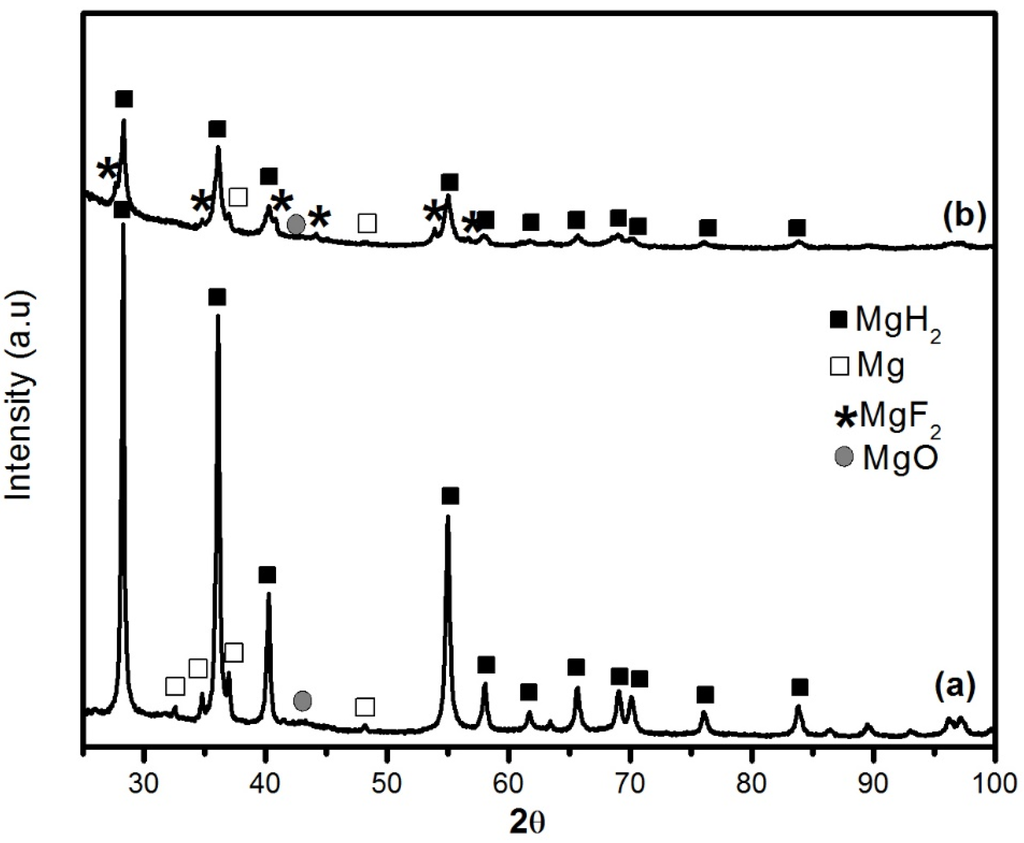
Figure 1.
XRD patterns of ball milled samples milled 1 h: (a) pure MgH2 and (b) MgH2 + 5 mol % MgF2.
Figure 1.
XRD patterns of ball milled samples milled 1 h: (a) pure MgH2 and (b) MgH2 + 5 mol % MgF2.
In practical applications, desorption will be performed under a pressure of at least 100 kPa of hydrogen. However, in order to study the behaviour of MgH2–MgF2 system, we decided to fully dehydride the samples after ball milling. Therefore, after milling the samples were completely desorbed at 335 °C under dynamic vacuum before investigating their hydrogenation properties. Representative hydrogenation and dehydrogenation characteristics are shown in Figure 2.
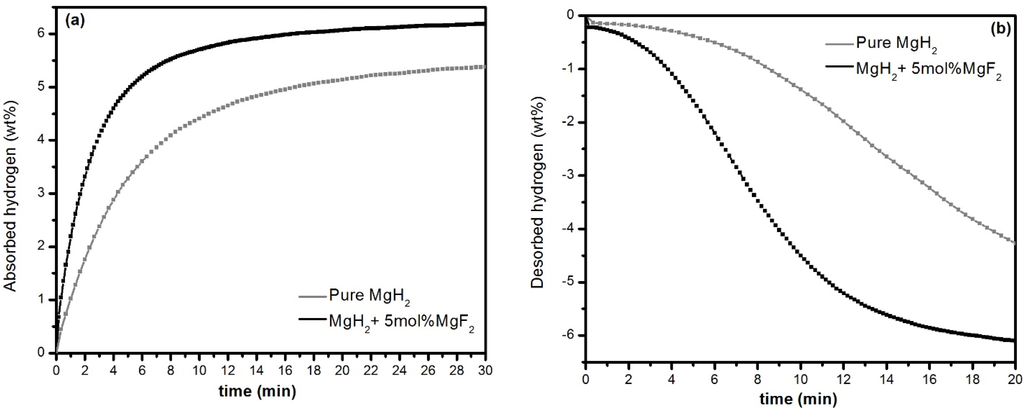
Figure 2.
Hydrogen sorption kinetics at 335 °C of 1 h milled MgH2 without and with 5 mol % MgF2. (a) First absorption under 1000 kPa H2; (b) desorption under 100 kPa H2.
Figure 2.
Hydrogen sorption kinetics at 335 °C of 1 h milled MgH2 without and with 5 mol % MgF2. (a) First absorption under 1000 kPa H2; (b) desorption under 100 kPa H2.
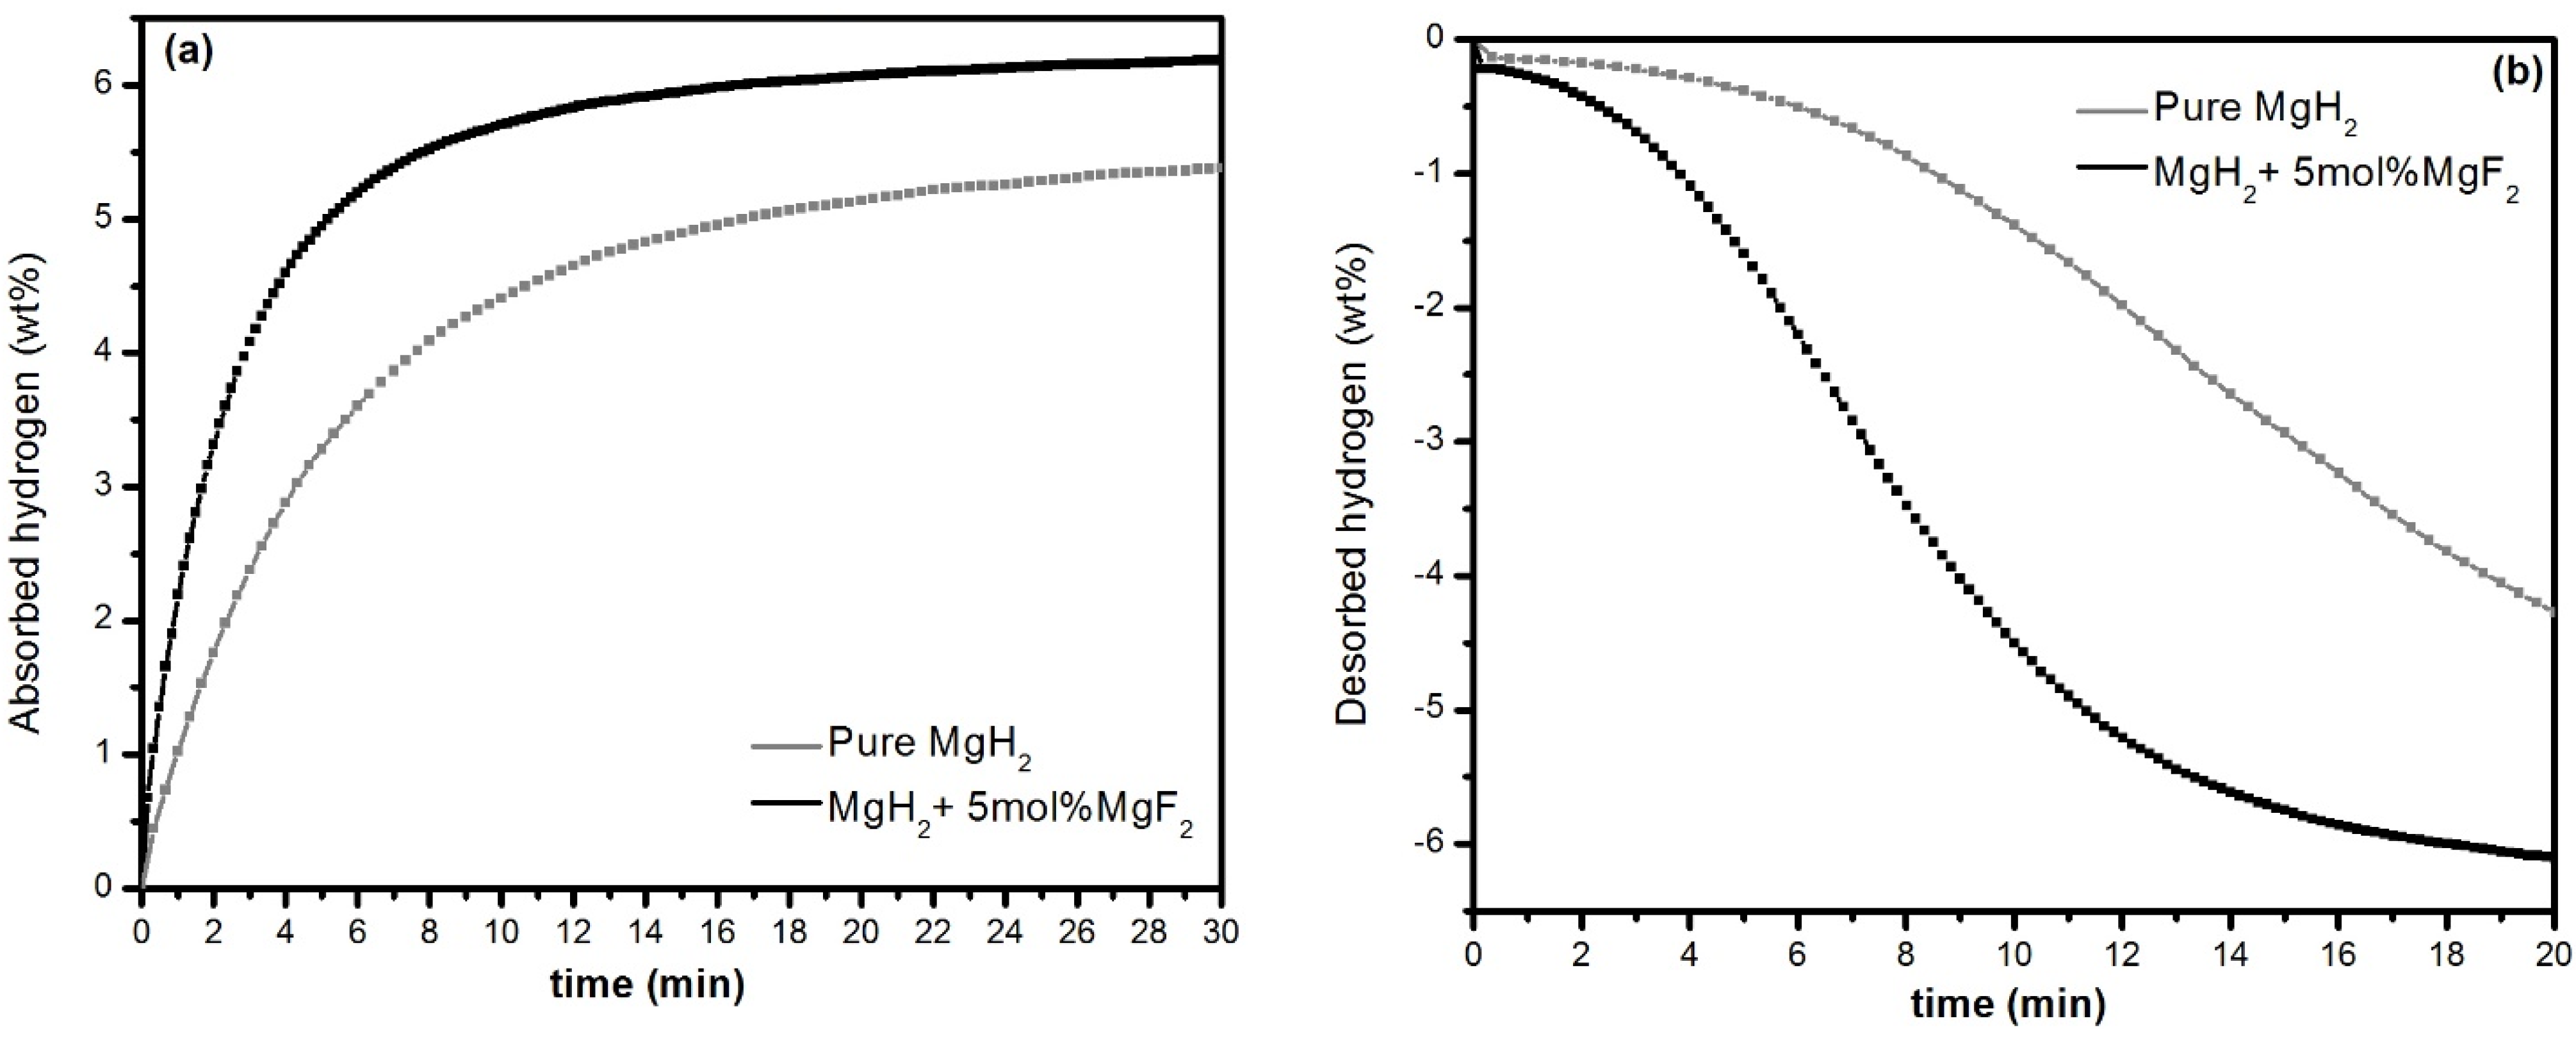
It is observed that at 335 °C under 1000 kPa H2 pressure MgH2 + 5 mol % MgF2 system absorbs 6.2 wt % hydrogen in 30 min in comparison to only 5.3 wt % absorption by pure MgH2. This shows a large improvement in absorption capacity is achieved, yielding 92% of the theoretical capacity in comparison to 70% for the pure MgH2. In addition, significant improvement in desorption kinetics is achieved with complete desorption of the hydride phase in less than 20 min in presence of MgF2. Thus, the beneficial effect of MgF2 is clearly evident on the hydriding/dehydriding aspect of MgH2.
Figure 3 shows the diffraction patterns of the doped sample in its desorbed and reabsorbed states. The desorbed pattern shows a small amount of un-desorbed MgH2. The interesting fact is that MgF2 is still present in the sample. This could be expected because it is known that for MgH2-transition metal (TM) fluoride systems, milling or dehydrogenation induces the formation of MgF2 and TM hydride [4,11]. Thus, MgF2 is a stable compound and does not react to form MgH2.
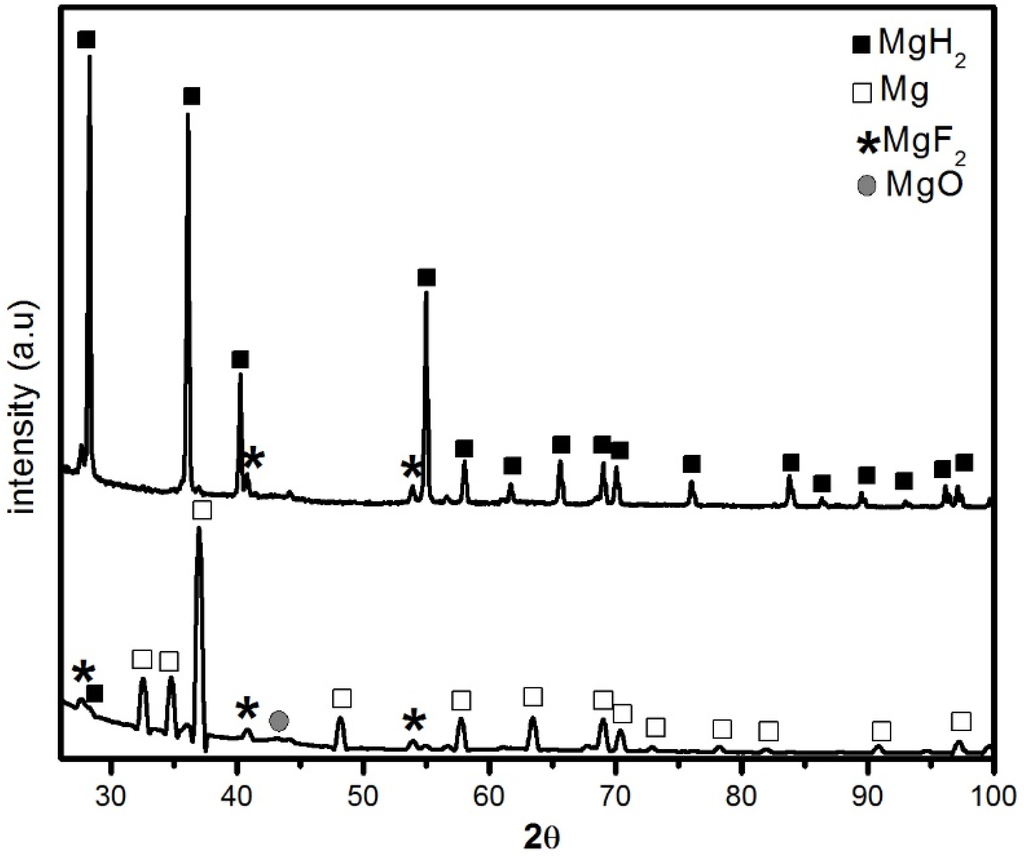
Figure 3.
XRD patterns of MgH2 + 5 mol % MgF2 (a) after desorption at 335 °C under 100 kPa H2 and (b) after re-hydrogenation at 335 °C under 1000 kPa H2.
Figure 3.
XRD patterns of MgH2 + 5 mol % MgF2 (a) after desorption at 335 °C under 100 kPa H2 and (b) after re-hydrogenation at 335 °C under 1000 kPa H2.
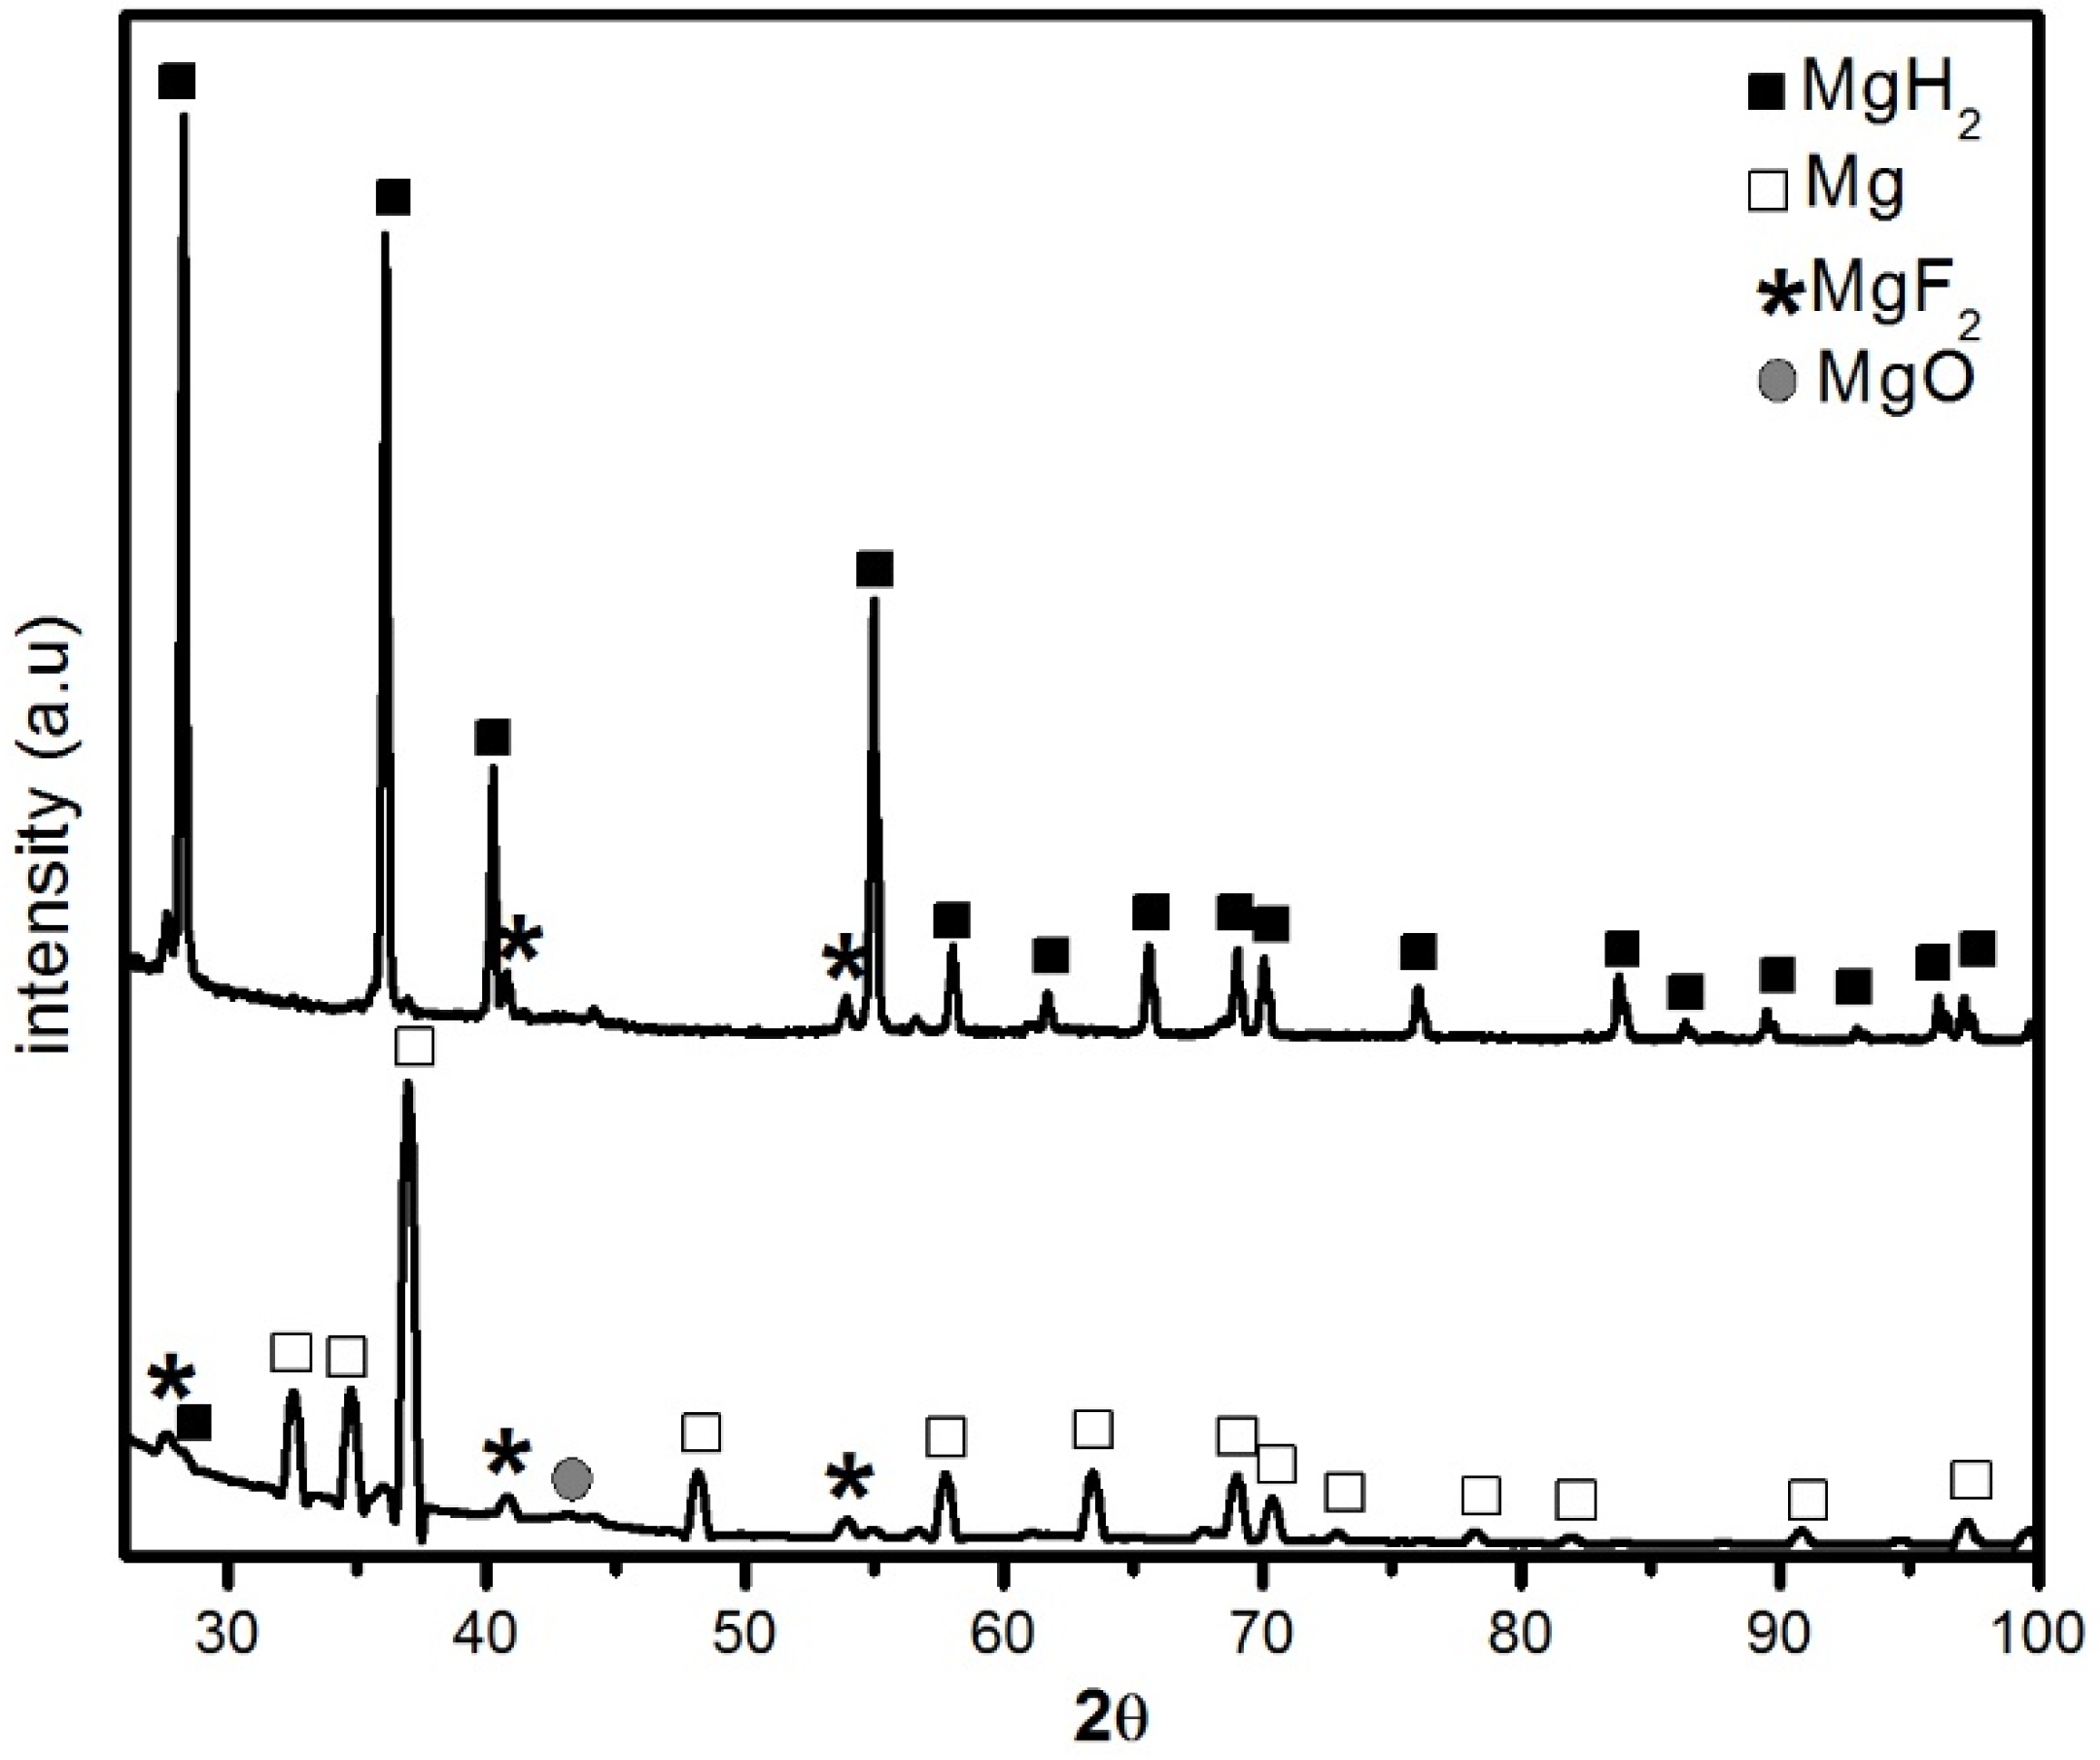
This is confirmed by the diffraction pattern of fully hydrided sample. The phases present are MgH2 and MgF2 along with small amount of unreacted Mg. Compared to the patterns of Figure 1 we see that the peaks of patterns of Figure 3 are not as broad, implying that the crystallite size increased. From Rietveld analysis we found that the crystallite size of Mg in the dehydrided pattern is 49.1 ± 0.8 nm while the crystallite size of MgH2 in the reabsorbed pattern is 64 ± 2 nm. This shows that there is grain growth compared to the as-milled sample. This may be due to the high temperature of hydrogenation and also because of desorption/absorption itself.
Figure 4 shows the SEM images of MgH2 + 5 mol % MgF2 composite in (Figure 4a) desorbed state and (Figure 4b) after re-hydrogenation at 335 °C in comparison with pure MgH2 (Figure 4c). The images show that ball milling with additive leads to effective decrease in particle size. In addition, energy dispersive X-ray (EDX) mapping done at higher magnification (Figure 5) shows that agglomerates consist of smaller MgH2 particles and additive.
Elemental mapping made on MgH2 + 5 mol % MgF2 in both the desorbed state (Figure 5a) and re-hydrogenated state (Figure 5b) confirms homogenous distribution of MgF2.
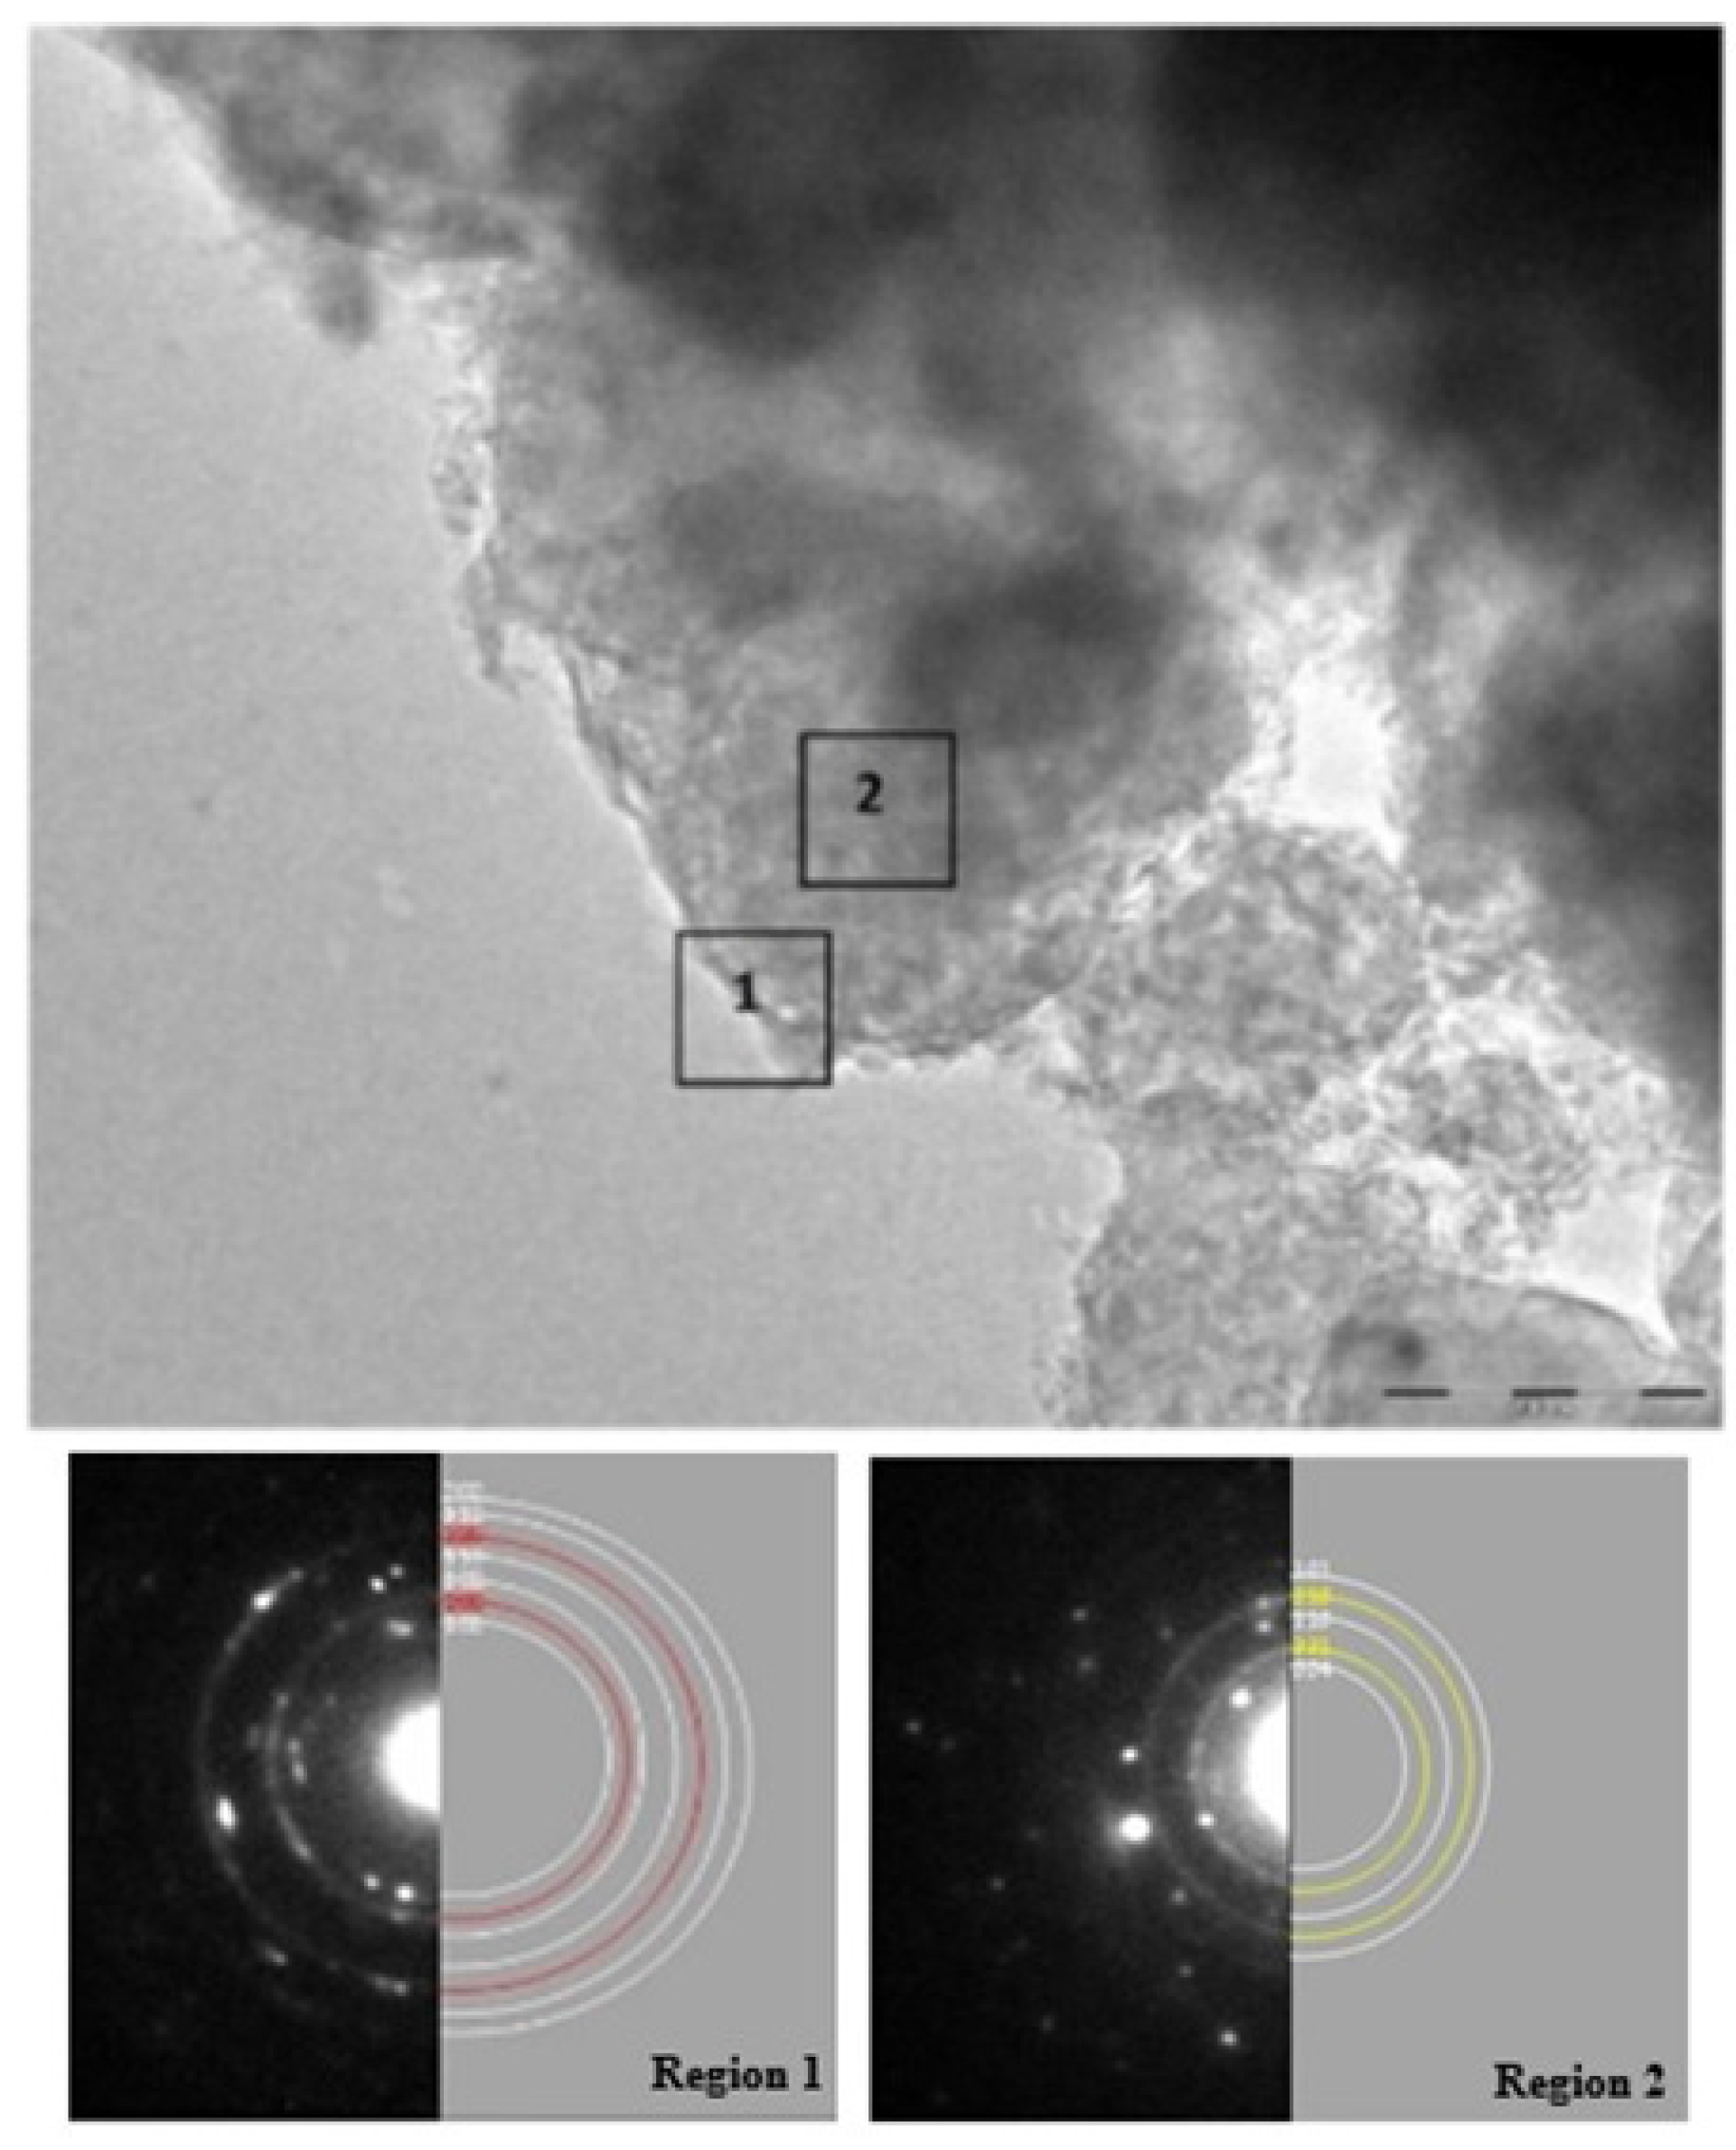
High energy milling leads to uniform dispersion of MgF2 phase in MgH2 matrix which may act as a catalytic layer and contributes in improving sorption properties. Chemical analysis performed by EDX spectroscopy during transmission electron microscopy (TEM) investigation of the desorbed sample gave the average atomic composition of different elements as 9.8% O, 14.7% F and 75.7% Mg which is very close to the nominal composition (86% Mg and 14% F). The presence of oxygen in EDX pattern in comparison to its small trace in XRD pattern could be due to small crystallite size of MgO making it peak difficult to distinguish from the background. A similar EDX investigation was performed on a sample that has been submitted to five dehydrogenation/hydrogenation cycles. Because abundances vary from point to point, we average over four different localisations. We found that, after cycling, the atomic composition of different elements was 15% ± 4% O, 11% ± 4% F and 74% ± 6% Mg. Within experimental error, these values are similar to the ones before cycling. However, this may be an indication that cycling induces a loss of MgF2 and increase of MgO. Typical TEM micrographs presented in Figure 6 shows the morphology of the desorbed sample.
The image shows presence of large number of particles agglomerated together with no visibility clear particle boundaries. These observations are quite similar to those reported recently by Grzech et al. [13]. High resolution pictures taken over region-1 in Figure 6 and its corresponding selected area electron diffraction (SAED) patterns shows reflections at d-spacing 2.45, 1.90, 1.60, 1.36 and 1.22 Å which are characteristic of Mg (101), (102), (110), (112) and (202) planes respectively along with reflections at d values 2.10 and 1.48 Å, corresponding to MgO (200) and (220) planes. Thus, the surface consists of small crystallites of MgO (forming well defined ring and represented by red rings) surrounding the large crystallites of Mg (seen as discontinuous spots and represented by white rings). While the multiple SAED patterns acquired from the region-2 were well indexed as a mixture of large crystallite Mg and small crystallite of MgF2 (seen as well-defined rings and colored yellow). The absence of oxide in region-2 is evidence that presence of fluoride limits MgO only to the surface. Both structural and morphological studies support the presence of MgF2 phase even after complete hydrogen absorption/desorption cycle at 335 °C.
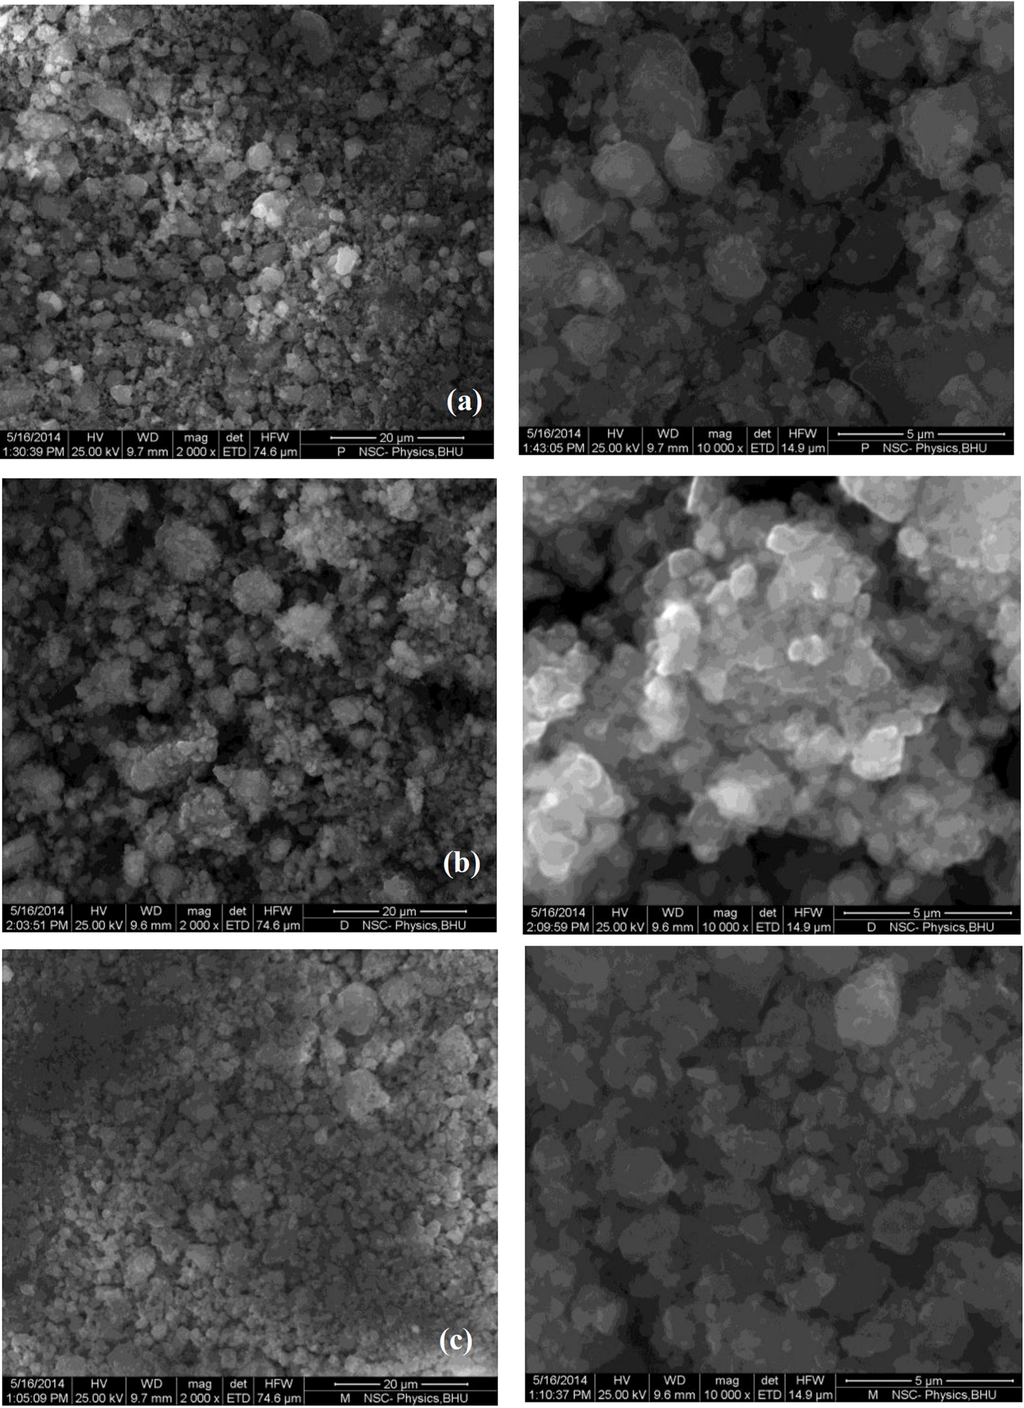
Figure 4.
SEM images for MgH2 + 5 mol % MgF2 in (a) desorbed state and (b) re-hydrogenated state in comparison to (c) pure MgH2.
Figure 4.
SEM images for MgH2 + 5 mol % MgF2 in (a) desorbed state and (b) re-hydrogenated state in comparison to (c) pure MgH2.
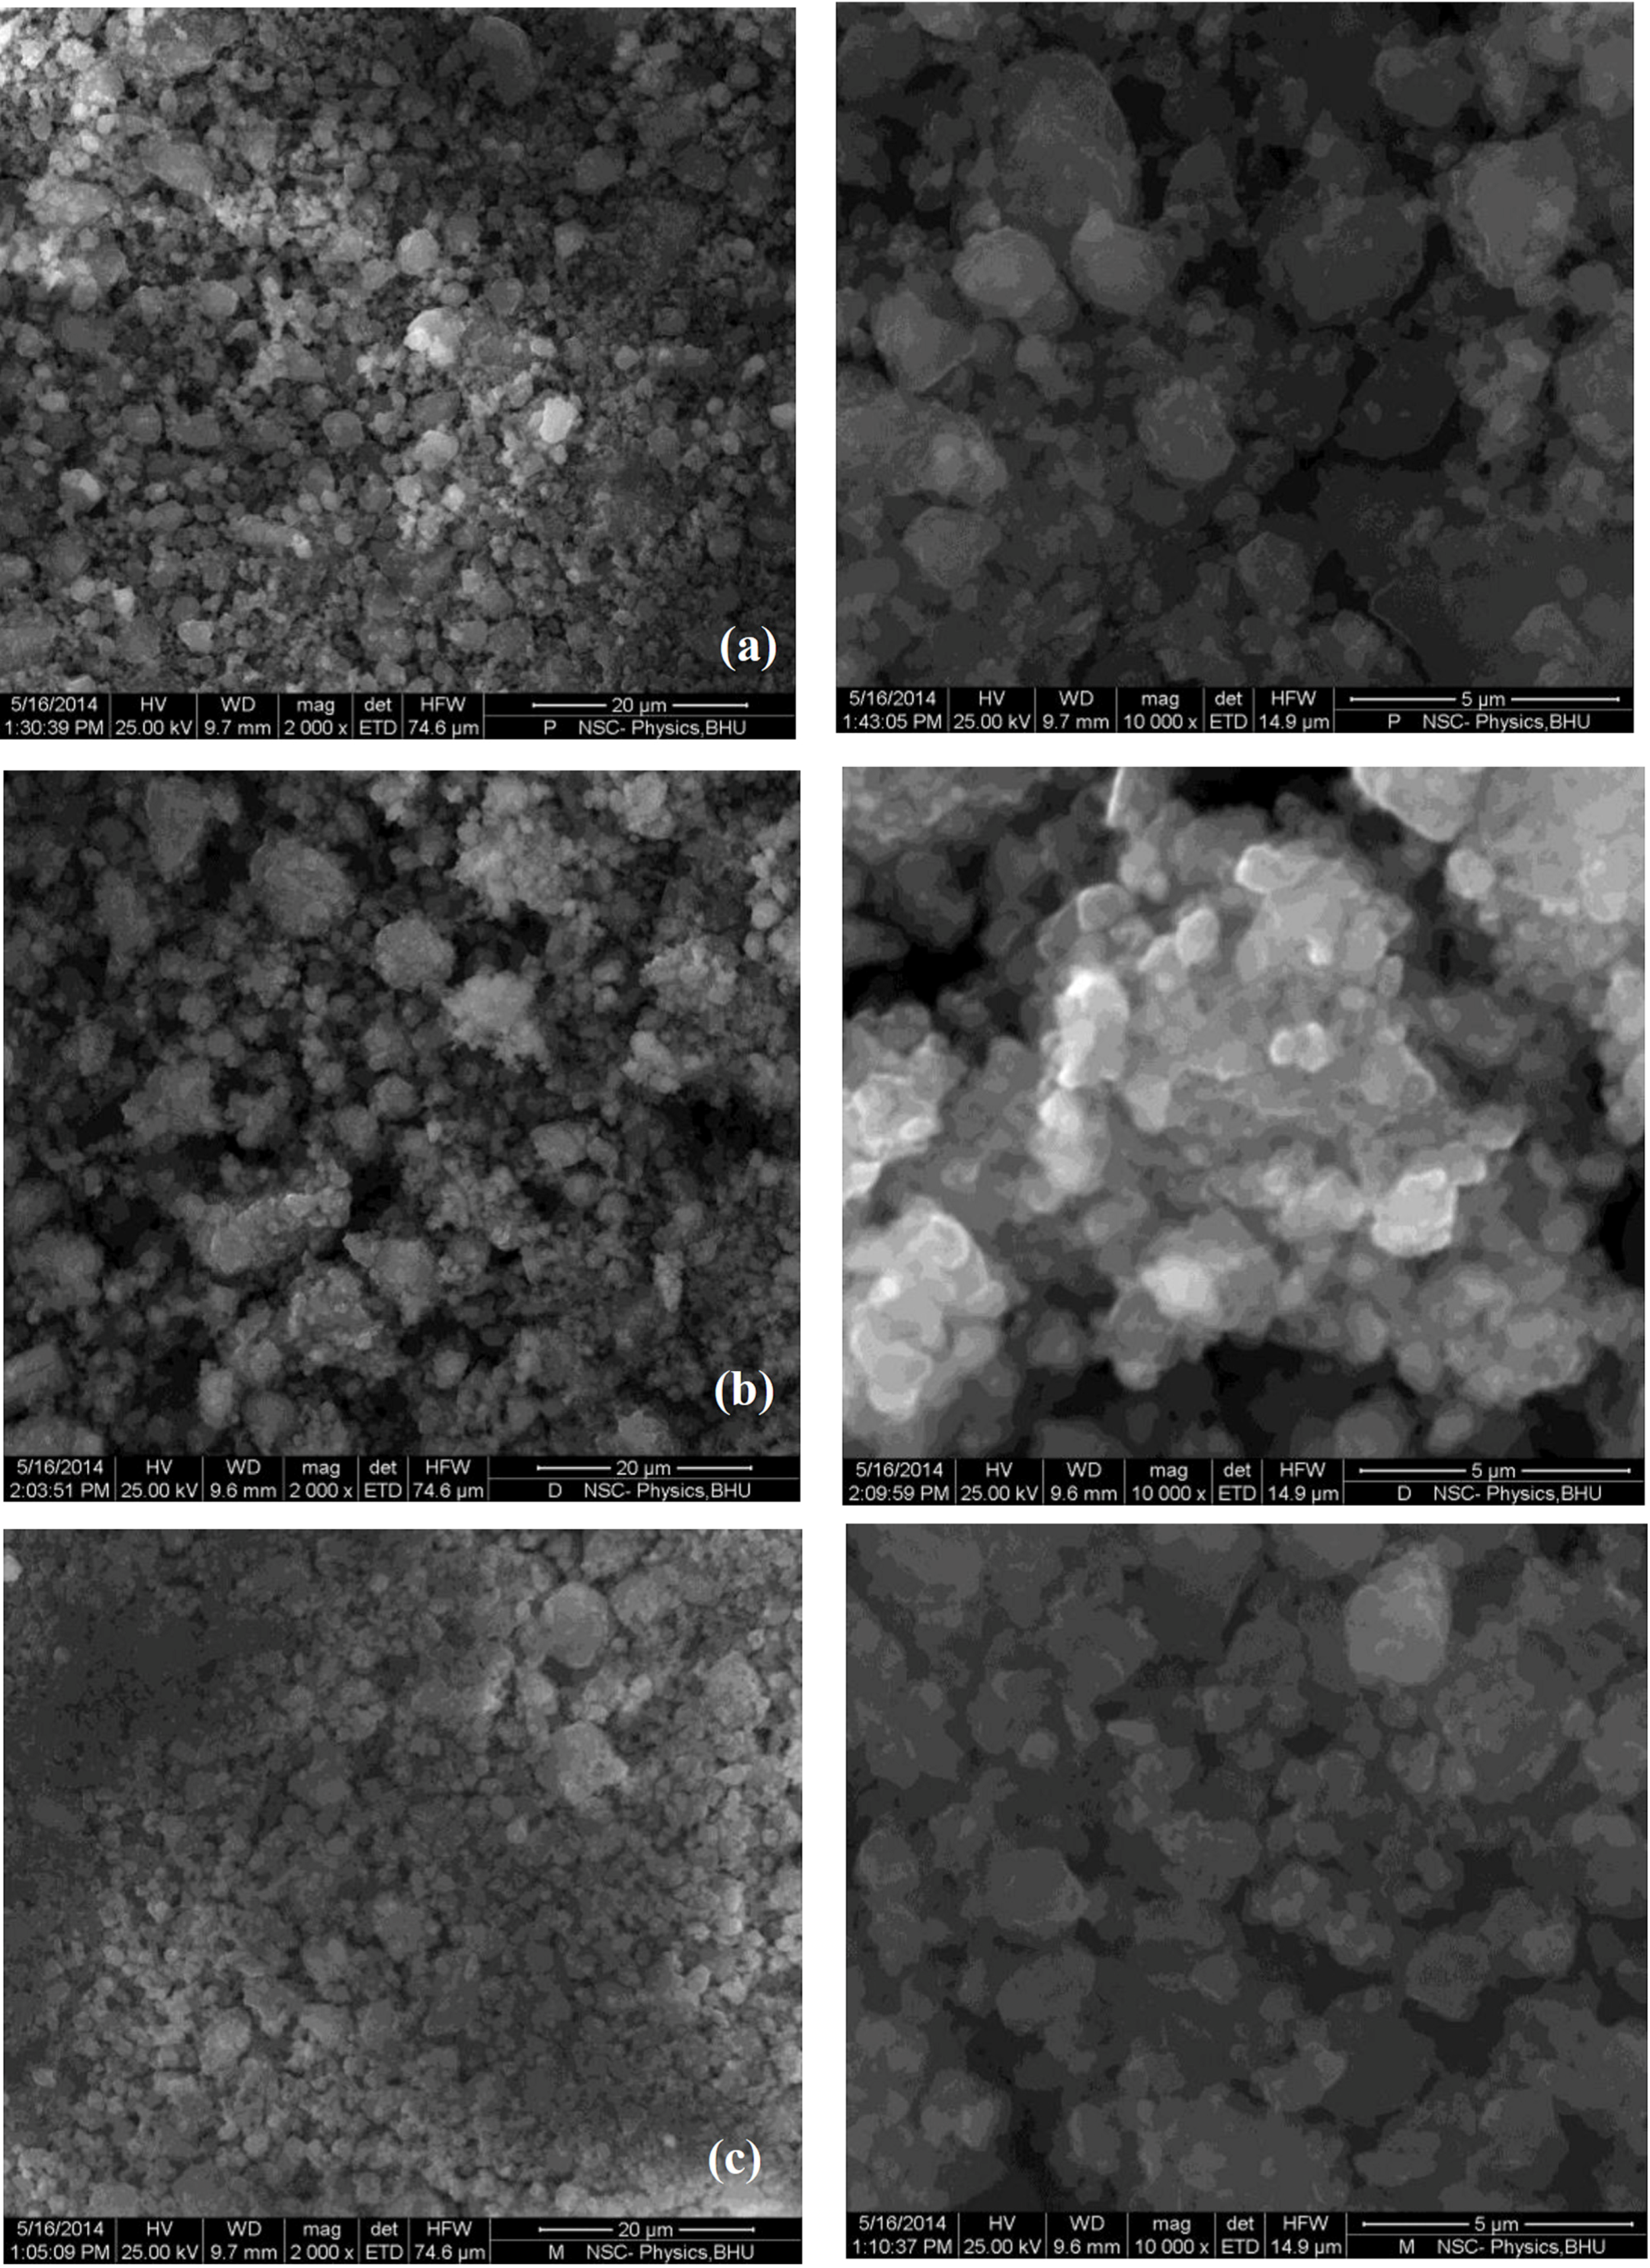
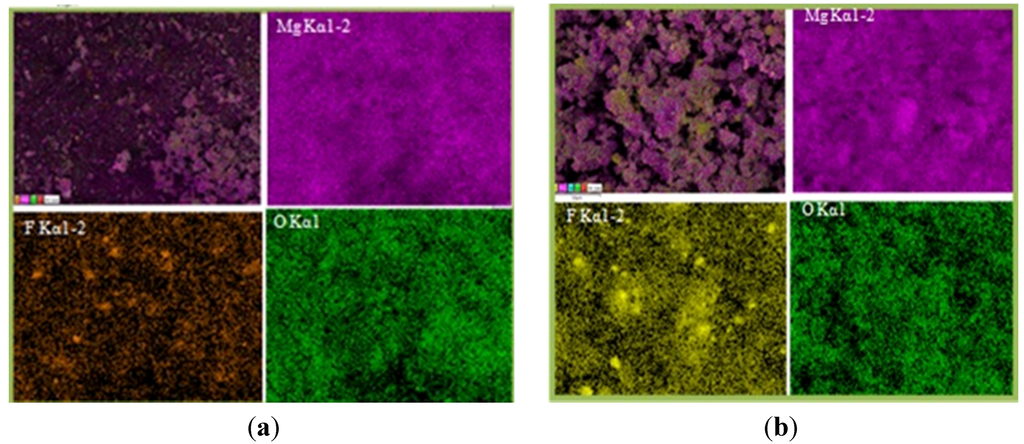
Figure 5.
Elemental mapping showing particle morphology and distribution of 1 h milled MgH2 + 5 mol % MgF2: (a) after desorption and (b) after re-hydrogenation at 335 °C.
Figure 5.
Elemental mapping showing particle morphology and distribution of 1 h milled MgH2 + 5 mol % MgF2: (a) after desorption and (b) after re-hydrogenation at 335 °C.
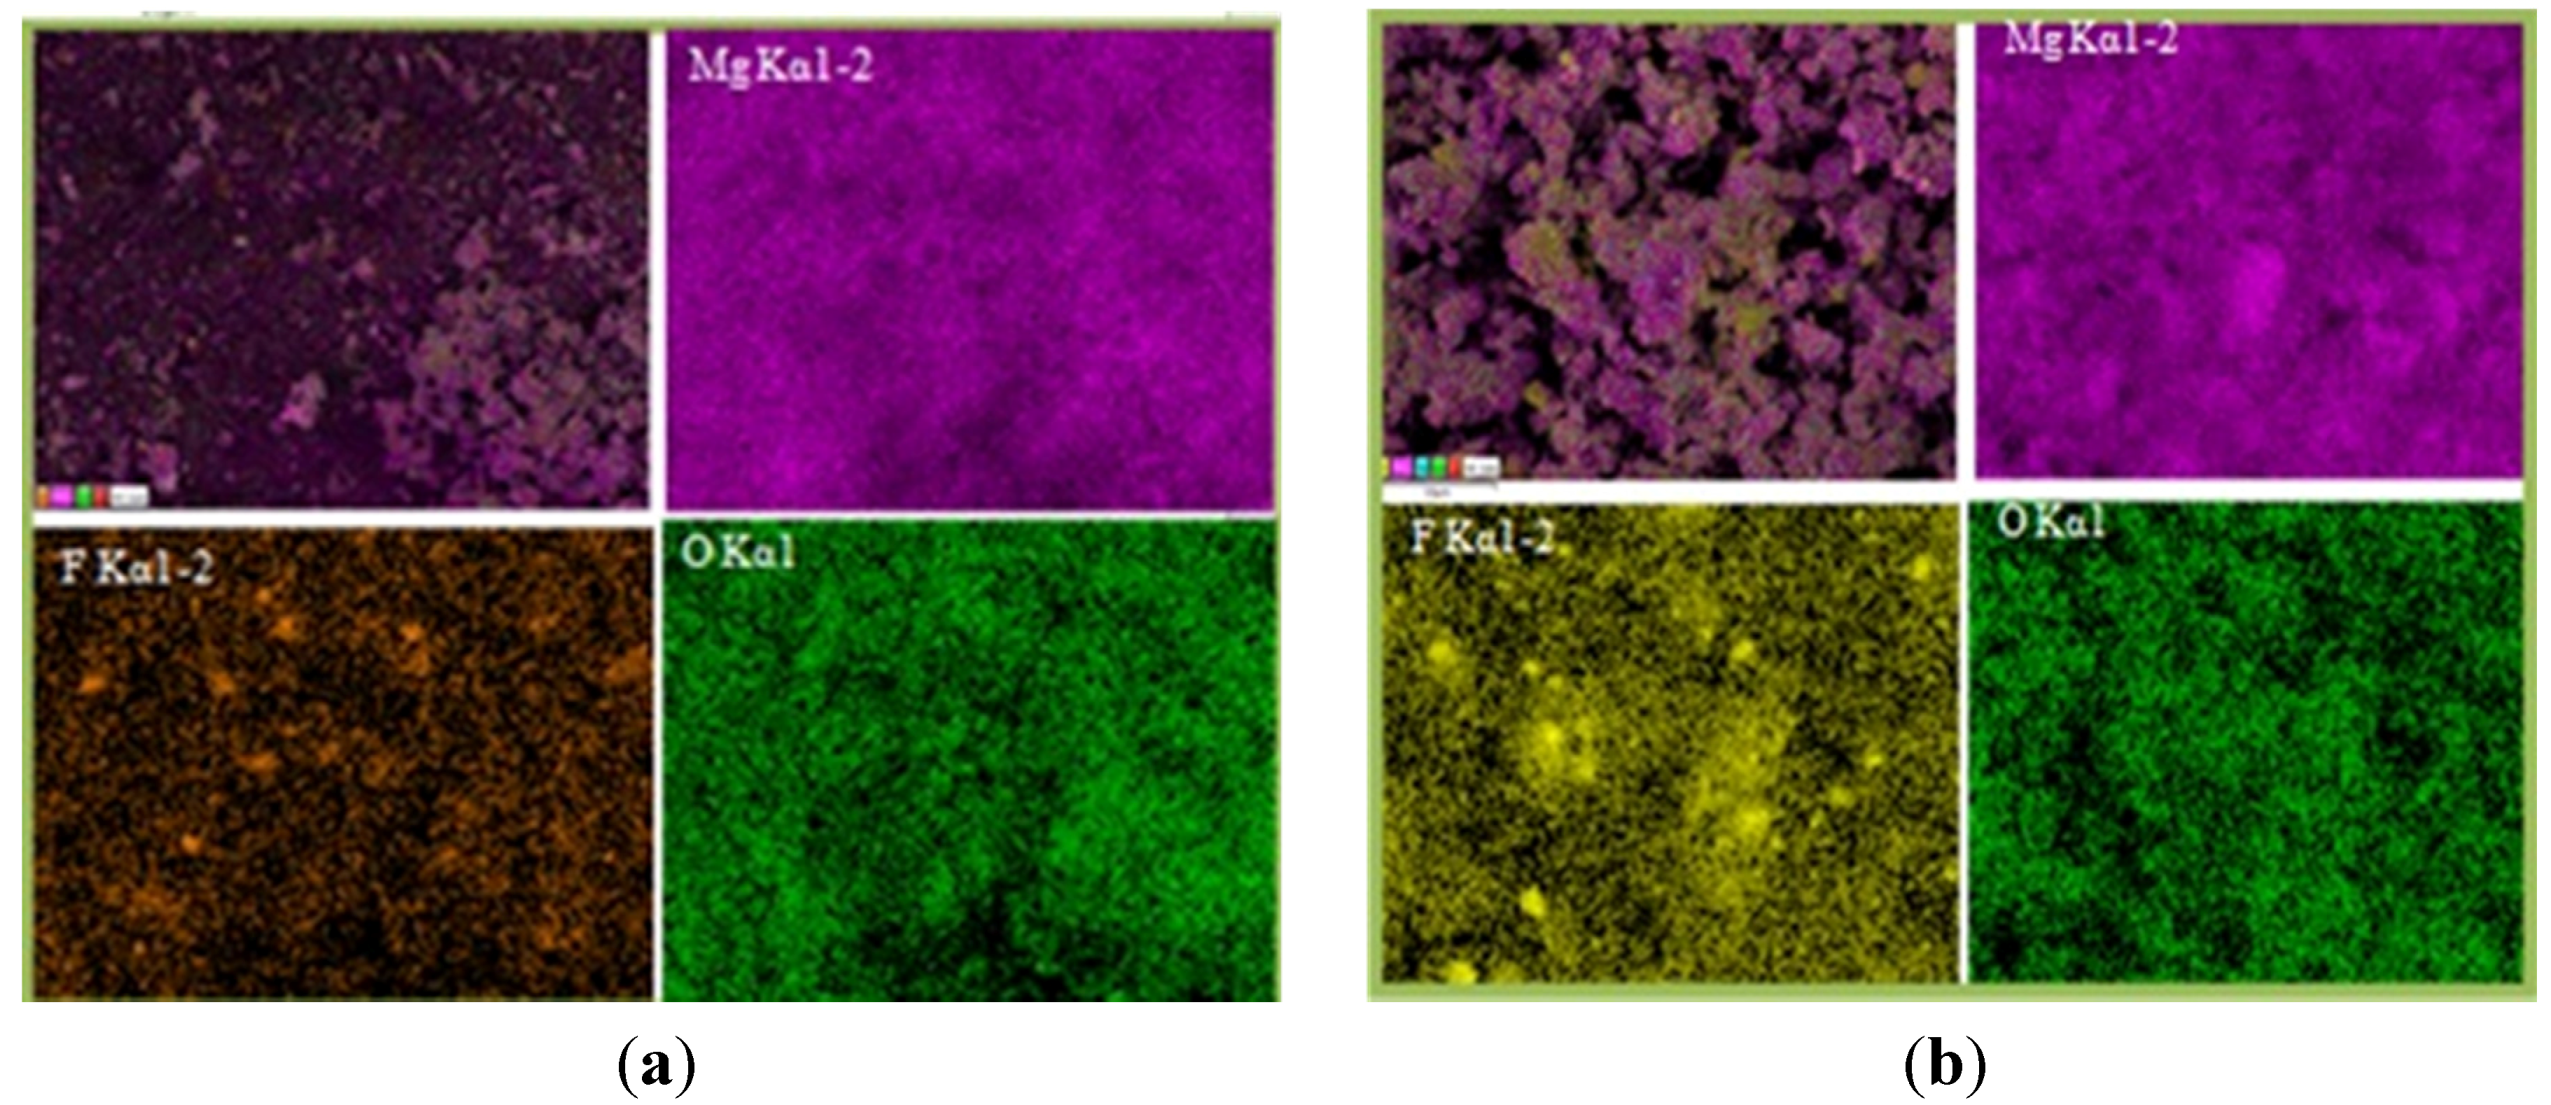
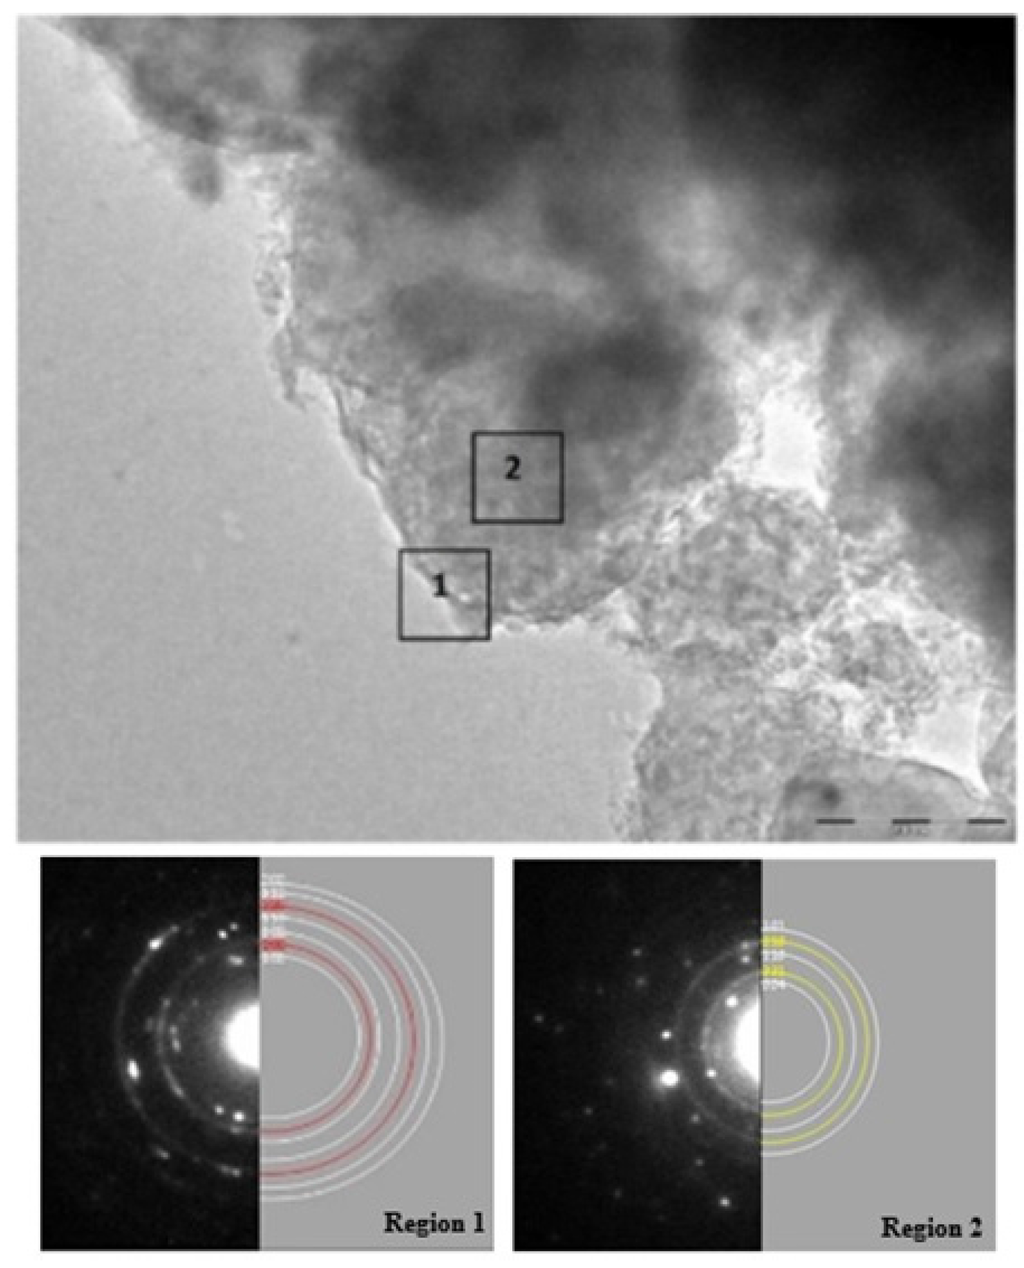
Figure 6.
Transmission electron microscopy (TEM) micrograph of MgH2 + 5 mol % MgF2 sample after desorption at 335 °C with selected area electron diffraction (SAED) patterns and simulations. Region 1 is composed of Mg (white rings) covered with MgO layer (red rings) in simulated data while Region 2 shows diffraction rings corresponding to Mg (white rings) and MgF2 (yellow rings).
2.2. Hydrogenation Characteristics of MgH2 + 5 mol % MgF2 at Lower Temperatures
The catalytic effect of 5 mol % MgF2 on hydrogen sorption properties of MgH2 was further investigated at lower temperatures. Figure 7 shows the absorption kinetics at 335, 310, 285 and 145 °C under 1000 kPa of hydrogen.
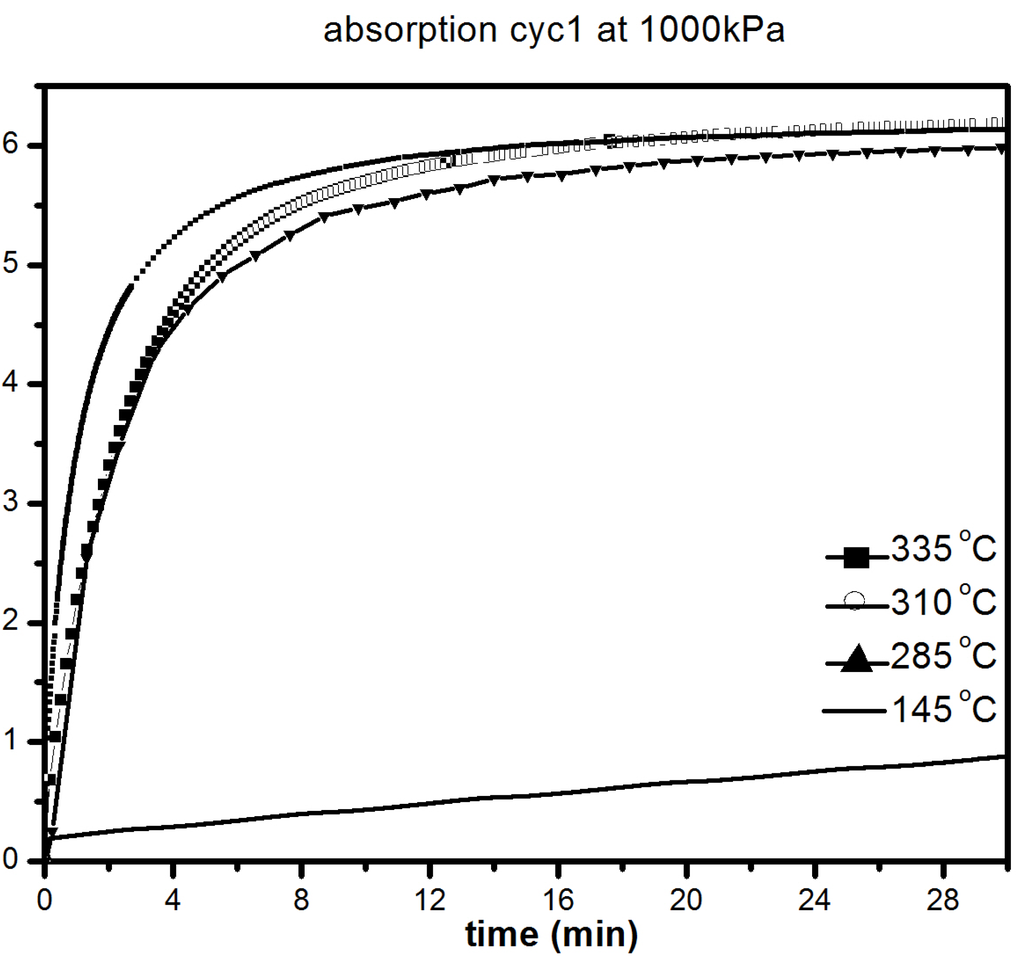
Figure 7.
First absorption under 1000 kPa H2 at different temperatures of 1 h milled MgH2 + 5 mol % MgF2. The insert is a compete absorption curve at 145 °C.
Figure 7.
First absorption under 1000 kPa H2 at different temperatures of 1 h milled MgH2 + 5 mol % MgF2. The insert is a compete absorption curve at 145 °C.
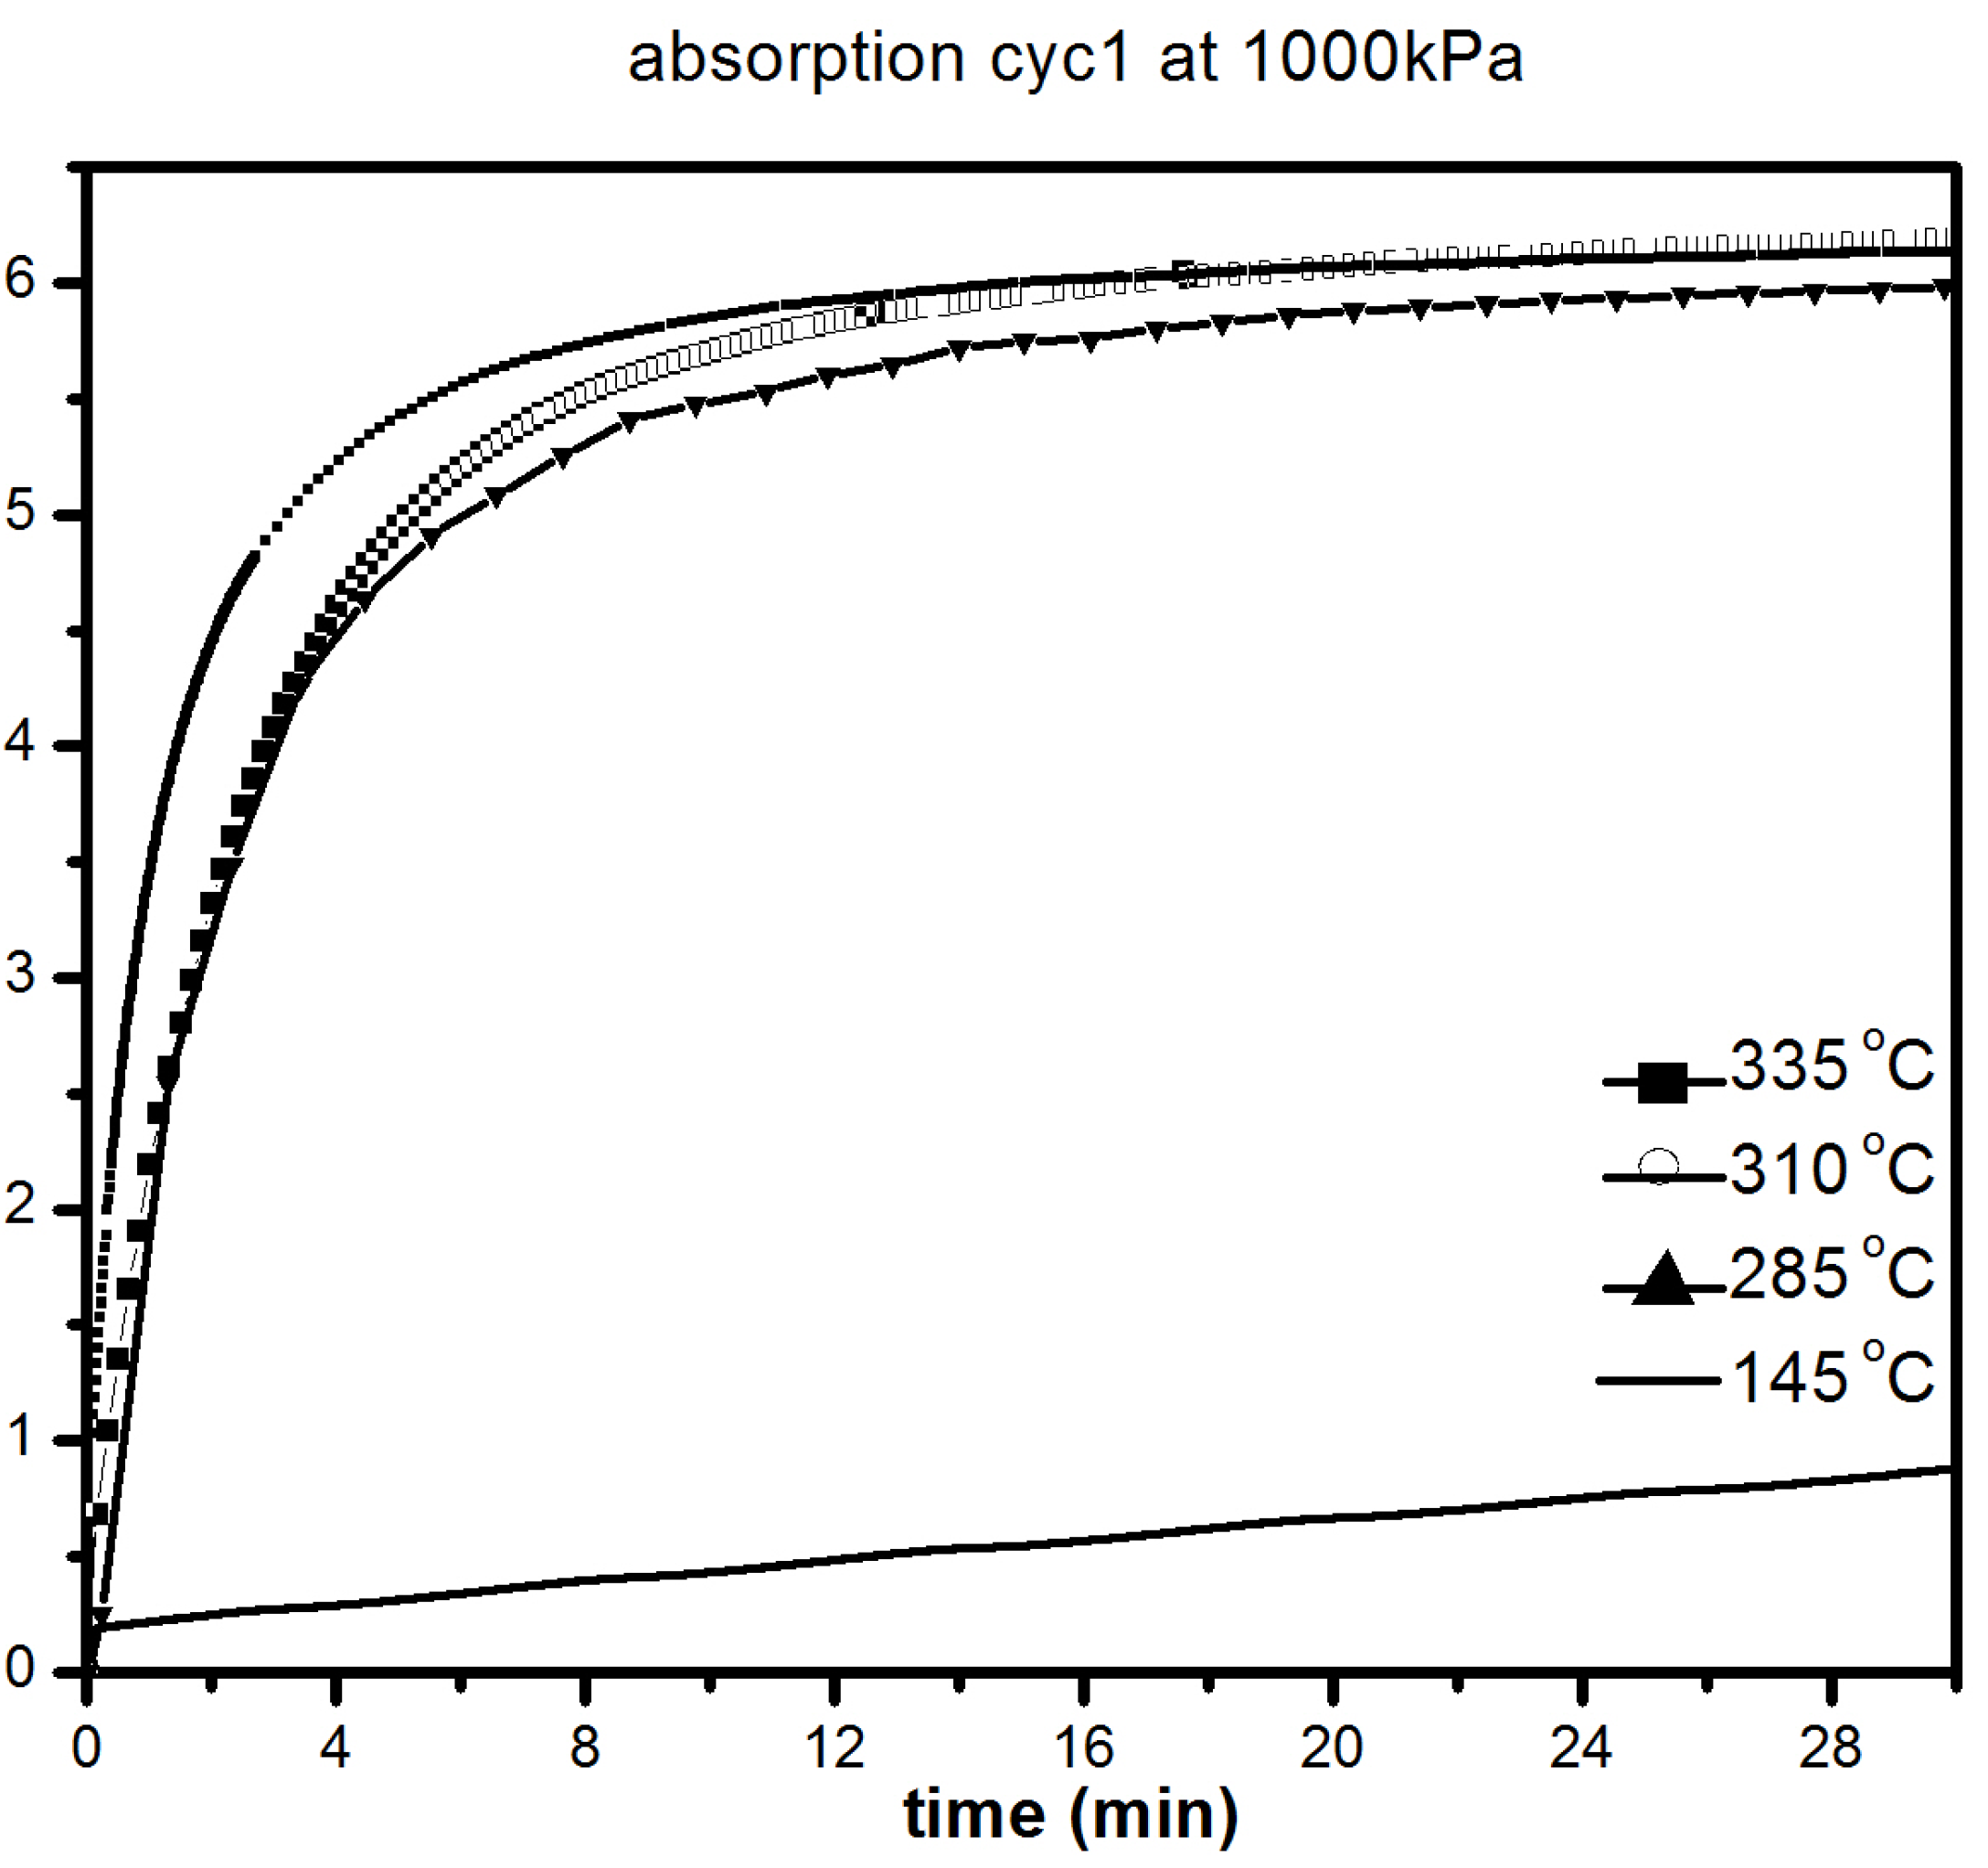
It should be pointed out that the samples were initially desorbed at 335 °C in order to ensure that full desorption was achieved before all absorption measurements. We notice only a slight loss in absorption capacity with reduction of temperature from 335 °C (6.2 wt % H2) to 285 °C (5.8 wt % H2). As seen in Figure 7, there was slight loss in kinetics and capacity in the temperature range 335–285 °C with the material reaching its complete capacity in less than 30 min. However, at 145 °C, the kinetics are much slower, but after 20 h, a capacity of 5.5 wt % is reached, as shown in Figure 7b. Desorption kinetic under 100 kPa H2 at 285, 310 and 335 °C are shown in Figure 8.
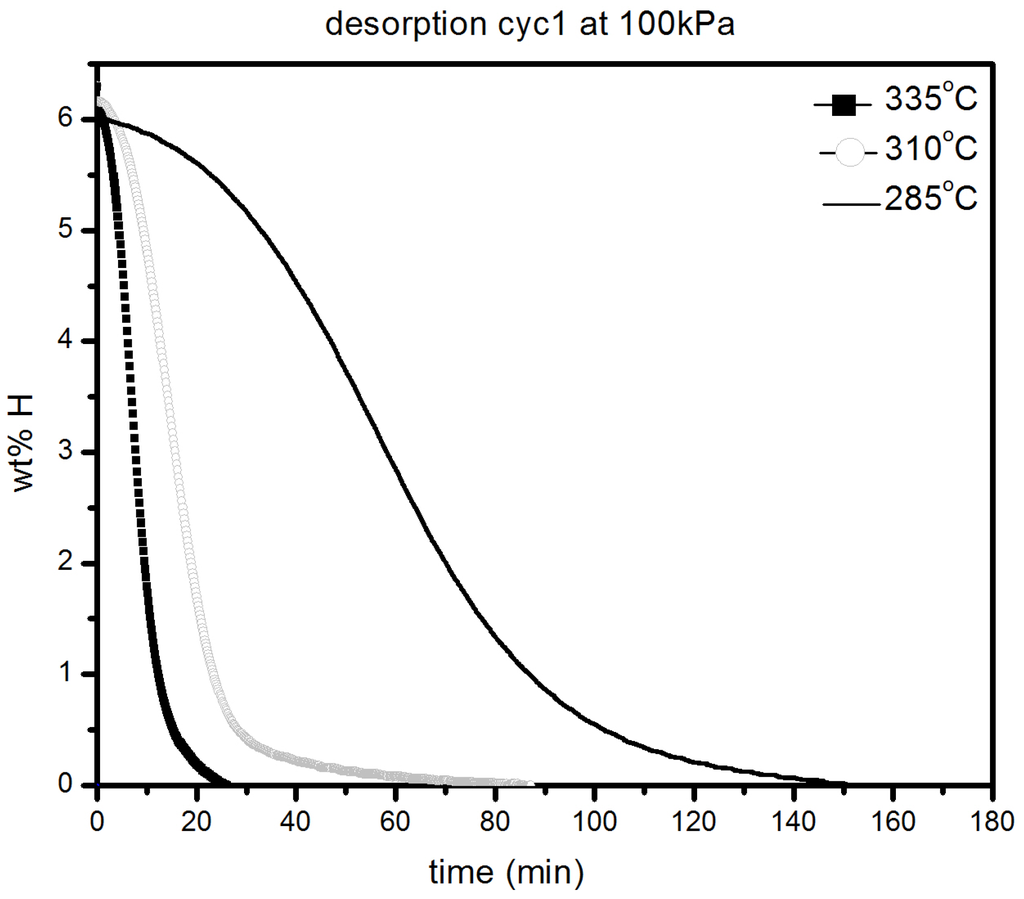
Figure 8.
Desorption under 100 kPa H2 at different temperatures of 1 h milled MgH2 + 5 mol % MgF2.
Figure 8.
Desorption under 100 kPa H2 at different temperatures of 1 h milled MgH2 + 5 mol % MgF2.
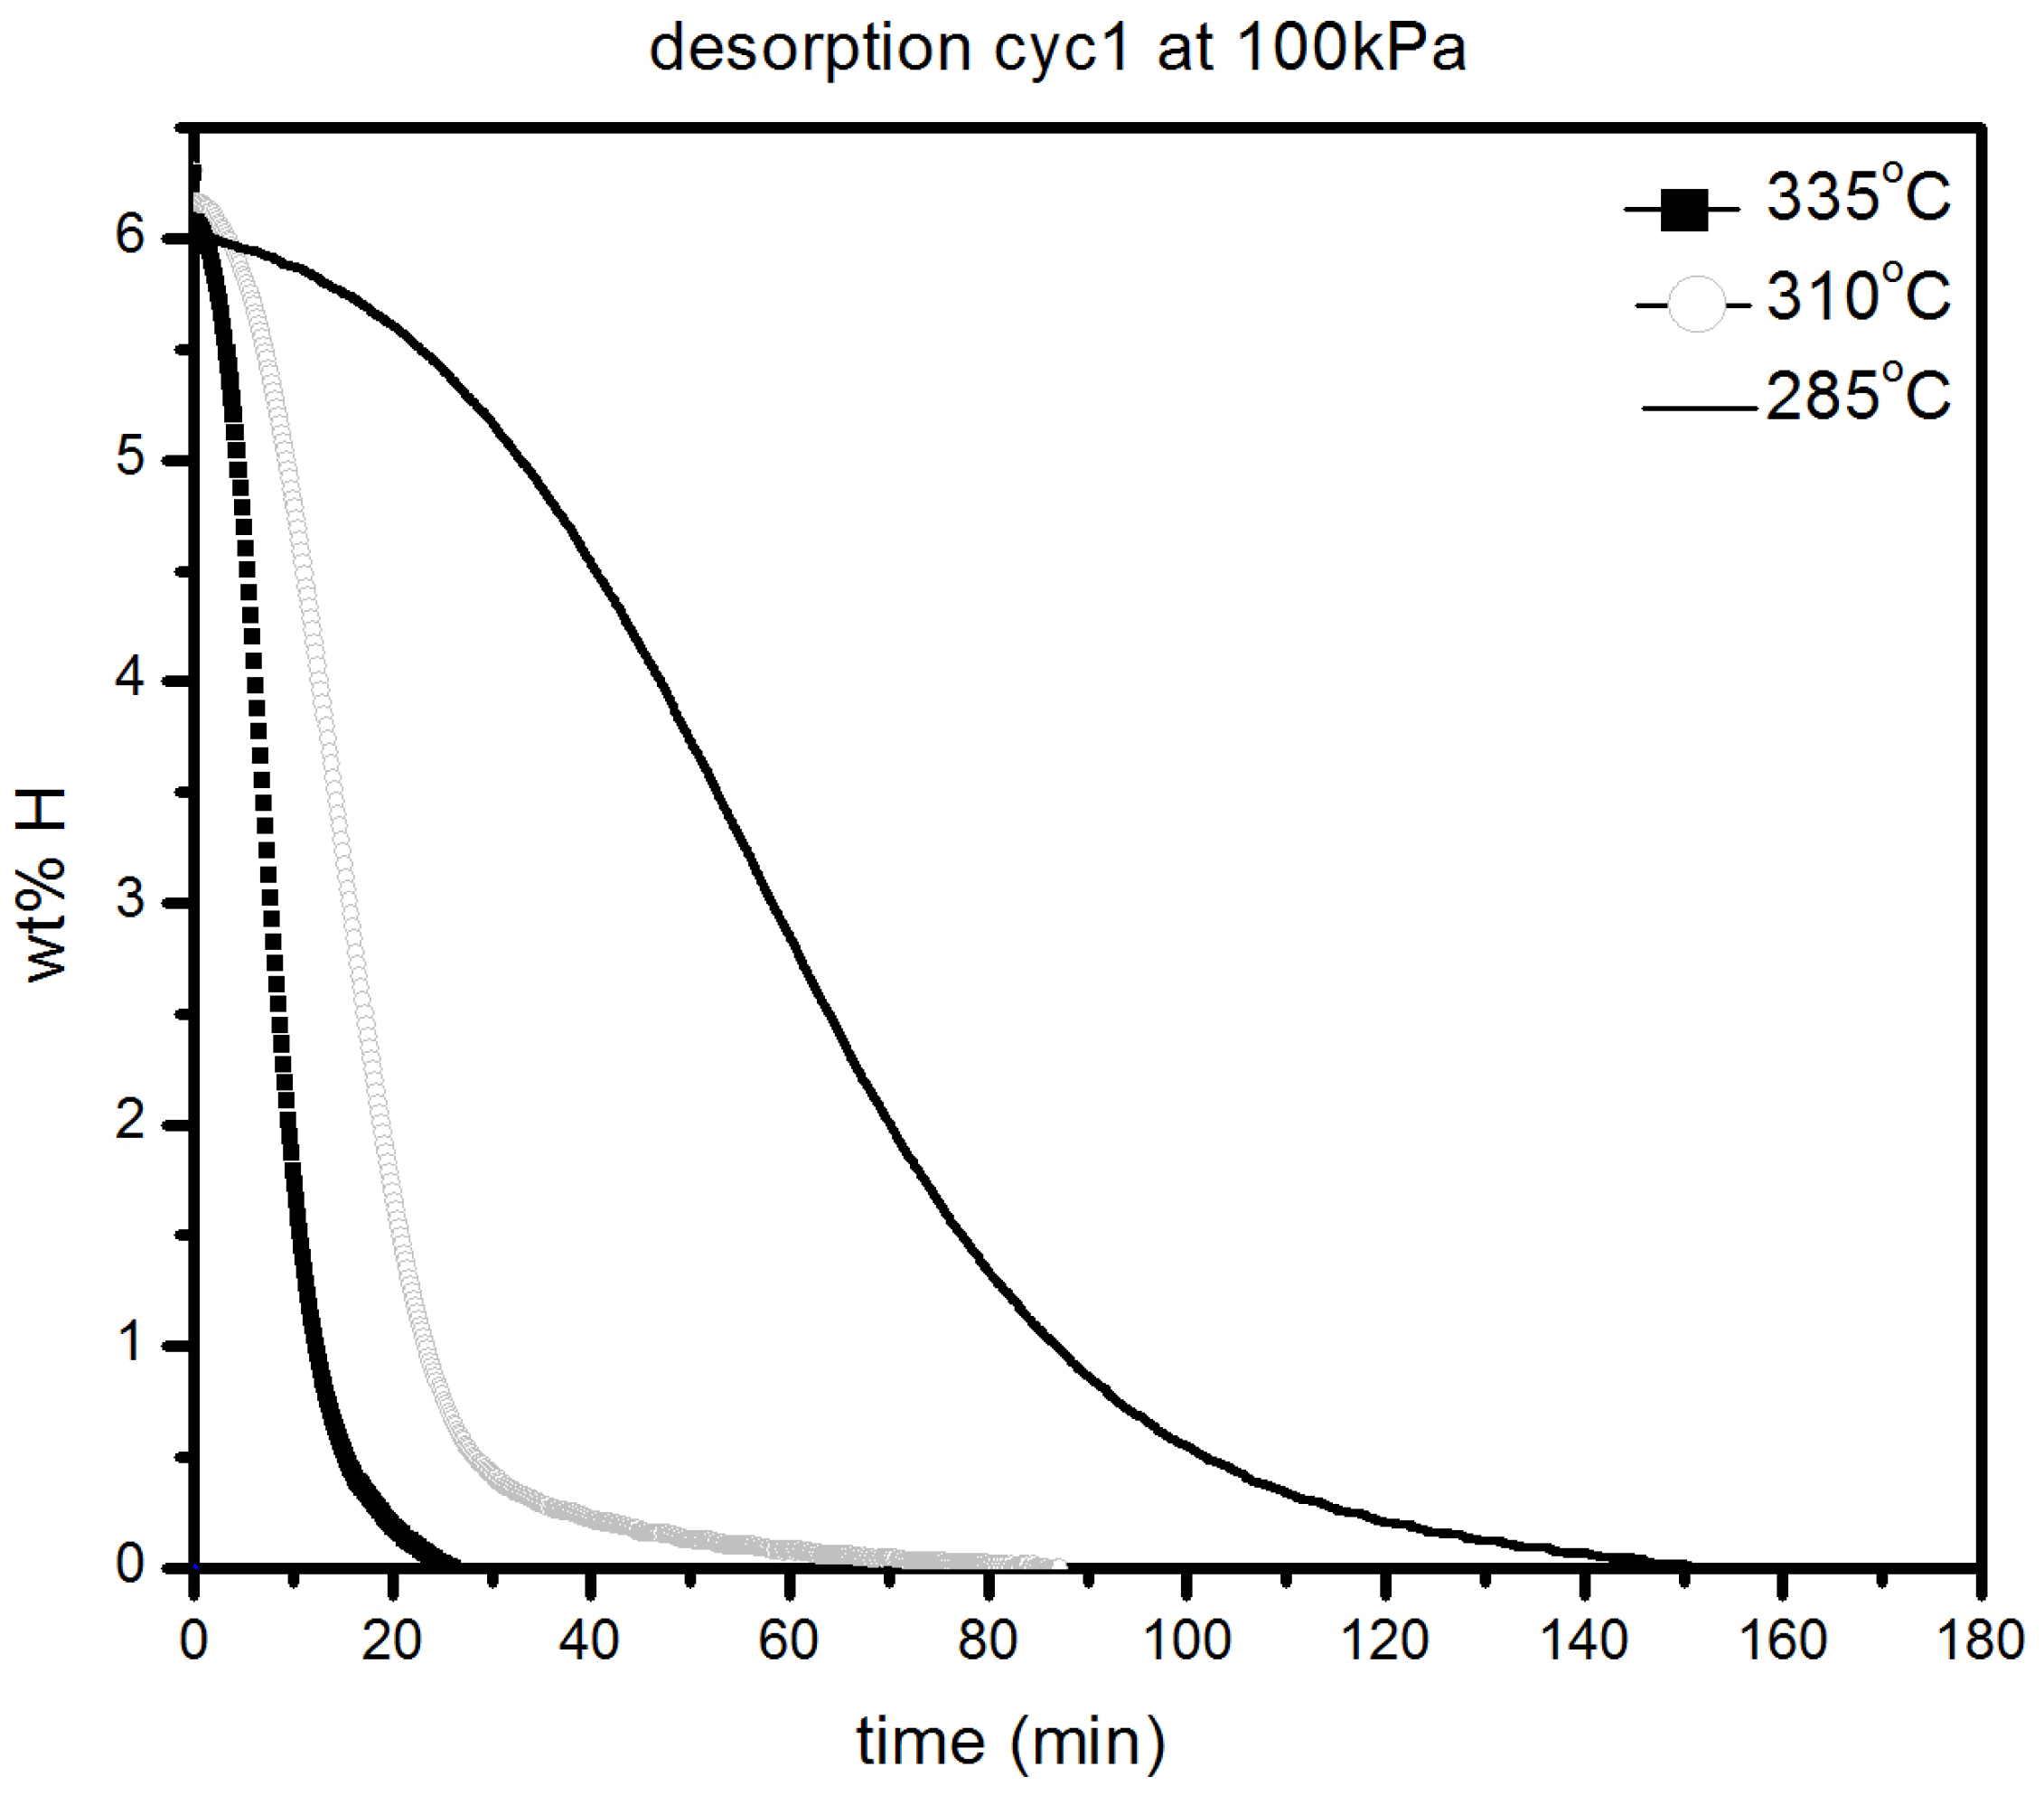
As expected, the kinetics are getting slower as temperature decreases but is still relatively fast even at 285 °C were complete desorption takes place in less than 3 h. These results reveal that even by sole addition of alkaline metal fluorides, improvements in hydrogenation characteristics of magnesium hydride can be achieved.
2.3. Cyclic Stability of MgH2 + 5 mol % MgF2 at T = 310 °C
Micro structural results have confirmed that MgF2 phase does not decompose and no new phase formation occurs during hydrogen absorption/desorption measurements for MgH2 + 5 mol % MgF2 system. Therefore, cyclic performance of catalyzed magnesium hydride was examined at moderate operating temperature of 310 °C at pressure of 1000 kPa (for absorption) and 10 kPa (for desorption) to evaluate performance stability. Prior to the measurements the sample was completely desorbed at 335 °C. Figure 9 shows that the absorption capacity goes down from 5.9 wt % in first cycle to 5.6 wt % in the 10th cycle.
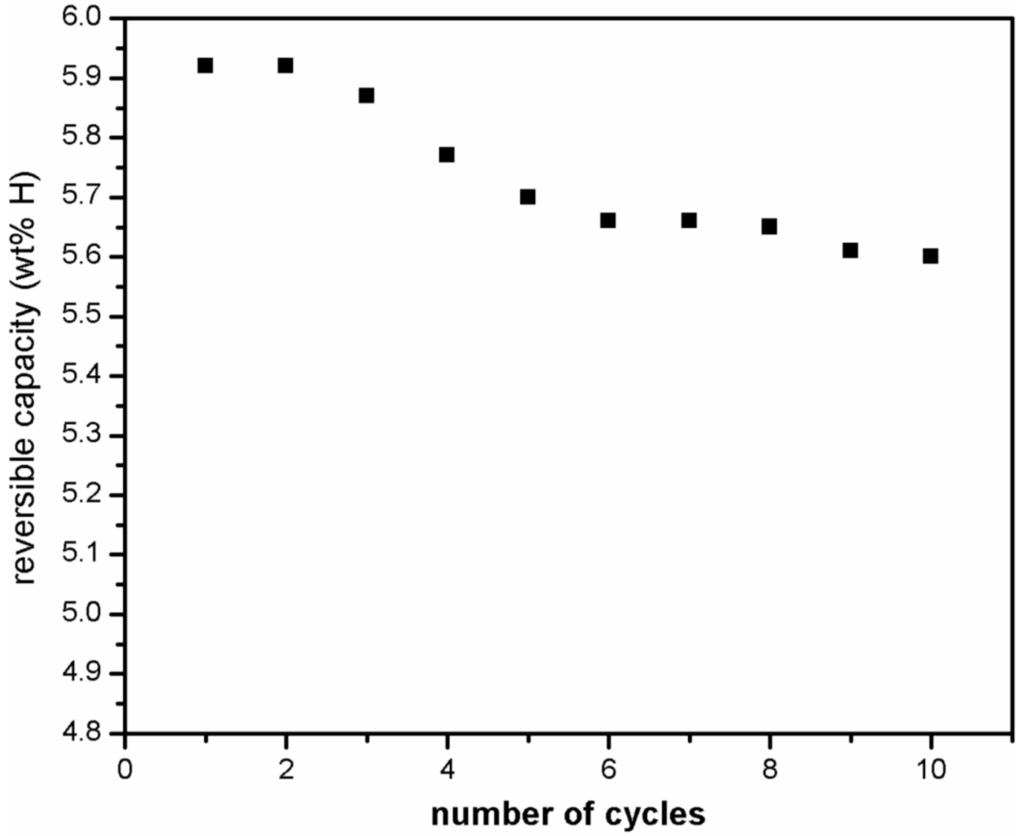
Figure 9.
Hydrogen absorption kinetics at 310 °C under 1000 kPa of hydrogen of ball milled MgH2 + 5 mol % MgF2 for 10 cycles.
Figure 9.
Hydrogen absorption kinetics at 310 °C under 1000 kPa of hydrogen of ball milled MgH2 + 5 mol % MgF2 for 10 cycles.
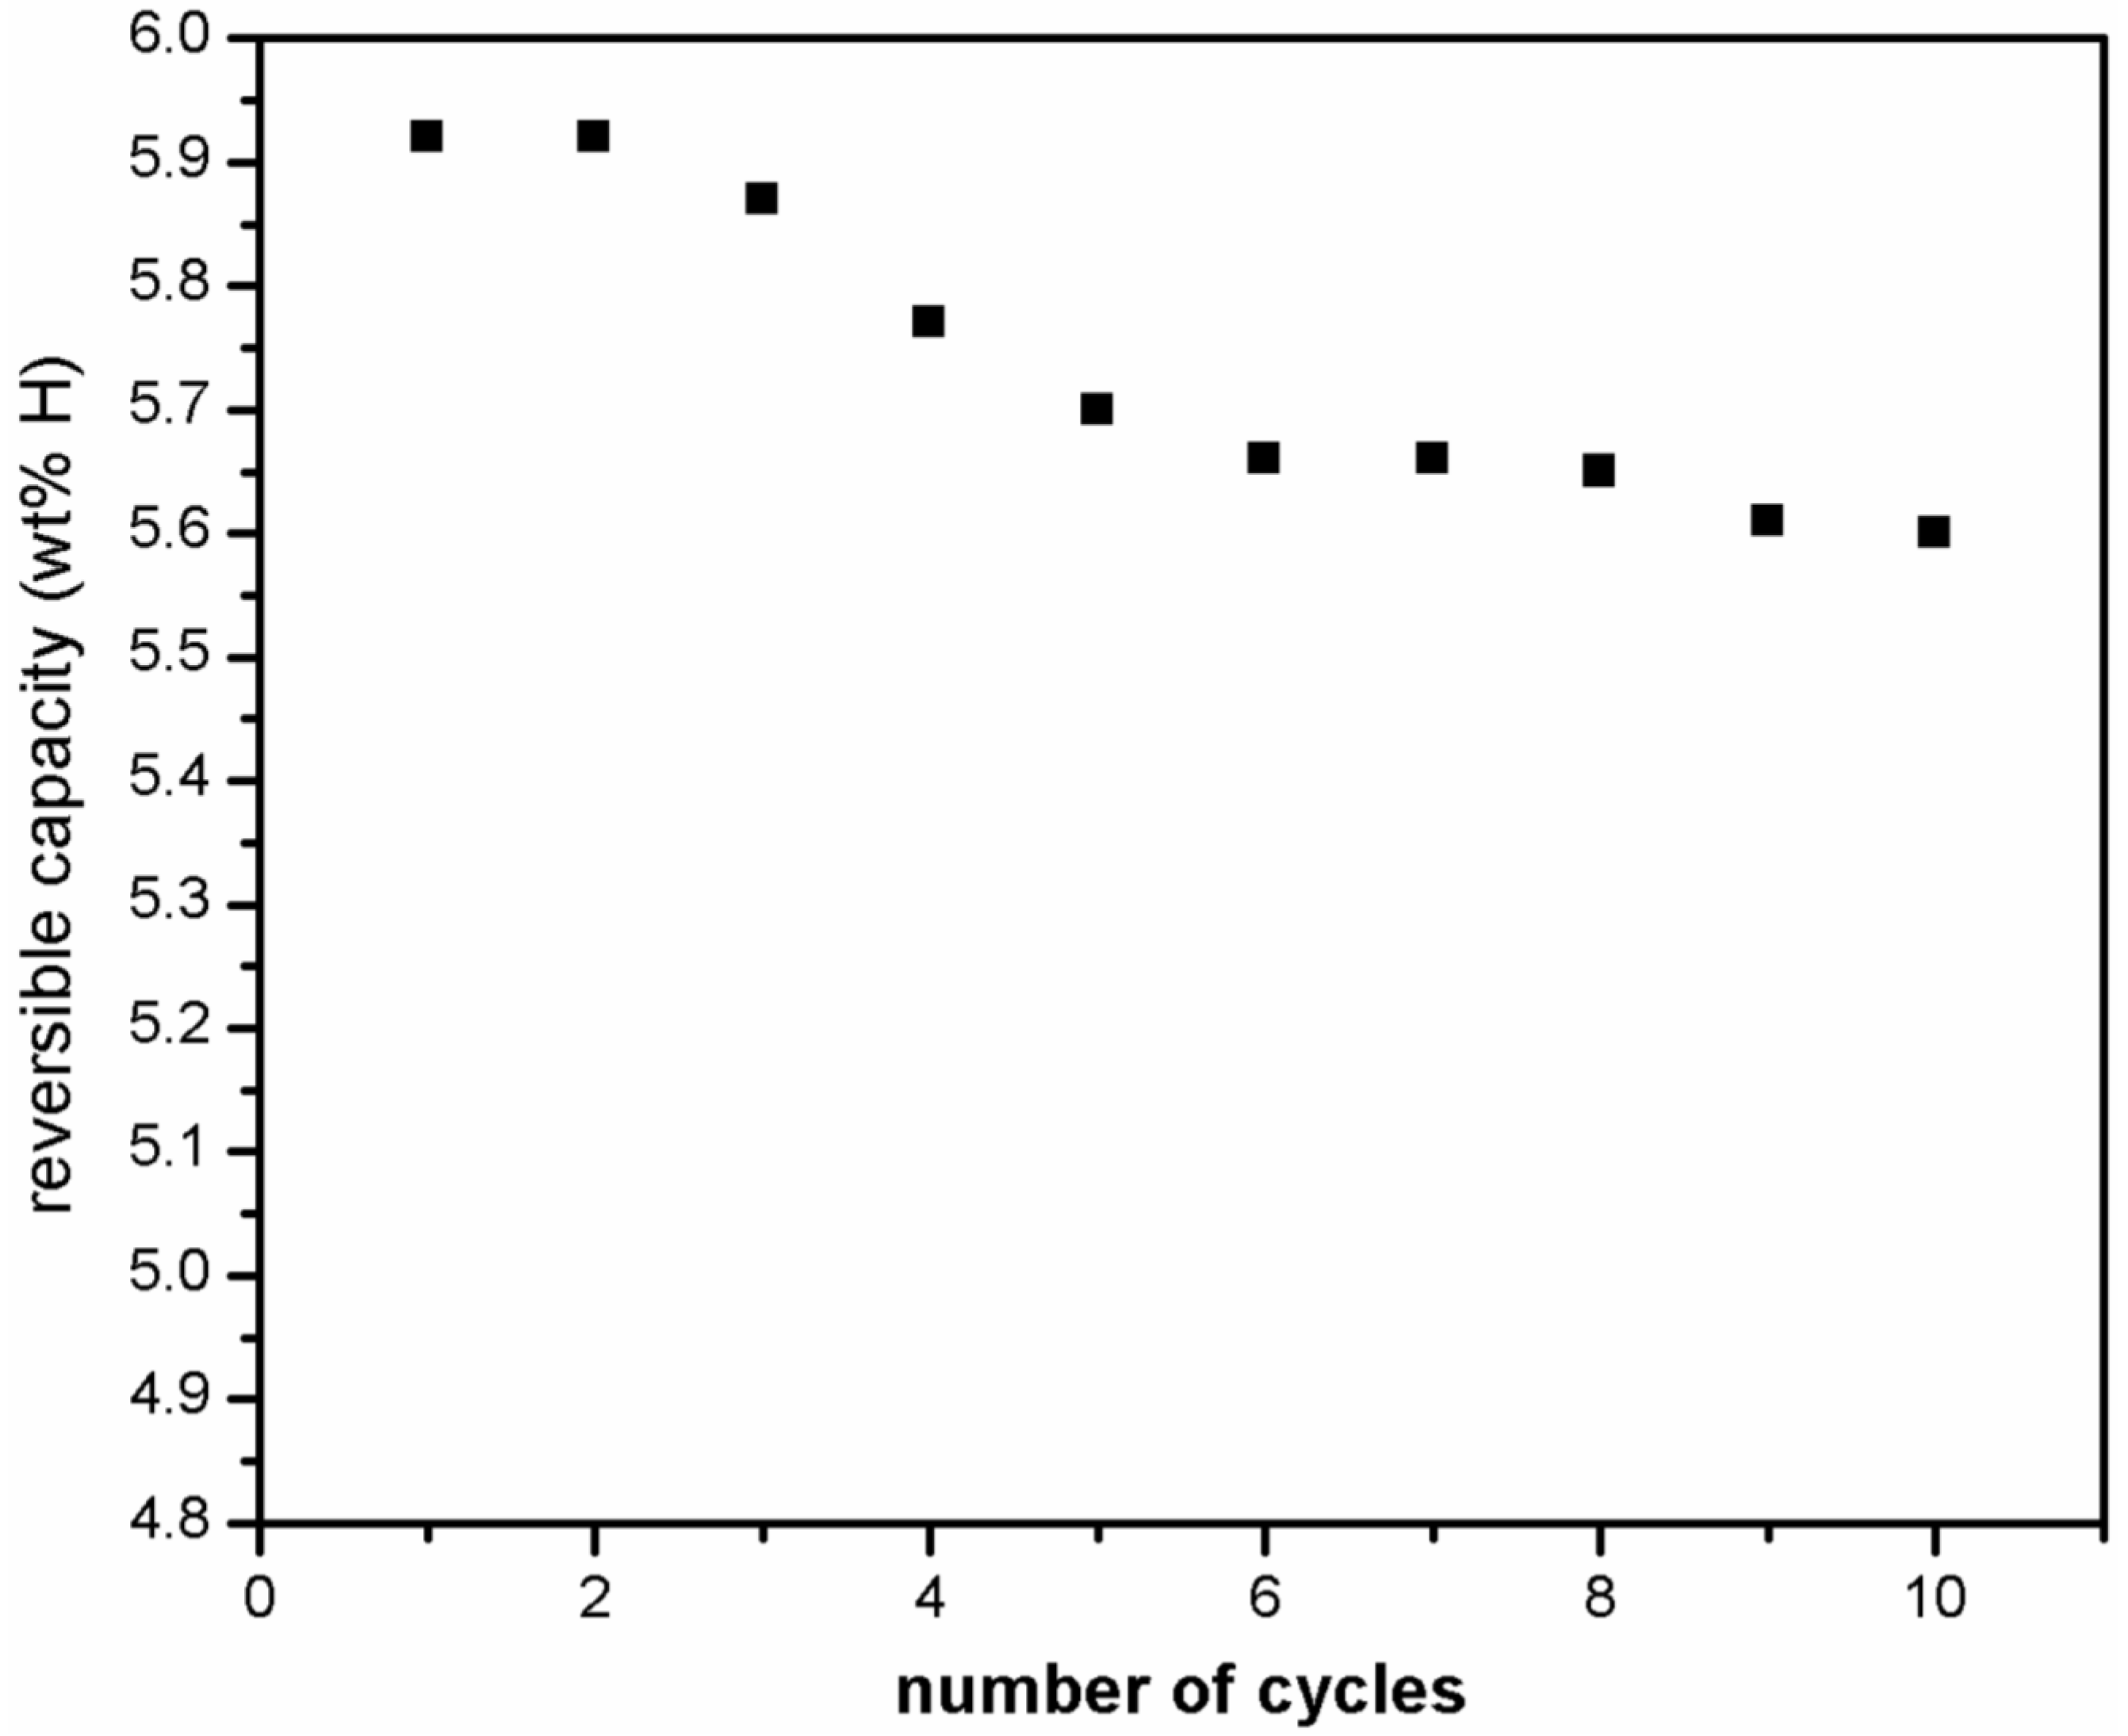
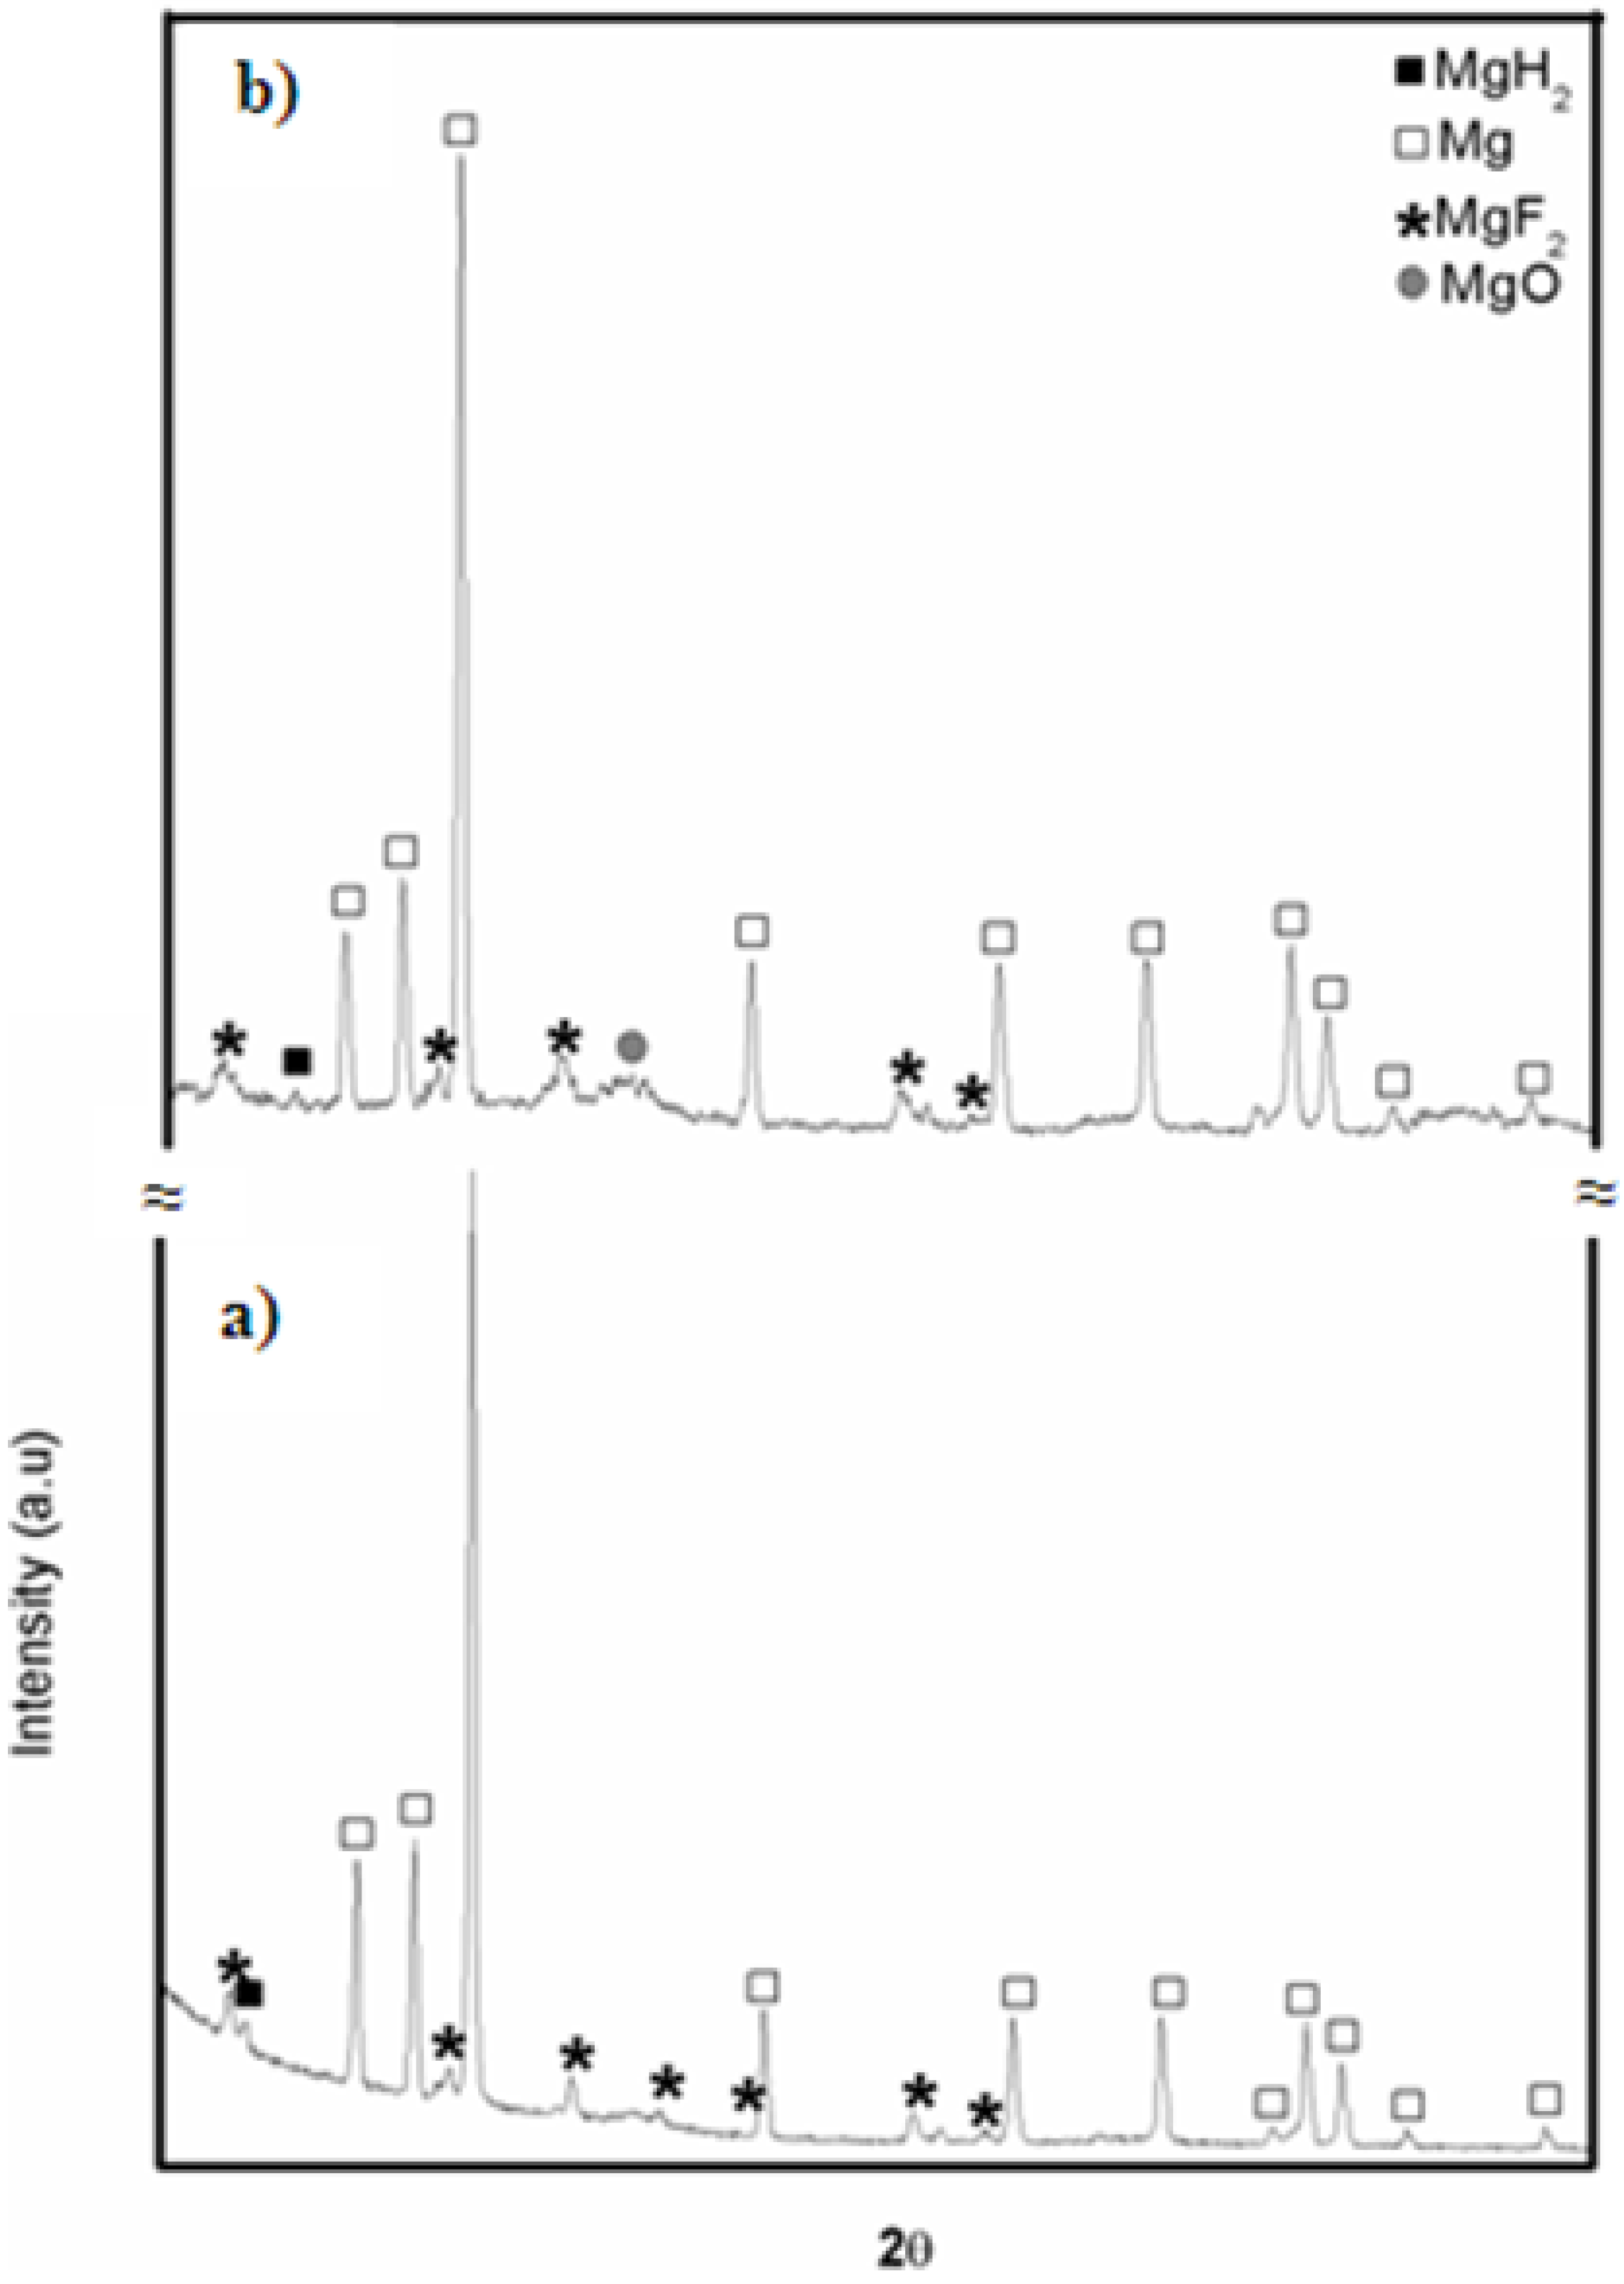
The observed loss of 0.3 wt % in capacity was reached within the first five cycles and thereafter the maximum capacity achieved by the system is more or less stabilized. These results show that magnesium hydride exhibits good hydrogen storage capacity and cyclic stability when magnesium fluoride is used as catalyst in comparison to the use of transition metal fluoride like NbF5 or ZrF4 where sharp decline in storage capacity was observed by Malka et al. [14] in the first 10 hydrogenation cycles recorded at 325 °C. X-ray diffraction patterns of the sample taken after 1st and 10th desorption cycle are presented in Figure 10. It shows that the β-MgH2 phase and the catalytic material remain intact while small increase in content of MgO occurs. Thus, the growth of the MgO layer is mostly responsible for an observed loss in capacity.
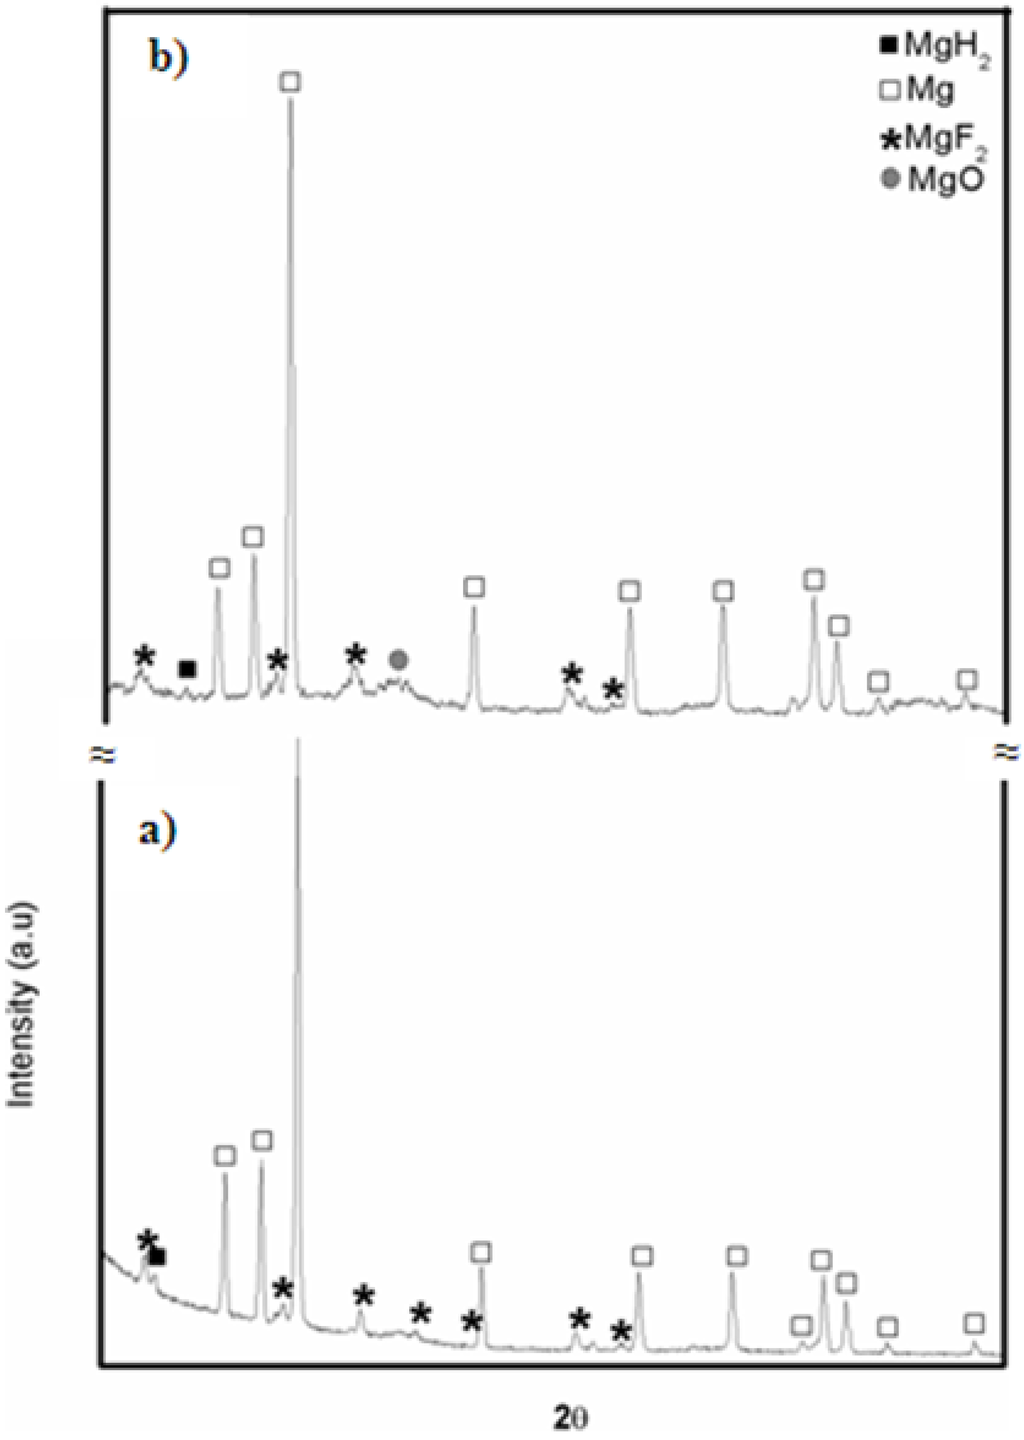
Figure 10.
X-ray diffraction patterns of ball milled MgH2 + 5 mol % MgF2 after (a) one desorption and (b) 10 desorption cycles at 310 °C.
Figure 10.
X-ray diffraction patterns of ball milled MgH2 + 5 mol % MgF2 after (a) one desorption and (b) 10 desorption cycles at 310 °C.
3. Discussion
The structural and hydrogenation results suggest that hydrogen absorption/desorption kinetics of MgF2 doped MgH2 is relatively slower than that attained with transition metal fluorides (TmF = TiF3, ZrF4, NbF5, TaF5). This could be explained by the presence of only one catalytically active phase in the present case (MgF2) while two active phases are present when transition metal fluorides are used as additives. More explicitly, upon dehydrogenation the following reaction takes place in the present case.
MgH2 + MgF2 → Mg + MgF2 + H2
While, as reported by Ma et al. [11], when transition metal fluoride is added the reaction taking place is:
3MgH2 + 2TiF3 → 3 MgF2 + 2TiH2 + H2
As TiH2 possess more negative enthalpy formation (−136 kJ/mol) than MgH2 (−75 kJ/mol) it will remain as a stable phase during desorption of MgH2 in later cycles [13]. Furthermore, presence and concentration of TiH2 phase would increase on multiple absorption/desorption cycling, which results in reduction of overall storage capacity. In addition, the transition metal fluoride is very sensitive to atmospheric conditions. Ball milled MgH2 + TM-fluoride samples require oxygen and moisture level to be less than 0.1 ppm for obtaining good hydrogenation results [7,9,11,15]. Additionally, even in the desorbed state the material is pyrophoric, which makes it difficult to handle. Moreover, transition metals are much heavier than magnesium thereby increasing the mass of entire system. It thus seems more practical to use MgF2 as a doping agent to increase the hydrogenation/dehydrogenation kinetics than transition metal fluorides.
4. Experimental Section
The starting materials MgH2 (99.8% purity) and MgF2 (99.9% purity) purchased from Alfa Aesar (Ward Hill, MA, USA) were vacuum annealed for few hours at 80 °C before using them for experiments. Afterwards, MgH2 powder with 2, 5, and 10 mol % MgF2, was milled under Ar atmosphere using Fritsch P4 planetary mill (Idar-Oberstein, Germany) with ball to powder ratio of 50:1 at a crucible rotation speed of 220 rpm. Milling was done for 60 min with 15 min rest after every 15 min of milling. The final milled products were handled in a glove box with oxygen and moisture level below 0.1 ppm. Initial hydrogen desorption curves taken at 335 °C under 100 kPa H2 pressure showed that with 2 mol % catalytic material the kinetics was too slow which could be improved by increasing the additive content to 5 mol %. Further increase in concentration of catalytic material to 10 mol % didn’t cause any significant change in kinetics. Therefore, MgF2 concentration was restricted to 5 mol % for further investigation.
The hydrogenation characteristics were measured on homemade Sievert-type apparatus and the cyclic studies were made on an automated-four channel apparatus called Multi Channel Hydride Evaluation System from Advanced Materials Corporation, Petersburg, VA, USA. Approximately 400 mg of powder was placed in a sample cell and completely desorbed under dynamic vacuum at 335 °C prior to any measurement. Thereafter all measurements were made under 1000 kPa H2 pressure for absorption and 100 kPa H2 pressure for desorption at temperatures ranging from 335 °C to 145 °C. X-ray diffraction was performed using Bruker D8 Focus X-Ray apparatus (Bruker, Madison, WI, USA) with CuKα radiation. Phase abundances were evaluated from Rietveld method using Topas software [16]. Small quantity of milled MgH2 + 5 mol % MgF2 (a) after desorption at 325 °C and (b) after rehydrogenation under 1000 kPa H2 was characterized for morphological studies with chemical analysis using JEOL JSM-5500 scanning electron microscope (JEOL, Tokyo, Japan). The sample was filled in air tight bottles and taken to SEM-EDX lab were they were slightly exposed to air for loading in SEM chamber. TEM analysis was performed on FEI: Technai 20G2 electron microscope (FEI, Hillsboro, OR, USA), operating at 200 kV accelerating voltage. TEM samples were prepared by dry dispersion of the powder onto a carbon substrate supported by copper TEM grid. This was done in an argon glove box before the TEM session, and the prepared sample was sealed by covering with parafilm tape to be carried to TEM lab. The sample was exposed to air for short duration during loading onto the TEM holder. Thus, partially transformed samples were characterised using scanning and transmission electron microscopy.
5. Conclusions
This investigation showed that magnesium fluoride could significantly influence the hydrogen sorption properties of magnesium hydride. It has been shown that MgF2 additive acts as a catalyst for MgH2, thereby improving its hydrogenation/dehydrogenation kinetics. These kinetic improvements are due to the presence of chemically stable MgF2 powder well mixed in MgH2 matrix and MgO layer being limited only to the surface. Cyclic stability reveals that 5 mol % MgF2 helps to accelerate the reversible kinetics of MgH2 with higher capacity in comparison to other transition metal fluoride catalysts. This is probably due to the persistence of MgF2 phase during hydrogen cycling. These results suggest that owing to its fast sorption properties, low sensitivity to atmospheric conditions and easy handling ability, this material can be used in applications where operation at relatively high temperature is not considered a significant issue.
Acknowledgments
Pragya Jain would like to thank University Grant Commission (UGC) for the Dr. D.S. Kothari post-doctoral fellowship to carry out this work.
Author Contributions
Study conception and design: Pragya Jain, Jacques Huot; Acquisition of data: Pragya Jain, Viney Dixit; Analysis and interpretation of data: Pragya Jain, Jacques Huot, Onkar N. Srivastava; Drafting of manuscript: Pragya Jain, Ankur Jain, Jacques Huot; Critical revision: Pragya Jain, Jacques Huot.
Conflicts of Interest
The authors declare no conflict of interest.
References
- Jain, I.P.; Lal, C.; Jain, A. Hydrogen storage in Mg: A most promising material. Int. J. Hydrog. Energy 2010, 35, 5133–5144. [Google Scholar] [CrossRef]
- Wu, Z.; Allendorf, M.D.; Grossman, J.C. Quantum Monte Carlo Simulation of Nanoscale MgH2 Cluster Thermodynamics. J. Am. Chem. Soc. 2009, 131, 13918–13919. [Google Scholar] [CrossRef] [PubMed]
- Dornheim, M.; Eigen, N.; Barkhordarian, G.; Klassen, T.; Bormann, R. Tailoring Hydrogen Storage Materials Towards Application. Adv. Eng. Mater. 2006, 8, 377–385. [Google Scholar] [CrossRef]
- Hanada, N.; Ichikawa, T.; Fujii, H. Catalytic effect of nanoparticle 3d-transition metals on hydrogen storage properties in magnesium hydride MgH2 prepared by mechanical milling. J. Phys. Chem. B 2005, 109, 7188–7194. [Google Scholar] [CrossRef] [PubMed]
- Aguey-Zinsou, K.F.; Ares Fernandez, J.R.; Klassen, T.; Bormann, R. Effect of Nb2O5 on MgH2 properties during mechanical milling. Int. J. Hydrog. Energy 2007, 32, 2400–2407. [Google Scholar] [CrossRef]
- Ma, L.P.; Wang, P.; Cheng, H.M. Improving hydrogen sorption kinetics of MgH2 by mechanical milling with TiF3. J. Alloys Compd. 2007, 432, L1–L4. [Google Scholar] [CrossRef]
- Yavari, A.R.; LeMoulec, A.; de Castro, F.R.; Deledda, S.; Friedrichs, O.; Botta, W.J.; Vaughan, G.; Klassen, T.; Fernandez, A.; Kvick, Ǻ. Improvement in H-sorption kinetics of MgH2 powders by using Fe nanoparticles generated by reactive FeF3 addition. Scr. Mater. 2005, 52, 719–724. [Google Scholar] [CrossRef]
- Deledda, S.; Borissova, A.; Poinsignon, C.; Botta, W.J.; Dornheim, M.; Klassen, T. H-sorption in MgH2 nanocomposites containing Fe or Ni with fluorine. J. Alloys Compd. 2005. [Google Scholar] [CrossRef]
- Malka, I.E.; Pisarek, M.; Czujko, T.; Bystrzycki, J. A study of the ZrF4, NbF5, TaF5, and TiCl3 influences on the MgH2 sorption properties. Int. J. Hydrog. Energy 2011, 36, 12909–12917. [Google Scholar] [CrossRef]
- Ivanov, E.; Konstanchuk, I.; Bokhonov, B.; Boldyrev, V. Hydrogen interaction with mechanically alloyed magnesium-salt composite materials. J. Alloys Compd. 2003, 359, 320–325. [Google Scholar] [CrossRef]
- Ma, L.-P.; Wang, P.; Cheng, H.-M. Hydrogen sorption kinetics of MgH2 catalyzed with titanium compounds. Int. J. Hydrog. Energy 2010, 35, 3046–3050. [Google Scholar] [CrossRef]
- Soni, P.R. Mechanical Alloying: Fundamentals and Applications; Cambridge International Science Publishing: Cambridge, UK, 2000; p. 160. [Google Scholar]
- Grzech, A.; Lafont, U.; Magusin, P.; Mulder, F.M. Microscopic Study of TiF3 as Hydrogen Storage Catalyst for MgH2. J. Phys. Chem. C 2012, 116, 26027–26035. [Google Scholar] [CrossRef]
- Malka, I.E.; Bystrzycki, J.; Płociński, T.; Czujko, T. Microstructure and hydrogen storage capacity of magnesium hydride with zirconium and niobium fluoride additives after cyclic loading. J. Alloys Compd. 2011, 509, S616–S620. [Google Scholar] [CrossRef]
- Jin, S.-A.; Shim, J.-H.; Cho, Y.W.; Yi, K.-W. Dehydrogenation and hydrogenation characteristics of MgH2 with transition metal fluorides. J. Power Sources 2007, 172, 859–862. [Google Scholar] [CrossRef]
- Topas V4: General Profile and Structure Analysis Software for Powder Diffraction Data; Bruker_AXS: Karlsruhe, Germany, 2008.
© 2015 by the authors; licensee MDPI, Basel, Switzerland. This article is an open access article distributed under the terms and conditions of the Creative Commons by Attribution (CC-BY) license (http://creativecommons.org/licenses/by/4.0/).
