Abstract
Increasing the feed total solids to anaerobic digester improves the process economics and decreases the volume of liquid effluent from current wet anaerobic digestion. The objective of this study was to develop a novel psychrophilic (20 °C) anaerobic digestion technology of undiluted cow feces (total solids of 11%–16%). Two sets of duplicate laboratory-scale sequence batch bioreactors have been operated at organic loading rates (OLR) of 6.0 to 8.0 g total chemical oxygen demand (TCOD) kg−1 inoculum day−1 (d−1) during 210 days. The results demonstrated that the process is feasible at treatment cycle length (TCL) of 21 days; however, the quality of cow feces rather than the OLR had a direct influence on the specific methane yield (SMY). The SMY ranged between 124.5 ± 1.4 and 227.9 ± 4.8 normalized liter (NL) CH4 kg−1 volatile solids (VS) fed d−1. Substrate-to-inoculum mass ratio (SIR) was 0.63 ± 0.05, 0.90 ± 0.09, and 1.06 ± 0.07 at OLR of 6.0, 7.0, and 8.0 g TCOD kg−1 inoculum d−1, respectively. No volatile fatty acids (VFAs) accumulation has been observed which indicated that hydrolysis was the rate limiting step and VFAs have been consumed immediately. Bioreactors performance consistency in terms of the level of SMYs, VFAs concentrations at end of the TCL, pH stability and volatile solids reduction indicates a stable and reproducible process during the entire operation.
1. Introduction
The search for environmental-friendly and sustainable energy sources is best implemented by developing novel bioprocesses for converting organic wastes to biofuels. In this respect, livestock manure is attracting increasing interest because its conversion to biofuels can also help to minimize farm-generated pollution given that cost effective manure treatment has been identified as a challenge in manure management [1]. For example, dairy cow manure storage in cold climates regions in the European countries and the U.S. contributes about 12% and 23% of the total CH4 emission on dairy operations, respectively [2,3].
Cow feces contains soluble, particulate, and fibrous components. It contains carbohydrates (cellulosic and hemicellulosic fiber), lipids, fats, and proteins. Approximately 40%–50% of the volatile solids (VS) in dairy manure is biodegradable lignocellulosic biomass which can be converted to CH4 [4]. The total solids content of fresh manure of cow (12%–16%) makes it unsuitable for conventional wet anaerobic digestion (WAD) because of the large amount of water (manure:water mass ratio between 1:1 and 1:4) required to dilute and decrease the solids content to less than 9% to allow liquid handling and processing [5,6,7]. Avoiding dilution of cow manure fed to anaerobic digestion (AD) is an important engineering design objective. In this context, dry anaerobic digestion (DAD) of high-solids agricultural wastes is a relatively new biotechnology, which could be adapted to digest undiluted cow manure [8,9,10]. Compared to WAD, DAD offers significant reduction in bioreactor volume [11]. Consequently, it decreases the capital cost required to construct bioreactors and effluent long-term storage facilities. Operation costs associated with handling, transportation and land application of bioreactor effluent is also substantially reduced [12]. Moreover, the higher nutrients concentration in high-solids digestate increases the interest in agronomic valorization of the odorless bioreactor effluent. A high-solids digestate of high nutrients content can be transported more economically over a longer distance than a diluted effluent. In addition, the use of DAD would eliminate problems of foaming and sedimentation in the bioreactors, reduce energy input for mixing and heating, increase specific volumetric energy output of the bioreactor and reduce loss of nitrogen during storage. Despite the advantages of DAD, mixing of inoculum and substrate at the beginning of the process is rather difficult.
Jha et al. [13] reported specific methane yields (SMY), which is the ratio of methane volume produced divided by the quantity of volatile solids fed, of 166 and 194 L CH4 kg−1 VS fed from mesophilic (35 °C) dry (total solids (TS) 15.2%) and wet (TS 7.7%) anaerobic digestion of cow dung during 63 days of incubation, respectively, whereas for the same incubation period thermophilic (55 °C) operation yielded 188 and 226 L CH4 kg−1 VS fed for dry and wet operation, respectively, fed at an organic loading rate (OLR) of 10.7 g VS kg−1 inoculum d−1. Recently, Jha et al. [14] reported a SMY of 127.2 L CH4 kg−1 VS of cow dung digested in mesophilic (35 °C) unmixed batch reactor during 35 days. They found that mixing increased the SMY and VS removal by 7.5% and 9.7%, respectively. Brown et al. [15] concluded that volumetric productivity of DAD (18% TS) is 2- to 7-times greater compared to wet anaerobic digestion (WAD) (5% TS) for lignocellulosic substrates based on 30 days batch incubation.
Novel psychrophilic static (i.e., without mixing) DAD of cow feces in sequence batch reactor (SBR) has recently been developed at Agriculture and Agri-Food, Dairy and Swine Research and Development Center (DSRDC) in Sherbrooke, Quebec, Canada. The process has been demonstrated at an OLR of 3.0, 4.0, and 5.0 g total chemical oxygen demand (TCOD) kg−1 inoculum d−1 and hydraulic retention time (HRT) of 21 days in long term operation (252 days) [16]. Farmers in cold-climate regions would be interested in psychrophilic DAD of livestock manure because of its advantages over mesophilic and thermophilic operations. Compared to mesophilic and thermophilic operation, psychrophilic process requires less energy input for heating the bioreactor, and is less amenable to inhibition by high nitrogen content of the substrate [17]. More work is needed to demonstrate the feasibility of psychrophilic dry anaerobic digestion of cow feces and other agriculture waste, optimize its operation, and evaluate its economic benefits.
The objective of this study was to assess the impact of OLR (6.0–8.0 g TCOD kg−1 inoculum d−1) on the SMY, stability and performance of psychrophilic (20 °C) anaerobic digestion of dairy cow manure (TS 11%–16.5%) in long-term operation of SBR.
2. Materials and Methods
2.1. Experimental Setup
Two sets of duplicate reactors (Set I and Set II) were set-up and operated as sequential batch reactors (SBR) at a treatment cycle length (TCL) of 21 days measured between successive feedings of the reactor which was operated at the same OLR in a temperature controlled room (20 °C). The cycle includes the following steps: day 1: loading the reactor with inoculum, feeding the substrate, and mixing the inoculum and substrate; day 1–21: reaction; and day 21: unloading the digestate and starting the next cycle. Set I was operated at OLR 6.0 g TCOD kg−1 inoculum d−1 (cycle 1–3) then its OLR has been increased to 7.0 g TCOD kg−1 inoculum d−1 (cycle 4–10); Set II was operated at OLR of 7.0 g TCOD kg−1 inoculum d−1 (cycle 1–3) then its OLR has been increased to 8.0 g TCOD kg−1 inoculum d−1 (cycle 4–10). Table 1 explains the sequence of digestion cycles conducted for the three OLRs examined.

Table 1.
Sequence of digestions cycles operated at the three organic loading rates (OLRs) examined.
| Reactor Set | Cycle Number | |||||||||
|---|---|---|---|---|---|---|---|---|---|---|
| 1 | 2 | 3 | 4 | 5 | 6 | 7 | 8 | 9 | 10 | |
| Set I | 6.0 | 6.0 | 6.0 | 7.0 | 7.0 | 7.0 | 7.0 | 7.0 | 7.0 | 7.0 |
| Set II | 7.0 | 7.0 | 7.0 | 8.0 | 8.0 | 8.0 | 8.0 | 8.0 | 8.0 | 8.0 |
The intersection of the set number and the cycle number indicates the OLR (g TCOD kg−1 inoculum d−1) at which that set of bioreactors was operated during that cycle number.
2.2. Bioreactor
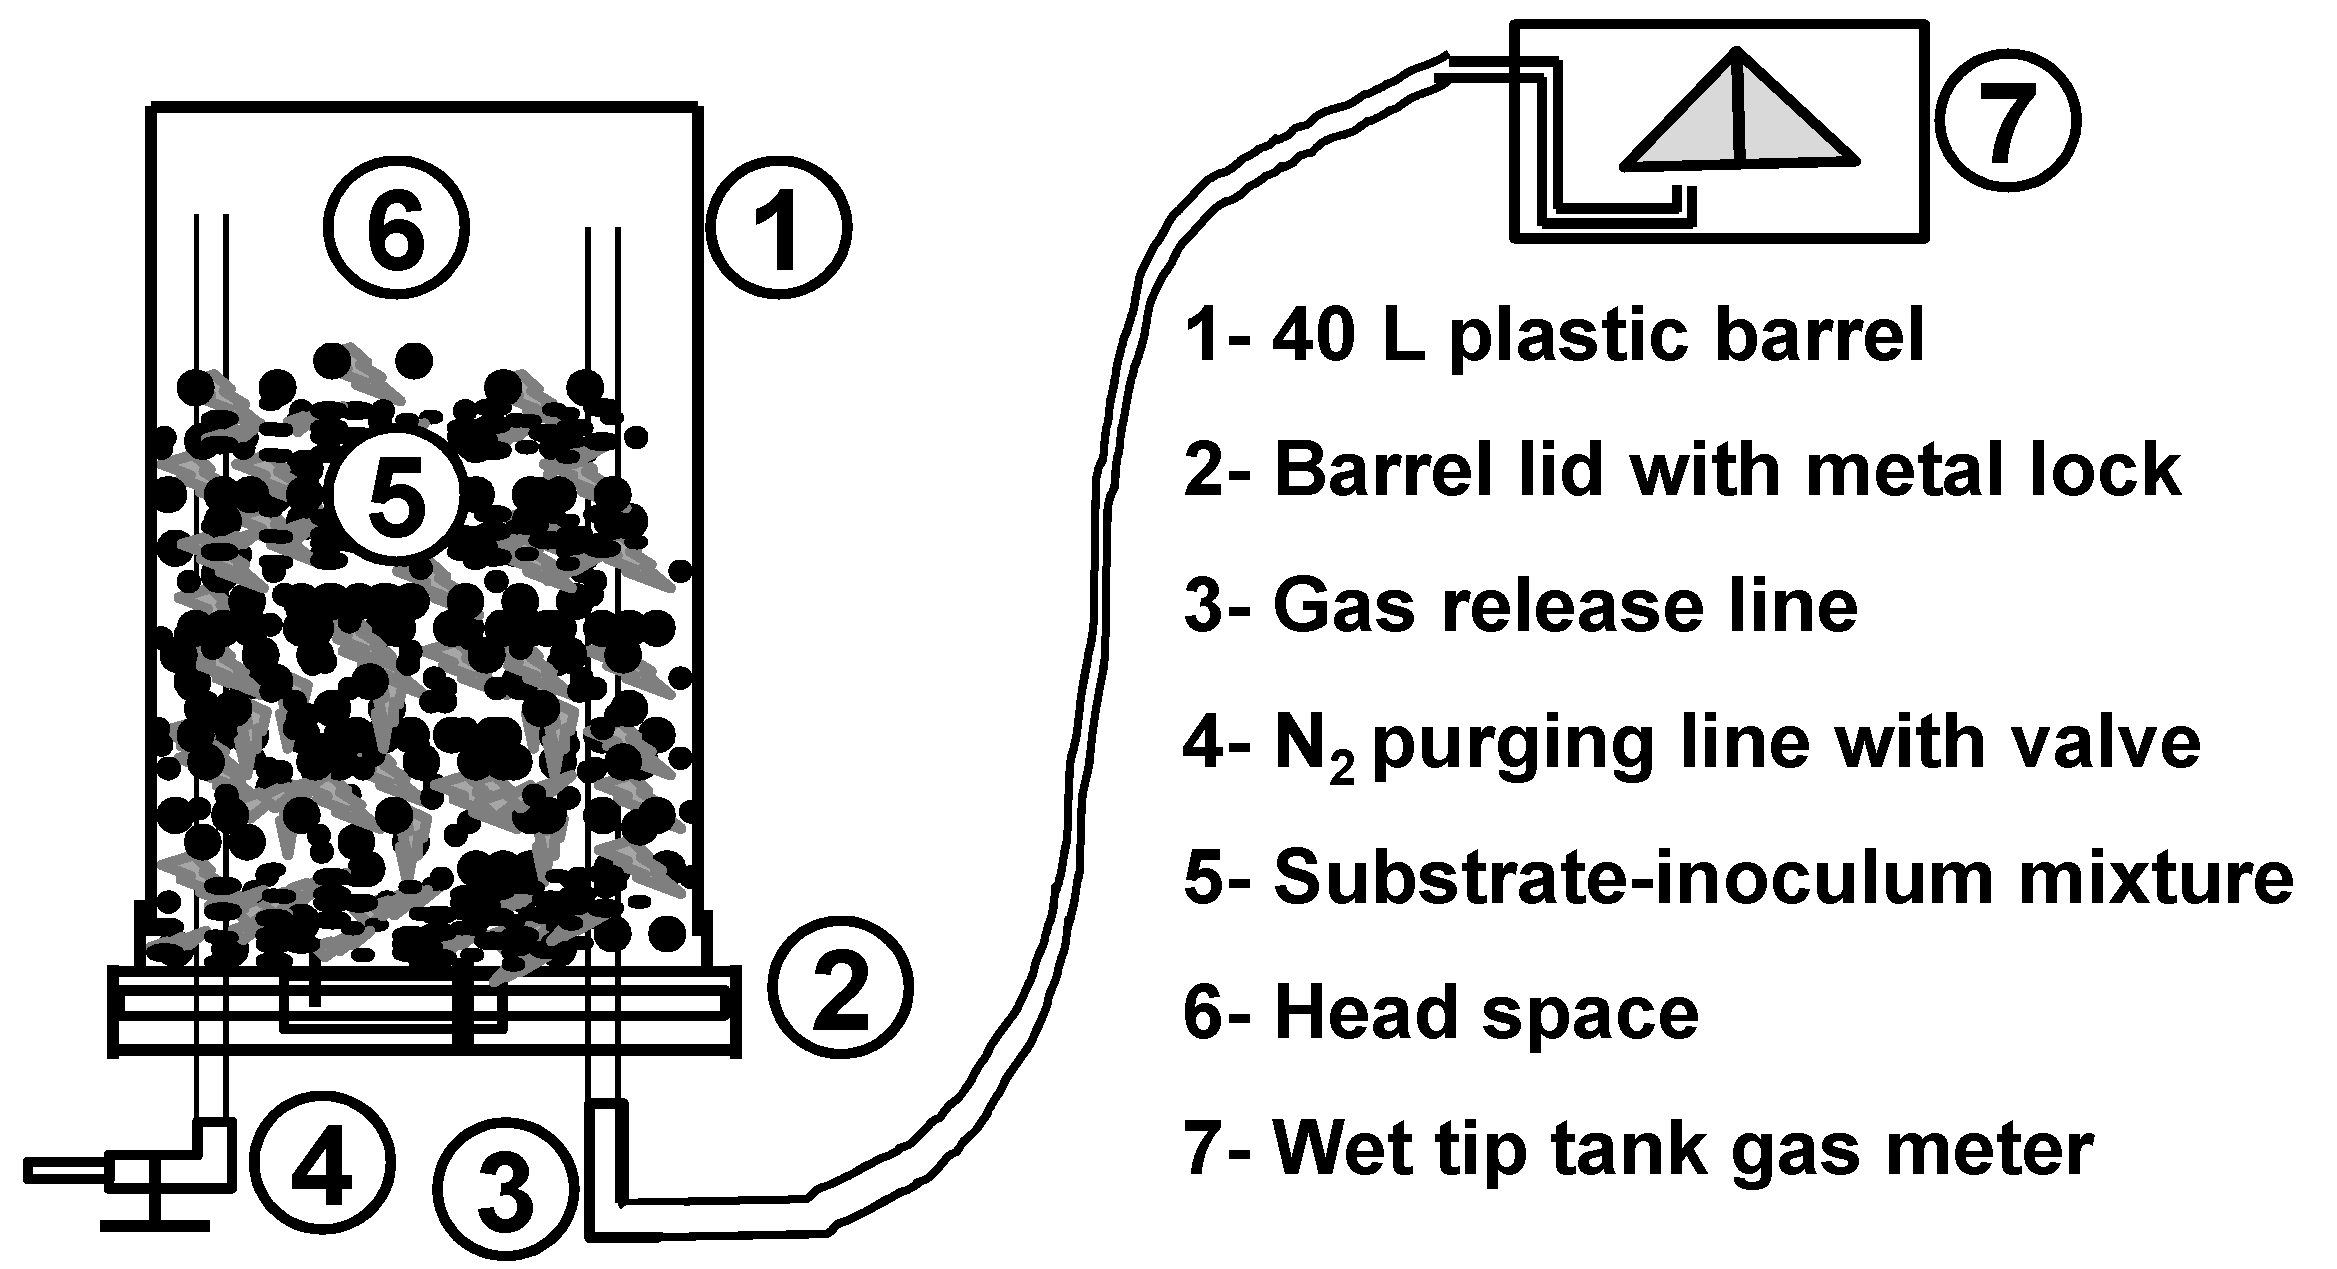
The reactor (Figure 1) was 40-L cylindrical (0.312 m in diameter × 0.520 m in height) plastic barrel fitted with two gas lines; one for purging with nitrogen gas immediately after feeding the substrate to maintain the anaerobic condition, and the second to release the biogas produced to a wet tip tank gas meter to measure the biogas volume. The barrel was kept upside down after it has been filled so that the wet content works as a water seal in addition to the seal of the barrel’s lid to ensure gas tightness.

Figure 1.
Schematic diagram of the high solids content anaerobic digester.
Figure 1.
Schematic diagram of the high solids content anaerobic digester.
2.3. Wet Tip Tank Gas Meter
The wet tip tank gas meter was manufactured at the workshop of DSRDC of transparent acrylic box, and consisted of a pivoting plastic container, which is comprised of two equal-size compartments facing downwards to a port that releases biogas under the pivoting point. The biogas accumulates under the compartment which faces the gas port. The tipping container was placed submerged inside the acrylic box which is filled with water. When biogas released into one compartment reaches a certain known volume, the container tips (the compartment filled with gas pivots upward) due to the buoyancy of the gas and releases the biogas which bubbles upwards to escape from water and leaves the box. Upon tipping (pivoting) the second compartment on the other side of the container moves downward and biogas released from the port starts to accumulate inside it, and so on. Each tip was counted using a magnetic sensor, which sends an electrical pulse to an electronic digital counter (manufacturer: OmRon, Schaumburg, IL, USA; model number: H7EC-NV-B). The tip counts were monitored daily and used to calculate the volume of the biogas produced. The wet tip tank gas meter calibration was checked weekly. After feeding, the reactor was held upside down so that the inoculum-substrate mixture provides sealing in addition to the locked lid of the barrel.
A total of 20 cycles have been conducted: three cycles at OLR (g TCOD kg−1 inoculum d−1) of 6.0; ten cycles at OLR of 7.0, and seven cycles at OLR of 8.0. The mass of inoculum used and the cow feces fed to each bioreactor at the beginning of the successive cycles and the OLR are given in Table 2.
Table 2.
Organic loading rate and total solids of the feed.
| Cycle Number | Cow Feces Fed (kg) | Organic Loading | Organic Loading Rate | SIR a (kg VS Fed kg−1 VS Inoculum) | |||
|---|---|---|---|---|---|---|---|
| TCOD Fed a (g) | VS Fed a (g) | g TCOD kg−1 Inoculum d−1 | g VS fed kg−1 Inoculum d−1 | g VS Fed kg−1 VS Inoculum d−1 | |||
| 1 | 3.429 | 756 | 490 | 6.0 | 3.9 | 28.0 | 0.6 |
| 2 | 3.950 | 756 | 501.7 | 6.0 | 4.0 | 45.9 | 1.0 |
| 3 | 3.950 | 756 | 501.7 | 6.0 | 4.0 | 45.4 | 1.0 |
| 1 | 4.000 | 882 | 572 | 7.0 | 4.5 | 51.6 | 1.1 |
| 2 | 4.605 | 882 | 584.8 | 7.0 | 4.6 | 51.5 | 1.1 |
| 3 | 4.605 | 882 | 584.8 | 7.0 | 4.6 | 52.0 | 1.1 |
| 4 | 5.88 | 882 | 646.8 | 7.0 | 5.1 | 61.3 | 1.3 |
| 5 | 5.88 | 882 | 646.8 | 7.0 | 5.1 | 63.5 | 1.3 |
| 6 | 5.054 | 882 | 601.4 | 7.0 | 4.8 | 60.9 | 1.3 |
| 7 | 5.054 | 882 | 601.4 | 7.0 | 4.8 | 53.0 | 1.1 |
| 8 | 5.738 | 881.9 | 648.4 | 7.0 | 5.1 | 48.5 | 1.0 |
| 9 | 5.738 | 881.9 | 648.4 | 7.0 | 5.1 | 61.0 | 1.3 |
| 10 | 5.683 | 882 | 576.3 | 7.0 | 4.6 | 58.0 | 1.2 |
| 4 | 6.720 | 1008 | 739.2 | 8.0 | 5.9 | 79.0 | 1.7 |
| 5 | 6.720 | 1008 | 739.2 | 8.0 | 5.9 | 70.0 | 1.5 |
| 6 | 5.776 | 1008 | 687.5 | 8.0 | 5.5 | 67.9 | 1.4 |
| 7 | 5.776 | 1008 | 687.5 | 8.0 | 5.5 | 68.2 | 1.4 |
| 8 | 6.558 | 1008 | 741.1 | 8.0 | 5.9 | 68.6 | 1.4 |
| 9 | 6.558 | 1008 | 741.1 | 8.0 | 5.9 | 65.6 | 1.4 |
| 10 | 6.495 | 1008 | 658.6 | 8.0 | 5.2 | 66.3 | 1.4 |
a Cow feces characteristics which are required to calculate the quantity of TCOD fed, VS fed, and SIR are provided in.
2.4. Inoculum and Substrate
The initial inoculum (for first cycle) was obtained from a laboratory scale psychrophilic (20 °C) anaerobic reactors fed with fresh dairy manure (7% TS). At the end of each cycle, the digestate in the replicate reactors was mixed together and homogenized manually using a scoop for 5 min, and part of it has been used as inoculum (6 kg per reactor) for the next cycle (cycle 2 to 10) conducted at the same OLR. The digestate was mixed and homogenized so that each reactor is seeded with the same inoculum at each new cycle.
Fresh feces from dairy cows was collected at the experimental farm of the DSRDC. Feces was collected on wood boards, before getting in contact with urine and bedding, transferred into a plastic drum, and stored at 4 °C before being fed to the reactors. The cow feces has been stored for a maximum of 6 weeks. Cycles having the same cycle number but conducted at different OLR have been fed from the same batch of cow feces but the mass was different according to the OLR examined.
2.5. Sampling
Samples of reactor content were collected before feeding day 21 for (digestate = inoculum) for the previous cycle and immediately after feeding (ISM = inoculum-substrate mixture) for the new cycle. Samples were also taken on day 7 by opening the reactor, mixing its content manually for 5 min to ensure that the sample is representative of the reactor content. The reactor has been flushed with nitrogen to maintain anaerobic digestion. The gas samples were taken through gas sampling port sealed with septa and installed on the gas line mid-way between the barrel and the gas meter using a 10 mL plastic syringe.
2.6. Organic Loading Rate
During the experiments, the organic loading rate (OLR) (Table 2) fed to the bioreactors has been based on the mass of total chemical oxygen demand (TCOD) fed while substrate-to-inoculum ratio (SIR) has been based on the mass of volatile solids. It has been calculated based on the mass of cow feces fed and its TCOD content. The physico-chemical characteristics of the cow feces fed are given in Table 3.
The OLR was expressed in g of TCOD fed per kg of inoculum per day and in g of total VS fed per kg of inoculum per day. The average substrate to inoculum ratio (SIR; based on wet mass) was 0.6 ± 0.1, 0.9 ± 0.1, and 1.1 ± 0.1 at OLR of 6.0, 7.0, and 8.0 g TCOD kg−1 inoculum d−1, respectively. The average SIR expressed as a mass of VS fed per a mass of VS inoculum was 0.8 ± 0.2, 1.2 ± 0.1, and 1.5 ± 0.1 for the same OLRs mentioned above, respectively.
Table 3.
Physicochemical characteristics of the cow feces fed in each treatment cycle.
| Cycle | pH | TCOD (g·kg−1) | TS (%) | VS (%) | Alkalinity (g CaCO3 kg−1) | Acetate (g·kg−1) | Propionate (g·kg−1) | Butyrate (g·kg−1) | Fiber Components (% of Dry Matter) | ||
|---|---|---|---|---|---|---|---|---|---|---|---|
| Cellulose | Hemicellulose | Lignin | |||||||||
| 1 | 6.62 | 220.5 | 16.1 | 14.3 | 7.63 | 3.6 | 1.4 | 0.51 | 26.33 | 16.35 | 10.67 |
| 2–3 | 6.17 | 191.5 | 14.7 | 12.9 | 7.90 | 5.0 | 1.30 | 2.20 | 24.69 | 26.06 | 10.77 |
| 4–5 | 6.5 | 150.0 | 11.8 | 10.3 | 7.70 | 4.5 | 1.10 | 0.93 | 24.58 | 20.54 | 11.95 |
| 6–7 | 6.73 | 174.5 | 13.5 | 11.9 | 9.10 | 3.9 | 1.00 | 0.69 | 25.53 | 25.00 | 14.93 |
| 8–9 | 6.86 | 153.8 | 11.2 | 9.84 | 7.17 | 3.4 | 0.83 | 0.63 | 22.15 | 20.10 | 12.31 |
| 10 | 6.71 | 155.2 | 11.5 | 10.1 | 6.91 | 3.9 | 0.96 | 0.50 | 24.39 | 19.28 | 12.74 |
Note: Each reactor was inoculated with 6.0 kg of digestate from the previous cycle.
2.7. Biogas Measurement
Biogas production was measured daily with calibrated wet tip tank gas meters while the biogas components (CH4, CO2 and H2S) were determined weekly using a Hach Carle 400 AGC gas chromatograph (Model 04131-C, Chandler Engineering, Houston, TX, USA) configured for the application 131-C. The application uses a column (3.175 mm diameter) composed of 1.8 m (805 porapak N + 205 Porapak Q), 2.1 m (80% molecular sieve 13X + 20% molecular Sieve 5A), and 1.8 m (80% OV-101 on chromosorb W—High Performance (HP)). The column and thermal conductivity detector (TCD) were operated at 85 °C with a helium gas flow rate of 30 mL·min−1 [18]. The linearity of the quantification regression equation covered the range from 0.001% to 100% (pure gas injection) with R2 value of 0.9991, 0.9988, and 0.9968 for CH4, CO2, and H2S. The quantification regression equation has been generated using certified standards containing different proportions of the gases measured. Instrument calibration was performed weekly with a standard gas (27.3% CO2, 1.01% N2, 71.69% CH4, 0.53% H2S); several standard gas samples were injected at the beginning and end of gas analysis as well as after every 10 unknown samples. Methane (CH4) production is reported in normalized liters (NL CH4), i.e., the CH4 volume produced was corrected to standard temperature and pressure (STP) (273 K; 1 atm) using Equation (1):
where Vm is the measured volume of biogas, η is the percentage of CH4 in biogas, Tm and Pm are the actual temperature and atmospheric pressure at the time of measurement, and Ts and Ps are the standard temperature and pressure. is the volume of methane at the standard temperature and atmospheric pressure. The specific methane yield (SMY) obtained during an individual cycle (TCL = 21 days) has been calculated by divining the cumulative methane volume produced during that cycle by the mass of volatile solids (VS) contained in the manure fed at the beginning of that cycle.
2.8. Analytical Methods
Each bioreactor has been sampled weekly. The duplicate samples were analyzed to determine the volatile fatty acids (VFAs), total solids (TS), volatile solids (VS), pH, alkalinity, and the total chemical oxygen demand (TCOD). The TCOD, TS, VS, alkalinity and pH were determined using standard methods [19]. Alkalinity: method number 2320B Potentiometric titration to preselected pH 4.38, Total solids: method number 2540B, Volatile solids method number: 2540E. VFA: method number 5560D. The concentrations of individual volatile fatty acids (VFAs) including acetic, propionic, butyric, isobutyric, butyric, valeric and isovaleric acids have been measured using Perkin Elmer gas chromatograph (GC) model 8310 (Perkin Elmer, Waltham, MA, USA) fitted with flame ionization detector (FID) and, equipped with a J&W Scientific DB-FFAP high resolution column (30 m × 0.53 mm × 1.00 μm; Chromatographic Specialties Inc., Brockville, On, Canada) [18]. Details of the analytical method used in this study have been described previously [18]. The VFAs minimum detection limits (mg·L−1) were as follows: acetic acid (23.6), propionic acid (12.3), isobutyric acid (5.0), butyric acid (27.7), isovaleric acid (1.3), valeric acid (1.7), and caproic acid (1.8). The calibration curve for each acid was linear over the range from zero to 1000 mg·L−1. The regression coefficients of the calibration equations for the acids measured were: 0.9991, 0.9990, 0.9991, 0.9973, 0.9996, 0.9992, and 0.9995, respectively.
2.9. Fiber Analysis
Cow feces is a complex substrate which contains fibers. The fiber content in cellulose, hemicellulose, and lignin was determined. Hemicellulose can be calculated as the difference between neutral detergent fiber (NDF) and acid detergent fiber (ADF), cellulose as the difference between acid detergent fiber and acid detergent lignin (ADL) [20].
3. Results and Discussion
The percent of H2S in the biogas was less than 0.06% in all samples of gas analyzed during the successive cycles. The cellulose, hemicellulose, and lignin components of the fiber in the cow feces fed in each cycle are given in Table 3. However, the overall average values of these components for all cycles were 24.6% ± 1.4% (cellulose), 21.2% ± 3.7% (hemicellulose), and 12.2% ± 1.6% (lignin).
Physico-chemical characteristics (TCOD, TS, VS, and acetic, propionic, and butyric acids concentration) of the dairy cow manure fed during the successive cycles are given in Table 3. The quality of the cow feces as described by TCOD, TS, and VS content varied significantly. During the first three cycles, the cow feces had higher values of TCOD, TS, and VS compared to that used during the rest of cycles. The average physicochemical characteristics of the inoculum and inoculum-substrate mixture (ISM) at the beginning of the treatment cycles operated at each OLR examined are given in Table 4.
Table 4.
Average physicochemical characteristics of the inoculum and the inoculum-substrate mixture (ISM) for the cycles operated at the same OLR.
| OLR a | Cycles Number | Substrate | pH | TS (%) | VS (%) | Acetate (g·kg−1) | Propionate (g·kg−1) | Butyrate (g·kg−1) |
|---|---|---|---|---|---|---|---|---|
| 6 | 1–3 | Inoculum | 7.32 ± 0.2 b | 12.5 ± 3.2 | 10.5 ± 3.0 | 0.11 ± 0.04 | 0.02 ± 0.01 | 0.04 ± 0.02 |
| ISM c | 6.99 ± 0.12 | 13.0 ± 0.4 | 11.1 ± 0.4 | 1.90 ± 0.09 | 0.57 ± 0.06 | 0.83 ± 0.47 | ||
| 7 | 1–10 | Inoculum | 7.29 ± 0.19 | 10.1 ± 1.0 | 8.4 ± 1.0 | 0.22 ± 0.10 | 0.04 ± 0.02 | 0.10 ± 0.06 |
| ISM | 7.07 ± 0.17 | 10.9 ± 0.5 | 9.4 ± 0.5 | 2.63 ± 0.29 | 0.72 ± 0.15 | 0.81 ± 0.46 | ||
| 8 | 4–10 | Inoculum | 7.33 ± 0.12 | 10.0 ± 0.6 | 8.3 ± 0.5 | 0.24 ± 0.12 | 0.04 ± 0.01 | 0.1 ± 0.06 |
| ISM | 7.02 ± 0.15 | 11.3 ± 0.4 | 9.7 ± 0.4 | 2.84 ± 0.33 | 0.77 ± 0.14 | 0.86 ± 0.43 |
a Units of OLR are g TCOD kg−1 inoculum d−1. b Values given are average and standard deviation for all cycles operated at the given OLR. c ISM = inoculum-substrate mixture.
3.1. Methane Production
The operation of bioreactors was generally stable and biogas production proceeded steadily during the successive cycles. No inhibition or lag phase in biogas production has been observed. The profiles of methane production expressed as SMY (NL CH4 kg−1 VS fed) in the replicate bioreactors are shown in Figure 2. The cumulative SMYs calculated during the successive cycles are given in Table 5.

Figure 2.
Specific methane yield profiles for the psychrophilic anaerobic digestion of dairy cow feces. (Coefficient of variation between the duplicate bioreactors was less than 5%).
Figure 2.
Specific methane yield profiles for the psychrophilic anaerobic digestion of dairy cow feces. (Coefficient of variation between the duplicate bioreactors was less than 5%).
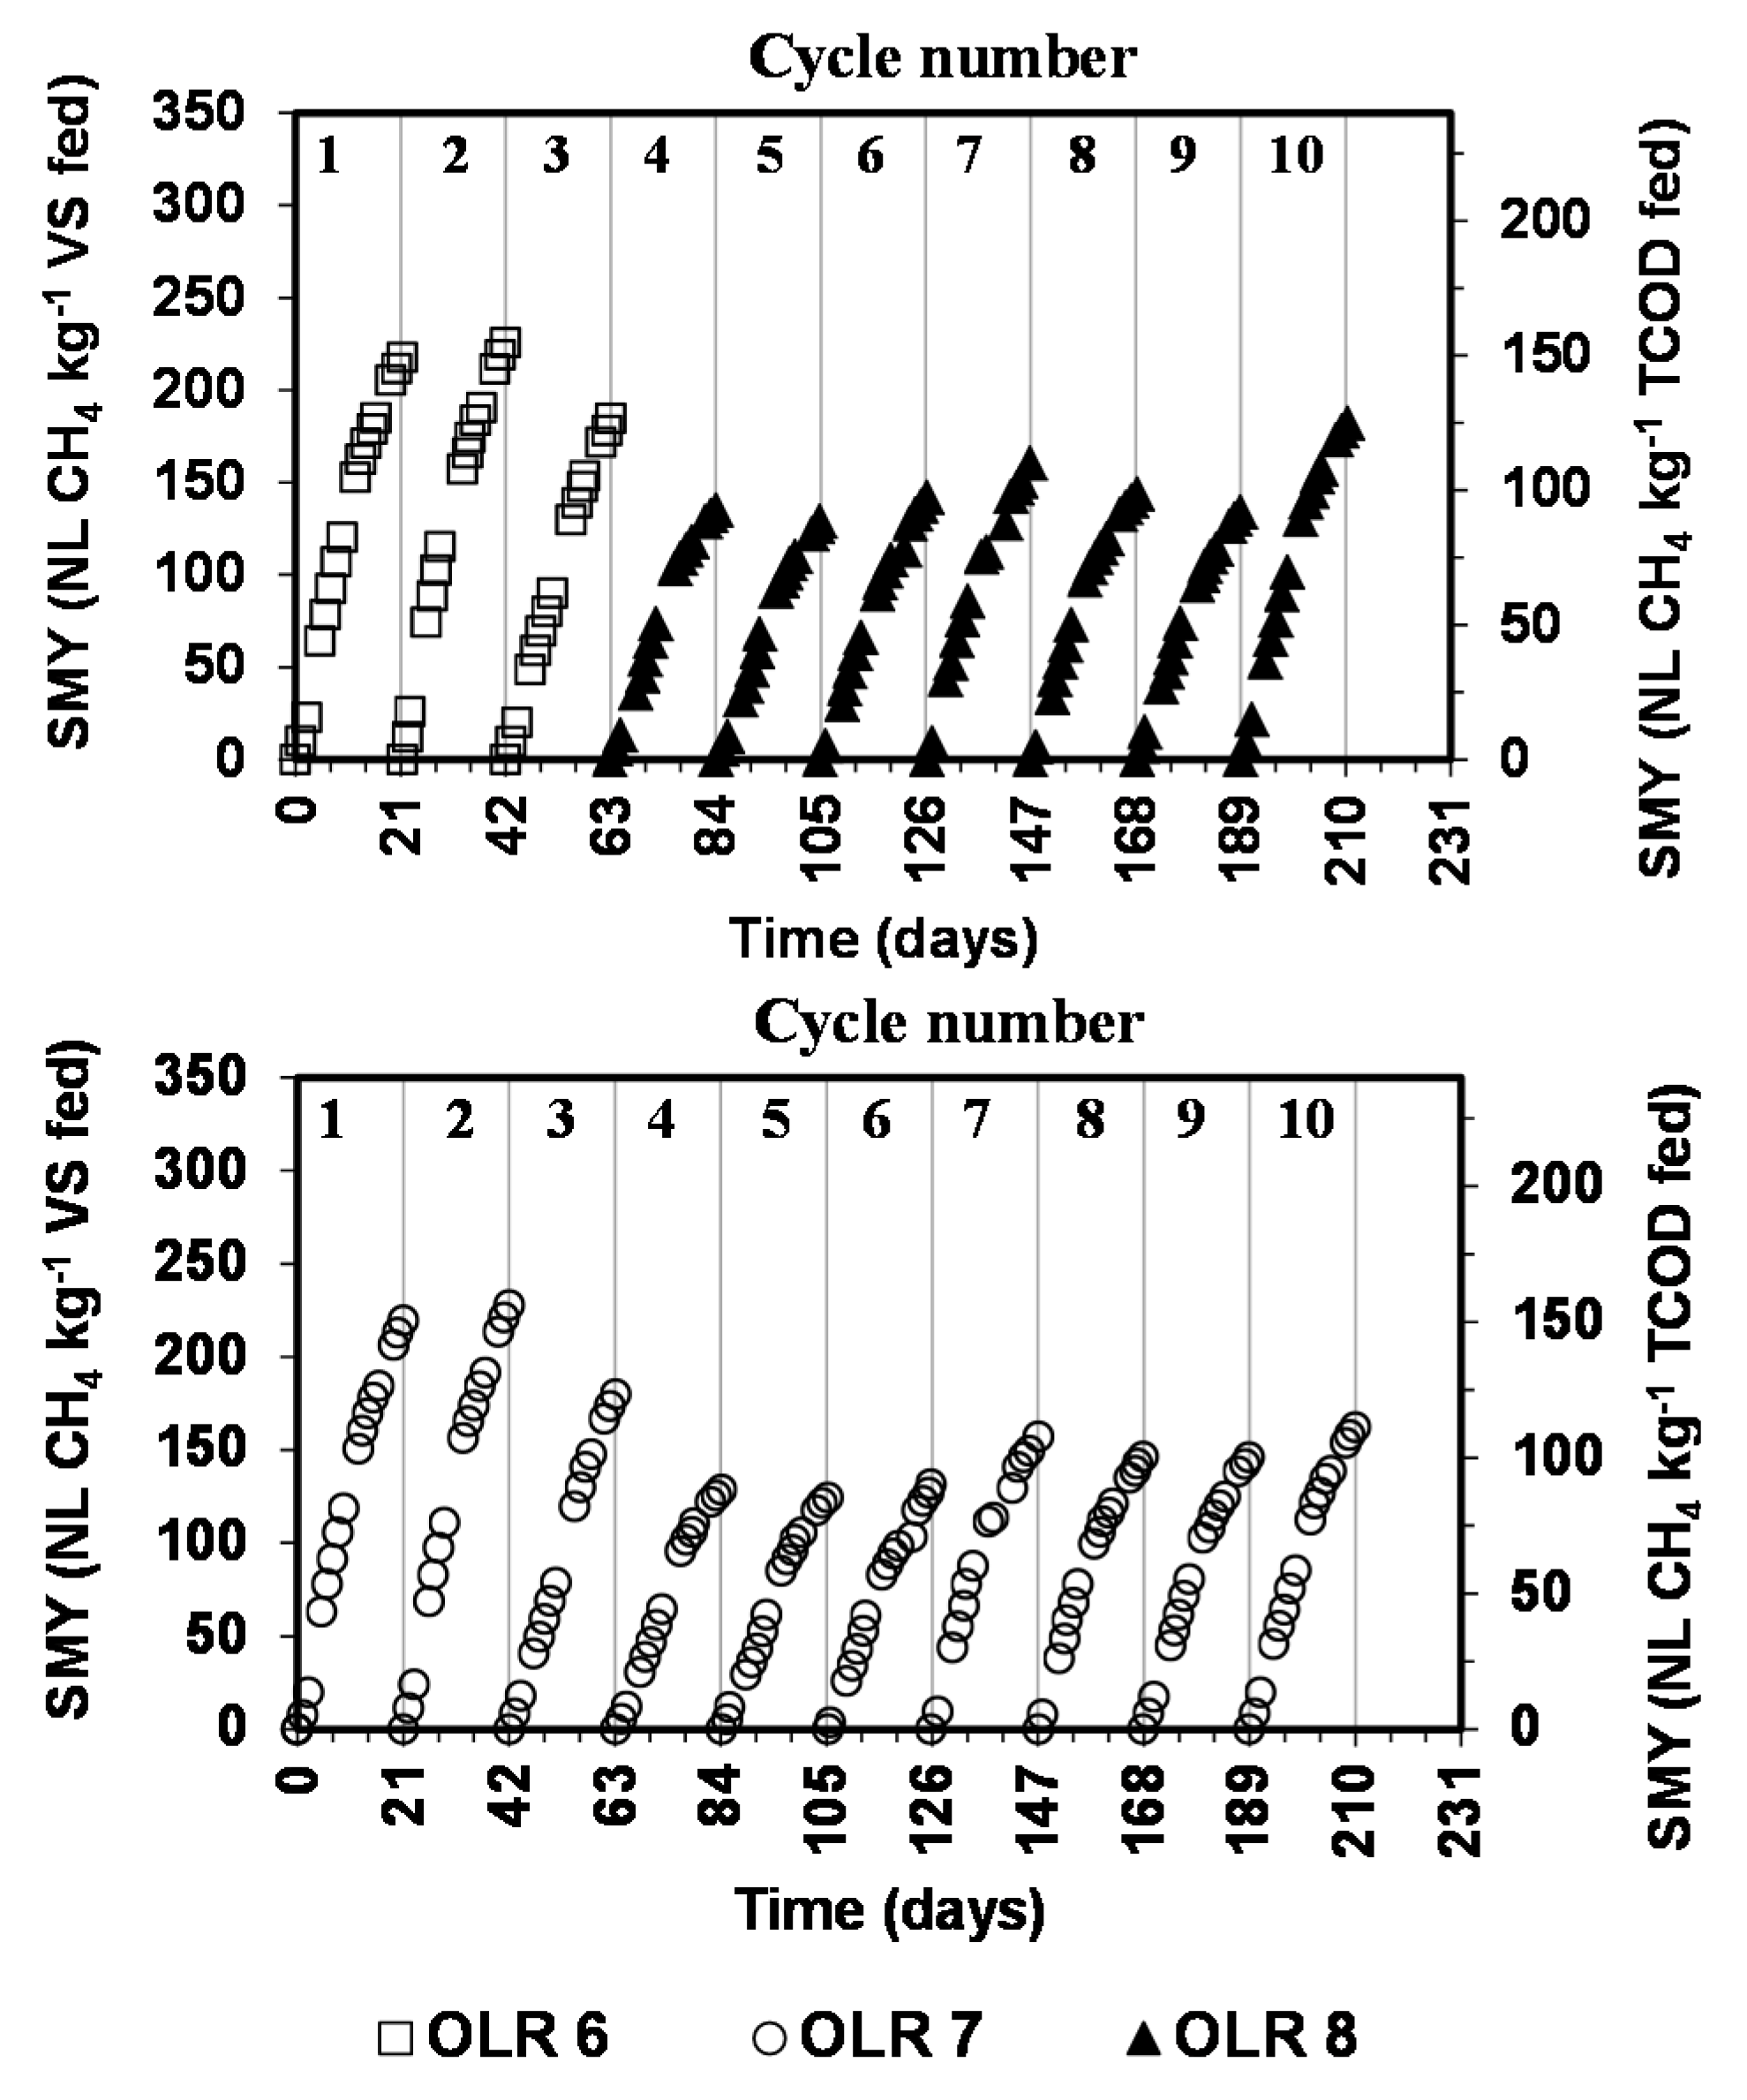
Table 5.
Rate and specific methane yield for the psychrophilic anaerobic digestion of cow feces (TS 11.0% to 16.5%).
| Cycle | Organic Loading Rate (g TCOD kg−1 inoculum d−1) | |||||
|---|---|---|---|---|---|---|
| 6.0 | 7.0 | 8.0 | ||||
| SMY (NL CH4 kg−1 VS Fed) | CH4 Production Rate (NL CH4 kg−1 VS d−1) | SMY (NL CH4 kg−1 VS Fed) | CH4 Production Rate (NL CH4 kg−1 VS d−1) | SMY (NL CH4 kg−1 VS Fed) | CH4 Production Rate (NL CH4 kg−1 VS d−1) | |
| 1 | 217.8 ± 6.0 a | 10.4 ± 1.1 | 219.6 ± 15.1 a | 10.5 ± 0.5 | – | – |
| 2 | 225.7 ± 1.2 a | 10.7 ± 1.4 | 227.9 ± 4.8 a | 10.9 ± 1.2 | – | – |
| 3 | 184.7 ± 0.5 a | 8.8 ± 0.4 | 179.9 ± 3.2 a | 8.6 ± 0.4 | – | – |
| 4 | – | – | 128.7 ± 3.4 a | 6.1 ± 0.5 | 135.1± 1.9 b | 6.4 ± 0.5 |
| 5 | – | – | 124.5 ± 1.4 a | 5.9 ± 0.5 | 128.9 ± 2.9 a | 6.1 ± 0.4 |
| 6 | – | – | 131.6 ± 3.8 a | 6.3 ± 0.4 | 141.9 ± 8.2 a | 6.8 ± 0.8 |
| 7 | – | – | 157.4 ± 0.4 a | 7.5 ± 0.9 | 160.4 ± 15.7 a | 7.6 ± 0.6 |
| 8 | – | – | 146.5 ± 4.1 a | 7.0 ± 1.0 | 143.7 ± 2.5 a | 6.8 ± 0.5 |
| 9 | – | – | 146.2 ± 3.4 a | 7.0 ± 0.8 | 134.0 ± 8.2 a | 6.4 ± 0.3 |
| 10 | – | – | 162.3 ± 2.4 a | 7.7 ± 0.4 | 182.2 ± 1.6 b | 8.7 ± 0.6 |
The superscripts a and b indicate the statistical similarity or difference. SMYs obtained in the same cycle but in at different OLR (different columns) with a similar superscripts are not significantly different (p < 0.005). The TCL for each cycle was 21 days.
Two-tail t-test at 95% confidence level has been conducted on the values of SMY obtained in cycle 1–3 at OLR 6.0 and 7.0 g TCOD kg−1 inoculum d−1 where the same cow feces quality has been fed to the reactors operating at these two OLRs during each cycle. Similarly, two-tail t-test has also been conducted on the values of SMY obtained in cycle 4–10 at OLR 7.0 and 8.0 g TCOD kg−1 inoculum d−1 where the same cow feces quality has been fed to the reactors at operating these two OLRs during each cycle.
The SMYs obtained at OLR 6.0 and 7.0 g TCOD kg−1 inoculum d−1 during cycle 1, 2 and 3 (Table 5), where the same cow manure has been fed to the bioreactors, are statistically similar to each other. The overall average of the SMY during the first 3 cycles was 209.4 ± 21.8 and 209.1 ± 25.6 NL CH4 kg−1 VS fed at OLR 6.0 and 7.0 g TCOD kg−1 inoculum d−1, respectively, and they are statistically similar.
Therefore, the variation in OLR between 6.0 and 7.0 did not influence the SMY. Similarly, the SMYs obtained at OLR 7.0 and 8.0 g TCOD kg−1 inoculum d−1 during cycle 5 to 9, where the same cow manure has been fed to the bioreactors operating at the these OLRs, are statistically similar to each other. The overall average of the SMY during the cycles 4 to 10 was 147.3 ± 14.8 and 149.5 ± 16.8 NL CH4 kg−1 VS fed at OLR 7.0 and 8.0 g TCOD kg−1 inoculum d−1, respectively, and they are statistically similar. Therefore, the variation in OLR between 7.0 and 8.0 did not influence the SMY. It appears that at this SIR, the inoculum is not overloaded and still has the ability to degrade substantial fraction of the biodegradable organics within the TCL of 21 days. However, further increase in OLR is expected to decrease the SMY until a maximum threshold OLR is reached when signs of instability are observed such as buildup of VFAs, pH drop, discontinuation of CH4 production. Notice that Tukey’s multiple comparisons test conducted at 95% confidence level indicated statistical differences in the quality of cow feces fed at OLR 7.0 and 8.0 g TCOD kg−1 inoculum d−1 (except for cycles 1 and 8–10 which were similar in terms of TCOD/VS ratio only). Therefore, variation in the SMY observed from cycle to cycle at the OLR applied was due to the variation in the quality (TCOD, VS, fiber content, and other biodegradable components) of cow feces fed.
Notice that at OLR of 7.0 g TCOD kg−1 inoculum d−1, the SMYs during the cycles 1, 2 and 3 were 219.6 ± 15.1, 227.9 ± 4.8, and 179.9 ± 3.2 NL CH4 kg−1 VS fed, respectively, because the cow feces fed had higher TCOD and VS compared to the feces used in the other cycles (4–10) as indicated in Table 6. At the same OLR (7.0 g TCOD kg−1 inoculum d−1), the SMY during cycles 4 to 10 decreased to an average of 147.3 ± 14.8 NL CH4 kg−1 VS fed which is equivalent to around 66.6% of the average SMY obtained during cycles 1 to 3. Cow feces fed during the cycles 1, 2 and 3 had an average TCOD of 201.2 ± 16.7 g·kg−1 feces and an average VS of 13.4% ± 0.8%, respectively, while cow feces fed during the cycles 4 to 10 had an average TCOD of 157.8 ± 11.6 g·kg−1 and an average VS of 10.5% ± 0.93%, respectively (Table 3). Moreover, because cow feces fed during cycle 1–3 had more VFAs than cow feces fed in cycles 4–10 (Table 3) then the quantities of VFAs fed during cycle 1–3 were higher than those fed during cycle 4–10. The quality of cow feces has also been described in terms of mass of fiber fed, contents of cellulose, hemicellulose, and lignin, the (cellulose + hemicellulose)/lignin ratio and TCOD/VS ratio (Table 6). The last two parameters (i.e., (cellulose + hemicellulose)/lignin ratio and TCOD/VS ratio) were selected so that they provide standardized unbiased ratios to indicate the quality of cow feces.
Table 6.
Effects of quality of cow feces fed on specific methane yield.
| Cycle | SMY (NL CH4 kg−1 VS Fed) | TCOD/VS Ratio | Fiber Fed (kg) | (Cellulose + Hemicellulose)/ Lignin Ratio |
|---|---|---|---|---|
| 1 | 219.6 ± 15.1 a | 1.54 ± 0.00 a | 0.31 ± 0.00 a | 4.0 ± 0.00 a |
| 2–3 | 203.9 ± 33.9 a | 1.48 ± 0.00 b | 0.41 ± 0.00 b | 4.71 ± 0.00 b |
| 4–7 | 135.6 ± 14.9 b | 1.45 ± 0.02 c | 0.44 ± 0.02 c | 3.58 ± 0.23 c |
| 8–10 | 151.7 ± 9.2 b | 1.55 ± 0.01 a | 0.36 ± 0.01 d | 3.43 ± 0.00 c |
The table is for the cycles operated at OLR of 7.0 g TCOD kg−1 inoculum d−1. The superscripts (a, b, c and d) indicate the statistical similarity or difference. Values in the same column with similar superscripts are statistically not significantly different based on Tukey’s multiple comparison test at 95% confidence interval.
Generally, cow feces fed in cycles 1–3 had higher average contents of cellulose (25.51%) and less content of lignin (10.72%) in fiber compared to cow feces fed in cycles 4–10 (cellulose (24.16%) and lignin (12.98%)). This is reflected by (Cellulose + hemicellulose)/lignin ratio of 4.0 and 4.71 during cycles 1 and 2–3, respectively, compared to 3.58 and 3.43 during cycles 4–7 and 8–10, respectively. Lignin builds complexes with cellulose and hemicellulose, thus creates a physical barrier making it difficult for microbial enzymes to break down the organic compounds in short time. Therefore the higher the lignin quantity the harder is the degradation of cellulose and hemicellulose.
Although the comparative parameters were summarized in Table 3 and Table 6 they were not sufficient to quantitatively explain the reduction in the SMY. These parameters measure the quantity of organics but do not measure their biodegradability or quality. TCOD and VS tests do not distinguish between fiber, lipids, fat, proteins, amino acids, etc. The content of these components which have not been measured might have been different and caused the difference in SMY between cycles 1–3 and 4–10. Notice that the theoretical methane potential per gram of VS is significantly greater for fat compared to proteins and carbohydrate (1014, 496, and 415 NL CH4 kg−1 VS, respectively) [21]. These differences collectively caused that the SMY during cycles 1–3 was higher than that obtained in cycles 4–10.
The specific methane production rate obtained at OLR 6.0 and 7.0 g TCOD kg−1 inoculum d−1 during cycles 1, 2 and 3 (Table 5) were similar to each other. The overall average of the specific methane production rate during the first 3 cycles was 10.0 ± 1.0 and 10.0 ± 1.2 NL CH4 kg−1 VS fed d−1 at OLR 6.0 and 7.0 g TCOD kg−1 inoculum d−1, respectively. Similarly, the specific methane production rate obtained at OLR 7.0 and 8.0 g TCOD kg−1 inoculum d−1 during cycle 4 to 10 were similar to each other. The overall average of the specific methane production rate during the cycles (4 to 10) was 6.8 ± 0.7 and 7.0 ± 0.9 NL CH4 kg−1 VS fed d−1 at OLR 7.0 and 8.0 g TCOD kg−1 inoculum d−1, respectively.
The data available in the accessible literature on the performance of psychrophilic high solids content anaerobic digestion (PDAD) is very scarce; therefore, the results have been compared to the performance of mesophilic and thermophilic DAD of cow manure (Table 7). The average yield of 209.4 ± 21.8 NL CH4 kg−1 VS fed obtained at OLR of 6.0 g TCOD kg−1 VS d−1 (equivalent to 4.0 ± 0.1 g VS fed kg−1·d−1) in this study after 21 days of psychrophilic (20 °C) incubation is greater than the yield 161 NL CH4 kg−1 VS of dairy cattle feces fed at OLR of 1.4 g VS substrate kg−1 VS inoculum reported by Møller et al. [22] at 35 °C and HRT of 40 days. Similarly, the SMYs of 157.8 ± 11.6 and 147.3 ± 14.8 NL CH4 kg−1 VS fed obtained in this study at OLR of 7.0 and 8.0 g TCOD kg−1 VS d−1 are within the range of the SMY 135 and 164 L CH4 kg−1 VS obtained during mesophilic (30 °C) anaerobic digestion of dairy cattle manure reported by Somayaji and Khanna [23], and Shyam [24] at HRT of 40 and 50 days, respectively.
However, the average SMYs (162.5 ± 38.6, and 140.7 ± 11.1 NL CH4 kg−1 VS fed) obtained at OLR of 7.0, and 8.0 g TCOD kg−1 VS d−1 (equivalent to 4.8 ± 0.2 and 5.7 ± 0.3 kg VS fed m−3·d−1, respectively) in this study are comparable to the yields reported by Møller et al. [22], Somayaji and Khanna [23], and Shyam [24]. For the same incubation time, Schafer et al. [25] reported a SMY of 85 L CH4 kg−1 VS from beef cattle manure in two-stage (hydrolysis-methanogenesis) reactor with OLR of 6 and 3 kg VS m−3·d−1 for hydrolysis and methanogenesis stages, respectively. The average SMY obtained in this study (209.4 ± 21.8 NL CH4 kg−1 VS fed) at OLR of 6.0 g TCOD kg−1 inoculum d−1 is less than those reported by Varel et al. [26] [240–280 L CH4 kg−1 VS] at temperatures between 35 and 65 °C, HRT of 18 days, and OLR of 3.3 kg VS m−3·d−1 (Table 7). Compared to Varel et al.’s results [26] for operations at 35 to 65 °C, the current study demonstrated a potential technology which minimizes energy required for heating the bioreactor. Achieving a stable psychrophilic anaerobic digestion of undiluted cow manure at increased OLR (6.0 to 8.0 g TCOD kg−1 inoculum d−1) over long-term operation is a significant improvement with potential market in cold climate area.
The specific methane yields obtained in this study demonstrate that the novel PDAD of cow feces in sequence batch reactor is practically feasible and as efficient as mesophilic and thermophilic anaerobic digestion given that a well-acclimatized inoculum is developed and maintained. Since the results of this study showed that there was no difference in SMY obtained at OLR 6.0 to 8.0 g TCOD kg−1 inoculum d−1 then there is a potential to increase the OLR further. It is important to define the threshold of maximum OLR, which allows for using a maximum proportion of substrate and minimum proportion of inoculum compared to those used in this study without jeopardizing decreasing the SMY. This objective could be addressed in future research.
Table 7.
Specific methane yield (L CH4 kg−1 VS) of cow feces at different temperatures and total solids.
| Substrate | OLR (g VS kg−1 Inoculum d−1) unless Indicated otherwise | HRT (day) | TS (%) | Temperature (°C) | Reference | ||||||||
|---|---|---|---|---|---|---|---|---|---|---|---|---|---|
| 15 | 20 | 30 | 35 | 40 | 50 | 55 | 60 | 65 | |||||
| Dairy cow manure | 6.0 g TCOD L−1 | 21 | 11–16 | – | 209.4 ± 21.8 a | – | – | – | – | – | – | – | This study |
| Dairy cow manure | 7.0 g TCOD L−1 | 21 | 11–16 | – | 147.3 ± 14.8 a | – | – | – | – | – | – | – | This study |
| Dairy cow manure | 8.0 g TCOD L−1 | 21 | 11–16 | – | 149.5 ± 16.8 a | – | – | – | – | – | – | – | This study |
| Cow dung | 5.3 b | 84 | 13.1–14.7 | 174 | – | – | – | – | – | – | – | – | Zhu and Jha [27] |
| Cow dung | 10.7 b | 63 | 15.2 | – | – | – | 167 | – | – | 188 | – | – | Jha et al. [13] |
| Cow dung | 10.7 b | 63 | 7.7 | – | – | – | 194 | – | – | 226 | – | – | Jha et al. [13] |
| Cow dung (no mixing) | 18.6 b | 35 | 16.2 | – | – | – | 127 | – | – | – | – | – | Jha et al. [14] |
| Cow dung with mixing | 18.6 b | 35 | 16.2 | – | – | – | 150 | – | – | – | – | – | Jha et al. [14] |
| Feedlot manure | NR | 40 | 16.3 | – | – | – | 9.2 | – | – | – | – | – | Borhan et al. [28] |
| Cattle manure | 3.3 | 18 | – | – | – | – | 260 | 270 | 250 | 280 | 270 | 240 | Varel et al. [26] |
| Cattle manure | 3.0 | 15 | – | – | – | – | – | – | – | 202 | – | 165 | Ahring et al. [29] |
| Cattle manure | 2.0 | 20 | – | – | – | – | – | – | 260 | – | 230 | – | El-Mashad et al. [5] |
| Dairy manure | NR | 30 | – | – | – | – | 242.7 | – | – | – | – | – | Labatut et al. [30] |
| Cattle manure | NR | 40 | – | – | – | 135 | – | – | – | – | – | – | Somayaji and Khanna [23] |
| Cattle manure | NR | 50 | – | – | – | 164 | – | – | – | – | – | – | Shyam [24] |
| Cattle manure | NR | 100 | – | – | – | 230 | – | – | – | – | – | – | Shyam [24] |
| Dairy cattle manure | NR | 100 | – | – | – | – | 148 ± 41 | – | – | – | – | – | Møller et al. [22] |
| Cow manure | NR | 16 | – | – | – | – | 128 | – | – | – | – | – | Preeti Rao and Seenayya [31] |
| Cow manure | NR | 90 | – | – | – | – | 260 c | – | – | – | – | – | Guengoer-Demirici et al. [32] |
a Units of SMY are NL CH4 kg−1 VS. b Calculated from the data provided in the citation. c With basal medium. NR = not reported.
3.2. Volatile Fatty Acids (VFAs) Production
The profiles of acetic, propionic, and butyric acids concentrations on day 0, 7 and 21 are shown in Figure 3. Samples at the beginning of each cycle (day 0) represents the ISM while those at the end of the treatment cycle (day 21) represent the digestate which has been used as inoculum for the next cycle. The average concentrations of iso-butyric, iso-valeric, valeric, and caproic acid were 60 ± 5, 58 ± 7, 28 ± 5, and 22 ± 6 mg·L−1, respectively, throughout the successive cycles.
Generally, the profiles of VFAs produced during different cycles were almost identical. Throughout the successive cycles, acetic acid concentration peaked immediately after feeding to levels ranging between 2000 and 3500 mg·L−1 but was consumed within a week in all bioreactors to levels of about 500 mg·L−1 and to within 100 ± 50 mg·L−1 after two weeks, as can be observed from Figure 3, indicating that methanogenesis from acetate was not a rate limiting step. Similarly, propionic acid peaked to around 500 mg·L−1 after feedings at OLR of 6.0 g TCOD kg−1 inoculum d−1 and to around 750–1000 mg·L−1 after feedings at OLR of 7.0 and 8.0 g TCOD kg−1·d−1. However, it was consumed within a week to levels close to the detection limits of the instrument (25 ± 10 mg·L−1).
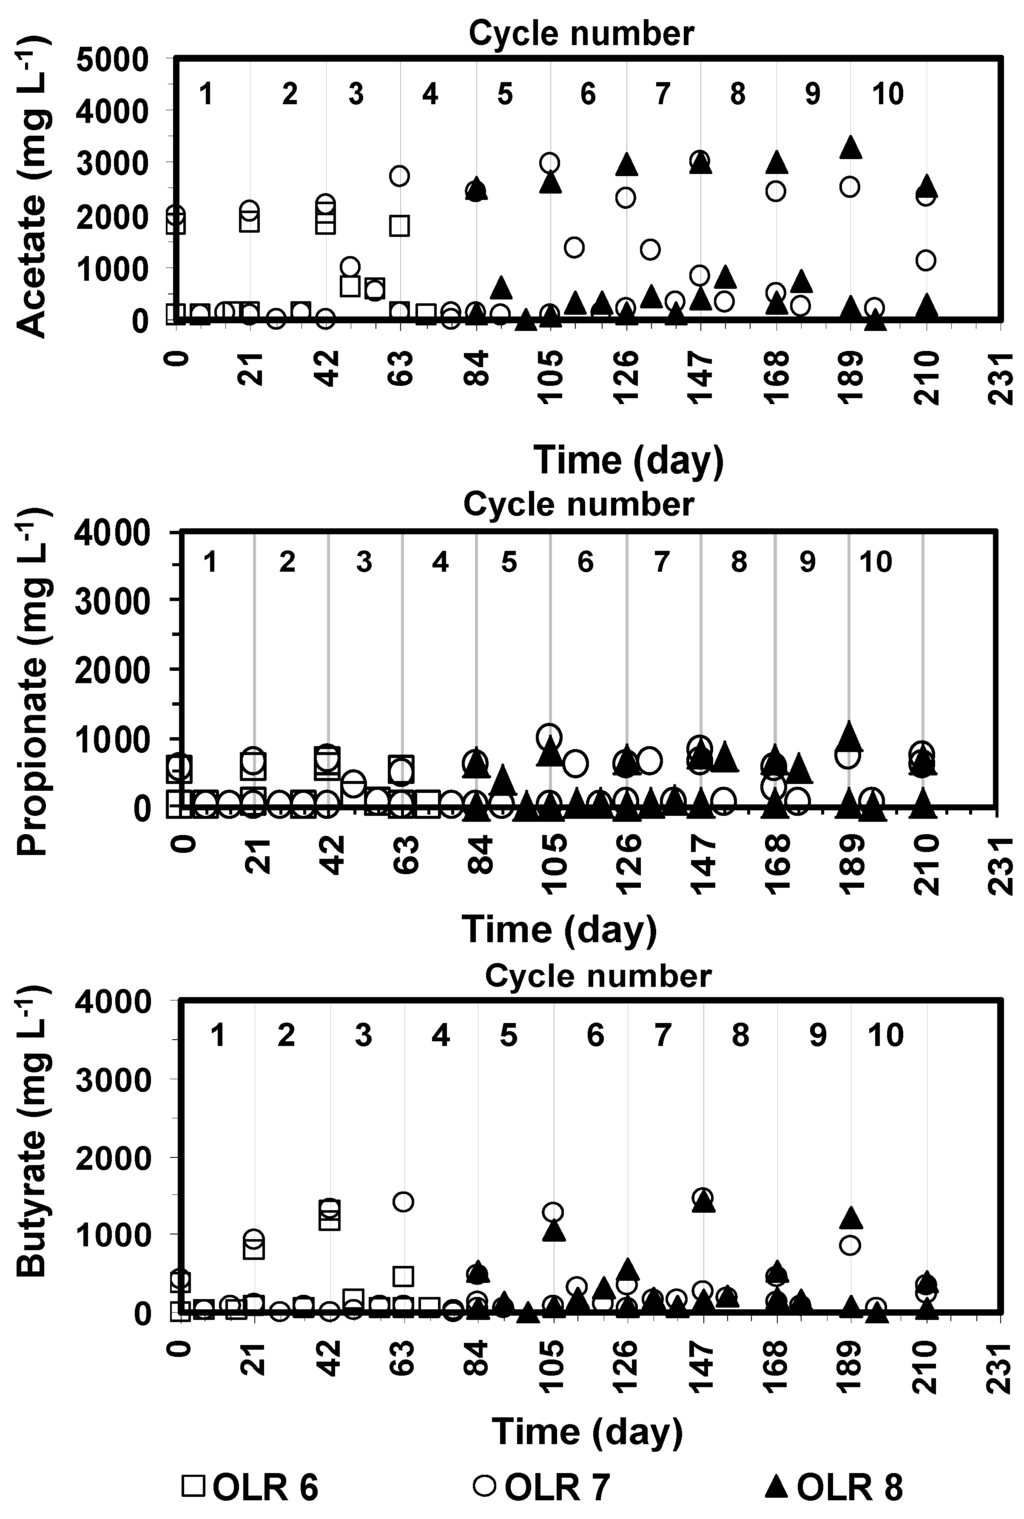
Figure 3.
VFAs profiles during for the psychrophilic anaerobic digestion of dairy cow feces.
Figure 3.
VFAs profiles during for the psychrophilic anaerobic digestion of dairy cow feces.

The profile of propionic acid in the bioreactors was similar to that of acetic acid. In addition, butyric acid peaked to around 500–1500 mg·L−1 after feedings and was consumed within a week to levels within 250 mg·L−1. The concentrations of other volatile fatty acids (isobutyric-, iso-valeric-, valeric-, and caproic-acid) were between 100 and 250 mg·L−1 immediately after feeding and less than 50 mg·L−1 during the remaining time of the cycles.
Inhibitory effects of VFAs depend among other factors on pH, alkalinity, and type of culture [33]. The VFAs toxicity increases with drop in pH. Salces [34] reported that acetate and propionate concentrations of 2851 and 745 mg·L−1 caused 50% inhibition in methane production at pH 7.0 while these concentrations increased to 8976 and 2358 mg·L−1, respectively, at pH 7.5. The pH profile (Figure 4) ranged between 6.8 at the beginning of the cycle (day 0) and 7.5 at the end of the cycle (day 21). The stability of pH was due to the sufficient buffering capacity of cow feces fed (alkalinity of 6900 to 9100 mg CaCO3 kg−1), that of the reactor content (8800 to 12600 mg CaCO3 kg−1) and absence of VFAs accumulation. The concentration of alkalinity in the reactor was generally in the same level or greater than that in the cow feces because methane producing reaction generates alkalinity as a by-product.
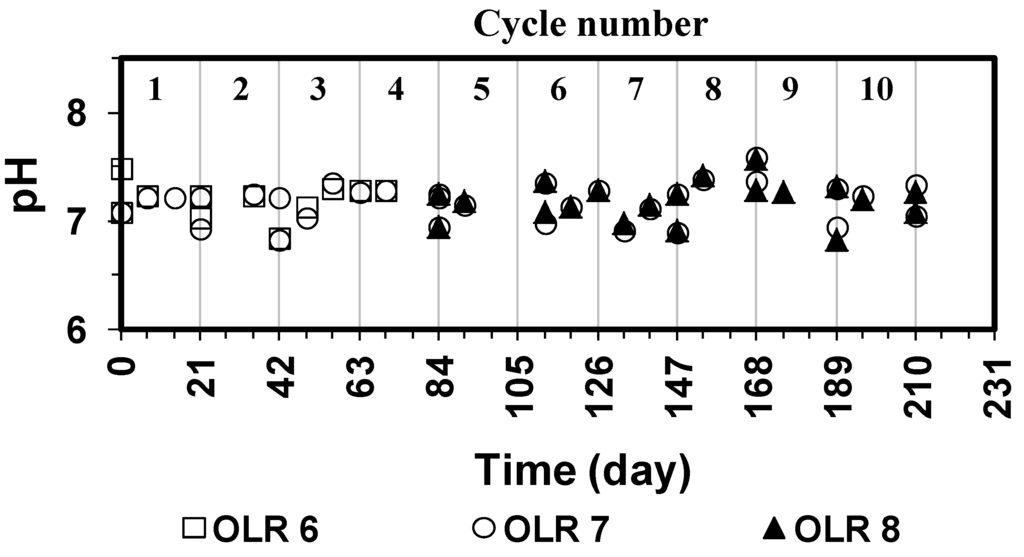
Figure 4.
Profile of pH during for the psychrophilic anaerobic digestion of dairy cow feces.
Figure 4.
Profile of pH during for the psychrophilic anaerobic digestion of dairy cow feces.

Concentrations of VFAs were always below the inhibitory levels (Figure 3). Since no fluctuation has been observed in the rate of biogas production (Figure 2) then there was no cause of inhibition whether due to VFAs accumulation, pH drop, ammonia inhibition or other causes. The profiles of the VFAs concentrations, the stable methane production and yield during the successive cycles indicate that acetogenic and methanogenic reactions proceeded fairly well.
3.3. Solids Reduction
The average total solids reduction during the individual cycles was about 30.0% ± 4.4%, 23.5% ± 6.9%, 17.8% ± 2.7% for the cycles operated at OLR of 6.0, 7.0, and 8.0 g TCOD kg−1 inoculum d−1, respectively. The average volatile solids reduction was about 45.2% ± 0.2%, 37.4% ± 8.5%, 31.2% ± 4.6% for the cycles operated at OLR of 6.0, 7.0, and 8.0 g TCOD kg−1 inoculum d−1, respectively.
4. Conclusions
Psychrophilic (20 °C) anaerobic digestion of cow feces (total solids of 11%–16%) in a sequence batch reactor is feasible at organic loading rate of 6.0 to 8.0 g TCOD kg−1 inoculum d−1 and treatment cycle length of 21 days. The specific methane yield ranged between 124.5 ± 1.4 and 227.9 ± 4.8 NL CH4 kg−1 VS fed; these values are within the range of specific methane yield reported for cow feces from mesophilic and thermophilic wet anaerobic digestion. No lag phase in biogas production or inhibition has been observed. Hydrolysis was the rate limiting step; volatile fatty acids have been consumed immediately and converted into methane. Consistent methane production, volatile fatty acid concentrations, pH and volatile solids removal in the duplicate bioreactors indicate a stable and reproducible process with consistent performance at the range of organic loading rates examined. The results proved that the novel PDAD of cow feces in sequence batch reactor is feasible at the conditions examined.
Acknowledgments
This project has been financially supported through contributions from Agriculture and Agri-Food Canada, the Canadian Dairy Commission and Dairy Farmers of Canada under the Dairy Research Cluster Program.
Author Contributions
Daniel I. Massé conceived the project and obtained the financial support; Noori M. Cata Saady performed the experimental study; Daniel I. Massé and Noori M. Cata Saady wrote the paper.
Conflicts of Interest
The authors declare no conflict of interest.
References
- Laguë, C. Challenges and Opportunities in Livestock Manure Management. Available online: http://agrienvarchive.ca/bioenergy/download/an-lague-A2.pdf (accessed on 7 October 2014).
- Hindrichsen, I.K.; Wettstein, H.R.; Machmuller, A.; Jorg, B.; Kreuzer, M. Effect of the carbohydrate composition of feed concentratates on methane emission from dairy cows and their slurry. Environ. Monitor. Assess. 2005, 107, 329–350. [Google Scholar]
- Intergovernmental Panel on Climate Change (IPCC). Revised IPCC Guidelines for National Greenhouse Gas Inventories; IPCC: Bracknell, UK, 1996. [Google Scholar]
- Abbassi-Guendouz, A.; Brockmann, D.; Trably, E.; Dumas, C.; Delgenès, J.; Steyer, J.; Escudié, R. Total solids content drives high solid anaerobic digestion via mass transfer limitation. Bioresour. Technol. 2012, 111, 55–61. [Google Scholar]
- El-Mashad, H.M.; Zeeman, G.; van Loon, W.K.P.; Bot, G.P.A.; Lettinga, G. Effect of temperature and temperature fluctuation on thermophilic anaerobic digestion of cattle manure. Bioresour. Technol. 2004, 95, 191–201. [Google Scholar]
- Ferrer, I.; Garfí, M.; Uggetti, E.; Ferrer-Martí, L.; Calderon, A.; Velo, E. Biogas production in low-cost household digesters at the peruvian andes. Biomass Bioenergy 2011, 35, 1668–1674. [Google Scholar]
- Martí-Herrero, J.; Chipana, M.; Cuevas, C.; Paco, G.; Serrano, V.; Zymla, B.; Heising, K.; Sologuren, J.; Gamarra, A. Low cost tubular digesters as appropriate technology for widespread application: Results and lessons learned from bolivia. Renew. Energy 2014, 71, 156–165. [Google Scholar]
- Ahn, H.K.; Smith, M.C.; Kondrad, S.L.; White, J.W. Evaluation of biogas production potential by dry anaerobic digestion of switchgrass-animal manure mixtures. Appl. Biochem. Biotechnol. 2010, 160, 965–975. [Google Scholar]
- Kusch, S.; Oechsner, H.; Jungbluth, T. Biogas production with horse dung in solid-phase digestion systems. Bioresour. Technol. 2008, 99, 1280–1292. [Google Scholar]
- Di Maria, F.; Gigliotti, G.; Sordi, A.; Micale, C.; Massaccesi, L. Start up of a pre-industrial scale solid state anaerobic digestion cell for the co-treatment of animal and agricultural residues. In Proceedings of the ECOS 2012–The 25th International Conference on Efficiency, Cost, Optimization, Simulation and Environmental Impact of Energy Systems, Perugia, Italy, 26–29 June 2012.
- Luning, L.; van Zundert, E.H.M.; Brinkmann, A.J.F. Comparison of dry and wet digestion for solid waste. Water Sci. Technol. 2003, 48, 15–20. [Google Scholar]
- Hall, S.J.; Hawkes, D.L.; Hawkes, F.R.; Thomas, A. Mesophilic anaerobic digestion of high solids cattle waste in a packed bed digester. J. Agric. Eng. Res. 1985, 32, 153–162. [Google Scholar]
- Jha, A.K.; Li, J.; Zhang, L.; Ban, Q.; Jin, Y. Comparison between wet and dry anaerobic digestions of cow dung under mesophilic and thermophilic conditions. Adv. Water Resour. Prot. (AWRP) 2013, 1, 28–38. [Google Scholar]
- Jha, A.K.; Li, J.; Ban, Q.; Zhang, L.; Zhao, B. Dry anaerobic digestion of cow dung for methane production: Effect of mixing. Pak. J. Biol. Sci. 2012, 15, 1111–1118. [Google Scholar]
- Brown, D.; Shi, J.; Li, Y. Comparison of solid-state to liquid anaerobic digestion of lignocellulosic feedstocks for biogas production. Bioresour. Technol. 2012, 124, 379–386. [Google Scholar]
- Massé, D.I.; Saady, N.M.C. Psychrophilic dry anaerobic digestion of dairy cow feces: Long-term operation. Waste Manag. 2015, 36, 86–92. [Google Scholar]
- Massé, D.I.; Rajagopal, R.; Singh, G. Technical and operational feasibility of psychrophilic anaerobic digestion biotechnology for processing ammonia-rich waste. Appl. Energy 2014, 120, 49–55. [Google Scholar]
- Massé, D.I.; Masse, L.; Croteau, F. The effect of temperature fluctuations on psychrophilic anaerobic sequencing batch reactors treating swine manure. Bioresour. Technol. 2003, 89, 57–62. [Google Scholar]
- American Public Health Association (APHA). Standard Methods for the Examination of Water and Wastewater, 18th ed.; APHA: Washington, DC, USA, 1992. [Google Scholar]
- Bauer, A.; Bösch, P.; Friedl, A.; Amon, T. Analysis of methane potentials of steam-exploded wheat straw and estimation of energy yields of combined ethanol and methane production. J. Biotechnol. 2009, 142, 50–55. [Google Scholar]
- Karthikeyan, O.; Visvanathan, C. Bio-energy recovery from high-solid organic substrates by dry anaerobic bio-conversion processes: A review. Rev. Environ. Sci. Biotechnol. 2013, 12, 257–284. [Google Scholar]
- Møller, H.B.; Sommer, S.G.; Ahring, B.K. Methane productivity of manure, straw and solid fractions of manure. Biomass Bioenergy 2004, 26, 485–495. [Google Scholar]
- Somayaji, D.; Khanna, S. Biomethanation of rice and wheat straw. World J. Microbiol. Biotechnol. 1994, 10, 521–523. [Google Scholar]
- Shyam, M. Agro-residue-based renewable energy technologies for rural development. Energy Sustain. Dev. 2002, 6, 37–42. [Google Scholar]
- Schäfer, W.; Lehto, M.; Teye, F. Dry Anaerobic Digestion of Organic Residues on-Farm—A Feasibility Study. 2006. Available online: http://orgprints.org/6590/1/MET77.pdf (accessed on 10 October 2014).
- Varel, V.H.; Hashimoto, A.G.; Chen, Y.R. Effect of temperature and retention time on methane production from beef cattle waste. Appl. Environ. Microbiol. 1980, 40, 217–222. [Google Scholar]
- Zhu, J.; Li, W.; Shen, R. Theoretical models of reaction mechanisms in solid anaerobic digestion: A review. Adv. Mater. Res. 2012, 347, 1247–1250. [Google Scholar]
- Borhan, M.S.; Rahman, S.; Ahn, H.K. Dry anaerobic digestion of fresh feedyard manure: A case study in a laboratory setting. Int. J. Emerg. Sci. 2012, 2, 509–525. [Google Scholar]
- Ahring, B.K.; Ibrahim, A.A.; Mladenovska, Z. Effect of temperature increase from 55 to 65 °C on performance and microbial population dynamics of an anaerobic reactor treating cattle manure. Water Res. 2001, 35, 2446–2452. [Google Scholar]
- Labatut, R.A.; Angenent, L.T.; Scott, N.R. Biochemical methane potential and biodegradability of complex organic substrates. Bioresour. Technol. 2011, 102, 2255–2264. [Google Scholar]
- Preeti Rao, P.; Seenayya, G. Improvement of methanogenesis from cow dung and poultry litter waste digesters by addition of iron. World J. Microbiol. Biotechnol. 1994, 10, 211–214. [Google Scholar]
- Güngör-Demirci, G.; Demirer, G.N. Effect of initial cod concentration, nutrient addition, temperature and microbial acclimation on anaerobic treatability of broiler and cattle manure. Bioresour. Technol. 2004, 93, 109–117. [Google Scholar]
- Angelidaki, I.; Ellegaard, L.; Ahring, B.K. A mathematical model for dynamic simulation of anaerobic digestion of complex substrates: Focusing on ammonia inhibition. Biotechnol. Bioeng. 1993, 42, 159–166. [Google Scholar]
- Salces, B.M. Anaerobic Digestion of Livestock Wastes: Vegetable Residues as Co-Substrate and Digestate Post-Treatment. Ph.D. Thesis. Available online: https://uvadoc.uva.es/bitstream/10324/845/1/TESIS114–110719.pdf (accessed on 9 October 2014).
© 2015 by the authors; licensee MDPI, Basel, Switzerland. This article is an open access article distributed under the terms and conditions of the Creative Commons Attribution license (http://creativecommons.org/licenses/by/4.0/).