
Study of Power Flow Algorithm of AC/DC Distribution System including VSC-MTDC


Abstract
:1. Introduction
2. Theoretical Considerations
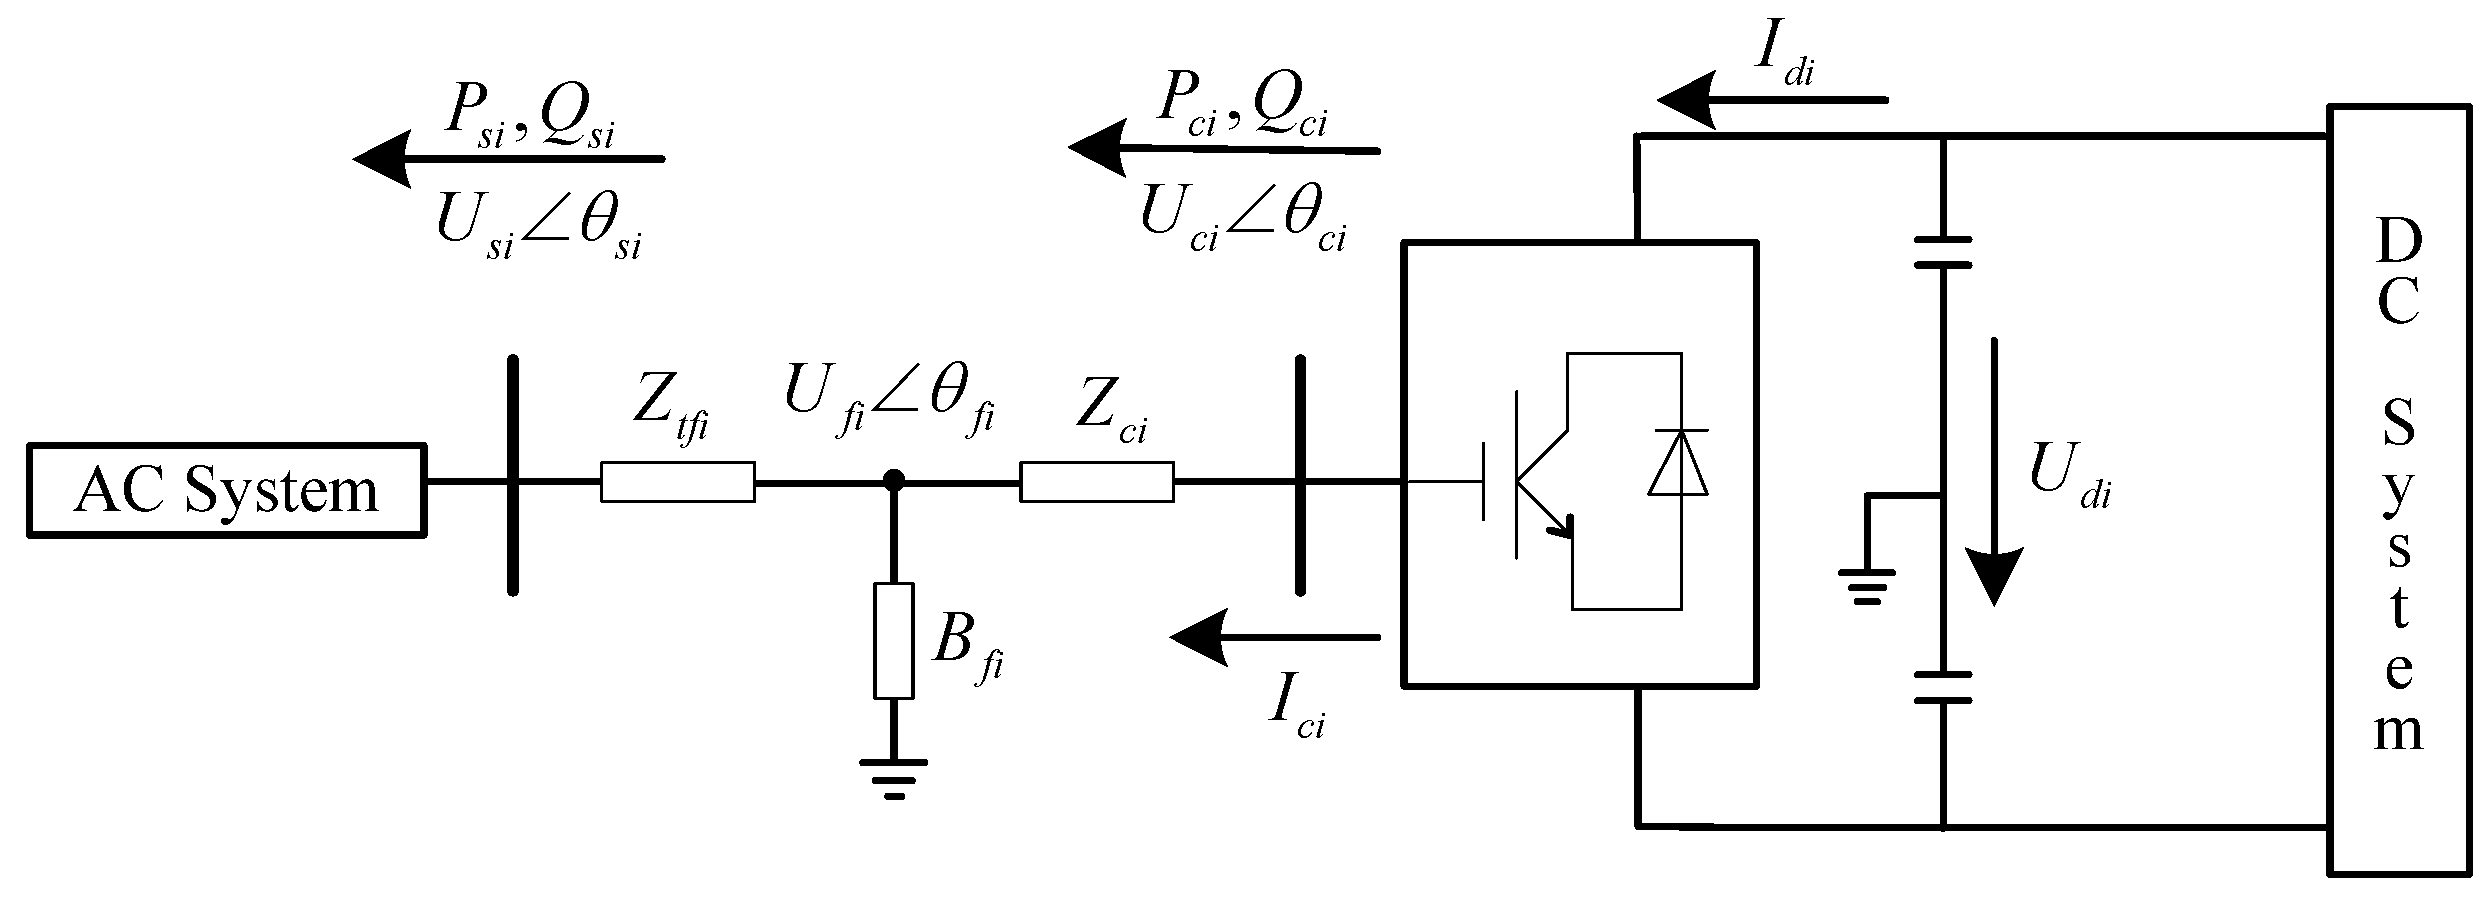
2.1. VSC-HVDC Steady-State Model

2.2. VSC-HVDC Control Modes and Parameter Constrains
- Mode 1: Constant active and reactive power control;
- Mode 2: Constant active and AC voltage amplitude control;
- Mode 3: Constant DC voltage and reactive power control;
- Mode 4: Constant DC voltage and AC voltage amplitude control.
2.3. Power Flow Calculation of AC/DC Distribution System with VSC-MTDC
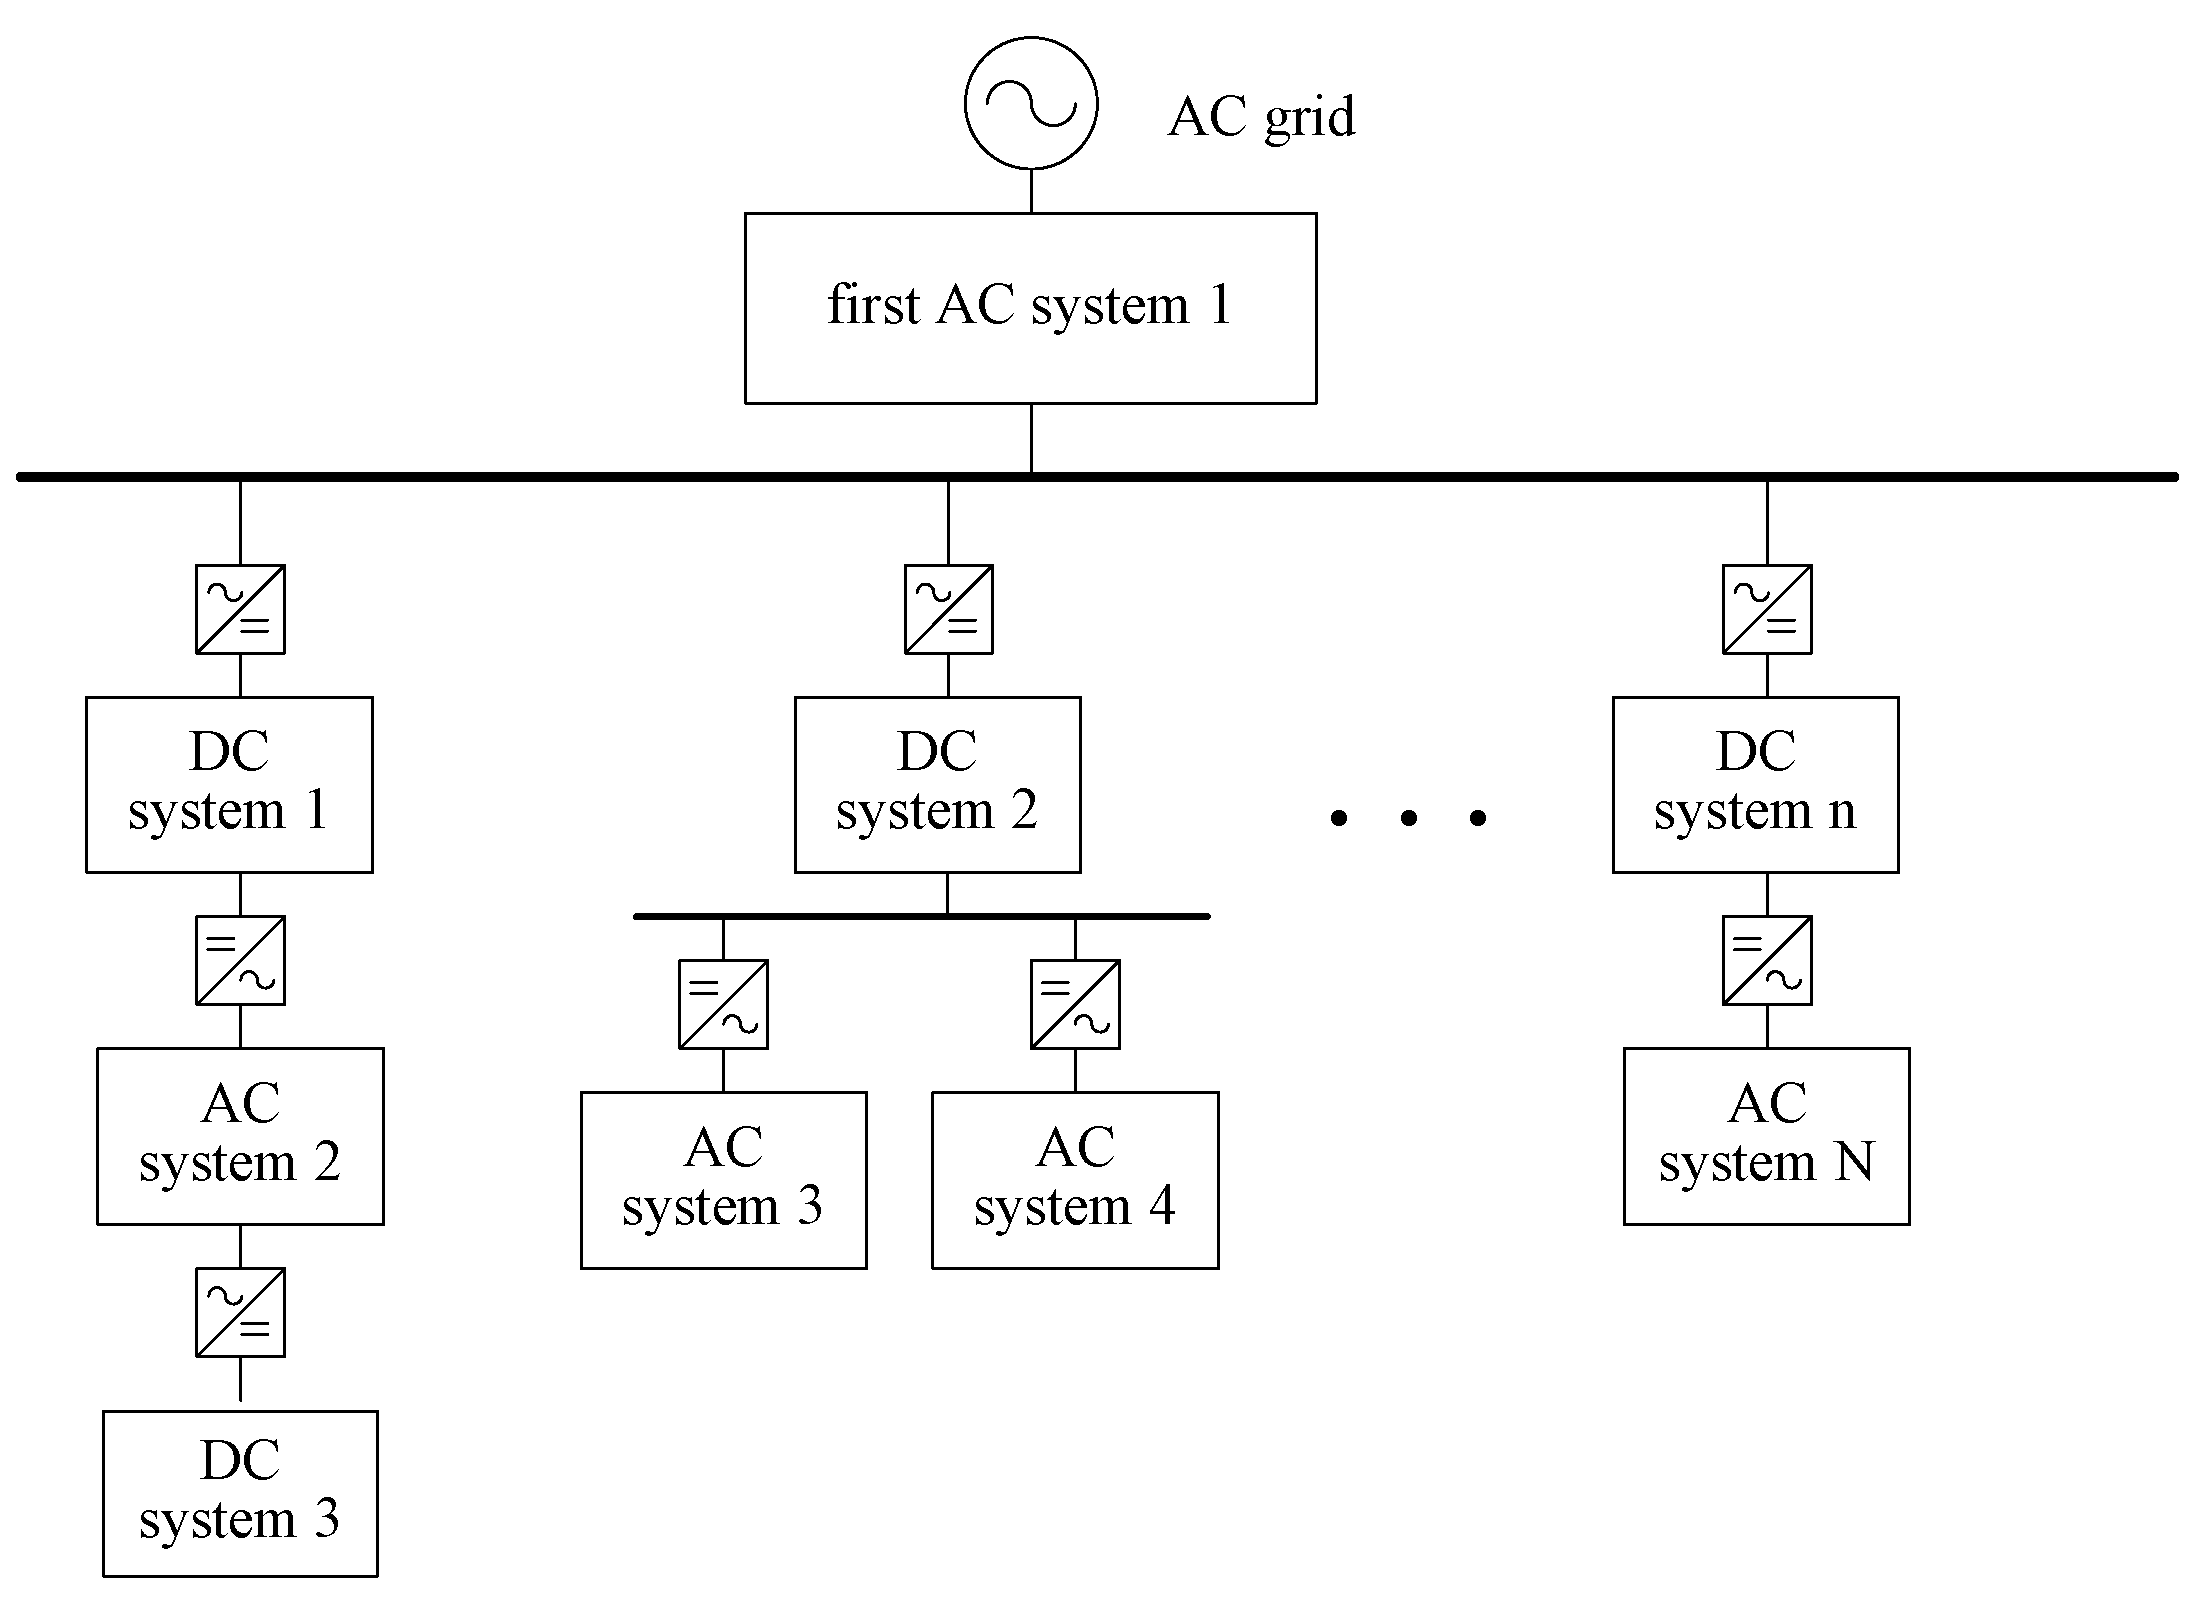
2.3.1. Structure of AC/DC Distribution System with VSC-MTDC

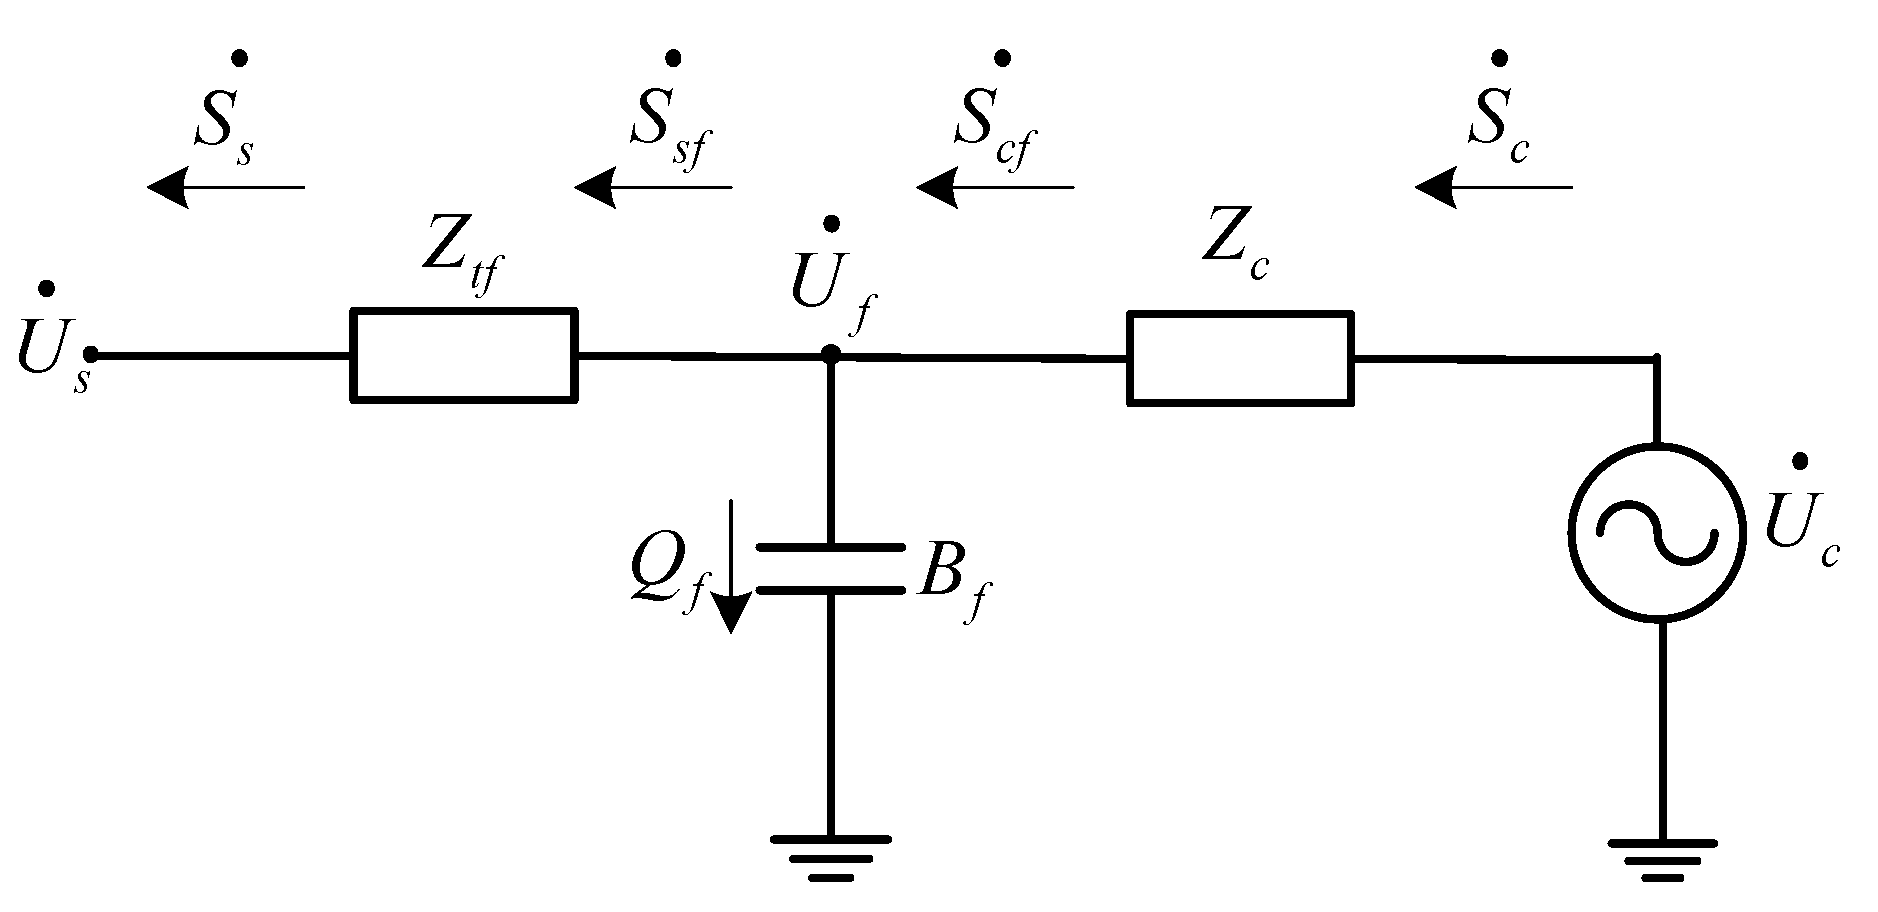
2.3.2. The Interface Equation of AC/DC Power Flow Alternate Calculation
2.3.2.1. Operation with Constant Active or Reactive Power

2.3.2.2. Operation with Constant Active Power and AC Voltage Amplitude
2.3.2.3. Operation with Constant AC Voltage
2.3.2.4. Operation with Constant DC Voltage and Reactive Power
2.3.2.5. Operation with Constant DC and AC Voltage
2.3.3. Alternation Algorithm of AC/DC Distribution System Incorporating VSC-MTDC
- Step 1:
- Input the data of AC/DC network power flow calculation and characteristic, set k = 1, then forward sweep from end of the network.
- Step 2:
- Determine the characteristic of networks. If it is a branch AC and passive network, apply back/forward iterative algorithm to power flow calculation until convergence, and apply Newton method if it is a branch AC and active network. When and of VSC are acquired, go to step 4, otherwise continue with step 3.
- Step 3:
- Determine the characteristic of networks. If it is a DC network, calculate of the inverters operated with non-constant DC voltage pattern at first, then solve DC network to obtain the DC voltage and active power of other inverters. Turn to step 4 after obtaining , and , otherwise move to step 5.
- Step 4:
- Continue to determine the characteristic of a next network. If it is a branch AC network, return to step 2. If it is a DC network, return to step 3. If it is the first AC network, go to step 5.
- Step 5:
- Determine the characteristic of networks. If it is the first AC network, apply Newton method to obtain . Until this step, an iteration of this algorithm for the AC/DC distribution system has been finished. If the result is convergent, the calculation is complete, otherwise , and return to step 2 with the DC system data acquired by the steps above.
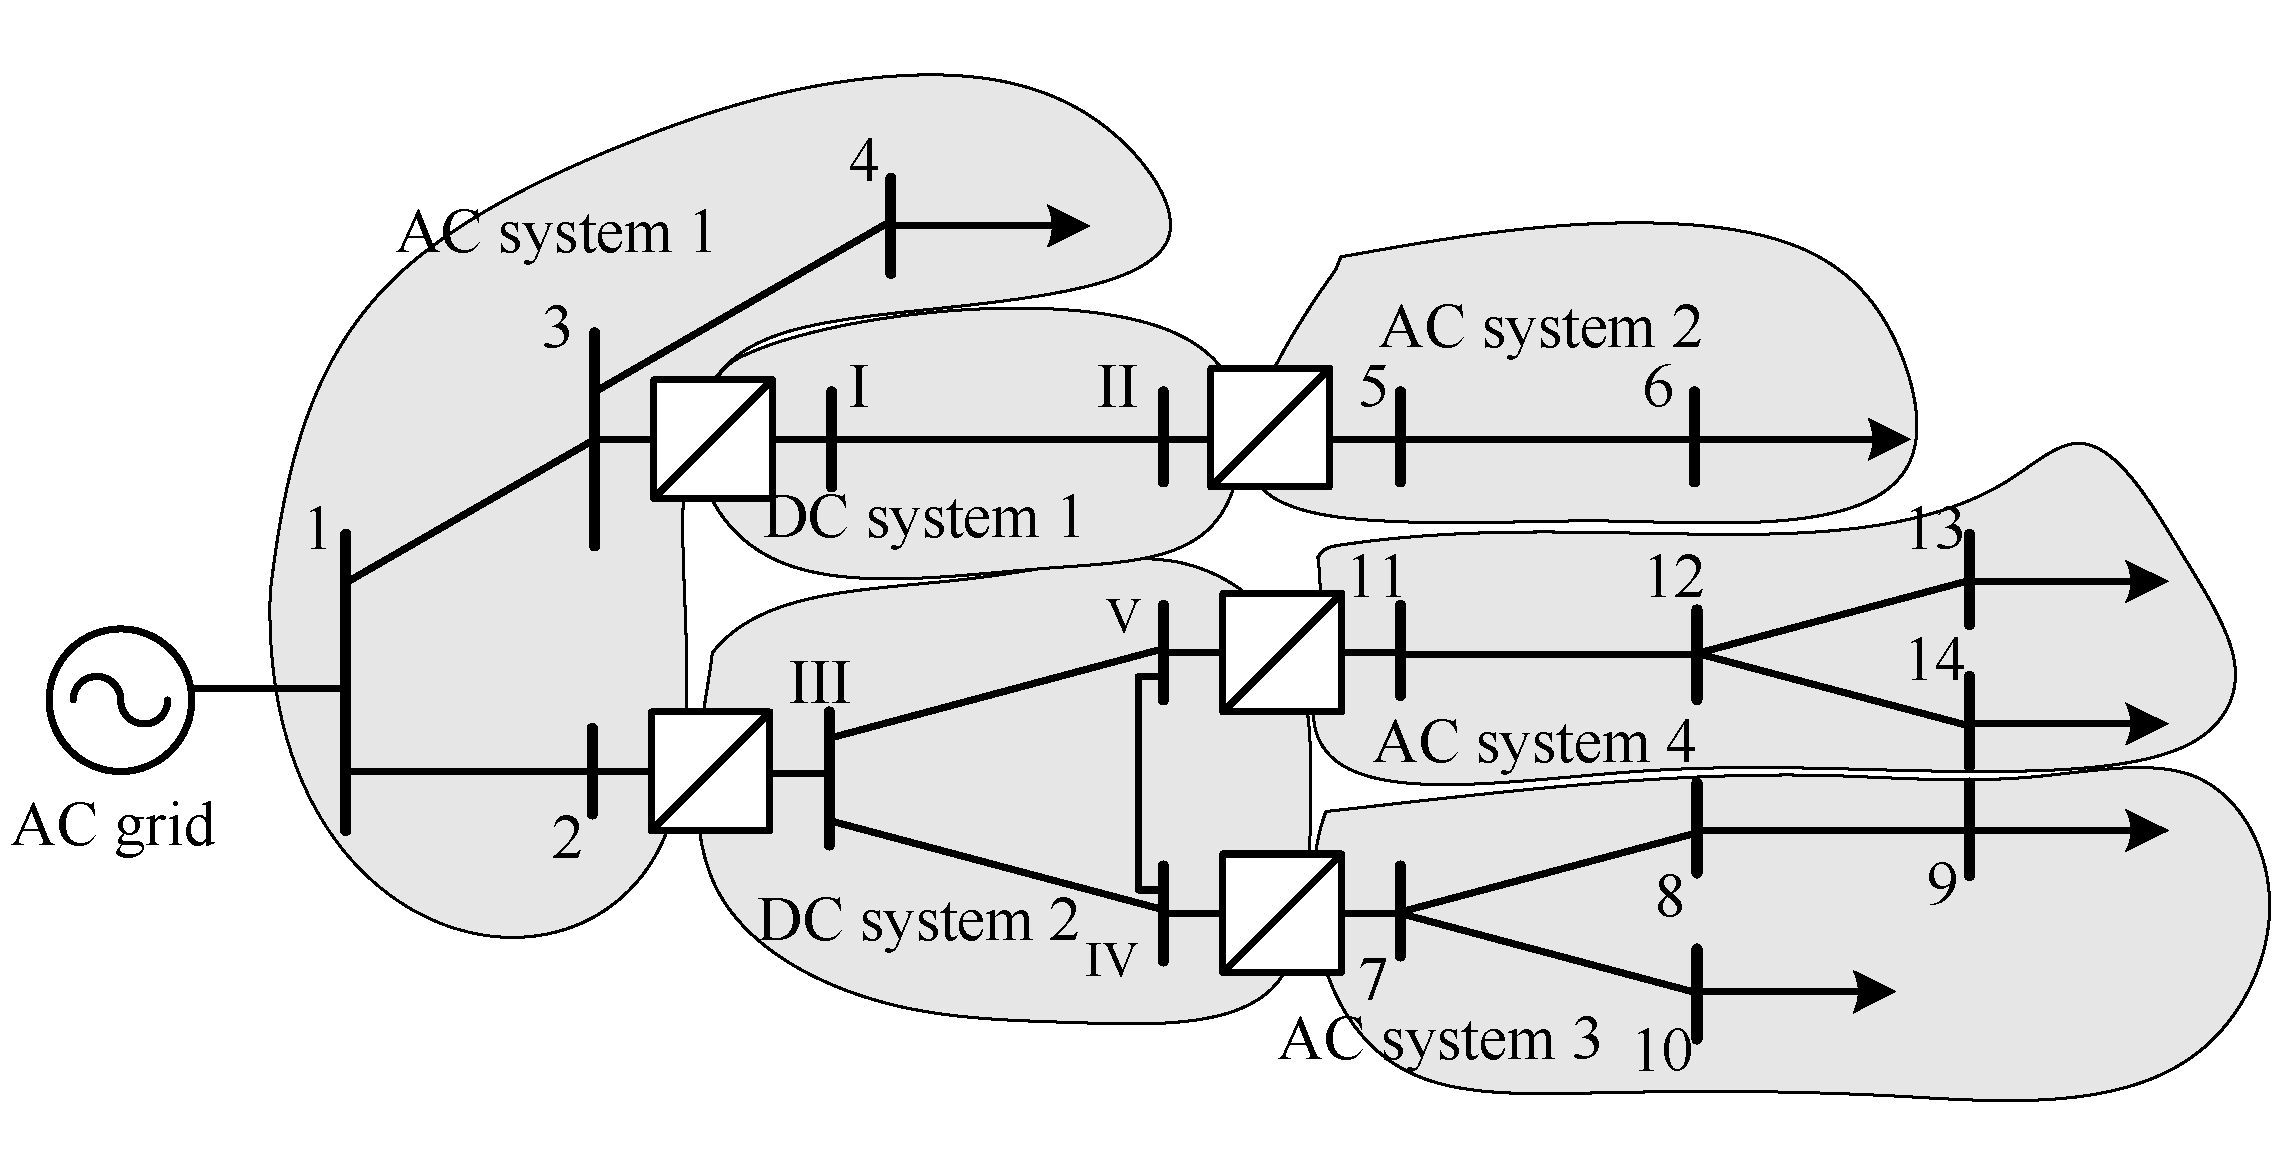
3. Modeled Case


| Scheme | Photovoltaic Power Generation | Wind Power Generation | Fuel Cells | Gas Turbine Power Generation | |
|---|---|---|---|---|---|
| Scheme 1 | Bus | AC 3 | AC 5 | AC 8 | AC 12 |
| Flow | 0.04 | 0.02 | 0.03 | 0.02 | |
| Scheme 2 | Bus | AC 3 | AC 8 | DC II | DC IV |
| Flow | 0.04 | 0.02 | 0.03 | 0.02 | |
| Scheme 3 | Bus | DC I | DC II | DC IV | DC V |
| Flow | 0.04 | 0.02 | 0.03 | 0.02 | |
| VSC | I | II | III | IV | V |
|---|---|---|---|---|---|
| Control pattern | 3 | 5 | 3 | 5 | 5 |
| 2.004 | 2.000 | 2.006 | 2.000 | 2.000 | |
| 0.000 | 0.000 | 0.000 | 0.000 | 0.000 | |
| −0.022 | 0.000 | −0.022 | 0.000 | 0.000 |
| Bus | Scheme 1 | Scheme 2 | Scheme 3 | |||
|---|---|---|---|---|---|---|
| Voltage Amplitude | Voltage Phase | Voltage Amplitude | Voltage Phase | Voltage Amplitude | Voltage Phase | |
| 1 | 1.0600 | 0.0000 | 1.0600 | 0.0000 | 1.0600 | 0.0000 |
| 2 | 1.0386 | −1.1888 | 1.0393 | −1.1383 | 1.0385 | −1.1948 |
| 3 | 1.0567 | 0.2496 | 1.0556 | 0.1930 | 1.0567 | 0.2493 |
| 4 | 1.0550 | 0.2203 | 1.0540 | 0.1636 | 1.0550 | 0.2200 |
| 5 | 1.0400 | 0.0000 | 1.0400 | 0.0000 | 1.0400 | 0.0000 |
| 6 | 1.0392 | −0.0424 | 1.0392 | −0.0424 | 1.0392 | −0.0424 |
| 7 | 1.0200 | 0.0000 | 1.0200 | 0.0000 | 1.0200 | 0.0000 |
| 8 | 1.0160 | 0.0497 | 1.0169 | 0.1491 | 1.0133 | −0.2495 |
| 9 | 1.0149 | 0.0430 | 1.0158 | 0.1424 | 1.0123 | −0.2562 |
| 10 | 1.0160 | −0.1161 | 1.0160 | −0.1161 | 1.0160 | −0.1161 |
| 11 | 1.0400 | 0.0000 | 1.0400 | 0.0000 | 1.0400 | 0.0000 |
| 12 | 1.0228 | −0.5417 | 1.0212 | −0.6613 | 1.0212 | −0.6613 |
| 13 | 1.0158 | −0.6934 | 1.0142 | −0.8134 | 1.0142 | −0.8134 |
| 14 | 1.0170 | −0.8612 | 1.0154 | −0.9818 | 1.0155 | −0.9818 |
| VSC | I | II | III | IV | V | |
|---|---|---|---|---|---|---|
| Scheme 1 | 2.0040 | 2.0041 | 2.0060 | 2.0044 | 2.0040 | |
| 0.0039 | −0.0039 | −0.1181 | 0.0281 | 0.0900 | ||
| 0.0932 | −0.1324 | −3.5780 | 0.8273 | 2.5423 | ||
| 0.8500 | 0.8433 | 0.8358 | 0.8363 | 0.8604 | ||
| 0.0064 | −0.0090 | −0.2417 | 0.0551 | 0.1772 | ||
| −0.0220 | 0.0100 | −0.0220 | 0.0512 | 0.0840 | ||
| Scheme 2 | 2.0040 | 2.0040 | 2.0060 | 2.0046 | 2.0040 | |
| −0.0011 | 0.0011 | −0.1135 | 0.0131 | 0.1003 | ||
| −0.0561 | 0.4543 | −3.4322 | 0.6765 | 2.8354 | ||
| 0.8492 | 0.8434 | 0.8363 | 0.8361 | 0.8608 | ||
| −0.0037 | 0.0310 | −0.2321 | 0.0451 | 0.1977 | ||
| −0.0220 | 0.0100 | −0.0220 | 0.0512 | 0.0846 | ||
| Scheme 3 | 2.0040 | 2.0041 | 2.0060 | 2.0044 | 2.0040 | |
| 0.0039 | −0.0039 | −0.1187 | 0.0283 | 0.0904 | ||
| 0.3787 | 0.4543 | −3.5953 | 1.2810 | 2.8354 | ||
| 0.8501 | 0.8434 | 0.8358 | 0.8365 | 0.8607 | ||
| 0.0263 | 0.0310 | −0.2428 | 0.0852 | 0.1977 | ||
| −0.0220 | 0.0100 | −0.0220 | 0.0514 | 0.0846 | ||
| Scheme | Scheme 1 | Scheme 2 | Scheme 3 |
|---|---|---|---|
| Sin | 0.2499 + j0.0751 | 0.2502 + j0.0747 | 0.2512 + j0.0752 |
| Sacloss | 0.0070 + j0.0093 | 0.0071 + j0.0095 | 0.0076 + j0.0102 |
| Pconvloss | 0.0115 | 0.0116 | 0.0121 |
| Stranloss | 0.0001 + j0.0108 | 0.0001 + j0.0111 | 0.0002 + j0.0123 |
| Sreacloss | 0.0000 + j0.0160 | 0.0000 + j0.0164 | 0.0000 + j0.0181 |
| Pdclloss | 0.0002 | 0.0002 | 0.0002 |
| Sdcloss | 0.0118 + j0.0268 | 0.0119 + j0.0275 | 0.0125 + j0.0304 |
| Scheme | Scheme 1 | Scheme 2 | Scheme 3 |
|---|---|---|---|
| Sin | 0.2546 + j0.0860 | 0.2541 + j0.0829 | 0.2535 + j0.0778 |
| Sacloss | 0.0082 + j0.0112 | 0.0080 + j0.0107 | 0.0079 + j0.0105 |
| Sdcloss | 0.0153 + j0.0358 | 0.0149 + j0.0345 | 0.0145 + j0.0327 |

4. Conclusions
Acknowledgments
Author Contributions
Conflicts of Interest
References
- Wang, D.; Mao, C.; Lu, J. Technical analysis and design concept of DC distribution system. Autom. Electr. Power Syst. 2013, 37, 82–88. (In Chinese) [Google Scholar]
- Hammerstrom, D.J. AC versus DC distribution systems—did we get it right. In Proceedings of the IEEE Power & Engineering Society General Meeting, Tampa, FL, USA, 24–28 June 2007; pp. 1–5.
- Patterson, B.T. DC, come home: DC microgrids and the birth of the “Enernet”. IEEE Power Energ. Mag. 2012, 10, 60–69. [Google Scholar] [CrossRef]
- Nilsson, D.; Sannino, A. Efficiency analysis of low-and-medium-voltage DC distribution systems. In Proceedings of the IEEE Power & Engineering Society General Meeting, Denver, CO, USA, 10 June 2004; pp. 1–7.
- Mariethoz, S.; Fuchs, A.; Morari, M. A VSC-HVDC Decentralized Model Predictive Control Scheme for Fast Power Tracking. IEEE Trans. Power Delivery 2014, 29, 462–470. [Google Scholar] [CrossRef]
- Tang, G. MTDC Technology Based on Voltage Source Converter; China Electric Power Press: Beijing, China, 2009; pp. 34–50. (In Chinese) [Google Scholar]
- Weimers, L. MTDC Light: A new technology for a better environment. IEEE Power Eng. Rev. 1998, 18, 19–20. [Google Scholar] [CrossRef]
- Hertem, V.; Ghandhari, M. Multi-terminal VSC HVDC for the European super grid: Obstacles. Renew. Sustainable Energy Rev. 2010, 14, 3156–3163. [Google Scholar] [CrossRef]
- Wang, C.; Wang, S. Study on problems of distributed generation energy supply systems. Autom. Electr. Power Syst. 2008, 32, 1–4. (In Chinese) [Google Scholar]
- Dastgeer, F.; Kalam, A. Efficiency comparison of DC and AC distribution systems for distributed generation. In Proceedings of the Australasian University Power Engineering Conference, Adelaide, SA, Australia, 27–30 September 2009; pp. 1–5.
- Zhu, K.; Jiang, D.; Hu, P. Study on a new type of DC distribution network containing electric vehicle charge station. Power Syst. Technol. 2012, 36, 35–41. (In Chinese) [Google Scholar]
- Ma, J.; Jiang, Q.; Yu, P. Survey on energy optimized control technology in DC distribution network. Autom. Electr. Power Syst. 2013, 37, 89–96. (In Chinese) [Google Scholar]
- Song, Q.; Zhao, B.; Liu, W. An overview of research on smart DC distribution power network. Proc. CSEE 2013, 33, 9–19. (In Chinese) [Google Scholar]
- Mousavizadeh, S.; Haghifam, M.R. Load flow calculations in AC/DC distribution network including weakly mesh, distributed generation and energy storage units. In Proceedings of the Electricity Distribution 22nd International Conference on Electricity Distribution, Stockholm, Sweden, 10–13 June 2013; pp. 1–4.
- El-Marsafawy, M.; Mathur, R. A new, fast technique for load-flow solution of integrated multi-terminal DC/AC system. IEEE Trans. Power Appar. Syst. 1980, 99, 246–255. [Google Scholar] [CrossRef]
- Beerten, J.; Coles, B.R. Implementation aspects of a sequential AC/DC power flow computation algorithm for multi-terminal VSC HVDC systems. In Proceedings of the IET 9th International Conference on AC and DC Power Transmission, London, UK, 19–21 October 2010; pp. 1–6.
- Zheng, C.; Zhou, X.; Li, R. Study on the steady characteristic and algorithm of power flow for VSC-HVDC. Proc. CSEE. 2005, 25, 1–5. (In Chinese) [Google Scholar]
- Zhen, C.; Sheng, C. Uniform iterative power flow algorithm for systems equipped with VSC-HVDCs. Electr. Power 2007, 40, 65–69. (In Chinese) [Google Scholar]
- Li, G.; Zhou, M.; He, J. Power flow calculation of power systems incorporating VSC-HVDC. In Proceedings of the International Conference Power System Technology, Singapore, 21–24 November 2004; pp. 1562–1566.
- Chen, Q.; Tang, G.; Wang, X. AC-DC power flow algorithm for multi-terminal VSC-HVDC systems. Autom. Electr. Power Syst. 2005, 25, 1–6. (In Chinese) [Google Scholar]
- Sun, G.; Li, Y.; Wei, Z. State estimation of power system with VSC-HVDC. Electr. Power Autom. Equip. 2010, 30, 6–12. (In Chinese) [Google Scholar]
- Chai, R.; Zhang, B.; Bo, Z. Alternating Iterative Power Flower Algorithm for Hybrid AC/DC Networks Containing DC Grid Based on Voltage Source Converter. Autom. Electr. Power Syst. 2015, 39, 7–13. (In Chinese) [Google Scholar]
- Beerten, J.; Cole, S.; Belmans, R. Generalized steady-state VSC MTDC model for sequential AC/DC power flow algorithms. IEEE Trans. Power Syst. 2012, 27, 821–829. [Google Scholar] [CrossRef] [Green Version]
- Zhang, X. Multiterminal Voltage-Sourced Converter-Based HVDC Models for Power Flow Analysis. IEEE Trans. Power Syst. 2004, 19, 1877–1884. [Google Scholar] [CrossRef]
- Han, B.M.; Karady, G.G.; Park, J.K. Interaction analysis model for transmission static compensator with EMTP. IEEE Trans. Power Delivery 1998, 13, 1297–1302. [Google Scholar] [CrossRef]
© 2015 by the authors; licensee MDPI, Basel, Switzerland. This article is an open access article distributed under the terms and conditions of the Creative Commons Attribution license (http://creativecommons.org/licenses/by/4.0/).
Share and Cite
Liang, H.; Zhao, X.; Yu, X.; Gao, Y.; Yang, J. Study of Power Flow Algorithm of AC/DC Distribution System including VSC-MTDC. Energies 2015, 8, 8391-8405. https://doi.org/10.3390/en8088391
Liang H, Zhao X, Yu X, Gao Y, Yang J. Study of Power Flow Algorithm of AC/DC Distribution System including VSC-MTDC. Energies. 2015; 8(8):8391-8405. https://doi.org/10.3390/en8088391
Chicago/Turabian StyleLiang, Haifeng, Xiaoling Zhao, Xiaolei Yu, Yajing Gao, and Jin Yang. 2015. "Study of Power Flow Algorithm of AC/DC Distribution System including VSC-MTDC" Energies 8, no. 8: 8391-8405. https://doi.org/10.3390/en8088391
APA StyleLiang, H., Zhao, X., Yu, X., Gao, Y., & Yang, J. (2015). Study of Power Flow Algorithm of AC/DC Distribution System including VSC-MTDC. Energies, 8(8), 8391-8405. https://doi.org/10.3390/en8088391