
Effects of Buffer Gas Composition on Autoignition of Dimethyl Ether

Abstract
:
1. Introduction
2. Experimental
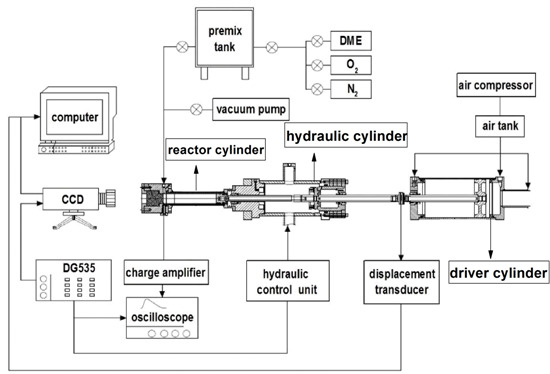
2.1. Rapid Compression Machine
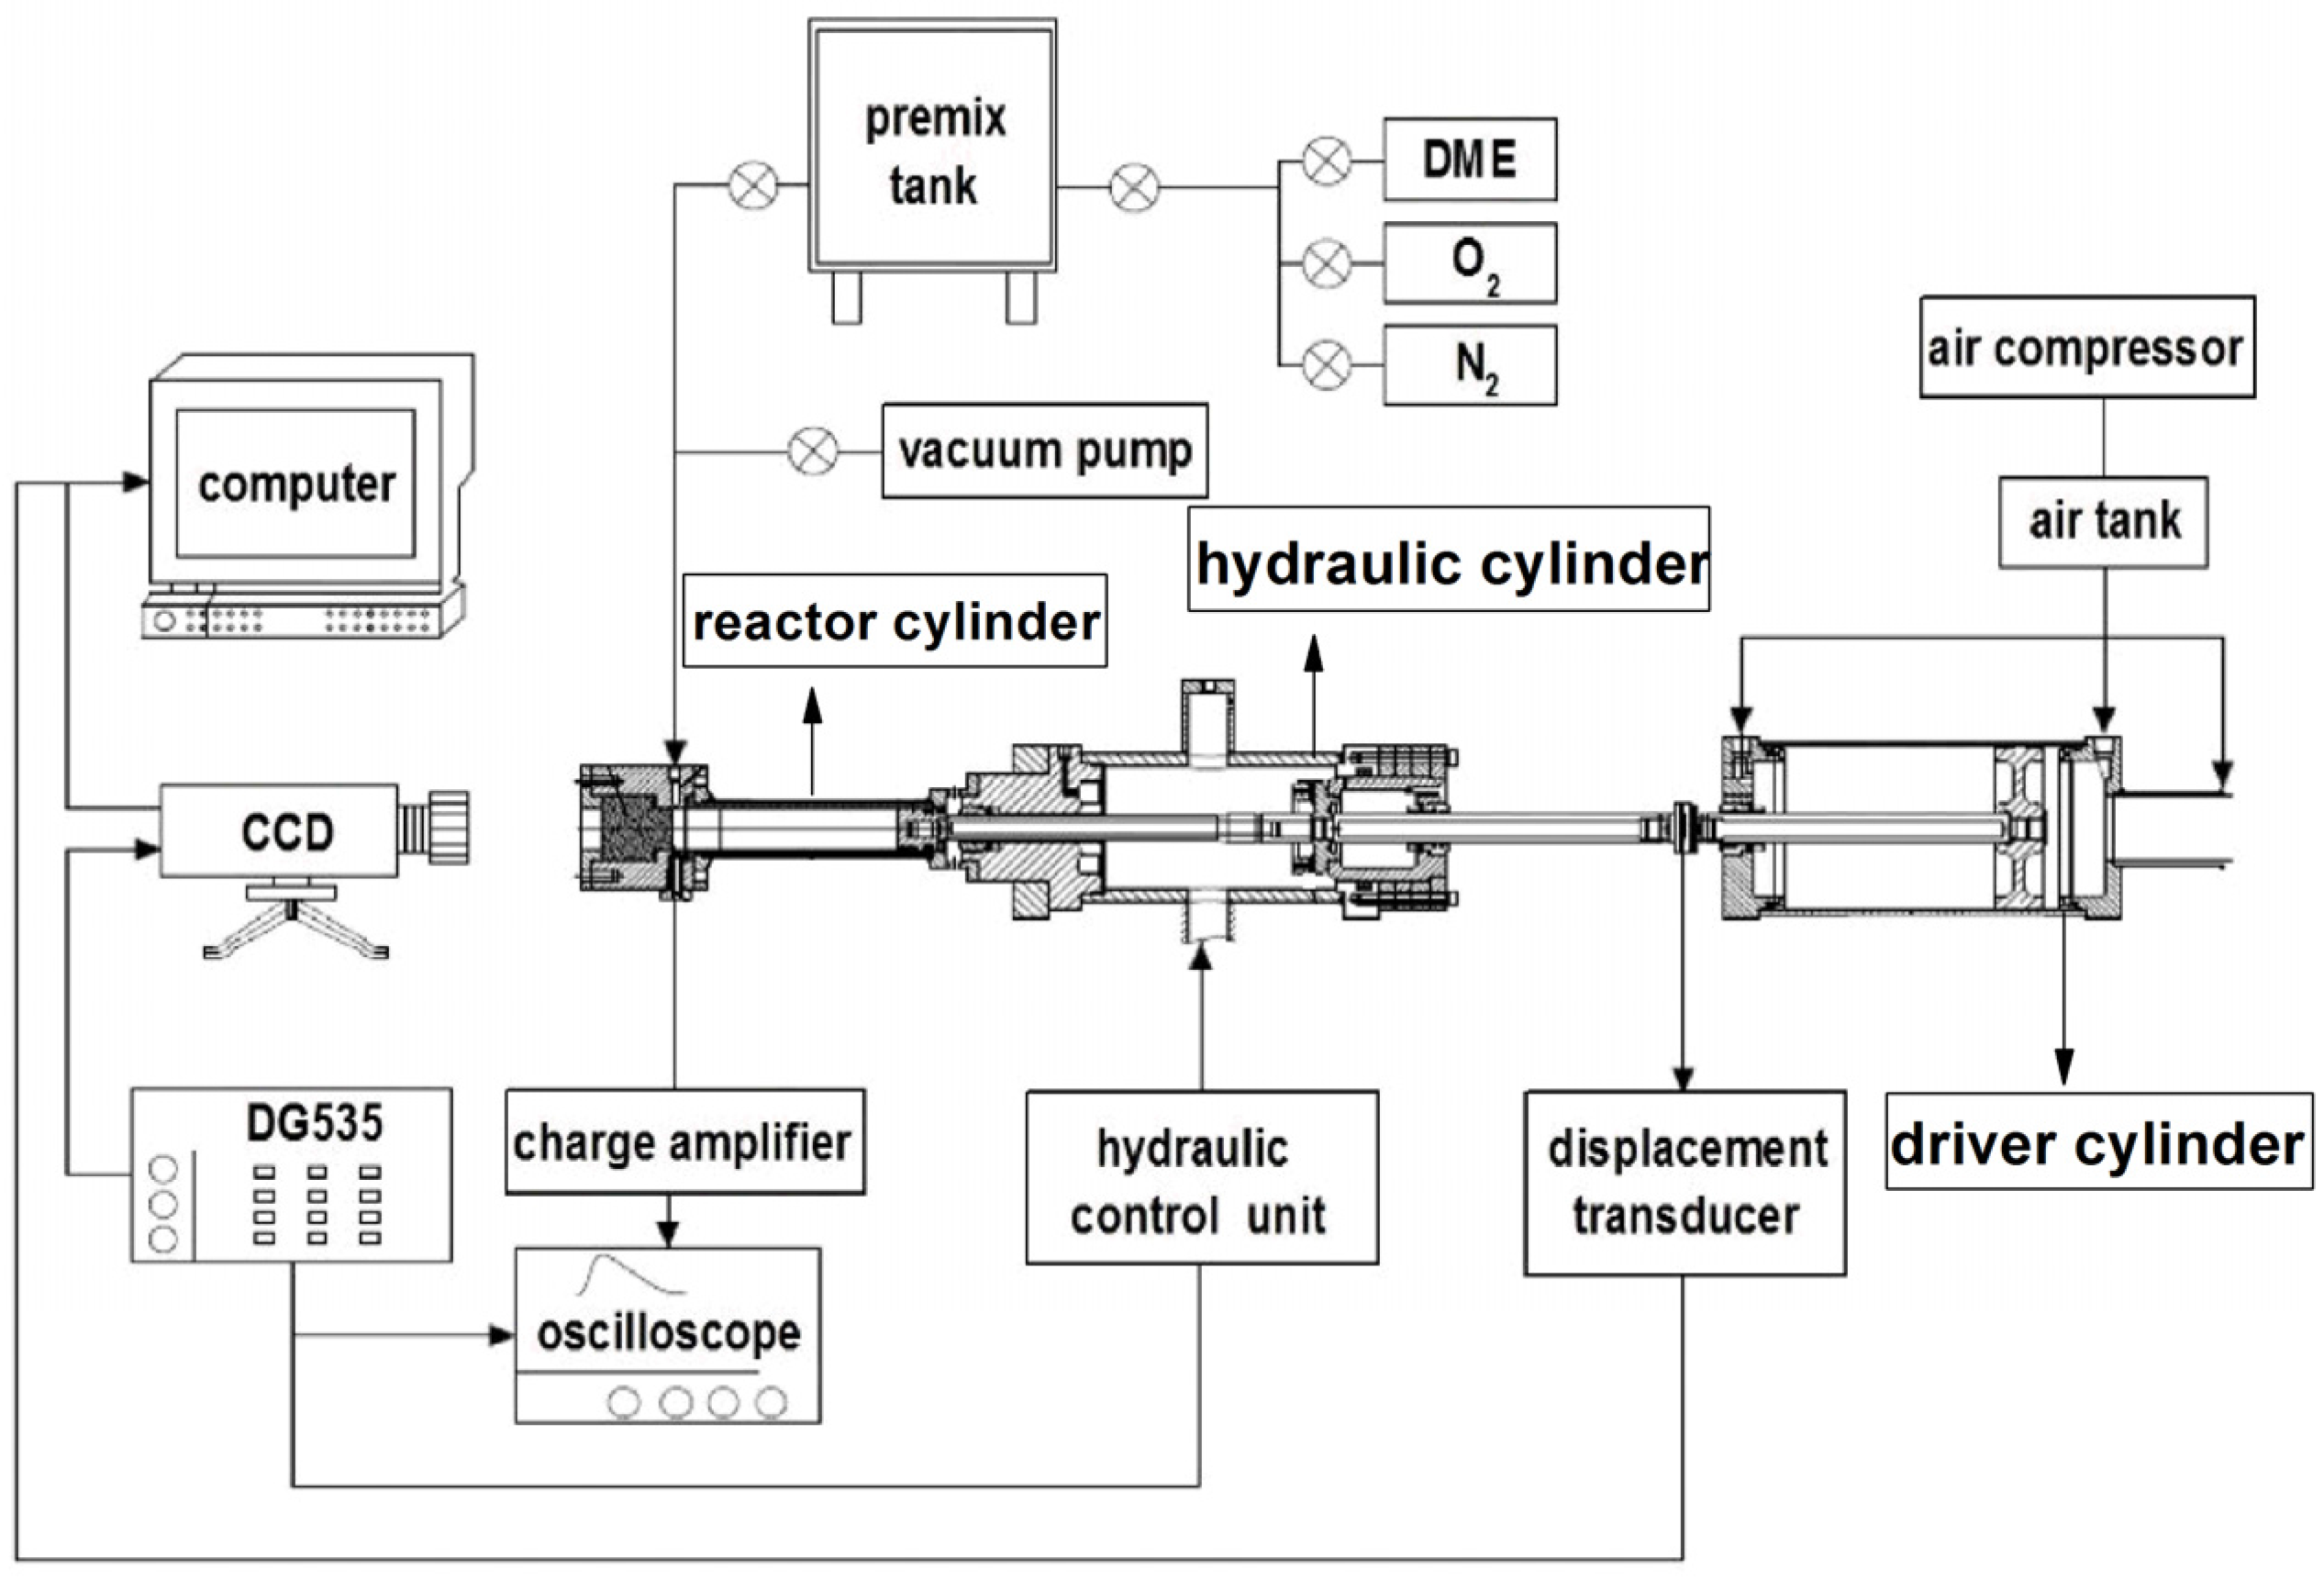
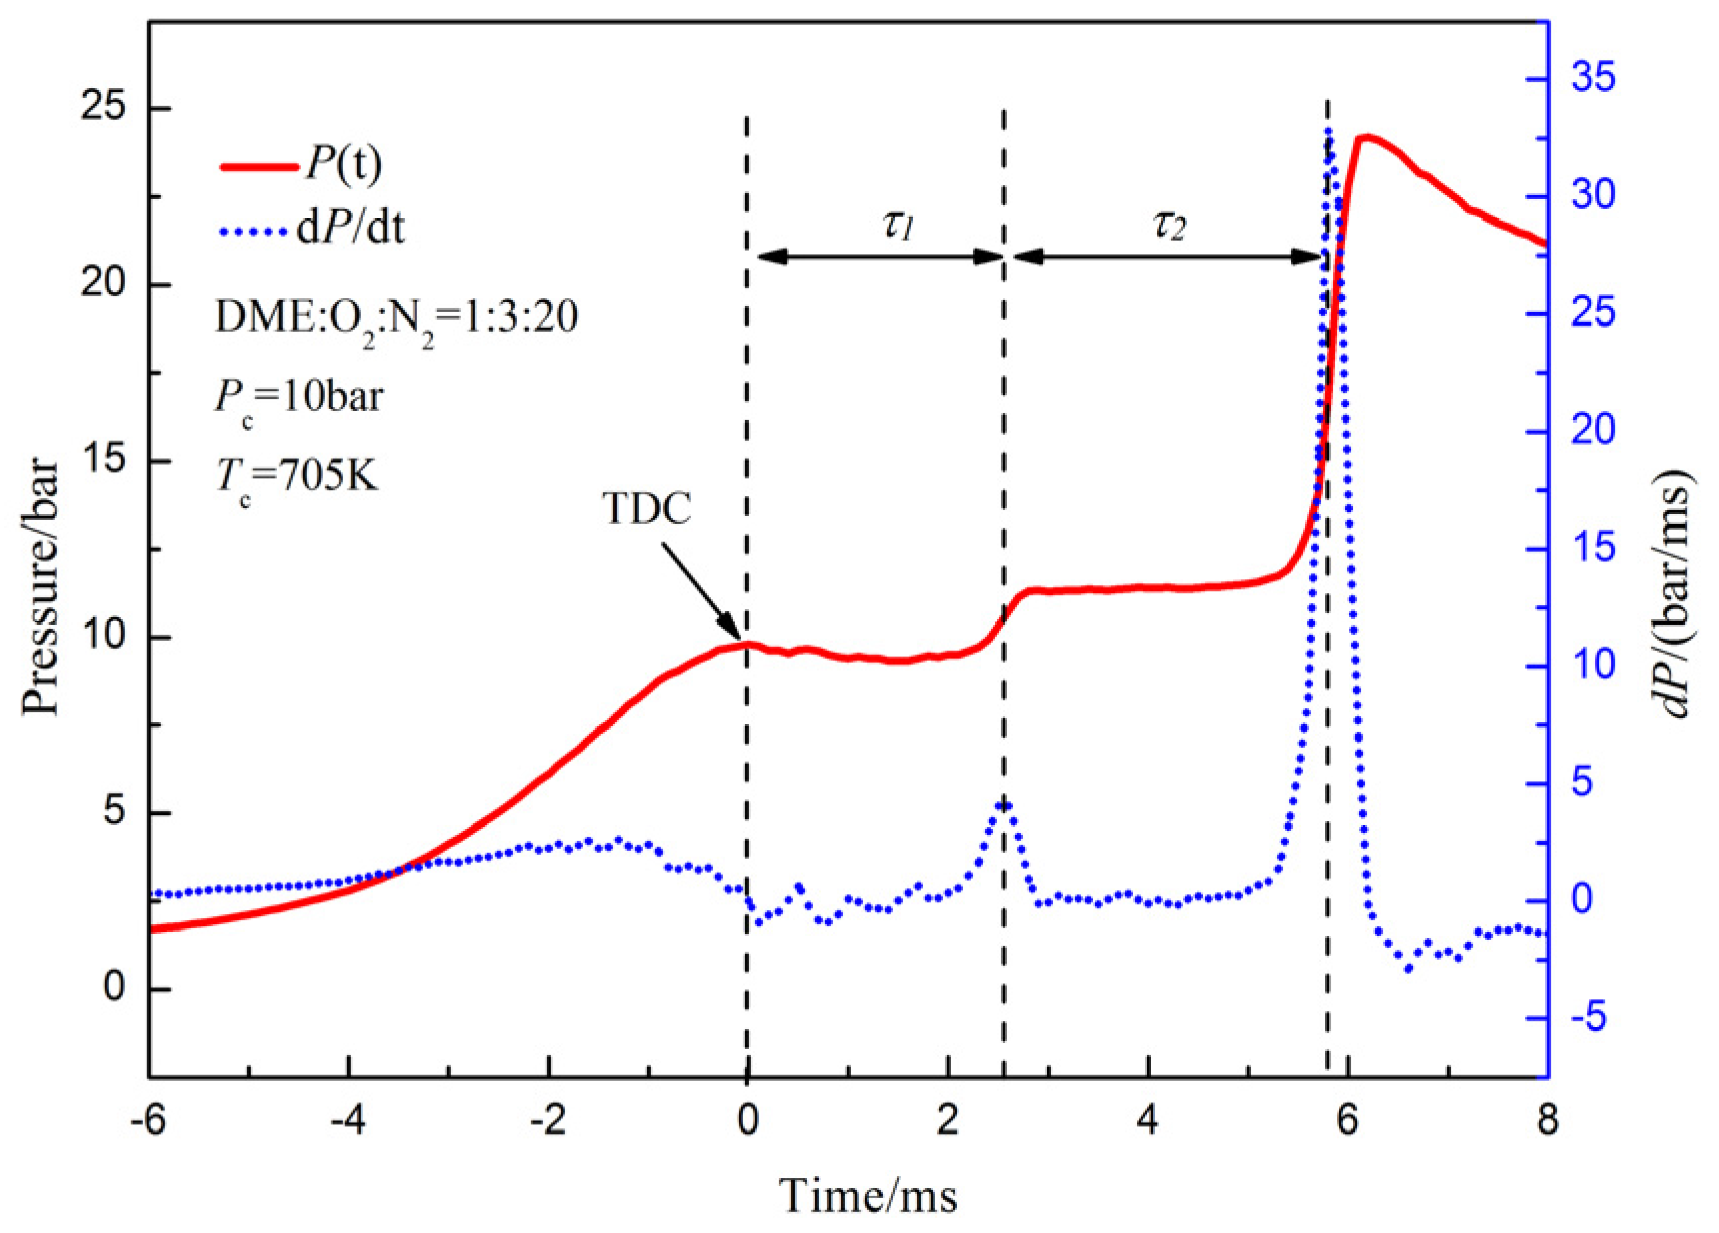
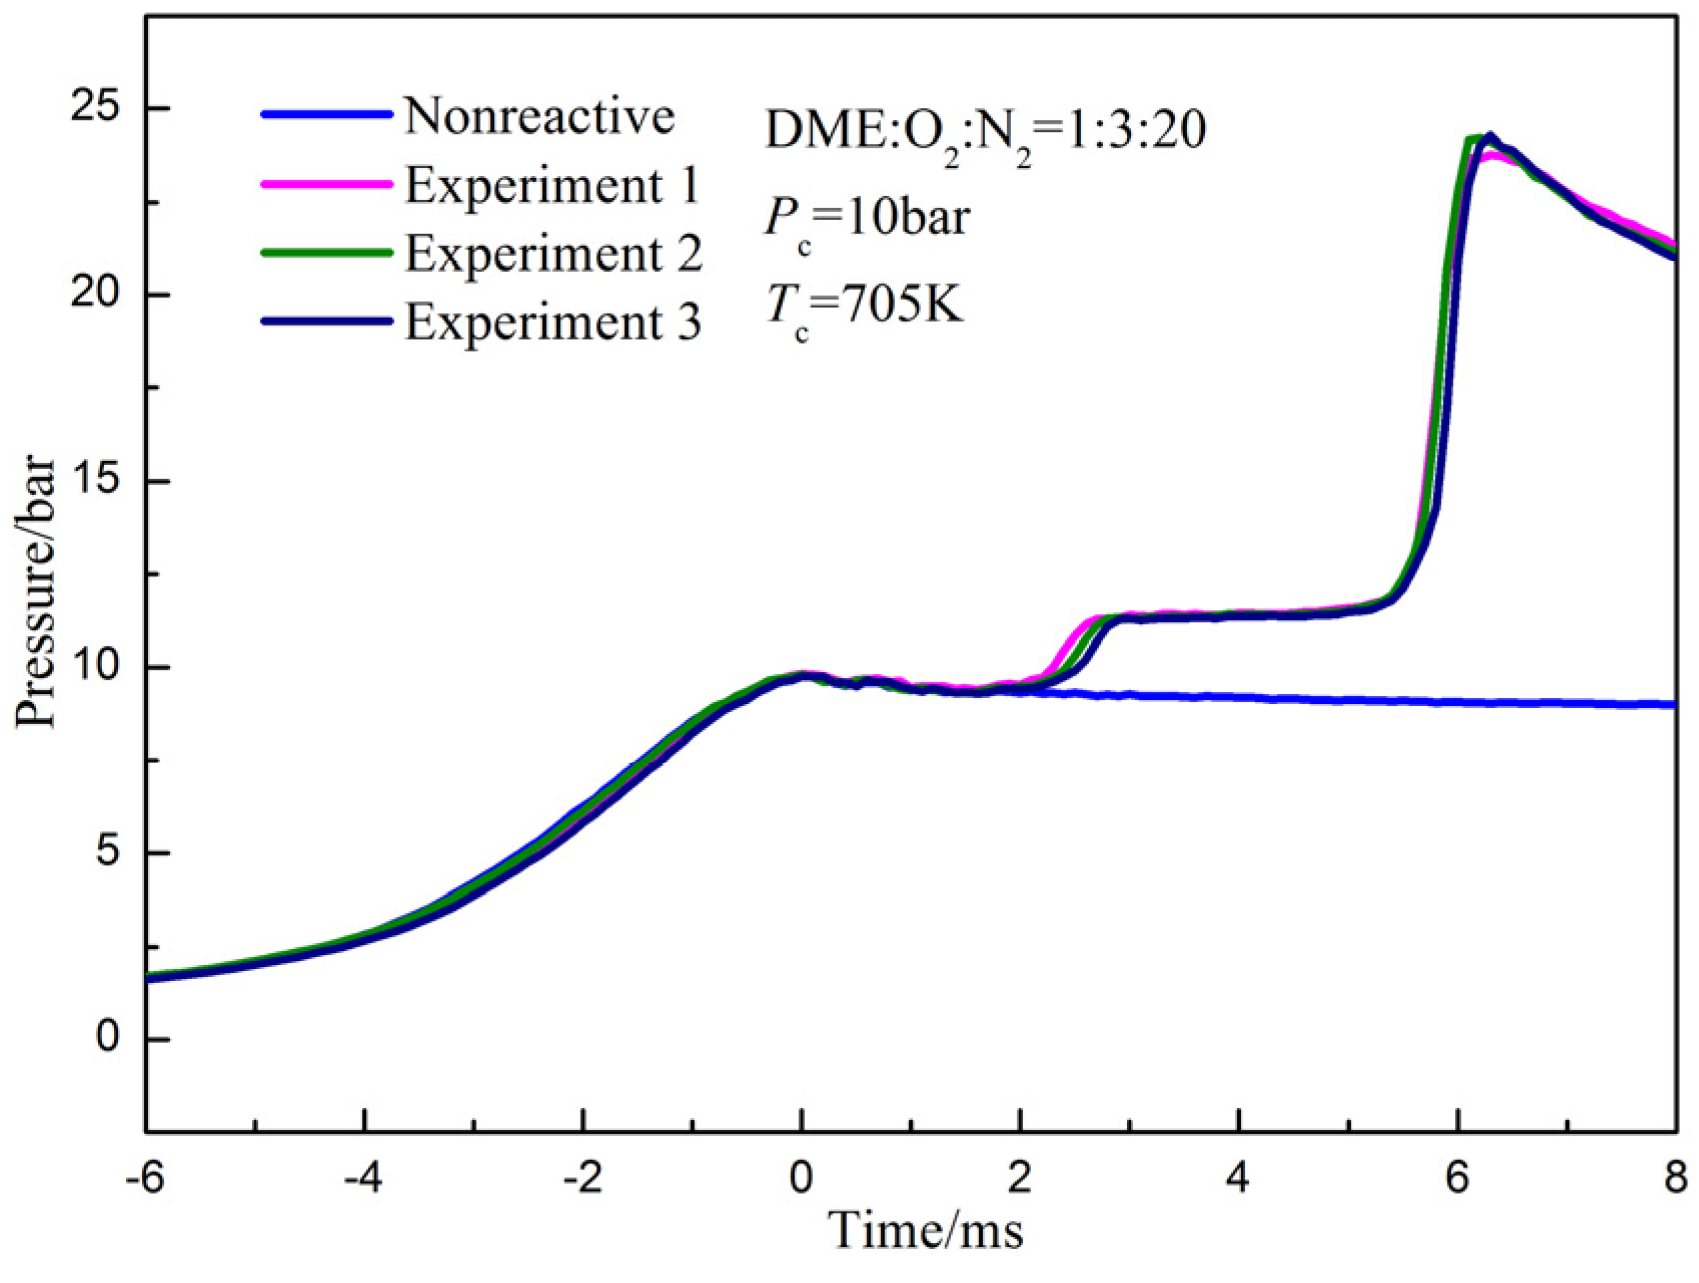
2.2. Definition of Ignition Delay and Repeatability of Experiments


2.3. Preparation of Gas Mixture
2.4. Experimental Conditions

| Mole proportion | Dilution ratio (%) | φ | Pc (bar) | Tc (K) |
|---|---|---|---|---|
| Dimethyl ether (DME):O2:N2 = 1:3:20 | 36.31 | 1 | 10 | 670–795 |
| DME:O2:N2:Ar = 1:3:10:10 | 36.31 | |||
| DME:O2:Ar:CO2 = 1:3:12.245:7.755 | 36.31 | |||
| DME:O2:N2 = 1:3:25 | 47.29 | |||
| DME:O2:N2 = 1:3:30 | 55.04 |
3. Numerical Simulations
4. Results and Discussion
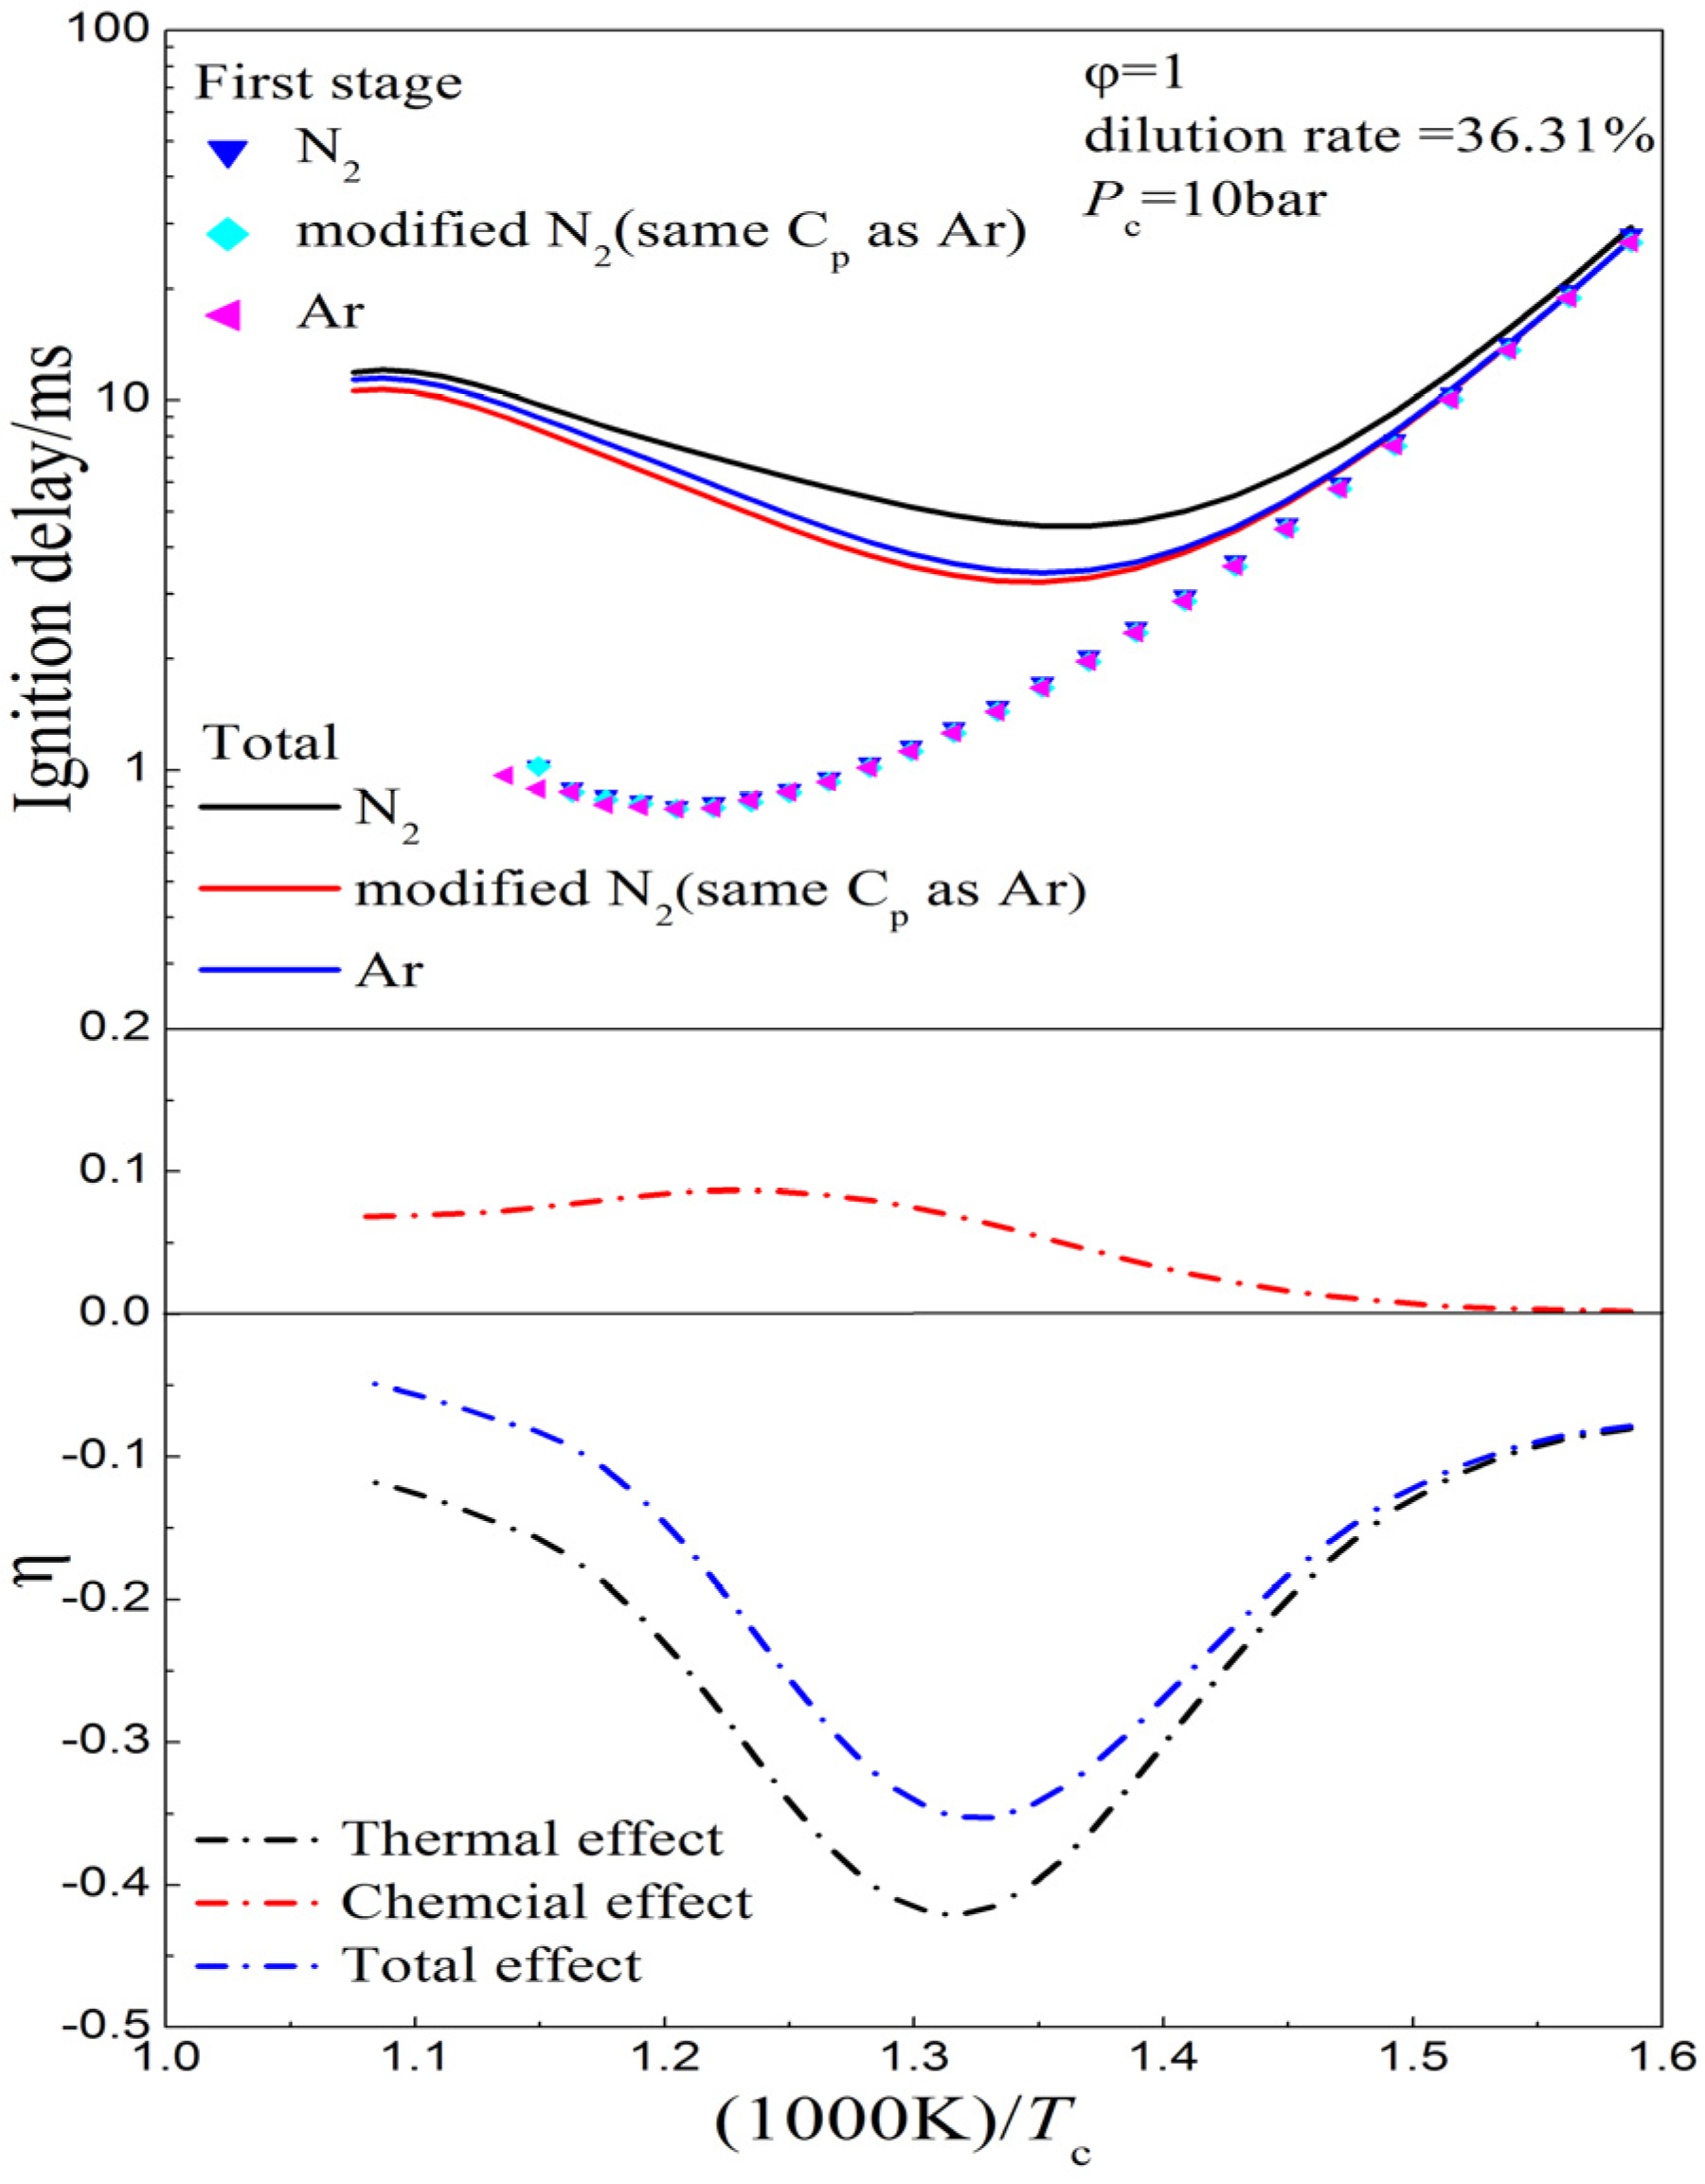
4.1. Thermal and Chemical Effects of Buffer Gas Composition


| Reactions | N2 | Ar | CO2 | Ar/CO2 (61.2%/38.8%) |
|---|---|---|---|---|
| H + O2 (+M) <=> HO2 (+M) | 1 | 1 | 3.8 | 2.09 |
| H2O2 (+M) <=> 2OH (+M) | 1 | 0.64 | 3.8 | 1.87 |


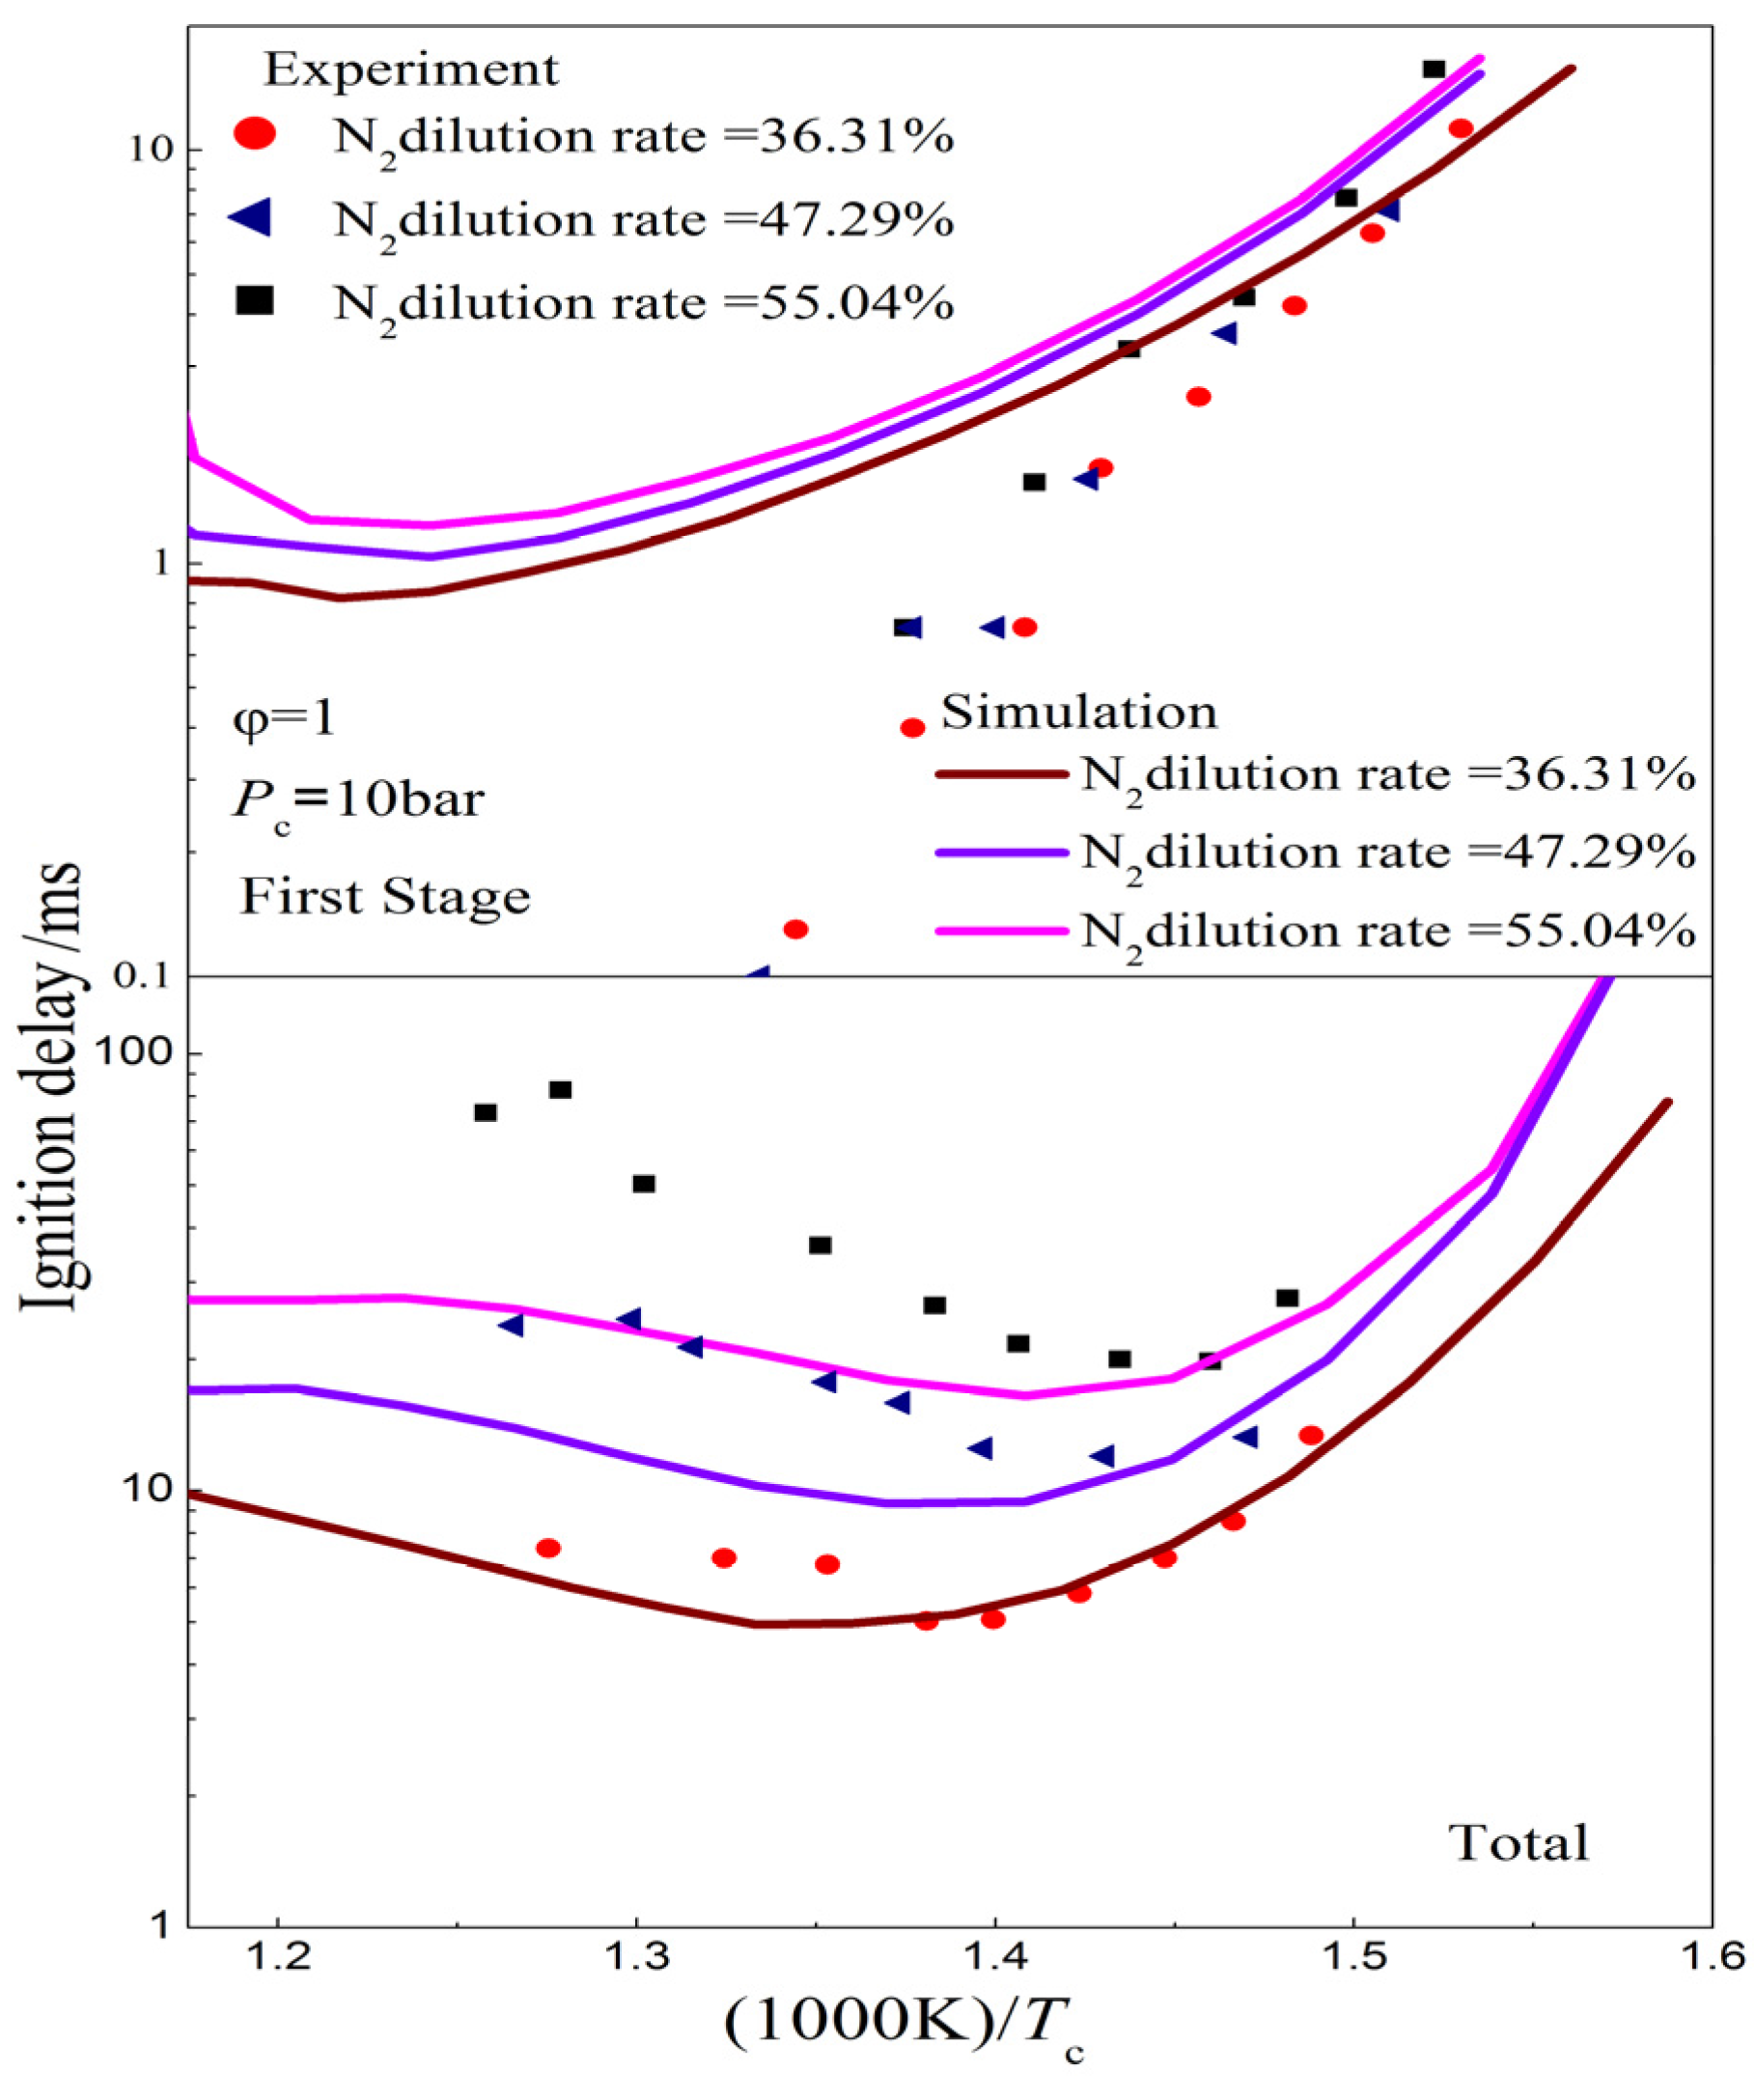
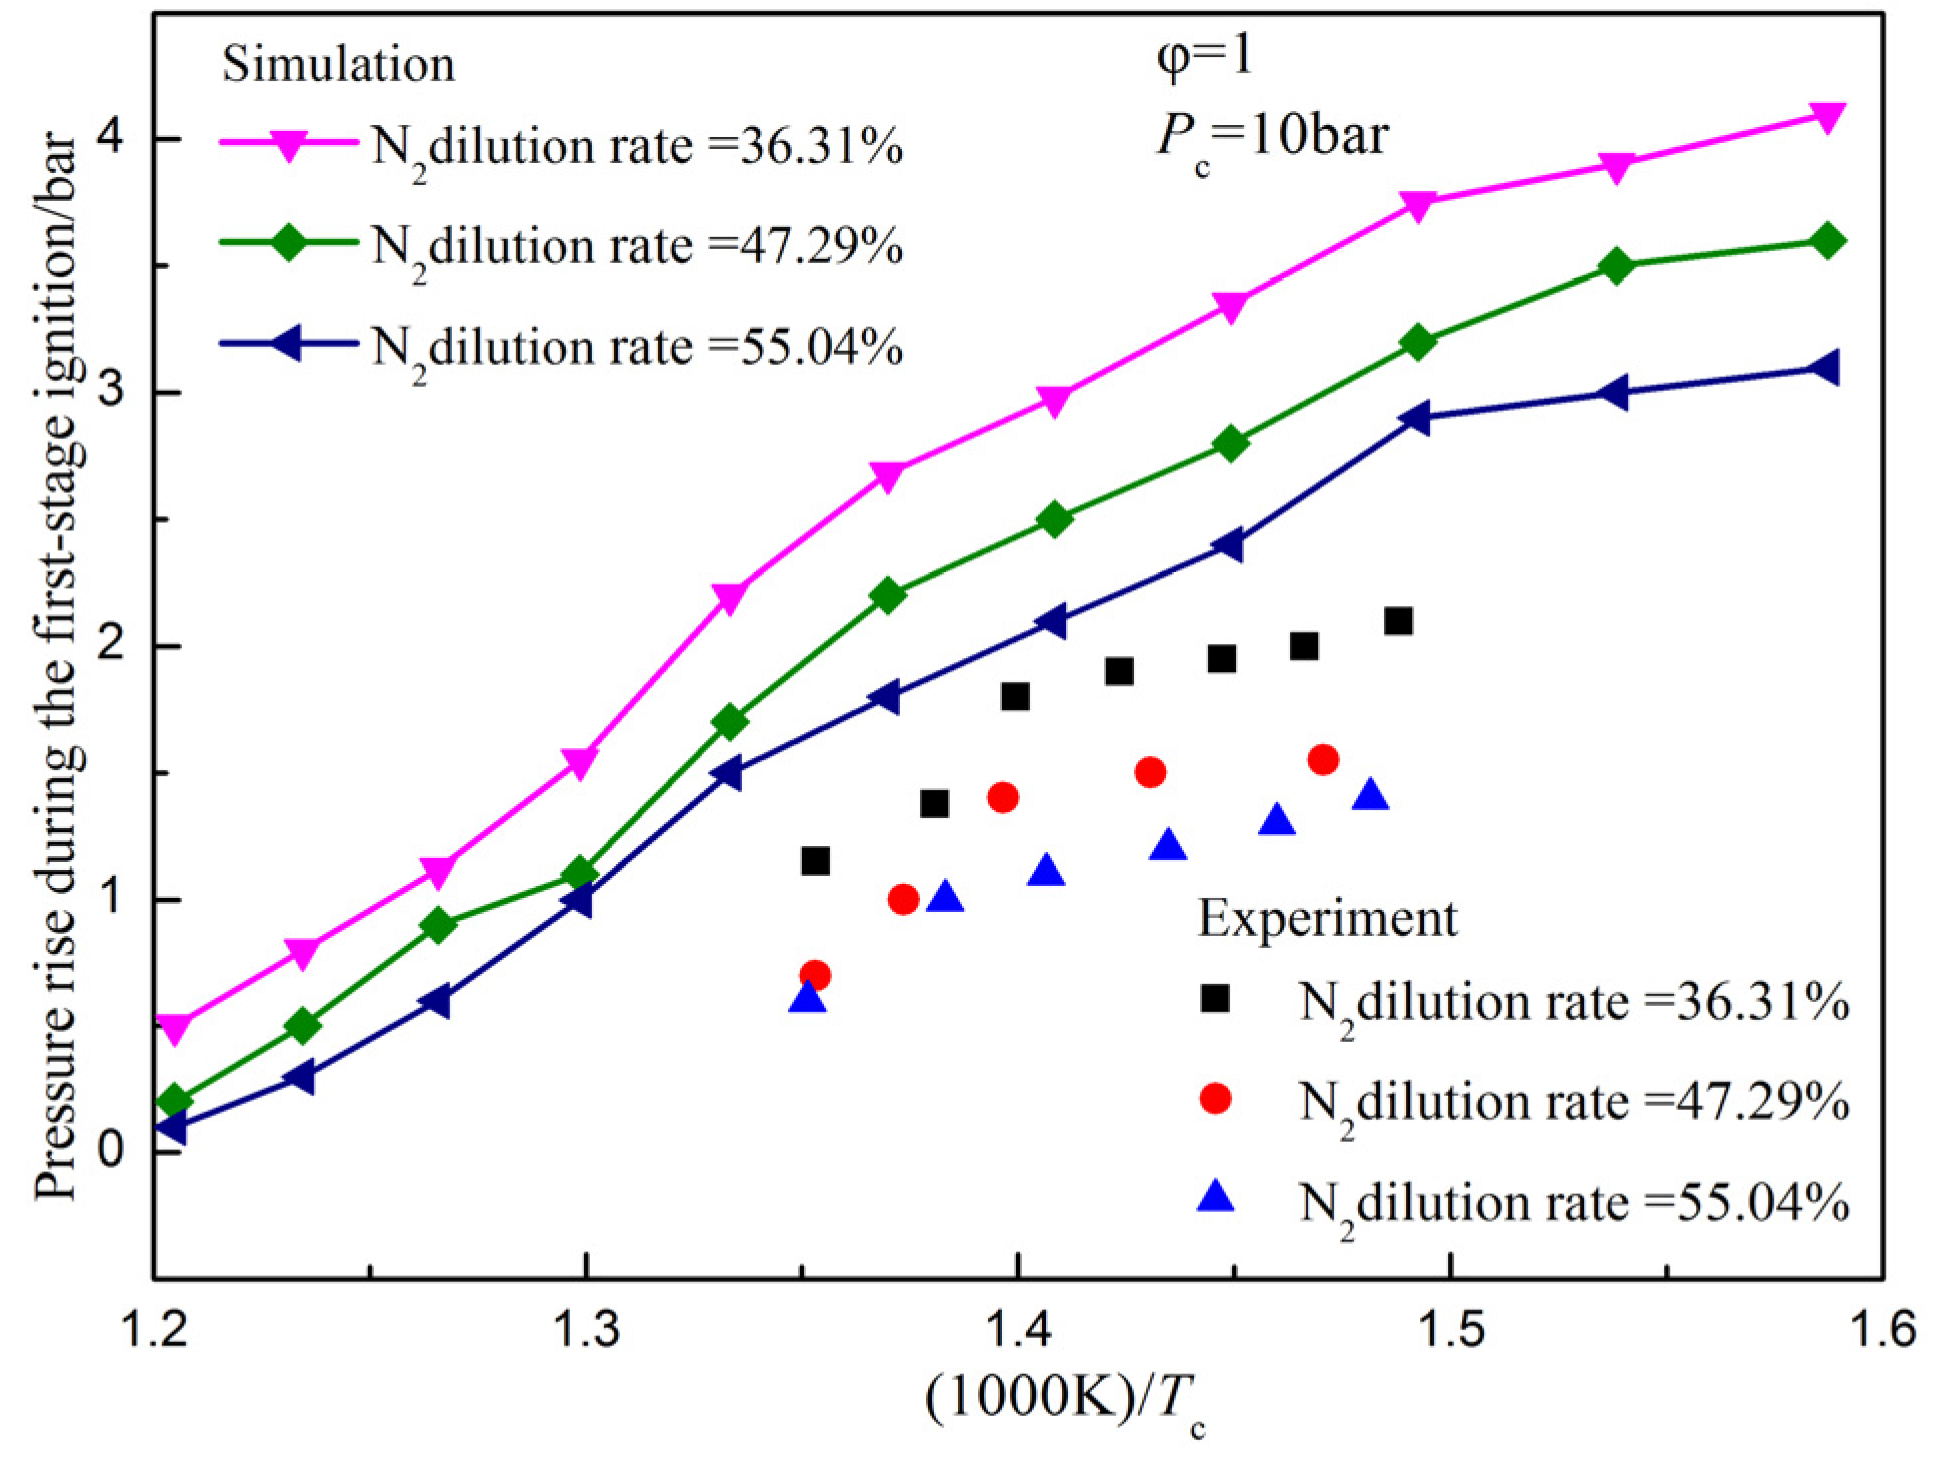
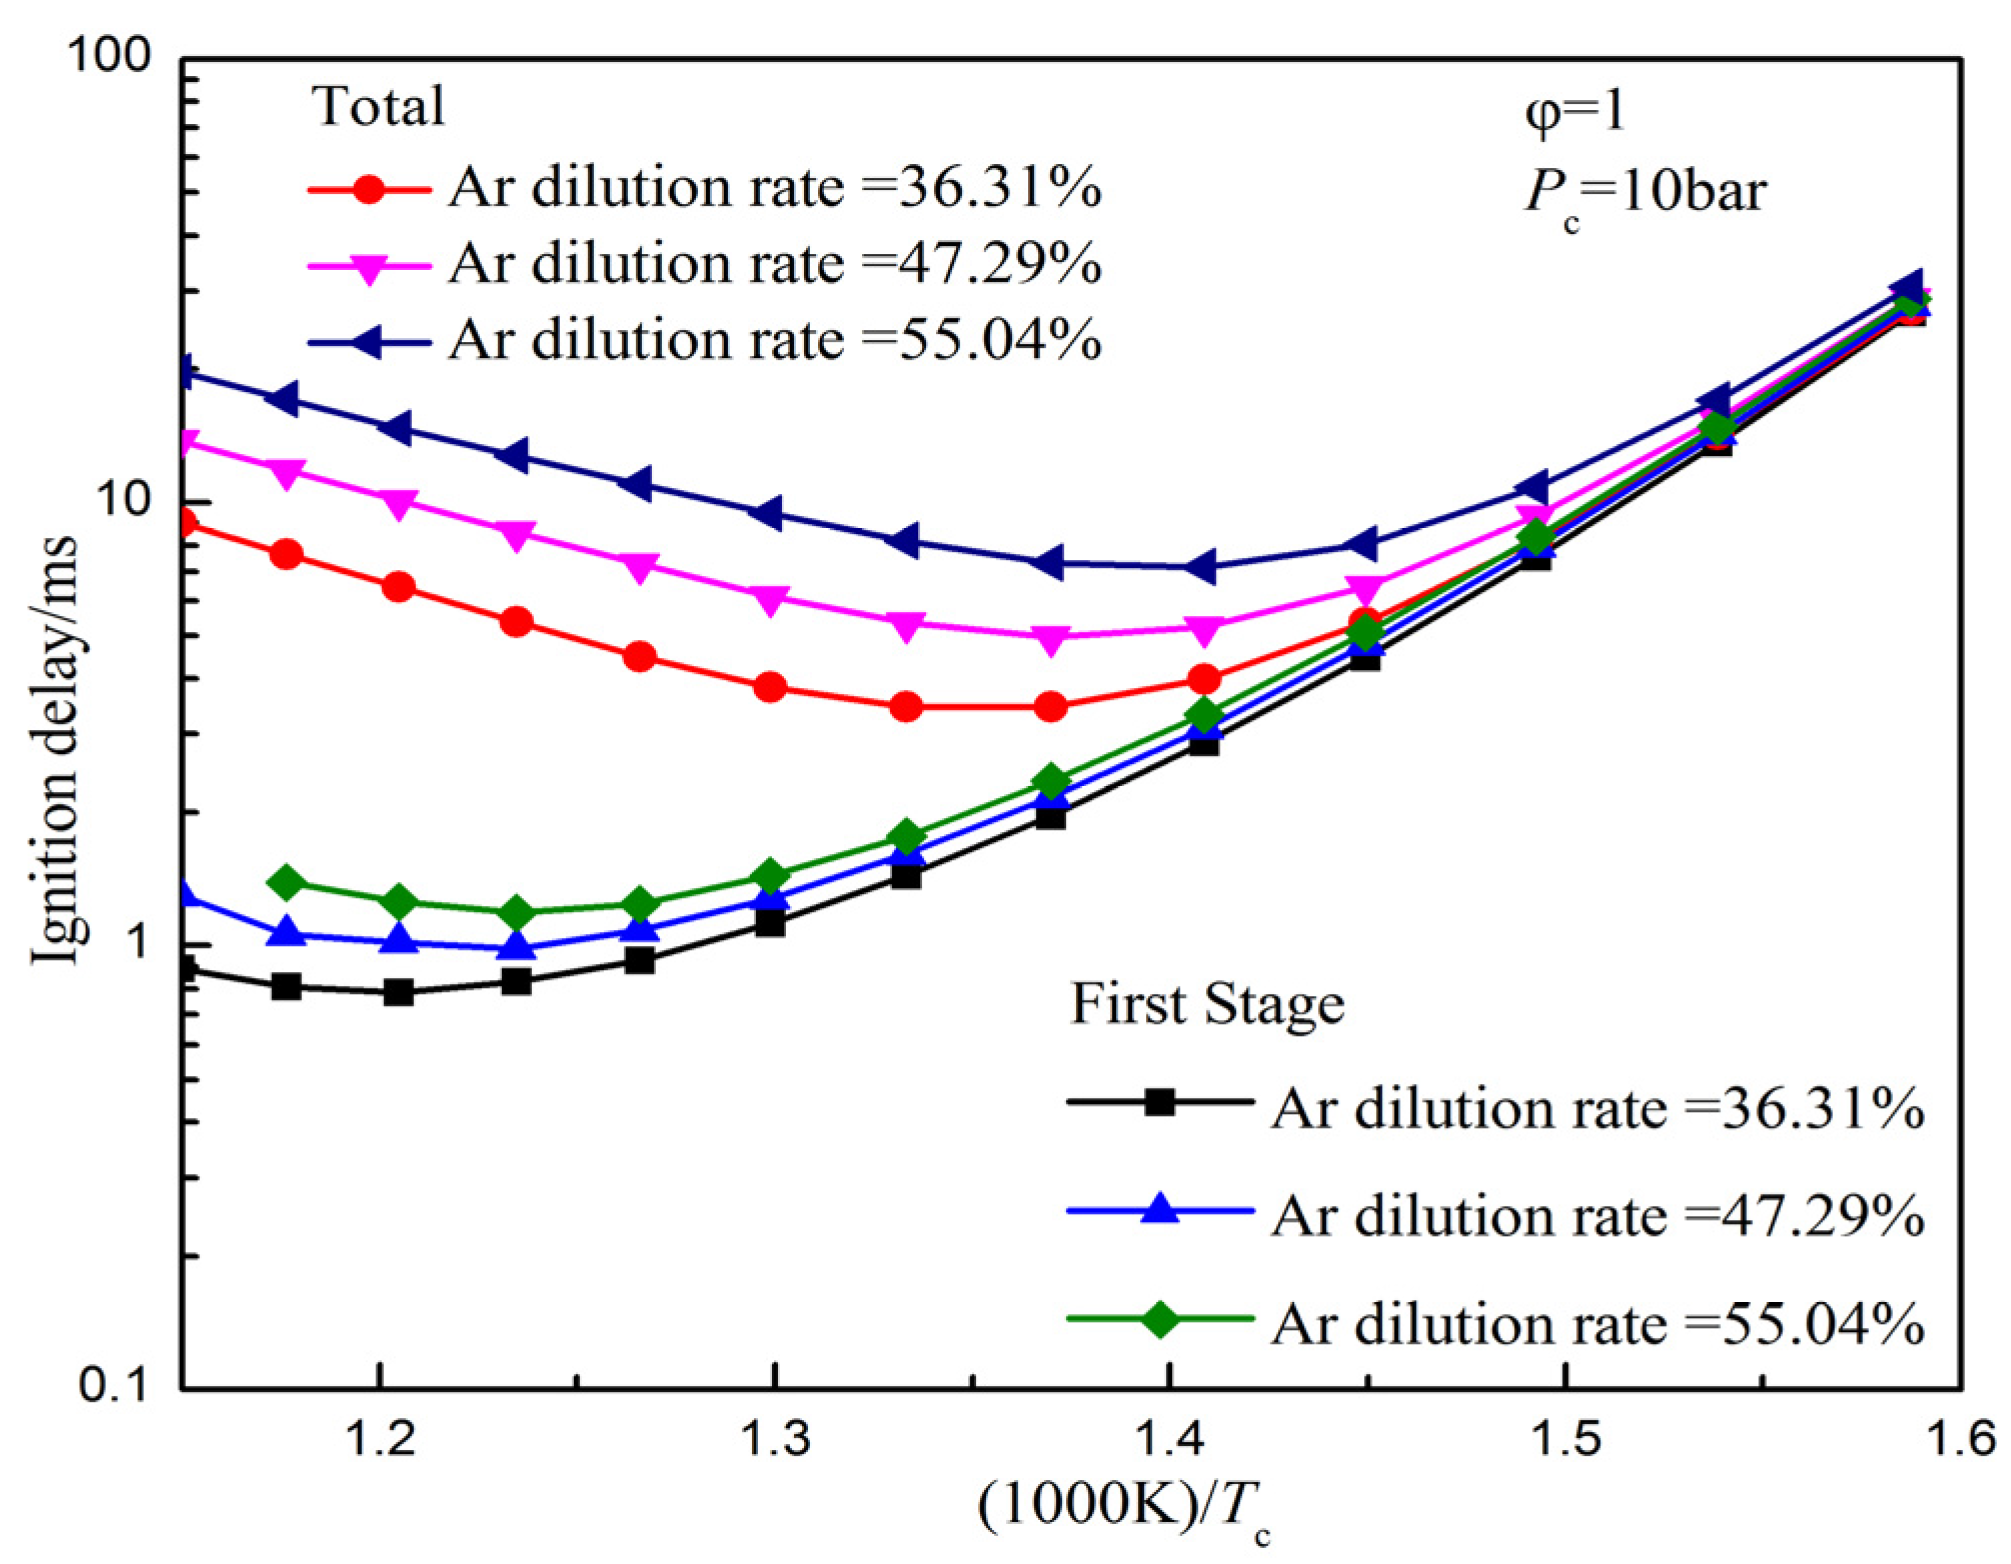
4.2. Dilution Effects of Buffer Gas Composition


5. Conclusions
- (1)
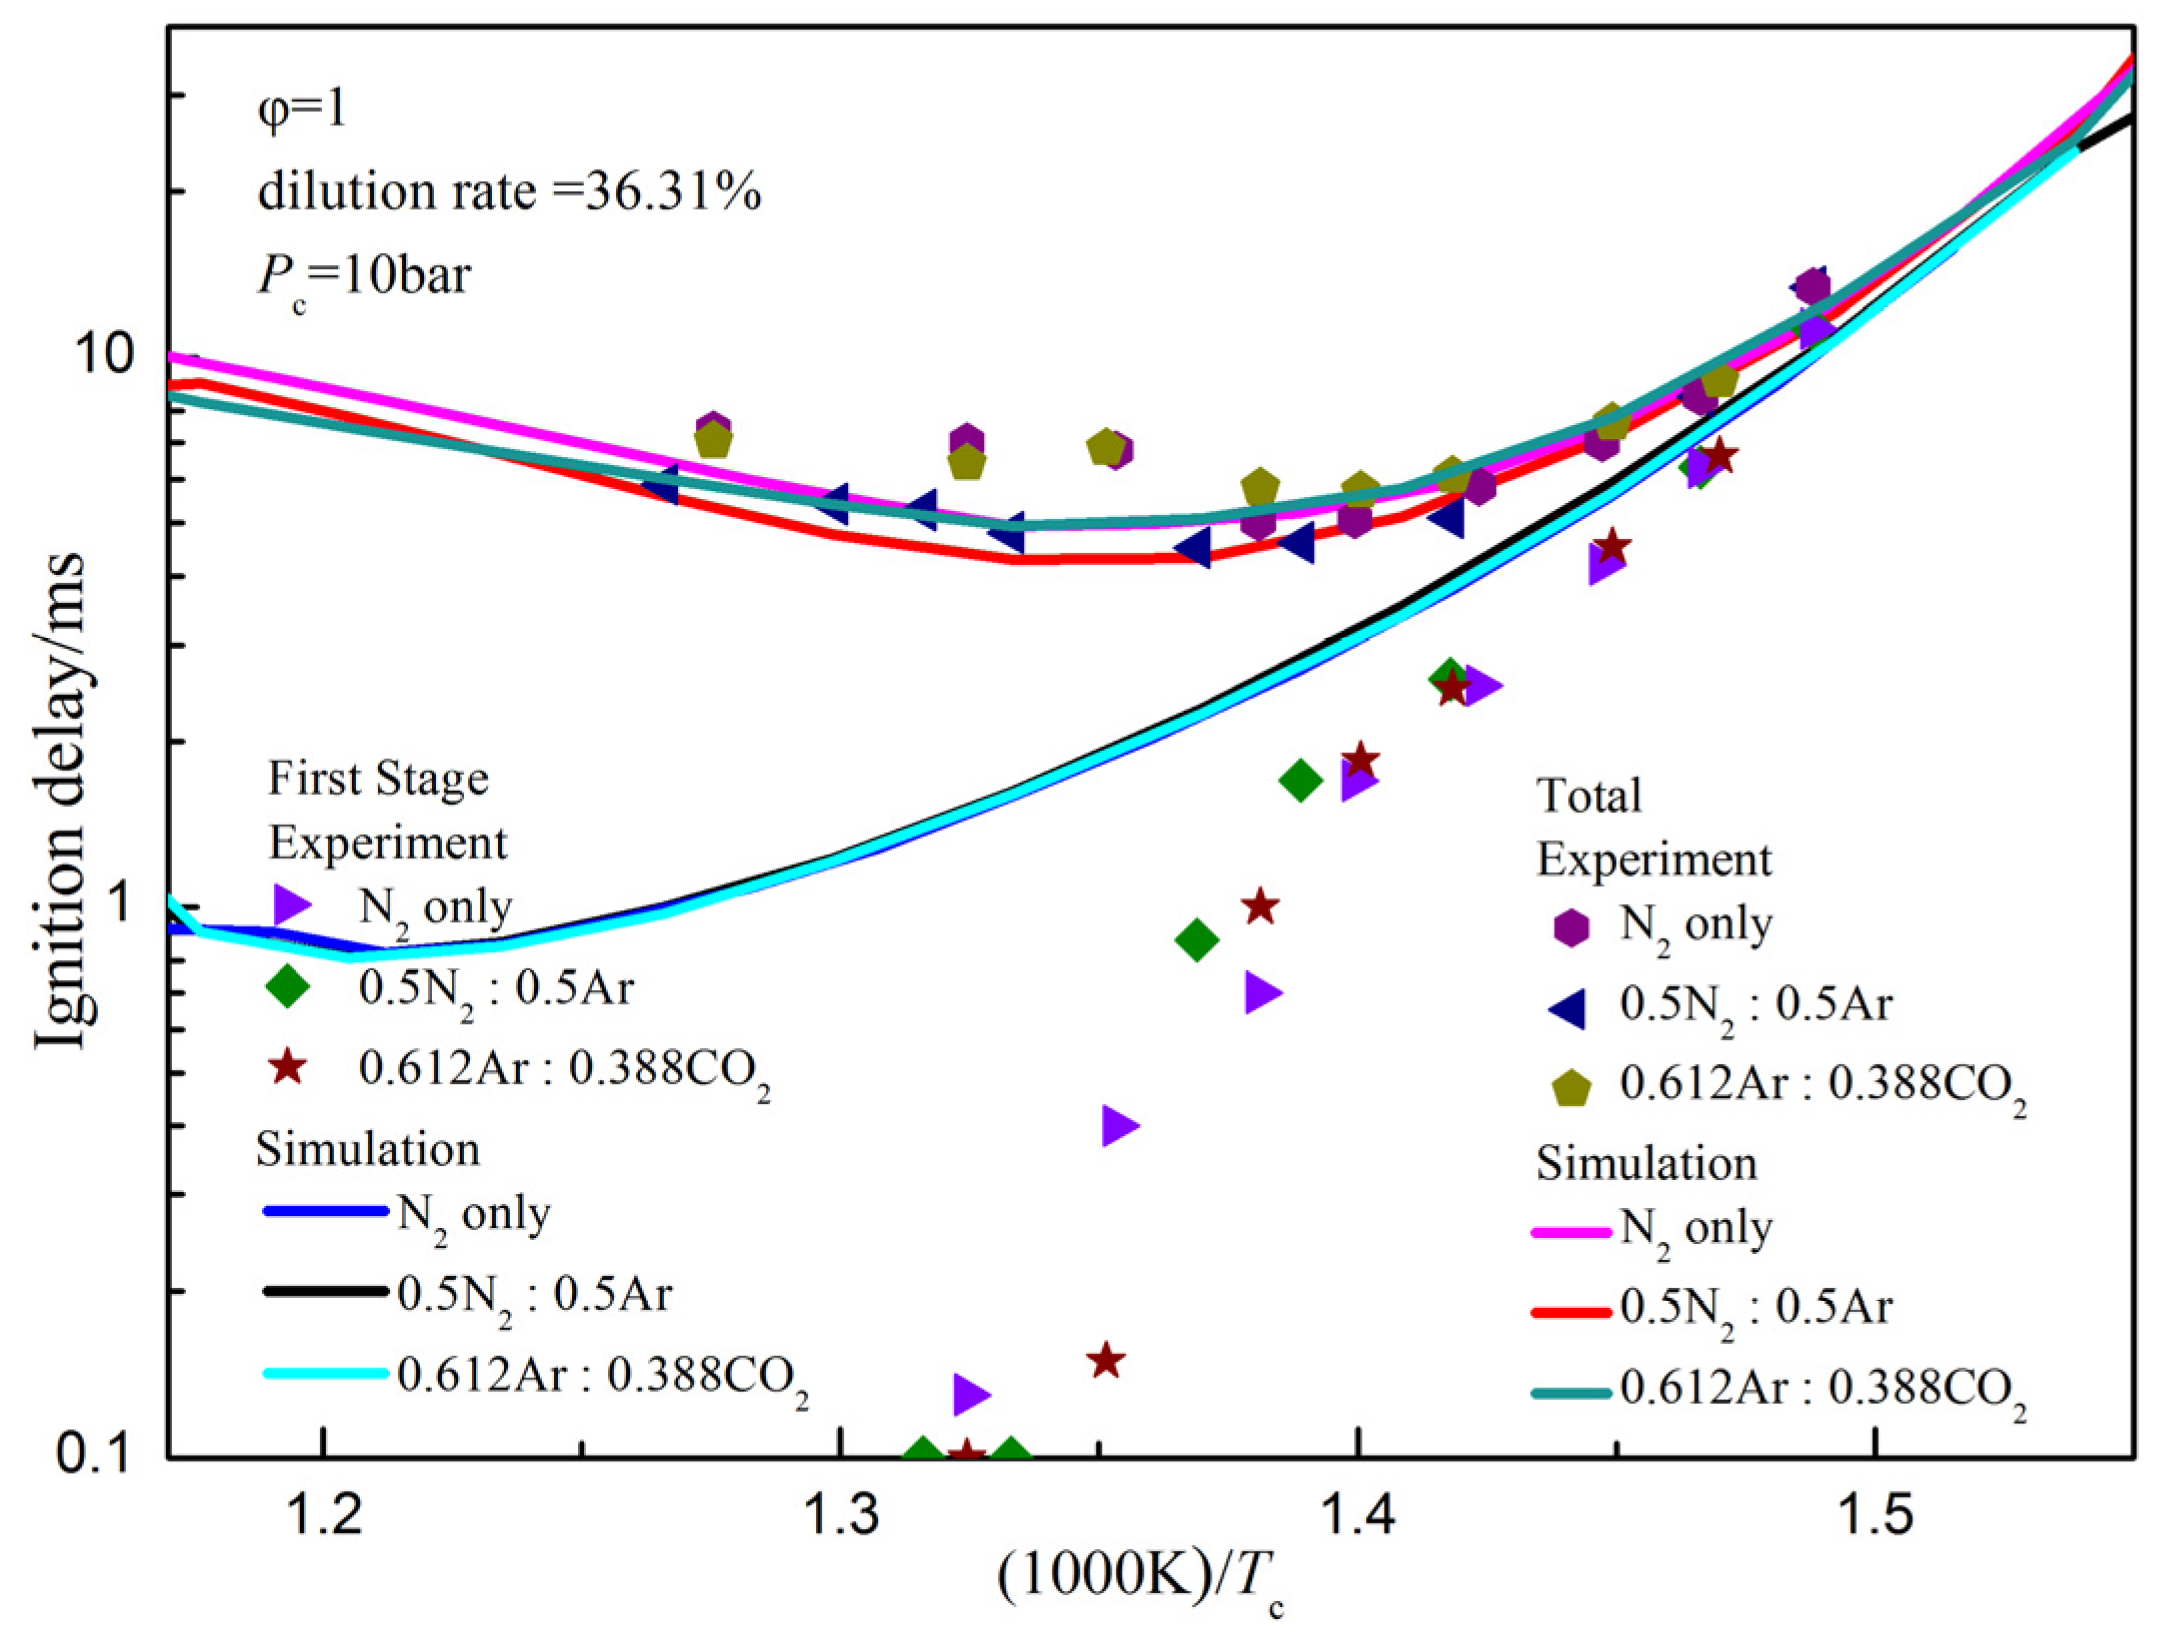
- Both experimental and simulation results show that the buffer gas composition has little impact on the first-stage ignition delay. In the low temperature region, the effects of buffer gas composition on the total ignition delay are also negligible. However, compared to N2, the N2/Ar (50%/50%) mixture reduces the total ignition delay by 31% and 14% in the NTC region for experimental and simulation data, respectively.
- (2)
- For ignition delays of N2 and the Ar/CO2 (61.2%/38.8%) mixture, experimental results show that the chemical effects have little impact on the first-stage and total ignition delays in the conditions studied, whereas the simulation results show that the chemical effects become pronounced at a compressed temperature higher than 770 K.
- (3)
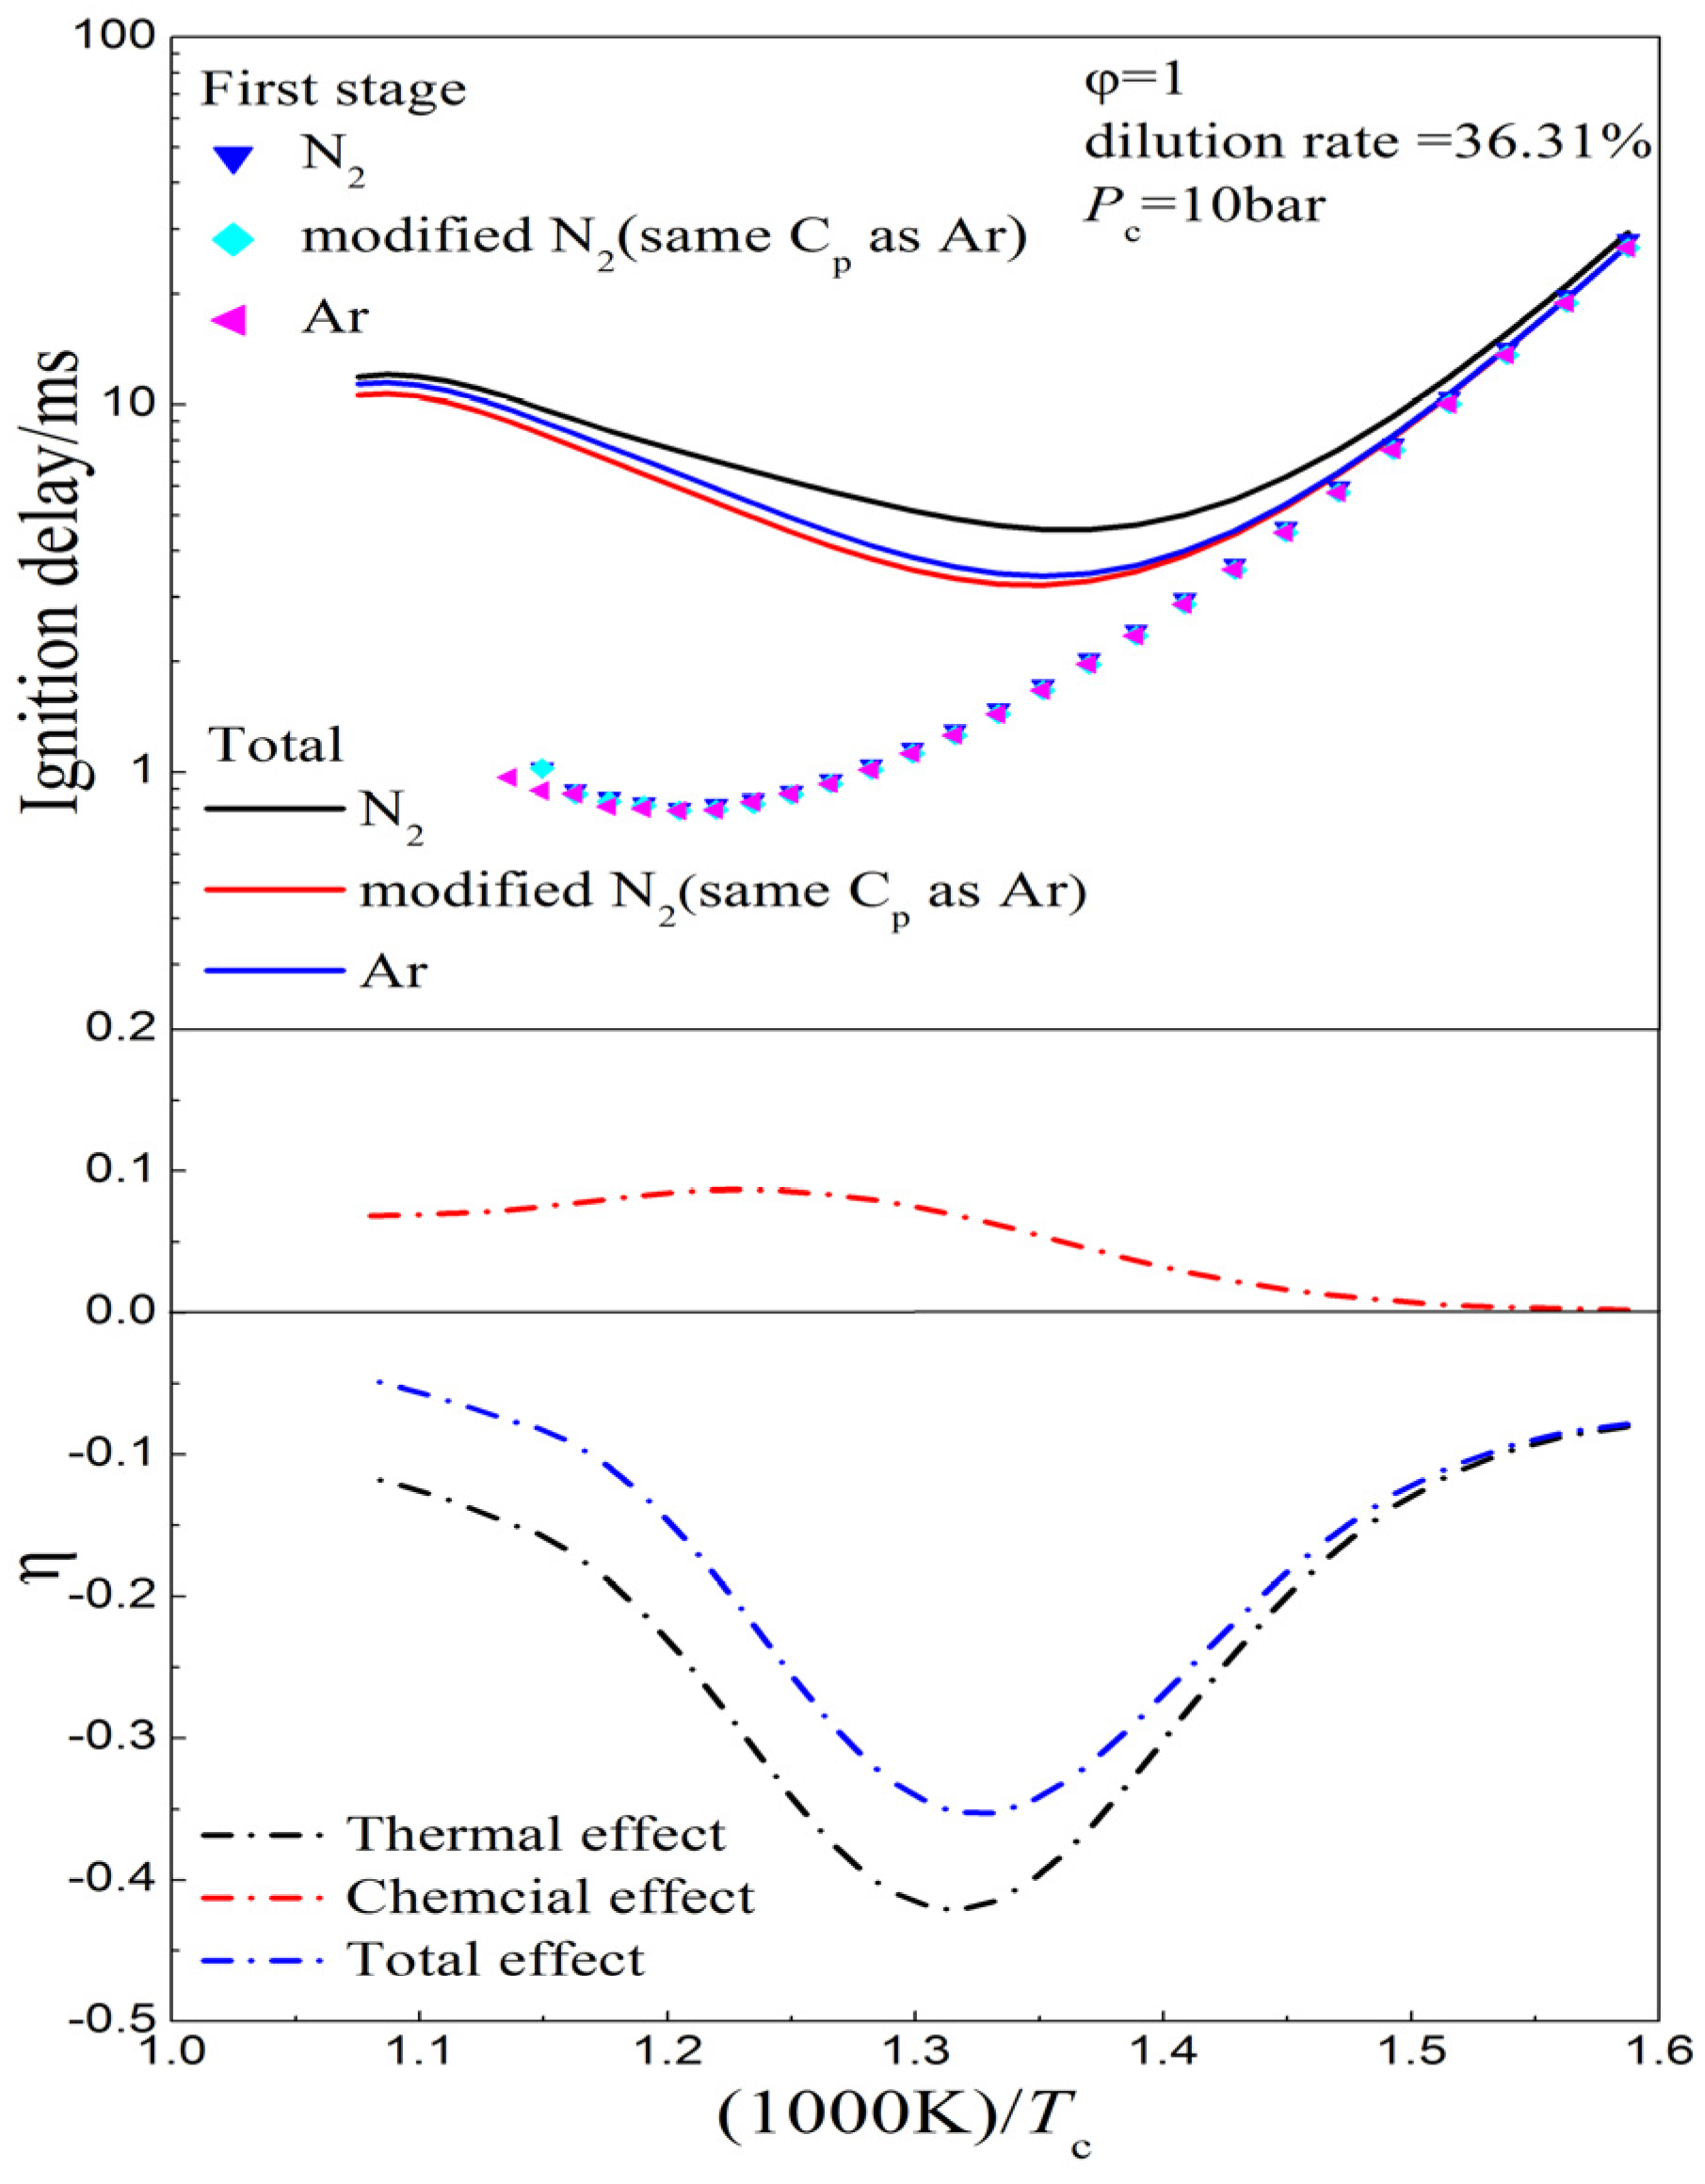
- The simulation results using pure N2, Ar and CO2 as buffer gases show that the thermal effects are the dominant factor in a low temperature and NTC region. The chemical effects become pronounced in the NTC region, and the chemical effect of CO2 exceeds the thermal effect at a compressed temperature higher than 880 K.
- (4)
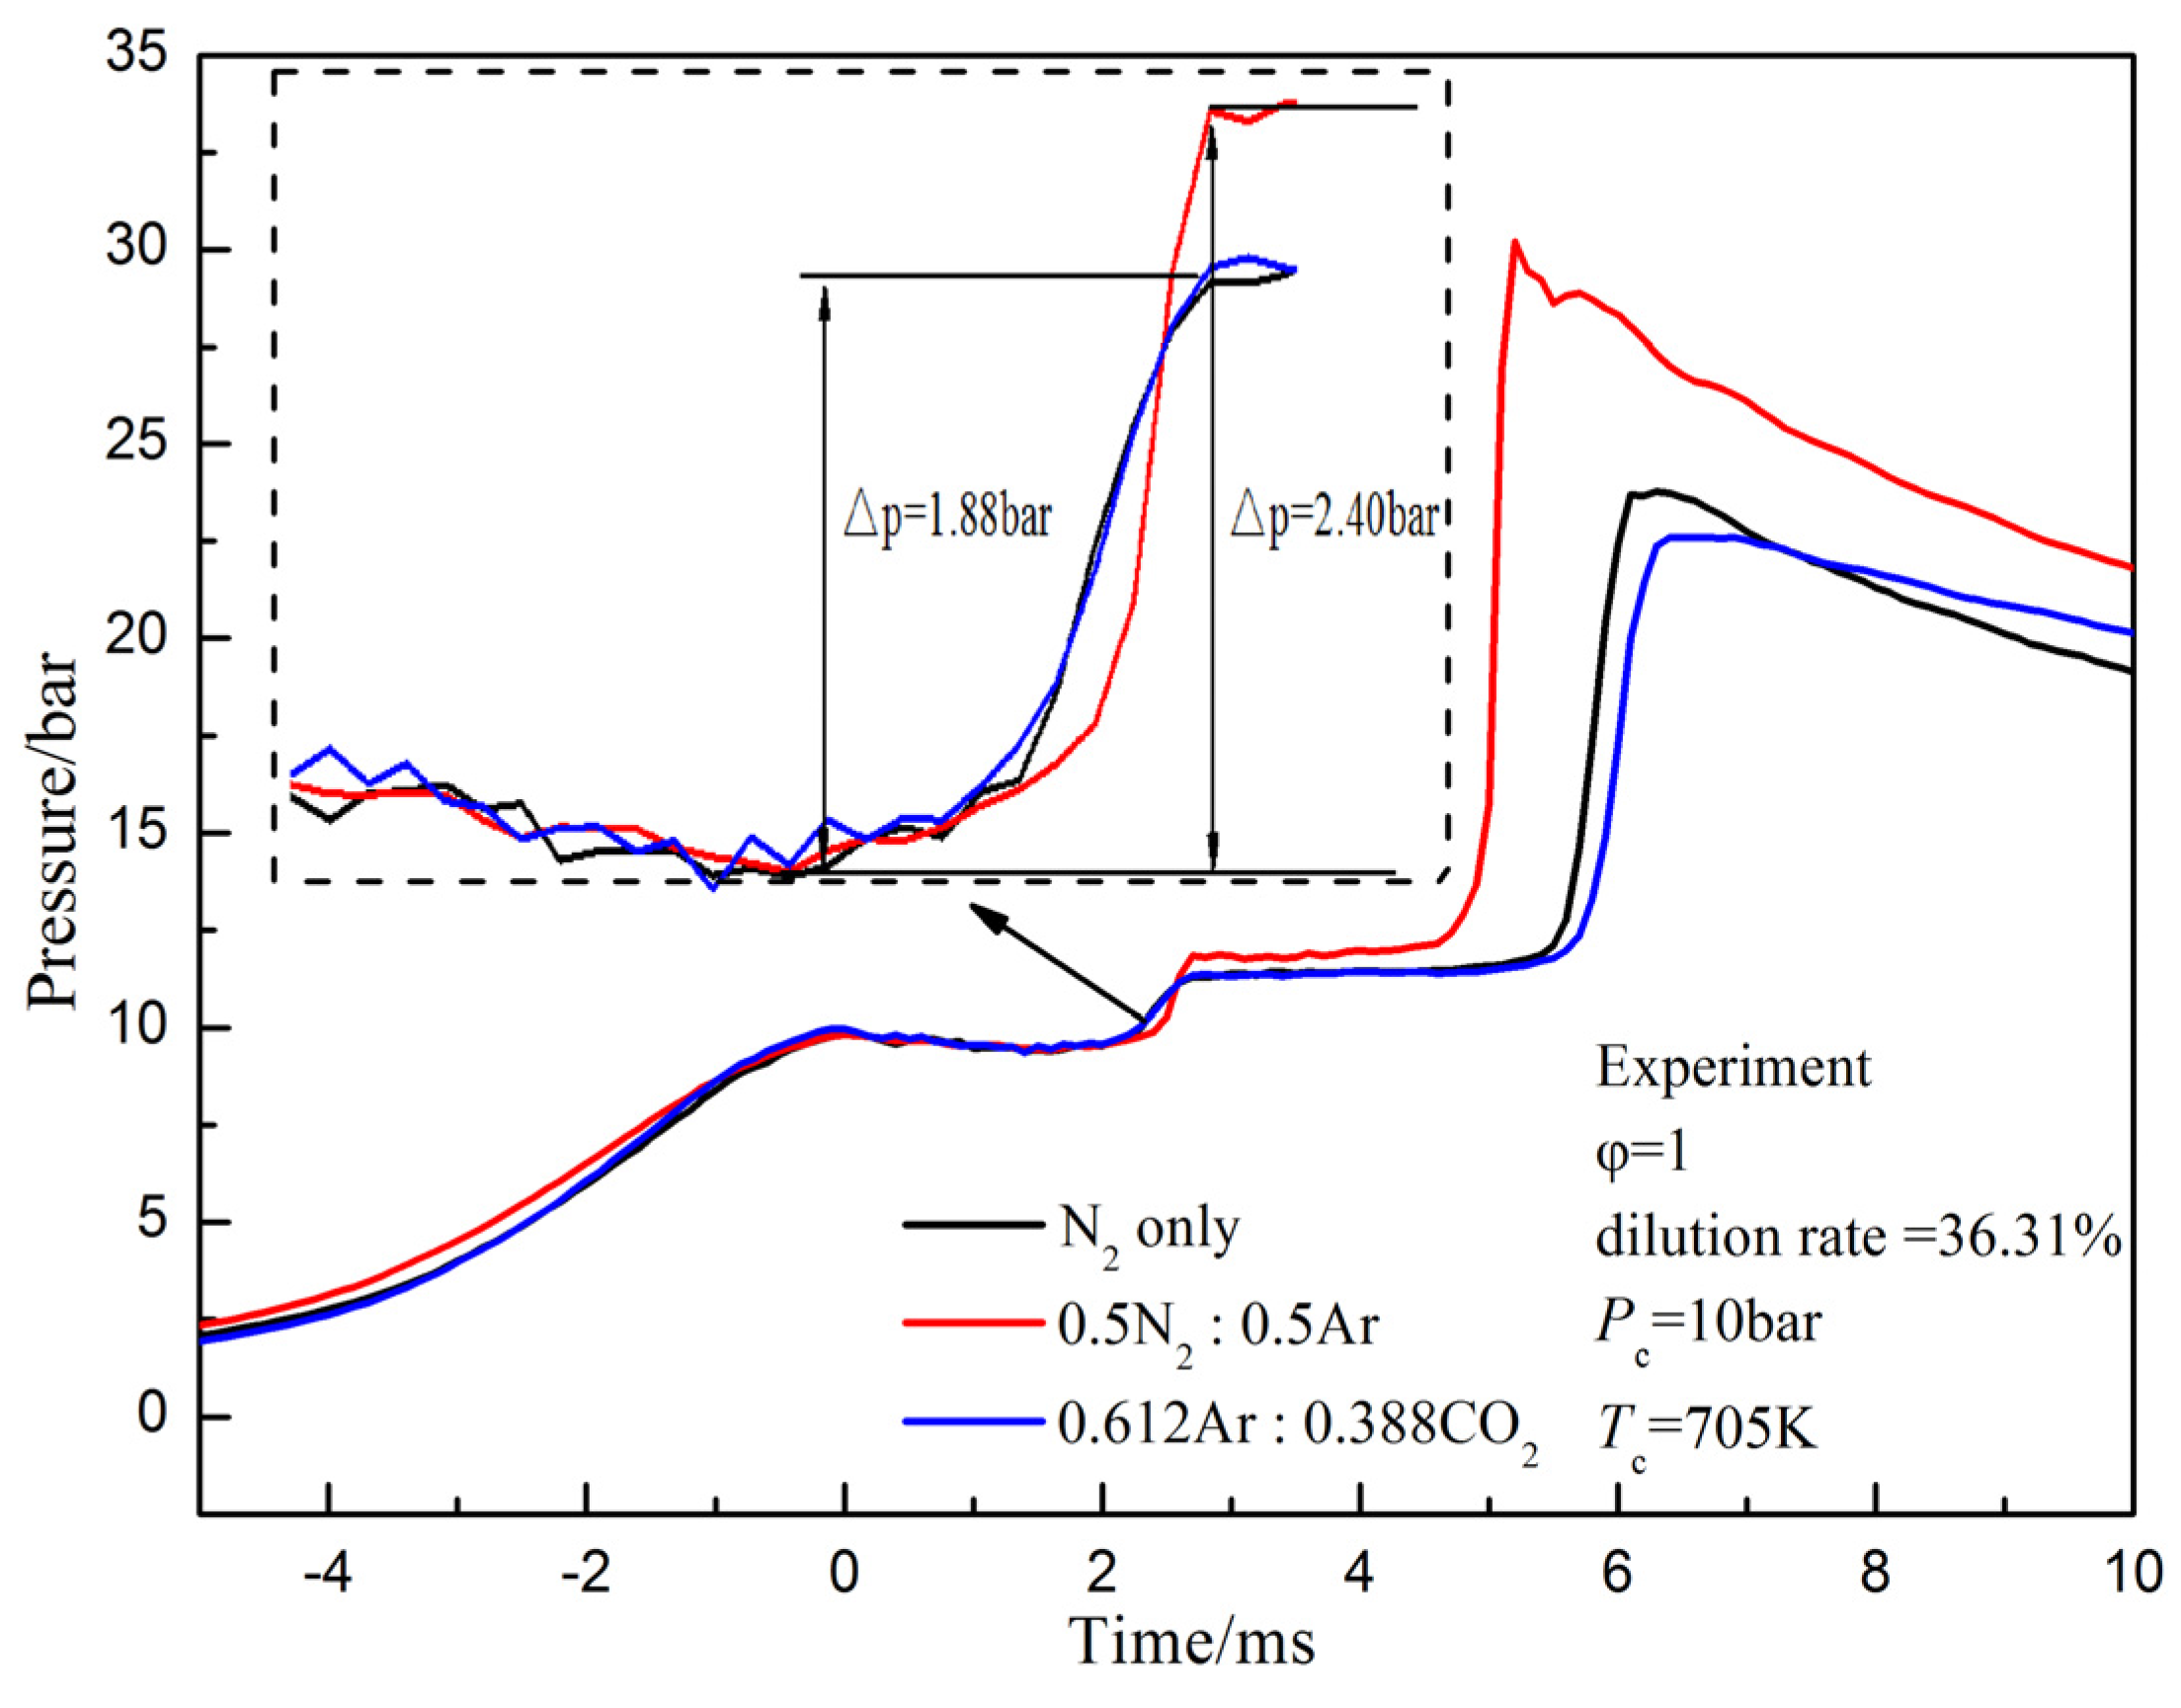
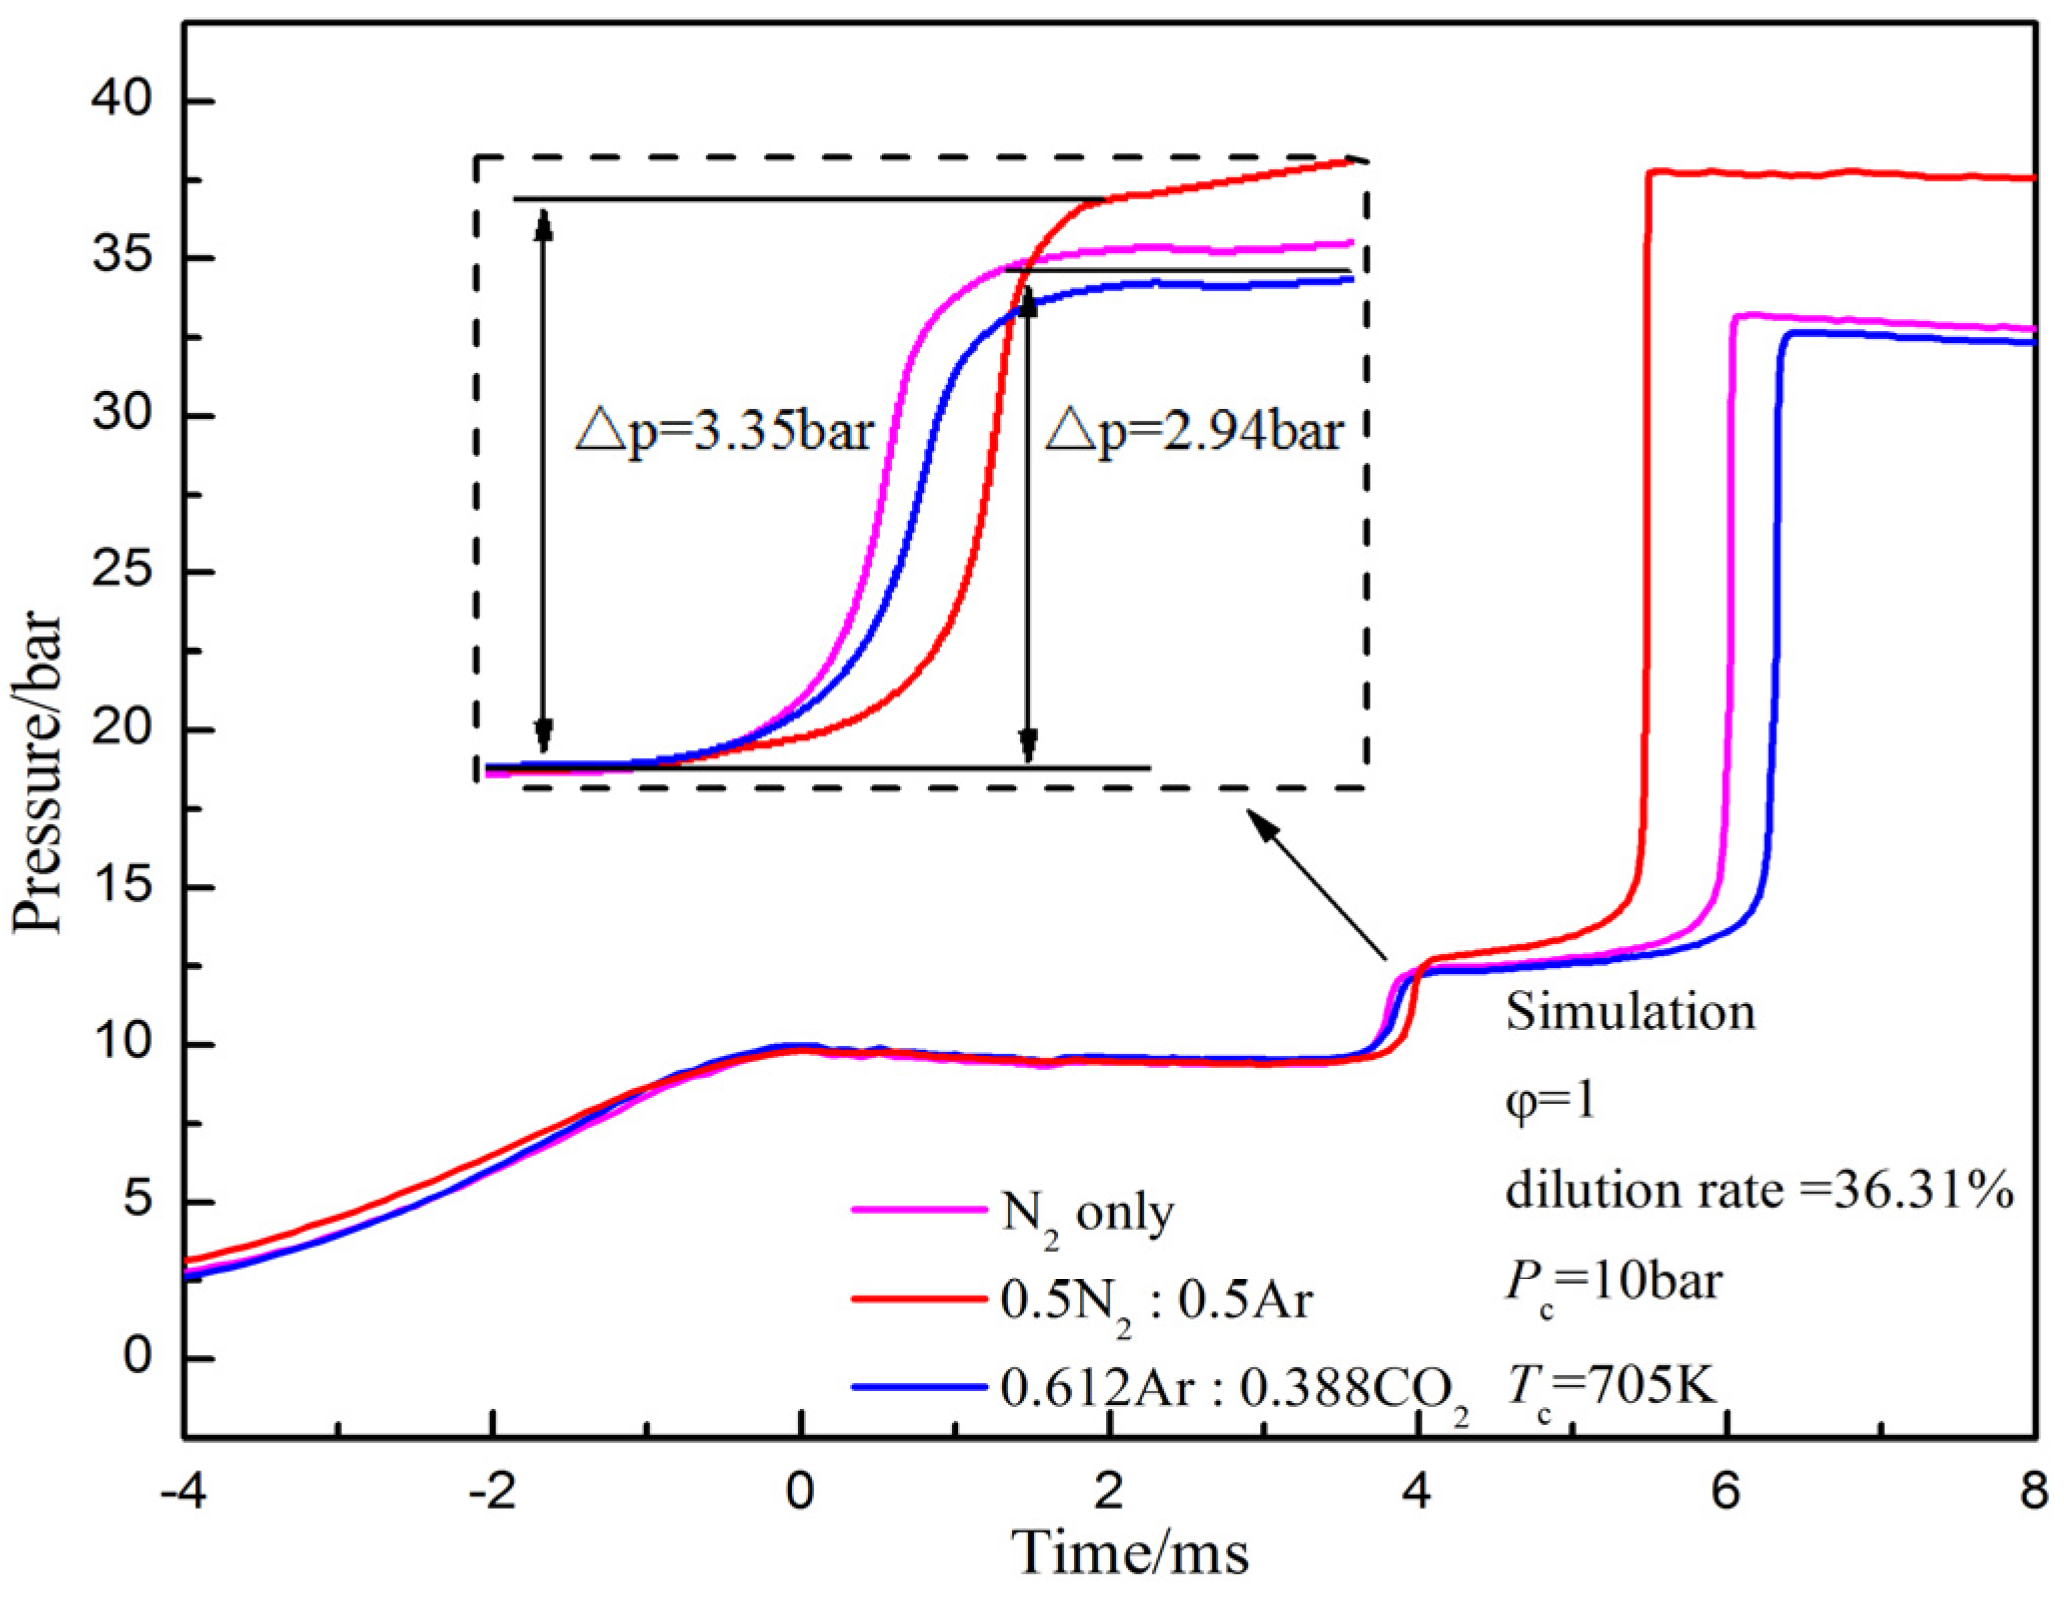
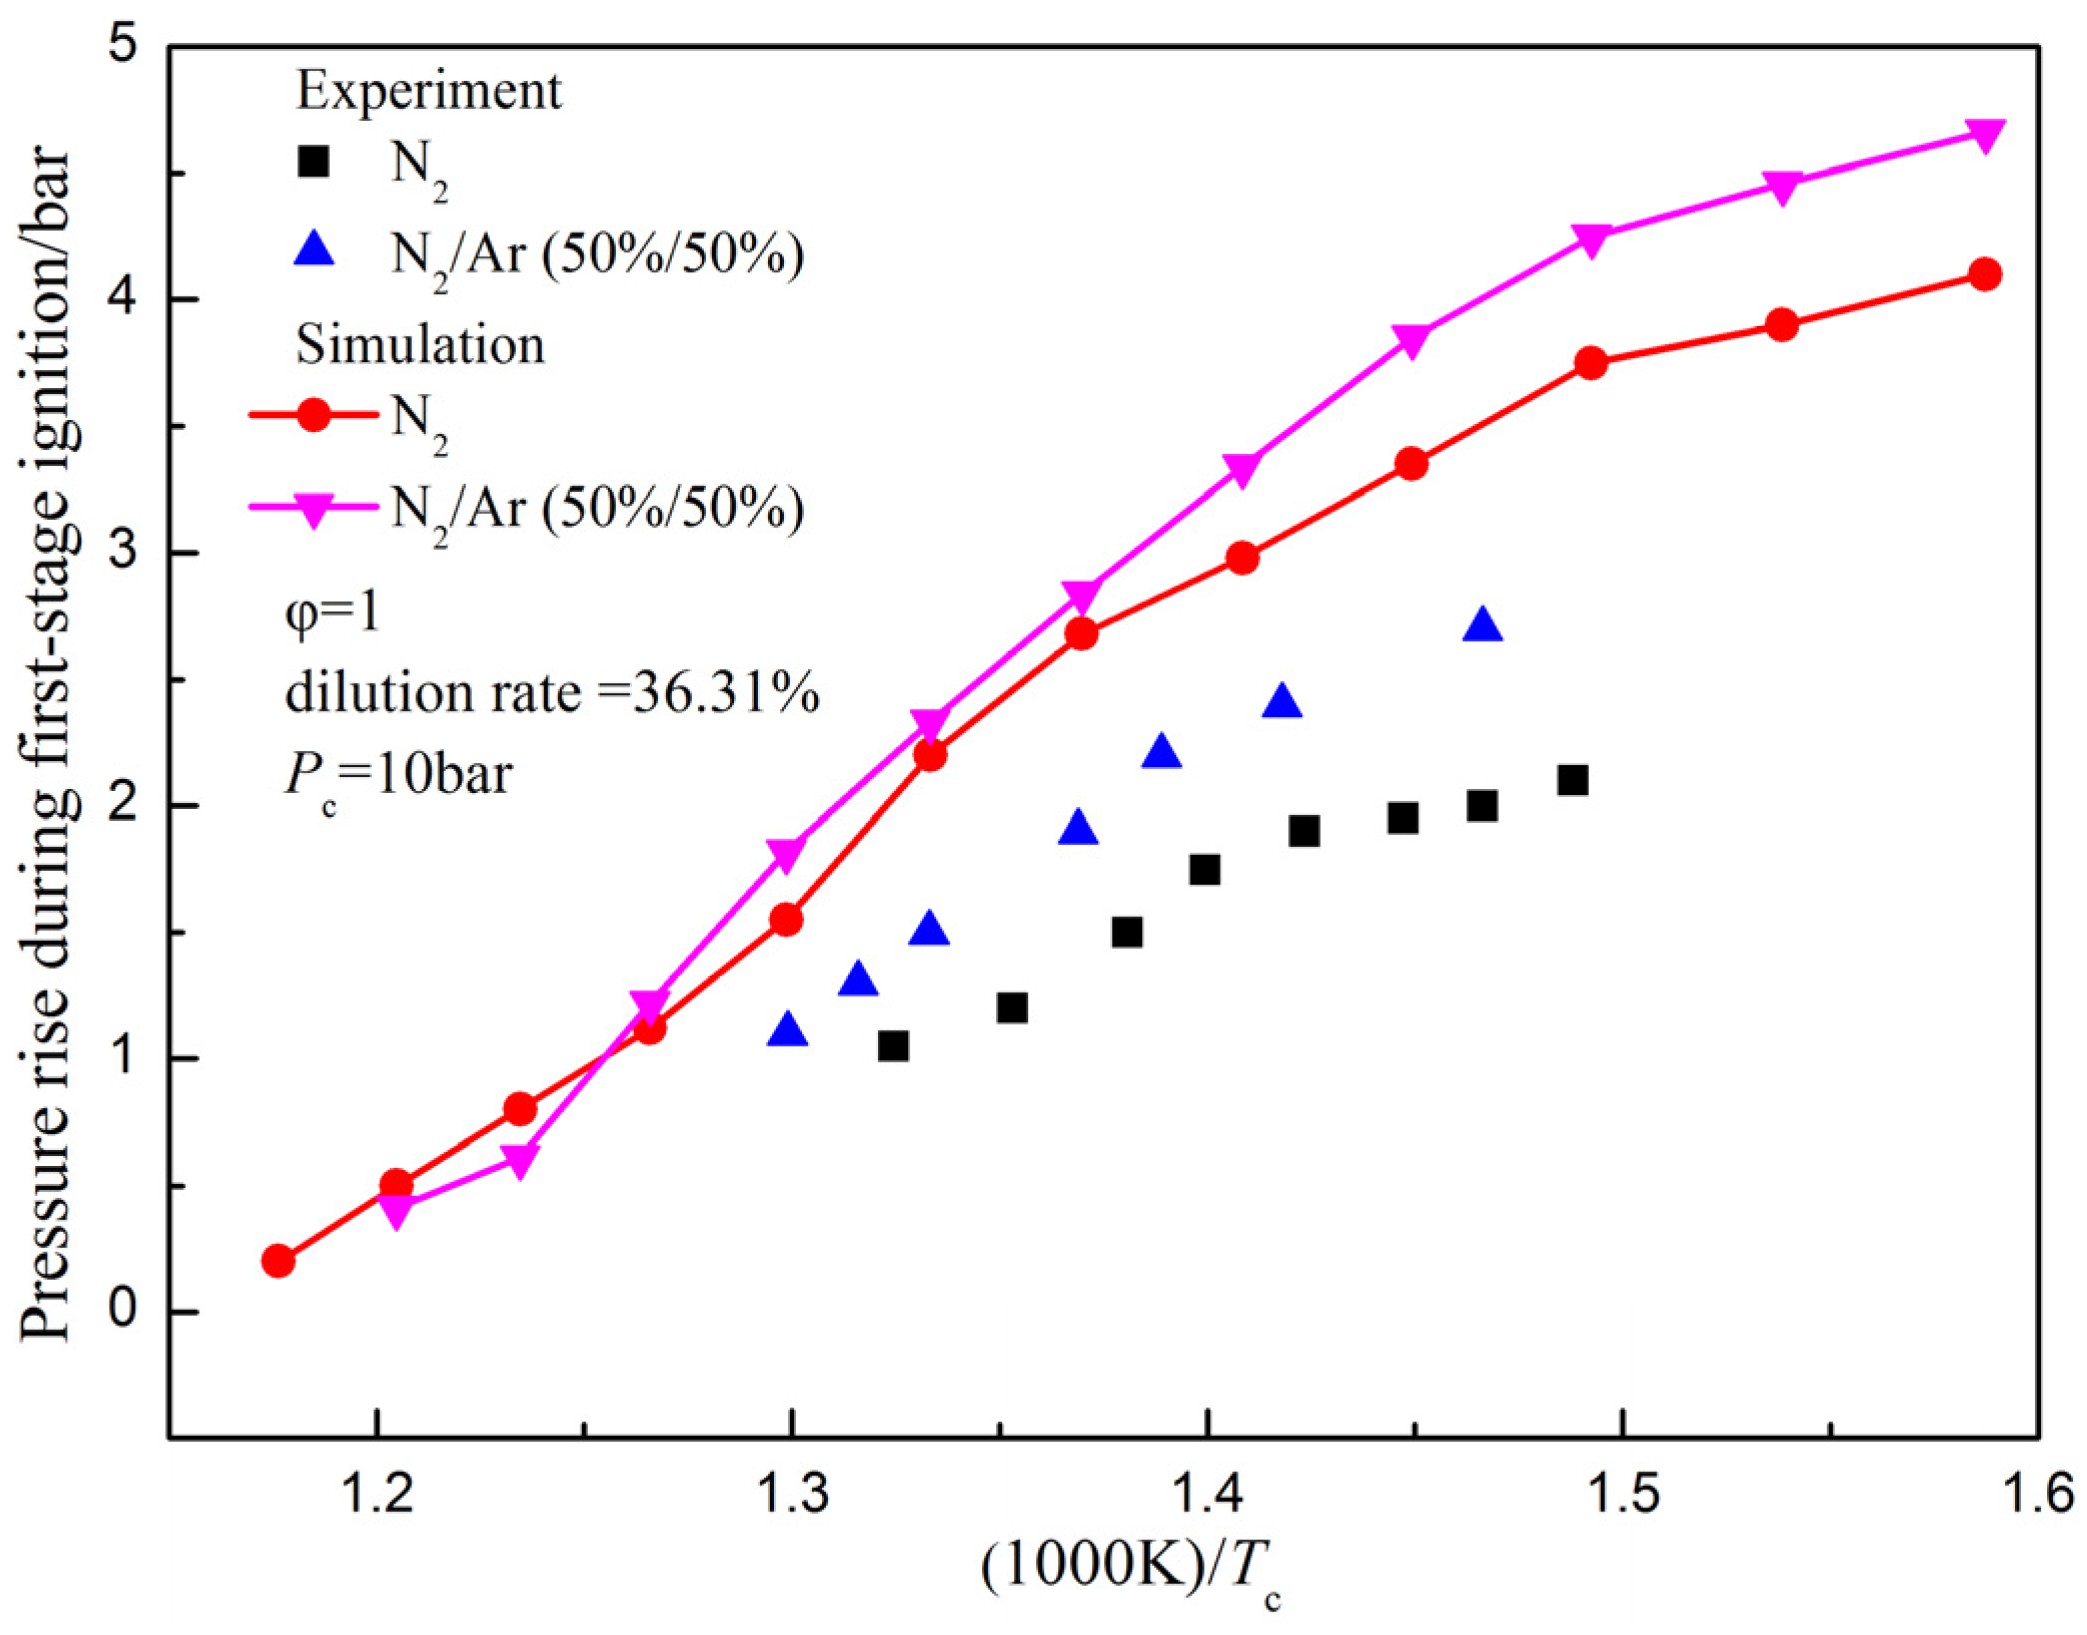
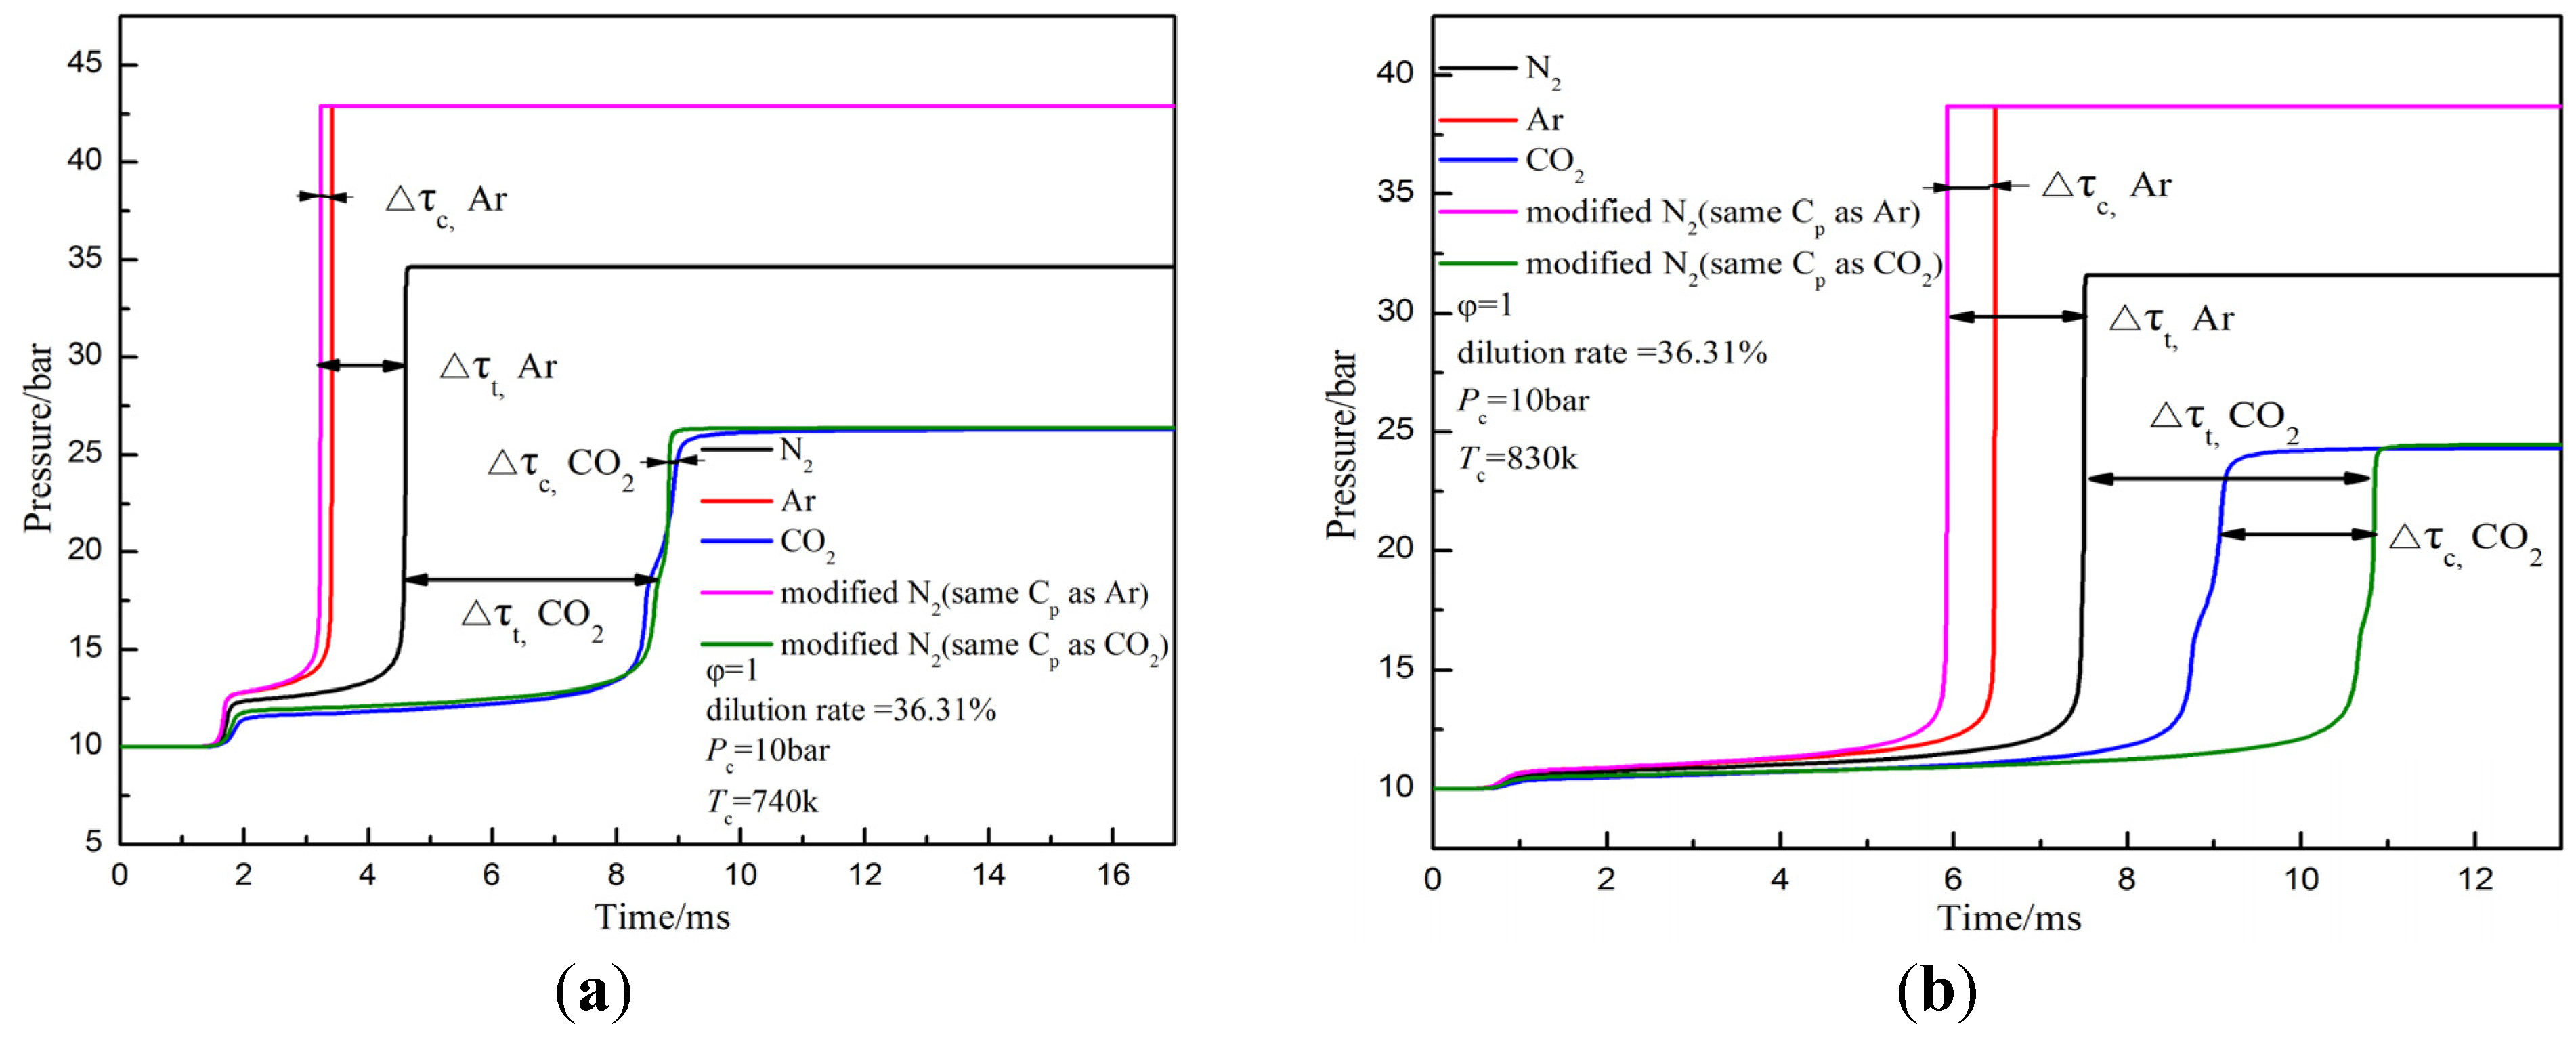
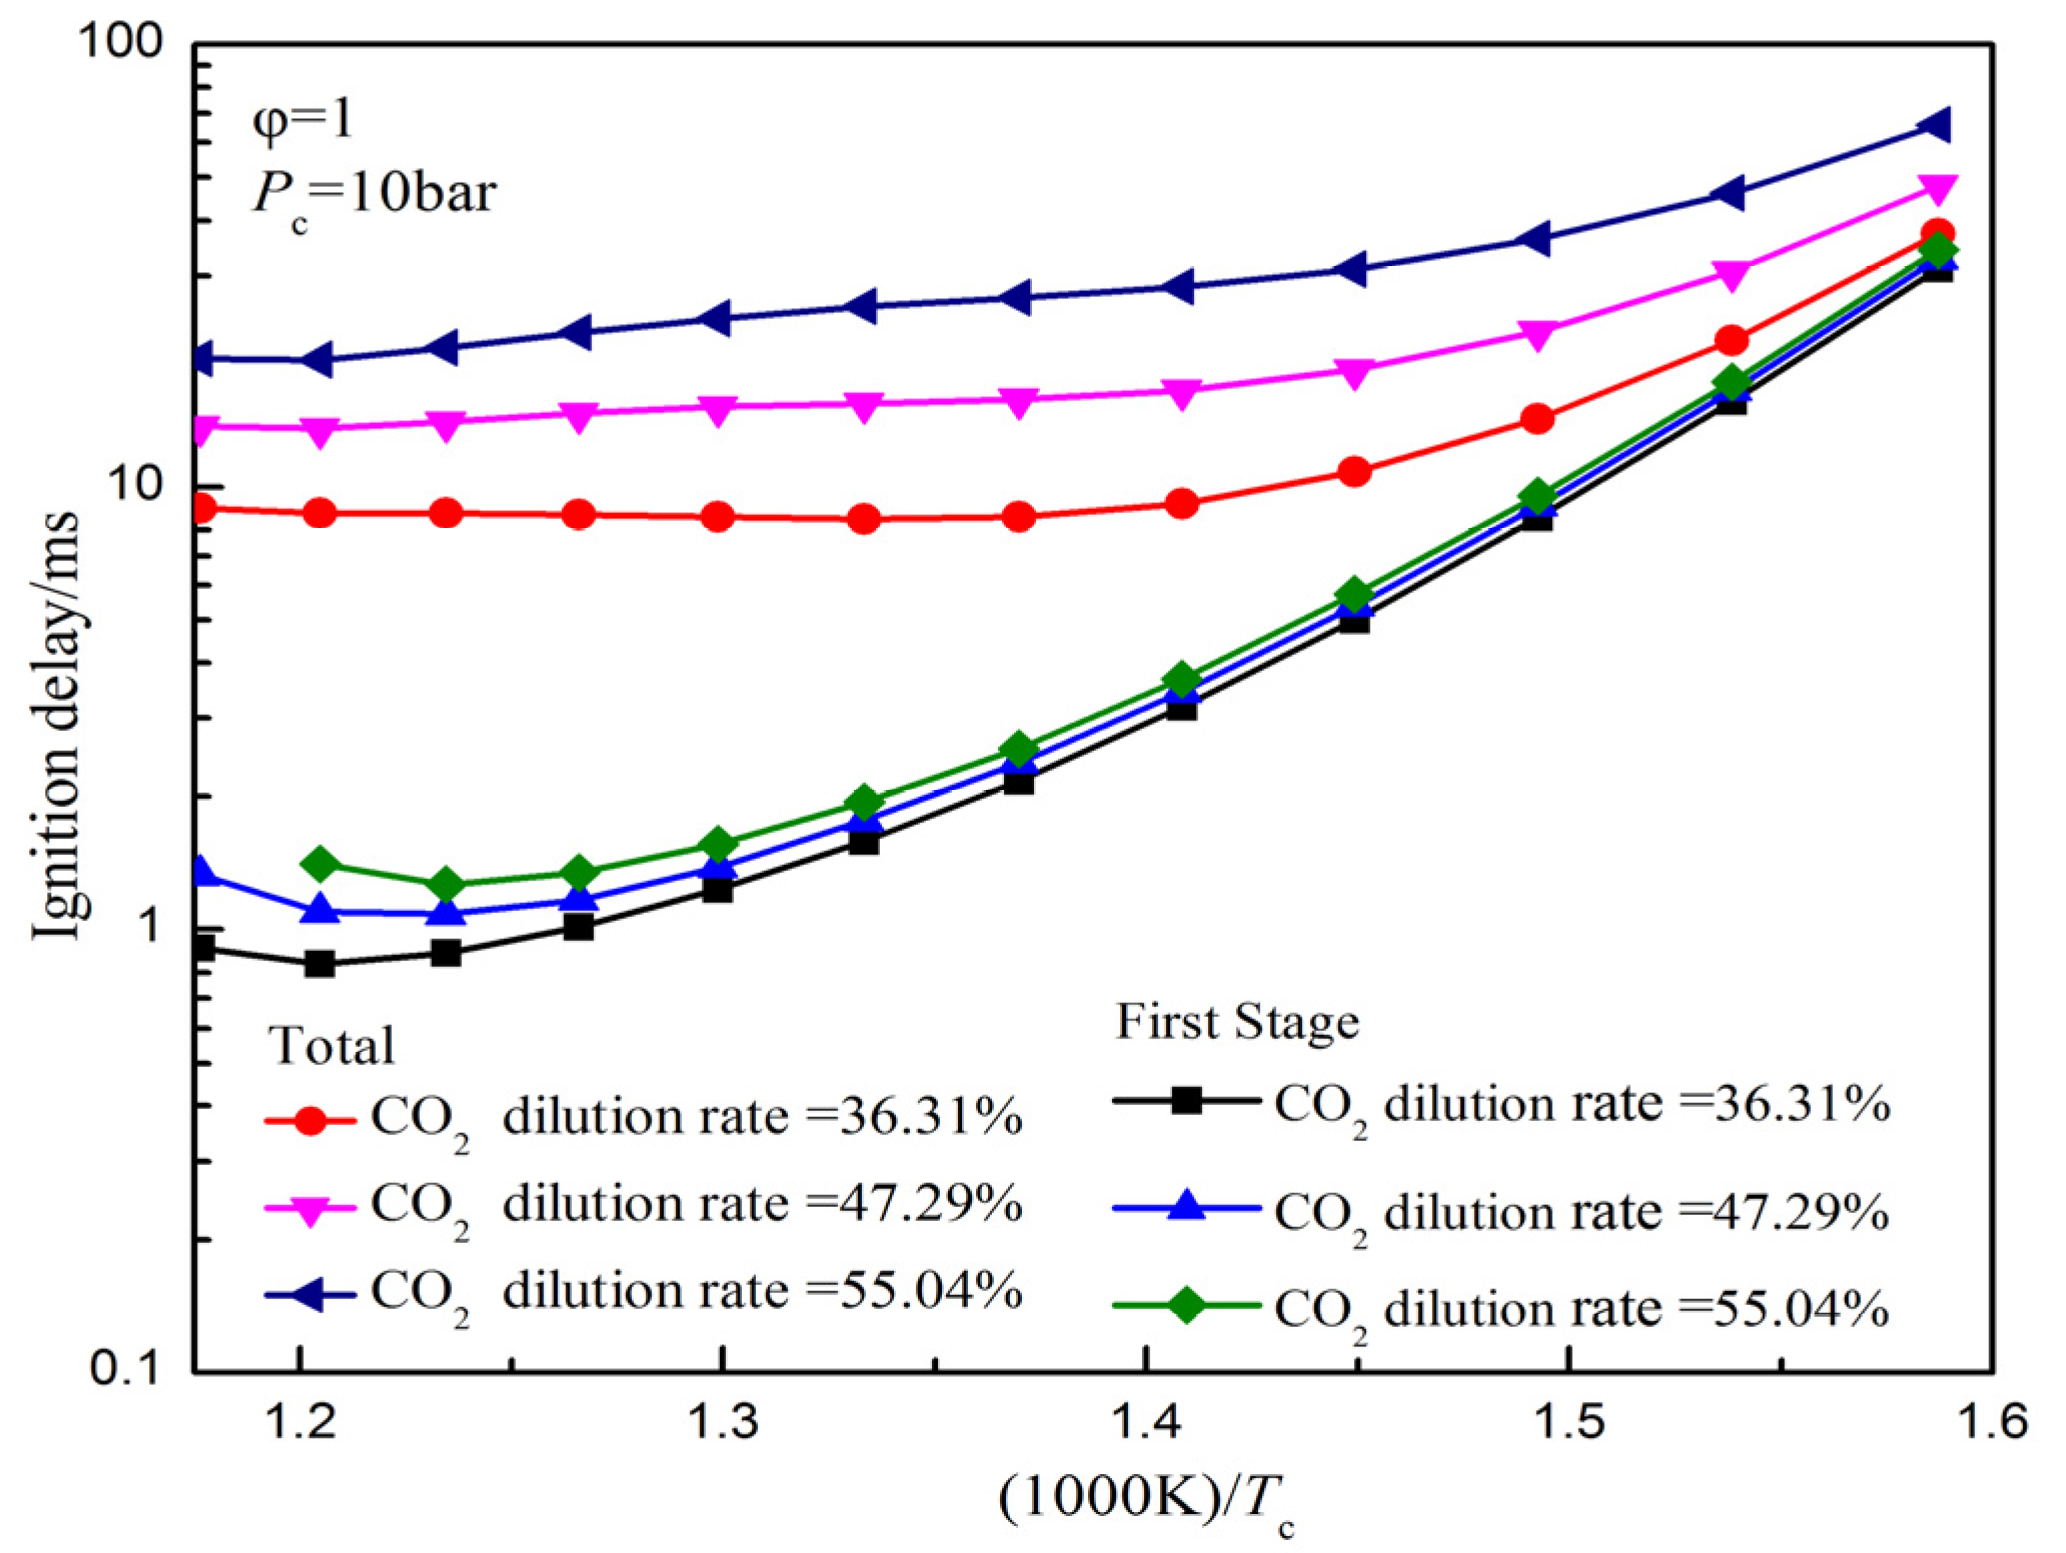
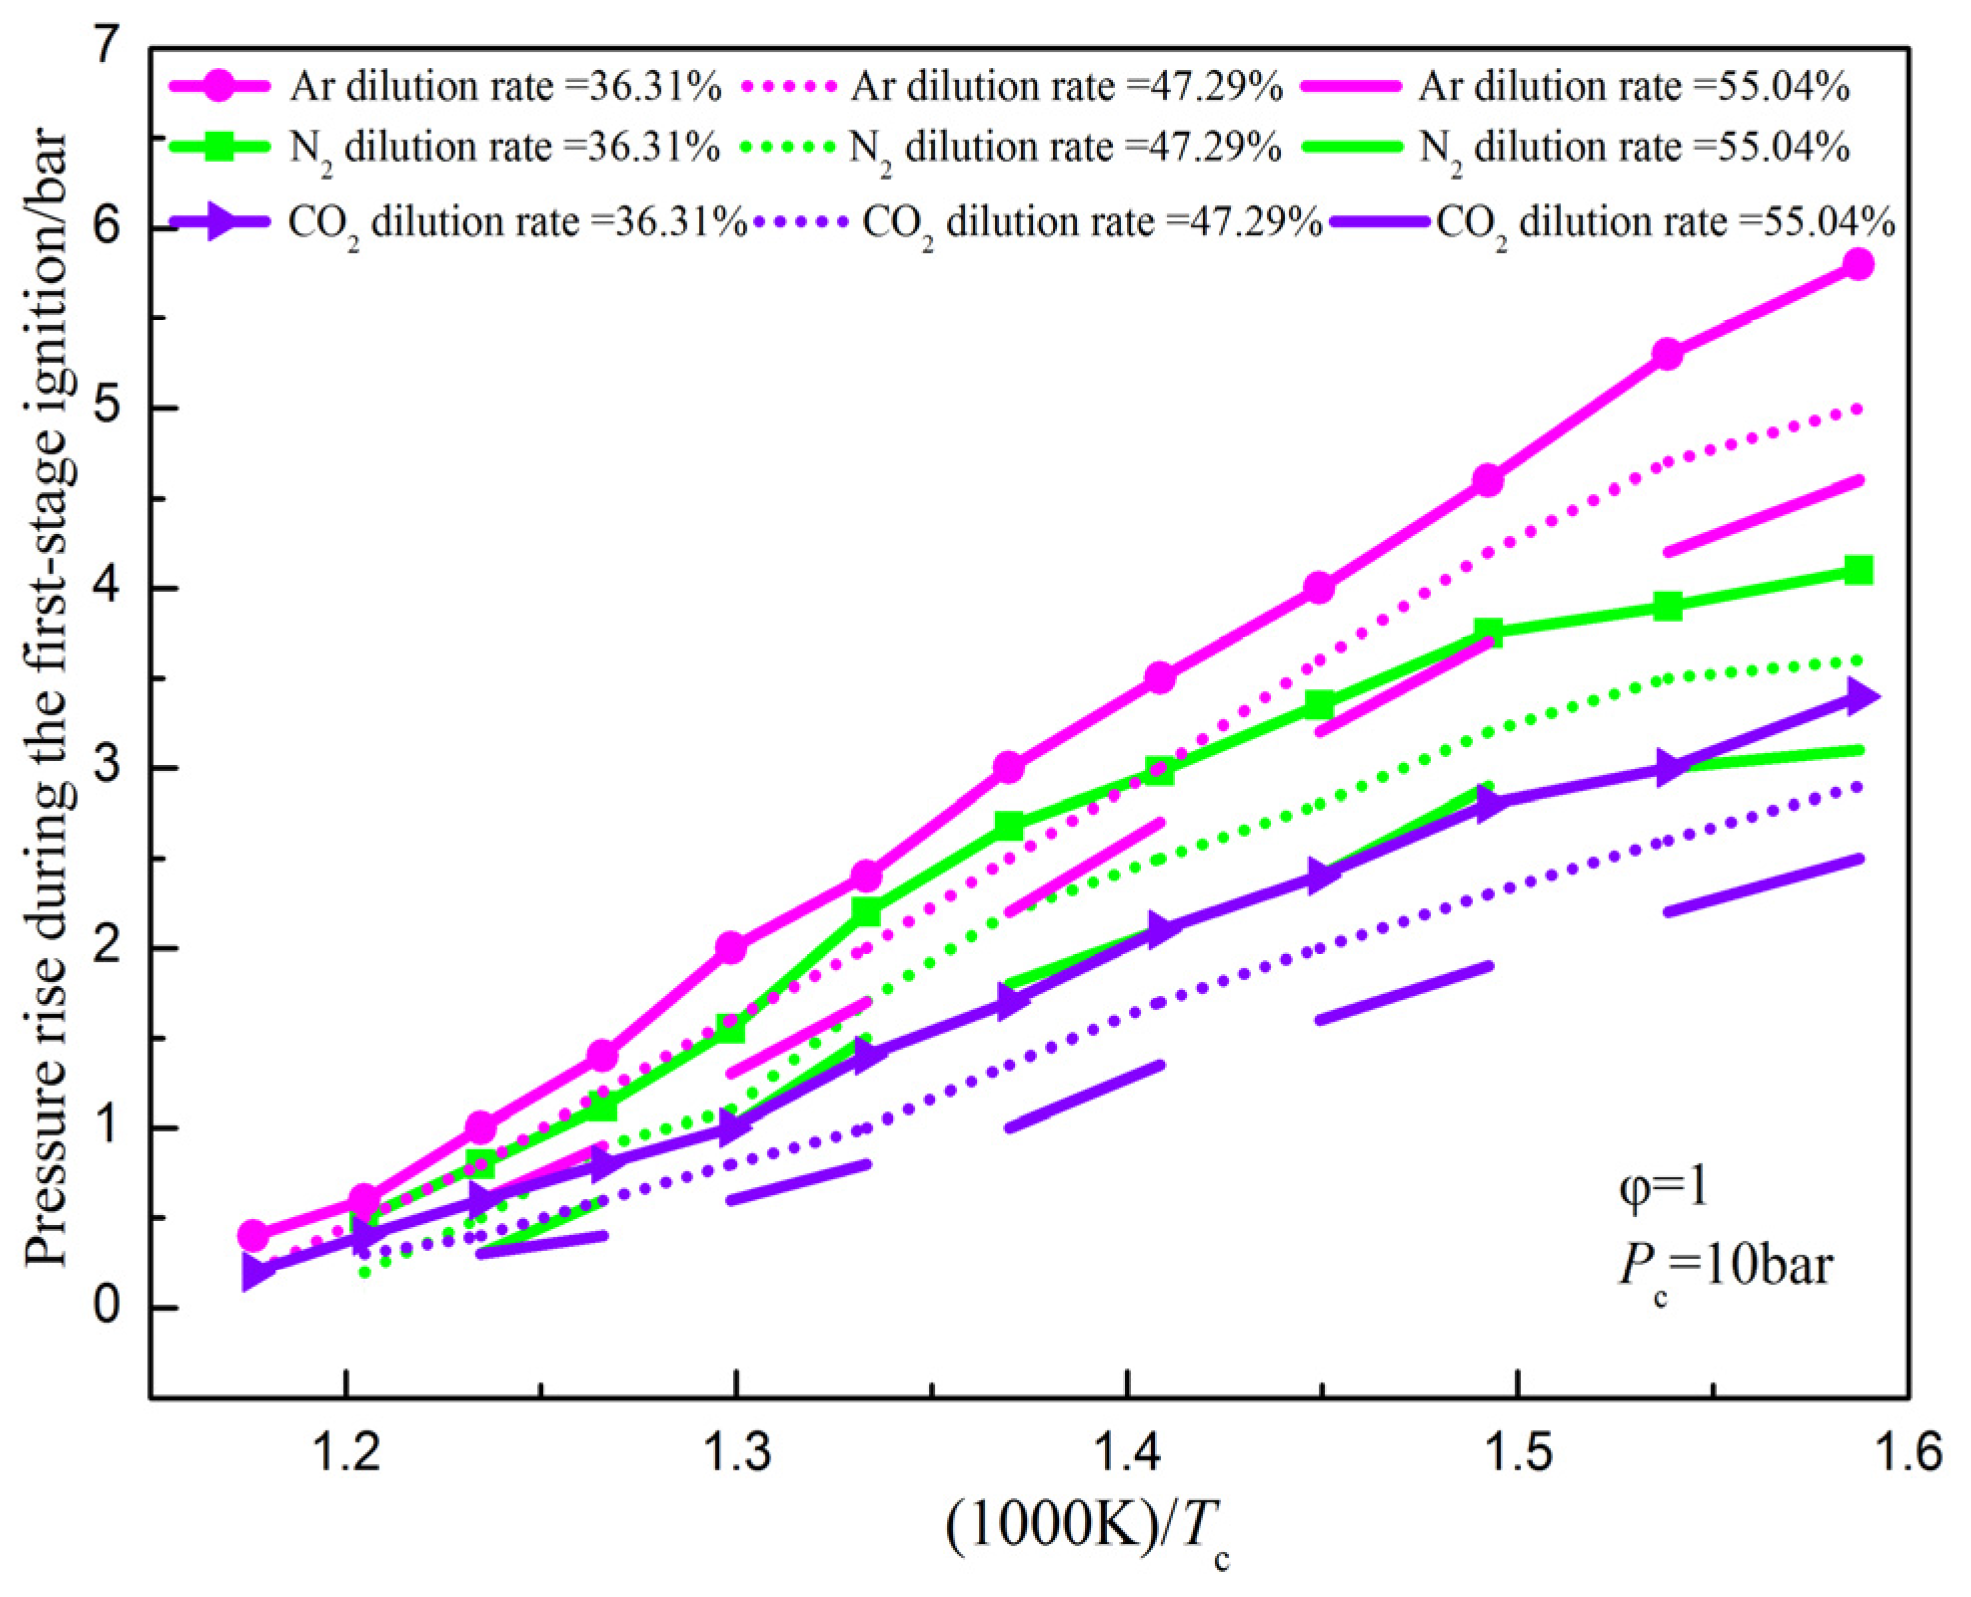
- With increasing buffer gas dilution ratio, the first-stage ignition delay slightly increases, but the total ignition delay has a significant increase due to the differences in heat release during first-stage ignition for different dilution ratios. The NTC behavior of total ignition delay becomes more pronounced at a high dilution ratio. The heat release during the first-stage ignition decreases with increasing buffer gas dilution ratio. Moreover, the heat release during first-stage ignition is sensitive to buffer gas composition.
Acknowledgments
Author Contributions
Conflicts of Interest
Nomenclature
| P0 | Initial pressure (bar) |
| T0 | Initial temperature (K) |
| Pc | Compressed pressure (bar) |
| Tc | Compressed temperature (K) |
| Δτt,Ar | Thermal effect index of Ar |
| Δτt,CO2 | Thermal effect index of CO2 |
| Δτc,Ar | Chemical effect index of Ar |
| Δτc,CO2 | Chemical effect index of CO2 |
Greek letters
| φ | Equivalence ratio |
| γ | Ratio of specific heat |
| ε | Compression ratio |
| τ1 | First-stage ignition delay |
| τ2 | Second-stage ignition delay |
| τ | Total ignition delay |
Acronyms
| DME | Dimethyl ether |
| RCM | Rapid compression machine |
| NTC | Negative temperature coefficient |
| EGR | Exhaust gas recirculation |
| ICE | Internal combustion engine |
| HCCI | Homogeneous charge compression ignition |
| PCCI | Premixed charge compression ignition |
| IMEP | Indicated mean effective pressure |
| TDC | Top dead center |
| ST | Shock tube |
References
- Ladommatos, N.; Abdelhalim, S.M.; Zhao, H.; Hu, Z. The effects of carbon dioxide in exhaust gas recirculation on diesel engine emissions. Proc. Inst. Mech. Eng. 1998, 212, 25–42. [Google Scholar] [CrossRef]
- Pierpont, D.A.; Montgomery, D.T.; Reitz, R.D. Reducing particulate and NOx using multiple injections and EGR in a DI diesel. SAE Tech. Pap. 1995. [Google Scholar] [CrossRef]
- Li, W.F.; Liu, Z.C.; Wang, Z.S.; Xu, Y. Experimental investigation of the thermal and diluent effects of EGR components on combustion and NOx emissions of a turbocharged natural gas SI engine. Energy Convers. Manag. 2014, 88, 1041–1050. [Google Scholar] [CrossRef]
- Sjöberg, M.; Dec, J.E. Effects of EGR and its constituents on HCCI autoignition of ethanol. Proc. Combust. Inst. 2011, 33, 3031–3038. [Google Scholar] [CrossRef]
- Al-Qurashi, K.; Lueking, A.D.; Boehman, A.L. The deconvolution of the thermal, dilution, and chemical effects of exhaust gas recirculation (EGR) on the reactivity of engine and flame soot. Combust. Flame 2011, 158, 1696–1704. [Google Scholar] [CrossRef]
- Cairns, A.; Blaxill, H.; Irlam, G. Exhaust gas recirculation for improved part and full load fuel economy in a turbocharged gasoline engine. SAE Tech. Pap. 2006. [Google Scholar] [CrossRef]
- Kiplimo, R.; Tomita, E.; Kawahara, N.; Zhou, S.Y.; Yokobe, S. Effects of injection pressure, timing and EGR on combustion and emissions characteristics of diesel PCCI engine. SAE Tech. Pap. 2011. [Google Scholar] [CrossRef]
- Ladommatos, N.; Abdelhalim, S.M.; Zhao, H.; Hu, Z. The dilution, chemical, and thermal effects of exhaust gas recirculation on diesel engine emissions–Part 2: Effects of carbon dioxide. SAE Tech. Pap. 1996. [Google Scholar] [CrossRef]
- Shen, H.-P.S.; Vanderover, J.; Oehlschlaeger, M.A. A shock tube study of iso-octane ignition at elevated pressures: The influence of diluent gases. Combust. Flame 2008, 155, 739–755. [Google Scholar] [CrossRef]
- Würmel, J.; Silke, E.J.; Curran, H.J.; Ó Conaire, M.S.; Simmie, J.M. The effect of diluent gases on ignition delay times in the shock tube and in the rapid compression machine. Combust. Flame 2007, 151, 289–302. [Google Scholar] [CrossRef]
- Yu, Y.; Vanhove, G.; Griffiths, J.F.; Ferrières, S.D.; Pauwels, J.-F. Influence of EGR and syngas components on the autoignition of natural gas in a rapid compression machine: A detailed experimental study. Energy Fuels 2013, 27, 3988–3996. [Google Scholar] [CrossRef]
- Davidson, D.F.; Hanson, R.K. Interpreting shock tube ignition data. Int. J. Chem. Kinet. 2004, 36, 510–523. [Google Scholar] [CrossRef]
- Wagnon, S.W.; Wooldridge, M.S. Effects of buffer gas composition on autoignition. Combust. Flame 2014, 161, 898–907. [Google Scholar] [CrossRef]
- Arcoumanis, C.; Bae, C.; Crookes, R.; Kinoshita, E. The potential of di-methyl ether (DME) as an alternative fuel for compression-ignition engines: A review. Fuel 2008, 87, 1014–1030. [Google Scholar] [CrossRef]
- Chen, Z.Y.; Tang, C.L.; Fu, J.; Jiang, X.; Li, Q.Q.; Wei, L.J.; Huang, Z.H. Experimental and numerical investigation on diluted DME flames: Thermal and chemical kinetic effects on laminar flame speeds. Fuel 2012, 102, 567–573. [Google Scholar] [CrossRef]
- Zhang, B.; Shen, X.B.; Pang, L. Effects of argon/nitrogen dilution on explosion and combustion characteristics of dimethyl ether-air mixtures. Fuel 2015, 159, 646–652. [Google Scholar] [CrossRef]
- Jamsran, N.; Lim, O.; Iida, N. A computational study of the effects of EGR and intake-pressure boost on DME autoignition characteristics over wide ranges of engine speed. SAE Int. J. Fuels Lubr. 2014, 7, 207–223. [Google Scholar] [CrossRef]
- Zhao, Y.W.; Wang, Y.; Li, D.C.; Lei, X.; Liu, S.H. Combustion and emission characteristics of a DME (dimethyl ether)-diesel dual fuel premixed charge compression ignition engine with EGR (exhaust gas recirculation). Energy 2014, 72, 608–617. [Google Scholar] [CrossRef]
- Pedersen, T.D.; Schramm, J.; Yanai, T.; Sato, Y. Controlling the heat release in HCCI combustion of DME with methanol and EGR. SAE Tech. Pap. 2010. [Google Scholar] [CrossRef]
- Liu, D.; Santner, J.; Togbé, C.; Felsmann, D.; Koppmann, J.; Lackner, A.; Yang, X.L.; Shen, X.B.; Ju, Y.G.; Kohse-Höinghaus, K. Flame structure and kinetic studies of carbon dioxide-diluted dimethyl ether flames at reduced and elevated pressures. Combust. Flame 2013, 160, 2654–2668. [Google Scholar] [CrossRef]
- Li, Z.H.; Wang, W.J.; Huang, Z.; Oehlschlaeger, M.A. Dimethyl ether autoignition at engine-relevant conditions. Energy Fuels 2013, 27, 2811–2817. [Google Scholar] [CrossRef]
- Liu, H.; Zhang, H.G.; Shi, Z.C.; Lu, H.T.; Zhao, G.Y.; Yao, B.F. Performance characterization and auto-ignition performance of a rapid compression machine. Energies 2014, 7, 6083–6104. [Google Scholar] [CrossRef]
- Werler, M.; Cancino, L.R.; Schiessl, R.; Maas, U.; Schulz, C.; Fikri, M. Ignition delay times of diethyl ether measured in a high-pressure shock tube and a rapid compression machine. Proc. Combust. Inst. 2015, 35, 259–266. [Google Scholar] [CrossRef]
- Lee, D.; Hochgreb, S. Rapid compression machines: Heat transfer and suppression of corner vortex. Combust. Flame 1998, 114, 531–545. [Google Scholar] [CrossRef]
- Affleck, W.S.; Thomas, A. An opposed piston rapid compression machine for preflame reaction studies. Proc. Inst. Mech. Eng. 1968, 183, 365–387. [Google Scholar] [CrossRef]
- Gupta, S.B.; Bihari, B.; Sekar, R.; Klett, G.M.; Ghaffarpour, M. Ignition characteristics of methane-air mixtures at elevated temperatures and pressures. SAE Tech. Pap. 2005. [Google Scholar] [CrossRef]
- Allen, C.; Mittal, G.; Sung, C.-J.; Toulson, E.; Lee, T. An aerosol rapid compression machine for studying energetic-nanoparticle-enhanced combustion of liquid fuels. Proc. Combust. Inst. 2011, 33, 3367–3374. [Google Scholar] [CrossRef]
- Sung, C.-J.; Curran, H.J. Using rapid compression machines for chemical kinetic studies. Prog. Energy Combust. Sci. 2014, 44, 1–18. [Google Scholar] [CrossRef]
- Di Sante, R. Measurements of the auto-ignition of n-heptane/toluene mixture using a rapid compression machine. Combust. Flame 2012, 159, 55–63. [Google Scholar] [CrossRef]
- Mittal, G.; Sung, C.-J. A rapid compression machine for chemical kinetics studies at elevated pressures and temperatures. Combust. Sci. Tech. 2007, 179, 497–530. [Google Scholar] [CrossRef]
- Zhao, Z.W.; Chaos, M.; Kazakov, A.; Dryer, F.L. Thermal decomposition reaction and a comprehensive kinetic model of dimethyl ether. Int. J. Chem. Kinet. 2008, 40, 1–18. [Google Scholar] [CrossRef]
- Dagaut, P.; Boettner, J.-C.; Cathonnet, M. Chemical kinetic study of dimethylether oxidation in a jet stirred reactor from 1 to 10 ATM: Experiments and kinetic modeling. Symp. Int. Combust. 1996, 26, 627–632. [Google Scholar] [CrossRef]
- Pan, L.; Hu, E.J.; Tian, Z.M.; Yang, F.Y.; Huang, Z.H. Experimental and kinetic study on ignition delay times of dimethyl ether at high temperatures. Energy Fuels 2015, 29, 3495–3506. [Google Scholar] [CrossRef]
- Daly, C.A.; Simmie, J.M.; Würmel, J.; Djebaïli, N.; Paillard, C. Burning velocities of dimethyl ether and air. Combust. Flame 2001, 125, 1329–1340. [Google Scholar] [CrossRef]
- Mittal, G.; Chaos, M.; Sung, C.-J.; Dryer, F.L. Dimethyl ether autoignition in a rapid compression machine: Experiments and chemical kinetic modeling. Fuel Process. Technol. 2008, 89, 1244–1254. [Google Scholar] [CrossRef]
- Di, H.S.; He, X.; Zhang, P.; Wang, Z.; Wooldridge, M.S.; Law, C.K.; Wang, C.P.; Shuai, S.J.; Wang, J.X. Effects of buffer gas composition on low temperature ignition of iso-octane and n-heptane. Combust. Flame 2014, 161, 2531–2538. [Google Scholar] [CrossRef]
- Wang, Y.; Yang, Z.; Yang, X.; Han, D.; Huang, Z.; Lu, X.C. Experimental and modeling studies on ignition delay times of methyl hexanoate/n-butanol blend fuels at elevated pressures. Energy Fuels 2014, 28, 5515–5522. [Google Scholar] [CrossRef]
- Guang, H.Y.; Yang, Z.; Huang, Z.; Lu, X.C. Experimental study of n-heptane ignition delay with carbon dioxide addition in a rapid compression machine under low-temperature conditions. Chin. Sci. Bull. 2012, 57, 3953–3960. [Google Scholar] [CrossRef]
© 2015 by the authors; licensee MDPI, Basel, Switzerland. This article is an open access article distributed under the terms and conditions of the Creative Commons Attribution license (http://creativecommons.org/licenses/by/4.0/).
Share and Cite
Shi, Z.; Zhang, H.; Liu, H.; Lu, H.; Li, J.; Gao, X. Effects of Buffer Gas Composition on Autoignition of Dimethyl Ether. Energies 2015, 8, 10198-10218. https://doi.org/10.3390/en80910198
Shi Z, Zhang H, Liu H, Lu H, Li J, Gao X. Effects of Buffer Gas Composition on Autoignition of Dimethyl Ether. Energies. 2015; 8(9):10198-10218. https://doi.org/10.3390/en80910198
Chicago/Turabian StyleShi, Zhicheng, Hongguang Zhang, Hao Liu, Haitao Lu, Jiazheng Li, and Xiang Gao. 2015. "Effects of Buffer Gas Composition on Autoignition of Dimethyl Ether" Energies 8, no. 9: 10198-10218. https://doi.org/10.3390/en80910198
APA StyleShi, Z., Zhang, H., Liu, H., Lu, H., Li, J., & Gao, X. (2015). Effects of Buffer Gas Composition on Autoignition of Dimethyl Ether. Energies, 8(9), 10198-10218. https://doi.org/10.3390/en80910198