Article

Numerical Simulation Research on the Process of Reburning South American Coal and Cornstalk

1
School of Energy and Environmental Engineering, Hebei University of Technology, 5340#, Xiping Road, Shuangkou Town, Beichen District, Tianjin 300401, China
2
School of Chemical Engineering and Technology, Tianjin University, 92#, Weijin Road, Nankai District, Tianjin 300072, China
3
School of Chemical and Process Engineering, Engineering Building, University of Leeds, Leeds LS2 9JT, UK
*
Authors to whom correspondence should be addressed.
Energies 2015, 8(9), 9434-9451; https://doi.org/10.3390/en8099434
Submission received: 20 May 2015 / Revised: 22 August 2015 / Accepted: 24 August 2015 / Published: 1 September 2015

Abstract

:
Photo-chemical smog and acid rain formed from many pollutants including NOx are serious problems that have attracted much attention due to their negative influences on the atmosphere, plants, animals and even building materials. Effective measures of controlling NOx emissions are necessary. In this study, a computational fluid dynamics (CFD) software, Ansys Fluent 14.5, has been applied to research the processes of South American coal (SAm) reburning and cornstalk reburning. The influences of reburn zone excess air coefficient, reburning fuel fraction (Rff) and the secondary air temperature on the furnace combustion and NOx reduction have been determined. Results show that, in the simulated data range, the lower reburn zone excess air coefficient, the greater the rate of denitration for both SAm reburning and cornstalk reburning. The highest rates of denitration for SAm reburning and cornstalk reburning were 56.15% and 66.89%, respectively, in comparison to the conventional combustion. The denitration rate increases with the increase of reburning fuel fraction. However, when the reburning fuel fraction increases beyond a certain level, fuels within the furnace will undergo incomplete combustion. Under the premise of the fuel burnout, a relatively good case occurs at the reburning fuel fraction of 20% for the two kinds of reburning, and the NOx removal rate is 60.57% for cornstalk reburning, which is 7.61% higher than that of the SAm reburning. Temperature also has certain influences on the denitration effect and it shows that, in the lower temperature range, the higher the temperature of the secondary air, the higher the denitration rate. However, as temperature reaches a certain value, the denitration effect is no longer enhanced but reduced. For the two kinds of reburning, the case with the secondary air at 500 K is a relatively good one, and the NOx removal rate reaches 66.36% for cornstalk reburning, while it is 55% for SAm reburning. Overall, cornstalk reburning provides a higher NOx reduction rate in comparison to SAm reburning.

Graphical Abstract

1. Introduction

Fuel reburning is one of the most promising NOx control technologies [1]. In the past few years, a lot of scholars have dedicated themselves to gas reburning and found that using gas as reburning fuel could decrease the NOx emissions to a certain extent [2,3,4,5,6], but the rise of gas prices inevitably restricts the utilization of gas reburning [7]. Therefore, currently more and more scholars have turned to studying solid fuel reburning and have found that it is more promising than gas reburning in denitration [8,9,10,11,12,13,14]. In the combustion process, mechanisms of the formation and reduction of NOx are extremely crucial and have been studied extensively [15,16,17,18,19]. Julien Cances [20] conducted experiments and modelling with four major solid fuels to identify the difference in the contributions of volatile matters and char to the NOx reduction, and found that for a short initial residence time, volatiles contribute more to the NOx reduction than char, and that after the short initial residence time, char contributes more. The influence of different factors (hydrocarbons, homogenous reactions, heterogeneous reactions, particle size, dried sludge, ash, etc.) on coal reburning has been well characterised by previous authors [21,22,23,24,25,26,27,28]. Although many experimental and simulation studies regarding the reburning process have been conducted, further study on solid fuel reburning needs to be done, especially on the reburning fuel which is quite different from the primary fuel. In this paper, a simplified combustor is introduced from the PC combustor as described by Nimmo and Singh [29] to simulate the process of South American coal (SAm) reburning and cornstalk reburning, which are compared with conventional combustion, respectively. With the reburning technique, the combustion process includes three stages which are called primary zone, reburn zone and burnout zone, as shown in Figure 1. Four cross baffles are set in the burner to ensure the secondary air swirl which benefits the mixing process of the primary and secondary air. The SAm and primary air with an appropriate velocity pass through the primary air inlet and then mix with the secondary air. Under the burner, there is a furnace 4 m in length with a cross sectional area of 350 mm2. The reburn zone is located at the height of 1.975 m to 2.770 m of the furnace, and the bottom of the furnace is set as the datum. Fuel and air are introduced from the top of the burner inlets and flow down into the combustor. Reburning fuel inlets and burnout air inlets are located on the furnace to initiate reburning combustion conditions.
Figure 1. Simplified structure of the combustor.
Energies 08 09434 g001
The proximate and ultimate analyses of SAm and cornstalk are presented respectively in Table 1. SAm is derived from the paper written by Singh and Nimmo [30], and cornstalk used in this paper is from Hebei province of China, with its proximate and ultimate analyses provided by the combustion research laboratory of Hebei University of Technology. It shows that the calorific value (CV) of SAm is greater than that of cornstalk, which determines that a higher feed rate of the cornstalk is needed in order to generate the same heat input as the SAm. The proximate analysis reveals a significantly higher volatile content in the cornstalk than that in the SAm. The cornstalk with higher volatile content may be of benefit in the reburning process.
The influences of reburn zone excess air coefficient (α), reburning fuel fraction (Rff), and the secondary air temperature on the denitration effect for both SAm and cornstalk reburning are conducted in this work. The reburning fuel fractions were maintained at 16% with the secondary air temperature at 300 K for cases with different reburn zone excess air coefficients. As for cases with different reburning fuel fractions, the reburn zone excess air coefficients were fixed at 0.93 to ensure the reburning fuel fraction remained positive for all cases with the secondary air temperature at 300 K. In order to study the influence of the secondary air temperature on the reburning process, the Rff was set to 15% with α = 0.9. All reburning cases have the same primary zone excess air coefficient 1.02 and all cases with and without reburning are under the same overall excess air coefficient 1.16. In this paper, the effect of the NOx reduction is expressed by NOx removal rate, η = ( 1 [ NO ] r [ NO ] c ) × 100 % , in which,   [ NO ] c denotes NOx emissions at the outlet in conventional combustion and [ NO ] r represents NOx emissions at the outlet under reburning conditions.
Table 1. South American coal (SAm) and cornstalk fuel analysis. CV: calorific value.
FuelCV (gross) MJ/kgUltimate analysis (wt.%)Proximate analysis (wt.%)
CHONSMAVFC
SAm (ar)2968.044.379.571.430.594.111.933.250.8
Cornstalk (ar)17.236.844.8138.840.720.09108.767.4813.82

2. Mathematical Model

2.1. Combustion Modelling

In this paper, Ansys Fluent 14.5 is applied to simulate the combustion process and its continuity equation is:
div ( ρ g u ) = r g
in which, ρg is the density of the continuous phase, and rg is the change rate from the solid phase to the gas phase by evaporation, pyrolysis and coke combustion.
As for turbulence model, realisable k–ε turbulence model is adopted. The transmission equation of turbulent dissipation rate ε for the realizable k–ε turbulence model is shown as follows:
( ρε ) t + ( ρεu j ) 𝓍 j = 𝓍 j [ ( μ + μ t σ ε ) ε 𝓍 j ] + R 1 ε ε k R 3 ε G b + ρR 1 + S ε ρR 2 ε 2 k + v ε
in which, R 1 = max [ 0.43 , η η + 5 ] , η = S k ε , S =   2 S ij S ij . G b represents the generation of turbulence kinetic energy due to buoyancy. R = 1.44; R2 = 1.9; the turbulent Prandtl number σε = 1.2 and Sε is a user-defined source term.
The momentum equation is:
div ( ρ g u u ) = div [ ( μ + μ t ) grad u ] grad P + div ( μ e grad u ) + S
where μt is the turbulence viscosity coefficient, μ is the laminar viscous coefficient, P is the local pressure, and S is the source term by the effects from the solid phase to the gas phase.
The energy equation is shown as follows:
[ ρ u ( h + u 2 2 ) ] = ( k eff T i h i J 1 ) + S k
where keff is the effective thermal conductivity, and keff = k + kt, in which kt is the turbulence coefficient of thermal conductivity and k is the heat transfer coefficient of the fluid.
As for the radiation heat transfer, P1 method is adopted to model the process of the thermal radiation in the furnace. A transported probability density function (PDF) method developed for pulverized coal combustion is applied in the simulation and non-premixed combustion model is used. Under certain simplifying assumptions, thermal chemical state of the fluid can be expressed by a simple parameter which is called a mixture fraction:
f = Z i Z i , ox Z i , fuel Z i , ox
in which Zi is the mass fraction for element i, and ox represents oxidant flow. Double mixture fraction model is used to simulate the gas phase combustion. There are three mixture fractions, ffuel, fsec and fox, representing the main fuel, reburning fuel, and oxidizer, respectively. The sum of all three mixture fractions in the system is always equal to 1. Interaction between the turbulence and chemical reaction can be expressed by the PDF. The probability density β function is shown as follow:
P ( f ) = f α 1 ( 1 f ) β 1 f α 1 ( 1 f ) β 1 d f
The PDF P(f), describing the temporal fluctuations of f in the turbulent flow, is used to calculate the averaged values of variables that depend on f. Density-weighted mean species mass fractions and temperature can be computed as:
Φ ¯ i = 0 1 0 1 p 1 ( f fuel ) p 2 ( P sec ) Φ i ( f fuel , P sec ) d f fuel d P sec
where p1 is the PDF of ffuel and p2 is the PDF of Psec. Here, statistical independence of ffuel and Psec is assumed, so that:
p ( f fuel , P sec ) = p 1 ( f fuel ) p 2 ( P sec )
Similarly, the mean time-averaged fluid density, ρ ¯ can be calculated as:
1 ρ ¯ = 0 1 0 1 p 1 ( f fuel ) p 2 ( P sec ) ρ ( f fuel , P sec ) d f fuel d P sec
ρ(ffuel, Psec) is the instantaneous density obtained using the instantaneous species mass fractions and temperature in the ideal gas law equation.
Particle-turbulence interaction is simulated by the stochastic particle trajectory model and the two-phase flow of the coal or cornstalk in the furnace is also modelled. The force balance equates the particle inertia with the forces acting on the particle and can be written as:
d u p d t = F D ( u u p ) + g ( ρ p ρ ) ρ p + F
where F is an additional acceleration term. F D ( u u p ) is the drag force per unit particle mass. A kinetic/diffusion-limited model is adopted for the char particle combustion. The mass diffusion-limited rate constant is 5.06 × 10⁻⁴, and the kinetics-limited rate pre-exponential factor in the model is 8.71 × 10³ s−1.
A two-competing-rates method is adopted to simulate the coal devolatilisation and the kinetic devolatilisation rate expressions are shown as follows:
R c 1 = B 1 e ( E 1 / R T P )
R c 2 = B 2 e ( E 2 / R T P )
in which Tp is the particle temperature. Rc1 and Rc2 are competing rates that may control the devolatilisation over different temperature ranges. B1 and B2 are pre-exponential factors for the two rates respectively, and B1 = 3.7 × 10⁵ s−1, B2 = 1.46 × 10¹³ s−1. E1 and E2 represent the activation energy. E1 = 7.46 × 10⁴ J/mol, and E2 = 2.52 × 10⁵ J/mol.

2.2. NOx Formation and Destruction Modelling

In this model, the amount of NO produced in the combustion is characterized using the following steady-state transport equation:
x i ( ρ u i Y NO ) = x i ( ρ D Y NO x i ) + S NO
As the concentration of NO is typically very small compared to the concentrations of the other species of interest in the coal combustion process, the NO transport Equation (13) has commonly been solved for a given combustion flow-field solution. The source term, SNO in Equation (13), is considered as contributions from the following predominant mechanisms: thermal NO, fuel NO, and NO reburning. The partial-equilibrium model is adopted for the reburning model.
As for the fuel NO modelling, the tracking of nitrogen-containing intermediate species is important. Ansys Fluent14.5 is used to solve a transport equation for the HCN and NH3 species:
t ( ρ Y HCN ) + · ( ρ v Y HCN ) = · ( ρ D Y HCN ) + S HCN
t ( ρ Y NH 3 ) + · ( ρ v Y NH 3 ) = · ( ρ D Y NH 3 ) + S NH 3
where YHCN and Y NH 3 are mass fractions of HCN and NH 3 in the gas phase, respectively, and D is the effective diffusion coefficient. SHCN and S NH 3 are source terms.
In the fuel-rich reburn zone, HCN oxidation reaction is restrained and the content of NOx formed in the primary combustion zone is lessened by the reduction reaction from HCN to N2. NOx concentration decreases as a result of the reactions with CH radicals. The reactions shown in Equations (16)–(18) are the main reactions of NO reduction by CH radicals:
CH 2 + NO HCN + OH
CH + NO HCN + O
C + NO CN + O

3. Results and Discussion

3.1. Reburn Zone Excess Air Coefficient Effect on Denitration

SAm combustion without reburning (conventional case), SAm combustion with SAm reburning, and SAm combustion with cornstalk reburning at different reburn zone excess air coefficients (α), 0.87, 0.9, 0.93 and 0.96, are discussed respectively. The experimental case is a reburning case which is under the conditions with α = 0.87, SAm combustion with SAm reburning, Rff 16%, and the secondary air temperature at 300 K.
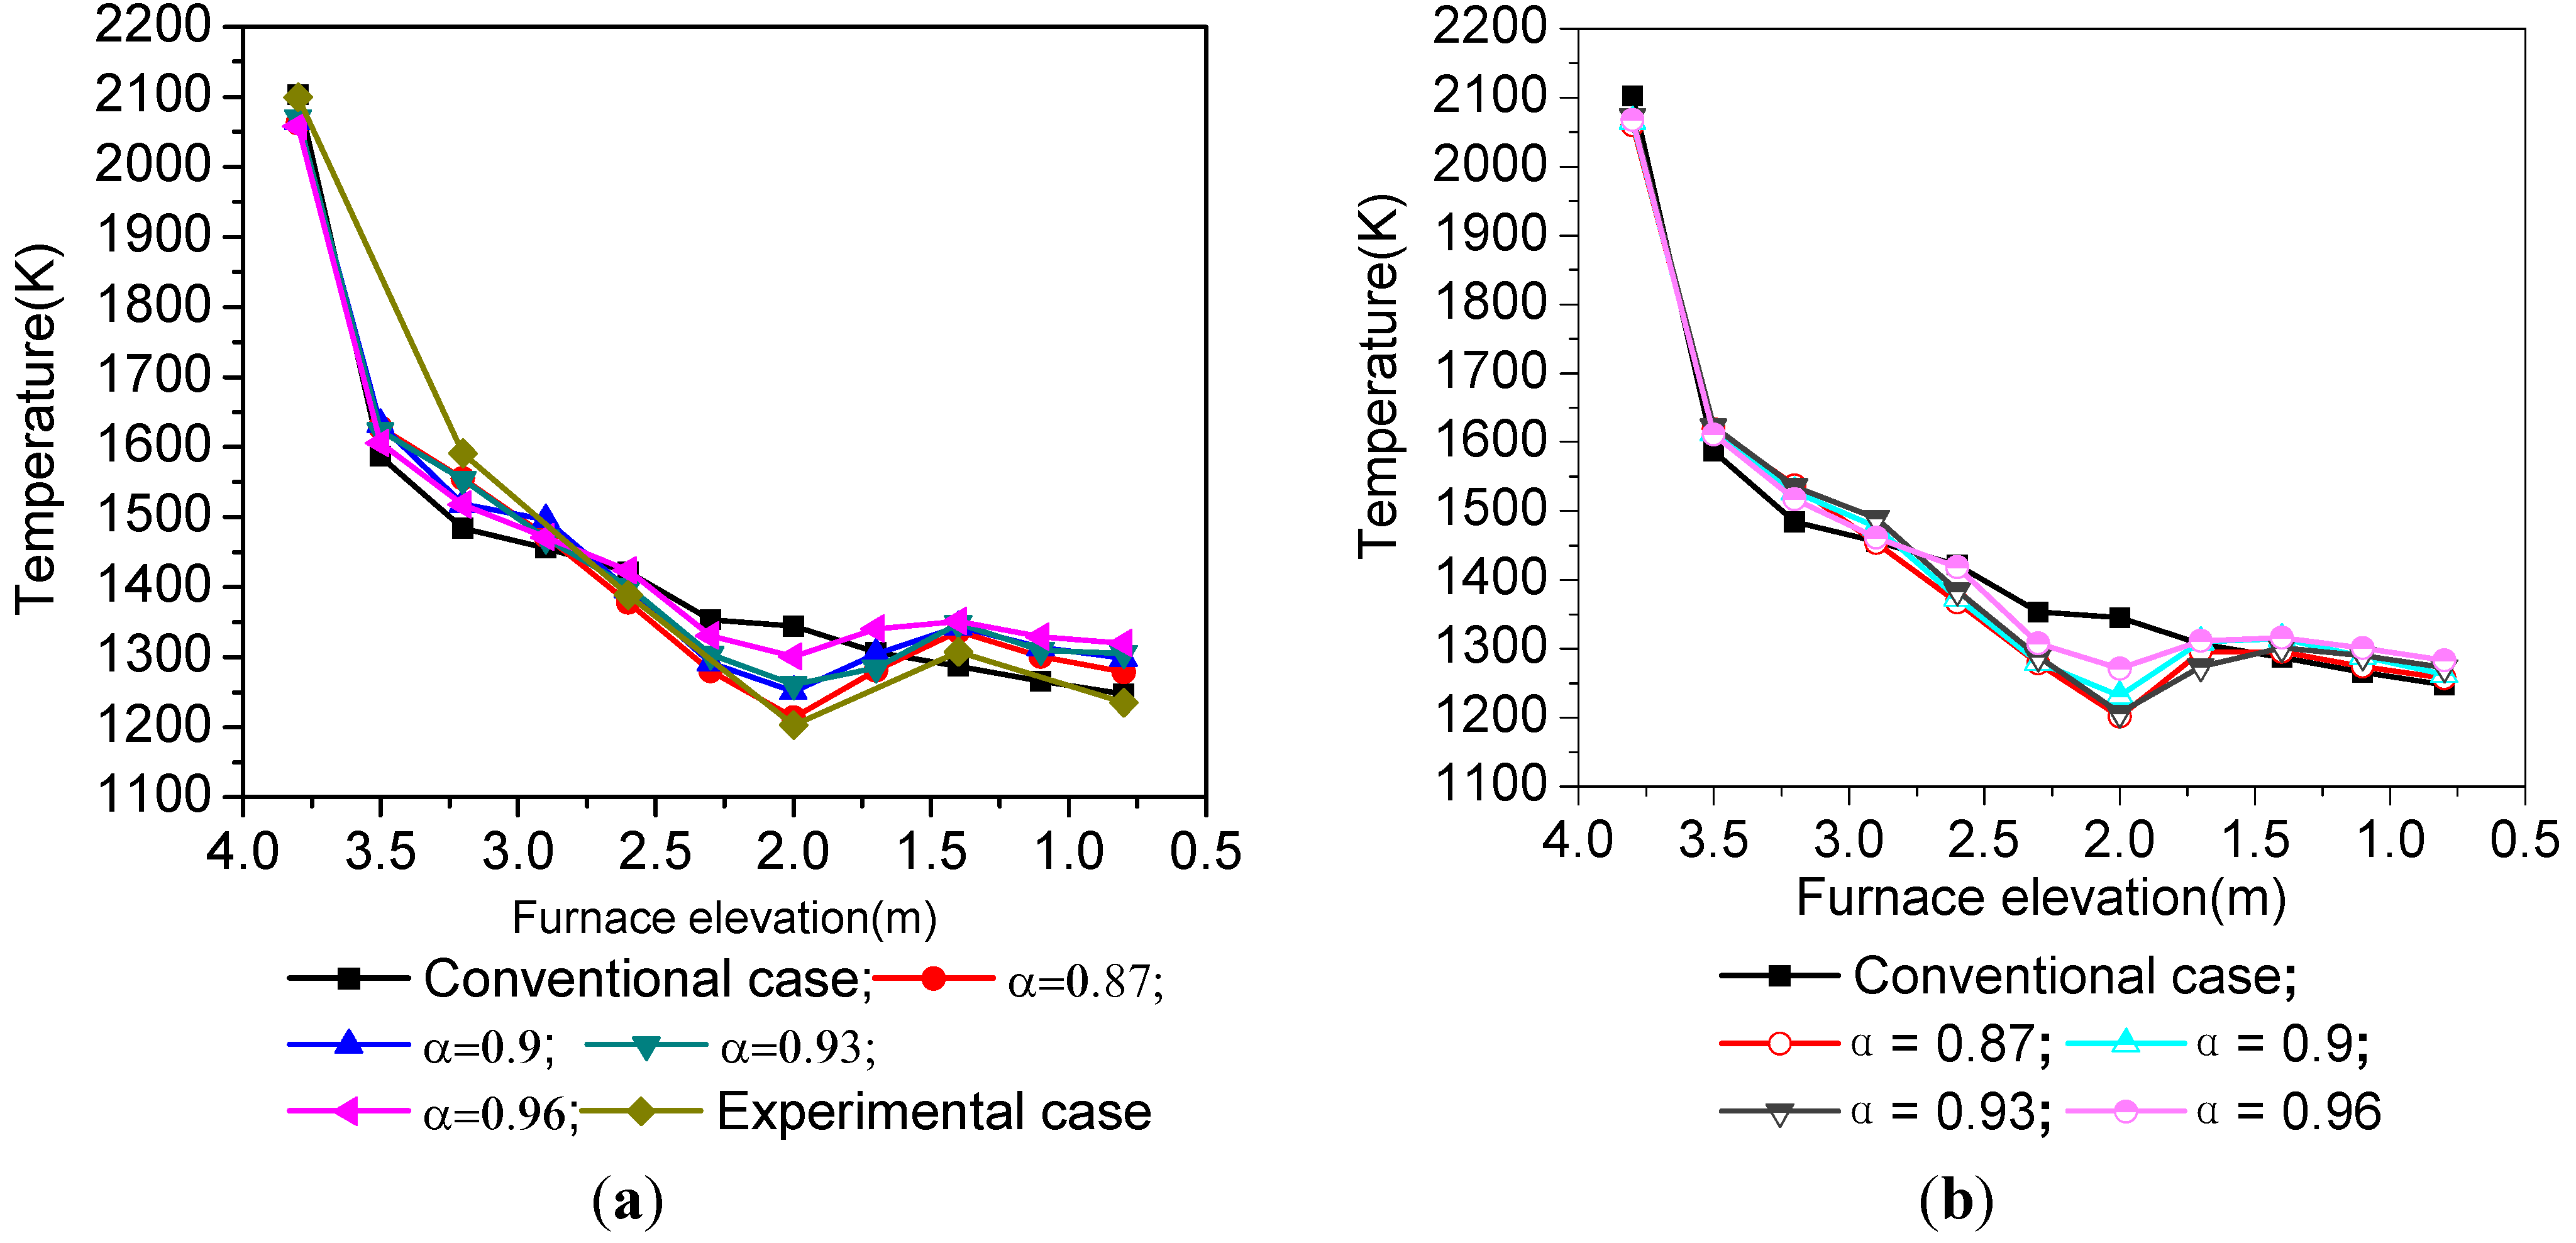
Flue gas temperature distributions along with the central line of the furnace for the conventional case and reburning cases including SAm reburning and cornstalk reburning are shown in Figure 2. In the conventional case, flue gas temperature decreases with the length of the furnace from the top to the bottom. Whereas, in SAm reburning and cornstalk reburning cases, temperatures with different reburn zone excess air coefficients decrease from the primary zone down to the burnout zone. In the reburn zone, they continue decreasing and reach the lowest values due to the insufficient air flow and the injection of reburning fuels, which undergoes pyrolysis within the reducing atmosphere. When the flue gas enters into the burnout zone, temperature increases again as the unburned fuels and intermediate products from the reburn zone react with the burnout air. During this stage, all the fuels from the reburn zone combust completely with the burnout air and release their remaining heat. In different cases, at different mass flow rates of reburning air and burnout air, it can be found that the higher reburn zone excess air coefficient, the higher the temperature in the reburn zone and burnout zone. For example, in the case of α = 0.96 for both SAm reburning and cornstalk reburning, the amount of air injected into the reburn zone is higher than any other reburn conditions. This directly results in a higher temperature within the reburn zone in comparison to any other reburn conditions. During the burnout stage, temperatures for SAm reburning are higher than that of cornstalk reburning. Both SAm reburning and cornstalk reburning overall show slightly higher temperature profiles in comparison to the conventional case without reburning. Thus, the higher temperature is a result of the fuel and air staged zones created within the furnace. Figure 2a shows that the temperature curve of the simulation case (α = 0.87) has similar characteristics as that of the experimental case (α = 0.87), which indicates that the mathematical model is applicable.
Figure 2. Temperature distributions along with the height of the furnace under different α: (a) SAm reburning; and (b) cornstalk reburning.
Energies 08 09434 g002
NO
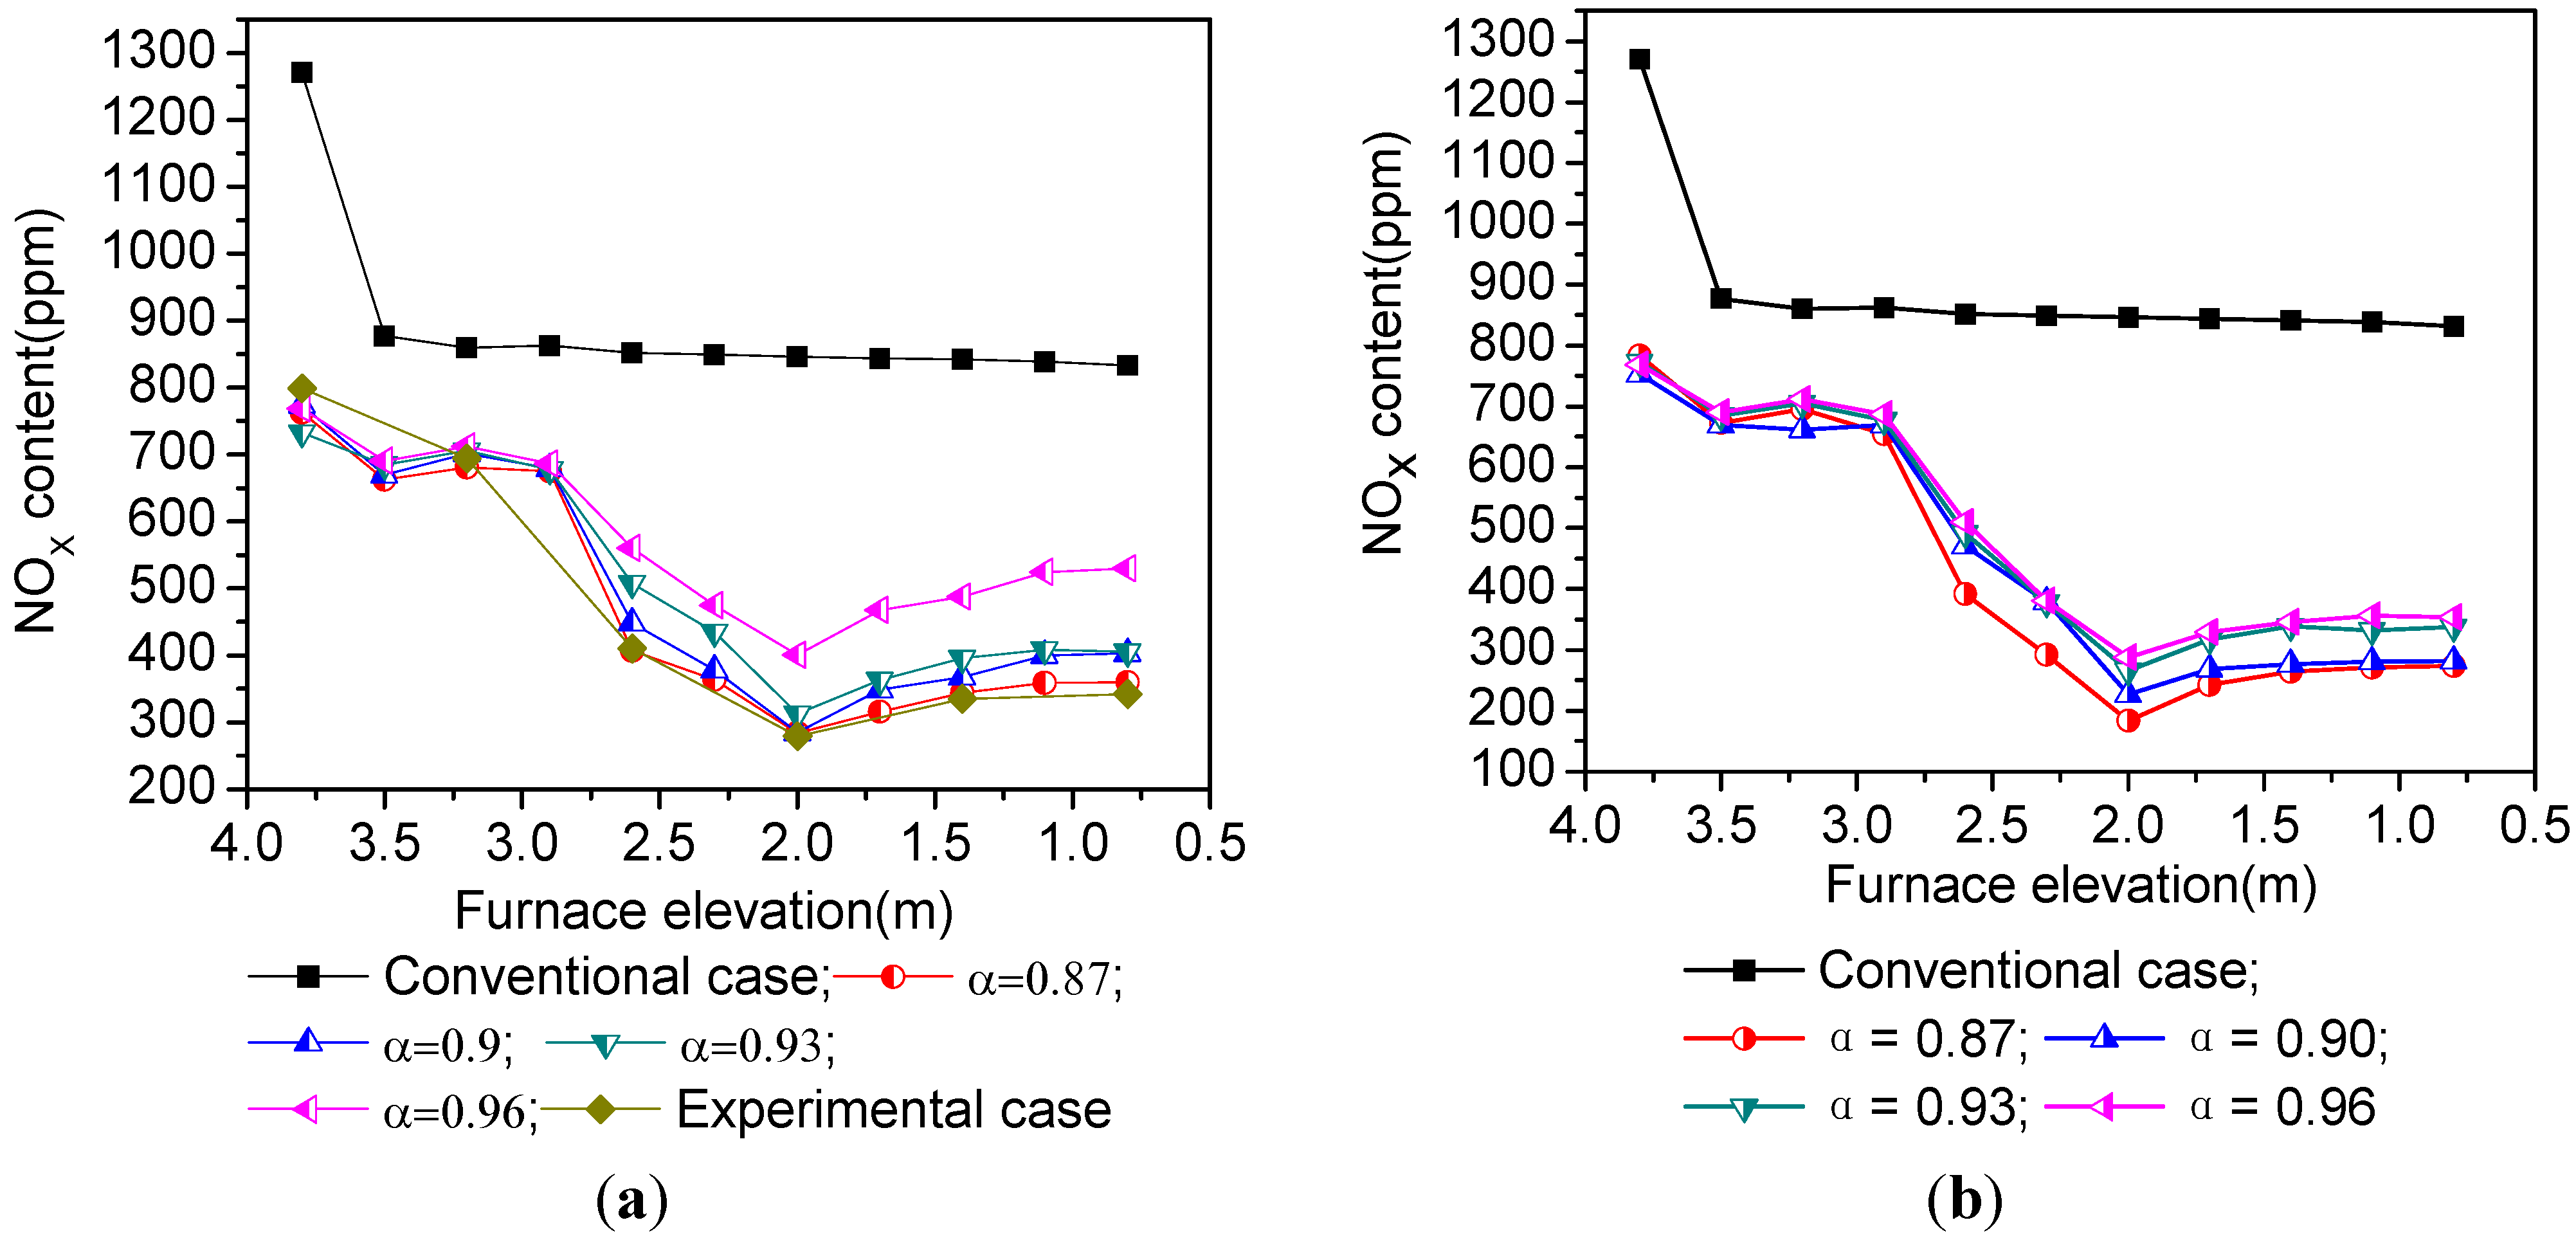
x distributions for the three kinds of combustion are shown in 
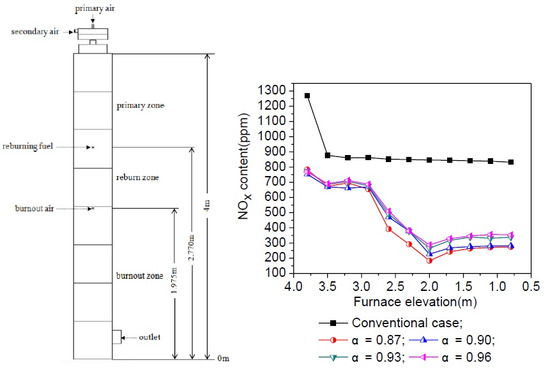
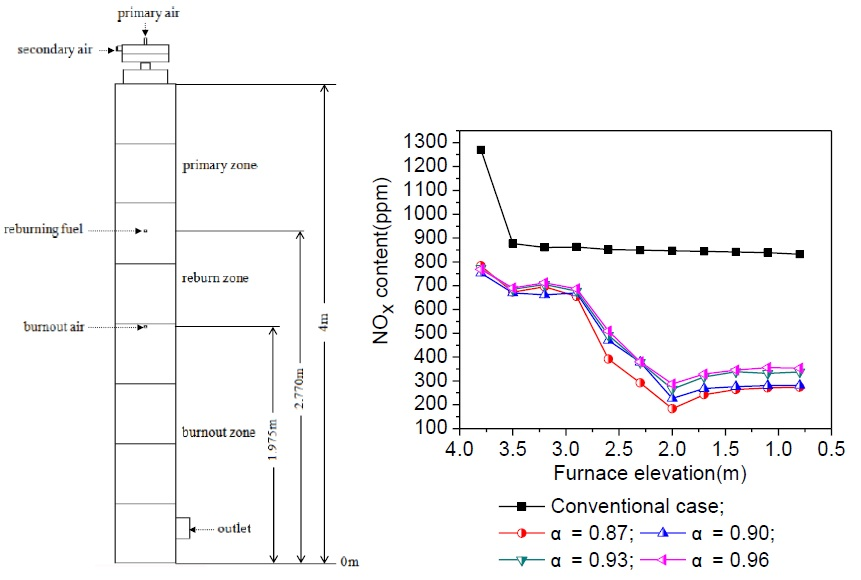
Figure 3. In terms of conventional combustion, NOx drops drastically in the primary zone and then retains a very slow decline and reaches 826.9 ppm at the exhaust outlet. For the reburning cases, SAm and cornstalk exhibit a similar trend. NOx concentrations in all cases decrease at first and then maintain a very slow decline in the primary zone. When the reactants enter the reburn zone, the NOx content drops sharply until it reaches the burnout zone. In the burnout zone, NOx content in all cases shows a slight increase and then remains constant. In the case of each reburning condition, the NOx contents at different α within the primary zone are similar. This is thought to be a result of the similar quantities of primary fuel and air under super stoichiometric (fuel lean) conditions, where the N-containing compounds are being formed.
Figure 3. NOx distributions along with the height of the furnace under different α: (a) SAm reburning; and (b) cornstalk reburning.
Energies 08 09434 g003
However, clear differences are observed in SAm reburning and cornstalk reburning cases when entering the reburn zone. With the injection of the reburning fuel and a small quantity of air, a reducing atmosphere is created. In this stage, reburning fuels are released and the reducing intermediate products react with NOx as detailed by Equations (16)–(18).
Therefore, NOx is partially reduced in the reburn zone. The highest NOx reduction is observed for the reburning condition of α = 0.87, in comparison to other reburning conditions set for both SAm and cornstalk. The unburned HCN and NH3 emanating from the reburn zone undergo complete oxidation within the oxygen rich burnout zone where further NOx is formed as follows:
NH 3 + O 2 NO +
HCN + O 2 NO +
Analyses of the SAm and cornstalk detailed in Table 1 show the carbon content of the SAm is higher than that in the cornstalk. However, SAm NOx emission is greater than cornstalk, indicating that the denitration effect of cornstalk containing a higher volatile content is better than that of SAm. This further implies that the effect of the denitration on homogeneous reaction for the volatile is better than the heterogeneous reaction of the char. Figure 3a also shows that the NOx curve of the simulation case (α = 0.87) has similar characteristics to that of the experimental case (α = 0.87), which indicates that the NOx model is also suitable.
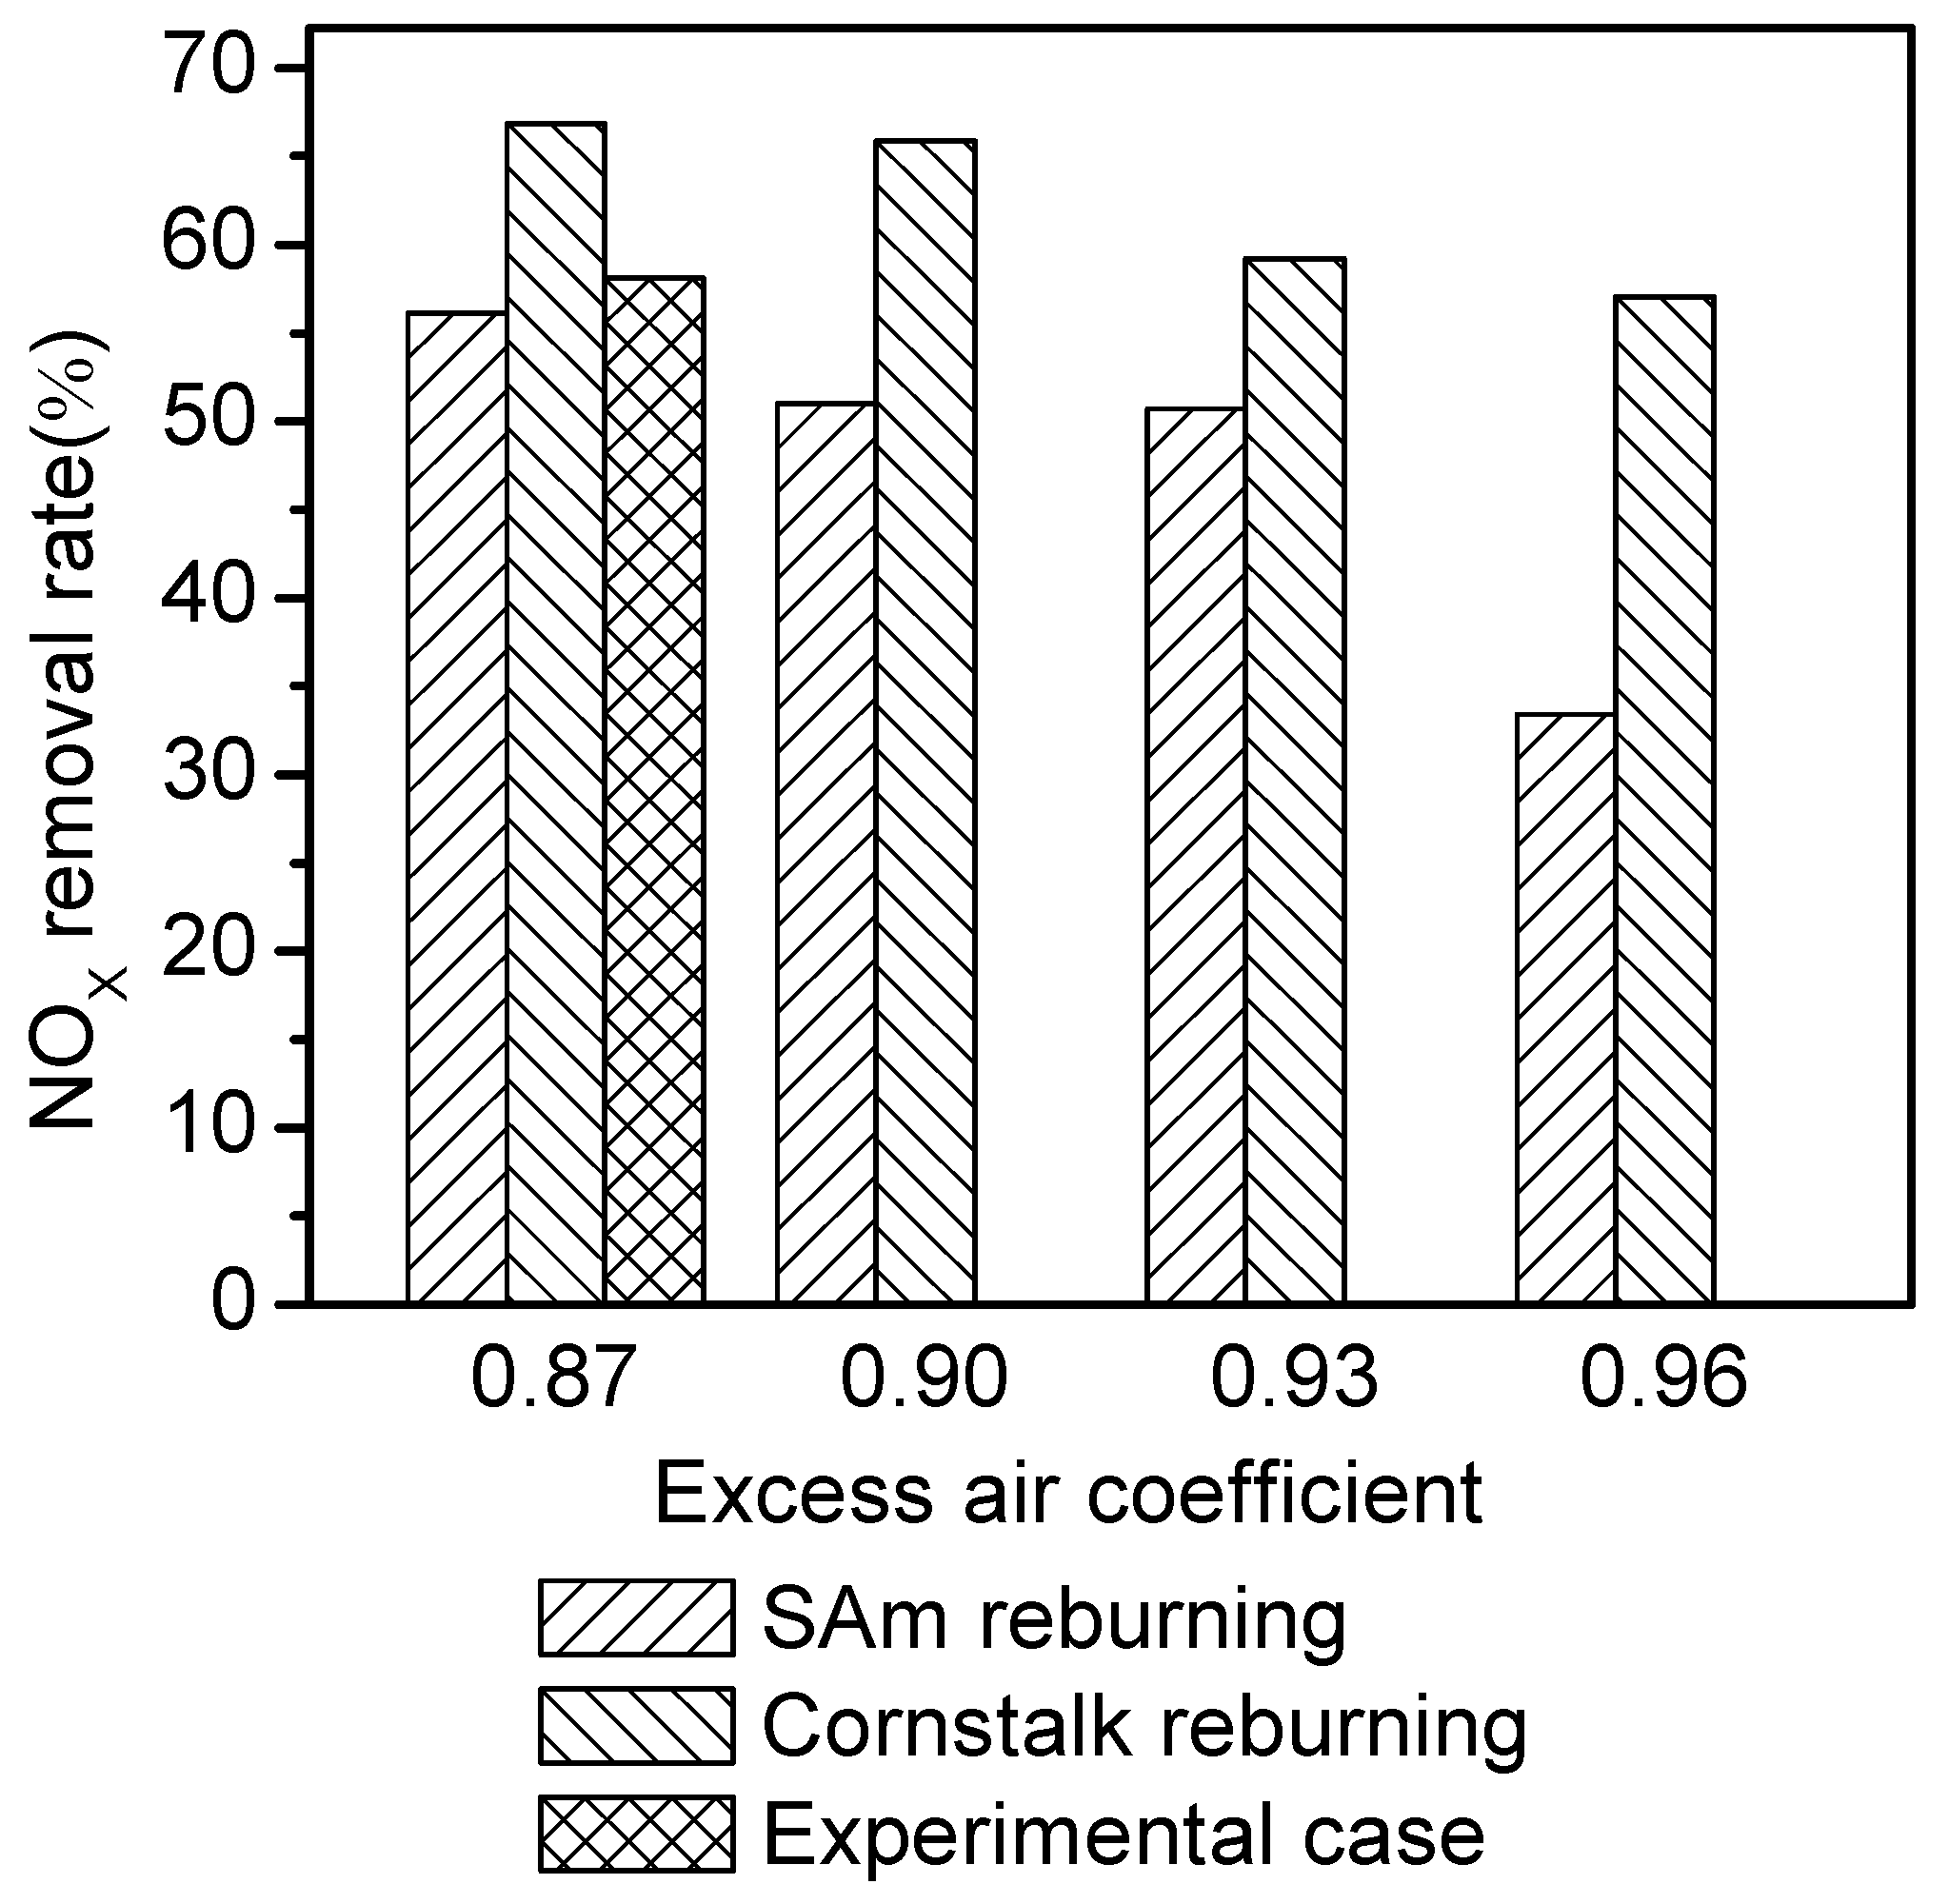
As shown in Figure 4, the smaller the α is, the lower the NOx emissions at the outlet and the higher the NOx removal rate are correspondingly for the two kinds of fuel reburning cases. In general, NOx emissions at the outlet for SAm reburning conditions are higher than cornstalk reburning under the same conditions. In SAm reburning simulation cases, the NOx removal rate reaches 56.15% at α = 0.87, and it is 66.89% for cornstalk reburning under the same conditions.
Figure 4. NOx removal rate under different α.
Energies 08 09434 g004
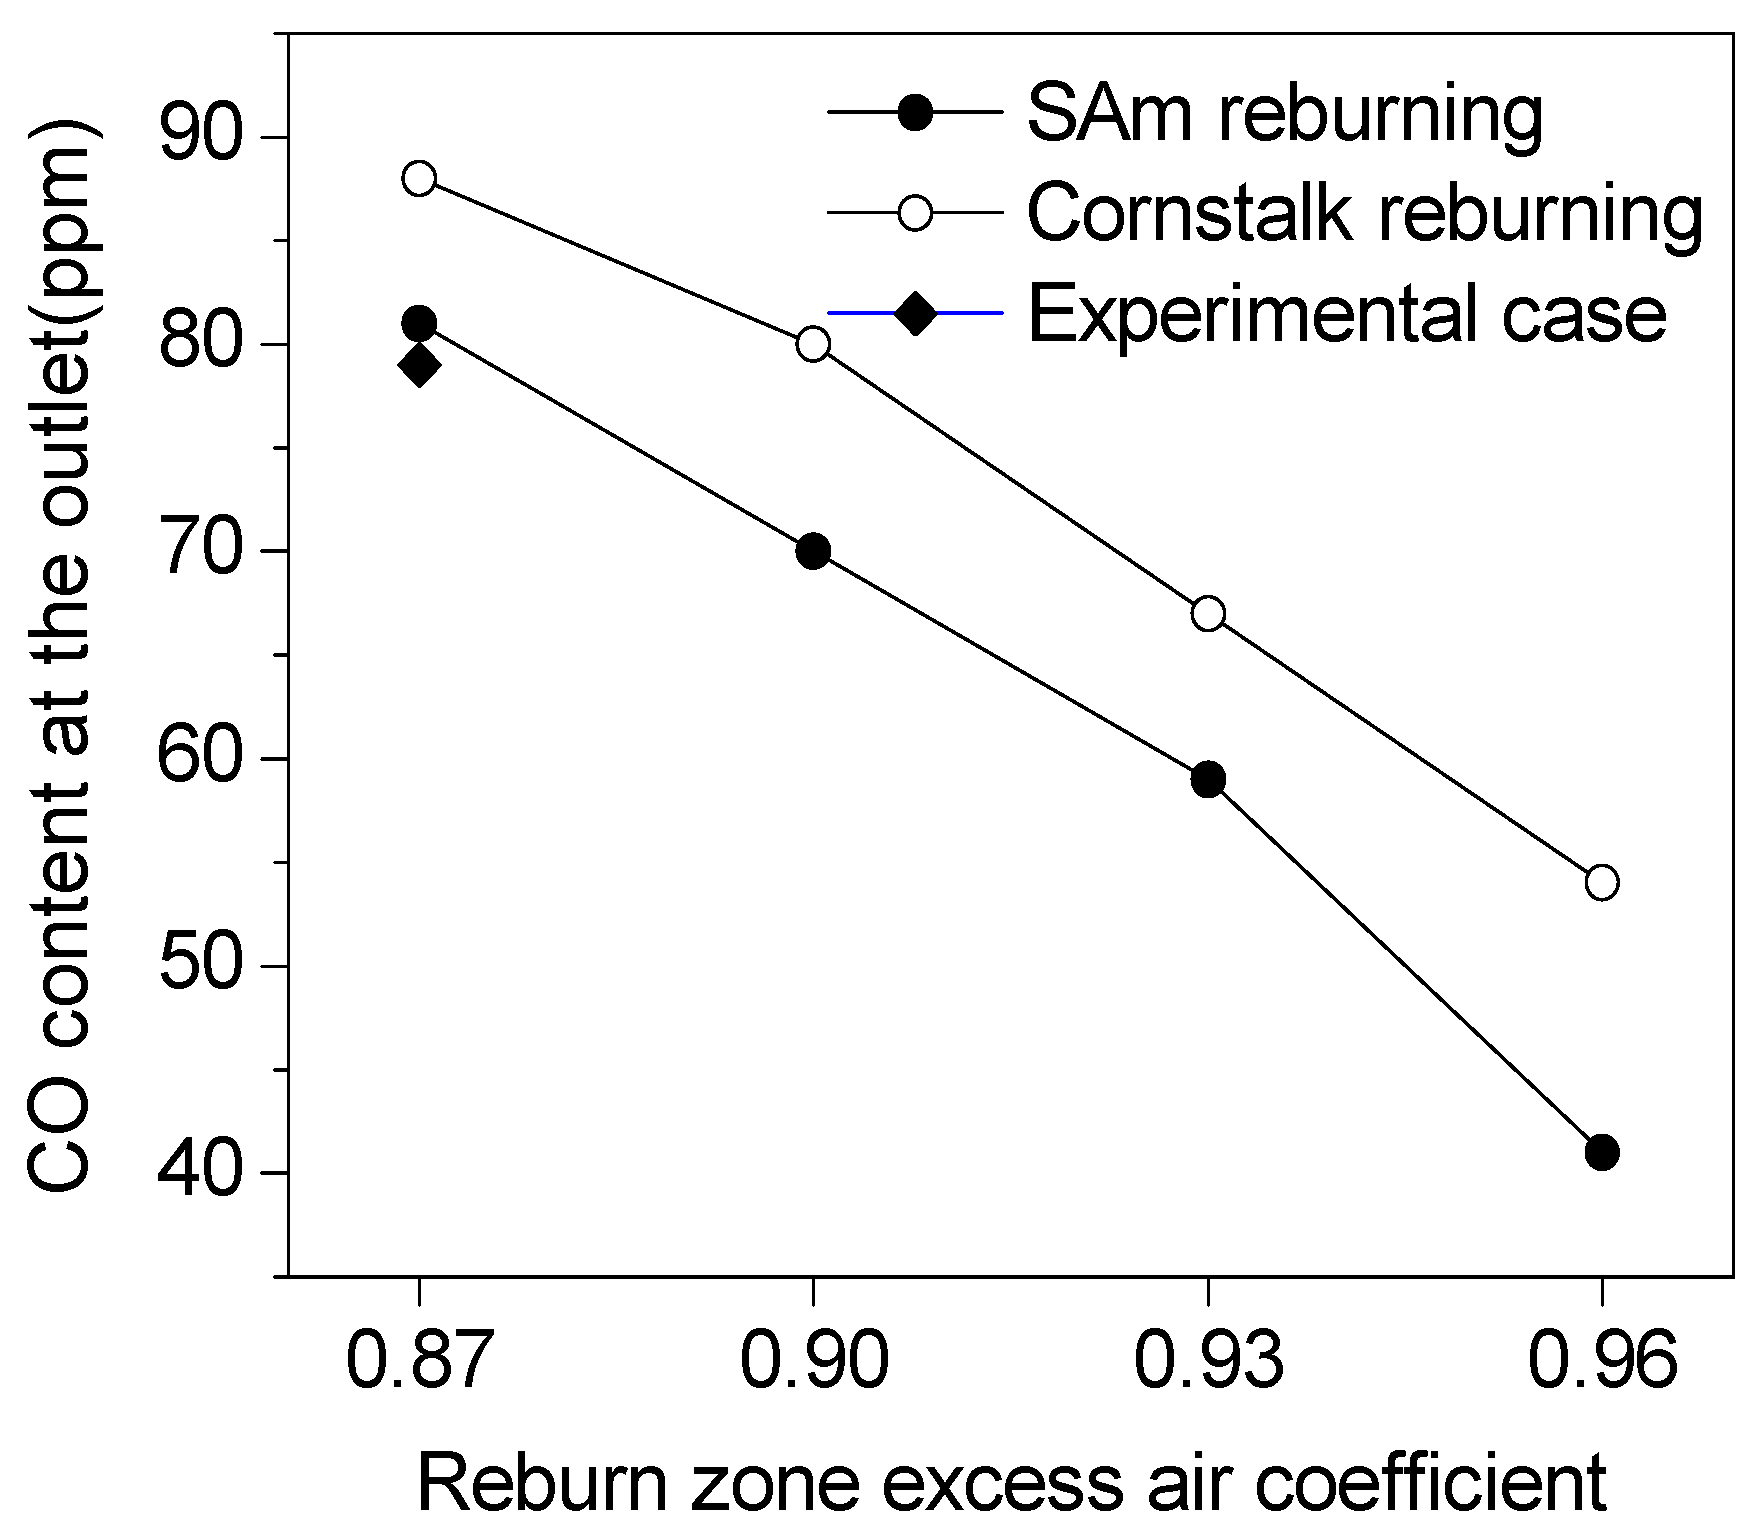
To ensure the combustion efficiency of the furnace, CO emissions for all the cases are considered. As shown in Figure 5, under the same conditions, CO emissions for cornstalk reburning are higher than SAm reburning. This may be explained by the lower CV of cornstalk compared to SAm, and therefore a higher mass flow rate of cornstalk is required in order to achieve the same heat input. Thus, a higher mass flow rate of cornstalk is injected into the reburn zone and, in addition, the volatile content of the cornstalk is far greater than that of the SAm. Therefore, more intermediate products remain within the burnout zone generating higher levels of CO as a result of cornstalk reburning. CO emissions decrease with an increase in the reburn zone excess air coefficient, and the maximum values obtained at α = 0.87 are 81 ppm and 88 ppm for SAm reburning and cornstalk reburning, respectively, where the experimental case has CO emissions of 79 ppm which is close enough to the simulation result.
Figure 5. CO content under different α.
Energies 08 09434 g005

3.2. Reburning Fuel Fraction Effect on Denitration

In this section, simulation results of SAm combustion with SAm reburning and SAm combustion with cornstalk reburning at different Rff, 10%, 15%, 20%, 25% and 30% are discussed, respectively. 
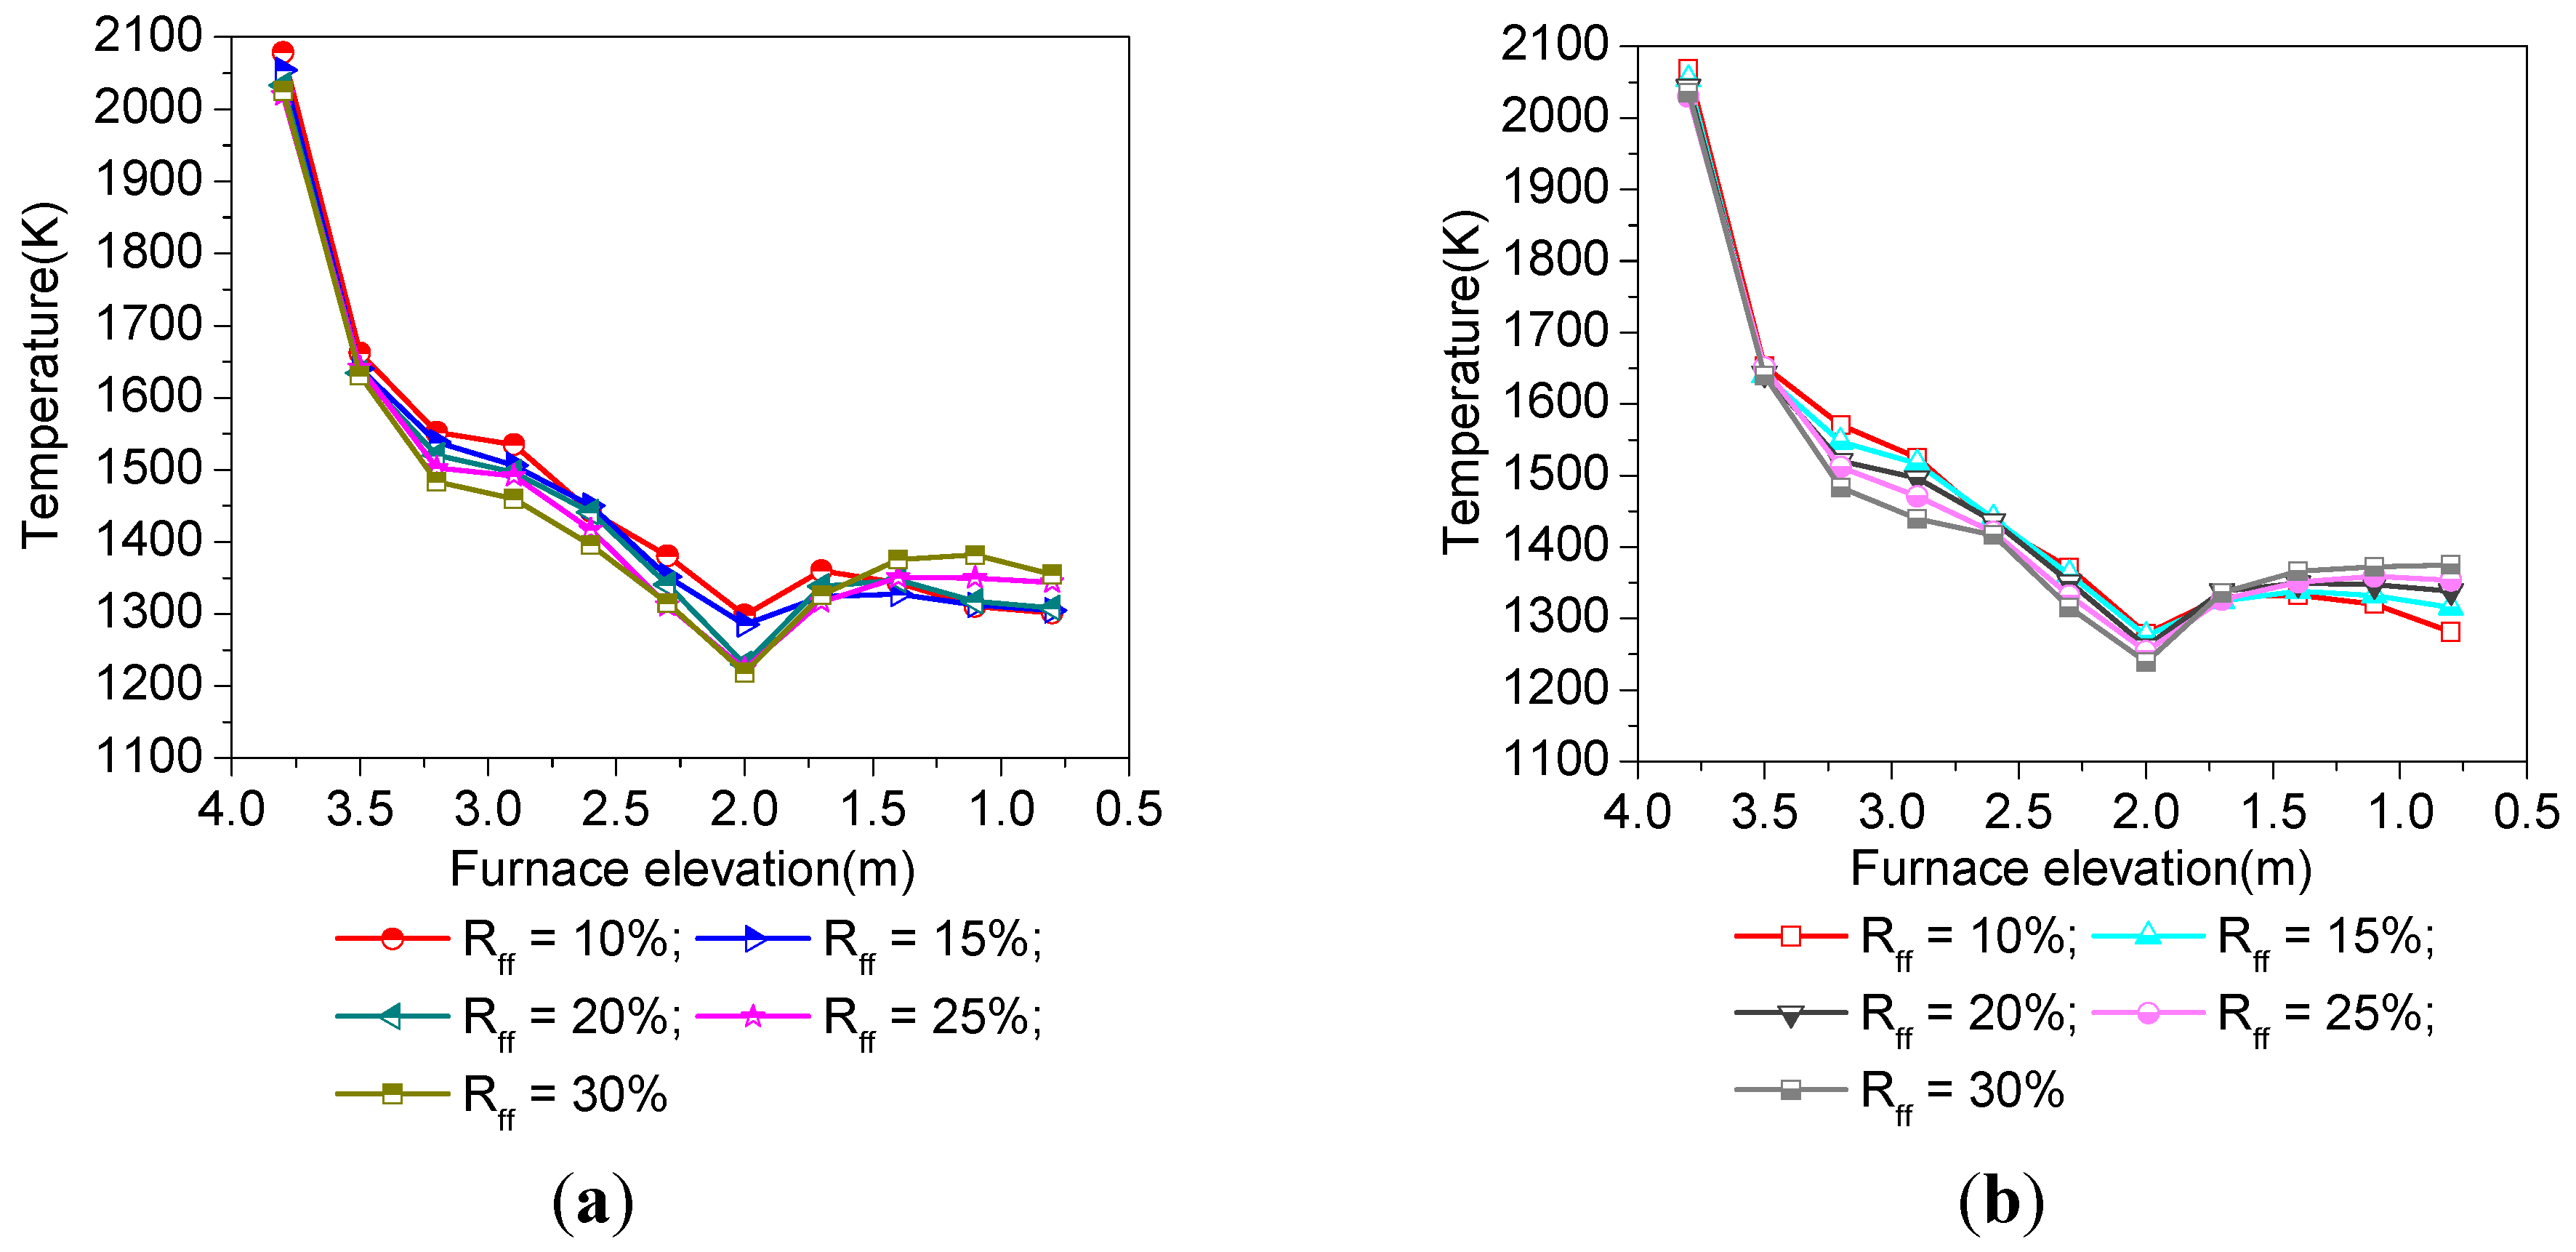
Figure 6 shows the temperature distributions under different Rff for the two kinds of fuel reburning. Irrespective of reburning, the temperatures in cases with a larger Rff are relatively lower in the primary zone as a result of the smaller quantities of primary fuel. In the second stage, with the injection of the reburning fuel and a lower flow rate of the air, a reduction atmosphere is formed.
Figure 6. Temperature distributions along with the height of the furnace under different Rff: (a) SAm reburning; and (b) cornstalk reburning.
Energies 08 09434 g006
Reburning fuels undergo an initial pyrolysis process resulting in the release of volatiles and chars, which further lowers the temperature within this zone. Entering into the burnout zone, unburned materials from the reburn zone are completely combusted with the burnout air, resulting in a slight increase in temperature and then remaining constant. However, in cases with higher reburning fuel fractions, for example, in the case of Rff = 30%, significantly more intermediate products are generated within the reburn zone due to more reburn fuel injected. Therefore, a higher proportion of partially combusted material requires oxidation producing a higher rate of heat release, which is observed as a greater increase in temperature when compared to any other reburning conditions. The phenomenon of the temperatures for SAm reburning and cornstalk reburning remaining relatively consistent under the same conditions, is probably due to the same reburning fuel fraction. This can be defined as the ratio of the heat contained within the reburning fuel to the total heat input. This further demonstrates that the heat input in the primary zone and reburn zone are the same for SAm reburning and cornstalk reburning.
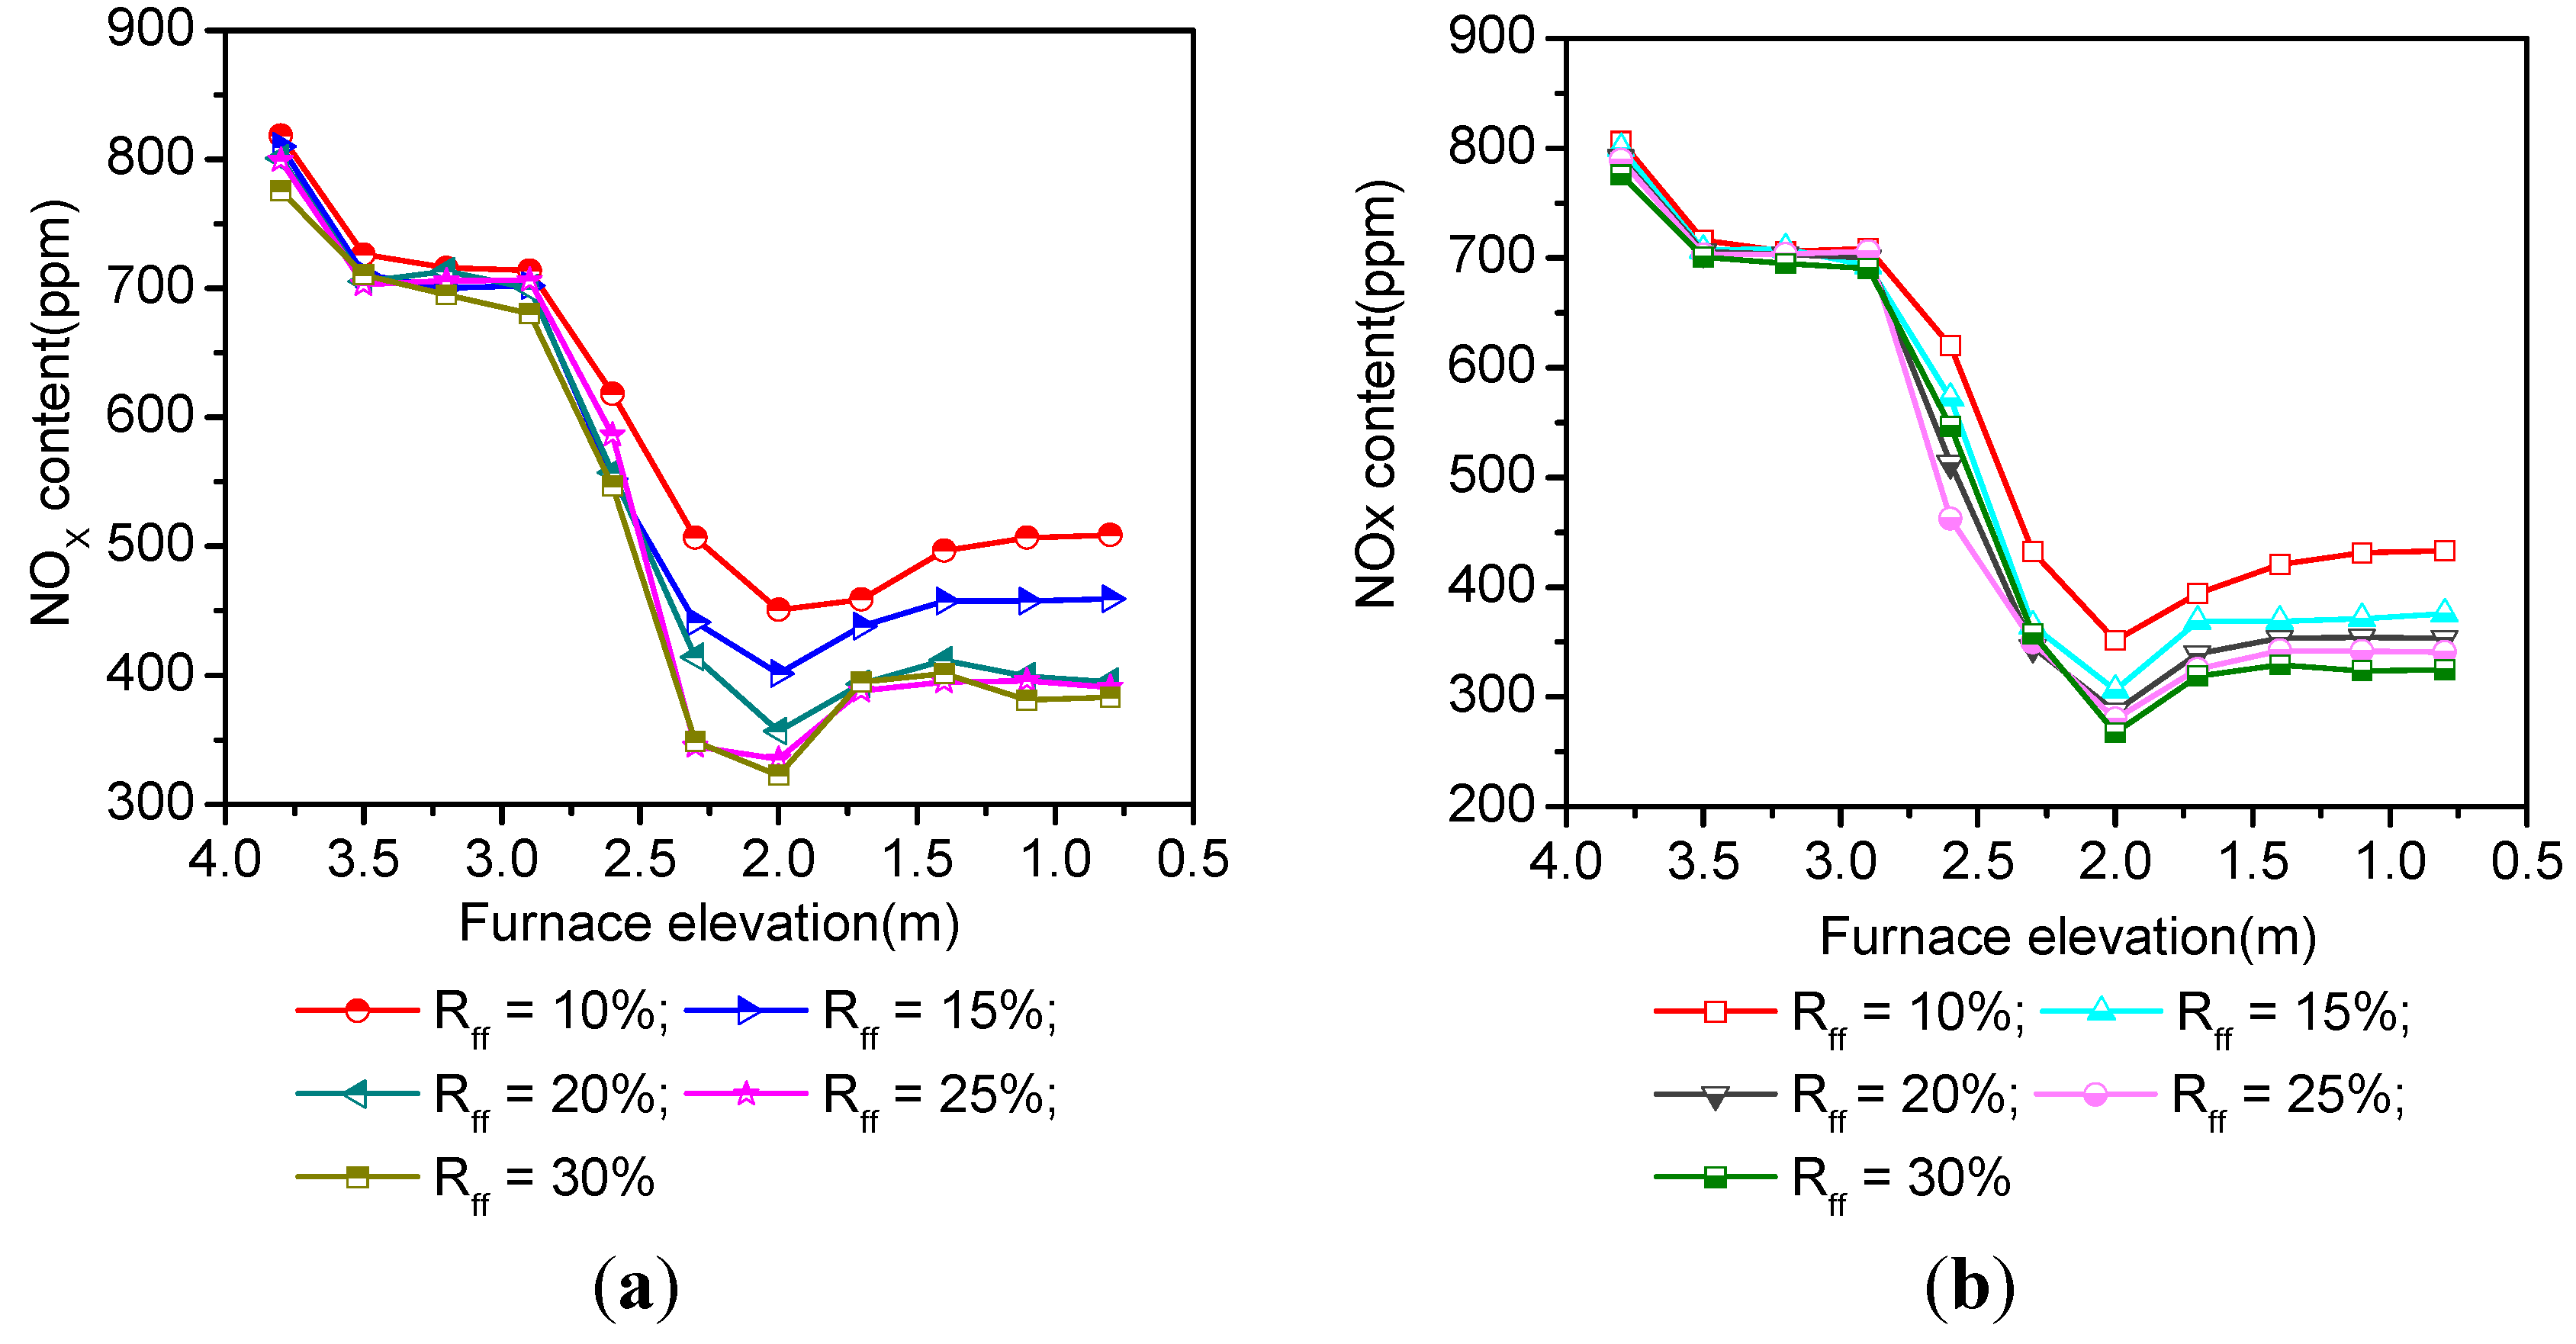
NOx distributions under different reburning fuel fractions for the two kinds of fuel reburning have some similar characteristics, as shown in Figure 7. NOx contents in all cases present a trend that sharply decreases at first and then maintains a slight reduction in the primary zone, further decreasing again at the secondary stage and slightly increasing at the tertiary stage. The reason for this trend is consistent with the effect of reburn zone excess air coefficient on denitration as discussed above. For SAm reburning and cornstalk reburning at the same Rff, NOx concentrations are similar within the primary zone due to the same ratio of primary fuel and air. However, it begins to show some differences when entering into the reburn zone and NOx content for the cases of cornstalk reburning has a higher NOx reduction rate than SAm reburning. In addition, the lowest NOx content value in the cornstalk cases is lower than that in SAm cases, which can be explained by the fact that volatiles’ content in the cornstalk is far higher than that in the SAm. Even though the carbon content in the SAm is higher than that in the cornstalk, the SAm possesses a lower NOx reduction efficiency than the cornstalk. Therefore, further reinforcing homogeneous reactions have a greater significant influence on NOx reduction as opposed to the heterogeneous reactions of the char.
Figure 7. NOx distributions along with the height of the furnace under different Rff: (a) SAm reburning; and (b) cornstalk reburning.
Energies 08 09434 g007
For SAm reburning and cornstalk reburning at different Rff, respectively, there are also clear differences. In the primary zone, for cases of higher Rff, the NOx content is lower than other cases, which may be caused by the lower levels of primary fuel and the lower temperatures. In the reburn zone, it is generally seen in higher Rff cases (example, Rff = 25%) that NOx concentration is significantly reduced in comparison to the lower Rff reburning cases. As a result of the higher injection rates of the reburning fuel, a higher volatile, and char and radical CXHY speciation is generated. This facilitates the formation of the intermediate products such as HCN and NH3 within the reburn zone. This is of benefit to the NOx reduction reactions in accordance to the mass law and Arrhenius law as follows (Equations (21) and (22)):
w = k + i C i v i k j C j v j
k = A T n e E R T
where, the rate of chemical reaction w increases exponentially with an increase in the reactant concentration C, which is proportional to the chemical reaction rate k. The rate of k increases exponentially with temperature.
In the tertiary stage, the relatively higher products remaining within the reburn zone react with oxygen and are further converted into NOx.
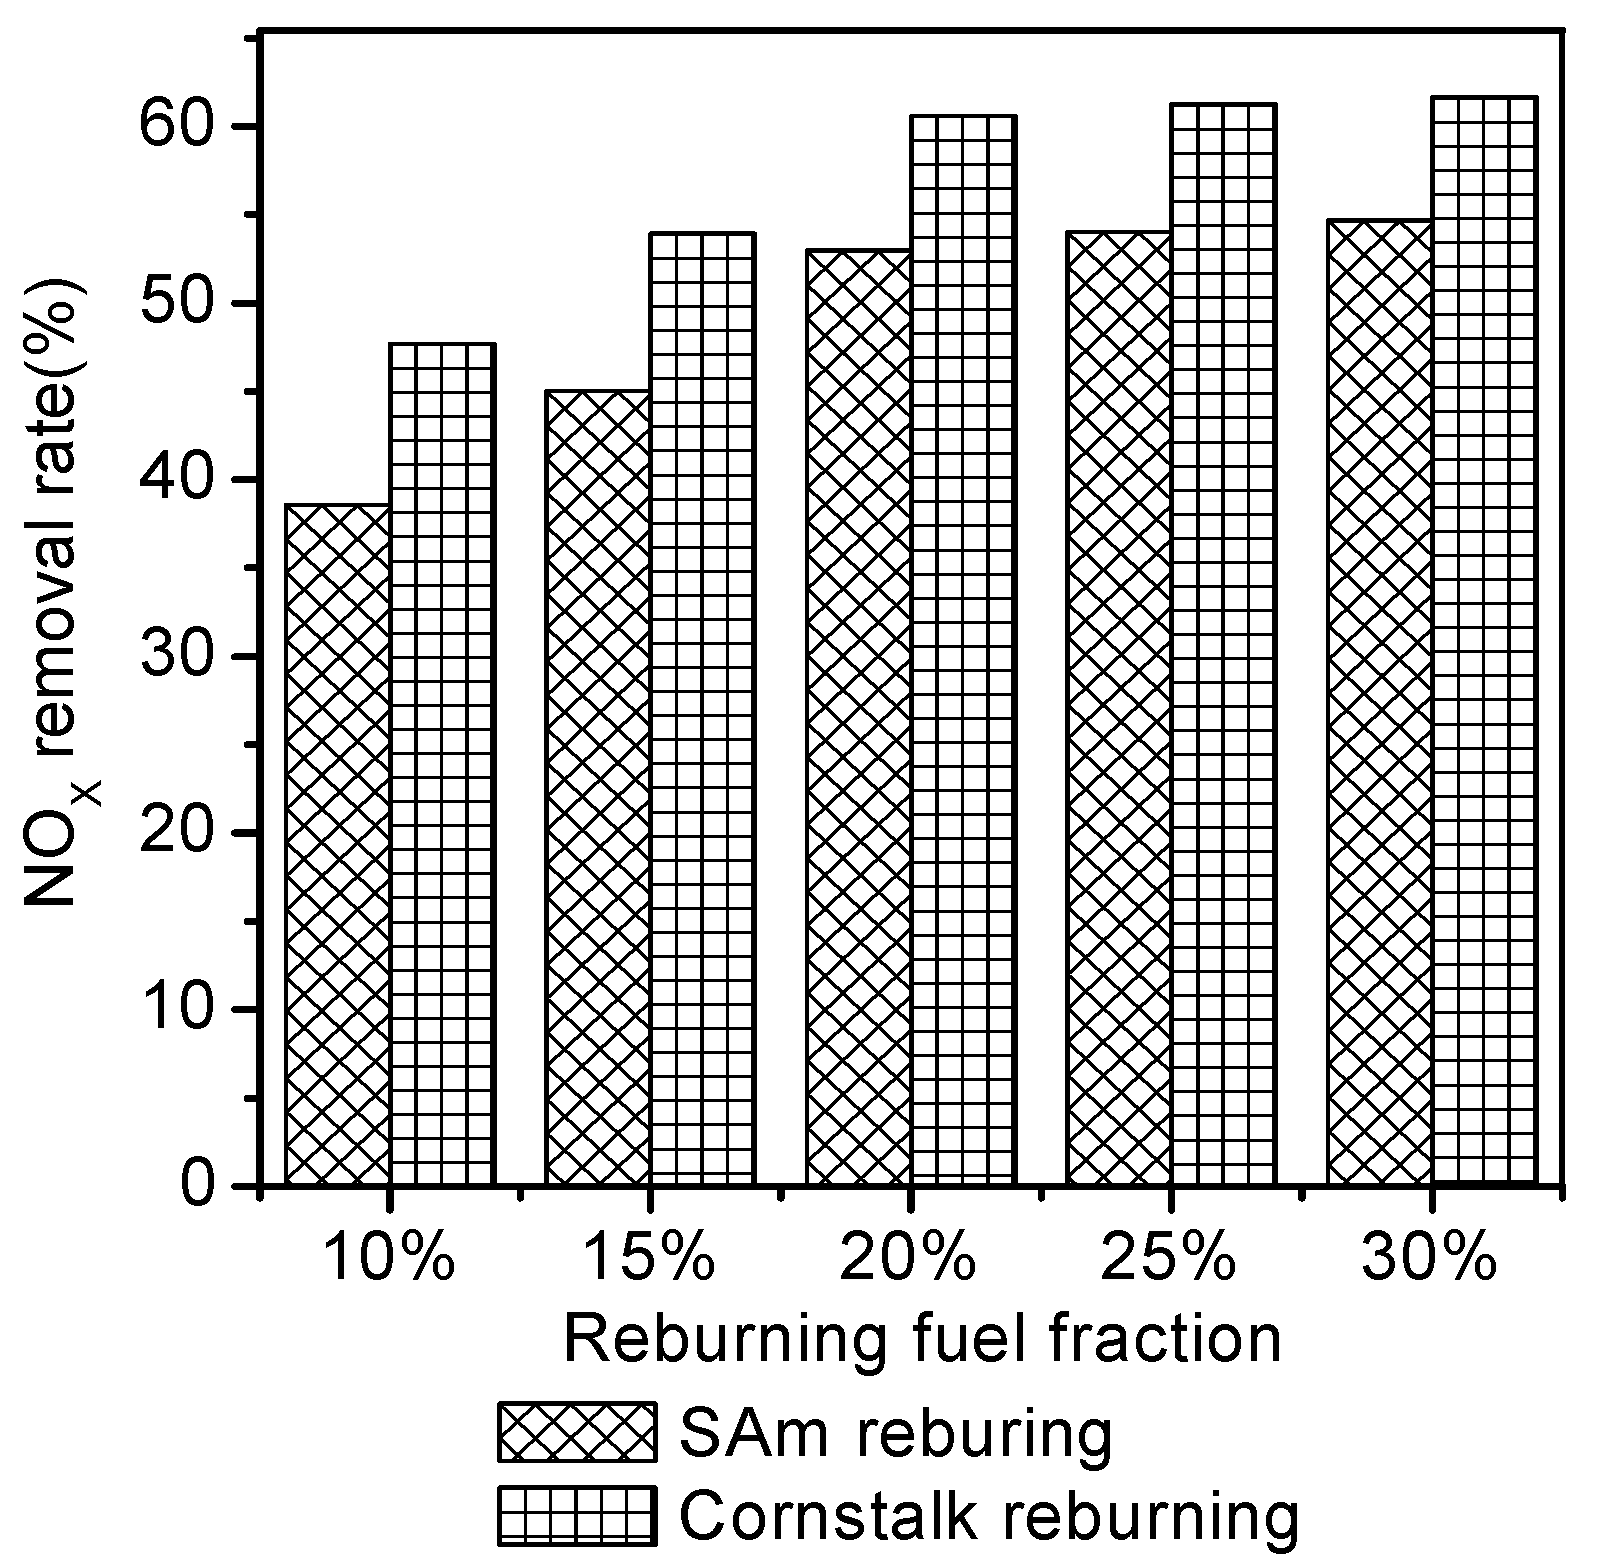
NOx removal rates in different cases are shown in Figure 8. This indicates that from a lower reburning fuel fraction range, an increase to a higher reburning fuel fraction enhances the NOx removal rate. However, once the reburning fuel fraction is increased beyond Rff = 20%, the impact on NOx reduction is no longer enhanced despite the continued increase in the reburning fuel fraction. For SAm reburning cases, NO removal rate increases by 1.04% when the reburning fuel fraction is increased from 20% to 25%. For the case of cornstalk, an increase in the R
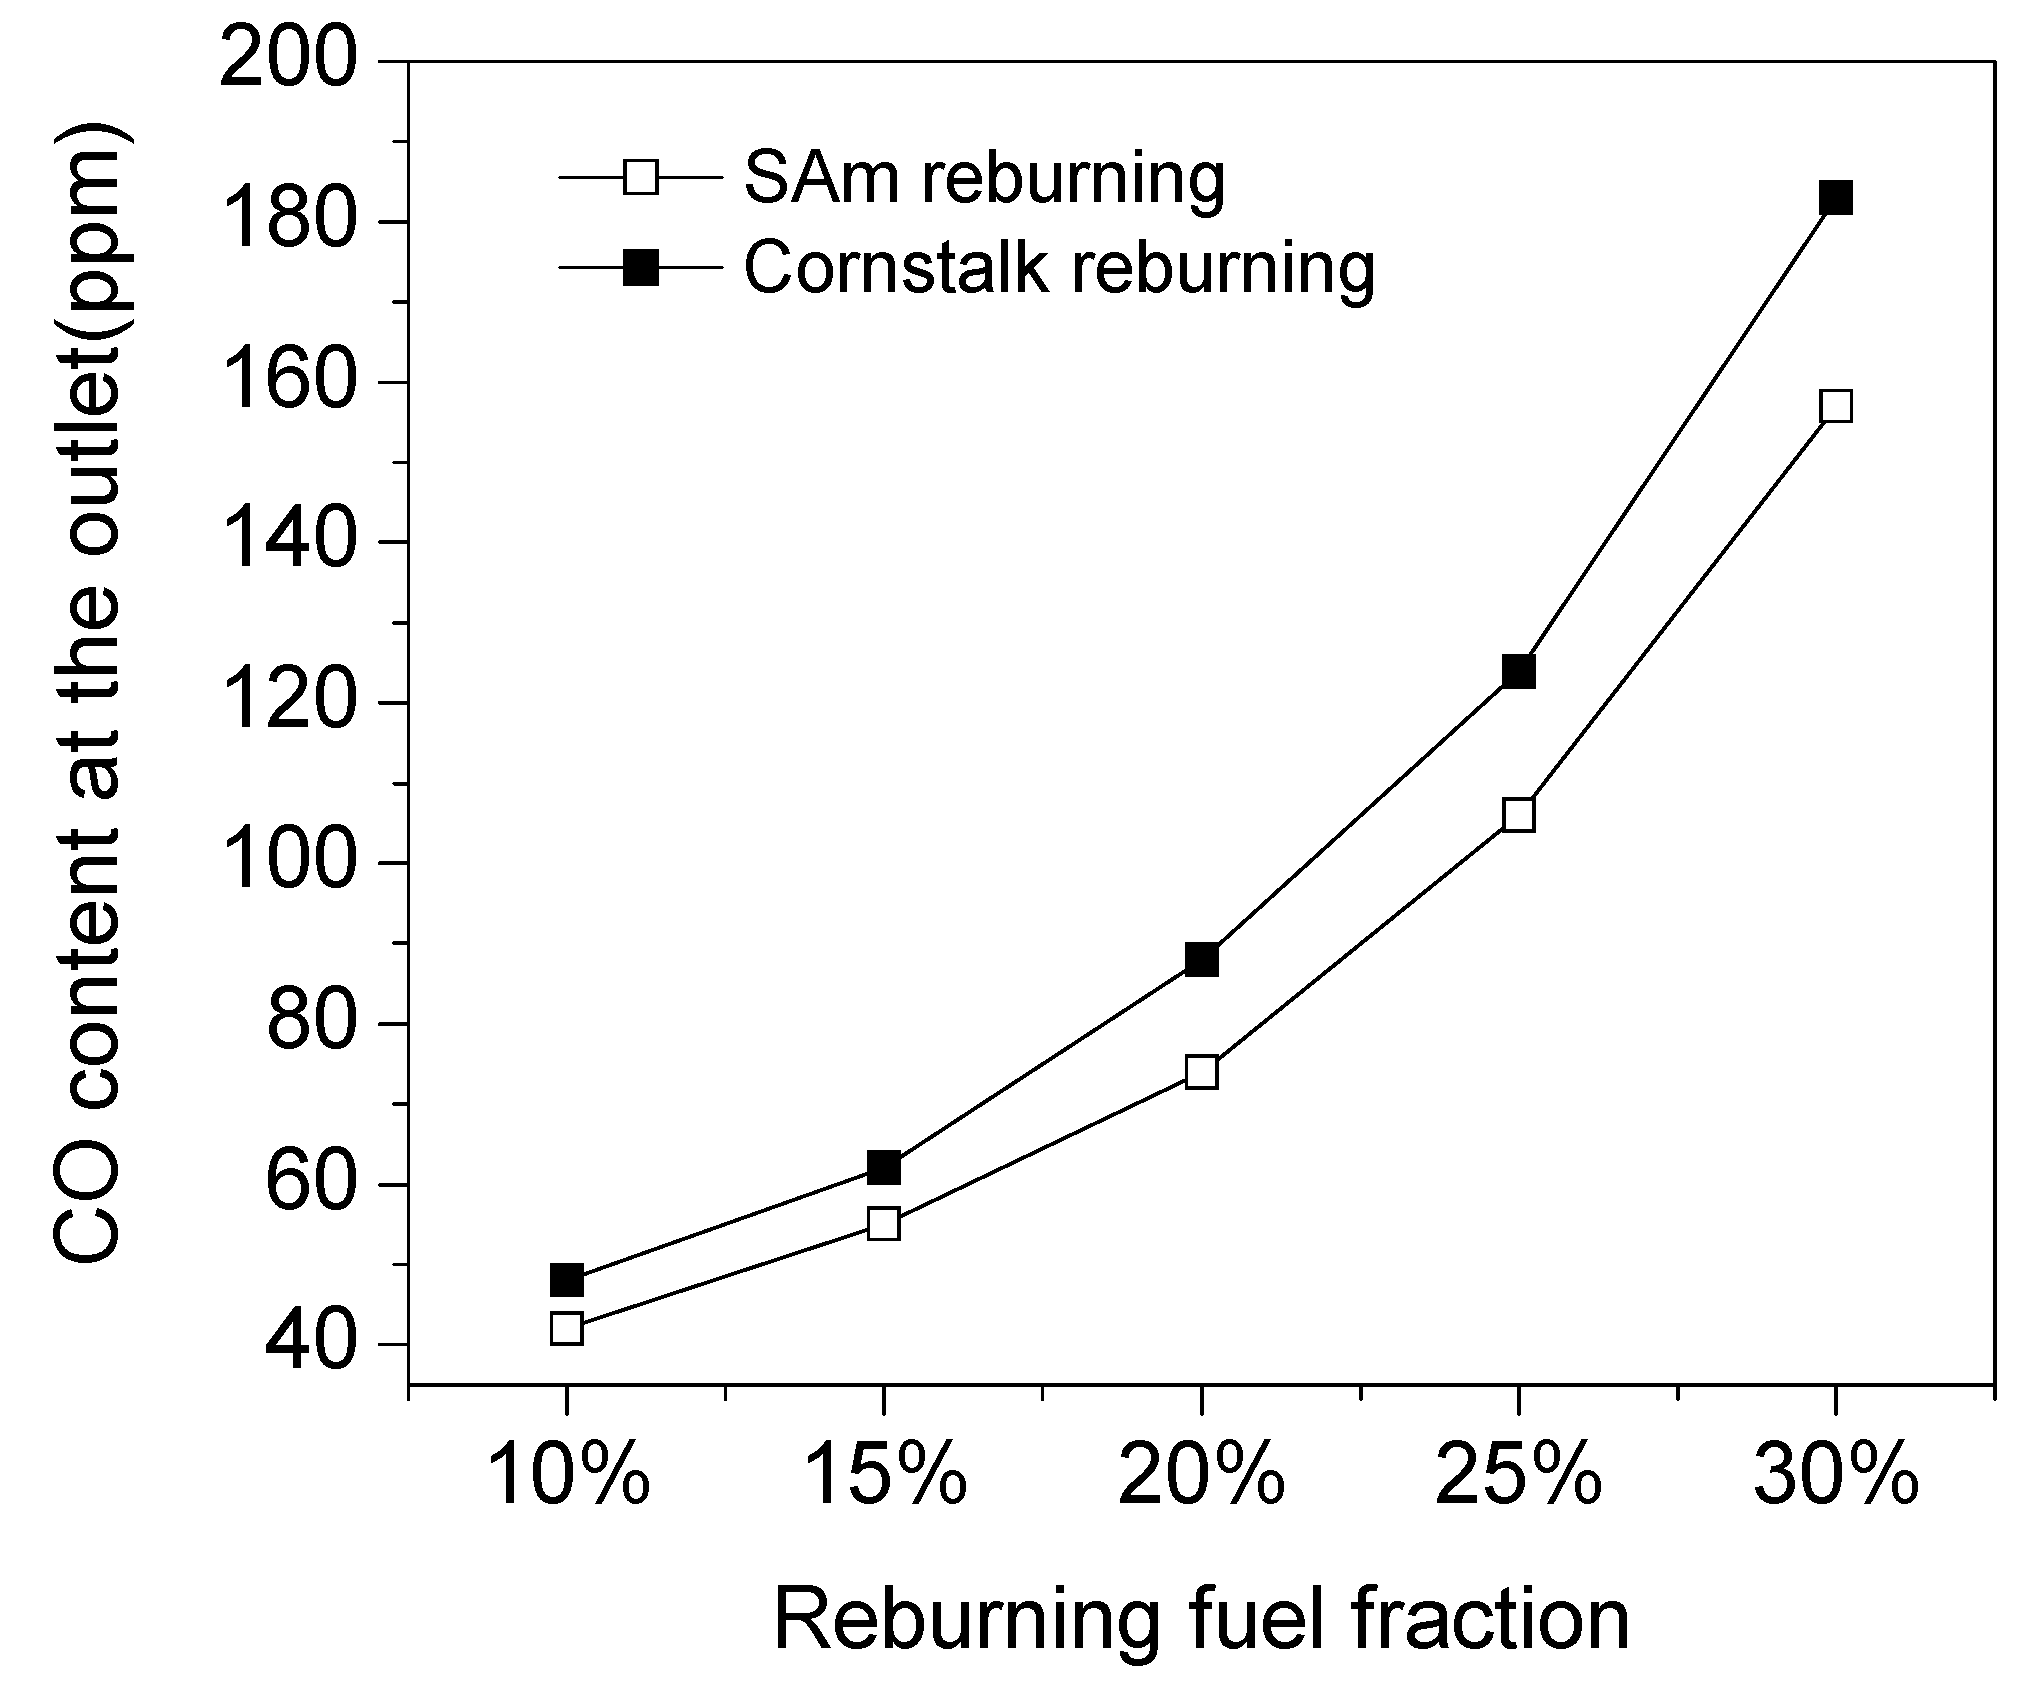
ff from 20% to 25% equates to an increase in the NO removal rate by 0.69%. Combined with the CO emissions at the exhaust outlet (Figure 9), it can be found that CO emissions increase as a function of higher Rffs for both SAm reburning and cornstalk reburning. For SAm reburning cases, when the reburning fuel fraction changes from 20% to 25%, CO emissions increase from 74 ppm to 106 ppm, while it ranges from 88 ppm to 124 ppm for cornstalk cases. In both cases, the CO concentration is greater than 90 ppm at an Rff of 25%. This implies the fuels within the furnace are undergoing incomplete combustion. Therefore, the relatively good reburning fuel fraction is 20% for both SAm reburning and cornstalk reburning.
Figure 8. NOx removal rate under different Rff.
Energies 08 09434 g008
Figure 9. CO content at the outlet under different Rff.
Energies 08 09434 g009

3.3. Temperature Effect on Denitration

For SAm reburning and cornstalk reburning, the effects of five different secondary air temperatures set at 300 K, 500 K, 700 K, 900 K and 1100 K were studied, respectively. The mass flow of primary fuel (SAm) for both SAm reburning and cornstalk reburning is 8.31 kg·h−1, and the mass flow rate of the reburning fuel SAm and cornstalk is 1.47 kg·h−1 and 2.52 kg·h−1 (higher than SAm due to a lower CV), respectively.
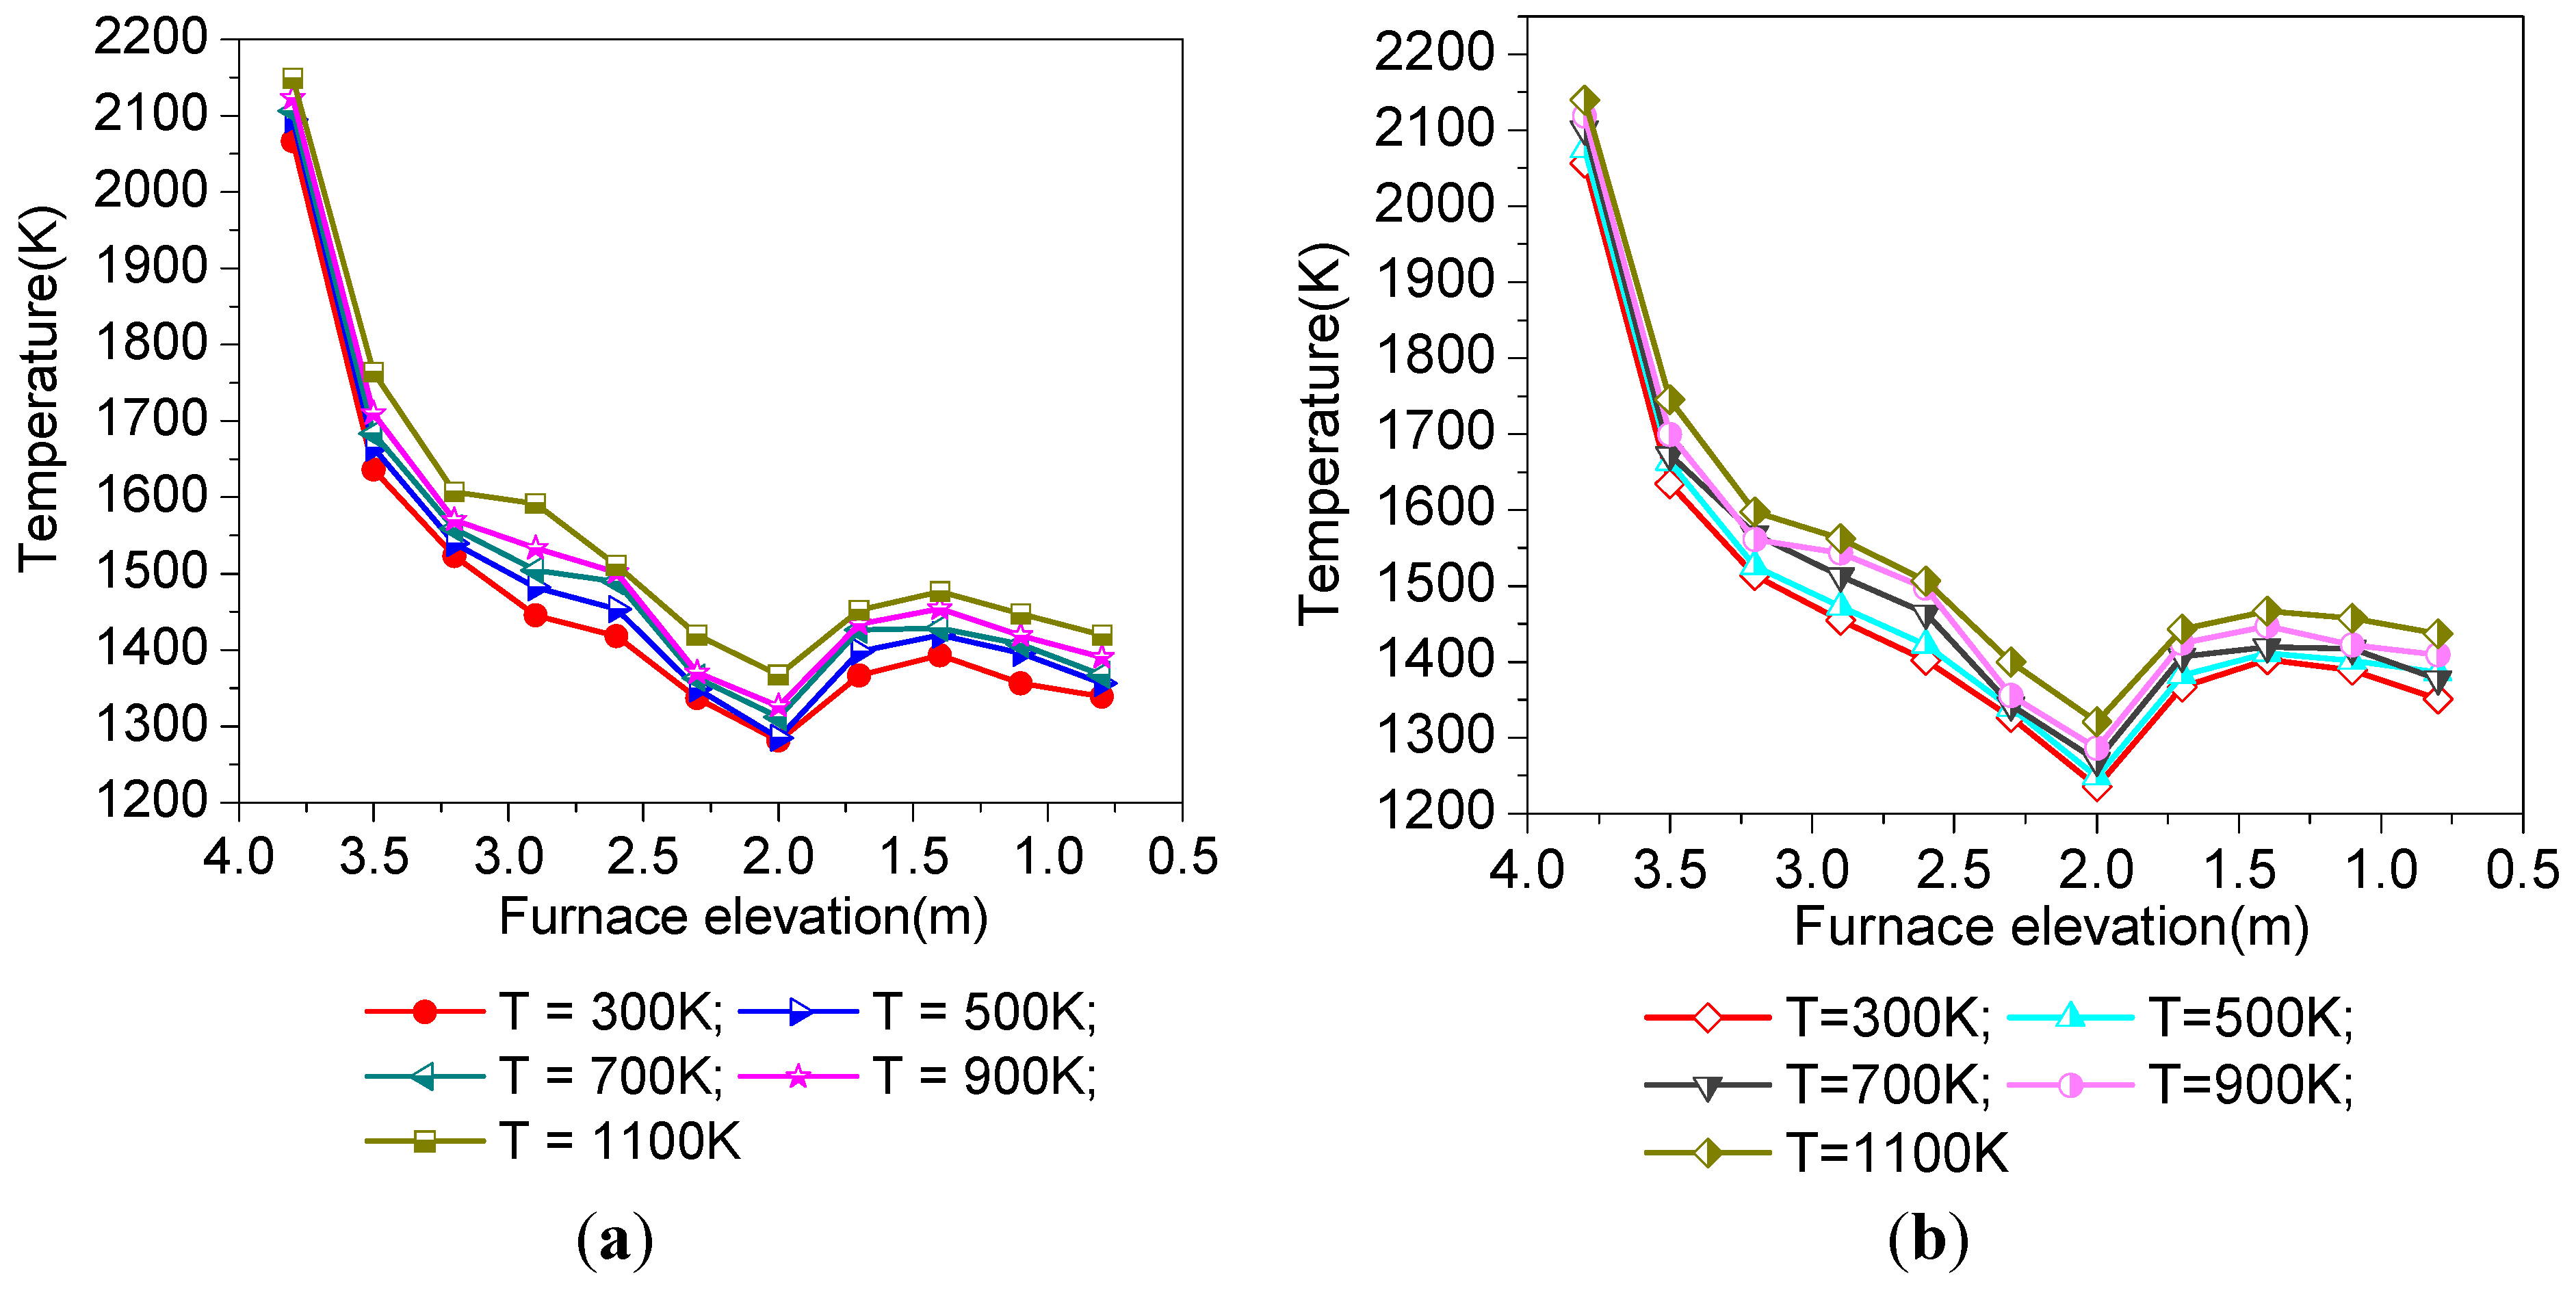
Temperature distributions along with the height of the furnace for both SAm reburning and cornstalk reburning under different secondary air temperatures are shown in Figure 10. It is shown that irrespective of the reburning fuel type, the temperature distributions show very similar characteristics for the reburning cases mentioned above.
Figure 10. Temperature distributions along with the height of the furnace under different temperatures of the secondary air: (a) SAm reburning; and (b) cornstalk reburning.
Energies 08 09434 g010
Additionally, it can be seen that for SAm reburning and cornstalk reburning with the same secondary air temperature, the primary zone temperature generally remains consistent. However, in the secondary zone, the cornstalk reburning temperature shows a greater decrease in comparison to SAm reburning. This can be explained by the cornstalk containing a lower CV. Therefore, in order for the cornstalk to match the same Rff and α as SAm reburning, a higher feed rate of cornstalk and air is required. In this oxygen deficient atmosphere (reburn zone), fuels undergo complex thermochemical (pyrolysis) reactions, and these reactions can be mainly endothermic. Once the reactants enter the burnout zone, the temperature increases owing to the addition of the burnout air. With a closer distance to the exhaust outlet, there is a slight decrease in the temperature. Higher furnace temperatures for SAm reburning and cornstalk reburning are observed with respect to increased secondary air temperatures.
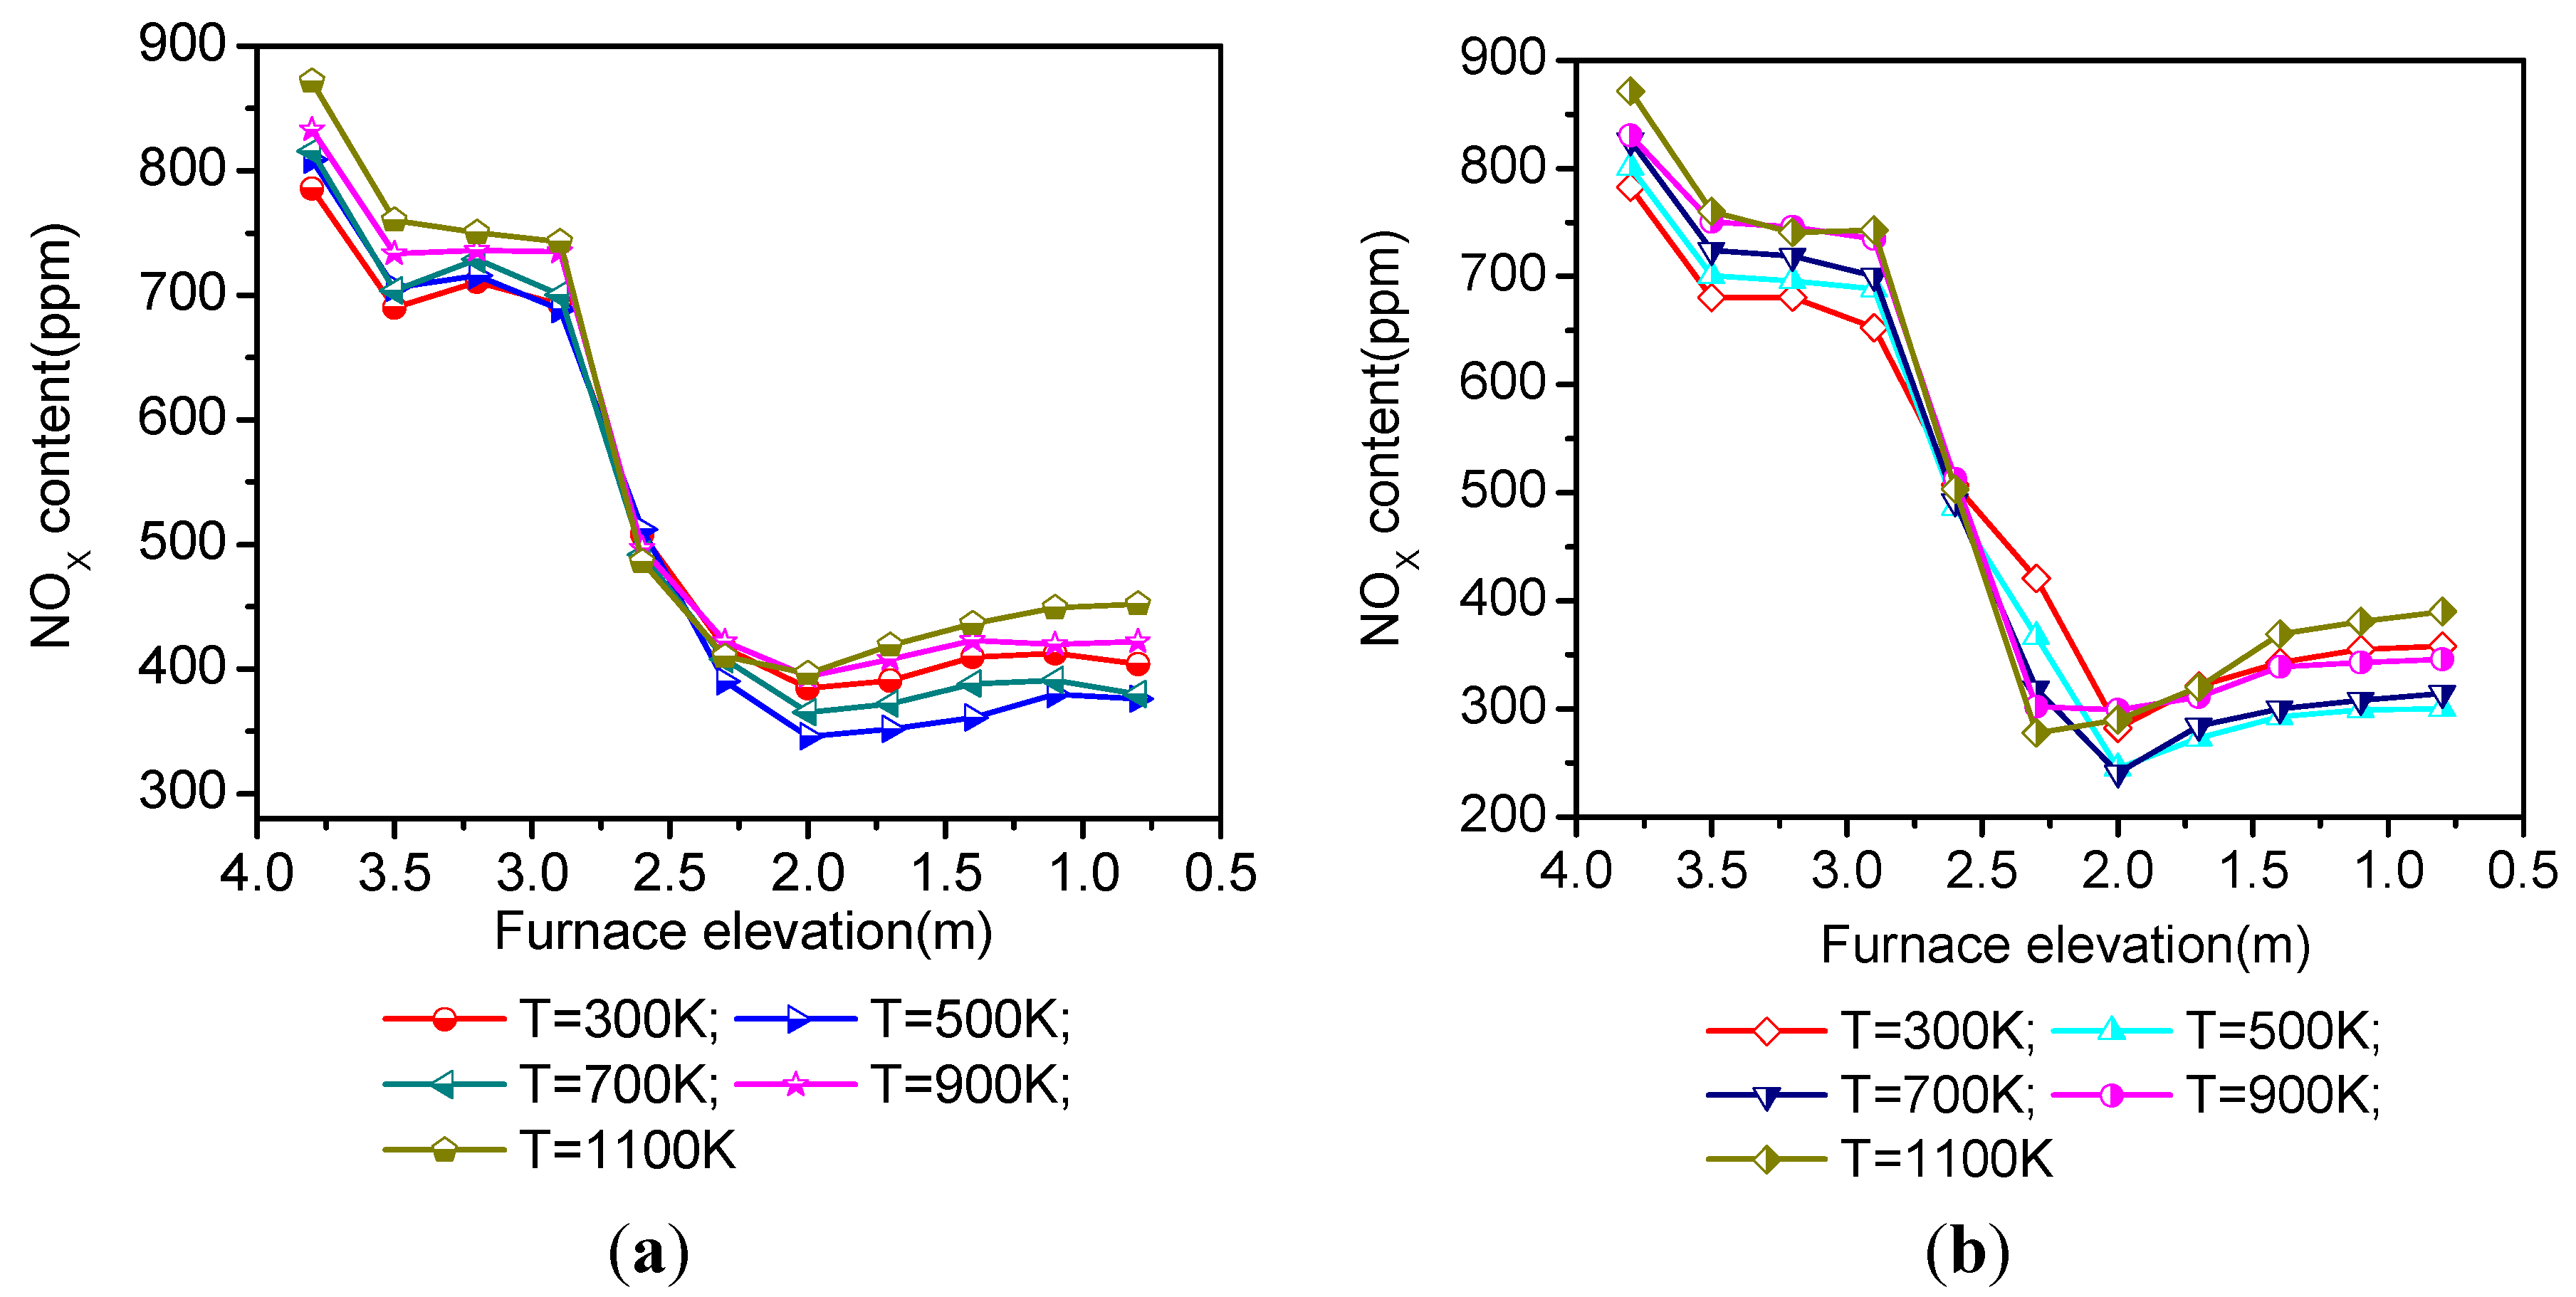
For NOx distributions, Figure 11 shows this trend clearly. SAm reburning and cornstalk reburning show similar NOx reduction characteristics. In the primary zone, due to the higher temperature of the secondary air, or the furnace, formation of the thermal NOx and the rate of the chemical reactions are promoted. Therefore, there is a trend that the higher the temperature of the secondary air, the higher the concentration of NOx formation for both SAm reburning and cornstalk reburning in this stage. However, in the upper region of the reburn zone, an increase in the secondary air temperature corresponds to a higher NOx removal rate. This is considered as a result of an increased rate of the reburn fuel undergoing pyrolytic reactions, which are largely promoted by a higher secondary air temperature within the reburn zone. Therefore, the concentrations of the products NH3 and HCN formed from the initial release of hydrocarbon (CXHY) radical intermediates and char are higher. According to Equations (21) and (22), the chemical rates of reaction can be significantly increased as a result of a temperature increase. The materials containing a greater excess of hydrocarbon radicals react with the NOx formed in the primary zone following the global chemical mechanisms detailed in Equations (16)–(18).
Figure 11. NOx distributions along with the height of the furnace at different secondary air temperatures: (a) SAm reburning; and (b) cornstalk reburning.
Energies 08 09434 g011
CO and H2 generated during the process of the pyrolysis and combustion are also involved in the reduction reaction as shown by Equations (23) and (24):
CO+NO N 2 +CO 2
H 2 + 2 NO N 2 + H 2 O
However, when it comes to the lower part of the reburn zone, NO content begins to show different trends, and for the cases with higher temperature, for example 1100 K, NO concentration is slightly higher than the 900 K case. The burnout zone also exhibits a trend showing the higher the temperature of the secondary air, the greater the NO generated.
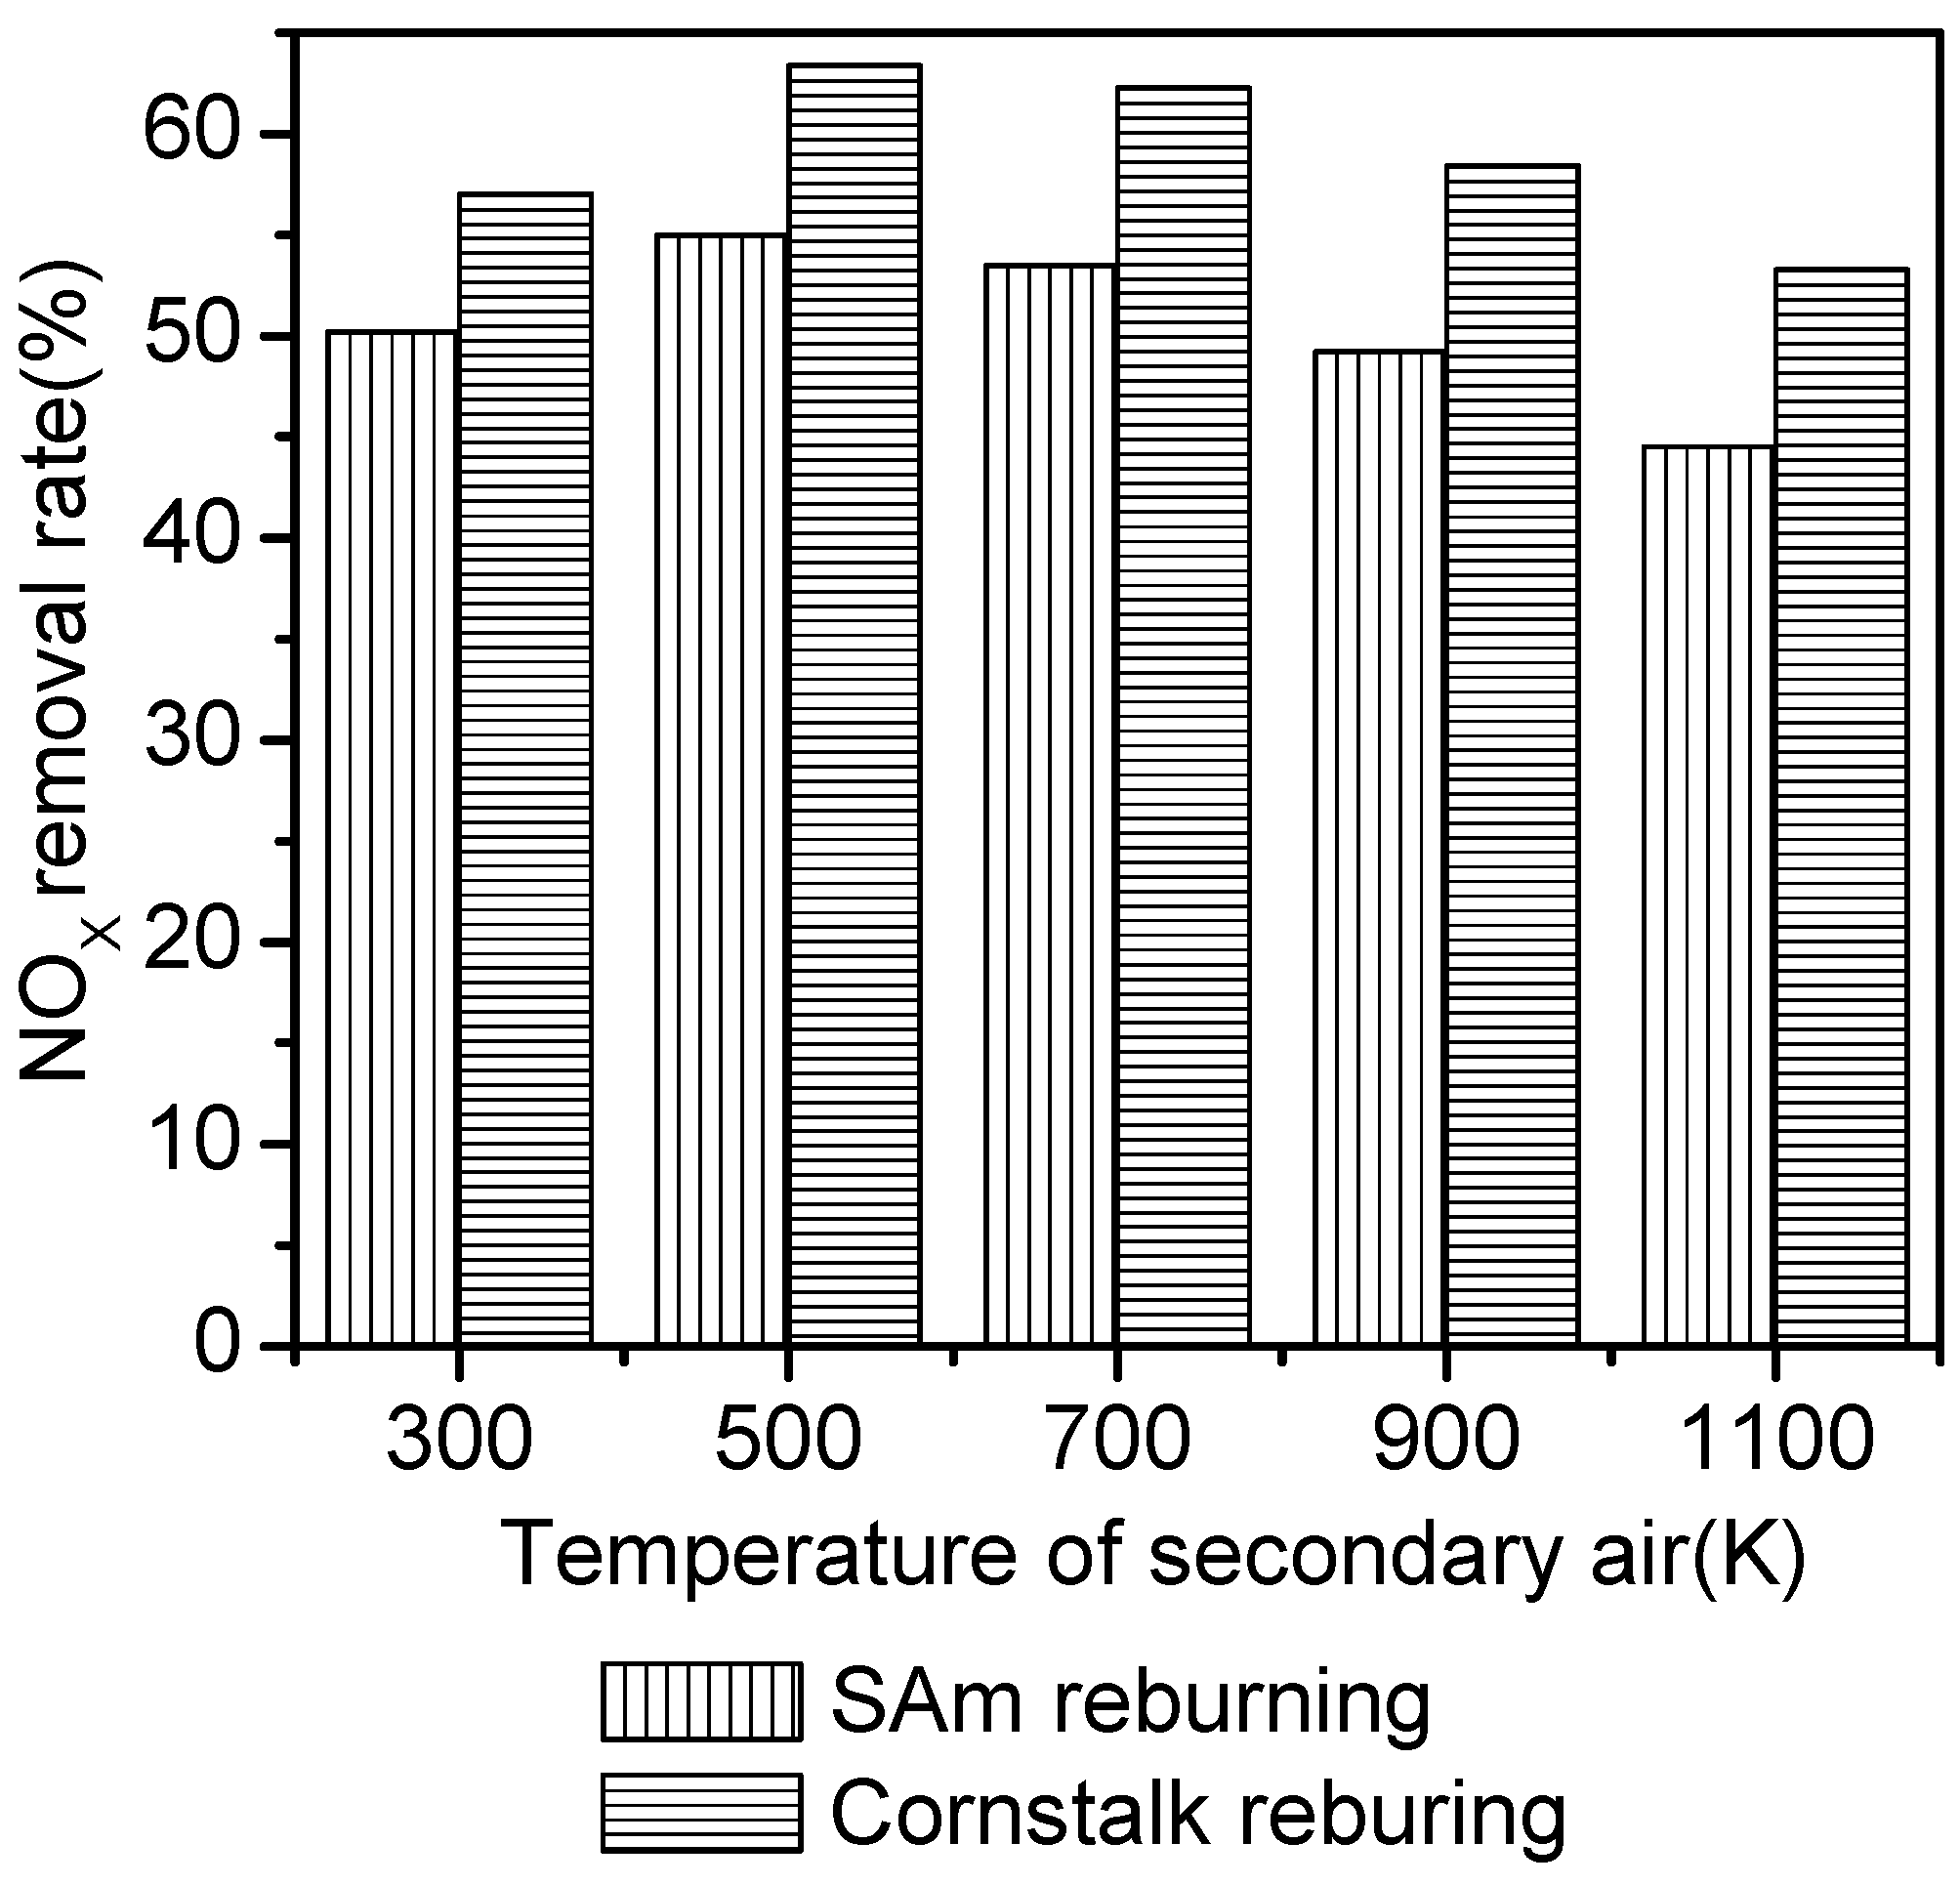
Figure 12 shows the NOx removal rate at different secondary air temperatures. It can be found for both SAm reburning and cornstalk reburning, in the lower temperature range, an increase in the secondary air temperature results in a higher NOx removal rate. However, when the temperature of the secondary air increases to 500 K, NOx emissions also increase corresponding to a lower NO
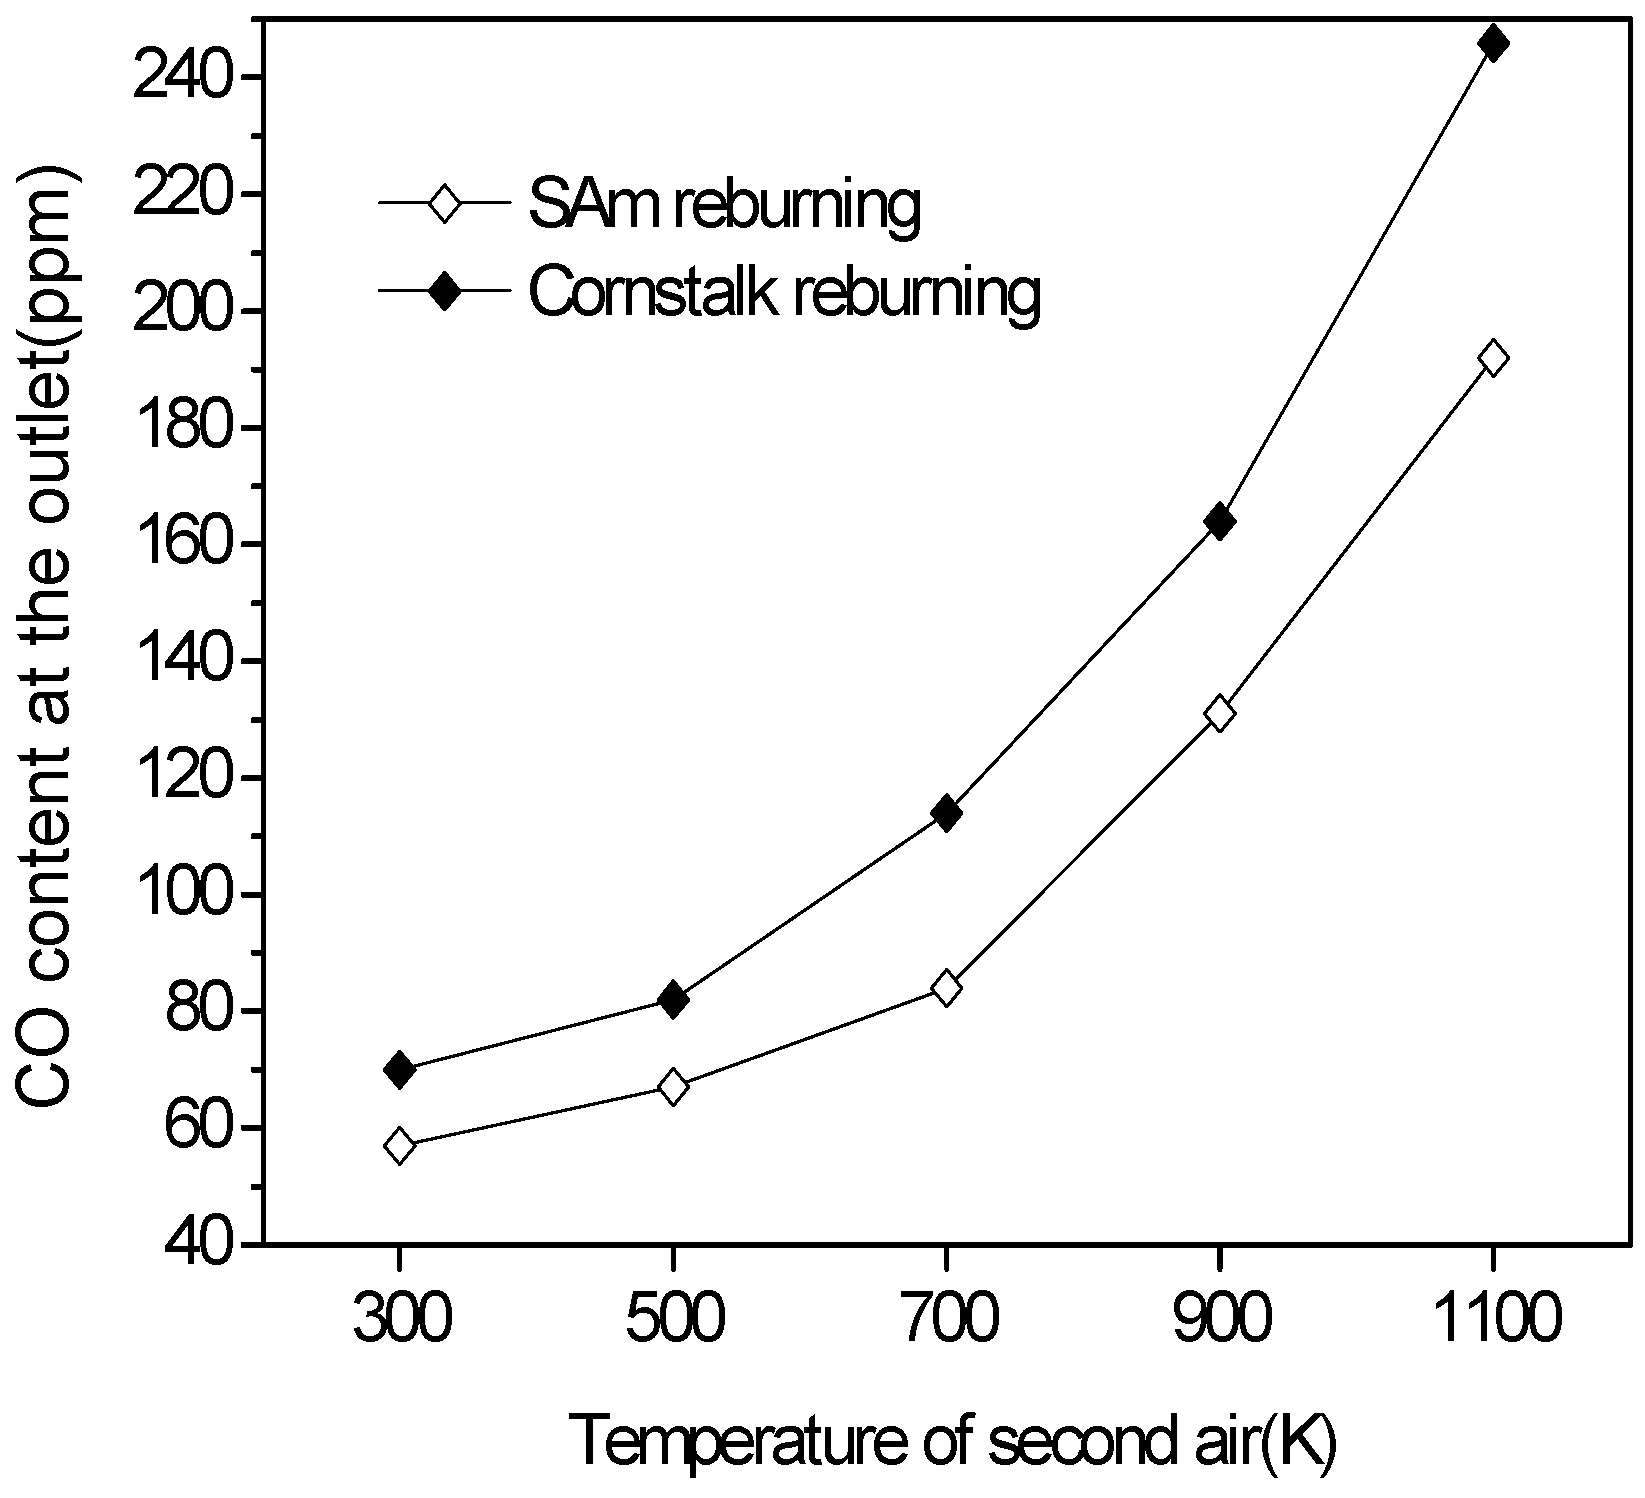
x removal rate. To analyse the burnout characteristics of the fuel, CO emissions for different cases are shown in Figure 13. It is observed that higher secondary air temperatures follow higher CO emissions for both SAm reburning and cornstalk reburning. For SAm reburning, CO emission reaches 131 ppm at a secondary air temperature of 900 K, which is 47 ppm greater than the CO concentration at 700 K, whereas for cornstalk reburning, CO emissions rapidly increase to 114 ppm when the temperature of the secondary air changes from 500 K to 700 K. Therefore, considering the two factors CO emissions and NO removal rate, it is found that the secondary air temperature of 500 K promotes relatively good case denitration conditions for both reburning cases.
Figure 12. NOx removal rate at different temperatures of the secondary air.
Energies 08 09434 g012
Figure 13. CO content at the outlet under different temperatures of the secondary air.
Energies 08 09434 g013

4. Conclusions

Reburn zone excess air coefficient, reburning fuel fraction and the secondary air temperature have influences to varying degrees on the combustion of the furnace and NOx reduction.
For both SAm reburning and cornstalk reburning, NOx removal rates increase with a decrease in the reburn zone excess air coefficient within the simulation data range. The relatively good case of α = 0.87 represents the NOx reduction efficiencies as being 56.15% and 66.89% for SAm reburning and cornstalk reburning, respectively.
The influences of reburning fuel fraction on denitration present an initial increase in NOx reduction, and when the reburning fuel fraction is increased beyond a specific value, the NOx reduction efficiency remains almost unchanged. Furthermore, cases with higher reburning fuel fraction have higher CO emissions. Besides, under the premise of the fuel burnout, the relatively good case occurs at the reburning fuel fraction set to 20% for the two kinds of fuel reburning, and the NOx removal rate is 60.57% and 52.96% for cornstalk reburning and SAm reburning, respectively.
The secondary air temperature has a certain degree of influence on NOx reduction for both SAm reburning and cornstalk reburning. In the relatively lower temperature range, increasing the secondary air temperature can effectively improve the denitration effect. However, beyond a specific value in the secondary air temperature, the denitration effect declines. The minimum NOx concentration reached by SAm reburning and cornstalk reburning is 372.1 ppm and 303 ppm, respectively. This corresponds to NOx removal rates of 55% and 63.36% for SAm reburning and cornstalk reburning, respectively.
Therefore, as for solid fuel reburning application, it is concluded that: (a) cornstalk can be used as a reburning fuel; (b) NOx reduction capacity of cornstalk reburning is superior to that of SAm reburning; and (c) CO emissions of cornstalk reburning are higher than that of SAm reburning. Further studies will focus on the changes of multiple parameters including the size of burnout zone and the injection of burnout air to find a relatively good case for low NOx and CO emissions.

Acknowledgments

This work was financially supported by the National Natural Science Foundation of China (Grant No.51276055) and the Hebei Applied Basic Research Program of China (Grant No. 13964503D).

Author Contributions

Xiang Gou, Zifang Wang and Yurou Liu conceived and designed the simulation. Zifang Wang, Yurou Liu and Xiang Gou carried out the simulation. Surjit Singh and Xiang Gou carried out the experimental case. Zifang Wang, Yurou Liu, Xiang Gou, and Meng Si participated in the analysis of the data and writing the initial manuscript. Surjit Singh, Xiang Gou, Enyu Wang, Liansheng Liu and Jinxiang Wu revised the manuscript and adjusted the data presentation. All authors have read and approved the manuscript.

Conflicts of Interest

The authors declare no conflict of interest.

References

  1. Sun, J.W.; Yan, W.P.; Zhao, W.J.; Li, H.Y.; Lin, J.H. Numerical study on biomass gas reburning in a 600 MW supercritical coal fired-boiler. J. Chin. Soc. Power Eng. 2012, 32, 89–95. [Google Scholar]
  2. Dimitriou, D.J.; Kandamby, N.; Lockwood, F.C. A mathematical modelling technique for gaseous and solid fuel reburning in pulverised coal combustors. Fuel 2003, 82, 2107–2114. [Google Scholar] [CrossRef]
  3. Su, S.; Xiang, J.; Sun, L.S.; Zhang, Z.X.; Sun, X.X.; Zheng, C.G. Numerical simulation of nitric oxide destruction by gaseous fuel reburning in a single-burner furnace. Proc. Combust. Inst. 2007, 31, 2795–2803. [Google Scholar] [CrossRef]
  4. Bilbao, R.; Millera, A.; Alzueta, M.U.; Prada, L. Evaluation of the use of different hydrocarbon fuels for gas reburning. Fuel 1997, 76, 1401–1407. [Google Scholar] [CrossRef]
  5. Bertran, C.A.; Marques, C.S.T.; Filho, R.V. Reburning and burnout simulations of natural gas for heavy oil combustion. Fuel 2004, 83, 109–121. [Google Scholar] [CrossRef]
  6. Hu, X.Y.; Wang, T.; Dong, Z.H.; Zhang, H.F.; Dong, C.Q. Research on the gas reburning in a circulating fluidized bed (CFB) system integrated with biomass gasification. Energies 2012, 5, 3167–3177. [Google Scholar] [CrossRef]
  7. Han, K.H.; Liu, Z.C.; Gao, P.; Lu, C.M.; Cheng, Z.J.; Ding, L.X. Experimental study on characteristics of nitrogen oxides reduction by biomass reburning. J. China Coal Soc. 2008, 33, 570–574. [Google Scholar]
  8. Pisupati, S.V.; Bhalla, S. Numerical modeling of NOx reduction using pyrolysis products from biomass-based materials. Biomass Bioenergy 2008, 32, 146–154. [Google Scholar] [CrossRef]
  9. Visona, S.P.; Stanmore, B.R. Modeling nitric oxide formation in a drop tube furnace burning pulverized coal. Combust. Flame 1999, 118, 61–75. [Google Scholar] [CrossRef]
  10. Casaca, C.; Costa, M. NOx control through reburning using biomass in a laboratory furnace: Effect of particle size. Proc. Combust. Inst. 2009, 32, 2641–2648. [Google Scholar] [CrossRef]
  11. Harding, N.S.; Adams, B.R. Biomass as a reburning fuel: a specialized cofiring application. Biomass Bioenergy 2000, 19, 429–445. [Google Scholar] [CrossRef]
  12. Adams, B.R.; Harding, N.S. Reburning using biomass for NOx control. Fuel Process. Technol. 1998, 54, 249–263. [Google Scholar] [CrossRef]
  13. Liu, J.; Gao, S.; Jiang, X.; Shen, J.; Zhang, H. NO emission characteristics of superfine pulverized coal combustion in the O2/CO2 atmosphere. Energy Convers. Manag. 2014, 77, 349–355. [Google Scholar] [CrossRef]
  14. Liu, H.; Hampartsoumian, E.; Gibbs, B.M. Evaluation of the optimal fuel characteristics for efficient NO reduction by coal reburning. Fuel 1997, 76, 985–993. [Google Scholar] [CrossRef]
  15. Hill, S.C.; Smoot, L.D. Modeling of nitrogen oxides formation and destruction in combustion systems. Prog. Energy Combust. Sci. 2000, 26, 417–458. [Google Scholar] [CrossRef]
  16. Chou, C.P.; Chen, J.Y.; Yam, C.G.; Marx, K.D. Numerical Modeling of NO Formation in Laminar Bunsen Flames—A Flamelet Approach. Combust. Flame 1998, 114, 420–435. [Google Scholar] [CrossRef]
  17. Miller, J.A.; Klippenstein, S.J.; Glarborg, P. A kinetic issue in reburning: The fate of HCNO. Combust. Flame 2003, 135, 357–362. [Google Scholar] [CrossRef]
  18. Nguyen, H.M.T.; Nguyen, T.N. Calculations on the complex mechanism of the HCNO + OH reaction. Chem. Phys. Lett. 2014, 599, 15–22. [Google Scholar] [CrossRef]
  19. Taniguchi, M.; Kamikawa, Y.; Shibata, T.; Yamamoto, K.; Kobayashi, H. Application of the NOx reaction model for development of low-NOx combustion technology for pulverized coals by using the gas phase stoichiometric ratio index. Energies 2011, 4, 545–562. [Google Scholar] [CrossRef]
  20. Cancès, J.; Commandré, J.M.; Salvador, S.; Dagaut, P. NO reduction capacity of four major solid fuels in reburning conditions – Experiments and modeling. Fuel 2008, 87, 274–289. [Google Scholar] [CrossRef]
  21. Hardy, T.; Kordylewski, W. Effective of polish lignite as reburn fuels. Fuel 2002, 81, 837–840. [Google Scholar] [CrossRef]
  22. Niu, S.L.; Lu, C.M. NOx reduction using biomass as reburning fuel. J. Fuel Chem. Technol. 2008, 36, 583–587. [Google Scholar]
  23. Yang, W.H.; Blasiak, W. Mathematical modelling of NO emissions from high-temperature air combustion with nitrous oxide mechanism. Fuel Process. Technol. 2005, 86, 943–957. [Google Scholar] [CrossRef]
  24. Frassoldati, A.; Faravelli, T.; Ranzi, E. Kinetic modeling of the interactions between NO and hydrocarbons at high temperature. Combust. Flame 2003, 135, 97–112. [Google Scholar] [CrossRef]
  25. Liu, H.T.; Han, K.H.; Lu, C.M.; Li, H. Experimental study on reburning/advanced reburning performance of limestone modified by wood vinegar for NO reduction under O2/CO2 atmosphere. J. Fuel Chem. Technol. 2013, 41, 228–234. [Google Scholar] [CrossRef]
  26. Kuhnemuth, D.; Normann, F.; Andersson, K.; Johnsson, F. On the carbon monoxide formation in oxy-fuel combustion—Contribution by homogenous and heterogeneous reactions. Int. J. Greenh. Gas Con. 2014, 25, 33–41. [Google Scholar] [CrossRef]
  27. Shim, S.H.; Jeong, S.H.; Lee, S.S. Reduction in nitrogen oxides emissions by MILD combustion of dried sludge. Renew. Energy 2014, 65, 29–35. [Google Scholar] [CrossRef]
  28. Zhang, J.J.; Yang, Y.P.; Hu, X.Y.; Dong, C.Q.; Lu, Q.; Qin, W. Experimental research on heterogeneous N2O decomposition with ash and biomass gasification gas. Energies 2011, 4, 2027–2037. [Google Scholar] [CrossRef]
  29. Nimmo, W.; Singh, S.; Gibbs, B.M.; Williams, P.T. The evaluation of waste tyre pulverised fuel for NOx reduction by reburning. Fuel 2008, 87, 2893–2900. [Google Scholar] [CrossRef]
  30. Singh, S.; Nimmo, W.; Gibbs, B.M.; Williams, P.T. Waste tyre rubber as a secondary fuel for power plants. Fuel 2009, 88, 2473–2480. [Google Scholar] [CrossRef]

