1. Background
Biofuel production is a promising alternative source of energy which provides advantages such as displacement of fossil-based fuels, reduction of greenhouse gas emissions, among others [
1]. Biofuels can be classified according to the type of biomass utilized as follows: (1) first-generation biofuels are produced from organic sources commonly used as food for human consumption (e.g., sorghum, corn, among others); (2) second-generation biofuels are obtained from a wide range of non-food sources such as agricultural and forest residues, energy crops, and municipal solid waste; and (3) third-generation biofuels commonly refer to biofuels produced from algae [
2]. This paper focuses on second-generation biofuels using a type of energy crop (i.e., switchgrass). The production of second-generation biofuels involves activities like harvesting, extracting, transporting and feedstock handling that can be enhanced to improve the biofuel supply chain performance [
3,
4]. Feedstock logistics play a relevant role in the optimization of the whole supply chain. Identifying factors in logistics operations that affect feedstock properties and its quality helps to improve the production of reliable biofuels.
Biomass refers to the organic feedstock from living or recently living beings, which can be used for energy production. Lignocellulosic biomass (LCB) is a plant-derived feedstock, mainly composed of cellulose, hemicellulose and lignin. Corn stover, wheat straw and switchgrass are examples of LCB with different properties such as the percentage of cellulose, hemicellulose and lignin in their chemical composition. LCB composition is directly related with the output in the energy conversion process; for example, a high percentage of cellulose leads to higher levels of biofuel production because cellulose is the raw material for biofuel production with technologies based on sugar degradation [
5,
6]. In supply chain operations, increasing our understanding of factors that affect the biomass composition (e.g., storage days, indoor/outdoor storage, among others) can lead to logistics improvements that maintain best operational conditions.
Densification of biomass is a common example of a supply chain operation that consists in changing the feedstock natural format by agglomerating the raw material into smaller structures. The densification process improves handling, storing, and transportation in the distribution of biomass [
7,
8]. Traditional densification systems include operations like baling, pelletization, extrusion and briquetting.
Densification of biomass and logistical operations involved affect quality attributes of biomass such as moisture content, unit density, bulk density, durability index and calorific value that are important for a reliable supply to biorefineries [
9]. Also, densification process has shown influence in the chemical composition of biomass [
10,
11,
12], which is in turn related with the aforementioned quality attributes [
11,
13] and with the efficiency of the conversion process. Thus, reducing the variance of biomass chemical composition can lead to high quality densified biomass such as switchgrass, corn stover, and miscanthus, among others.
Switchgrass is a perennial warm-season grass that is utilized as a lignocellulosic feedstock for biofuel production and several studies regarding its properties have been made [
14,
15,
16,
17]. Harvesting periods, pre-treatments, storage conditions and handling operations seem to affect the switchgrass chemical composition. Kline et al. [
8] showed that harvesting periods affect the feedstock composition even more than soil type.
Researchers in the field have studied baling effects in feedstock properties. For example, an analysis of switchgrass composition in large round bales, stored in outdoor conditions with no protection for two different periods of 26 weeks after harvest, was performed by Wiselogel et al. [
18]. Hemicellulose concentration was lower after the storage time. Moreover, ash was higher and xylan kept the same content in both periods. In the case of lignin content, the percentage was not the same in the different time intervals. The first period showed higher concentration of lignin, whereas the second period presented lower lignin content.
Another switchgrass analysis was made over bales stored in outdoor environment with different wrap material types by Shinners et al. [
19]. The storage time was 311 days and after that period, cellulose concentration increased, reaching the highest value with net cover and the concentration of hemicellulose and ash also increased after the stored period, but no effect due to wrap material was observed.
Khanchi et al. [
20] compared the influence of bale geometry over cellulose, hemicellulose and lignin. Two types of switchgrass bales, large round and large rectangular were analyzed after a storage period of 180 days in outdoors. The authors performed the experiment twice, each of them in a different year and both experiments showed higher cellulose content after storage time in rectangular bales. For round bales, the experiment in the first year showed a lower value for cellulose after storage while in the second year, the result was the opposite. Hemicellulose and lignin presented the same behavior in round and rectangular bales for both experiments.
In the works of Shinners et al. [
19] and Khanchi et al. [
20], the composition was analyzed at the beginning and at the end of the storage period. As a result, changes occurring throughout the storage period were not recorded.
Boyer et al. [
21] introduced a study to show the effects of three different factors: (1) particle size, (2) wrap type and (3) days in storage in the chemical contents of switchgrass (cellulose, hemicellulose, lignin, ash and extractives percentages). Cellulose, hemicellulose, lignin, ash and extractives content changed within the groups of particle size, wrap material and days in storage. Thus, all factors showed an influence on the feedstock composition. The model utilized for this study was a univariate analysis for every single chemical component without considering relationship with other components.
This paper significantly extends previous works by:
- (1)
Proposing a multivariate analysis (in this case a PCA) [
22,
23,
24,
25], with additional covariance/correlation information, to identify effects in the switchgrass composition due to selected controllable factors.
- (2)
Studying the weight of the bale as a controllable factor in the chemical composition analysis (this factor has not been included in previous analysis).
- (3)
Presenting a methodology to depict the contribution of factors such as storage days, particle size, wrap type and weight of the bale to the variance in the chemical composition.
Results from this statistical analysis serve to identify best practices within the most significant factors, and therefore, they can help determining conditions to enhance the quality of feedstock and, subsequently, lead to the design of robust biofuel supply chains.
The paper is structured as follows. In
Section 2, methodology for PCA is presented. In
Section 3, results of PCA are shown. Lastly,
Section 4,
Section 5 and
Section 6 present the conclusions, managerial insights and future work, respectively.
2. Methodology
In 2012, an experiment to study physical and chemical properties of switchgrass was performed at the Biomass Innovation Park in Vonore Tennessee. The feedstock (Alamo Switchgrass) was harvested and baled in a rectangular shape (1.2 × 0.9 × 2.4 m) with technology New Holland. A large square baler without a cutter, New Holland BB9080 (New Holland Agriculture, New Holland, PA USA), was utilized to process the LCB at the beginning of January 2012. After being baled, the feedstock was re-located to a covered location before pre-processing, and then, on February 2012 the biomass was unpacked and grinded with a Vermeer TG5000 tub grinder (Vermeer Corporation, Pella, IA, USA). Grinded switchgrass was sampled for moisture content and chemical composition; chemical composition was determined with near-infrared (NIR) technology. After sampling, the biomass was baled one more time with a BT3 industrial baler (TLA Bale Tech LLC, South Orange, NJ, USA) in order to produce round bales (1.2 m of diameter × 1.5 m of width). The bales were moved to storage in order to begin with the experiment.
The experiment was set up with a split-split plot design. Three controllable factors were included in the experiment: (1) storage days; (2) particle size; and (3) wrap type. Storage days had three groups under study, particle size had also three groups and wrap type had two groups. The data generated was utilized in Yu et al. and Boyer et al. [
14,
21]. This data was also utilized to conduct the analysis presented here. This data met all necessary conditions (normality, homogeneity and heteroscedacity); thus, no further pre-processing was needed for conducting our analysis.
Detailed information related to where the biomass was grown, harvested, baled, stored, among others important features, can be found in the work of Yu et al. and Boyer et al. [
14,
21]. Also, additional information about the infrared methodology used to determine the chemical composition of the feedstock can be found in the study of Kline et al. [
26] where a PCA was applied over the NIR spectra data, and then, information derived from PCA was used to build a partial least square (PLS) regression model to predict the chemical composition in the bales. It is worth noting that the chemical composition data generated from Kline et al. [
26], was utilized for the multivariate analysis conducted in this paper to investigate four logistics (harvesting and storing) factors.
Table 1 shows the factors and variables defined for this analysis. The wrap type refers to: (1) net mesh (excluding the two ends of the round bale) and net; (2) high tensile strength film wrapping the whole round bale (net and film). The particle size was categorized in three levels, according to particle size of baled switchgrass: PS1 (243.84 cm), PS2 (7.62 cm) and PS3 (1.27–1.91 cm). Storage days were defined in three levels: 75 days, 150 days and 225 days of storage. The bale weight was included in this study by defining two levels: low (957.65–1715.20 LB) and high (1715.21–2455.10 LB). The bale weight affects the material handling processes, storage conditions and storage facilities, among others.
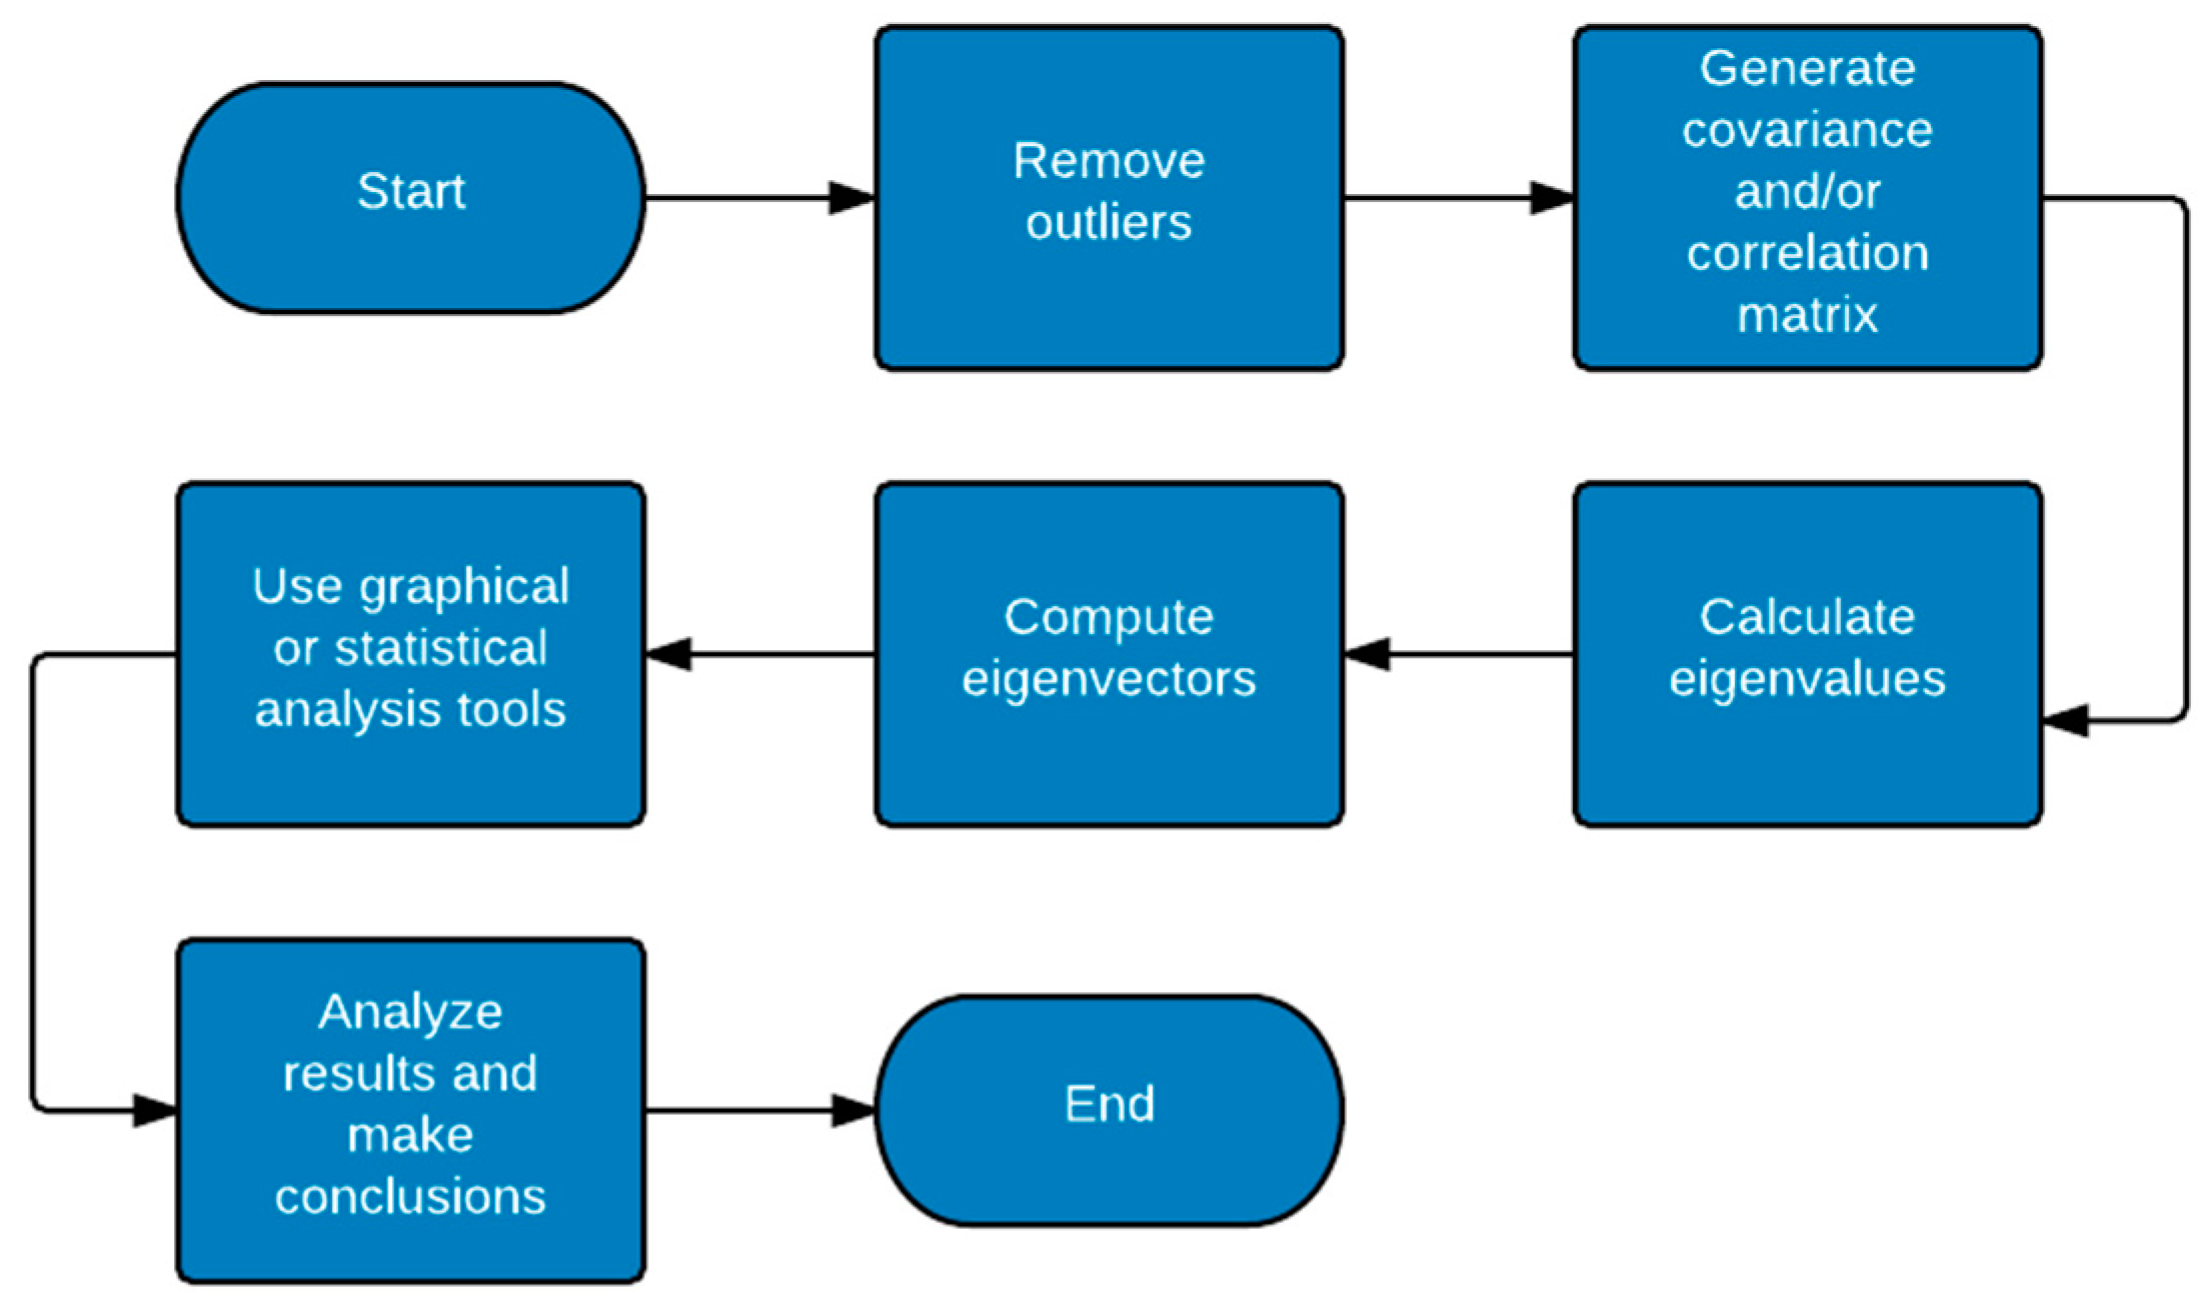
The variables in this analysis were: (1) cellulose—a glucose polymer linked by glycosidic bonds; (2) hemicellulose—a branched polymer of carbon sugars; (3) lignin—a structural constituent of plants, which consists of an aromatic system composed of phenyl proposal units; (4) ash—inorganic residue remaining after combustion at 550–600 °C; and (5) extractives—non-structural components that can be extracted with neutral solvents and include, but are not limited to, free sugars, proteins, chlorophyll, and waxes. The methodology to perform the multivariate analysis in this work, with factors and variable defined above, is summarized in five steps according to
Figure 1:
2.1. Principal Component Analysis
In the first step of this work, no potential outliers were found and all assumptions were met (Yu et al. and Boyer et al. [
14,
21]). Thus, the covariance/correlation matrix was generated (refer to
Table 2). The next step in the analysis was to perform an eigendecomposition, which involves computing eigenvalues and eigenvectors. The function prcomp ( ), included in the core package {stats} of R software environment [
27], has been utilized to make all the calculations related with the PCA. A Bartlett’s test of sphericity [
28,
29] was performed to determine the factorability of the correlation matrix. This test was also performed in R with the function bart_sphere ( ), included in the package {REdaS}. The resulting
p-value was 2.22 × 10
−16; therefore, the correlation matrix did not come from a population in which the correlation matrix is an identity matrix and the correlation information for this analysis was shown to be significant.
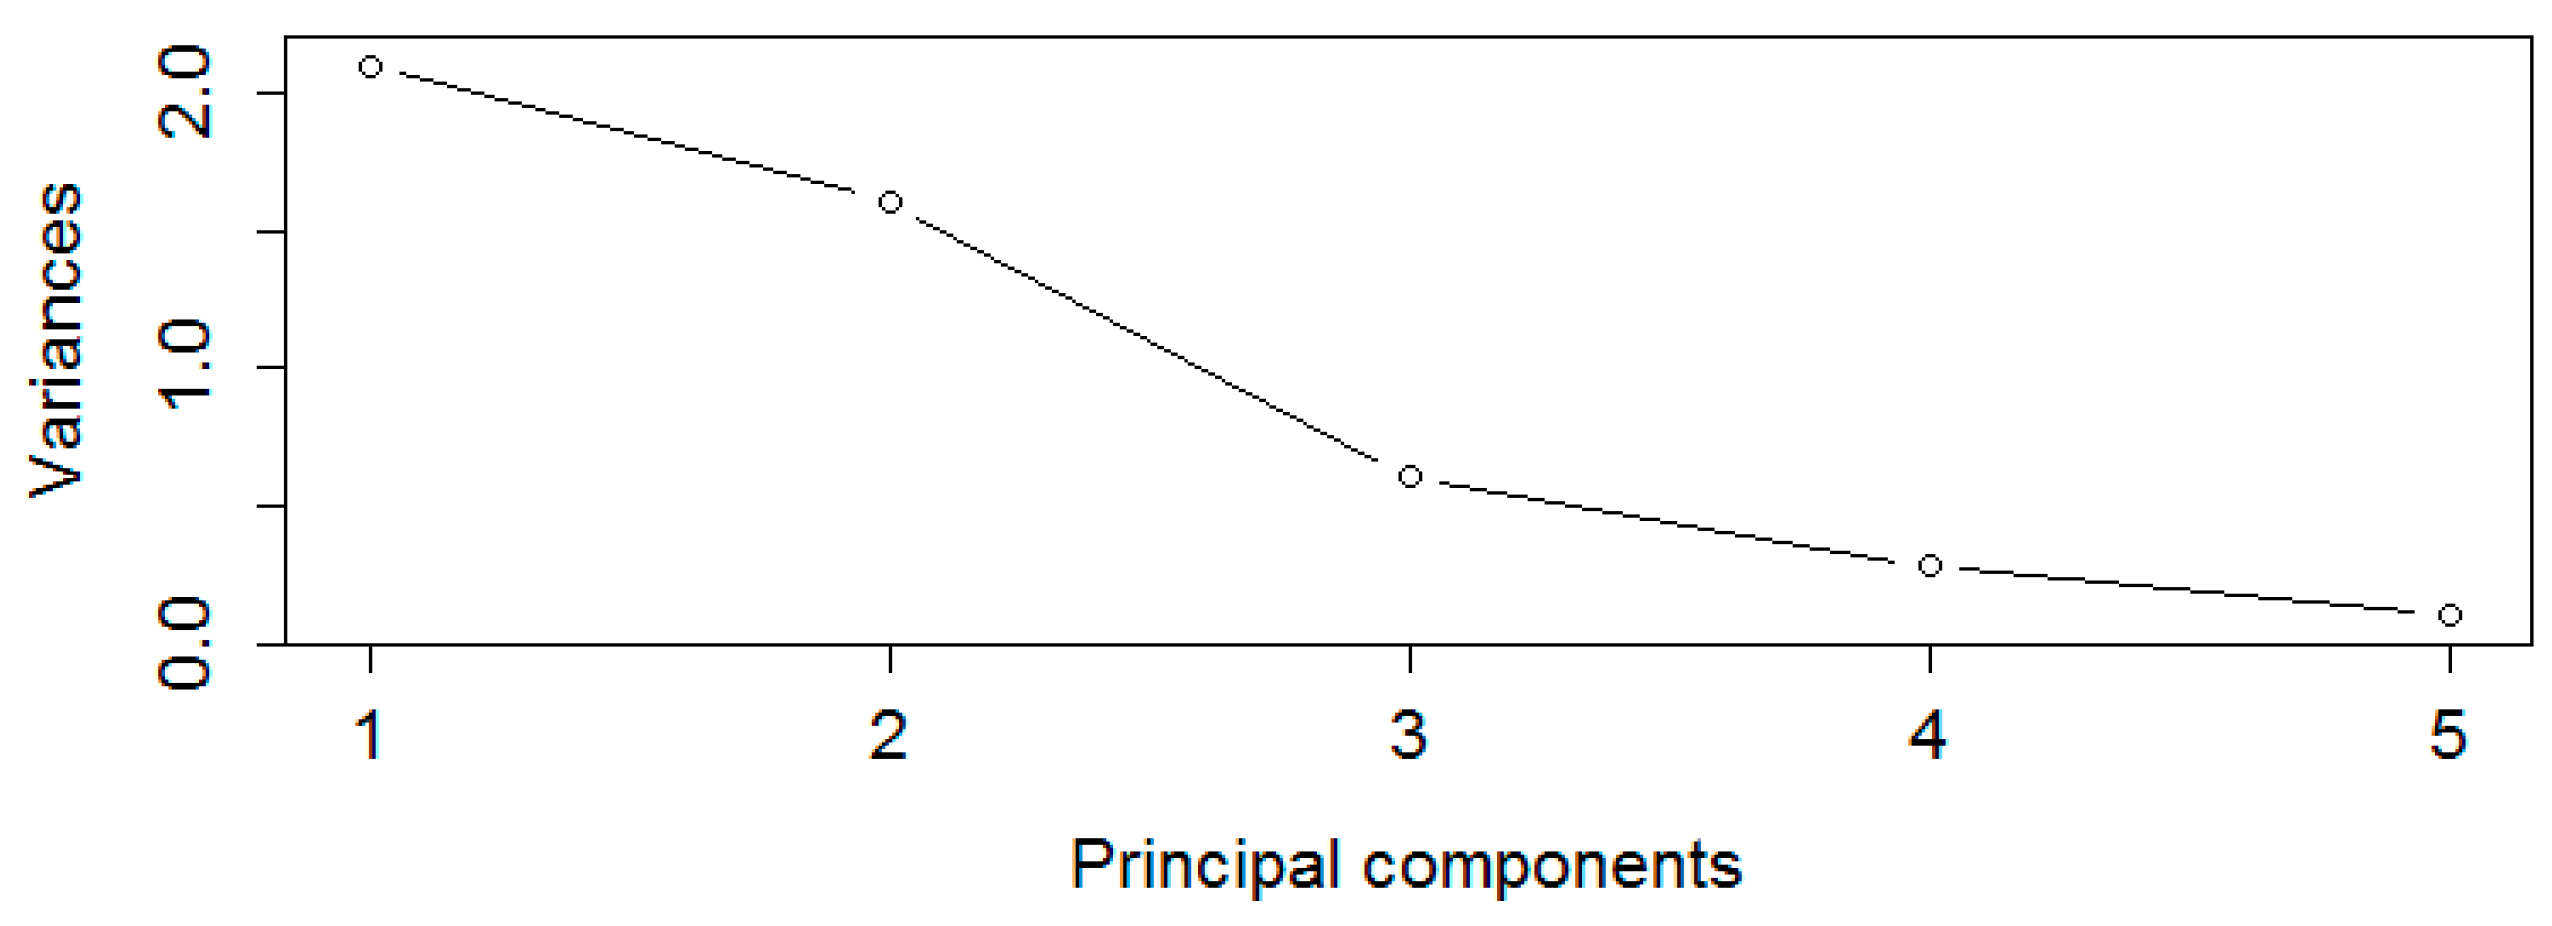
For the analysis of eigenvalues in the covariance matrix, it is useful to know the amount of variance contained in every principal component (PC). Principal components (PCs) considered in this analysis should have the majority of the total variance (main PCs). Then, the controllable factors should be related with the main PCs in order to determine those factors with the biggest influence in the chemical composition of the feedstock under study.
According to
Table 3, the first two principal components represented approximately almost 80% of the total variance. Besides the eigenanalysis,
Figure 2 shows the relation between principal components and eigenvalues (variance of each PC). A common rule of thumb to determine the main PCs is that the principal components with eigenvalues above one should be included in the analysis.
According to
Figure 2 and
Table 3, PC1 and PC2 were included in this analysis (main PCs) since their eigenvalues were above one and the amount of variance was up to approximately 80%. Eigenvalues are also needed to determine the eigenvectors, that is, the orthogonal directions where largest variance is present. In
Table 4, the eigenvectors are shown. The higher the eigenvector magnitude, the more correlation between the original variable and the principal component; they are either directly or inversely proportional (depending on their sign).
The more correlated variables within each principal component were:
- (1)
PC1—cellulose and extractives (C&E).
- (2)
PC2—hemicellulose (HEM).
- (3)
PC3—lignin and extractives (L&E).
- (4)
PC4—cellulose and ash (C&A).
- (5)
PC5—lignin and ash (L&A).
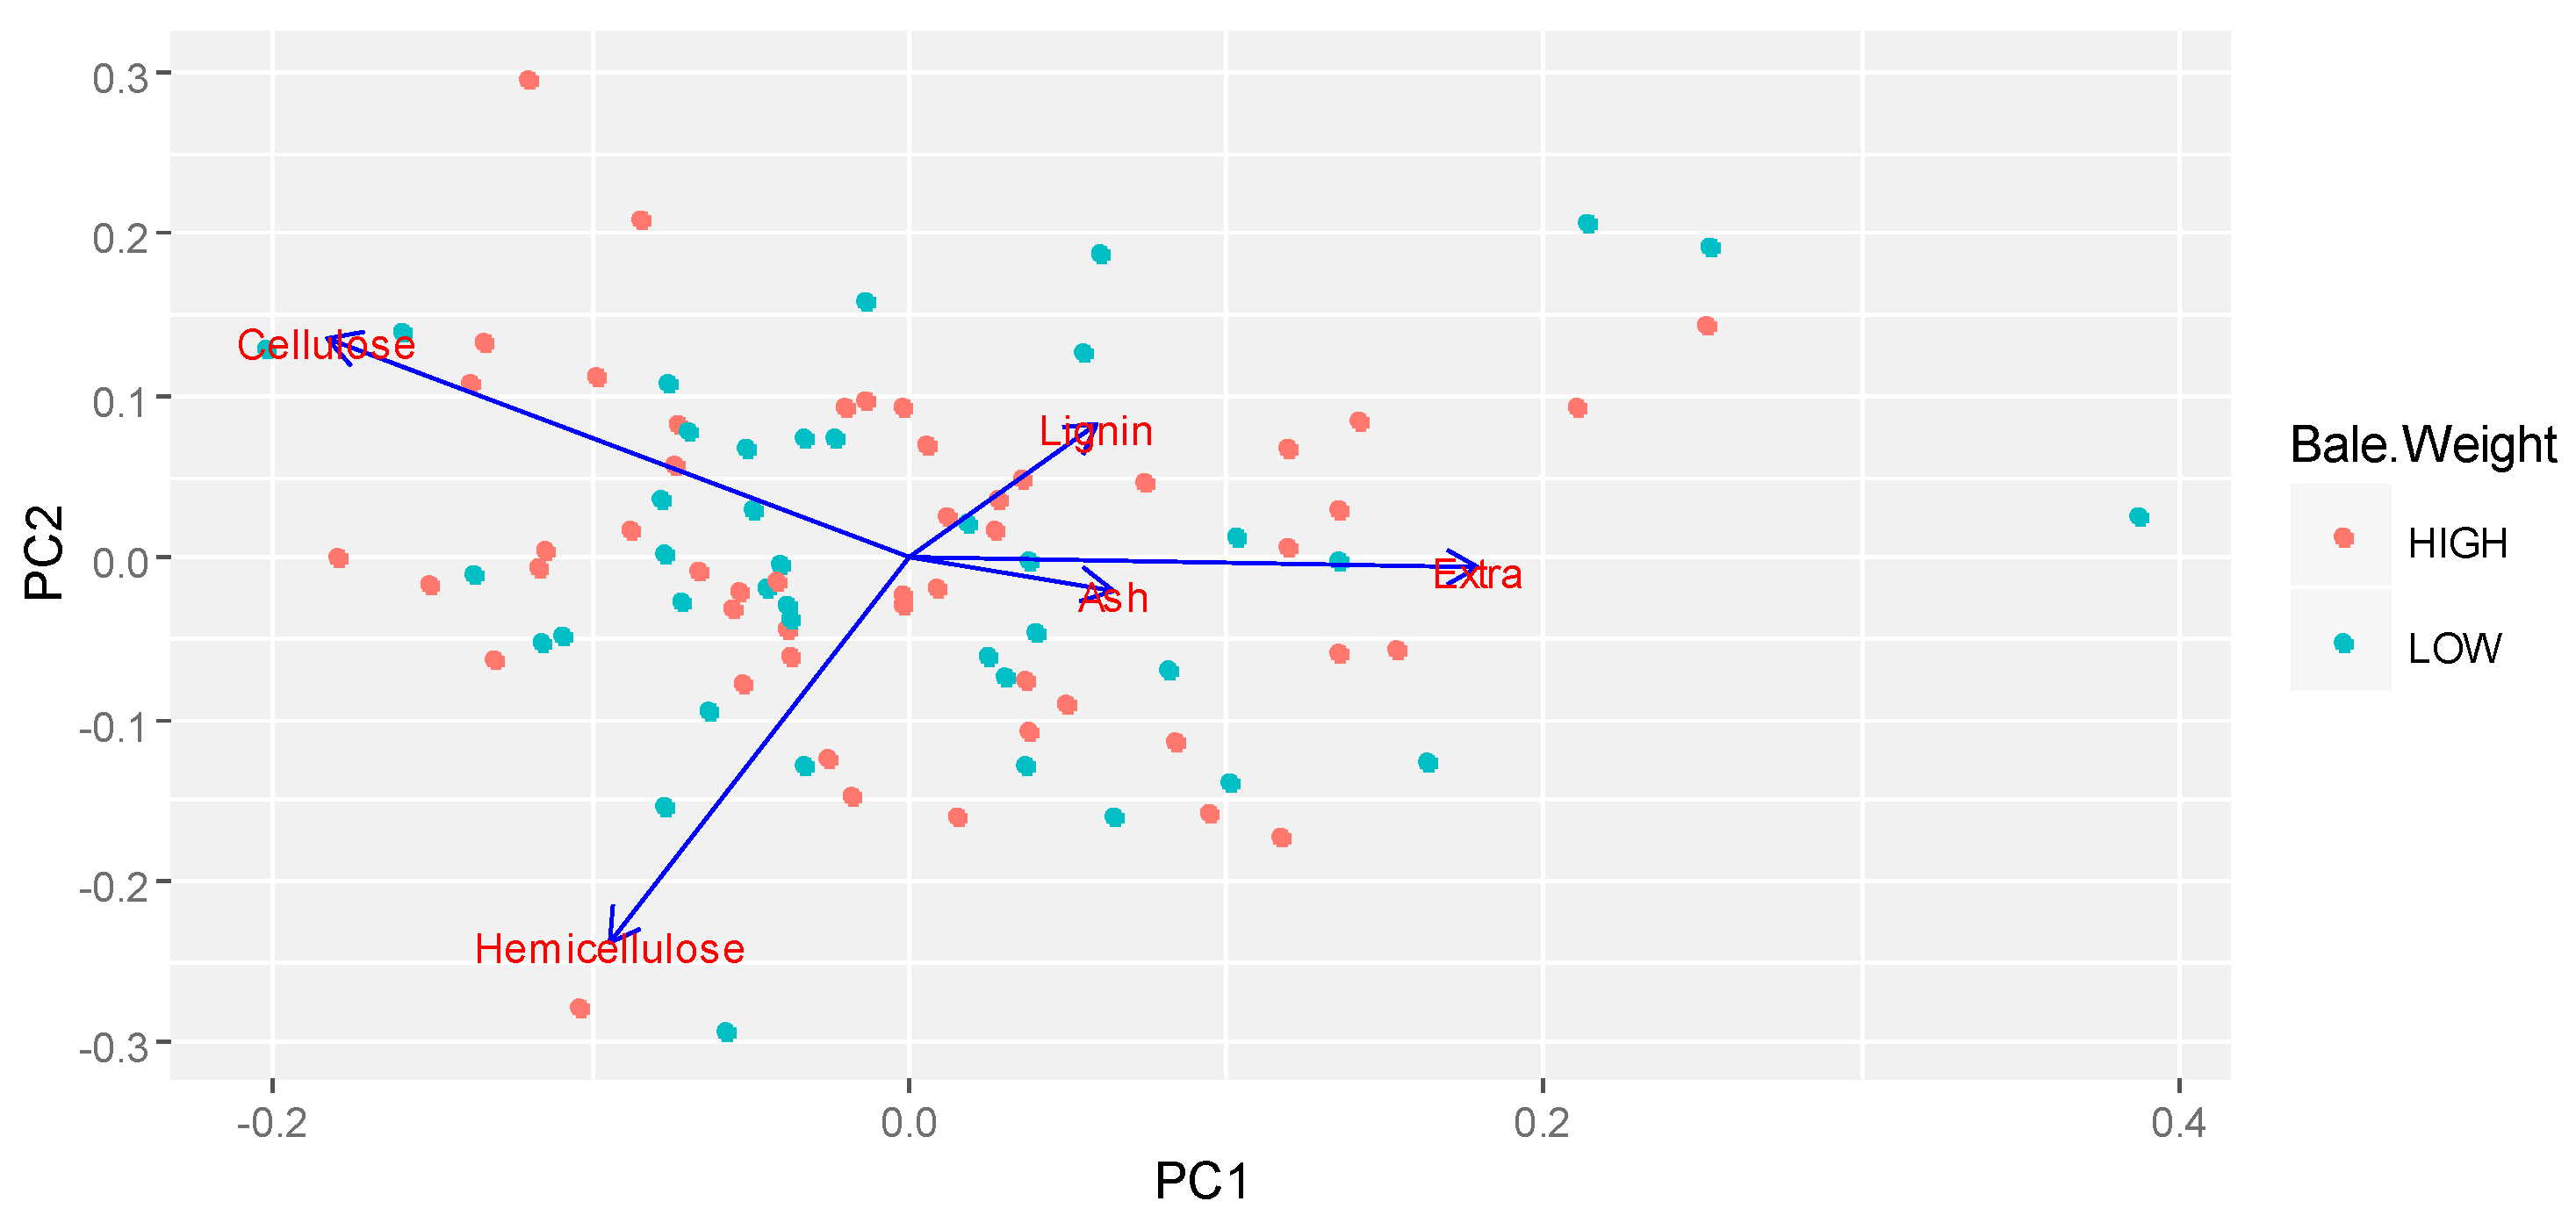
An improvement in the value of PC1 (C&E) resulted in an increment in the value of extractives and a decrement in the value of cellulose, whereas a reduction in this principal component implied an improvement in the cellulose value and a decrease in the value of extractives, as shown in
Table 4. Similarly, in PC2 (HEM), an increase in the value of this component represented a reduction in the value of hemicellulose and vice versa.
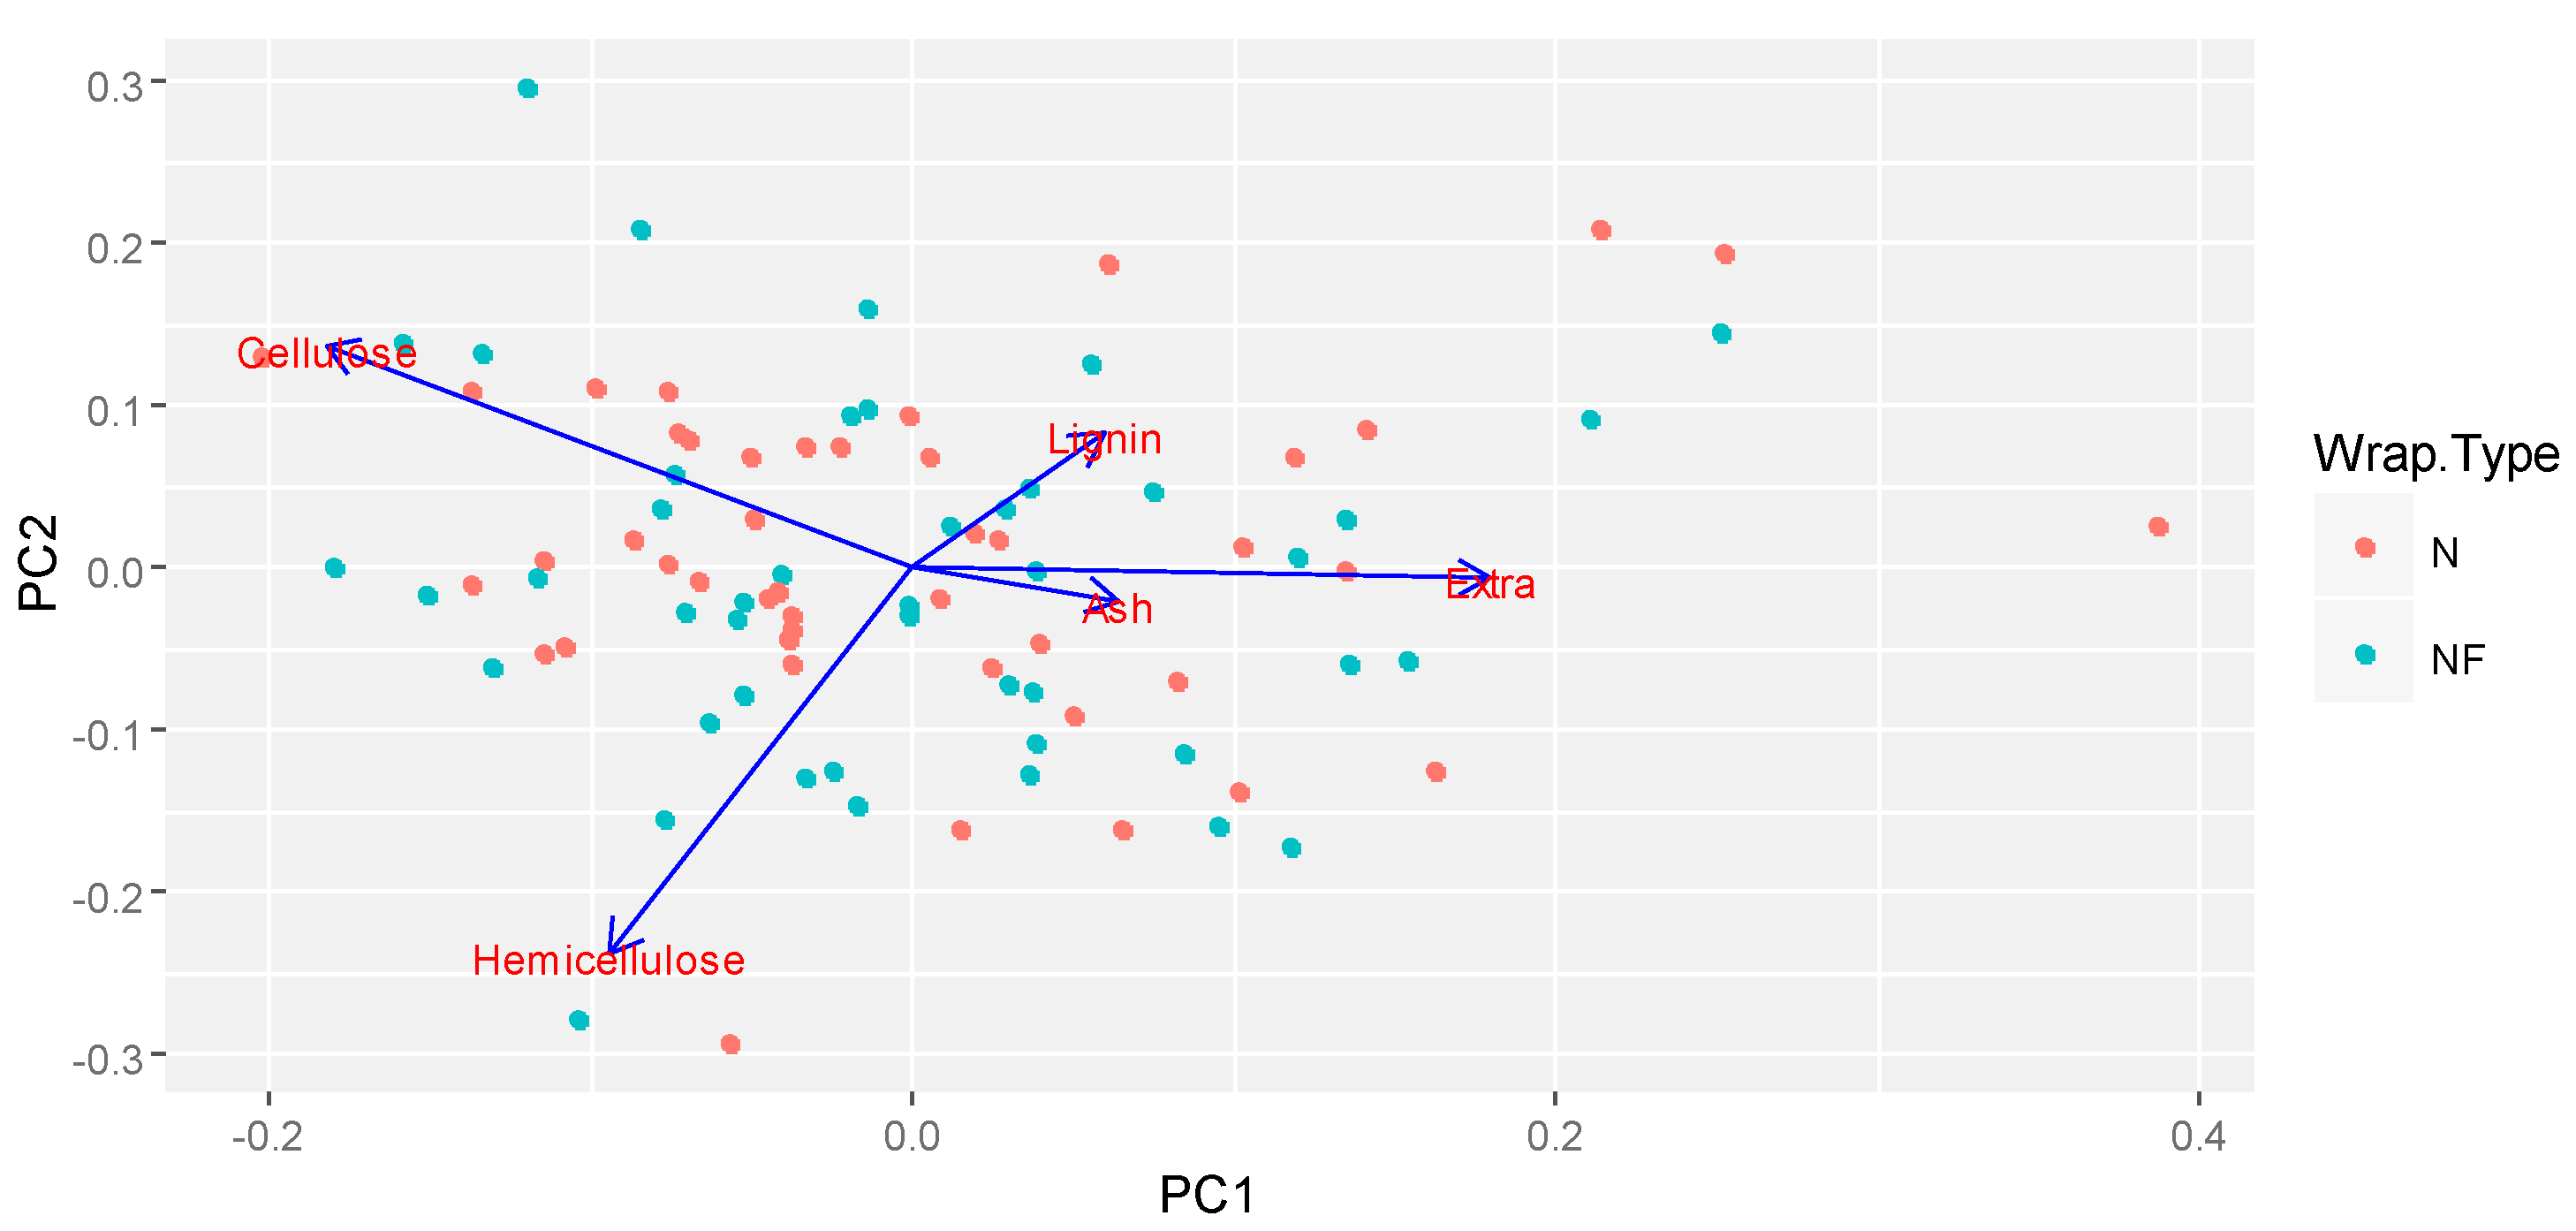
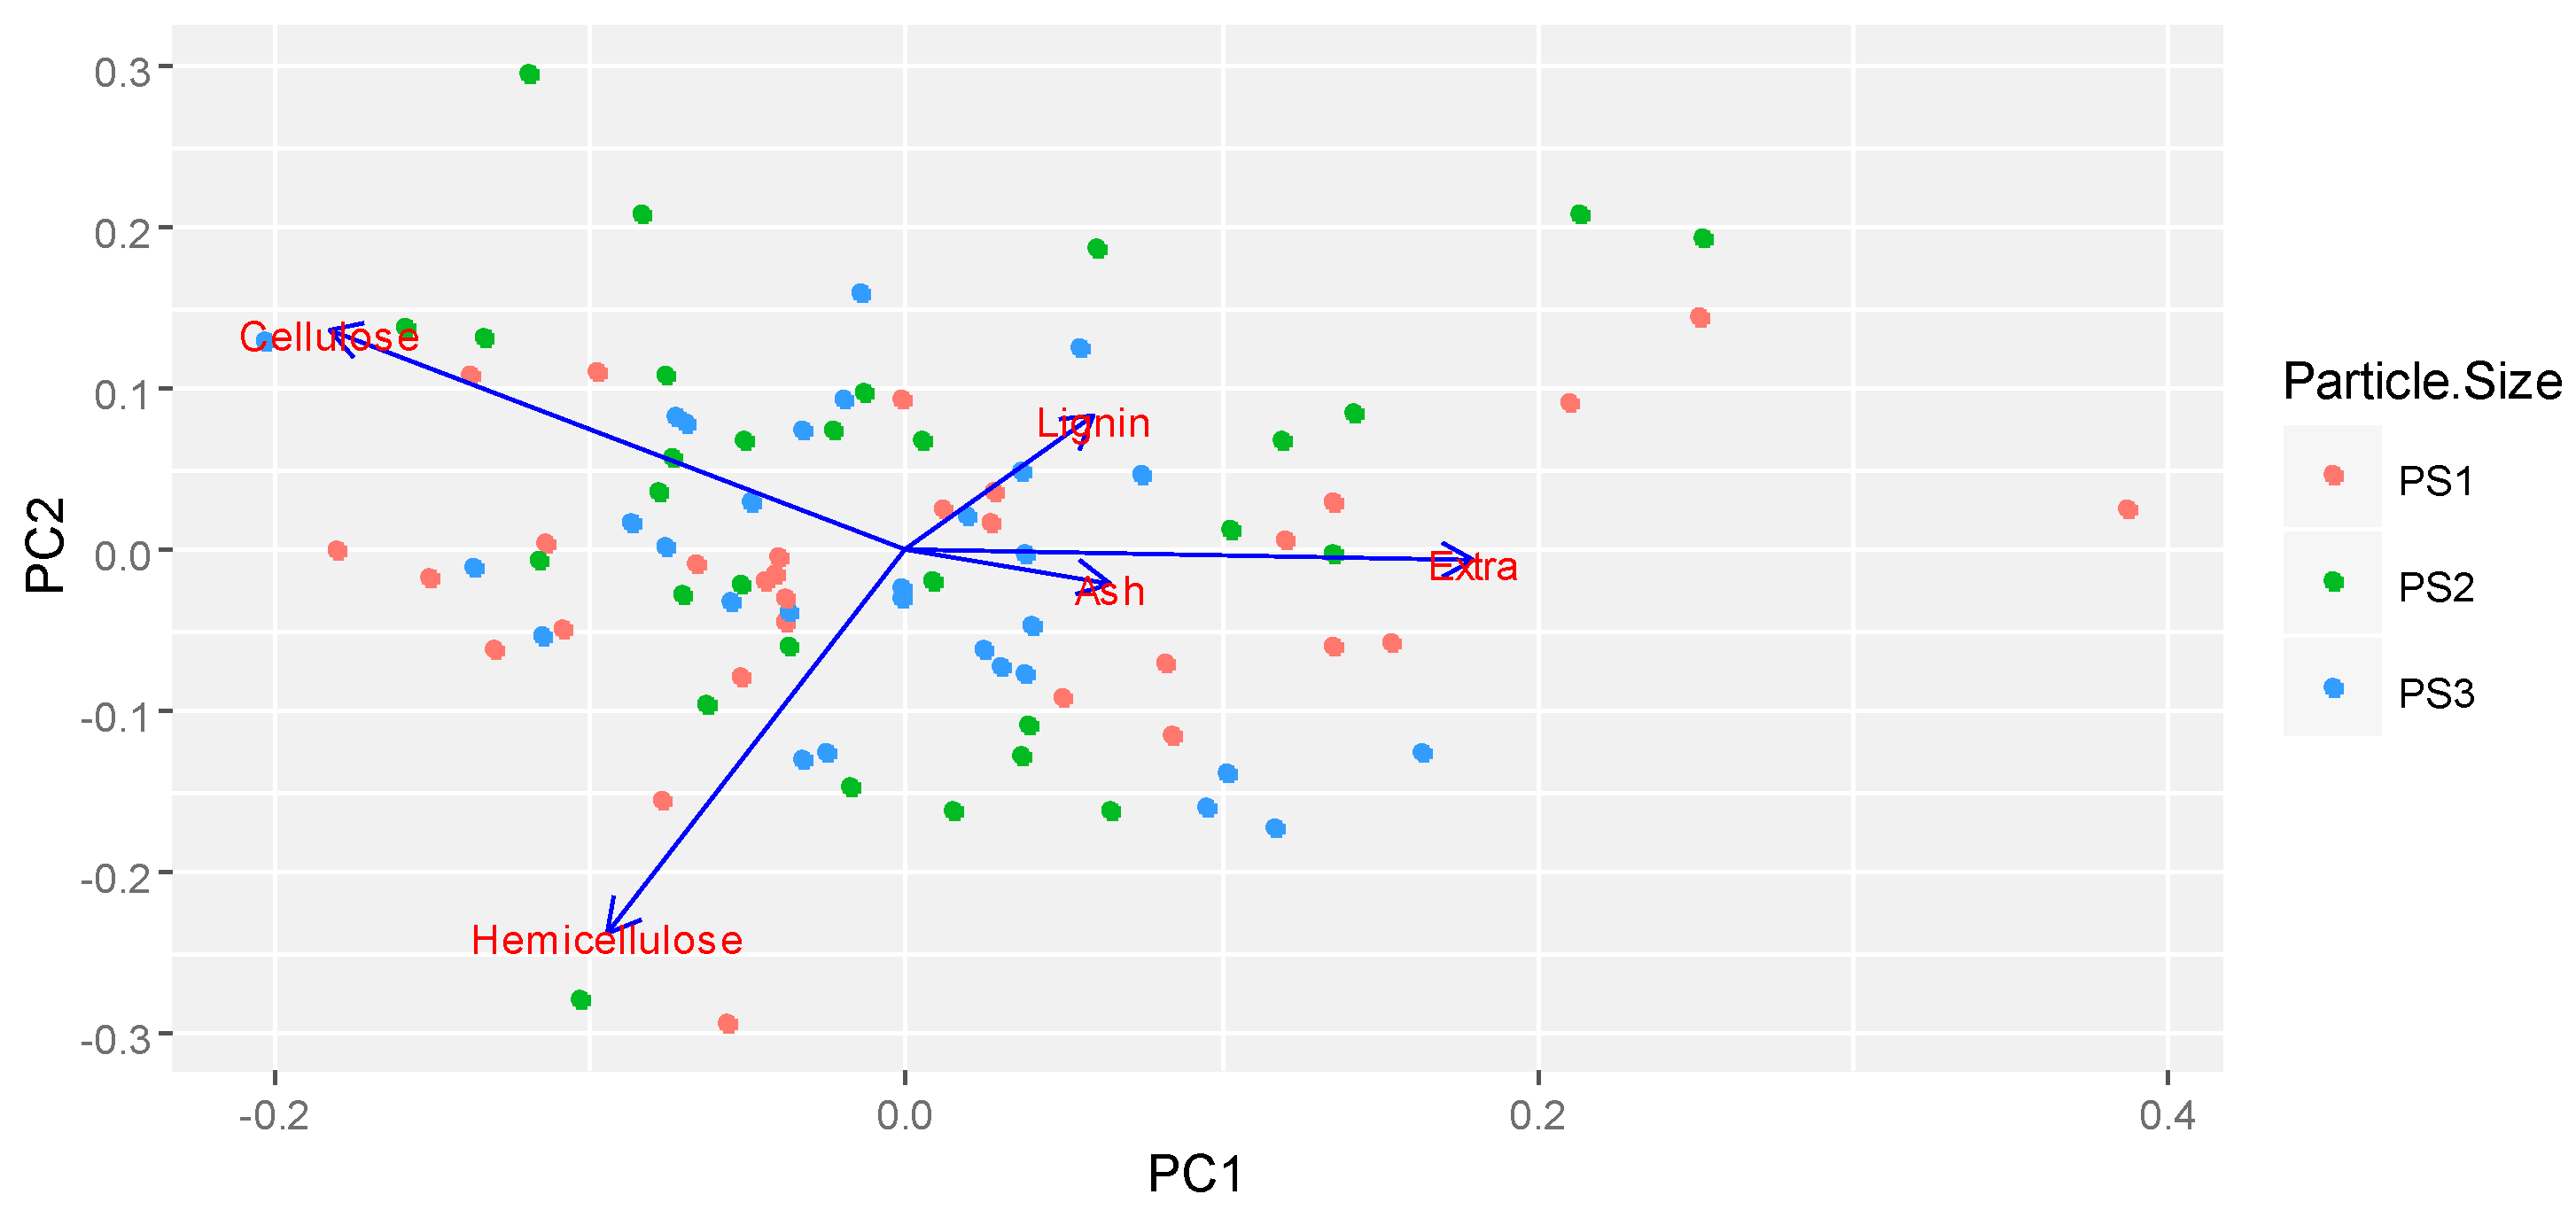
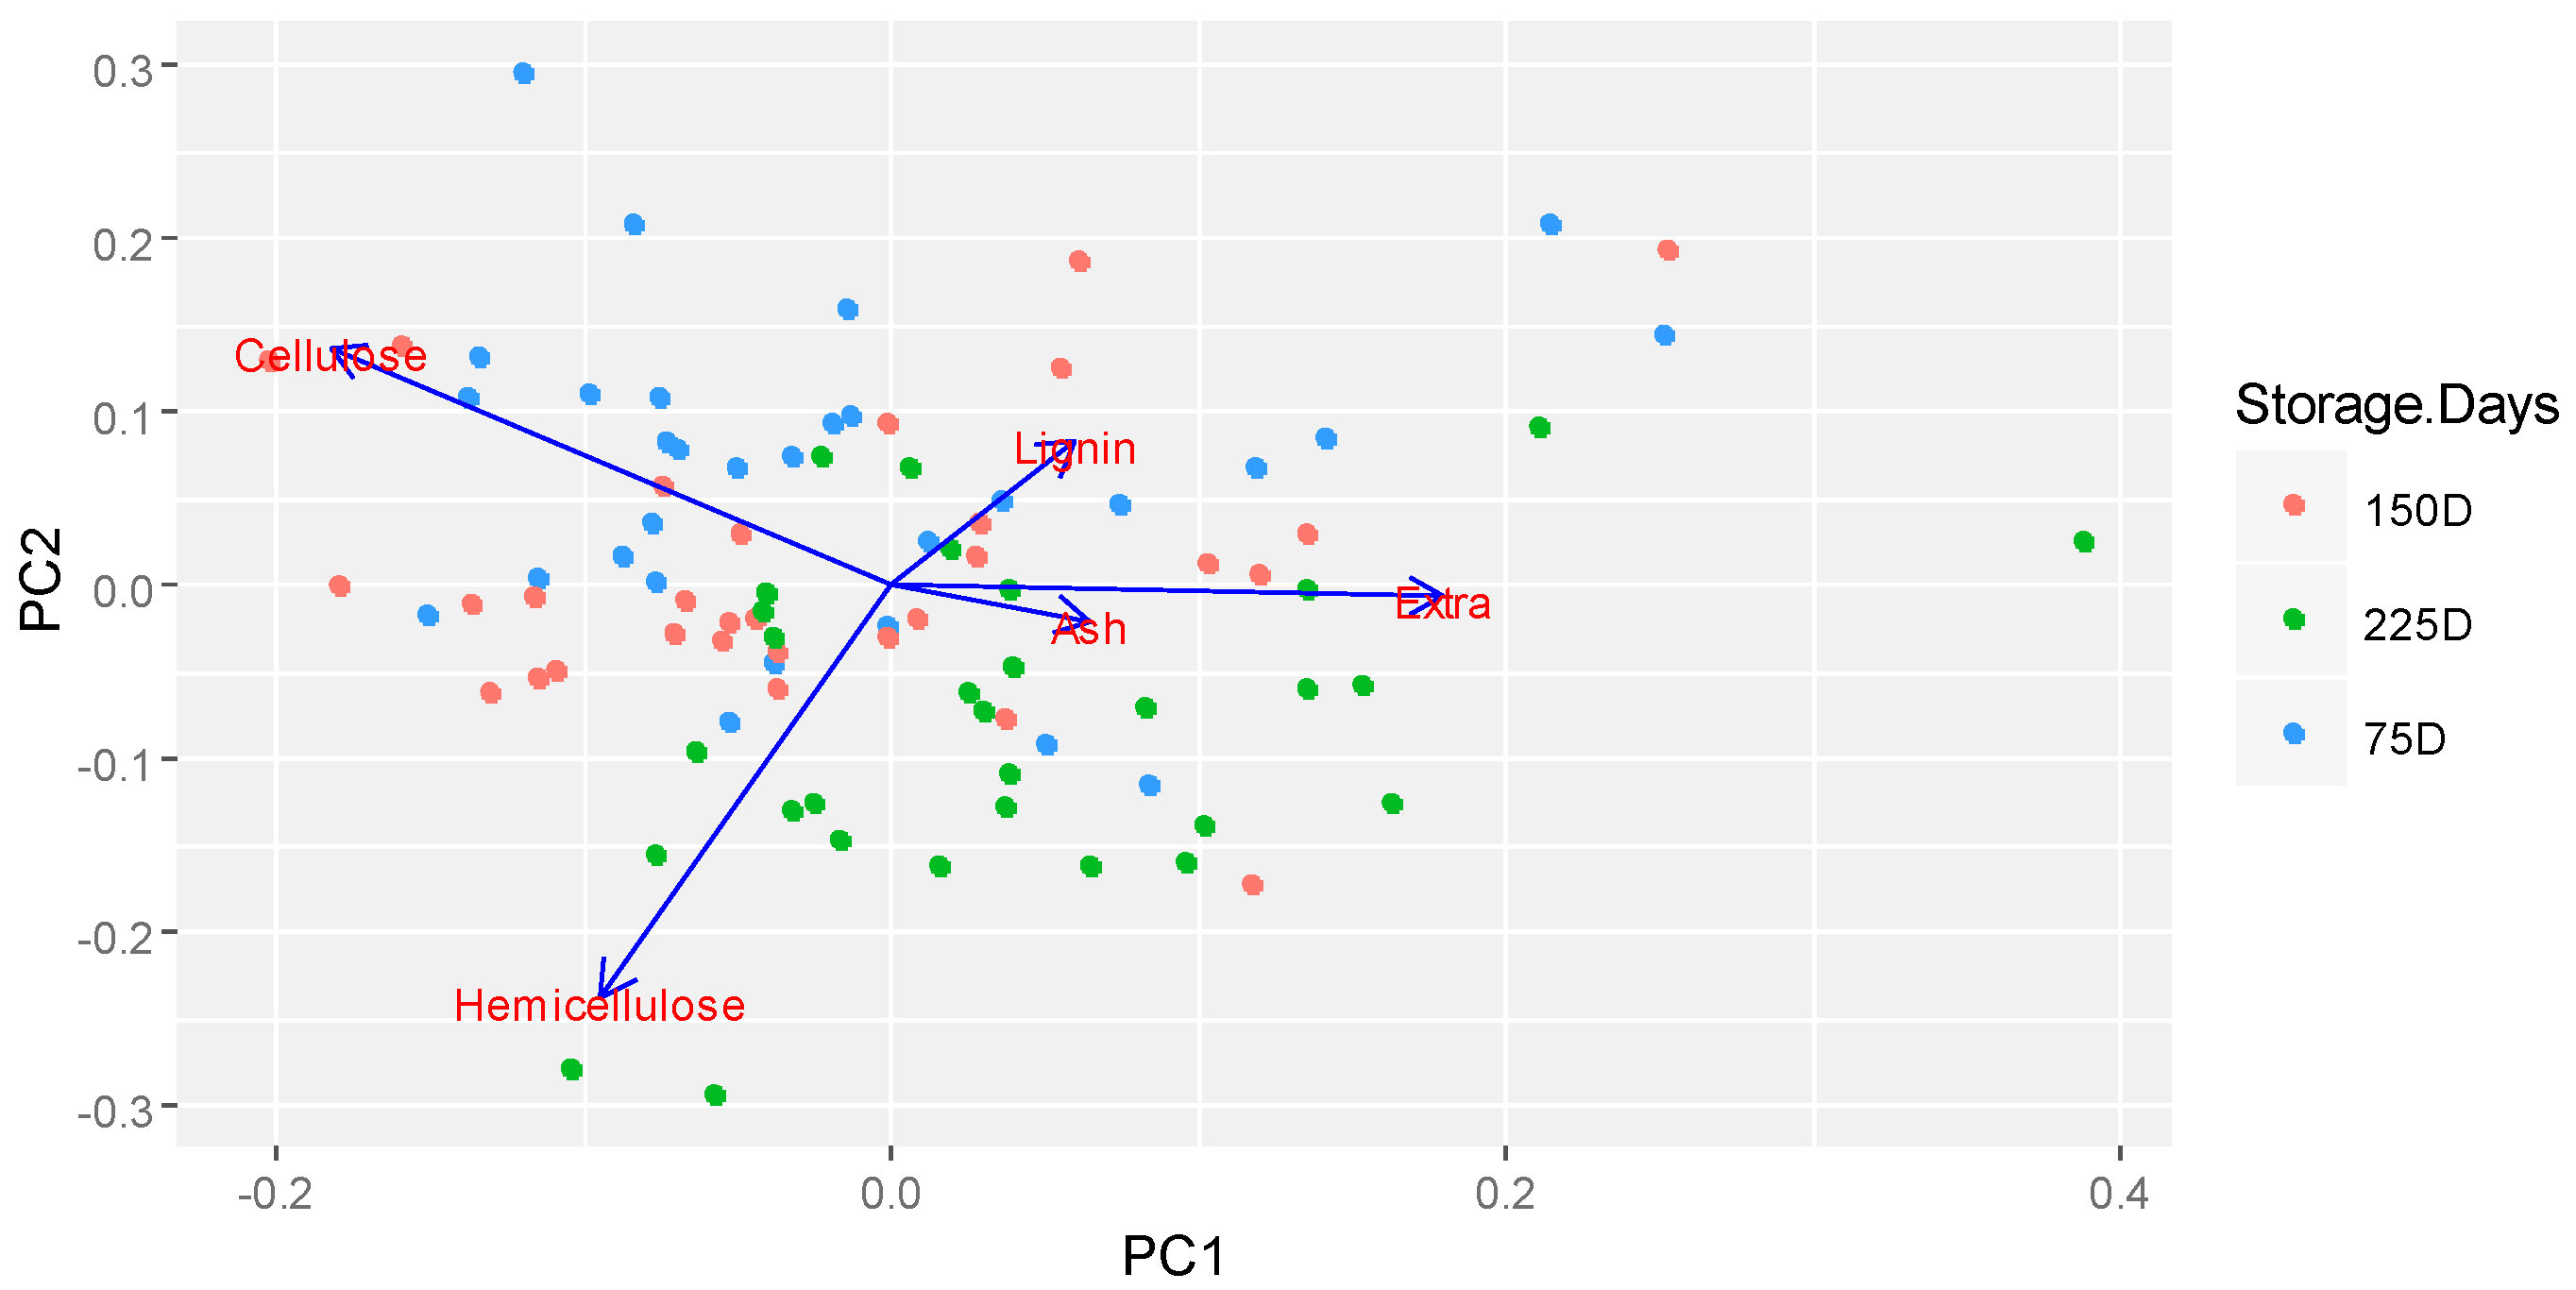
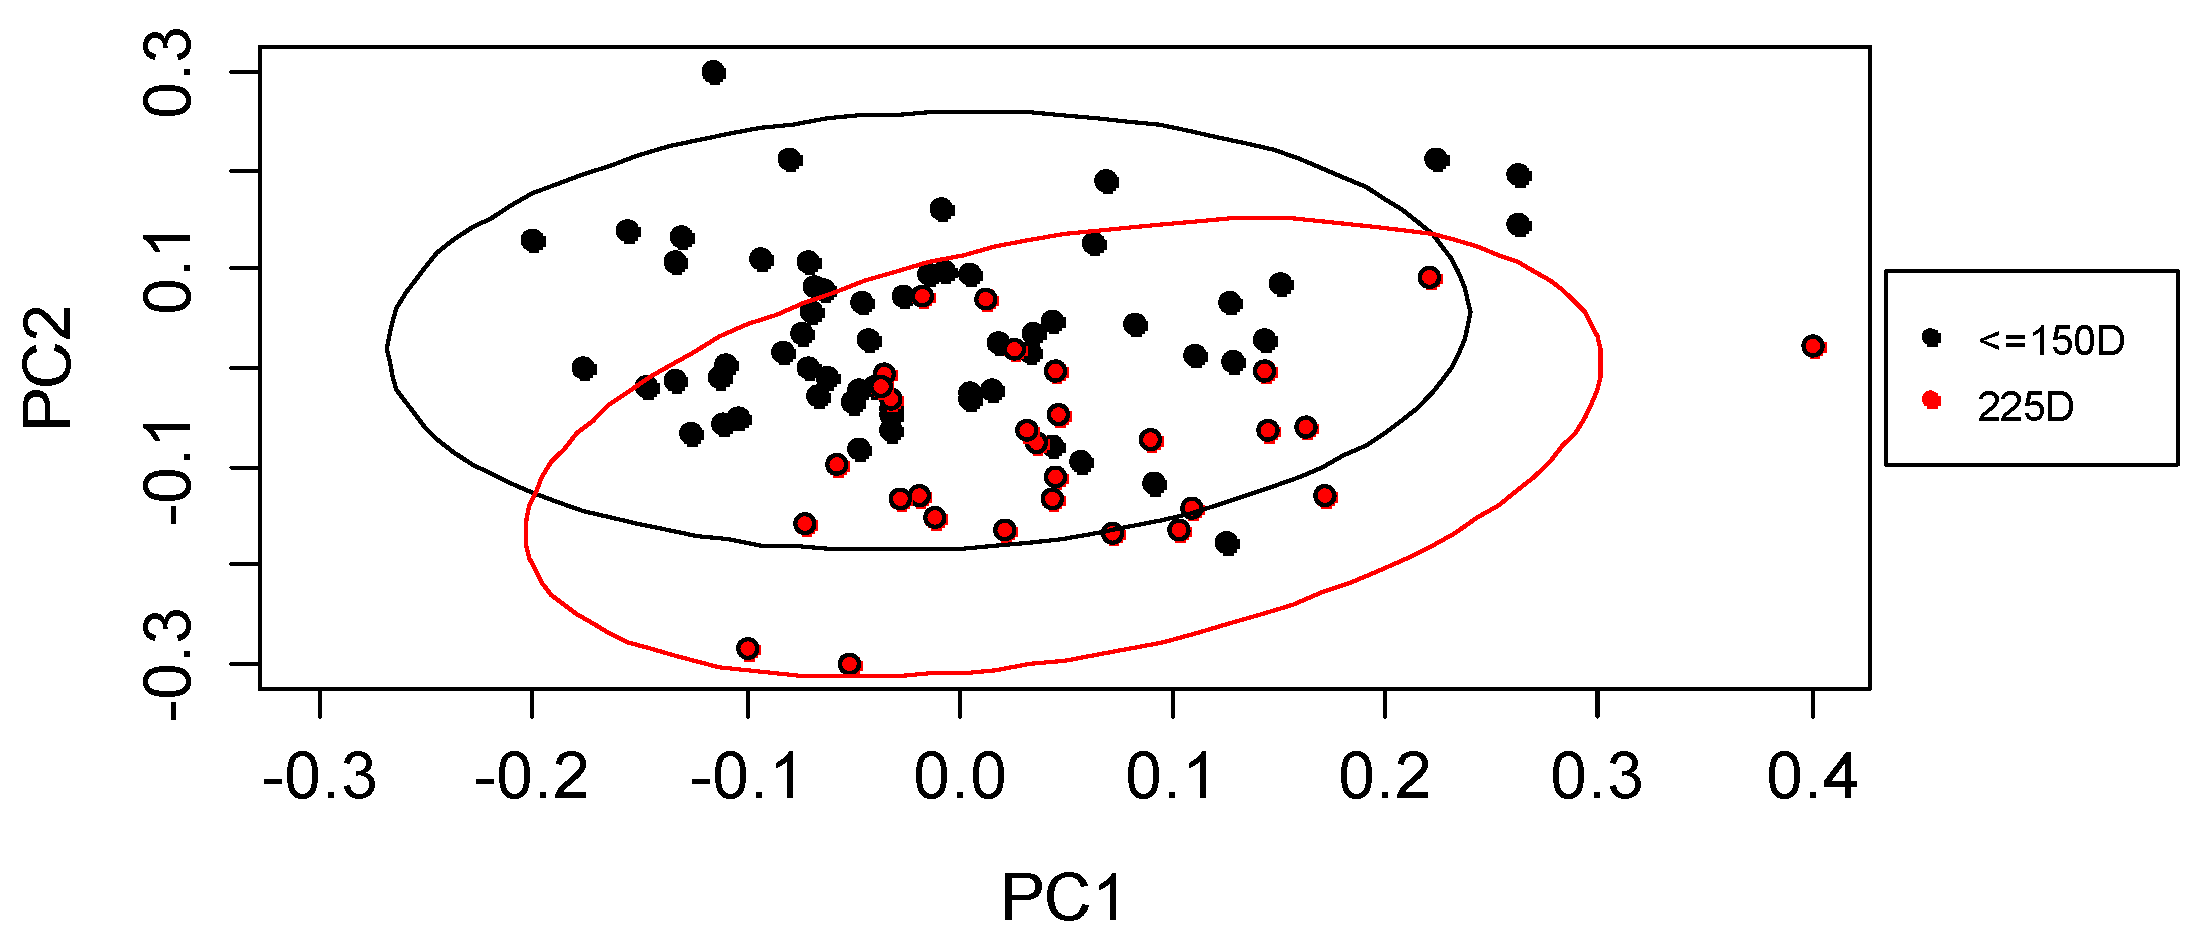
With the eigenvector information, original data can be transformed into a set of multivariate data points located in the principal components (scores). The set of scores can be analyzed in a visual manner with exploratory graphs, in order to detect segregation between groups for any controllable factor selected. Furthermore, if there is no distinguishable segregation in the exploratory graph, a statistical test can be implemented to determine the differences in their means, and, therefore, the effect of the corresponding factor. In this work, an exploratory graph know as bi-plot chart was utilized. Then, if no visual segregation between the groups was detected, a pairwise
t-test with adjusted
p-value, was implemented for the statistical analysis. The function autoplot ( ) in the package {ggfortify} and ordiellipse ( ) in the package {vegan} (R software environment [
27]) were executed for this analysis. The function pairwise.t.test ( ) included in the package {stats}, also in R, was run in the comparison analysis. The next section introduces the statistical test for pairwise comparison.
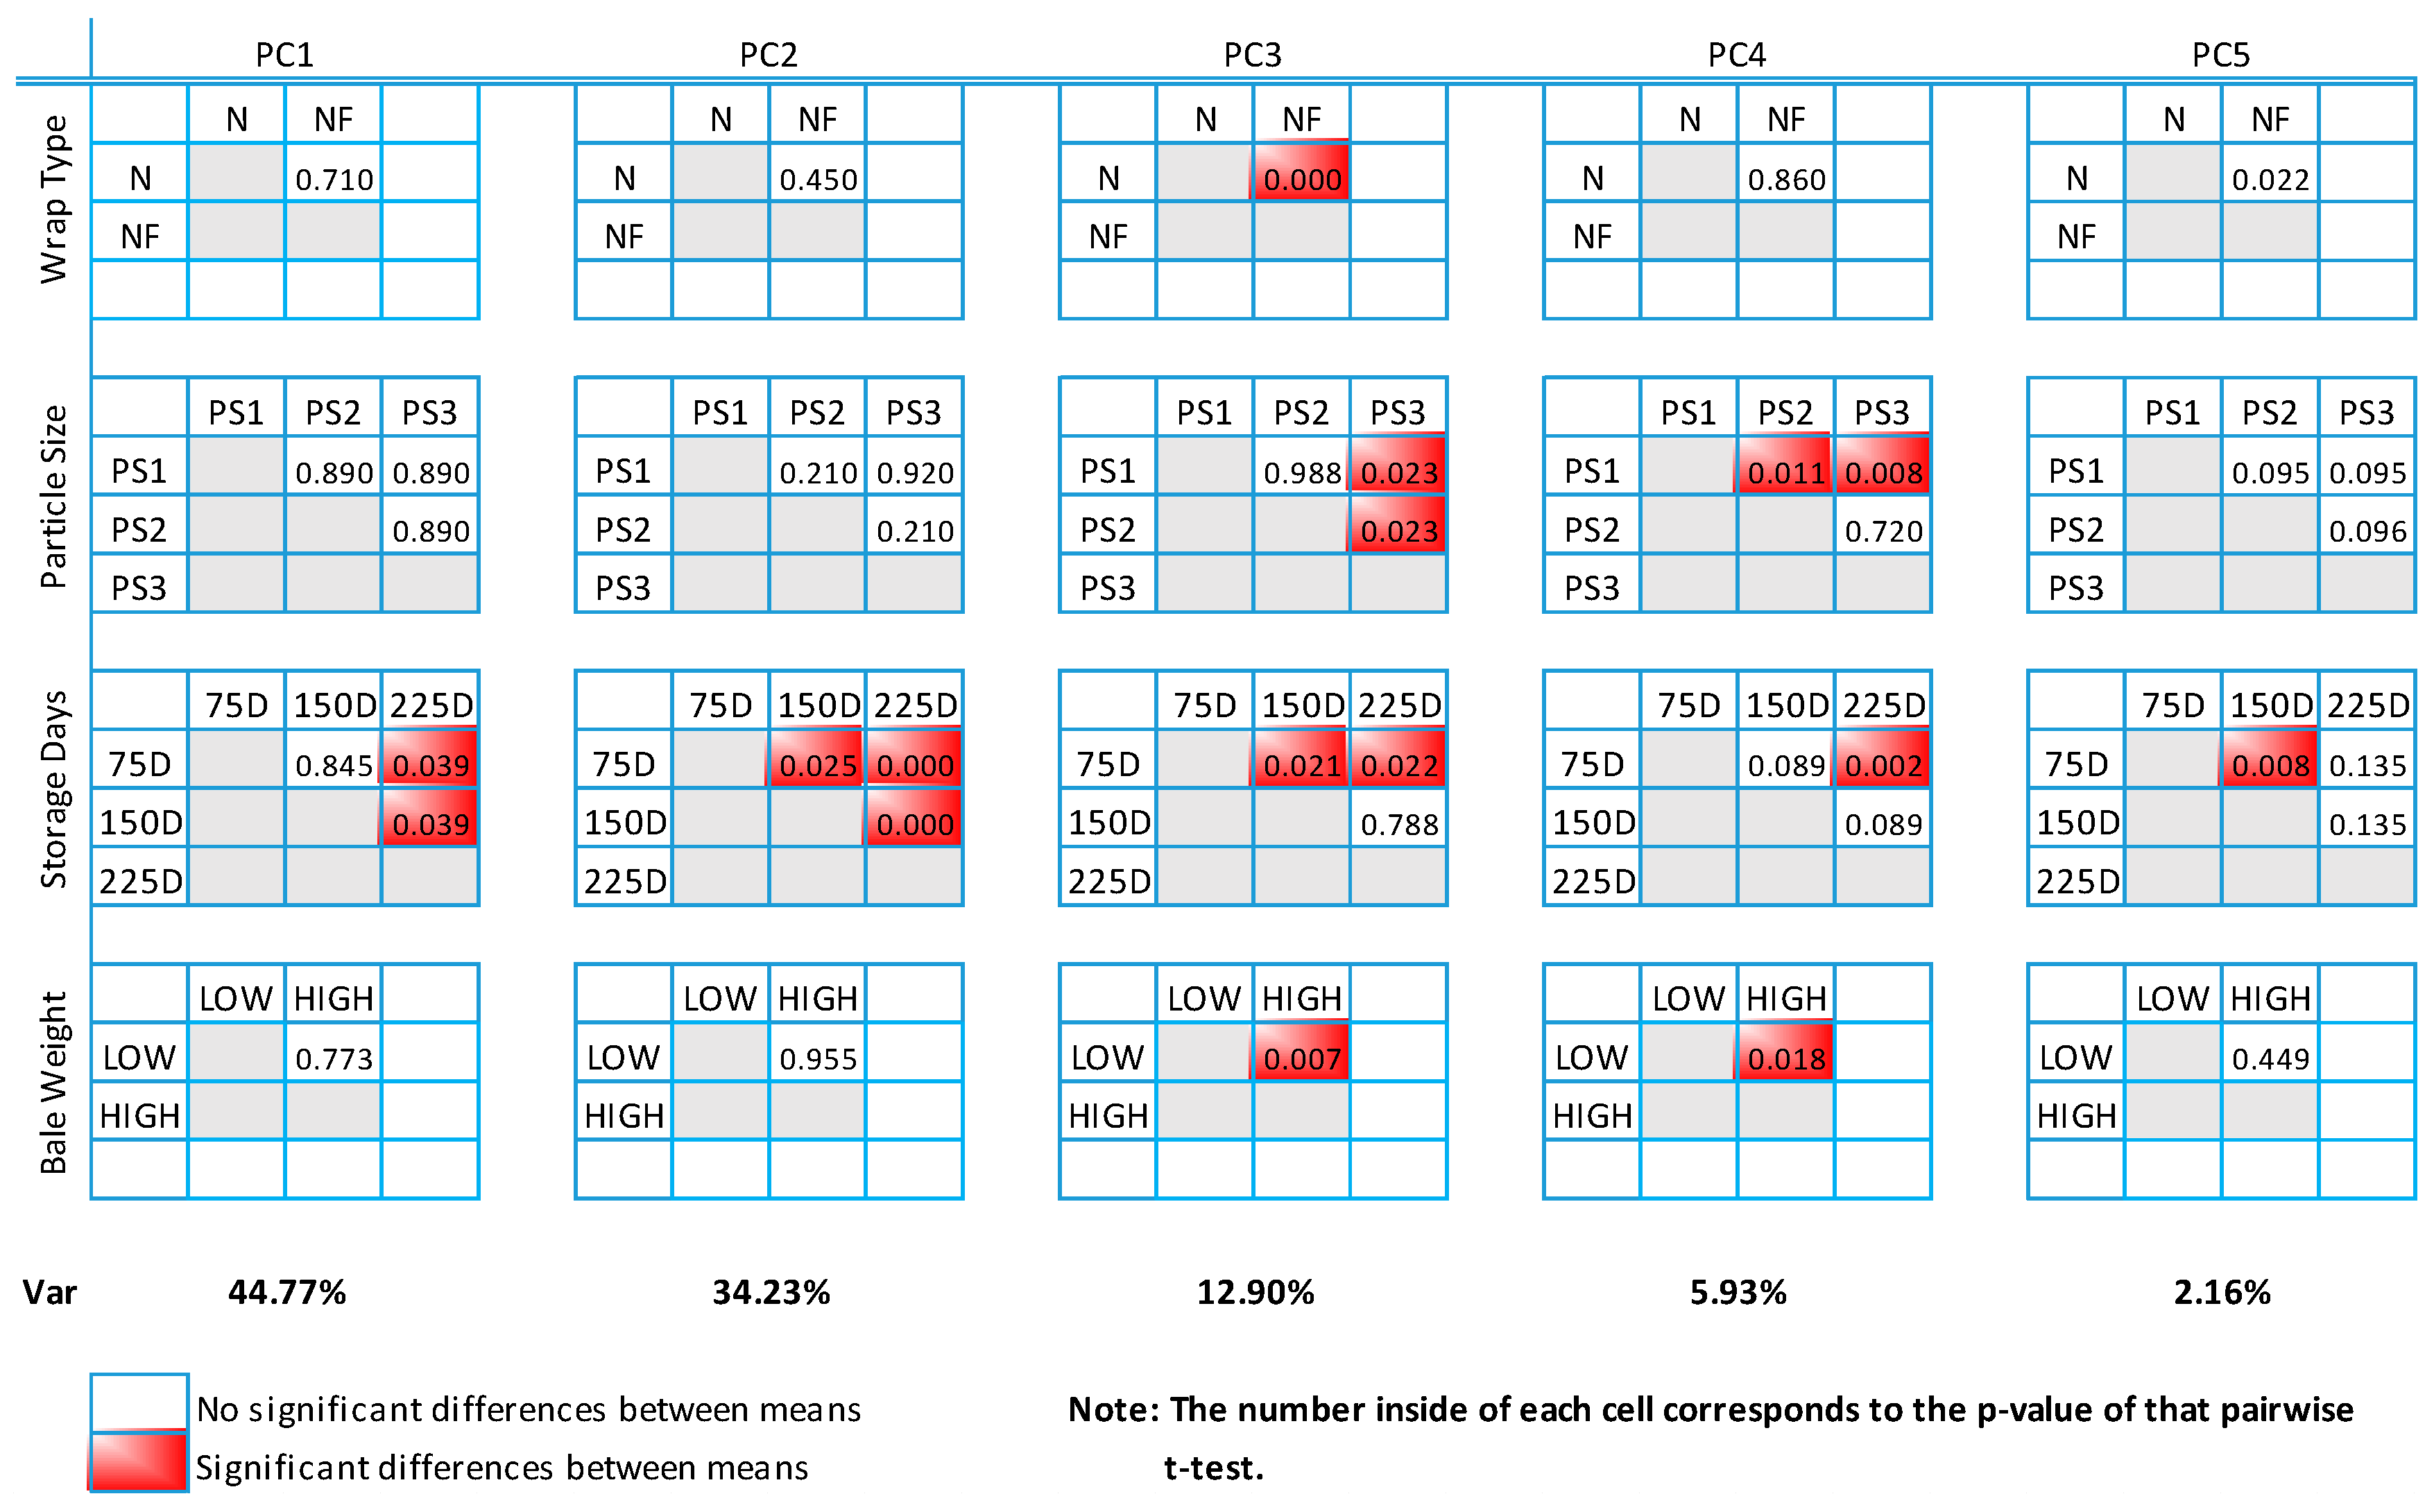
2.2. T-test in Principal Components
In some instances of the analysis, it is not possible to visually identify segregation within the groups of a factor, and therefore, a statistical test is required to determine an effect over the chemical composition of the feedstock [
30]. In this work, pairwise
t-test was utilized to make comparisons between the groups in order to conclude an influence over PCs due to the difference in their score means. A mean difference within the PCs corresponds to a difference in the chemical composition (i.e., the level of cellulose, hemicellulose, lignin, ash and extractives).
The test for this difference considered unknown but equal population variances, known sample means and not equal sample variances. The test was performed using the
t-distribution and the corresponding estimator is defined by the following expression:
In the definition of parameter
t,
represents the sample mean of the first group under study whereas
corresponds to the sample mean of the second one. Similarly, μ
1 represents the population mean for the first group and μ
2 to the sample mean for the second one. In the denominator,
sp is the pooled estimator in the case where the sample variances are not equal. Also,
n1 and
n2 represent the corresponding number of samples for the first and second group in the analysis. The following function describes this pooling effect:
In Equation (2),
represents the standard deviation within the first group and
within the second group. With this approach, it was possible to statistically test every factor through its groups on every principal component, and, therefore, it was possible to see the most important factors in terms of variance. All the results for the pairwise statistical tests of these interactions were displayed in a matrix format. The main findings from this matrix are discussed in
Section 3.2.
5. Managerial Insights
The results of this work can be used to design and improve switchgrass logistics. Storage days are associated with most of the variance, followed by particle size, bale weight and wrap material. The supply of biomass should be mostly designed and implemented according to the storage days with best performance regarding feedstock quality and then, a just-in-time philosophy can lead to get the right quantity of feedstock at the right place and the right time. To achieve this goal, prediction models are needed to generate valuable information.
Weight of the bale and particle size are related to feedstock composition. Therefore, this information becomes relevant to design the bale and all the logistics (e.g., handling and transportation).
Since storage days, particle size, weight of the bale and wrap material affect the switchgrass quality; statistical tools can also be used to track the quality performance of switchgrass bales and detect important deviations from specifications. This detection can lead to finding the root causes, assuring that the required biomass quality for the conversion process is met.
6. Future Work
Storage days are the most relevant factor in this study. Thus, future research should increase the knowledge in this particular factor. This work introduced three different storage periods. However, relevant information within those periods might need further investigation. Prediction models to better estimate the chemical composition in feedstock should be based in time-series analysis (e.g., moving average, exponential smoothing, regression analysis, and autoregressive integrated moving average, among others). In order to develop such models, it is recommended to gather sufficient data and adopt a multivariate approach. The insights related with storage days can be utilized to set restrictions in decision models. For instance, the bale of switchgrass cannot be stored for more than days due the changes in chemical composition. Moreover, this can be reflected in the objective function of an optimization model by including the opportunity cost in a profit or cost function.
Quality assurance is also a promising area of research due to its role in the reliability and economically feasibility of bioenergy production. Development of tools such as statistical quality control within a multivariate frame is a plausible approach since biomass has several properties that are involved within its energy extraction. Assuring that these properties meet the specifications is vital to detect and prevent any issues in the conversion process.
Physical constitution of feedstock bales is also a promising line of research, the weight and the particle size can be critical in logistical decisions because they affect the chemical composition and, hence, the production yield of biofuels. Therefore, more research including factors related to physical properties in the biomass supply chain decision making and management is needed.


 ,
, 


