1. Introduction
Science and technology are developing by leaps and bounds, leading to higher energy storage demands. The unitized regenerative fuel cell (URFC) is perceived as one of the cleanest and most effective energy storage and conversion device, whose special energy is several times higher than that of the lightest secondary battery [
1,
2]. Compared with secondary batteries, URFCs have the advantages of no self-discharge or cell capacity limitation. The high special energy of URFCs indicates limitless applications for some weight-critical and time-consuming portable applications such as space energy systems (>40 Wh·kg
−1) [
3]. In addition, URFCs can be developed for and applied in high-altitude long-endurance solar aircraft, hybrid energy storage spacecraft propulsion systems, remote area energy storage systems without relying on the grid, power systems for power grid peak adjustment, and portable power source systems [
4,
5,
6].
Continuous direct current power and water will be generated when URFCs are replenished with H
2 and O
2 under the fuel cell (FC) mode. Electronic energy will be converted into chemical energy stored in H
2 and O
2 when water is electrolyzed under the electrolysis cell (EC) mode [
7,
8]. The two modes occur within the same system. The chemical reactions in the FC mode are: 2H
2 − 4e
− = 4H
+ (on the hydrogen side); O
2 + 4e
− + 4H
+ = 2H
2O (on the oxygen side). The chemical reactions in the EC mode are: 4H
+ + 4e
− = 2H
2 (on the hydrogen side); 2H
2O − 4e
− = O
2 + 4H
+ (on the oxygen side). Proton exchange membrane (PEM) URFCs have become the focus of attention of researchers because of the rapid development of PEM water electrolysis and the reliable characteristics of PEM FC, such as low operating temperature, high starting speed, and large current density [
9].
As a reversible electrochemical tool, URFCs place higher demands on their catalysts and the structure and materials of each component. In the past two decades, there have been many experimental investigations focusing on the type of catalysts and mass ratio of complex catalysts (e.g., [
10,
11,
12,
13]), the structure of flow field plates (e.g., [
14,
15]), material types and surface treatment technology of gas diffuse layer (GDL) (e.g., [
16,
17]) as well as the cell performance (e.g., [
6,
18,
19]) under different operational conditions such as temperature, pressure and humidity. Li et al. [
20] and Zhang et al. [
21] conducted experiments, tested and compared the performance of URFCs under different operating temperatures.
At the same time, a handful of simulation studies related to URFCs have been conducted. Guarnieri et al. [
9] developed a multi-physics zero-dimensional model of the PEM URFC system to provide guidance for the design of a cell/stack subsystem. The sensitivity of URFC performance to temperature, pressure and humidity is also analyzed. Doddathimmaiah et al. [
22] used Excel and Visual Basic to develop a computer model by modifying the Butler-Volmer equation to generate voltage-current curves in the EC and FC modes of the PEM URFC. This model was considered as a tool to identify the electrode materials and structures of URFCs. Those two models are purely mathematical models used to investigate the influence of a parameter on the cell performance, which could not provide the influencing mechanism inside of the URFC. What’s more, URFCs should be shifted from one mode to another mode, particularly when combining with wind or solar energy to provide renewable energy. An in-depth study of a complex set of changes occurring during operation mode switching should be conducted. Two-dimensional, isothermal, single-phase, and transient models for URFCs based on PEM [
23] and solid oxide electrolyte [
24] were developed to investigate the transport phenomena during the mode switching process. Wang et al. [
23] presented the mass fraction distributions of hydrogen, oxygen, water, and electrolyte potential response when a URFC switched from the FC mode to the EC mode. The performance of URFCs is affected by some fundamental factors, such as electrolyte, temperature, and mass transfer. Furthermore, electrochemical reaction, reactant mass transfer, equilibrium potential, and parameters of composite material are tightly linked to the temperature. The amount of waste heat produced by the PEM FC is approximately the same as its electric power output. PEM URFCs tolerate a small temperature variation. Only a few studies have investigated the heat transfer of URFCs, and no literature on numerical simulation can be found for this purpose.
So far, many articles have developed models for the PEM FC and PEM EC to analyze heat transfer (e.g., [
25,
26]). A three-dimensional, single-phase, and non-isothermal model is developed for a PEM FC by Ju et al. [
27]. The simulation results indicate that the GDL thermal conductivity plays an important role in thermal and water management of cells. Wen [
28] built a two-dimensional model and a three-dimensional model to analyze the thermal questions. The results indicated that the highest temperature exists in the catalyst of the cathode, the temperature difference among membrane electrode assembly (MEA) is lower than 1 K. Some transient non-isothermal models (e.g., [
29,
30,
31]) are built to assess the mass transfer transient responses in a PEM FC. The work of Meng [
32] revealed that the heat transfer process evidently increased the transient response time. Chandesris et al. [
33] developed a one-dimensional model incorporating chemical degradation of the membrane for an EC, and the results showed a strong influence of temperature on the degradation rate. Marangio et al. [
34] believed that the increase in pressure and temperature lead to a better performance of the PEM EC. Hamour et al. [
35] adopted a transient model to investigate the heat conducting characteristics of the GDL for a PEM FC and a PEM EC. However, no article analyzing the heat response for URFCs has been found. Heat and mass transfer significantly affect the performance of FC, water electrolysis, and URFCs. Numerical simulation is a cost-effective and time-effective approach in analyzing the intricate change inside the URFCs.
A transient, non-isothermal, single-phase, multi-physics, and full-cell mathematical model for PEM URFC is generated in the present study to analyze the dynamic responses of a PEM URFC under the operation mode switching and enhance the fundamental understandings of the complex interactions of heat and mass transfer during the cell transient operations further. The model is coupled with electrochemical reactions. Heat generation of URFC without phase change includes irreversible heat attributed to activation polarizations and ohmic heat and reversible entropic heat of reactions. The influences of temperature on the parameters of materials and equilibrium potential are considered in this model. The multi-component species in hydrogen and oxygen electrodes transmit in porous medium. The URFC is switched from the FC mode to the EC mode at 2 s. This study aims to explore the intricate changes of heat and mass transfer as well as current density under operation mode switching.
4. Results and Discussion
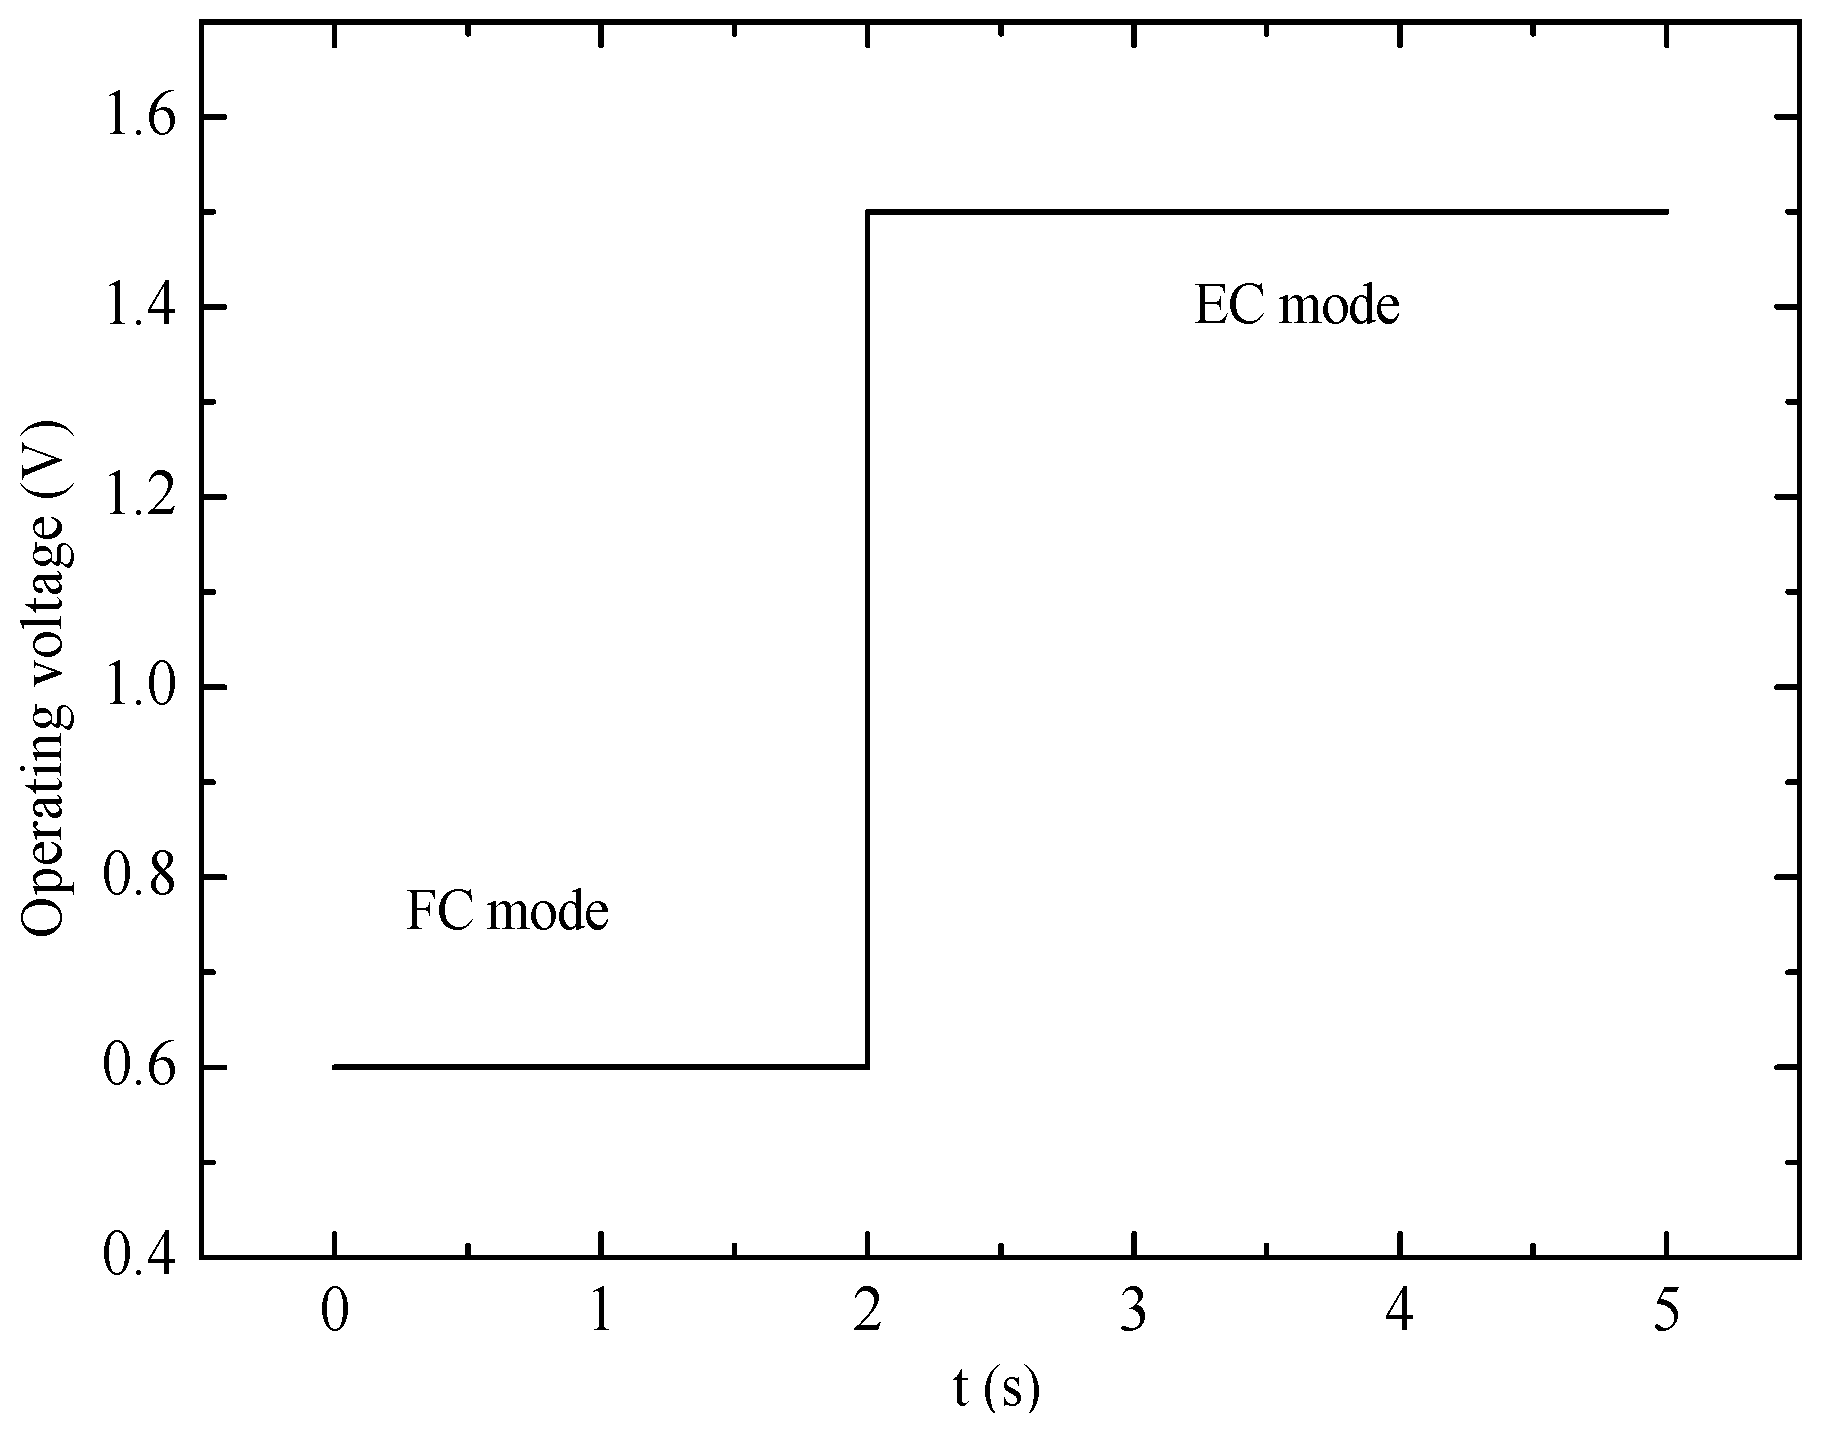
This study deals with the understanding of the dynamic response of an operating PEM-based URFC during the mode switching process. The cell operating mode in FC or EC is controlled by cell voltage, as shown in
Figure 5. Cell voltage in the FC and EC modes are set as 0.6 V in the first 2 s and 1.5 V during the subsequent 3 s. In the course of the switching process, the key transient responses of the current density, mass transfer, and heat transmission would occur at approximately 2 s, and the results will be shown and discussed in this section.
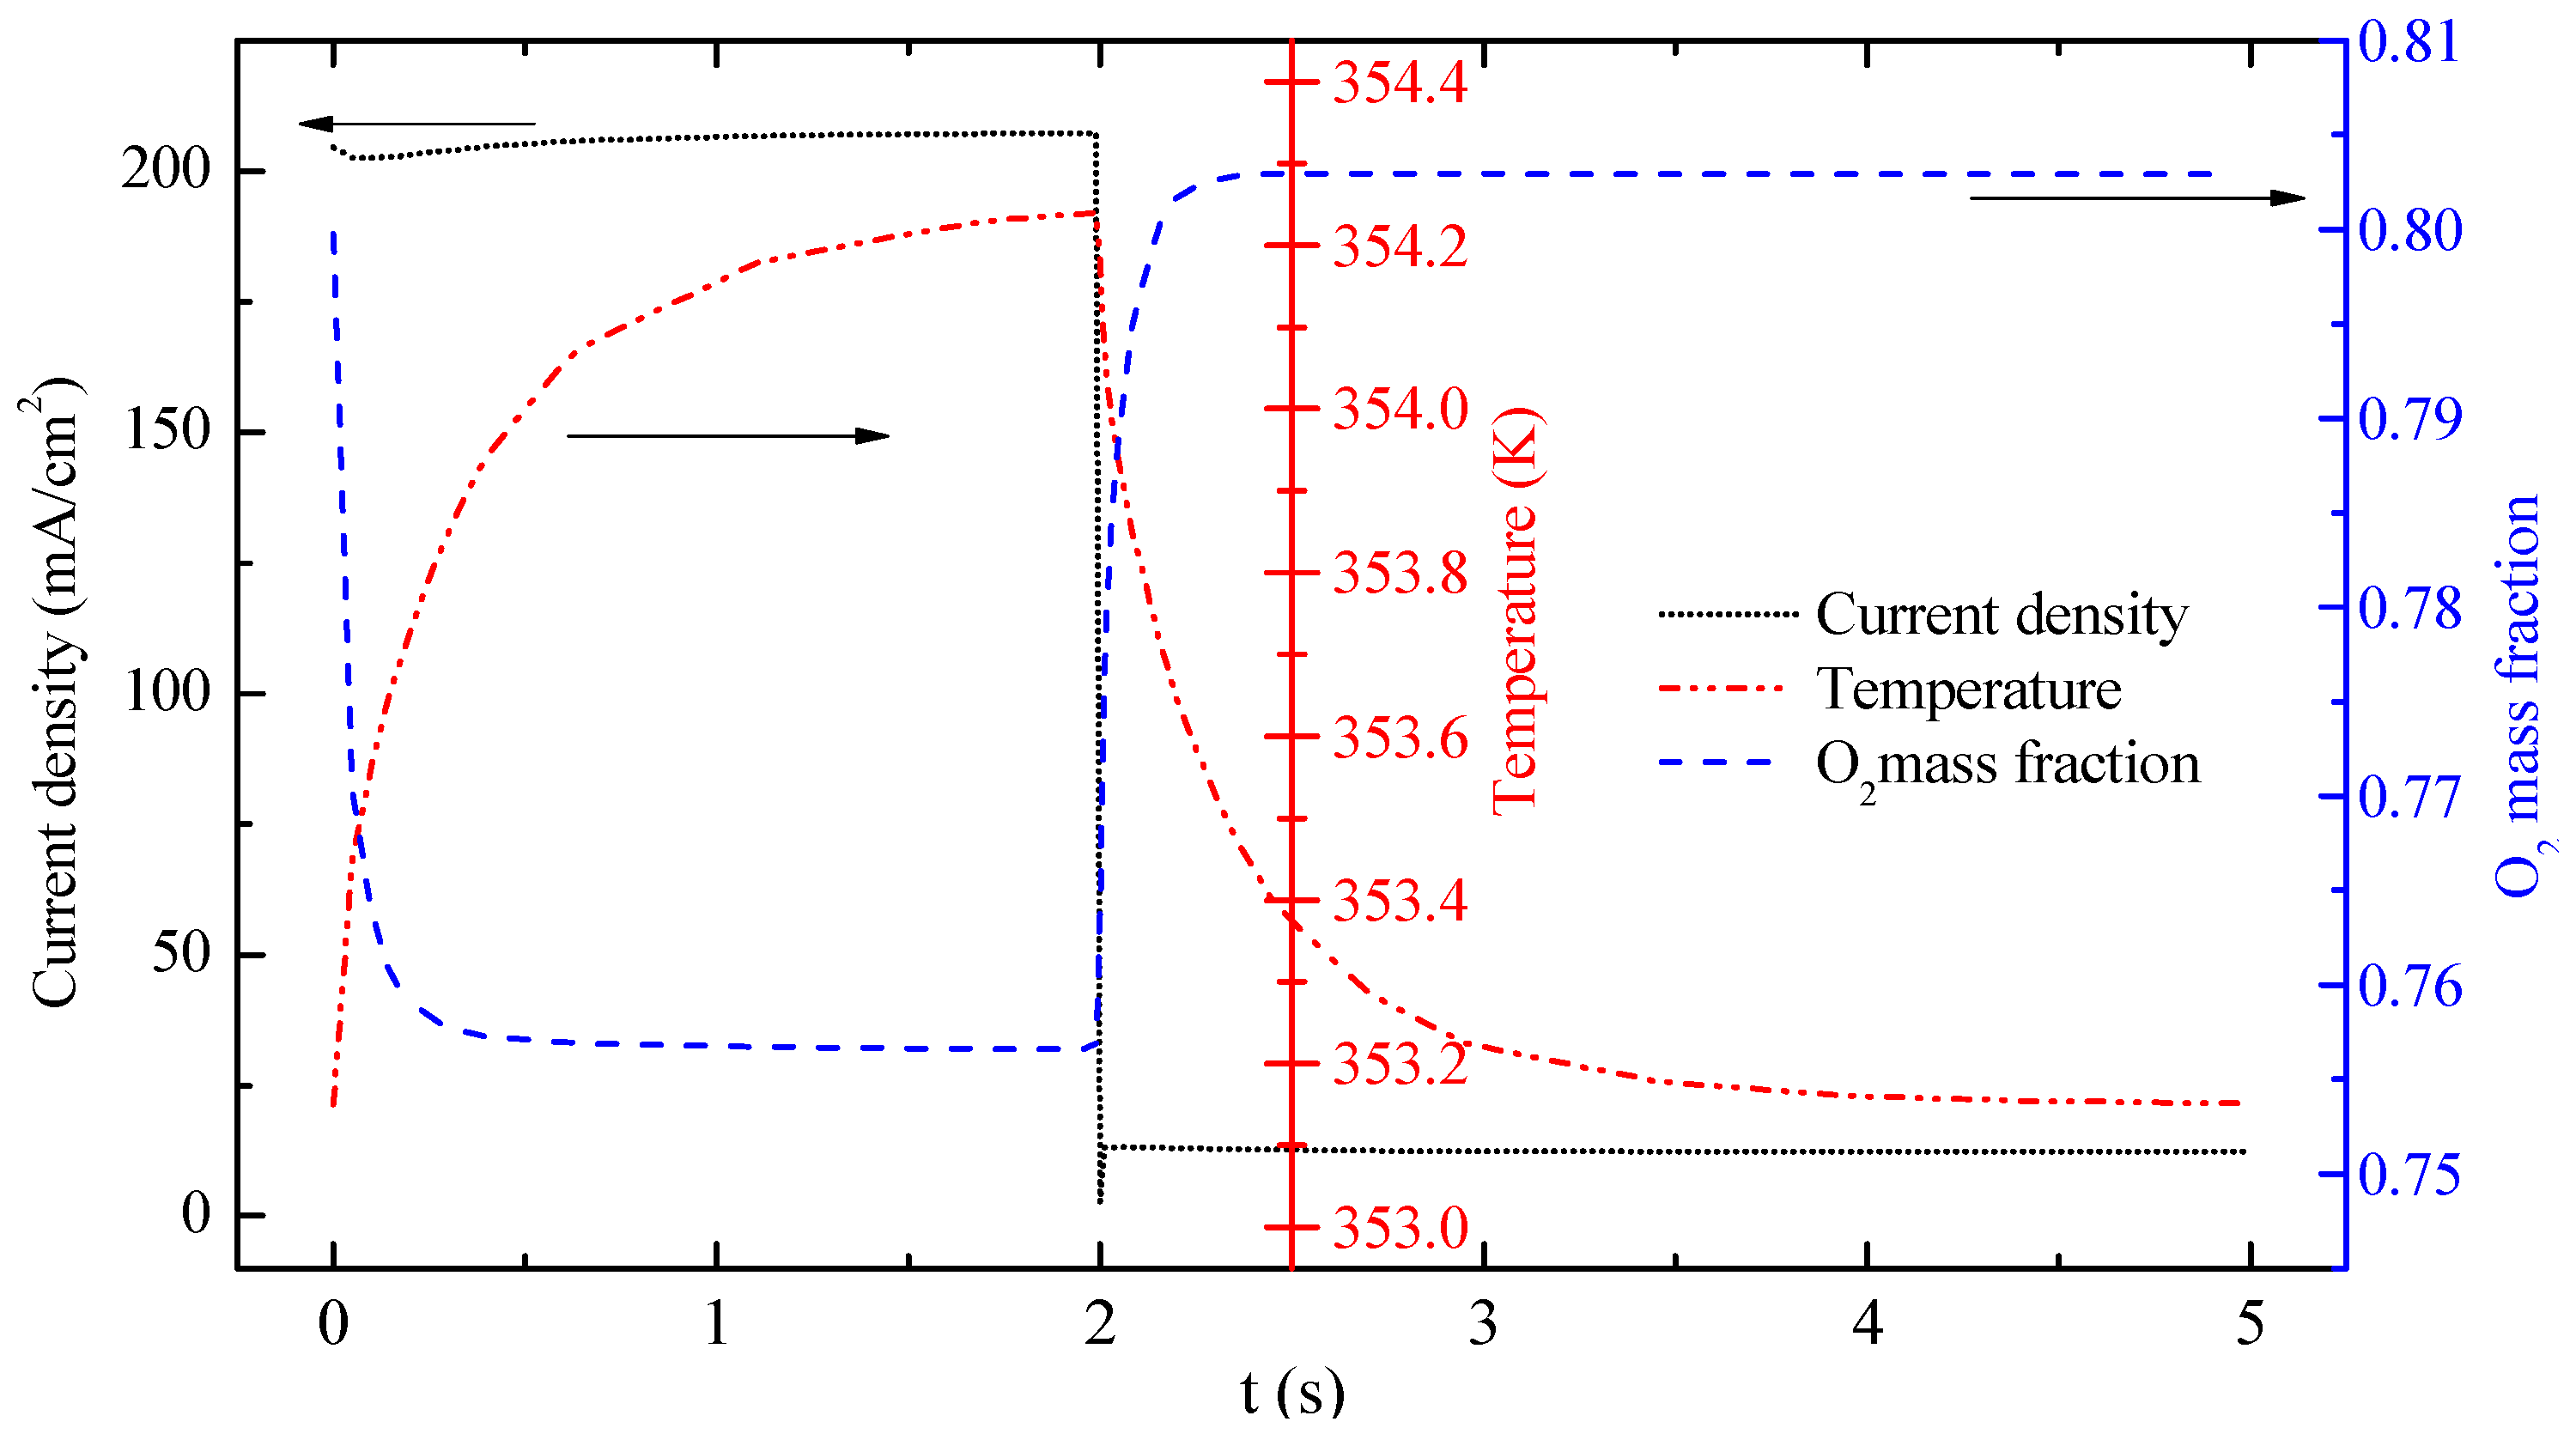
Figure 6 displays the transient responses of current density, O
2 mass fraction and temperature at the central point of the OCL. At the beginning of the FC mode, the O
2 mass fraction declines sharply, whereas the current density and temperature increase gradually because of the consumption of O
2 and the generation of heat. The O
2 mass fraction and current density reach a steady state at approximately 1 s. At 2 s the temperature continues to increase. The current density decreases to 2.77 mA·cm
−2 at 2 s because of mode switching. Then, the current density rapidly increases to approximately 15 mA·cm
−2 corresponding to the EC mode. At the same time, O
2 mass fraction and temperature at that point change dramatically. These changes can be explained as follows: The accumulated water, which is produced in the FC mode, is the reactant in the EC mode. The concentration of H
2O reduces rapidly at the beginning of the EC mode, which leads to a slight decrease in the current density. The O
2 mass fraction increases sharply because of the consumption of H
2O and the production of O
2 when the mode is switched from FC mode to EC mode. Temperature decreases rapidly at 2 s mainly because the exothermic reaction in the FC mode converts into the endothermic reaction in the EC mode. During the subsequent 3 s, the temperature gradient diminishes gradually. Temperature does not reach a steady state during the process. Current density, O
2 mass fraction and temperature in the OCL suddenly change under operation mode switching. The response time of temperature is longer than that of current density and O
2 mass fraction.
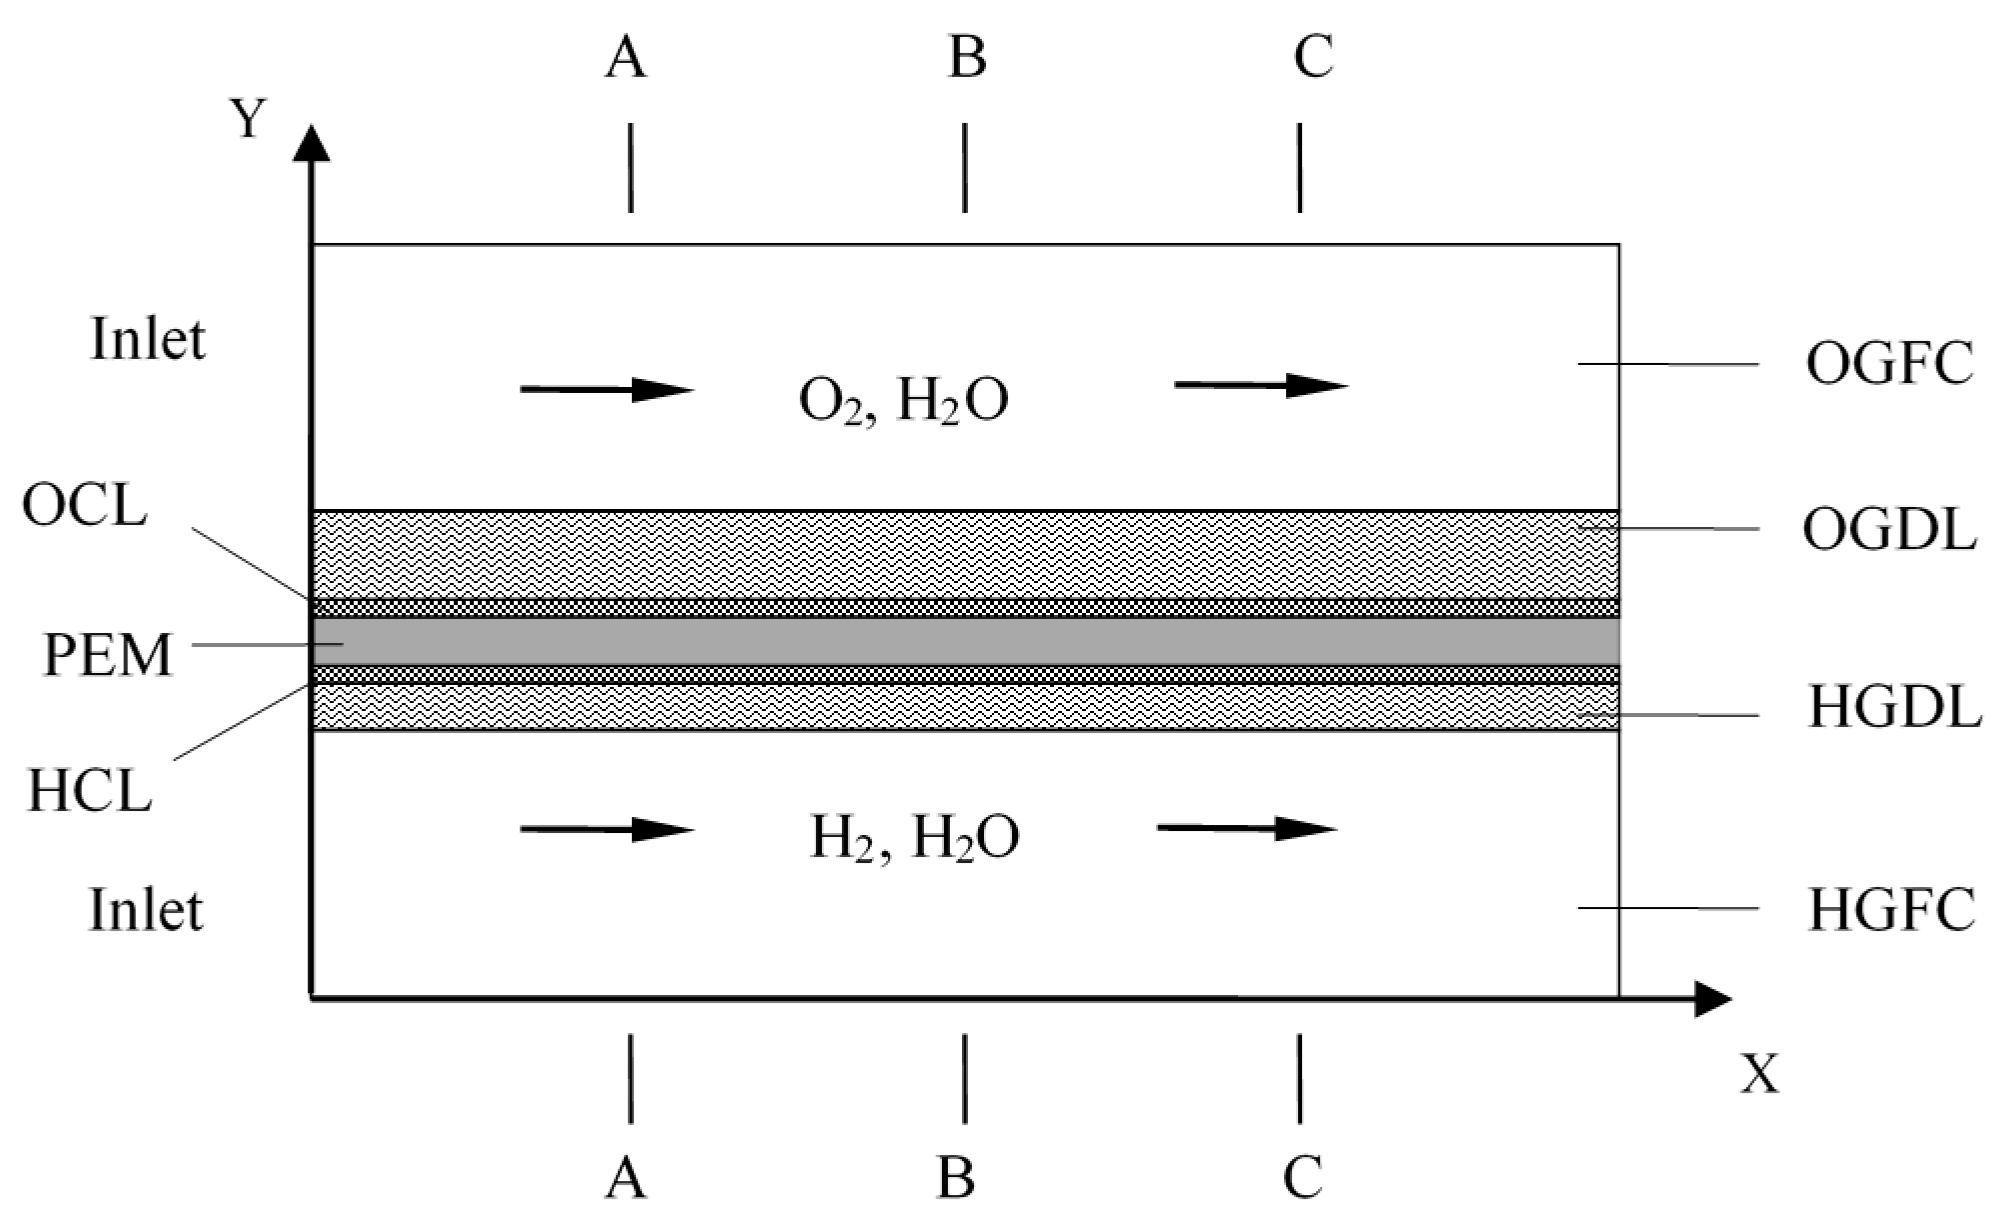
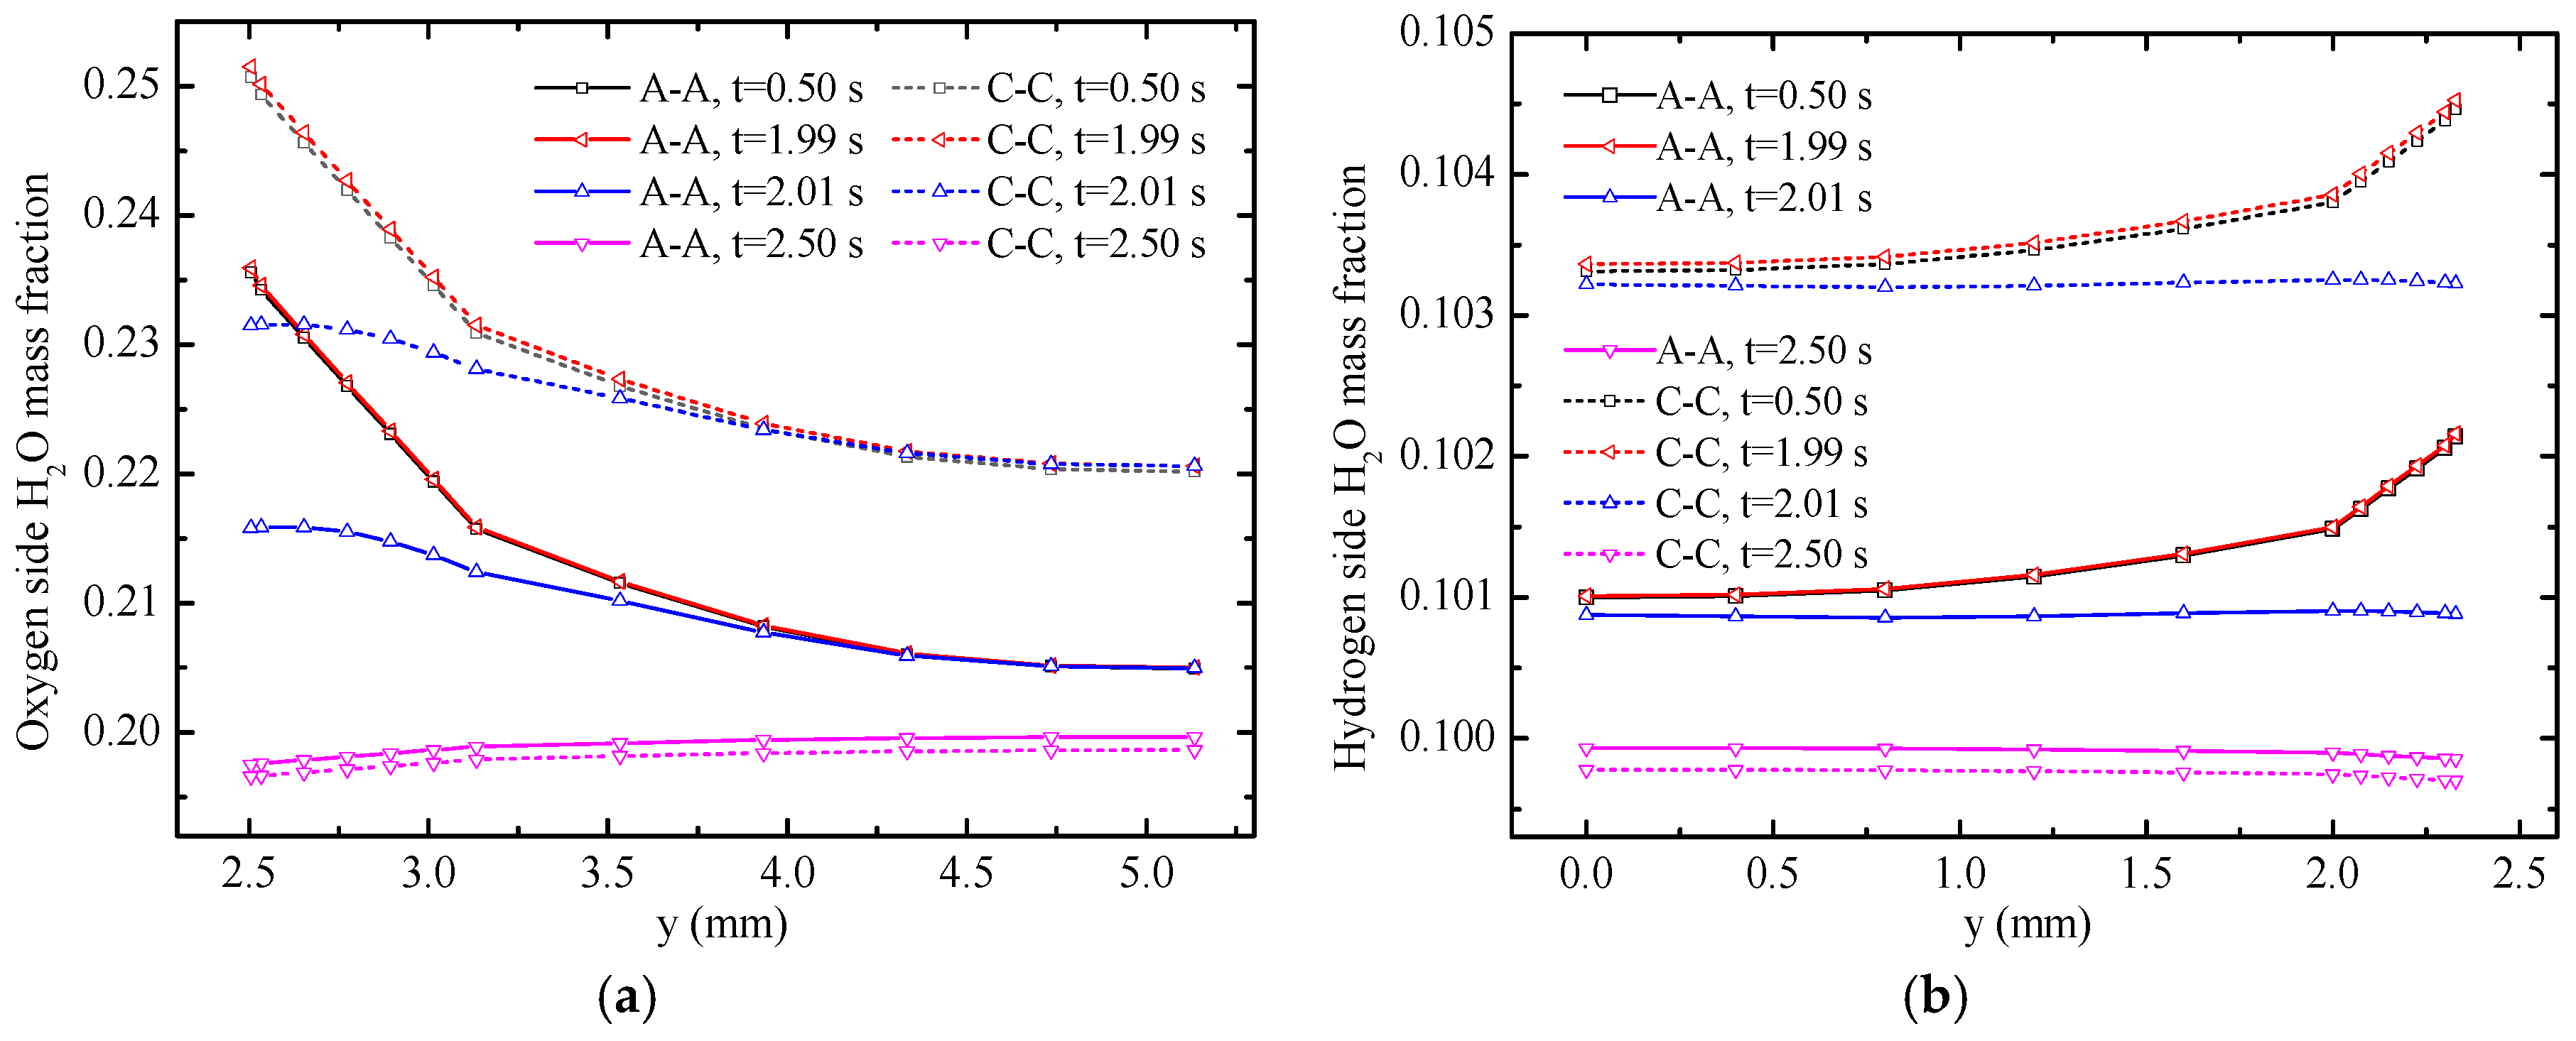
The water mass fractions along
y-axis with varying times are displayed in
Figure 7. The solid lines represent the temperature distribution along A-A line and the dotted lines represent the temperature distribution along the C-C line. Under the FC mode, the water mass fraction along the C-C line is evidently higher than that along the A-A line. The main reasons are the consumption of reactants and generation of H
2O in oxygen side. Therefore, the H
2O mass fraction increases gradually along the gas flow direction. Moreover, the consumption and the generation of gases occur in the CLs. H
2O mass fraction increases gradually from gas flow channels to CLs because of gas diffusion. However, the distribution of H
2O mass fraction under the EC mode is different from that under the FC mode because of the opposite electrochemical reactions. The mass fraction gradient in the hydrogen side is smaller compared with that in the oxygen side because of the generation of water and the small molecular weight of hydrogen. The water mass fraction at 0.5 and 1.99 s did not change at the A-A line. Meanwhile, at the C-C line, the water mass fraction at 1.99 s is slightly larger than that at 0.05 s, which illustrates that the mass fraction near the inlet of the gas flow channel reaches a steady state faster. The H
2O mass fraction decreases in different degrees within 0.02 s from
t = 1.99 s to
t = 2.01 s. Along the
y-direction from gas flow channel to CLs, the H
2O mass fraction significantly changes. At 2.01 s, the maximum value of H
2O mass fraction appears on the GDLs. The H
2O mass fraction dramatically declines in the CLs because of mode switching from the FC mode to the EC mode at 2.0 s and the opposite electro-chemical reactions of the two modes. Eventually, the H
2O mass fraction declines in the GDLs and gas flow channels under the action of diffusion.
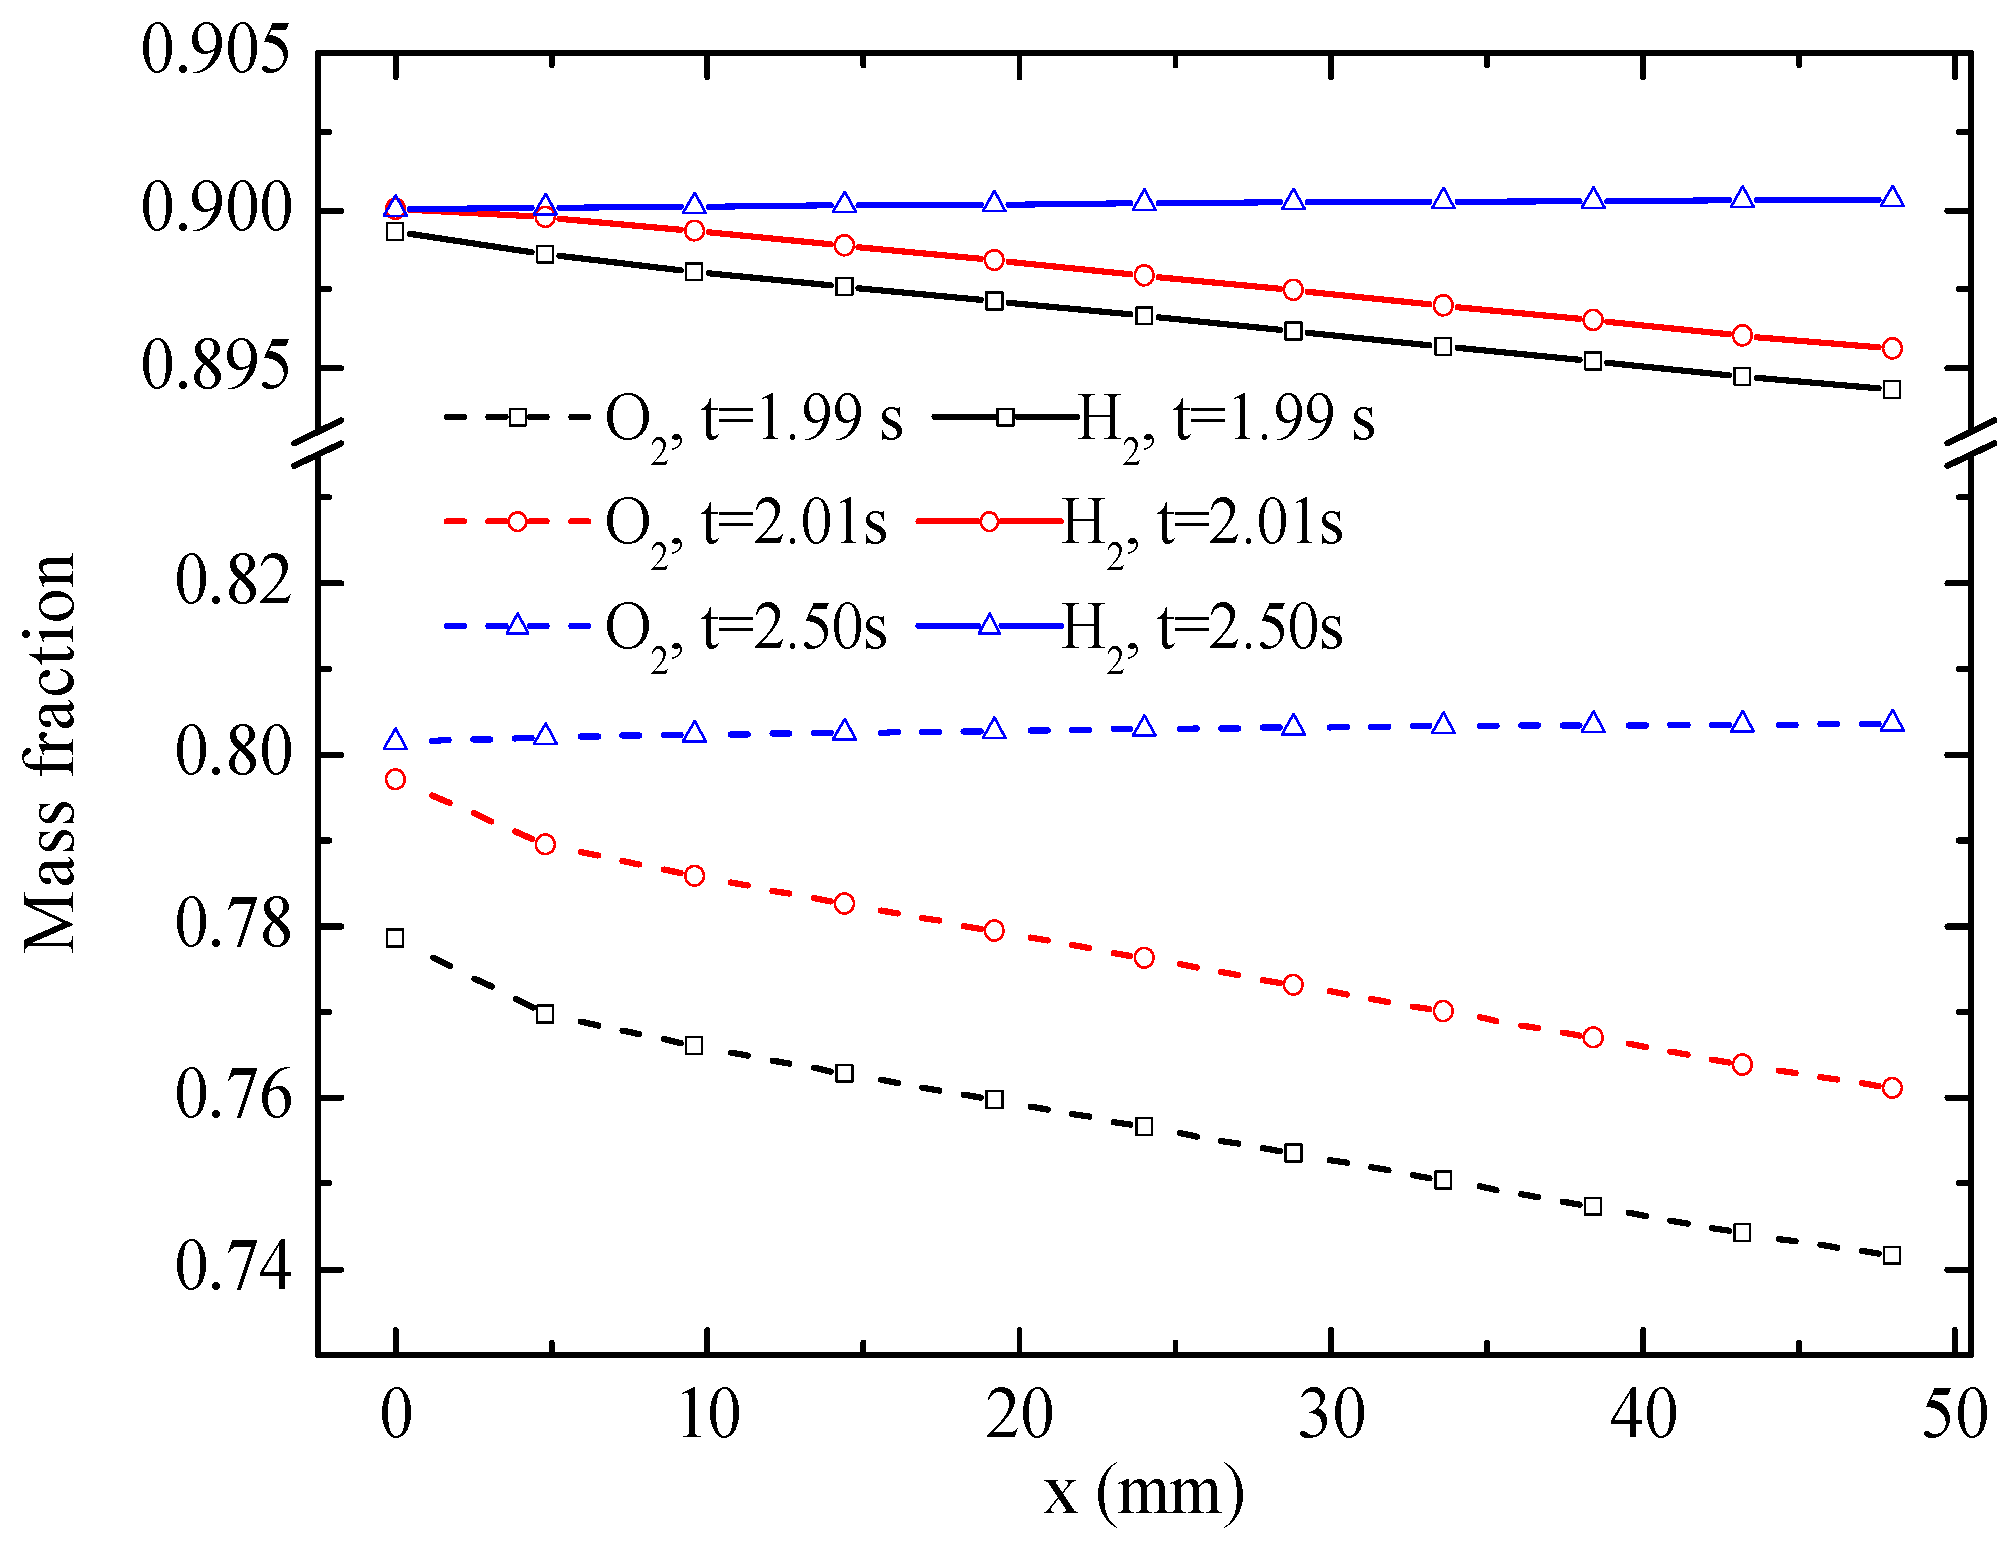
Figure 8 displays the distribution of H
2 and O
2 mass fractions along the central lines of the CLs. The results indicate that both O
2 and H
2 mass fractions are depressed distinctly along the flow direction at 1.99 s. The O
2 and H
2 mass fractions increase when the mode is switched to the EC mode. Eventually, the O
2 and H
2 mass fractions increase along the flow direction under a more stable EC mode at 2.5 s, and the magnitudes of O
2 and H
2 mass fractions are greater than those at the inlets of gas flow channels because of the production of O
2 and H
2 in the CLs. As with the H
2O mass fraction, the gradient of the O
2 mass fraction is significantly larger than that of the H
2 mass fraction.
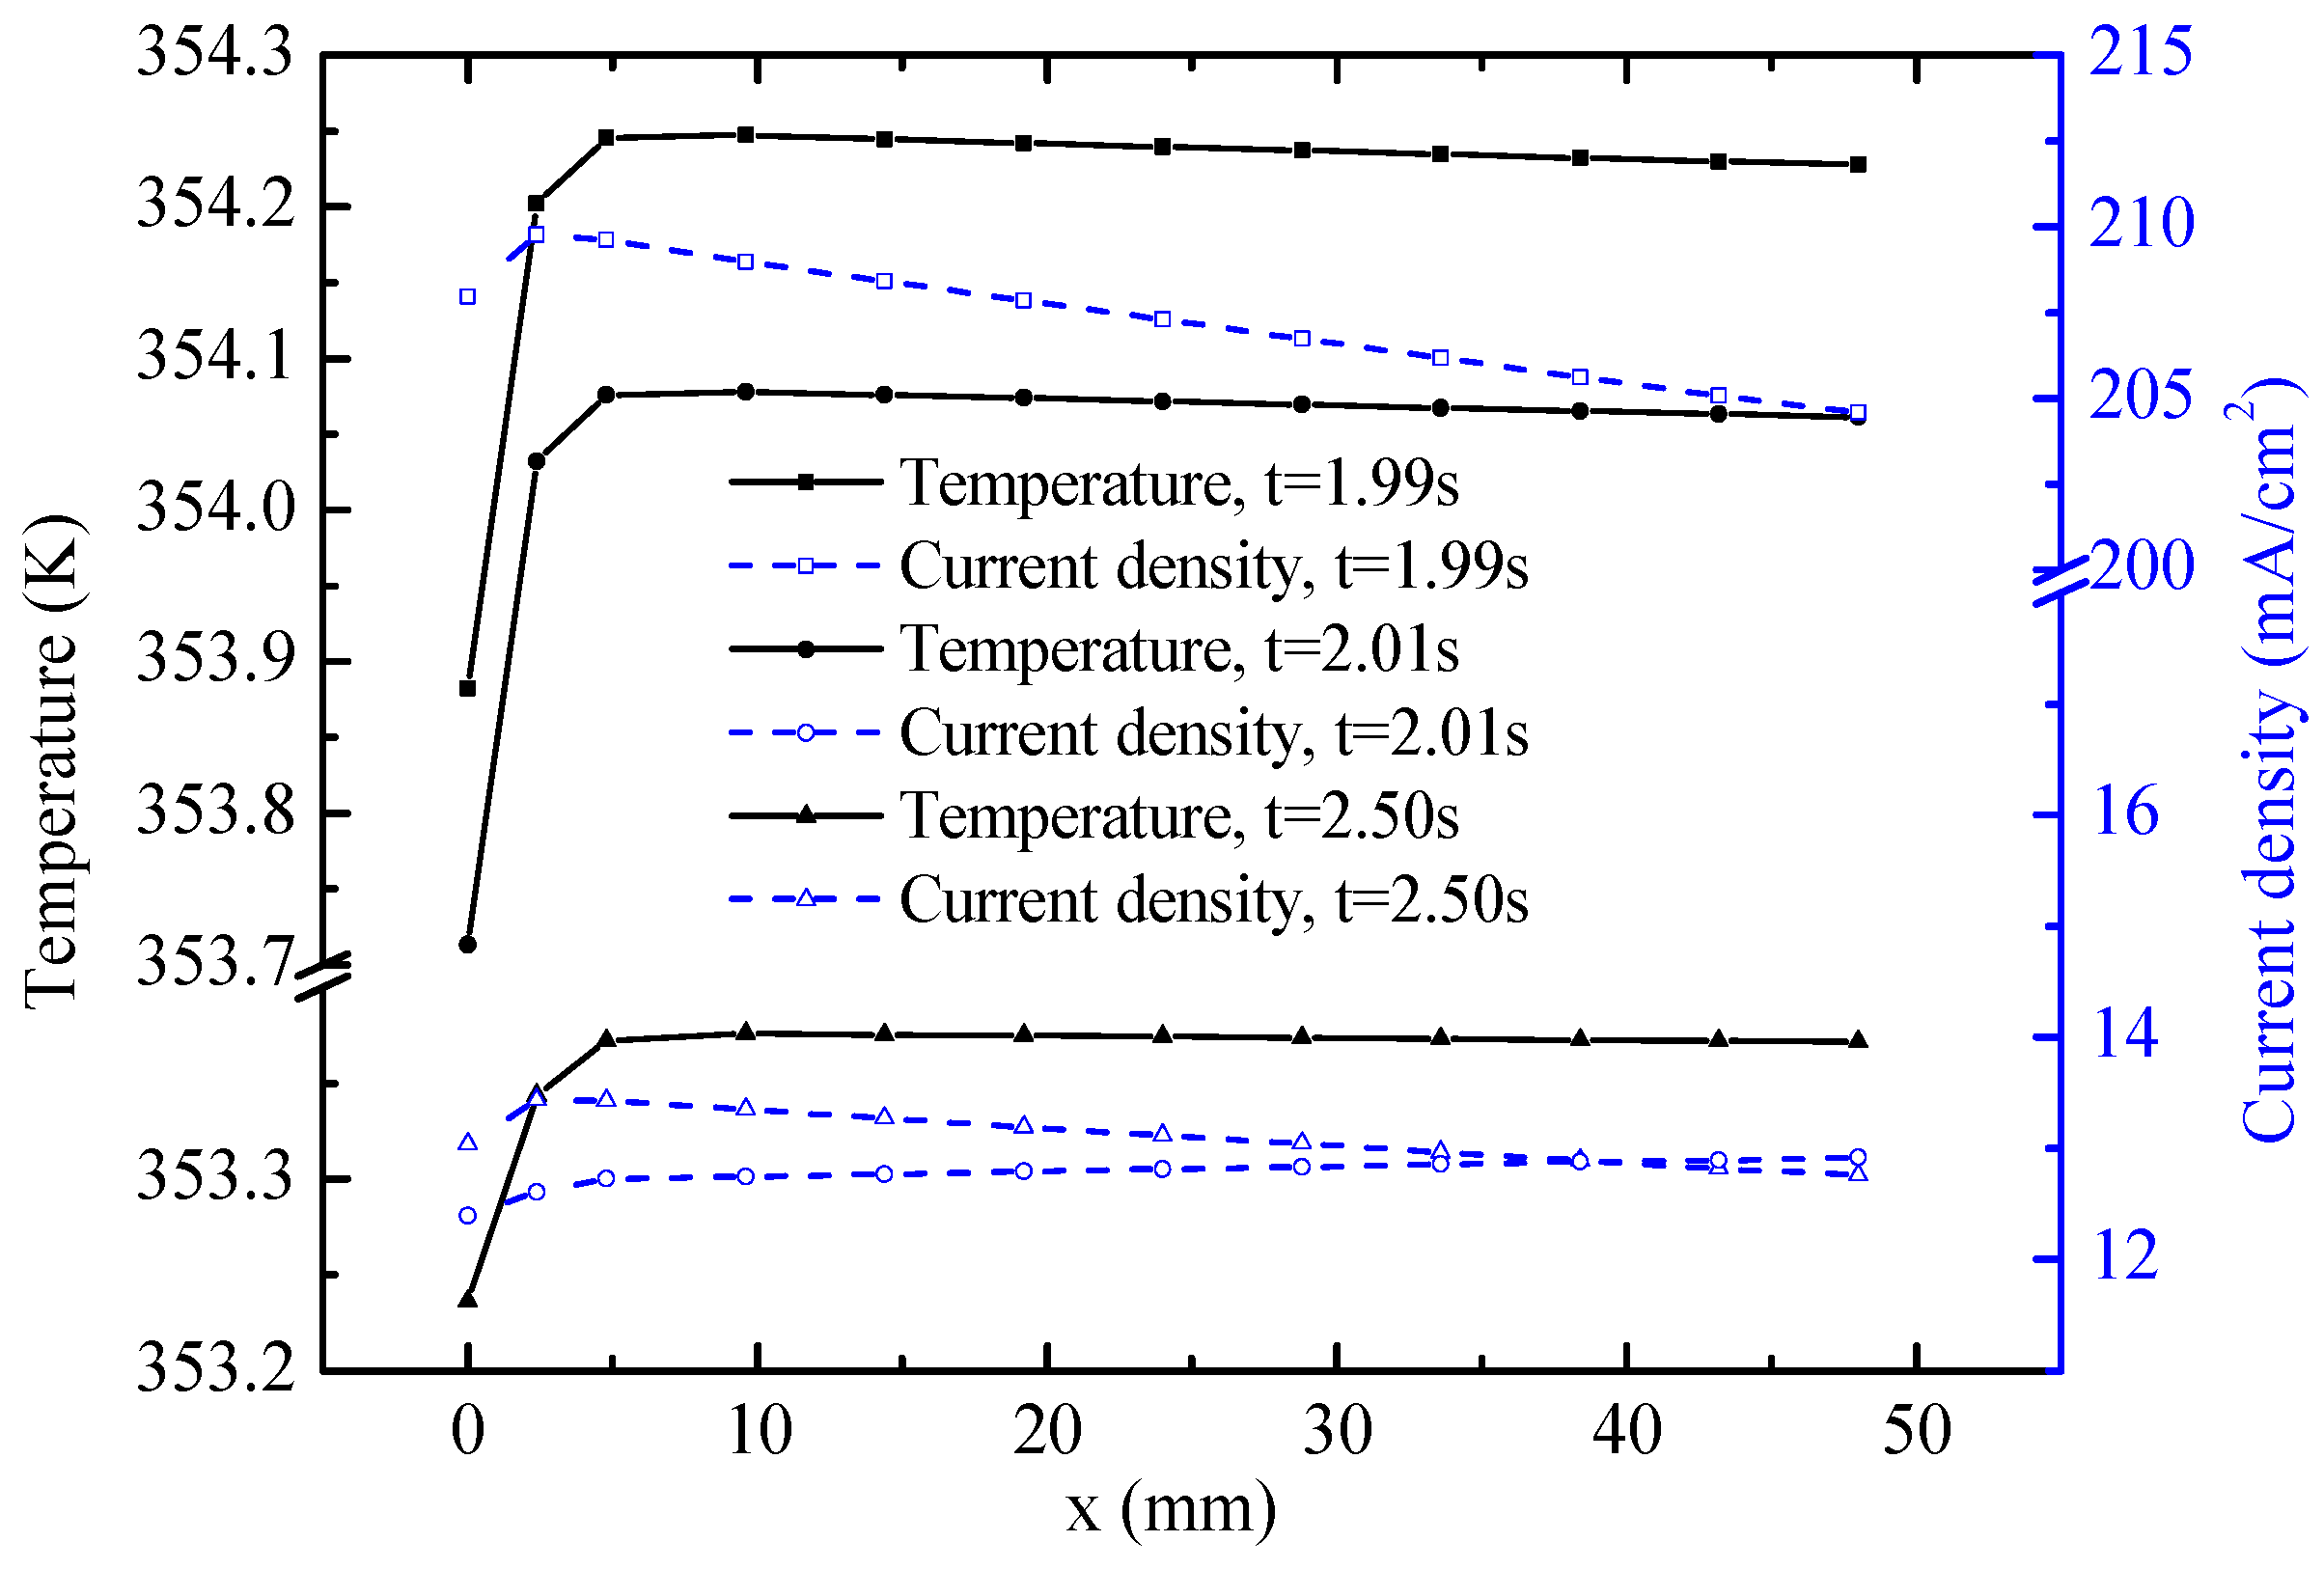
Figure 9 shows the distribution of temperature and current density along the central line of the OCL. At the end of the FC mode (1.99 s), the general trends of temperature and current density decline gradually along the
x-axis. The distribution of current density probably results from the concentrations of the reactants. As shown in
Figure 8, the O
2 mass fraction declines along the
x-axis. The temperature is determined by the heat source and heat flow. For the homogenous and isotropic CL, a relatively high temperature is observed where the heat source is large. The heat source in the OCL consists of heat attributed to activation polarizations, Joule heat, and reaction heat, all of which are positively correlated with current density. Therefore temperature is depressed along the
x-axis. Temperature and current density show remarkable reduction during 0.02 s from 1.99 s to 2.01 s. The causes of temperature reduction are varied. The main reasons are the endothermic electrochemical reaction heat source and low current density under the EC mode. However, the current density distribution increases slightly along the
x-axis at 2.01 s and decreases at 2.5 s. The main reason for these trends is the change of H
2O concentration, which has an opposite distribution trend compared with O
2. From the O
2 mass fraction shown in
Figure 8, the concentration of H
2O, which is reactant for the reaction of the EC mode, has a distribution trend similar to current density along the
x-axis. The temperature at the OCL exhibits an evident decrease in the process of operation mode switching. The temperature difference along the
x-axis is less than 0.1 K, except at the left end. The current density, temperature, and mass fraction of the reactant influence each other to some extent.
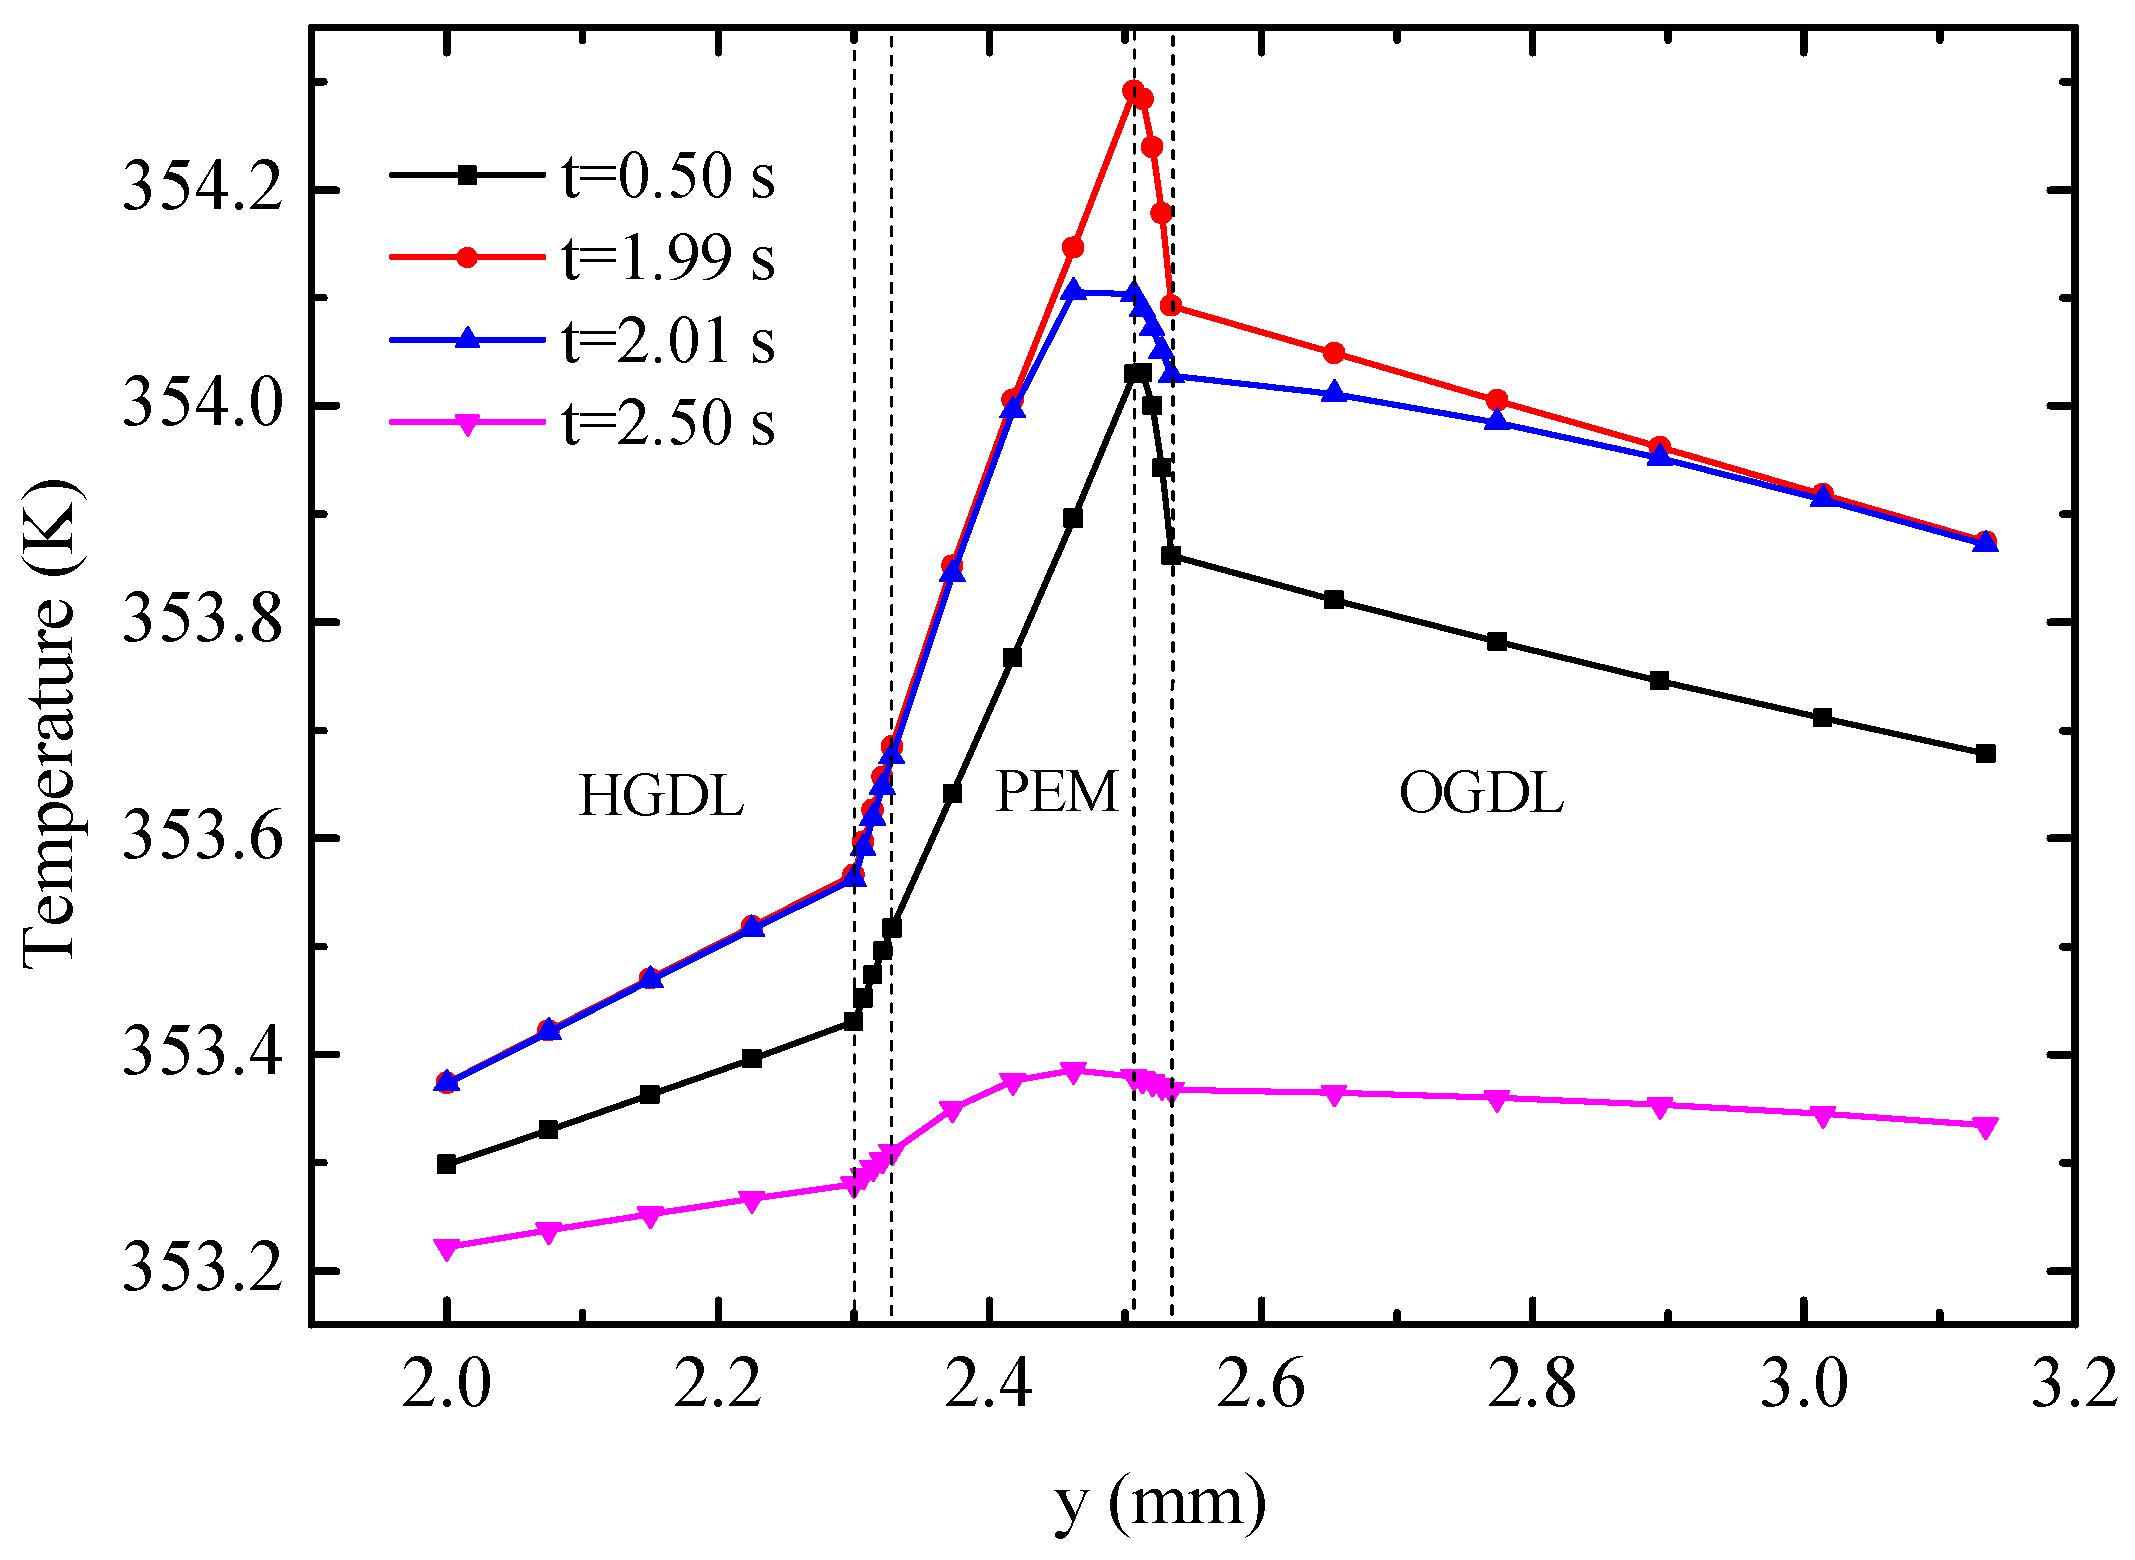
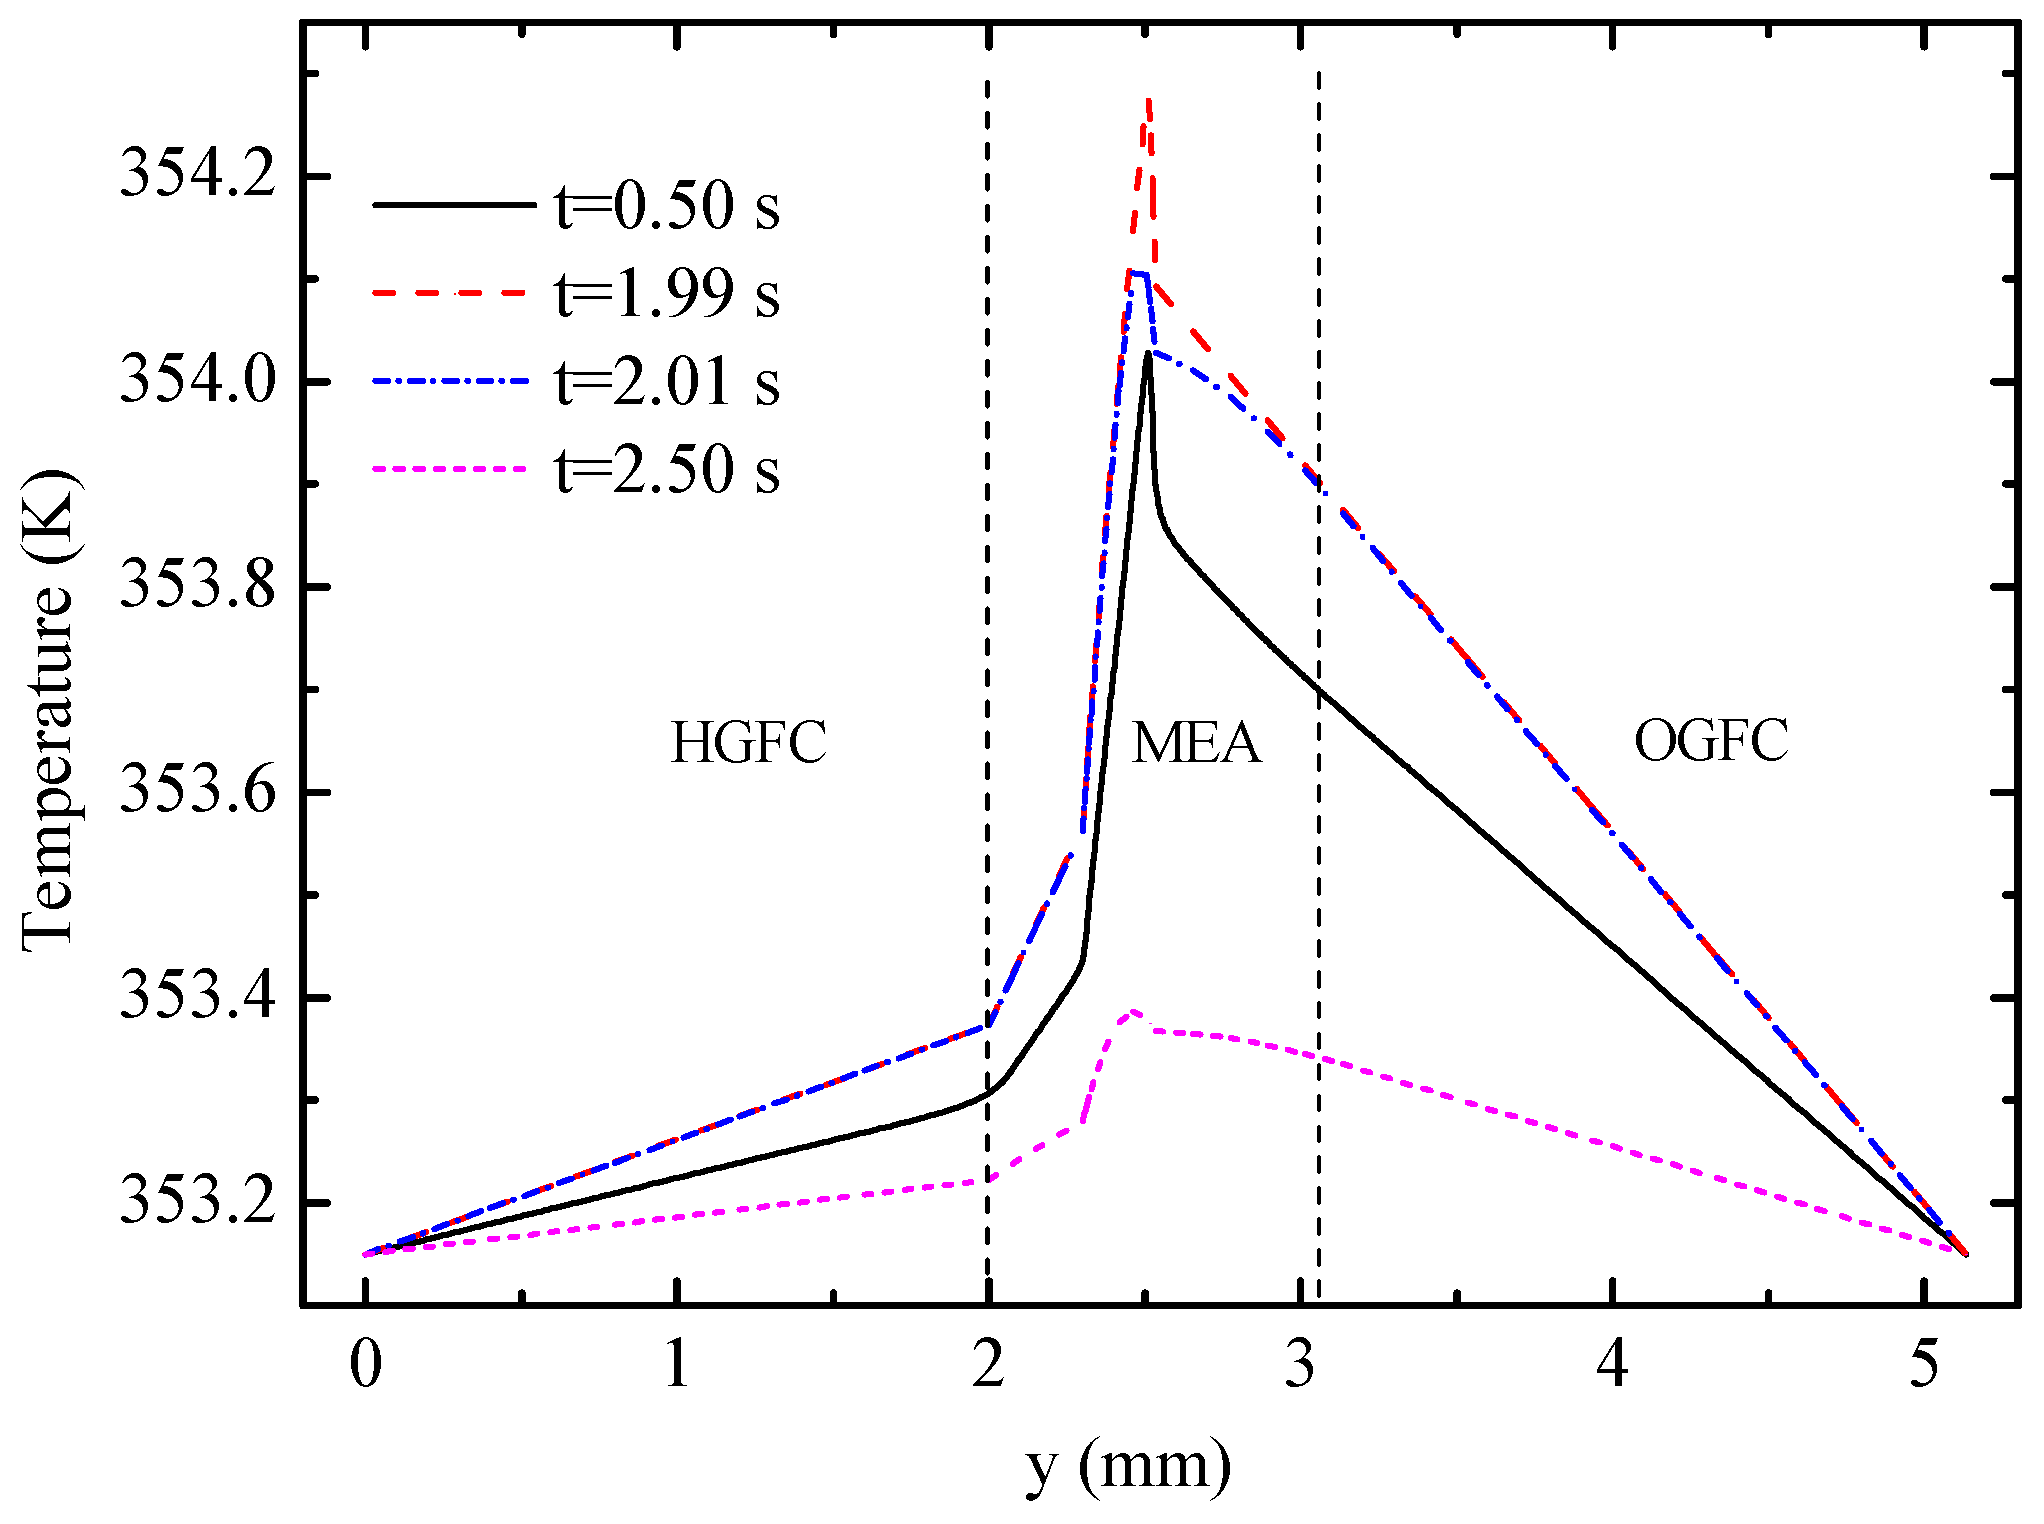
Figure 10 displays the temperature profiles of the cell along line B-B at different times.
Figure 11 shows the detailed temperature distribution of the MEA. As shown in
Figure 10, temperature in the hydrogen side is lower than that in the oxygen side, which can be explained by the following three factors: (1) The heat source in OCL accounts for more than 90% of all heat sources according to
Table 3; (2) the thickness of OGDL is double that of HGDL, which causes double Joule heat; and (3) the heat conductivity of oxygen is smaller than that of hydrogen. In spite of the endothermic reaction in the EC mode, the temperature in the hydrogen side is lower than that in the oxygen side during the limited time of this mode because of the heat attributed to activation polarizations, Joule heat, and heat accumulation in the FC mode. The maximum value of temperature appears at the OCL and increases gradually under the FC mode. During the 0.02 s from 1.99 s to 2.01 s, the temperature of the oxygen electrode decreases sharply, but the temperature of other areas almost remains constant. The main reason for these results is that the OCL is the place where heat source exhibits the most significant changes. Furthermore, the low conductivity of the membrane hinders heat transfer to the hydrogen side. After the EC process lasting 0.5 s, at 2.5 s, the maximum of temperature appears at the membrane on account of the largest value of heat source according to
Table 3. The temperature of the entire B-B line decreases to different degrees.
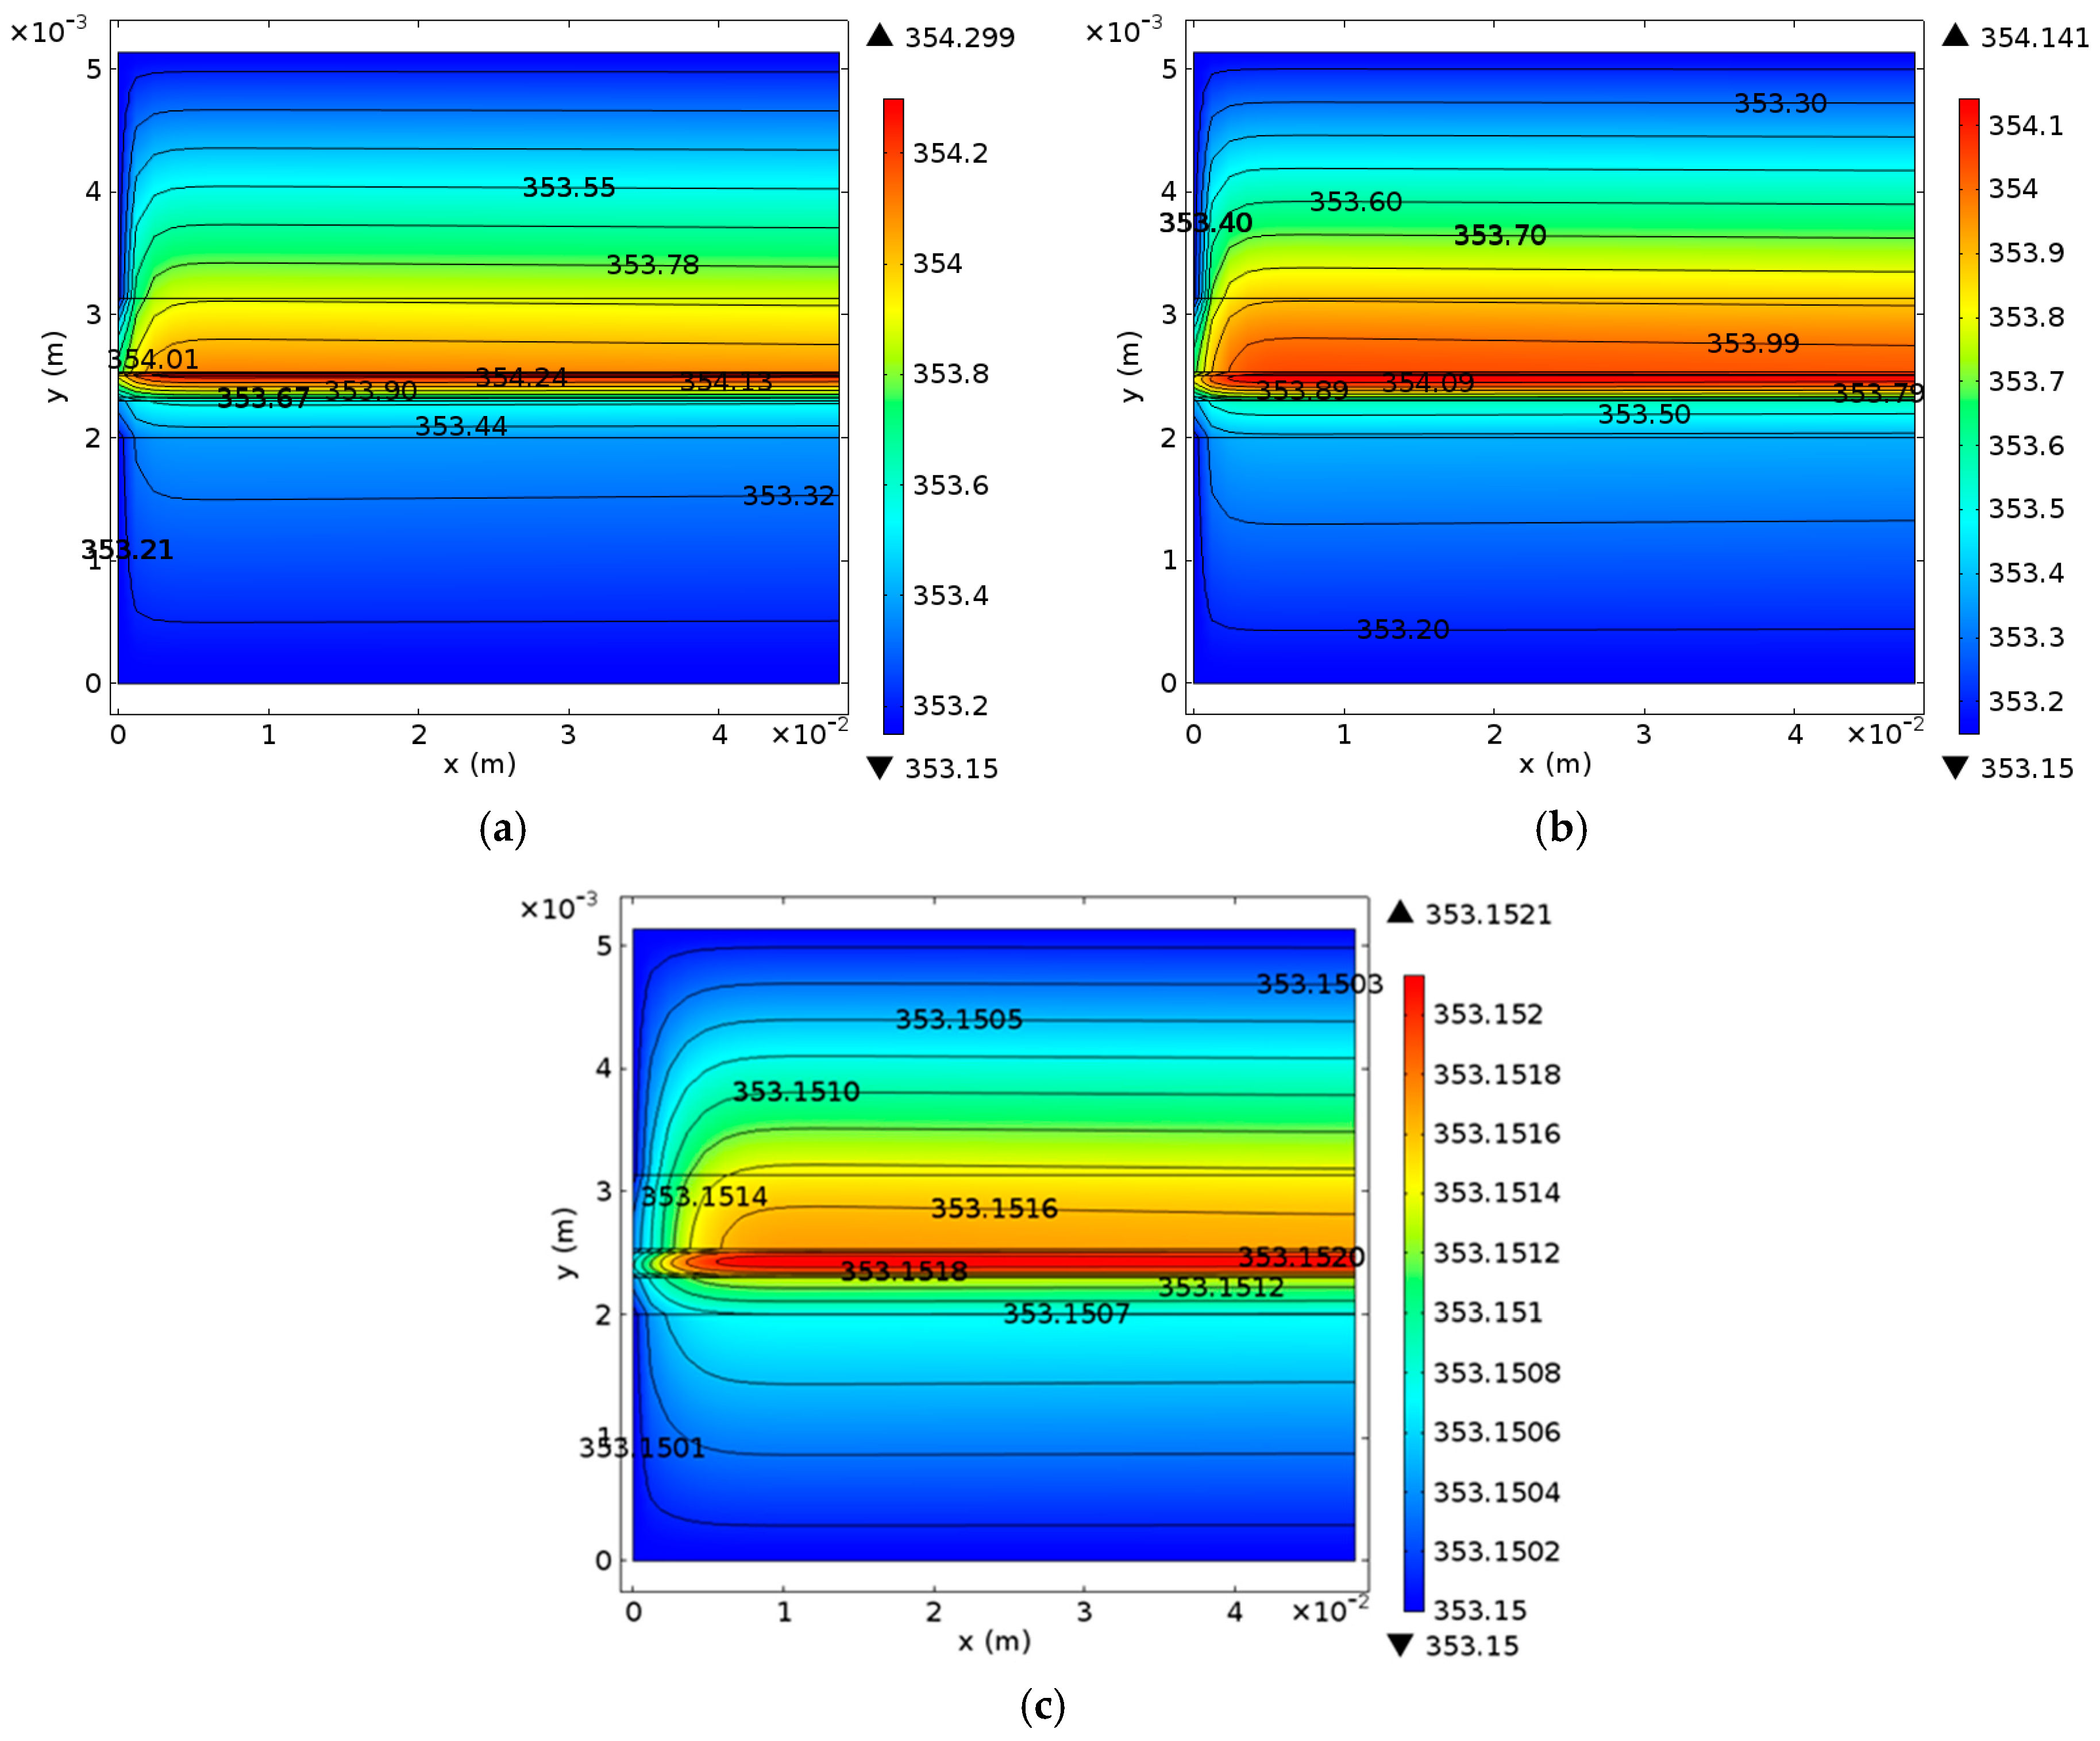
Similar phenomena and conclusion can be observed and drawn from
Figure 12, which shows transient variations of the entire cell temperature. Under the FC mode, the temperature in the OCL is significantly higher than that in other areas. The temperature difference decreases when the mode is switched to the EC mode. The maximum temperature difference is less than 1.5 K. By the time the EC reaches a more stable state, the cell temperature is slightly higher than the operating temperature, and the highest temperature appears at the membrane. In addition, the cell temperature distribution trends along the
x-axis are similar at different times. The temperature gradient near the inlet is relatively large and exhibit a small temperature change along the
x-axis behind
x = 0.05 m.
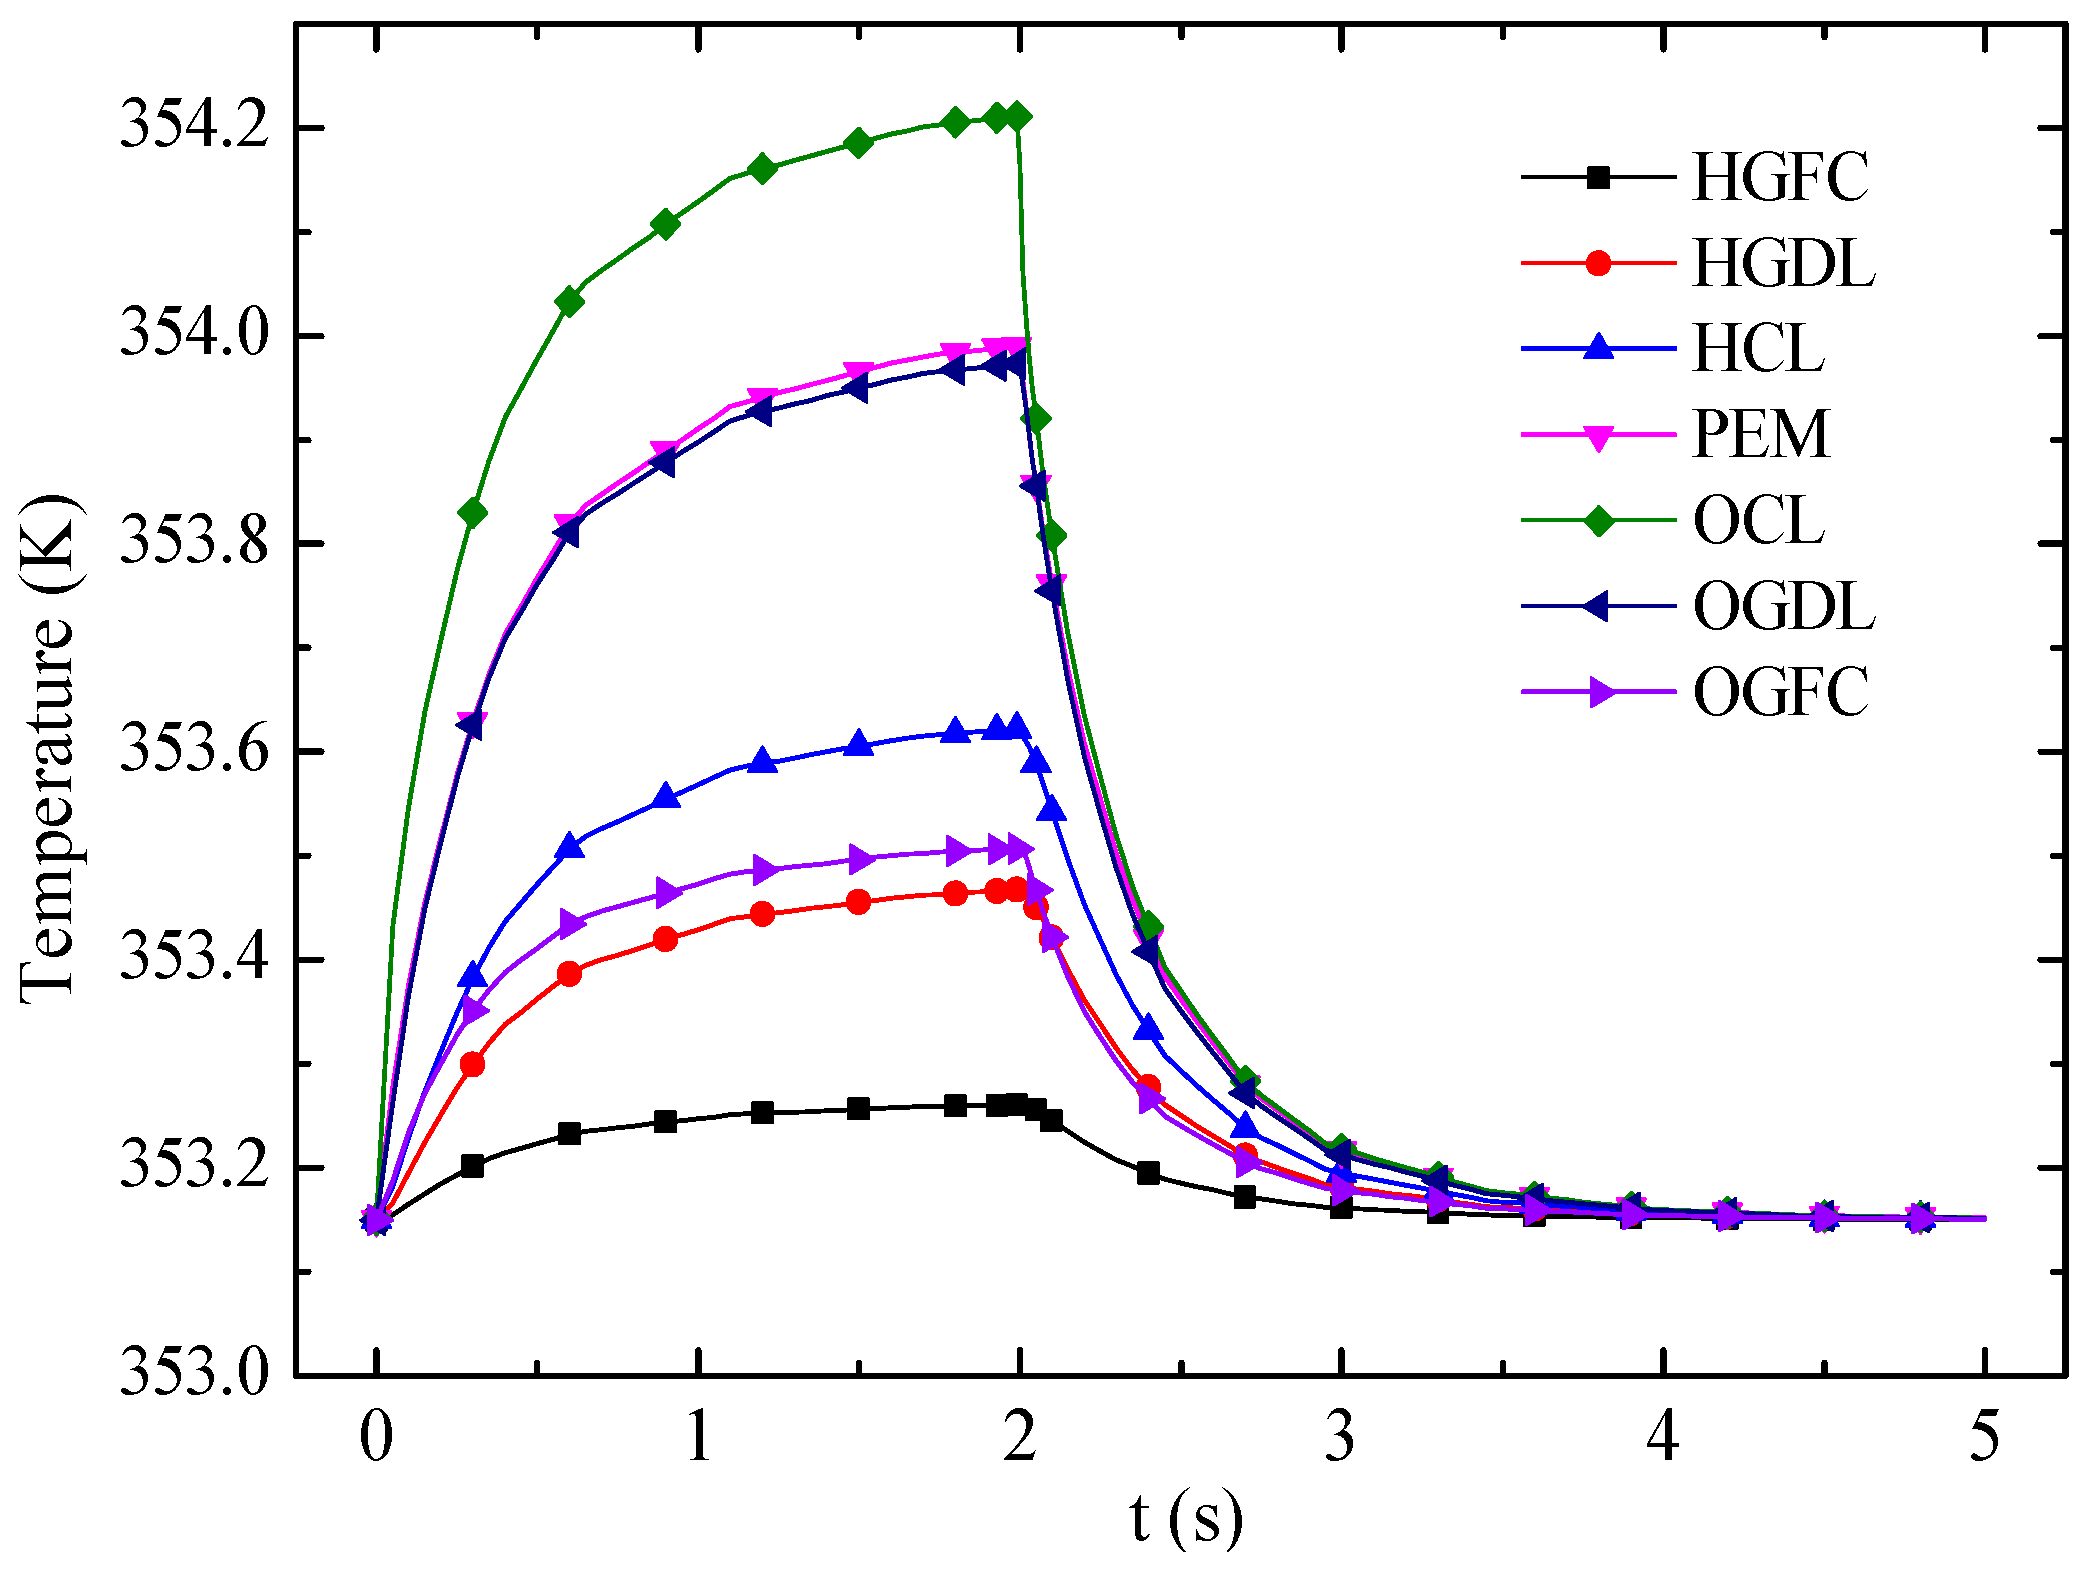
Figure 13 shows the transient responses of average temperature in different layers. The OCL, which generates the most heat under the FC mode but absorbs heat under the EC mode, has the strongest temperature variation. In the FC mode, the temperature of each layer increases with time because of heat accumulation. Then the temperature variation becomes small and decreases rapidly when the cell mode is switched from FC mode to EC mode at 2 s. The temperatures of the CLs are close to that of the membrane under the EC mode. Eventually, the temperature difference of entire cell is small because of the endothermic reaction and the small current density in the EC mode.
Table 3 lists the heat sources and its percentages in each layer before and after mode switching. Under the FC mode, heat attributed to activation polarizations and reaction heat are the main sources of cell total heat production, and Joule heat contributes less than 10% of all heat. When the mode is switched to EC, cell total heat production comes mainly from Joule heat in the membrane, and the value of the heat source in the OCL is negative because of the endothermic reaction. However, the cell is still exothermic, although the total heat is small under the EC mode.


