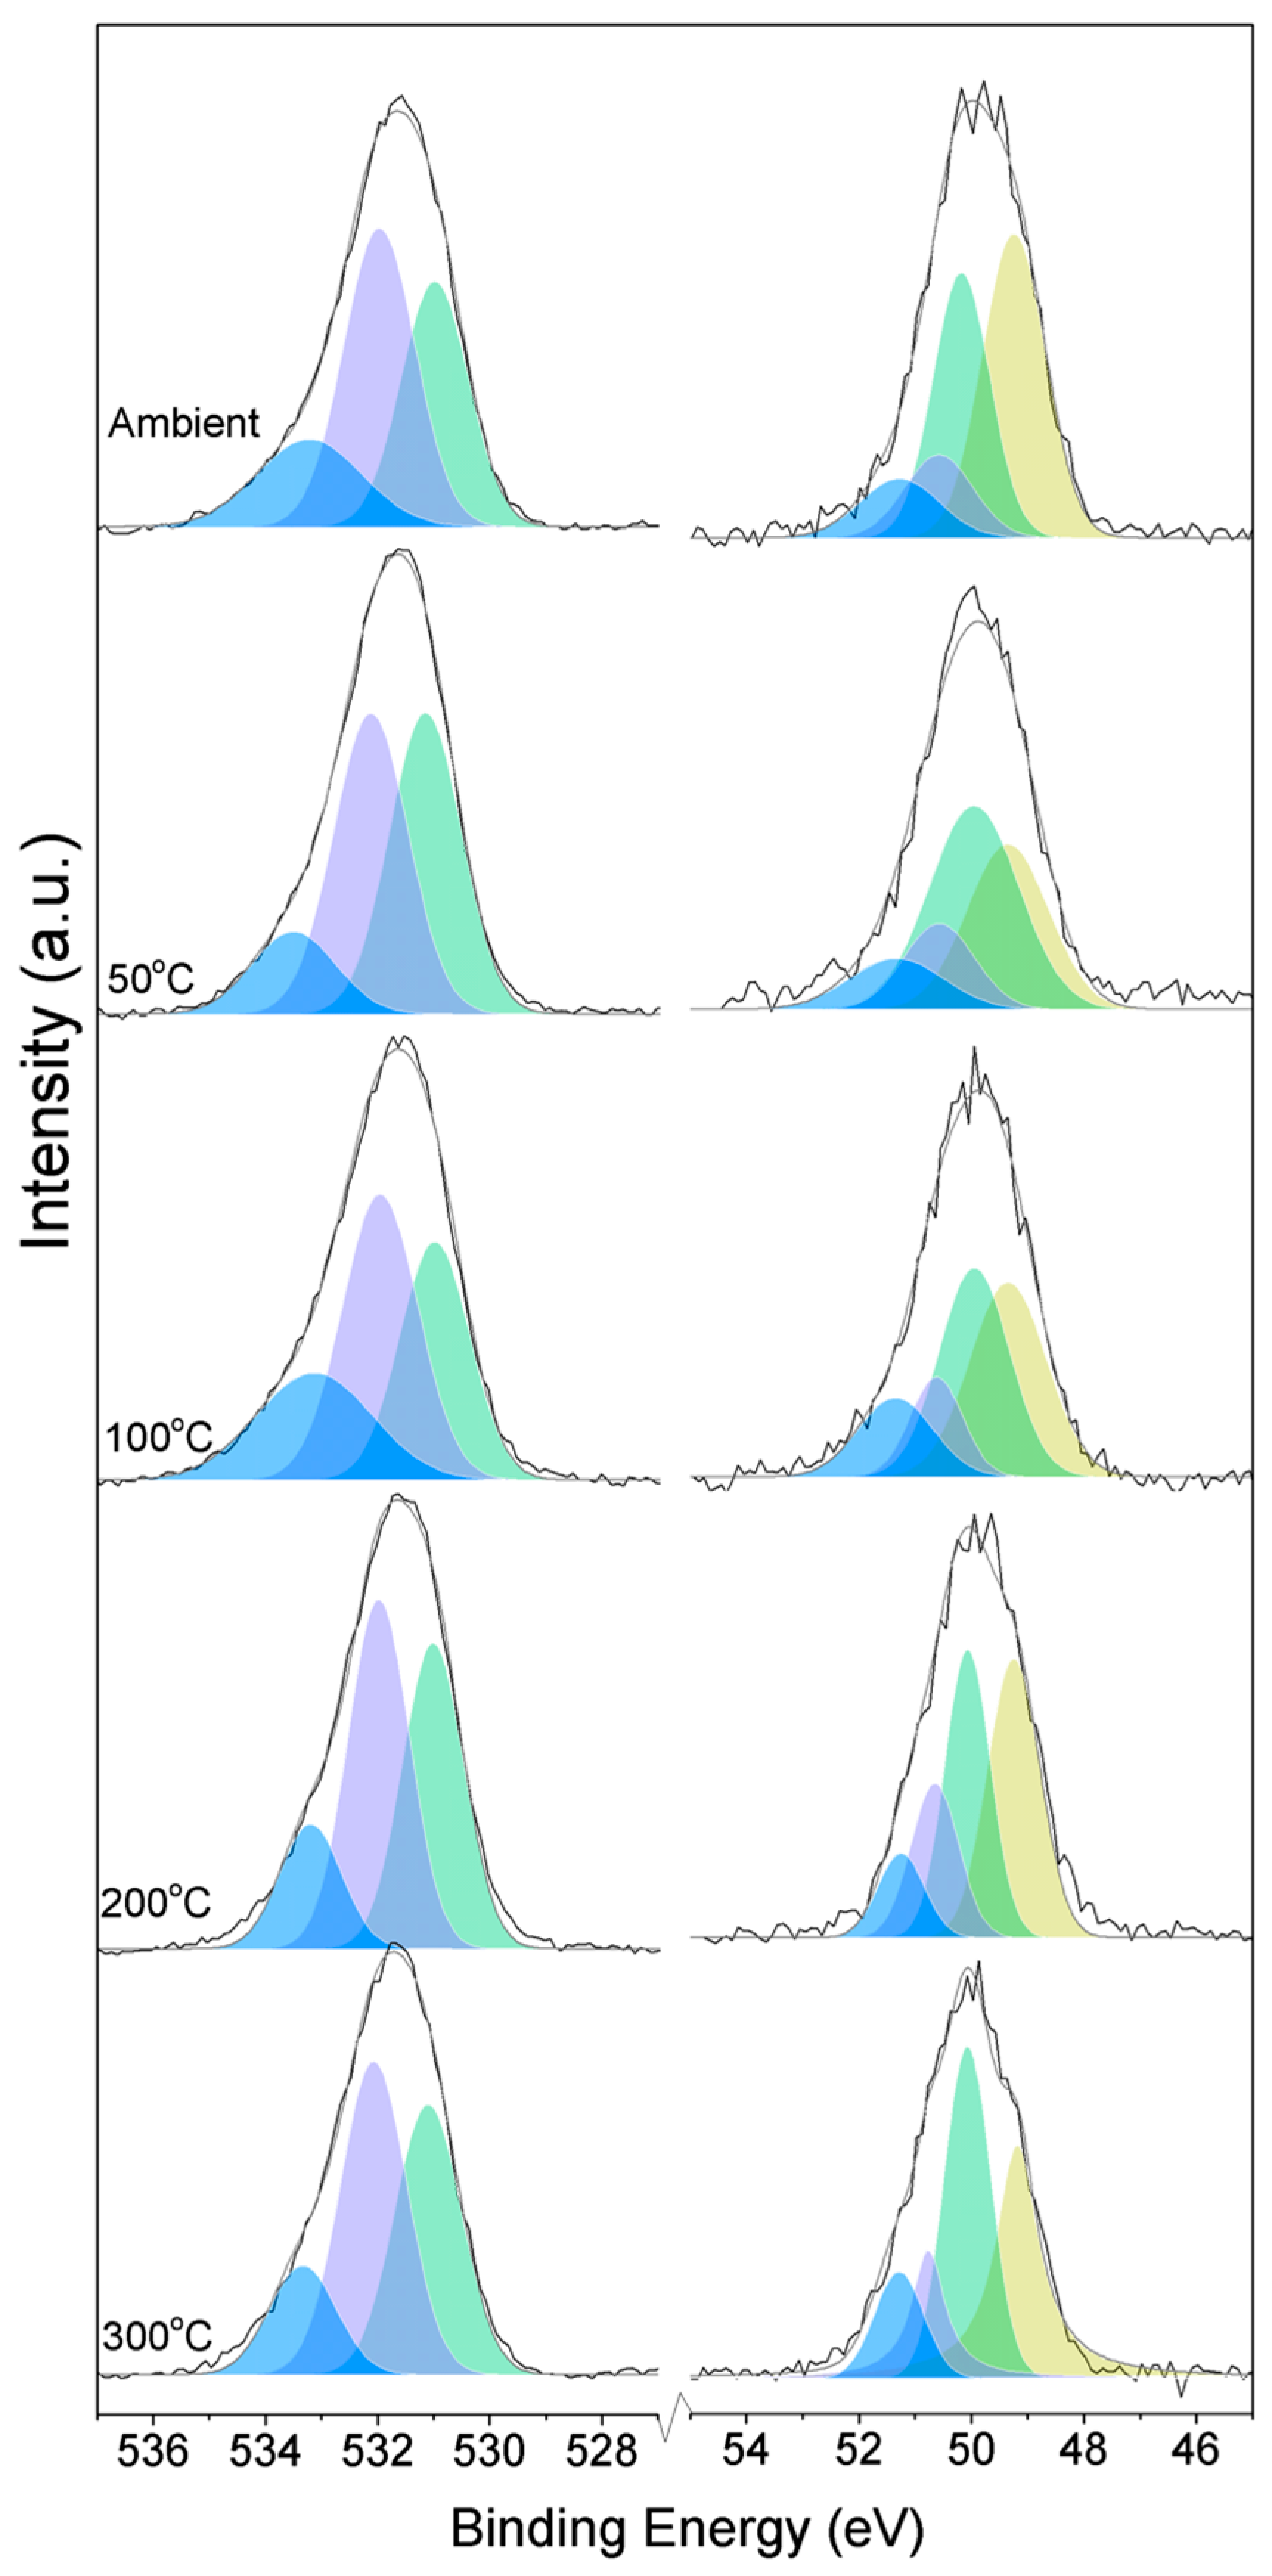
3.1. Samples Exposed to High Temperatures
Three O1s peaks are easily distinguished in the XPS spectra of all of the samples (
Figure 1). From the literature, it is known that the peaks related to magnesium oxides have BEs at approximately 530.0–531.0 eV, magnesium hydrates (MH) have BEs at approximately 530.0–533.2 eV, and magnesium carbonates present peaks in the range of 533.2–533.5 eV [
19,
20,
21,
22,
23,
24,
25]. Due to the enthalpy impact from the BE of its three water molecules, nesquehonite is the most stable phase at pCO
2 = pH
2O = 1 bar at up to 46 °C. As the temperature increases, magnesite becomes the most stable phase, followed by MgO [
4].
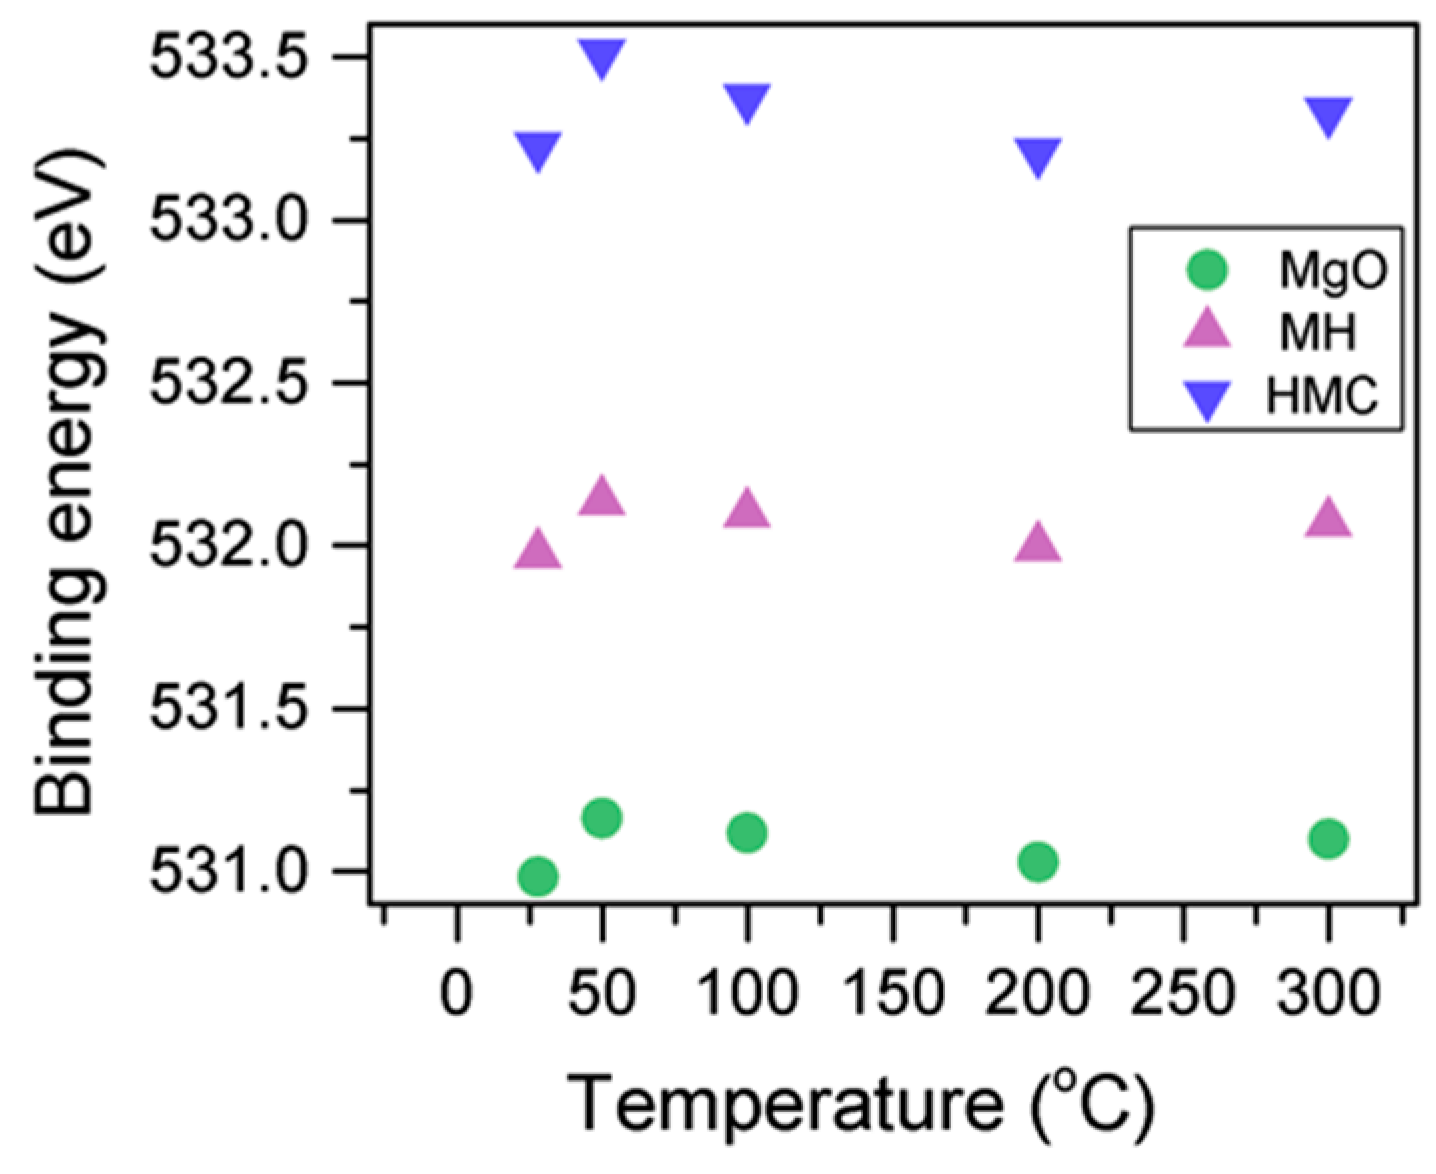
Here, changes are observed when the samples are subjected to an increase in the temperature; the following describes the phase changes: the O1s peak at higher temperature, related to the magnesium carbonates, shifts initially to a higher BE (533.2 to 533.5 eV) (
Figure 2,
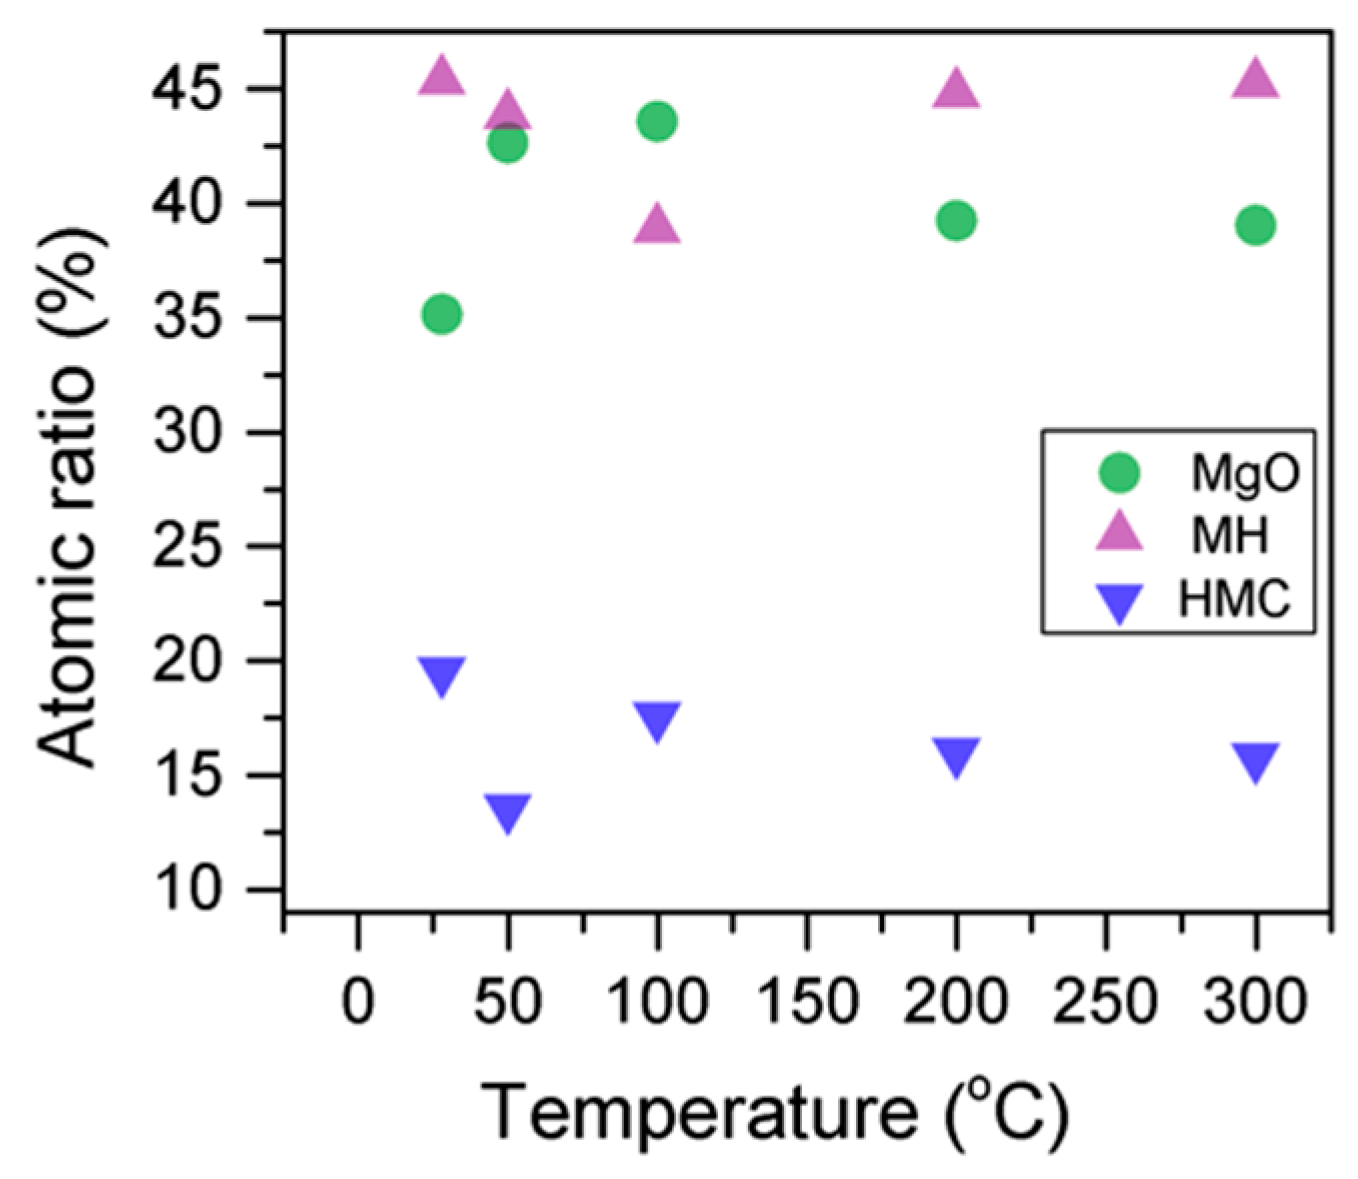
Table 4), which can be attributed to the transformation of nesquehonite into hydromagnesite, followed by a gradual decrease in the BE as the temperature increases further, which could be due to the formation of magnesite by the dehydration of the sample. The atomic ratio of the carbonates fluctuates; however, as expected, no large changes are observed since the decarbonation of the samples only starts at higher temperatures (
Figure 3,
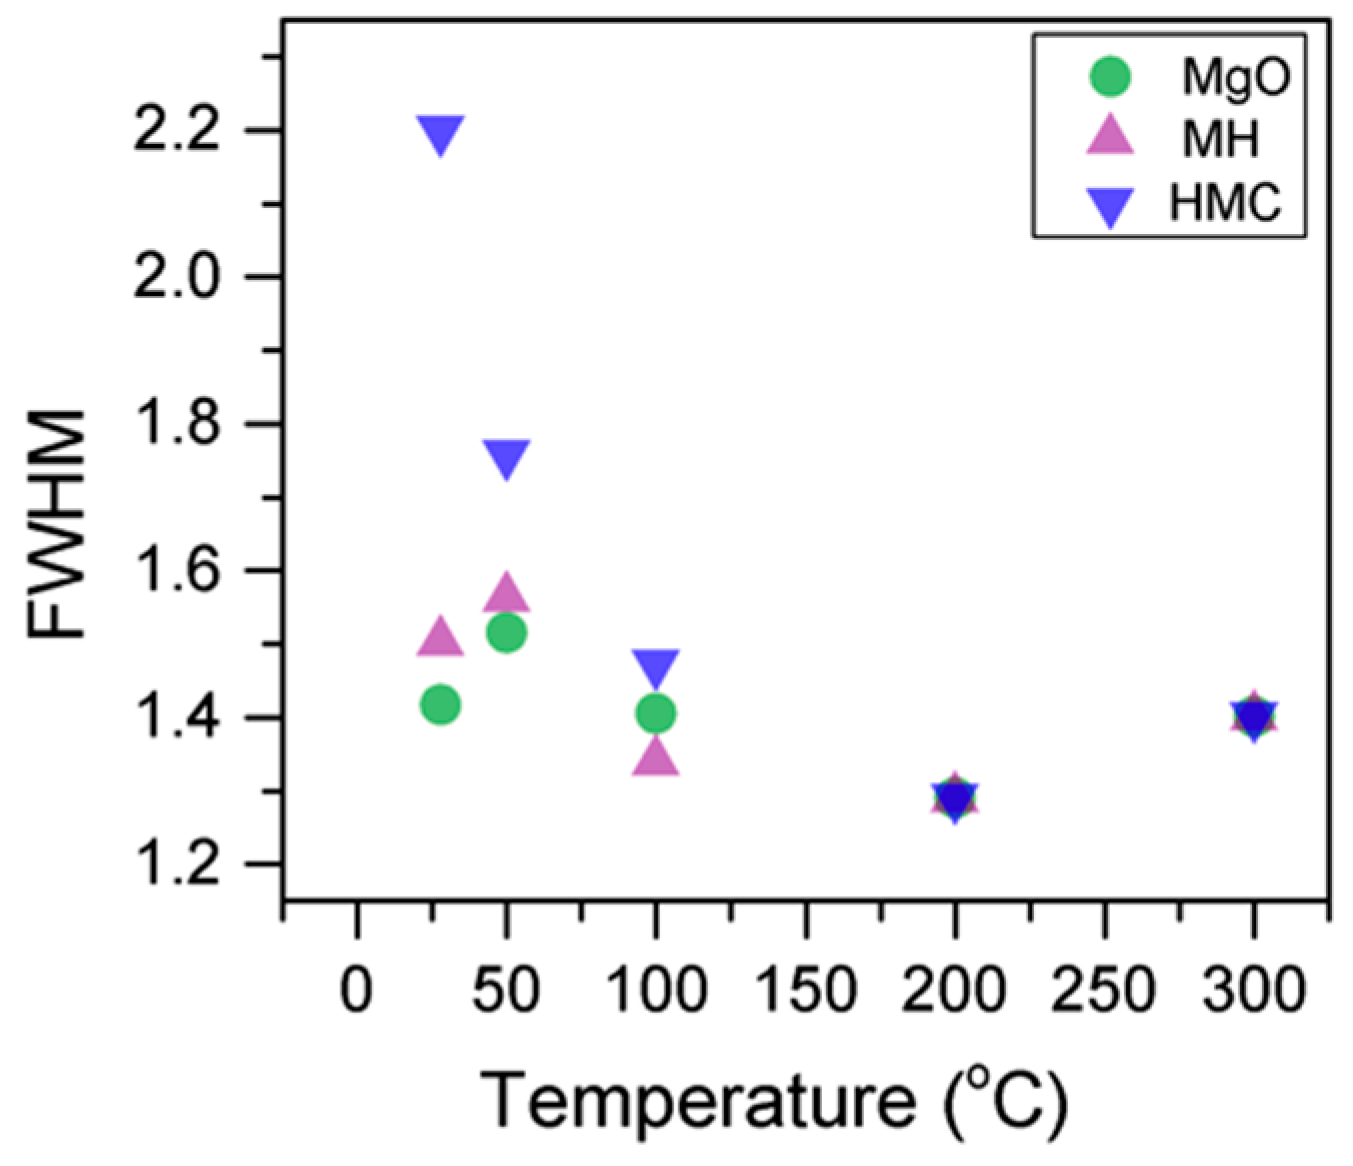
Table 4), while the decrease in the FWHM confirms the expected changes in the oxygen bonding (
Figure 4,
Table 4).
As previously emphasized, magnesite and brucite are the only stable phases in the MgO–CO
2–H
2O system, and the increase of the temperature leads to the formation of less hydrated phases. At temperatures above 10 °C, lansfordite decomposes into nesquehonite [
3,
6]; therefore, lansfordite is not expected to be observed here. Due to the loss of water from the system, which results in the reduction of water activity, above 50 °C, nesquehonite is converted into hydromagnesite [
6,
26]. However, intermediate phases may be present. Between 100 and 200 °C, the dehydration of hydromagnesite can be observed, and the formation of amorphous magnesite occurs at 126 °C. Above 315 °C, the decarbonation process starts, which leads to the formation of crystalline magnesite. The formation of periclase, which is the only phase observed at higher temperatures, can be observed at temperatures as low as 330 °C [
27].
Under ambient temperature and CO
2 concentrations, the formation of artinite and lansfordite (MgCO
3·5H
2O) is expected. The formation of artinite requires less CO
2 than the amount present under ambient conditions (8–40 × 10
−4 vs. 0.04%) [
2]. An increase in the temperature results in the transformation of these HMCs into nesquehonite [
7,
12], which can also form under ambient temperature and CO
2 concentrations [
9,
28,
29,
30]. Other studies have shown that nesquehonite forms at a temperature and CO
2 pressure of ~25–55 °C and 1 bar, respectively [
29,
31,
32]. Nesquehonite is stable at temperatures as high as 55–100 °C, after which it loses its water of crystallization [
17,
33,
34,
35]. The presence of hydromagnesite at lower temperatures and ambient CO
2 concentrations has also been reported [
30]. The dehydration of hydromagnesite starts at 135 °C, followed by dehydroxylation at approximately 184 °C [
36]. Other studies have shown that hydromagnesite is stable up to 300 °C [
15]. Dypingite, which exists under elevated temperatures, is usually observed as an intermediate phase between nesquehonite and hydromagnesite [
9,
37].
There are contradictions in the literature with regards to the Mg2p binding energy (BE) of different magnesium components, but the peak with the lowest BE is associated with metallic Mg [
21,
22,
38,
39], or single-crystal 0001 Mg [
40]. At higher BEs, several authors associate MgO with the peak at approximately 50.3–50.8 eV [
20,
39,
40,
41], while Mg(OH)
2 is represented by the peaks at approximately 49.5 [
42] to 51.5 eV [
19,
22]. Finally, MgCO
3 is present in peaks from 50.4 [
43], through intermediate values [
19,
20], and up to 54.0 eV [
44]. Newberg et al. [
45] presented a detailed study on the reaction of MgO thin films with water in ambient temperature using XPS, which demonstrated how molecular and dissociative water react with the MgO to form the hydrated products.
The Mg2p level is close to the valence band and, therefore, it is easy to observe changes in the valence band and to identify the valence state for this element. In this case, a shift to higher binding energies occurs when a valence electron is lost because the bonds become stronger, i.e., anions have lower BEs than atoms. Therefore, for the Mg2p peaks, it is inferred that the peak at a higher BE is related to MgCO
3 or to dioxygen species, such as magnesium peroxide, with Mg in the form of (2+) [
44].
As expected, the samples present magnesium with different coordinations, which means that they form different components. All samples present four components for Mg2p: at BEs of 49.2 eV (associated with metallic Mg, which can be a residue from the precursor during the synthesis), 50.1 eV (that may represent MgO), and 50.5 eV (related to the Mg-O/OH species [
22], which can be MgOH [
22,
38,
40,
41,
46]). Mg2p peaks present at low BE, such as the peak at 49.2 eV, are normally associated with pure, metallic Mg. The specimens present an additional peak at approximately 51.4 eV, which is associated with crystalline Mg–OH [
22], i.e., Mg(OH)
2, or to MgCO
3.
When the samples are subjected to high temperatures, it is observed that the Mg2p peak related to metallic Mg shifts by 0.2 eV to a higher BE but soon fluctuates down to the initial BE. Simultaneously, the peak related to MgO shifts to a lower BE (50.2 to 50.0 eV), and this increases again when the samples are subjected to temperatures higher than 100 degrees; however, the BE is still lower than the initial BE by 0.1 eV, and the Mg(OH)
2 peak shows a 0.2 eV shift to a higher BE only when the temperature is at 300 °C. The peak at a higher BE, related to the magnesium carbonates, does not exhibit any significant change in terms of BE. In the literature, samples heated to high temperatures, however, present abnormalities on the adventitious carbon peak, which end up inducing errors on the BE of the magnesium peak [
47,
48,
49]. These studies correct the charging effect by using alternative peaks, usually the O1s peak, when it originates only from the native oxide; however, this cannot be ensured here. Therefore, the Mg2p BE here cannot be considered as stand-alone information on the chemical state of the elements, and it is analyzed together with the concentration, FWHM, and the other components present in the sample.
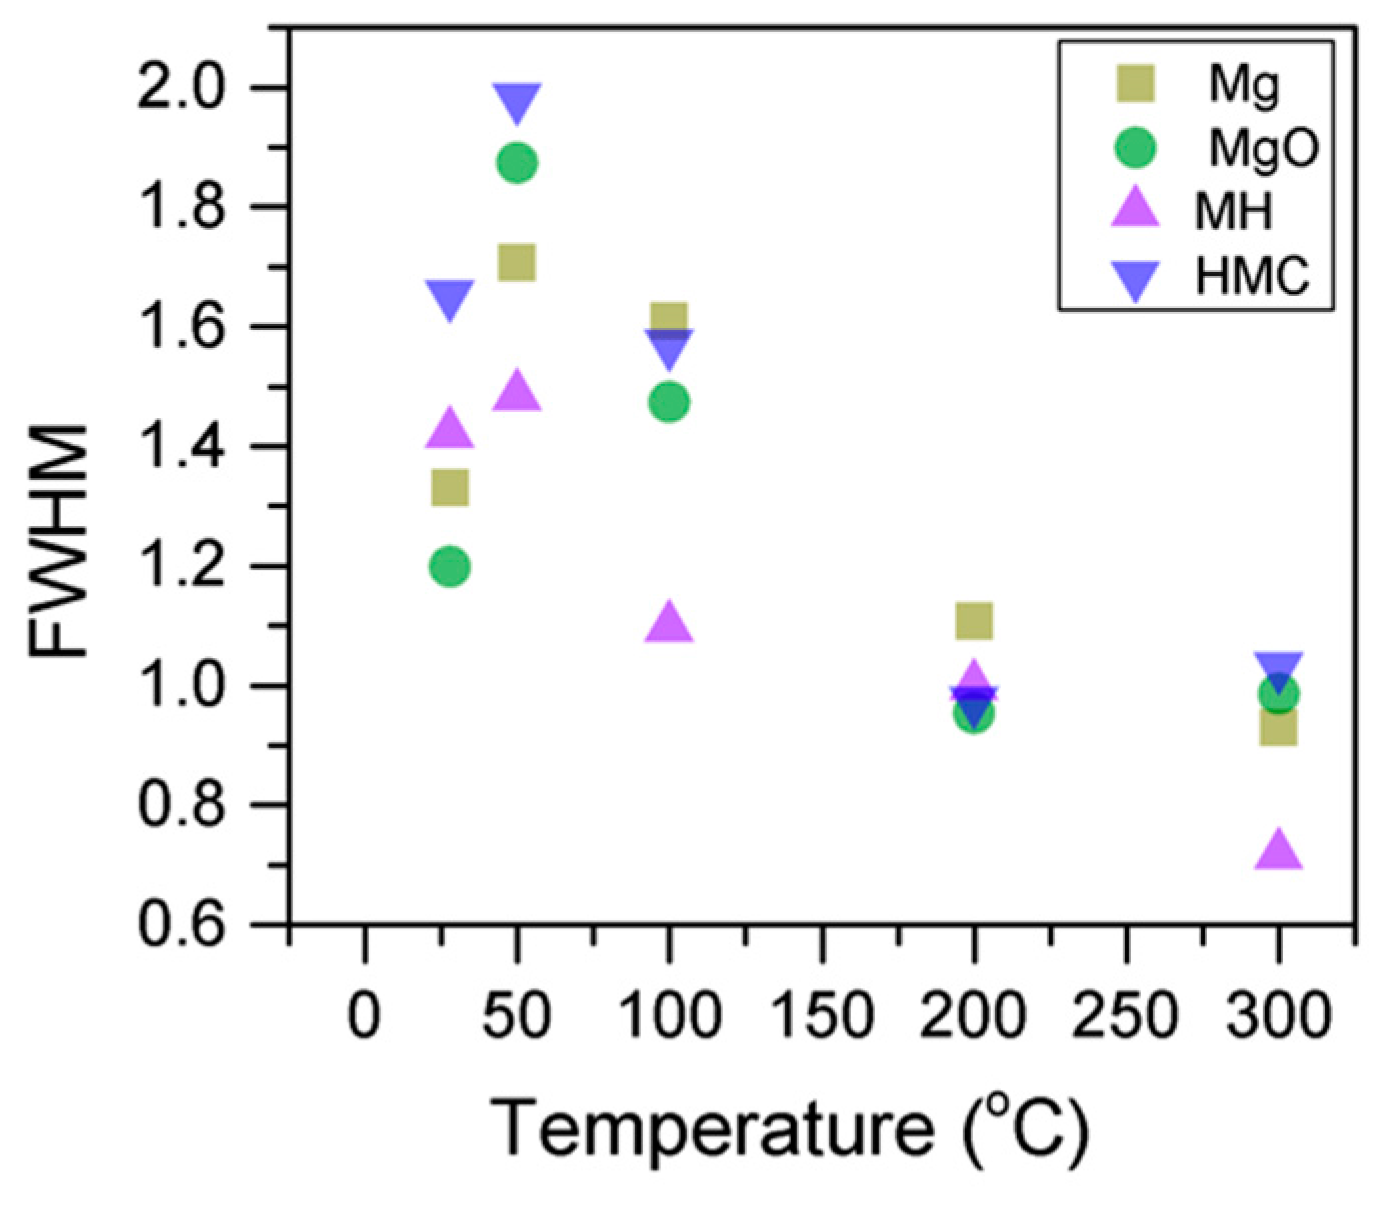
Here, the FWHM reduces significantly for the all the elements, which indicates changes in the chemical state; in particular, in magnesium hydrates, where the decrease is more significant, the reduction in the FWHM indicates the decomposition of these components (
Figure 5). At the same time, the amount of MgCO
3 in the samples fluctuates as the temperature increases, as there is not much decarbonation within this range; moreover, the other components do not provide significant information on the atomic ratio.
There is a C1s signal at approximately 290 eV (not presented here) due to carbon-oxygen bonding, which may be O–C=O. It is known that the carbon atoms in the magnesite phase are threefold-coordinated carbon atoms with triangular CO
2− ions with sp
2 bonding [
50], which is likely observed here. Feliu et al. [
21] in their experiments involving the exposure of pure Mg to an ambient environment with high humidity, also describe observing hydration and carbonation and associating peaks at approximately 290.3–290.8 eV to magnesium carbonates. Here, all of the samples that are either subjected or not subjected to high temperatures gradually present the same peak at approximately 289.8 eV, which is related to magnesium carbonates, and no significant differences in the FWHM value are observed.
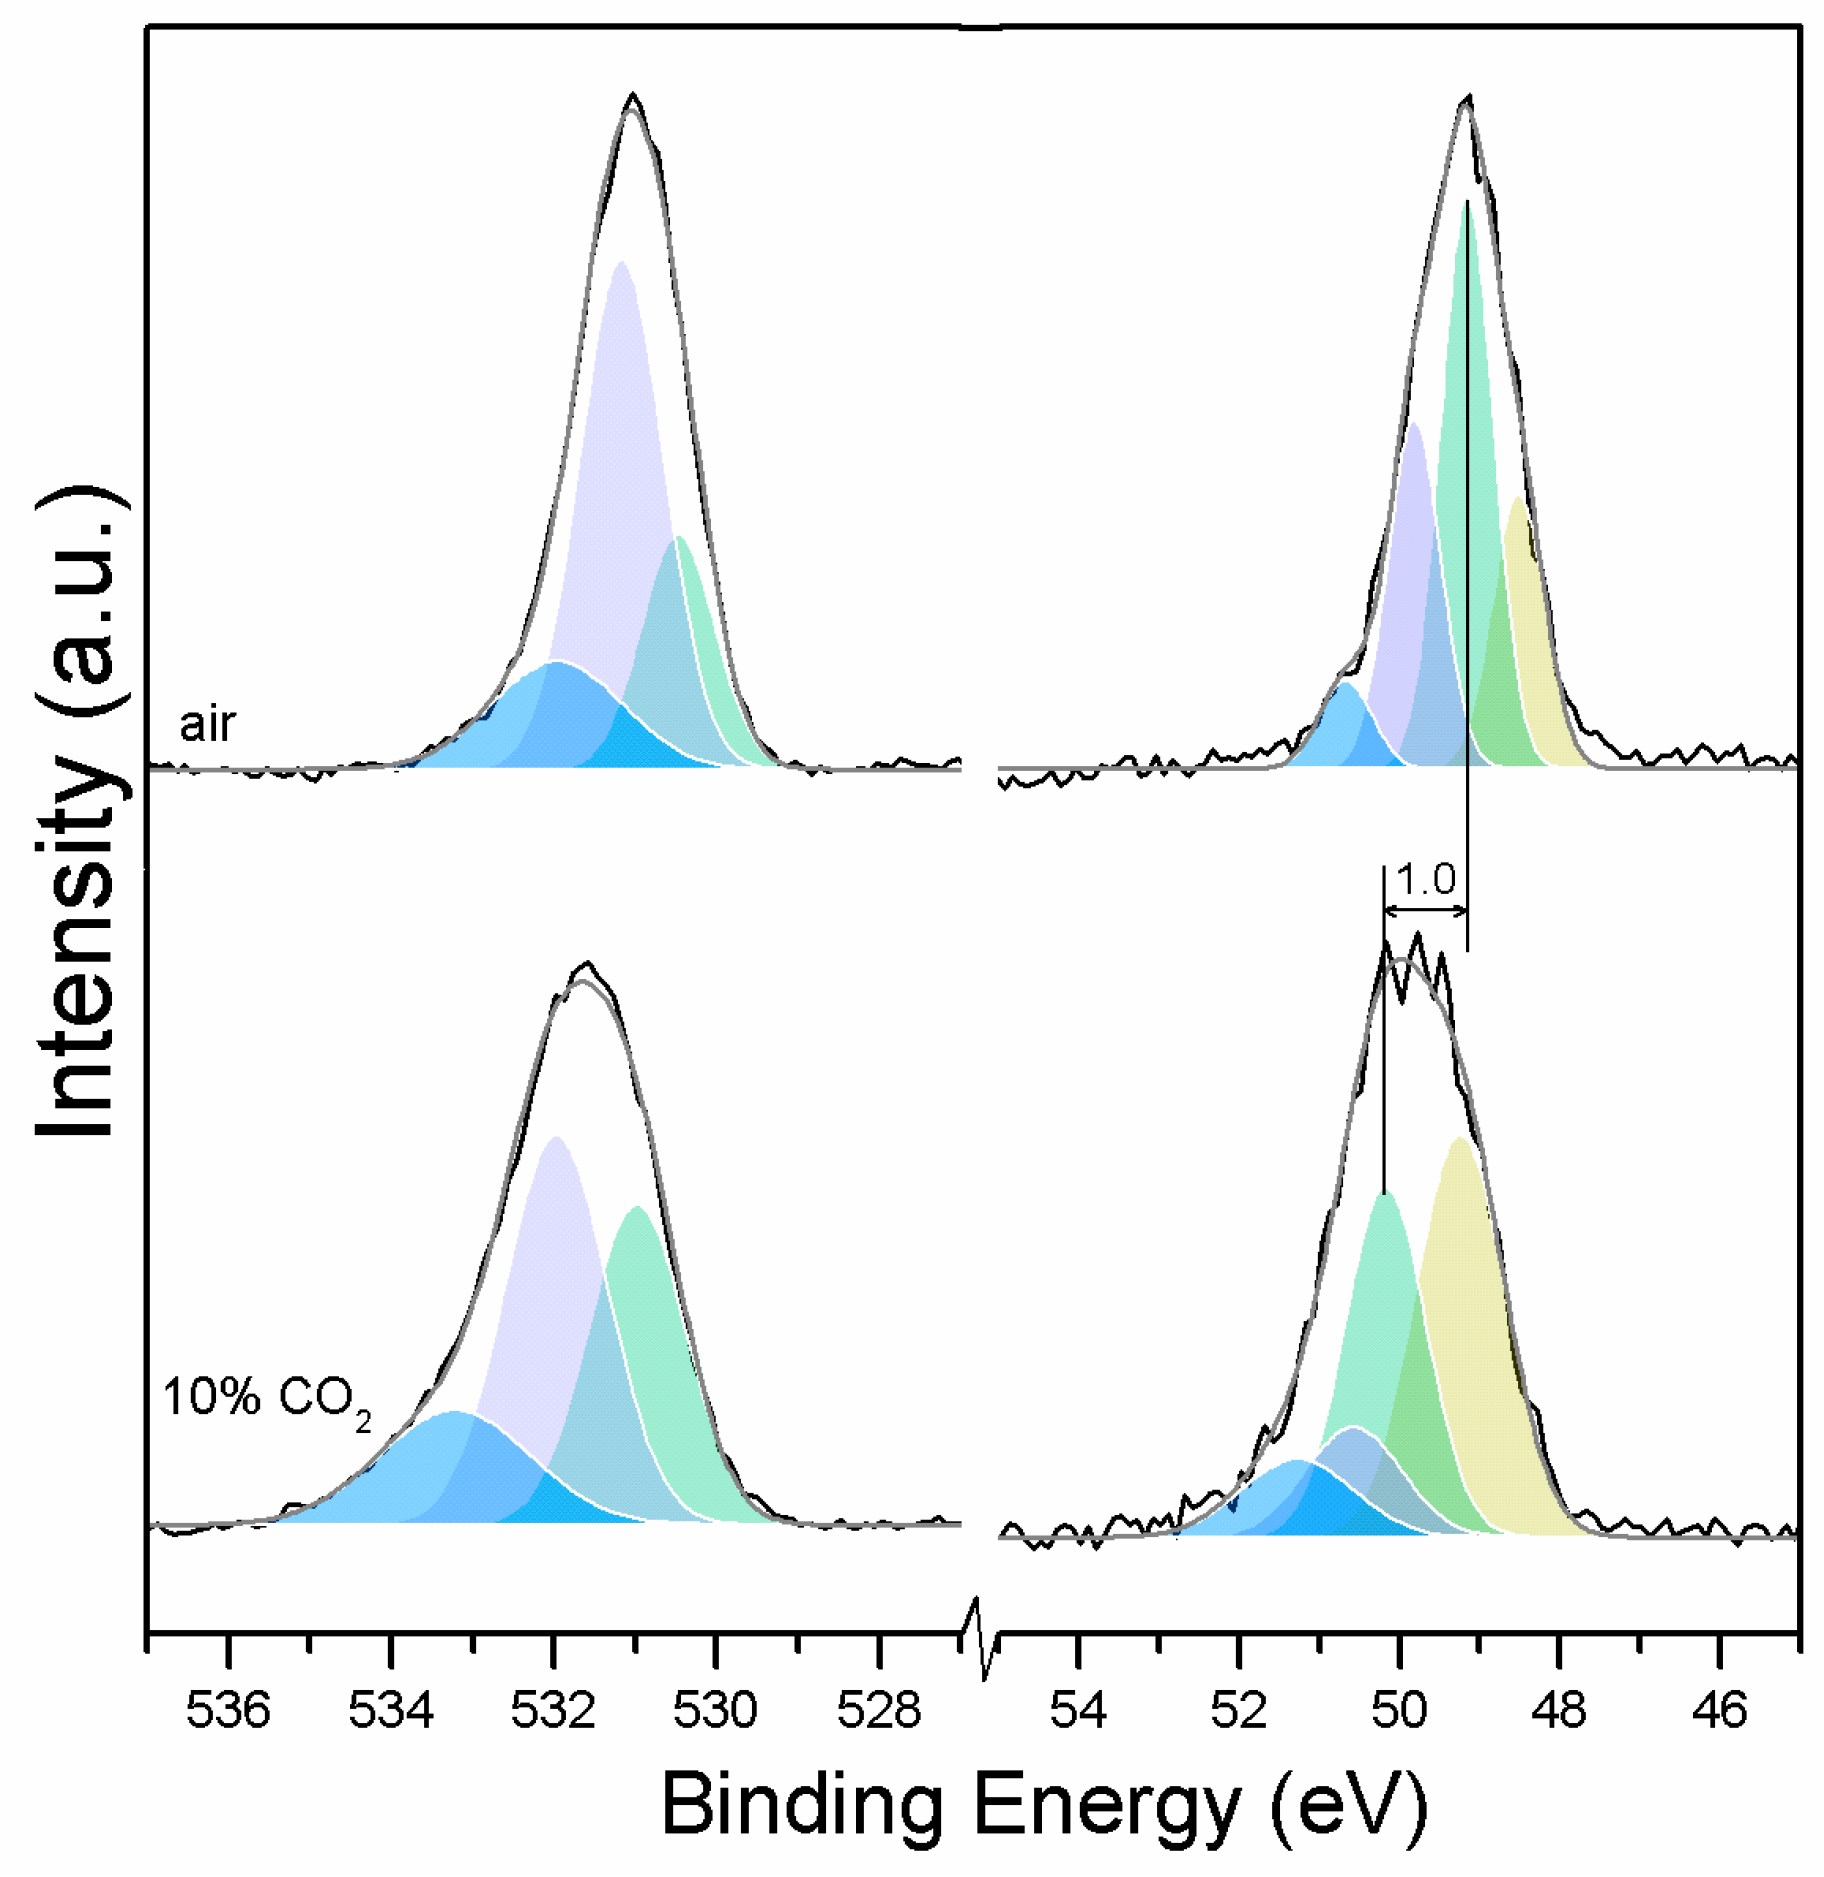
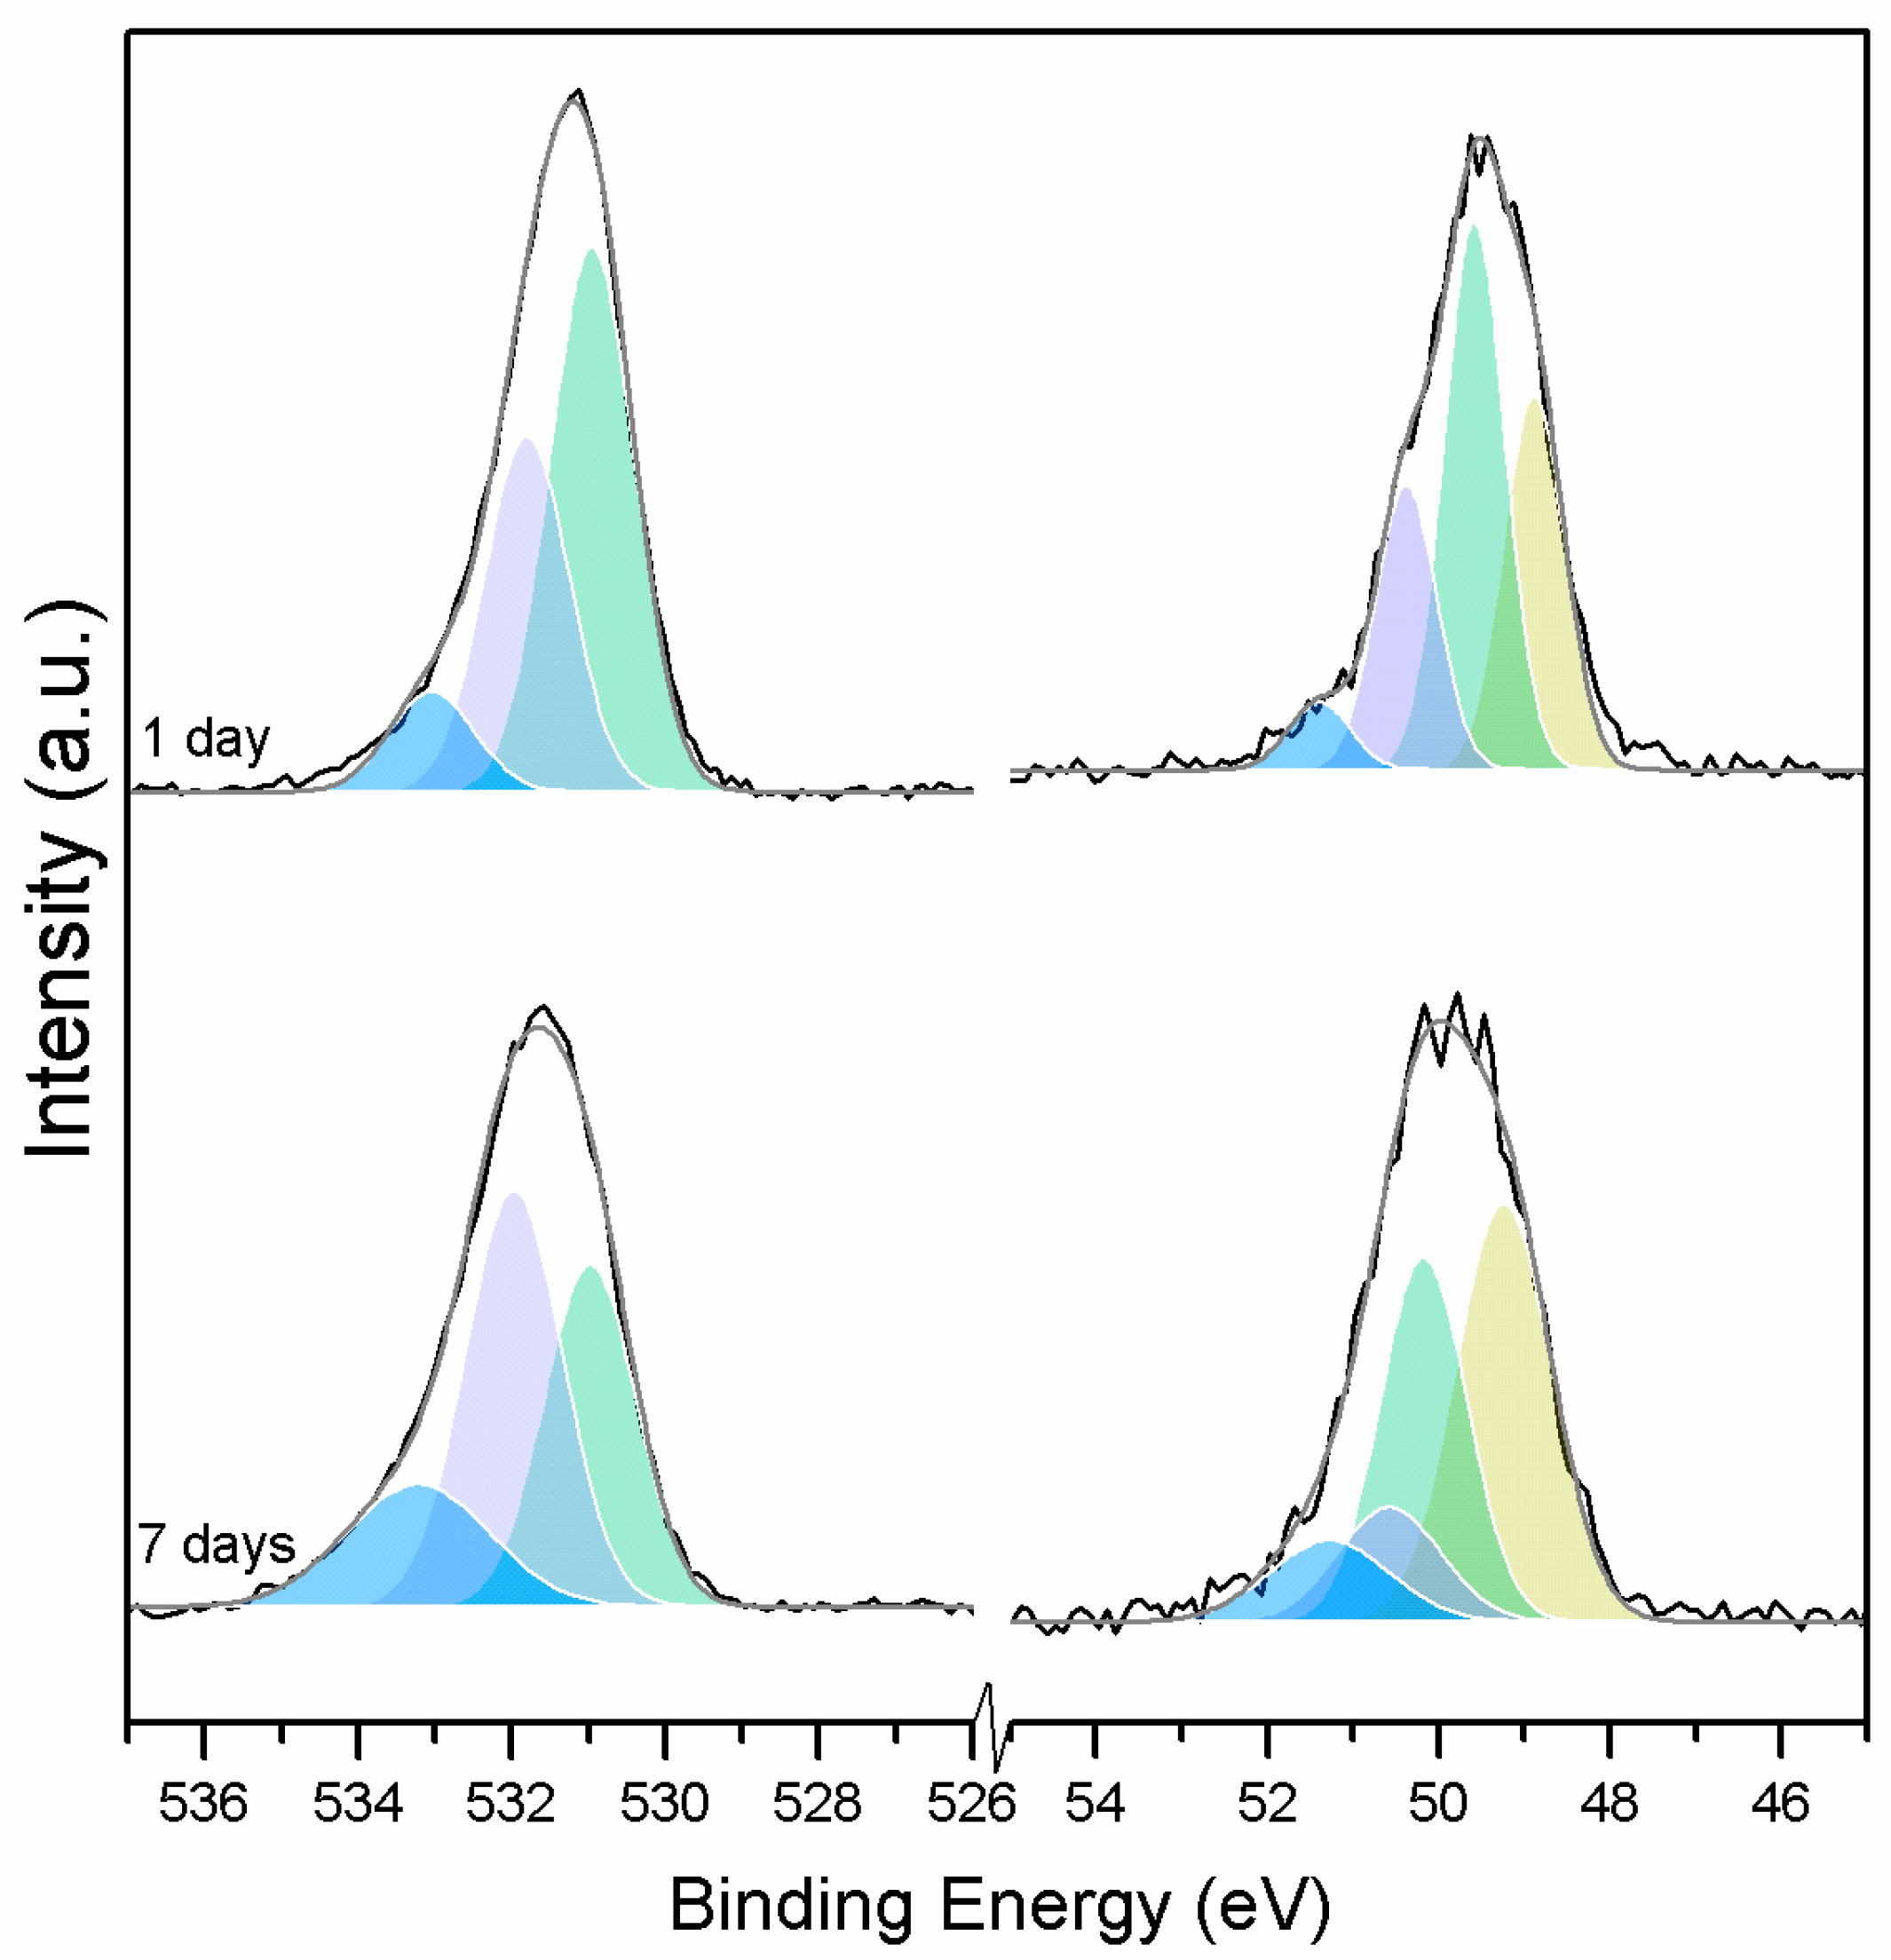
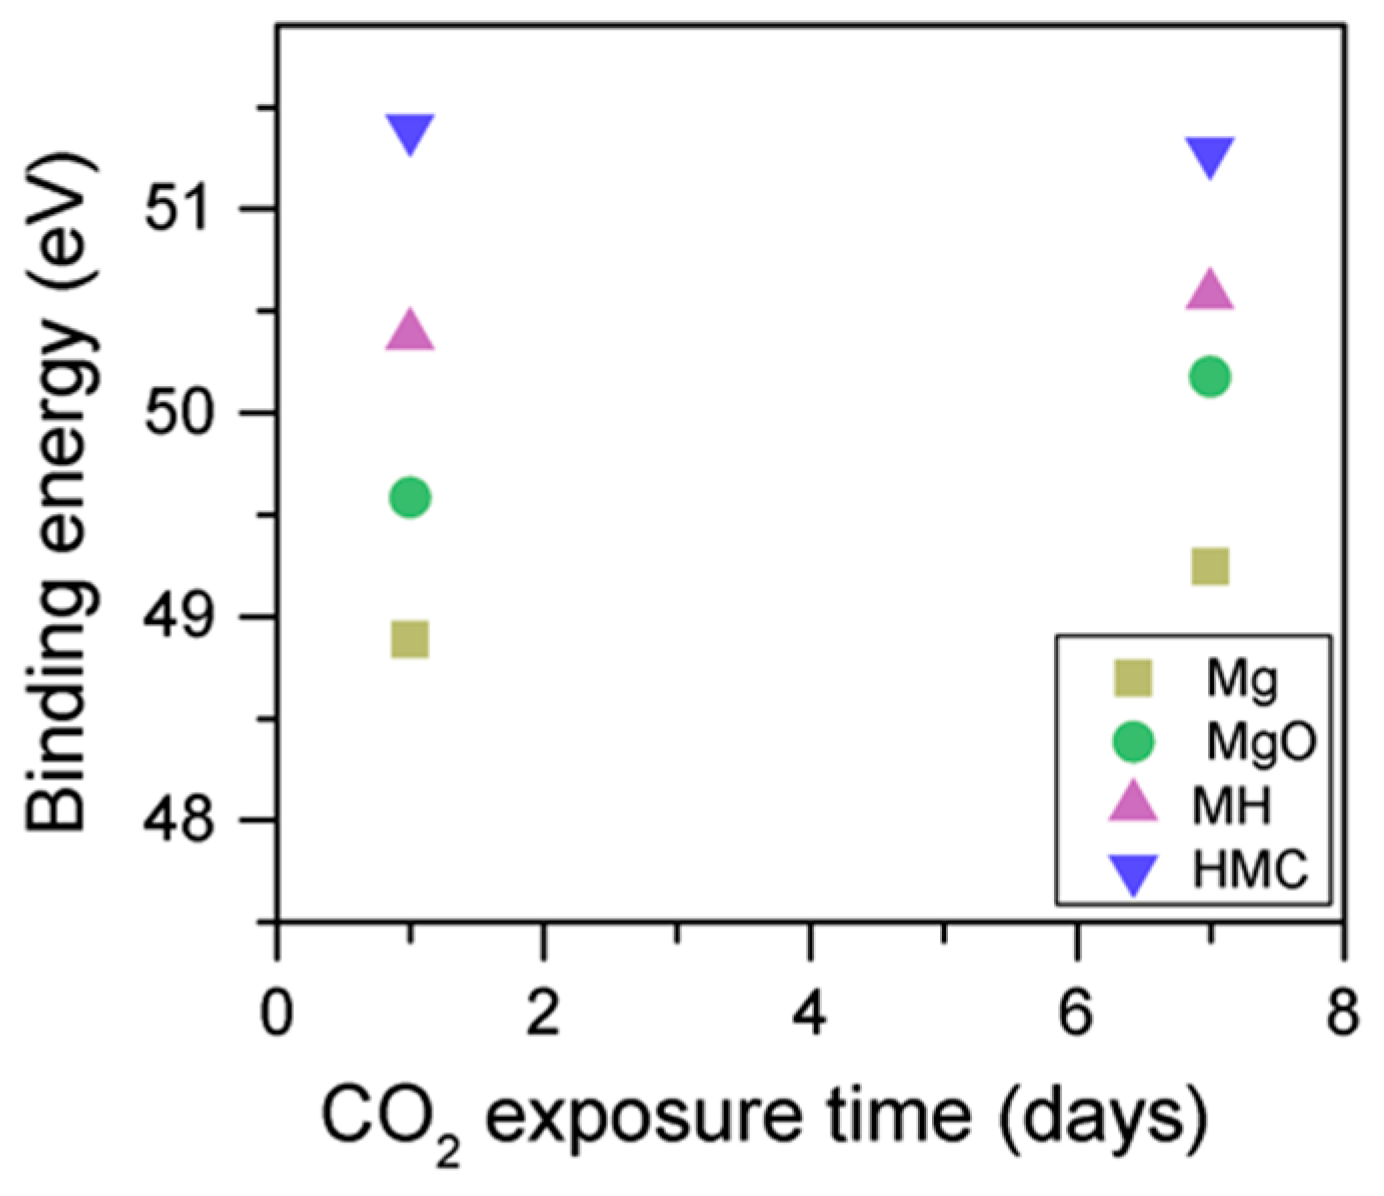
3.2. Effect of Exposure to Air or CO2
Clear differences are observed between a sample of MgO cement with a w/c ratio of 0.55 exposed for seven days to either air or CO
2. Firstly, and most importantly, only a very small Mg2p peak at high energies, related to carbonates, is present for the sample not exposed to CO
2 (
Figure 6 and
Figure 7). This confirms that there is minimal formation of magnesium carbonate hydrates when the sample is not exposed to a high concentration of CO
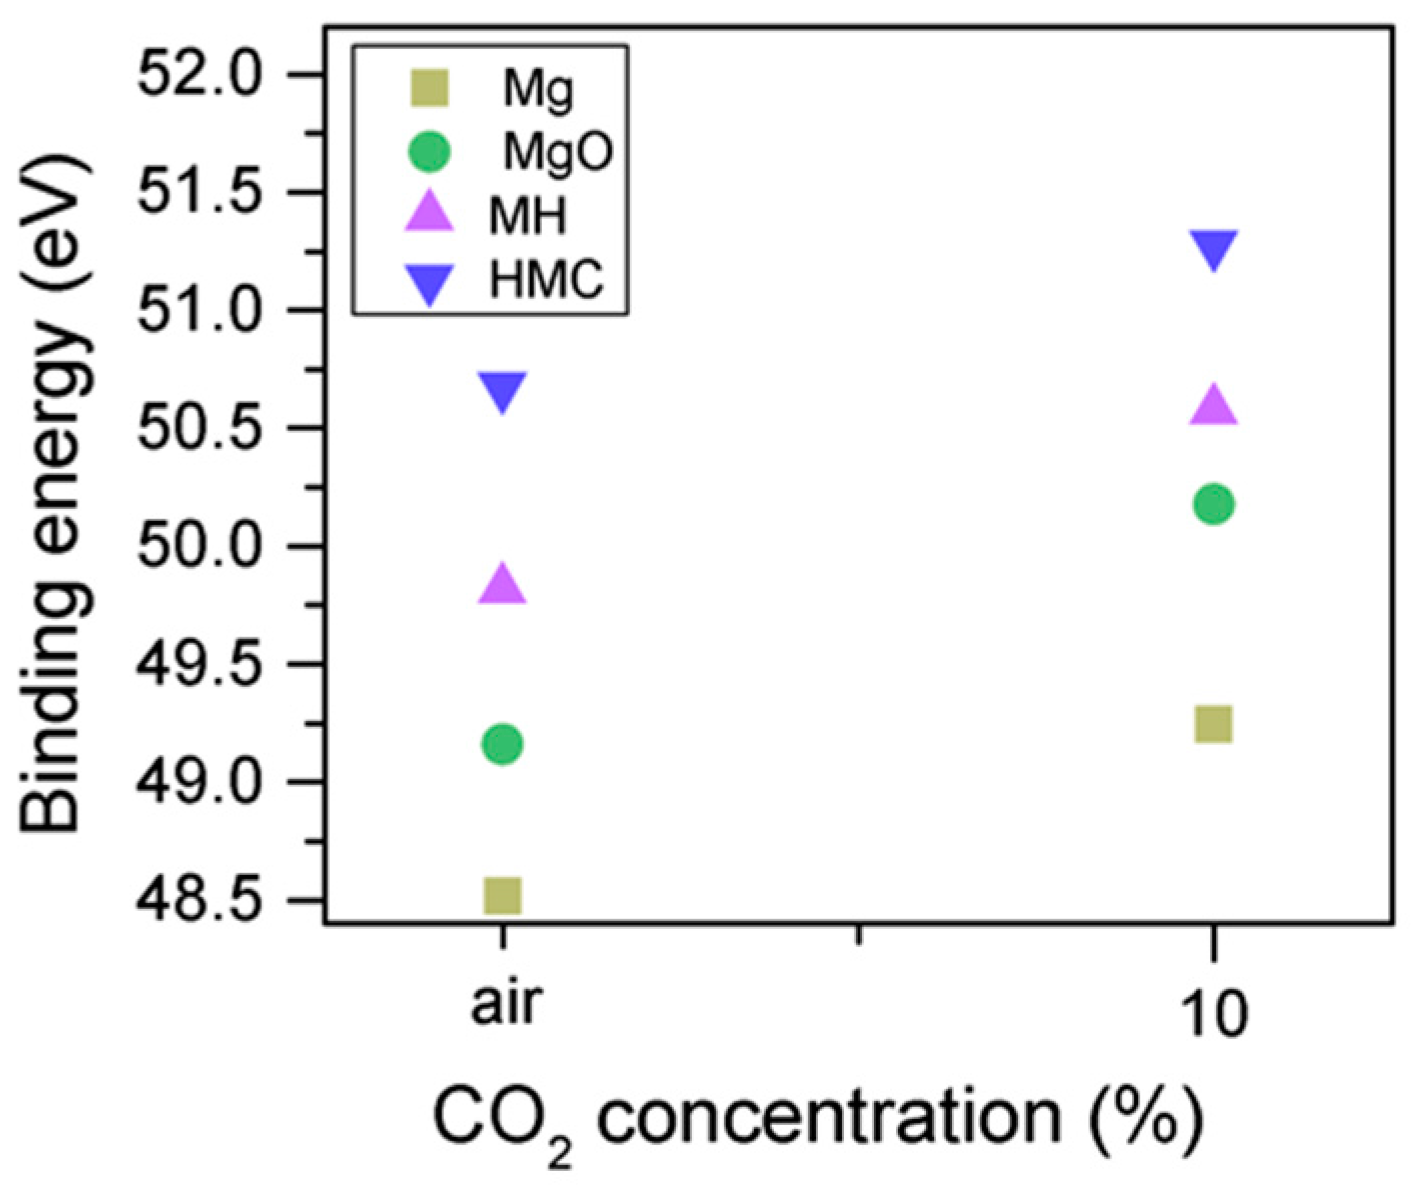
2 in such early ages, even at the surface. Secondly, the binding energies increase for all the Mg2p peaks as the exposure time increases. This is related to the formation of hydrated and carbonated species. The peak at a lower energy, which is related to metallic Mg, has its BE increased by 0.7 eV, while the initial BE for the MgO peak rises by 1.0 eV (the arrow in
Figure 7), approaching the energies of Mg(OH)
2, and clearly showing the reaction with water, which leads to the formation of hydrated species. Finally, the initial BE for Mg(OH)
2 is increased by 0.8 eV in the direction of the BE of the carbonated species (
Figure 7).
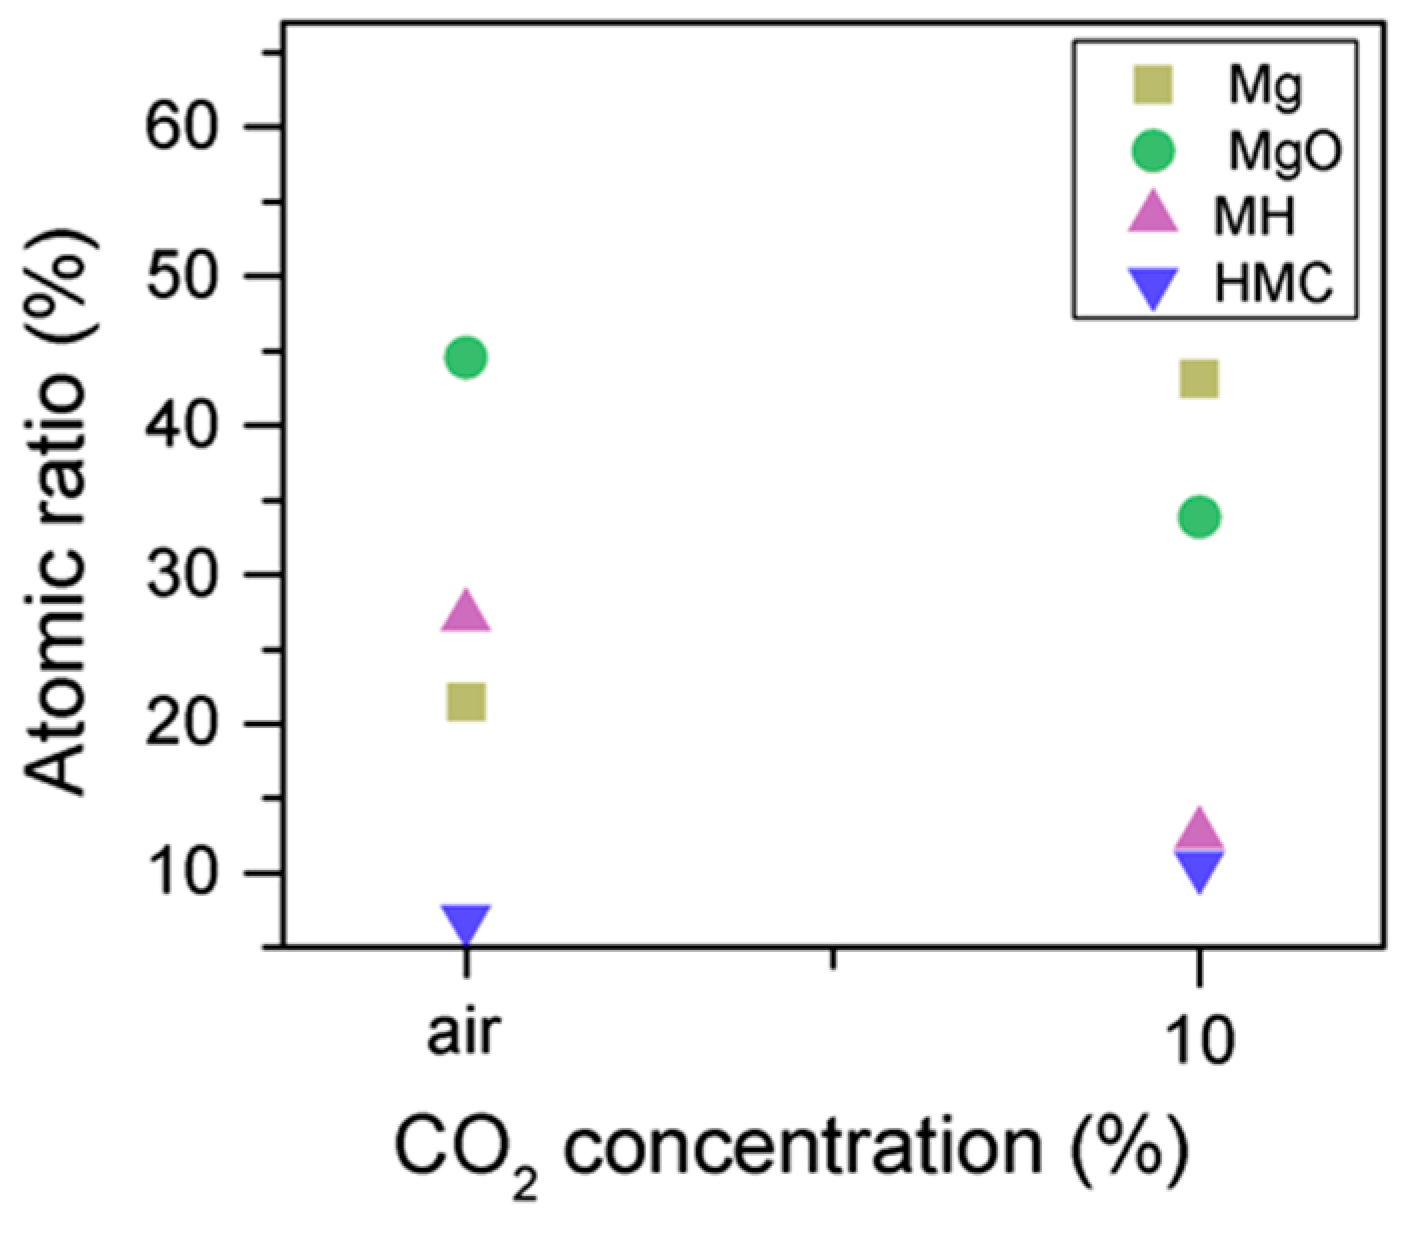
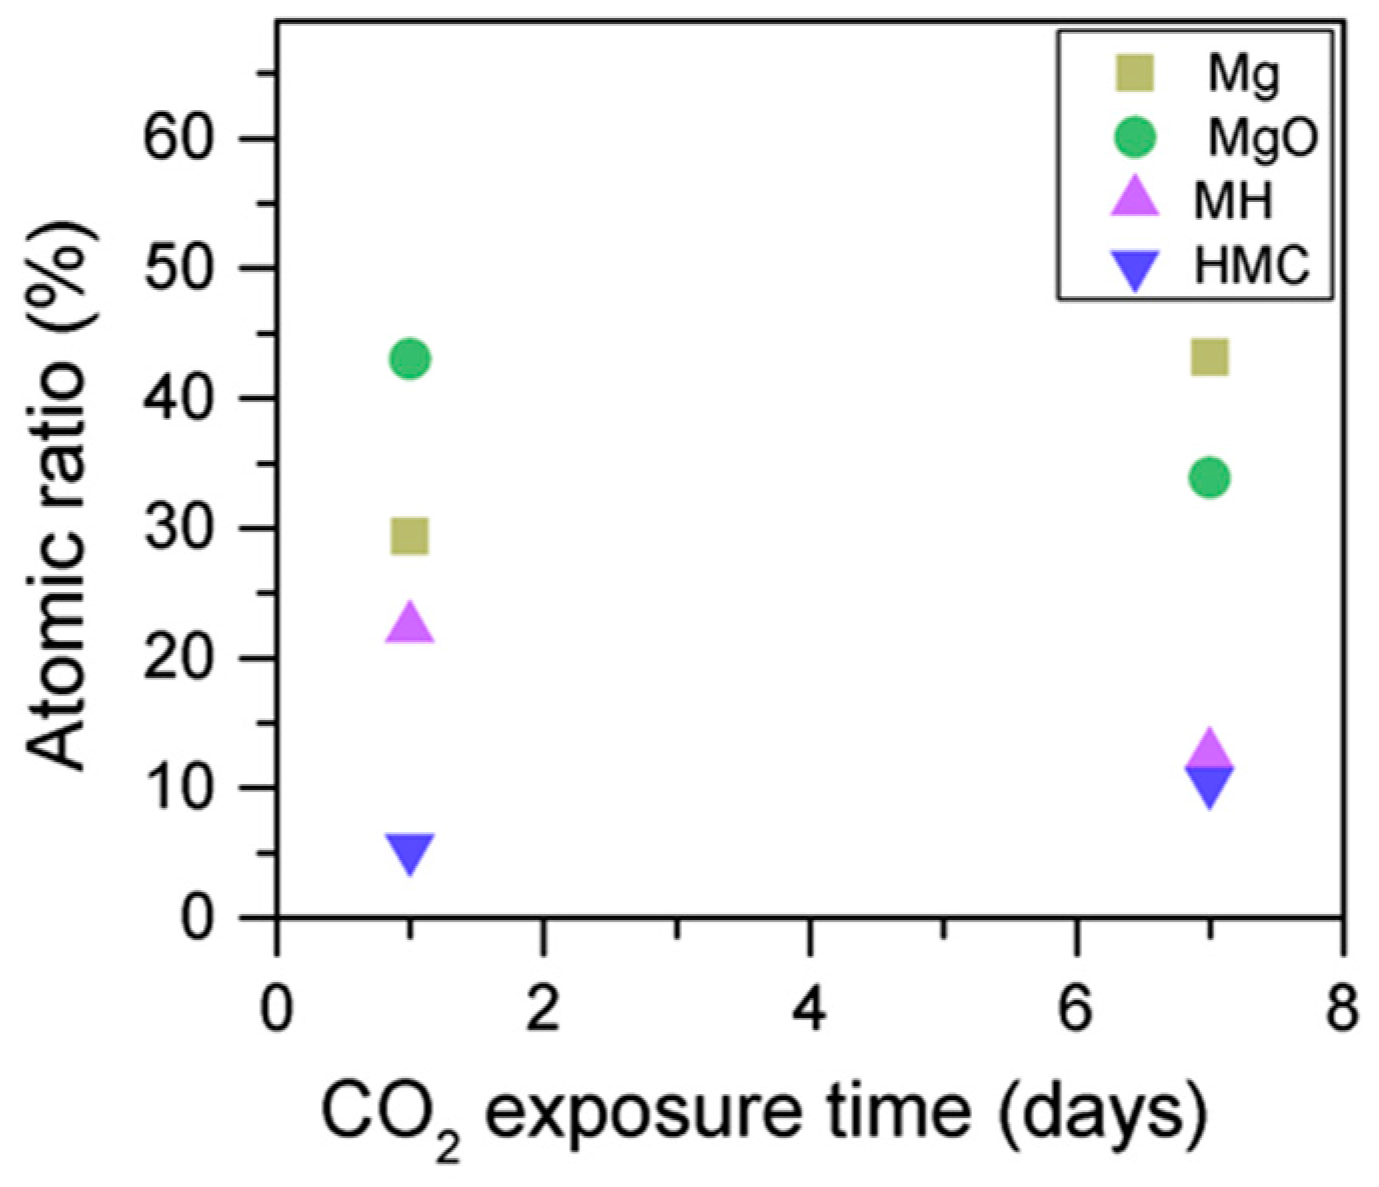
Similarly, the FWHM for all Mg peaks increases upon the exposure to CO
2 (
Figure 6,
Table 5). However, even though the concentration of magnesium in MgO and Mg(OH)
2 seems to decrease when the sample is exposed to CO
2, the metallic Mg peak concentration seem to increase along with the increase in the concentration of carbonates (
Figure 8). This may be due to differences between the samples or even different scanning locations in the sample, where there may be higher concentrations of pure Mg from the precursor.
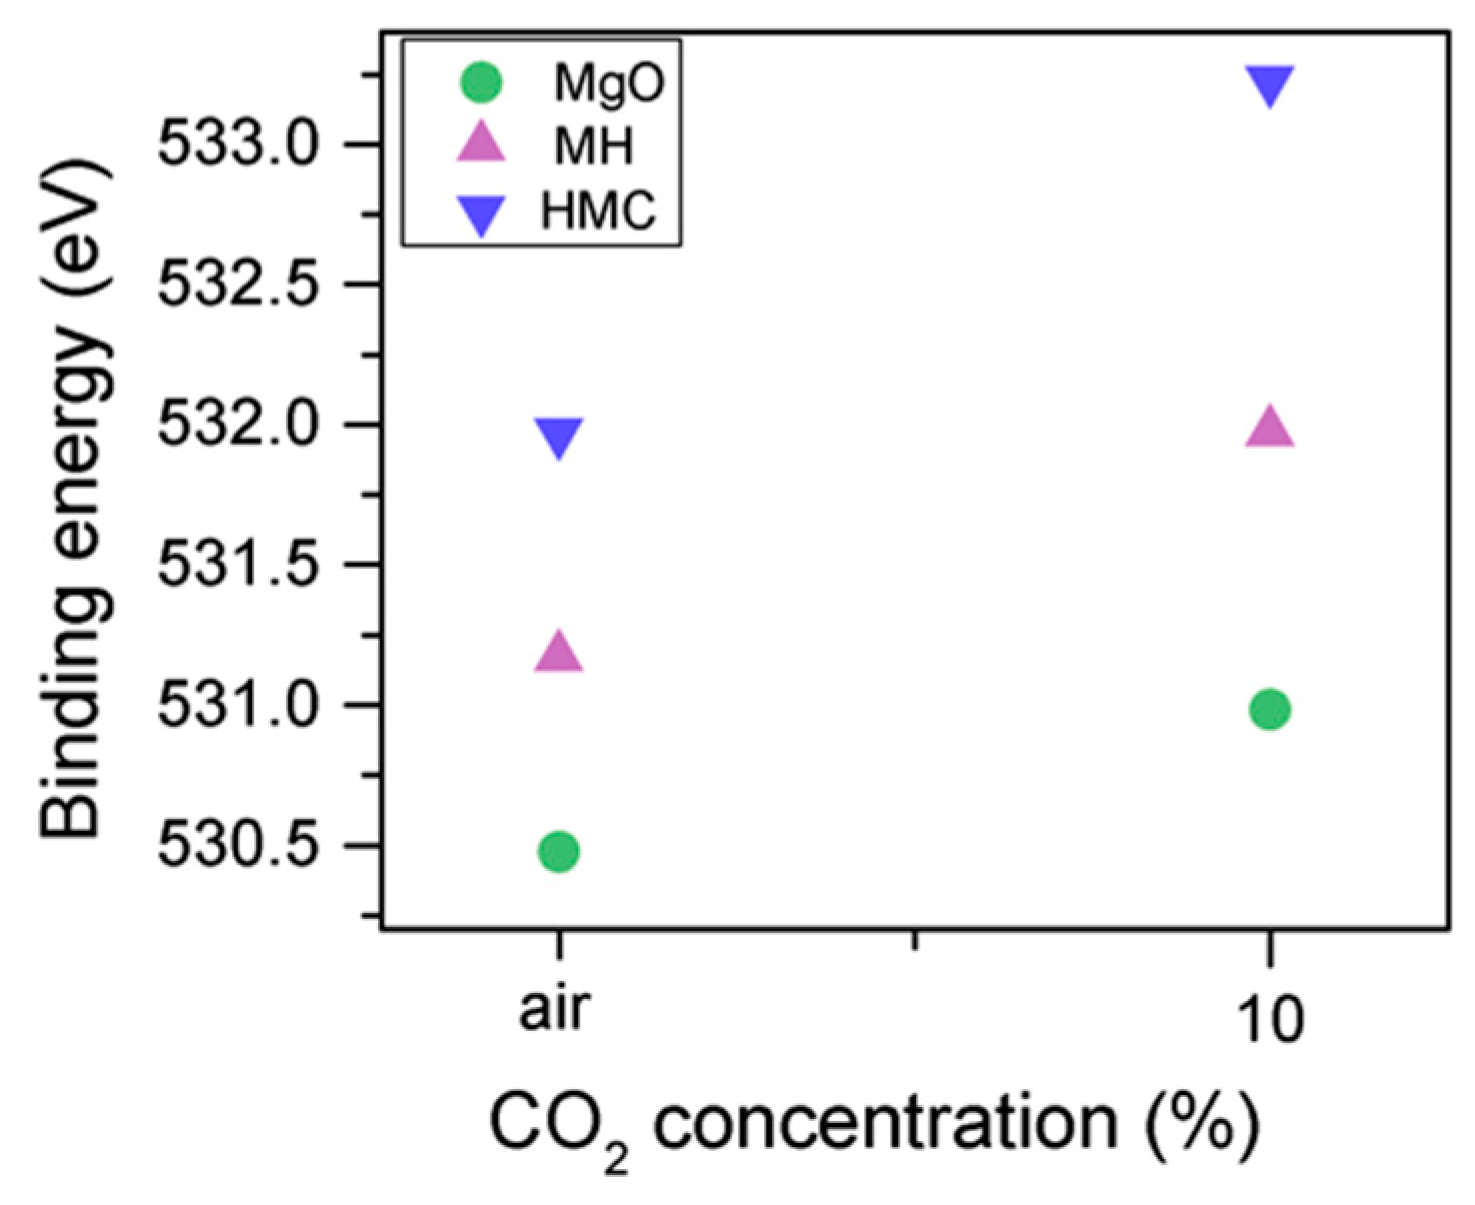
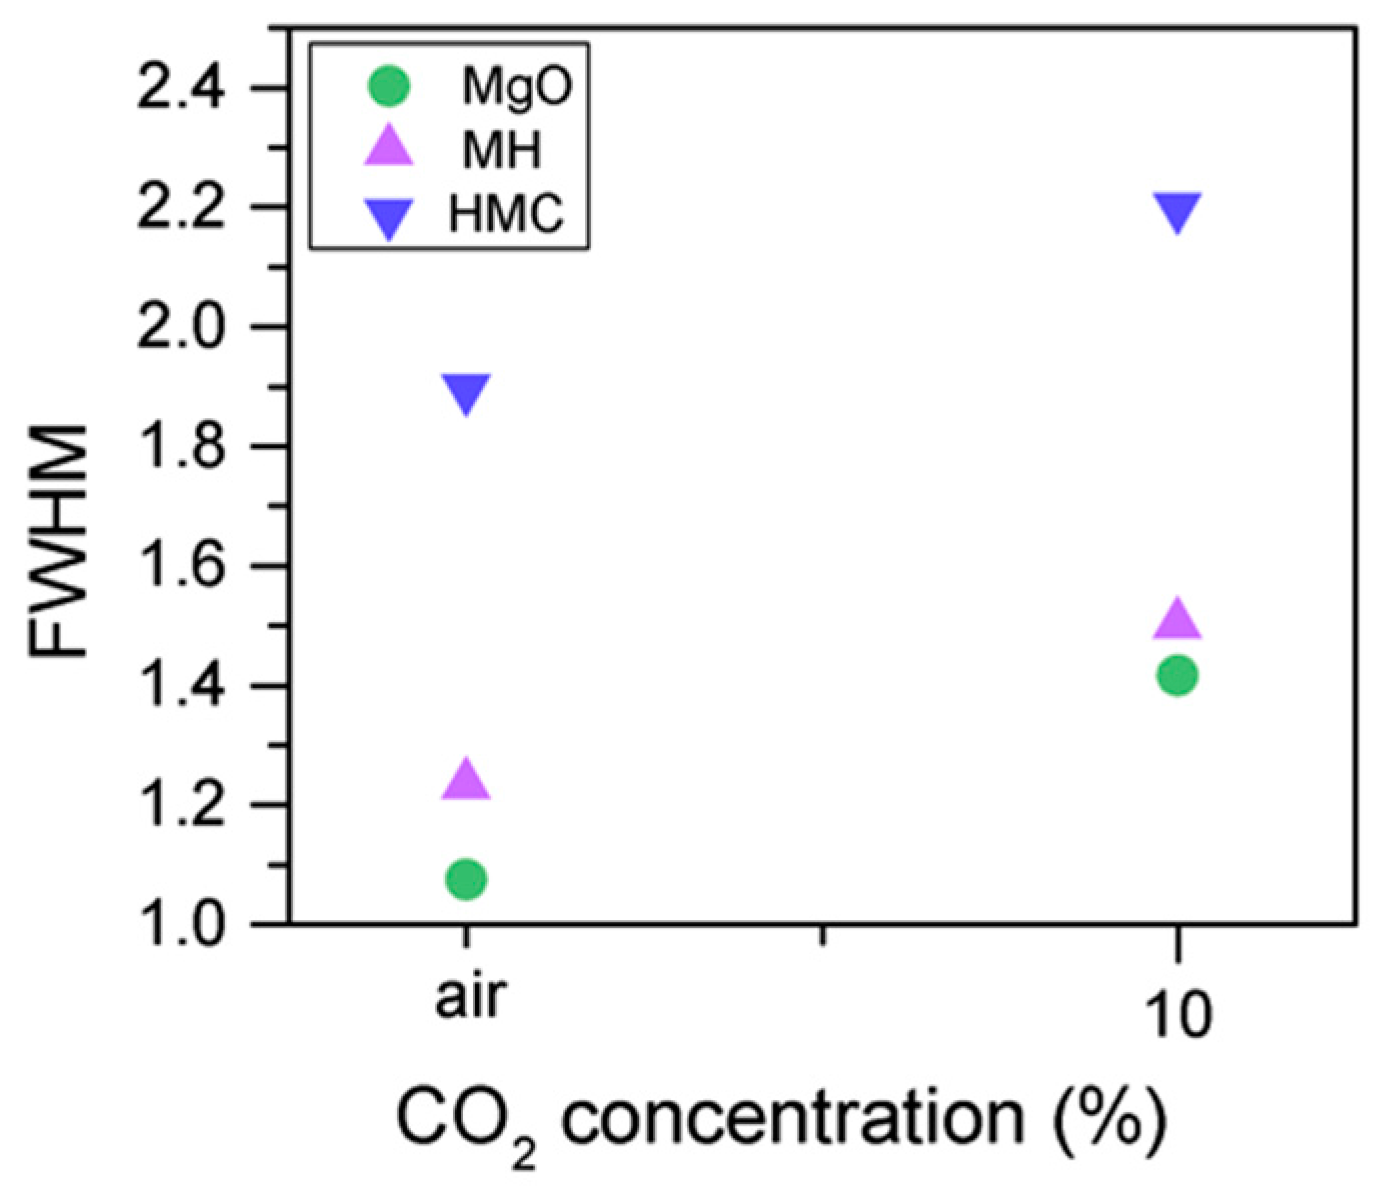
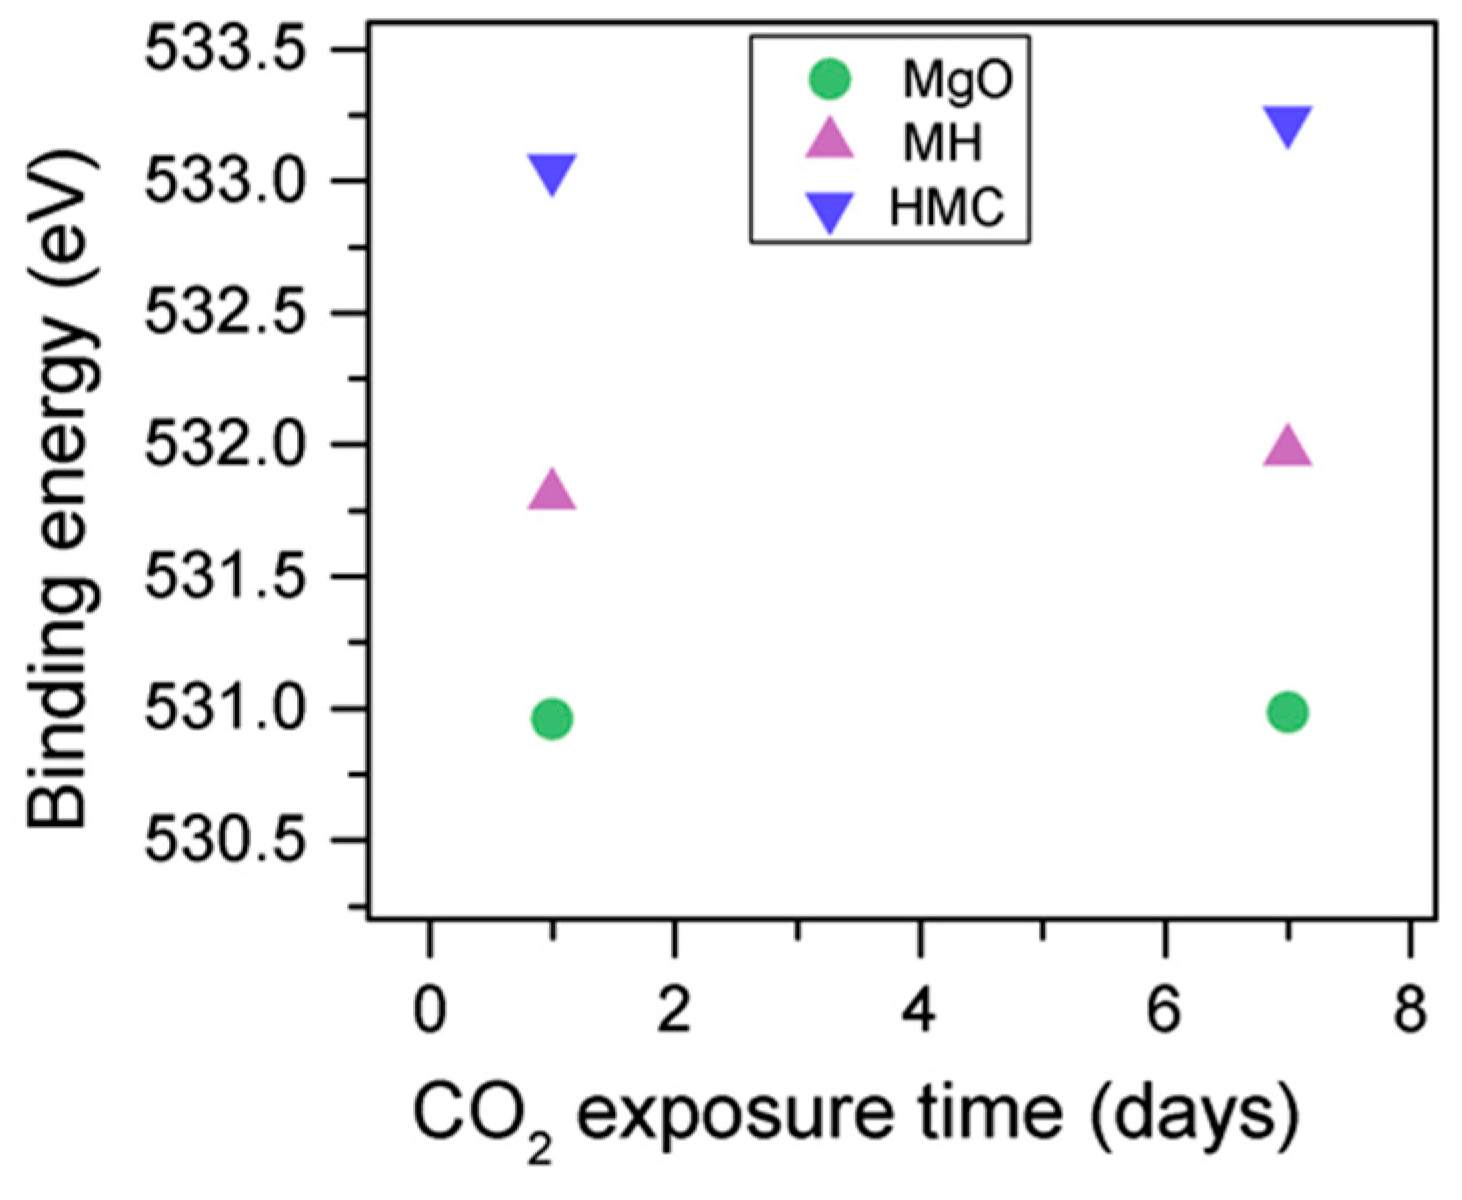
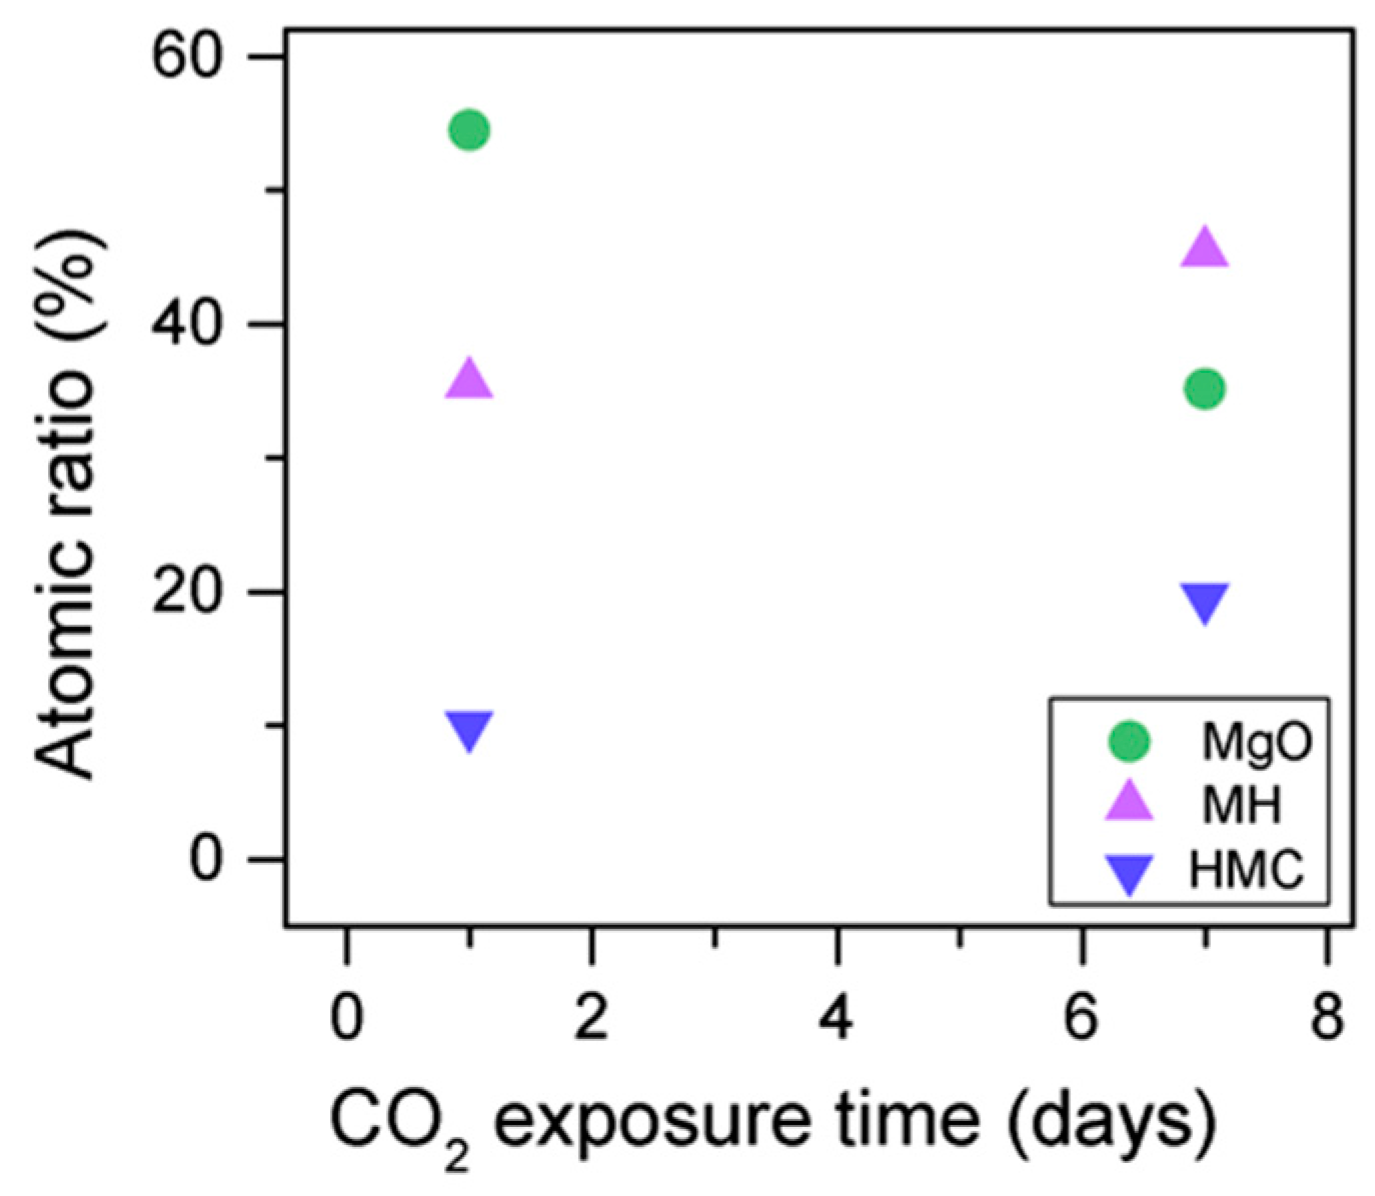
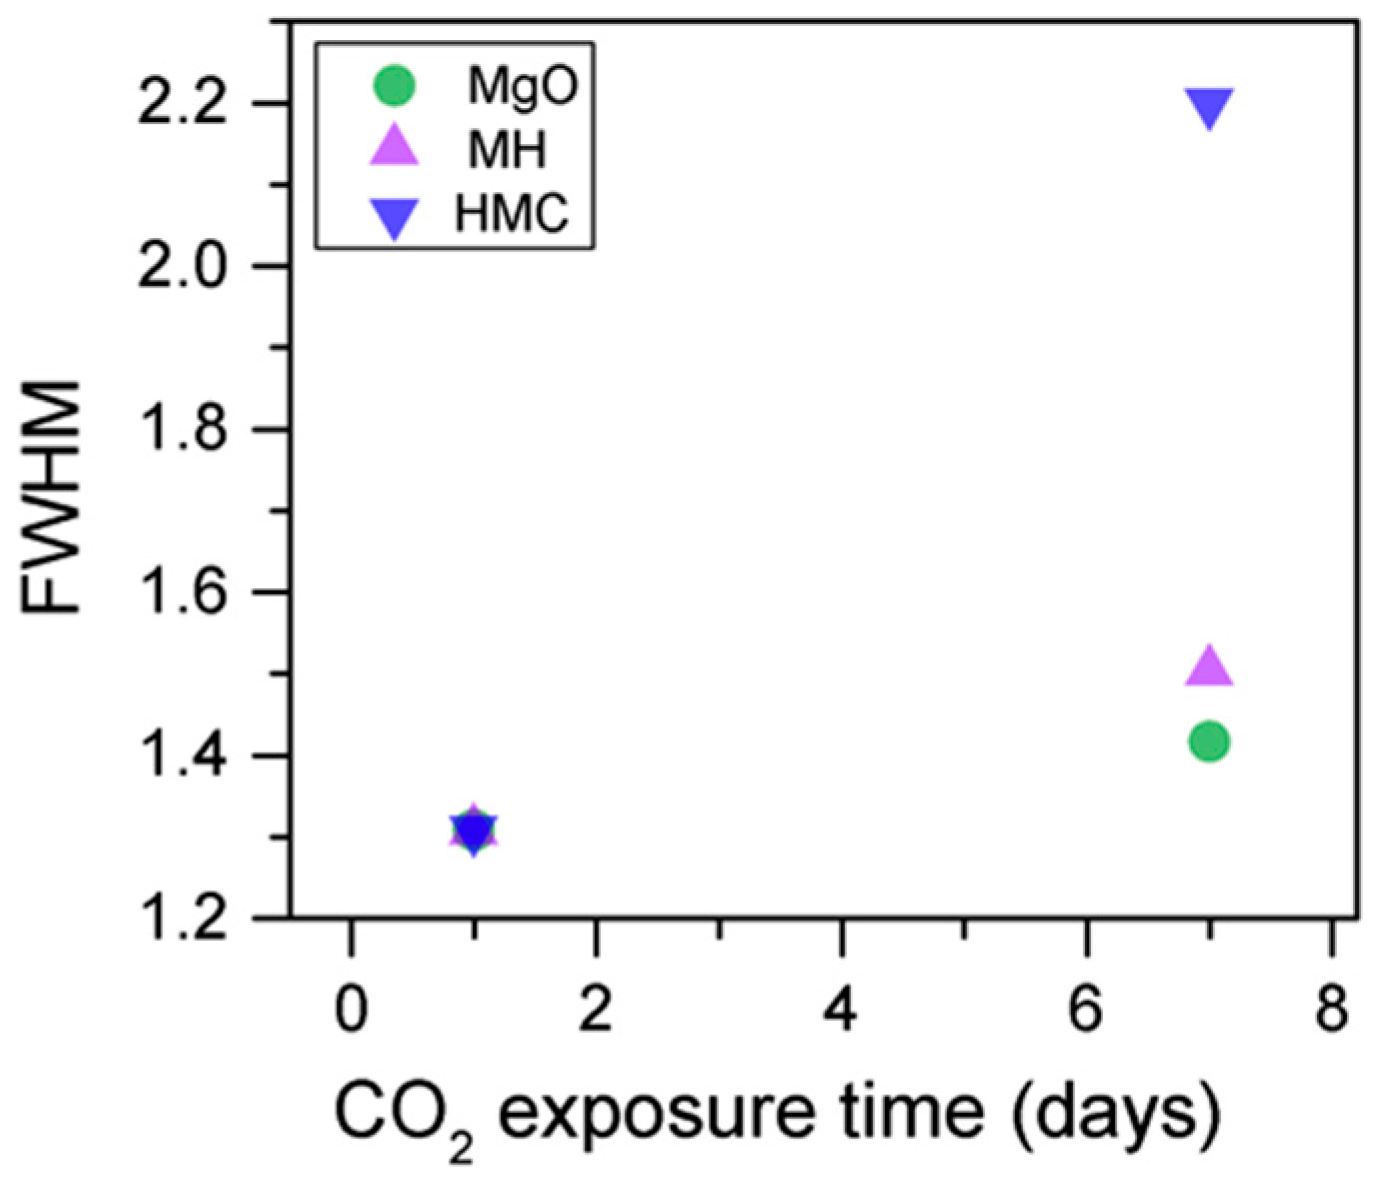
The C1s peak (not presented here) indicates differences when the sample is exposed to CO
2 instead of air: an increase of the BE by 0.8 eV is observed (from 289.0 to 289.8 eV), which is accompanied with a decrease of the FWHM by 0.8 eV. On the other hand, the O1s peaks shift by 0.2 eV to higher BEs, which also indicates the formation of magnesium carbonates; the magnesium hydrates peak shifts from 531.8 to 532.0 eV (
Figure 9), while the concentration of carbonates increases significantly (
Table 5), with a large increase in the FWHM of the carbonated species (
Figure 10).


