
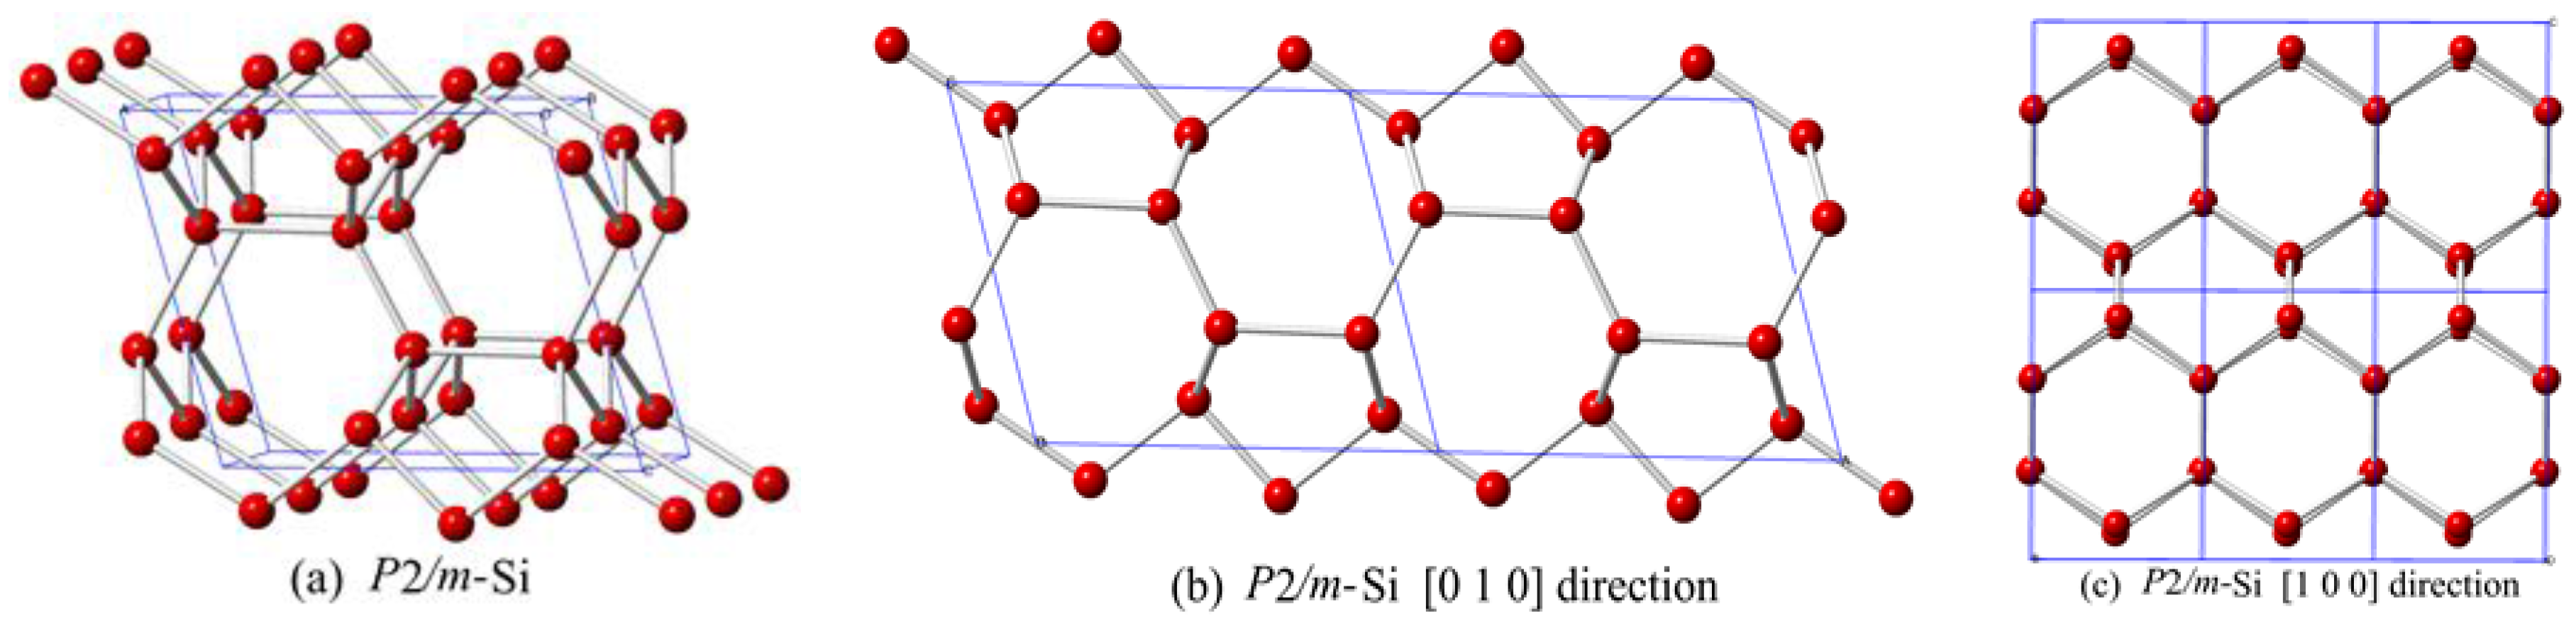
A Novel Silicon Allotrope in the Monoclinic Phase


Abstract
:1. Introduction
2. Calculations Methods
3. Results and Discussion
4. Conclusions
Acknowledgments
Author Contributions
Conflicts of Interest
References
- Hao, X.P.; Cui, H.L. Electronic, elastic properties and hardness of the novel tetragonal silicon. J. Korean Phys. Soc. 2014, 65, 45–51. [Google Scholar] [CrossRef]
- Lee, I.H.; Lee, Y.J.; Oh, S.; Kim, K.J. Computational search for direct band gap silicon crystals. Phys. Rev. B 2014, 90, 115209. [Google Scholar] [CrossRef]
- Wu, F.; Dai, J.; Kan, E.J.; Li, Z.Y. Density functional predictions of new silicon allotropes: Electronic properties and potential applications to Li-battery anode materials. Solid State Commun. 2011, 151, 1228–1230. [Google Scholar] [CrossRef]
- Wang, Q.Q.; Xu, B.; Sun, J.; Liu, H.Y.; Zhao, Z.S.; Yu, D.L.; Fan, C.Z.; He, J.L. Direct band gap silicon allotropes. J. Am. Chem. Soc. 2014, 136, 9826–9829. [Google Scholar] [CrossRef] [PubMed]
- Fan, Q.Y.; Chai, C.C.; We, Q.; Yang, Y.T.; Chen, P.Y.; Xing, M.J.; Zhang, J.Q.; Yao, R.H. Prediction of novel phase of silicon and Si-Ge alloys. J. Solid State Chem. 2015, 233, 471–483. [Google Scholar] [CrossRef]
- Bateman, T.B.; Mcskimin, H.J.; Whelan, J.M. Elastic moduli of single crystal gallium arsenide. J. Appl. Phys. 1959, 30, 544–545. [Google Scholar] [CrossRef]
- Zhang, X.X.; Wang, Y.C.; Lv, J.; Zhu, C.Y.; Li, Q.; Zhang, M.; Ma, Y.M. First-principles structural design of superhard materials. J. Chem. Phys. 2013, 138, 114101. [Google Scholar] [CrossRef] [PubMed]
- Matt, L.; Joshua, G. Semiconductor nanowires and nanotubes. Annu. Rev. Mater. Res. 2004, 34, 83–122. [Google Scholar]
- Amsler, M.; Botti, S.; Marques, M.A.L.; Lenosky, T.J.; Goedecker, S. Low-density silicon allotropes for photovoltaic applications. Phys. Rev. B 2015, 92, 014101. [Google Scholar] [CrossRef]
- Fan, Q.Y.; Chai, C.C.; We, Q.; Yan, H.Y.; Zhao, Y.B.; Yang, Y.T.; Yu, X.H.; Liu, Y.; Xing, M.J.; Zhang, J.Q.; Yao, R.H. Novel silicon allotropes: Stability, mechanical, and electronic properties. J. Appl. Phys. 2015, 118, 4870–4876. [Google Scholar] [CrossRef]
- Wei, Q.; Zhang, Q.; Yan, H.Y.; Zhang, M.G. A new superhard carbon allotrope: Tetragonal C64. J. Mater. Sci. 2016, 52, 2385–2391. [Google Scholar] [CrossRef]
- Du, Y.; Zhuang, J.C.; Liu, H.; Xu, X.; Eilers, S.; Wu, K.; Cheng, P.; Zhao, J.; Pi, X.; See, K.; et al. Tuning the band gap in silicene by oxidation. ACS Nano 2014, 8, 10019. [Google Scholar] [CrossRef] [PubMed]
- Feng, B.; Ding, Z.; Meng, S.; Yao, Y.; He, X.; Cheng, P.; Chen, L.; Wu, K.H. Evidence of silicene in honeycomb structures of silicon on Ag (111). Nano Lett. 2012, 12, 3507–3511. [Google Scholar] [CrossRef] [PubMed]
- Du, Y.; Zhuang, J.C.; Wang, J.O.; Li, Z.; Liu, H.S.; Zhao, J.J.; Xu, X.; Feng, H.F.; Chen, L.; Wu, K.H.; et al. Quasi-freestanding epitaxial silicene on Ag (111) by oxygen intercalation. Sci. Adv. 2016, 2, e1600067. [Google Scholar] [CrossRef] [PubMed]
- Oh, Y.J.; Lee, I.H.; Kim, S.; Lee, J.; Chang, K.J. Dipole-allowed direct band gap silicon superlattices. Sci. Rep. 2015, 5, 18086. [Google Scholar] [CrossRef] [PubMed]
- Lee, I.H.; Oh, Y.J.; Kim, S.; Lee, J.; Chang, K.J. Ab initio, materials design using conformational space annealing and its application to searching for direct band gap silicon crystals. Comput. Phys. Commun. 2016, 203, 110–121. [Google Scholar] [CrossRef]
- Kim, D.Y.; Stefanoski, S.; Kurakevych, O.O.; Strobel, T.A. Synthesis of an open-framework allotrope of silicon. Nat. Mater. 2015, 14, 169–173. [Google Scholar] [CrossRef] [PubMed]
- Guo, Y.G.; Wang, Q.; Kawazoe, Y.; Jena, P. A new silicon allotrope with a direct band gap for optoelectronic applications. APS Meet. 2015, 5, 14342. [Google Scholar]
- Niu, H.; Chen, X.Q.; Wang, S.; Li, D.; Mao, W.L.; Li, Y. Families of superhard crystalline carbon allotropes constructed via cold compression of graphite and nanotubes. Phys. Rev. Lett. 2012, 108, 135501. [Google Scholar] [CrossRef] [PubMed]
- Botti, S.; Floreslivas, J.A.; Amsler, M.; Goedecker, S.; Marques, M.A.L. Low-energy silicon allotropes with strong absorption in the visible for photovoltaic applications. Phys. Rev. B 2012, 86, 7035–7040. [Google Scholar] [CrossRef]
- Hohenberg, P.; Kohn, W. Inhomogeneous electron gas. Phys. Rev. 1964, 136, B864. [Google Scholar] [CrossRef]
- Kohn, W.; Sham, L.J.P.R. The self-consistent field for molecular and solids. Phys. Rev. 1965, 140, A1133. [Google Scholar] [CrossRef]
- Clark, S.J.; Segall, M.D.; Pickard, C.J.; Hasnip, P.J.; Probert, M.I.J.; Refson, K.; Payne, M.C.; Krist, Z. First principles methods using CASTEP: Zeitschrift für Kristallographie-Crystalline materials. Z. Kristallogr. 2005, 220, 567. [Google Scholar] [CrossRef]
- Pfrommer, B.G.; Louie, S.G.; Cohen, M.L. Ab initio study of silicon in the R8 phase. Phys. Rev. B 1997, 56, 6662–6668. [Google Scholar] [CrossRef]
- Perdew, J.P.; Burke, K.; Ernzerhof, M. Generalized gradient approximation made simple. Phys. Rev. Lett. 1996, 77, 3865–3868. [Google Scholar] [CrossRef] [PubMed]
- Ceperley, D.M.; Alder, B.J. Ground state of the electron gas by a stochastic method. Phys. Rev. Lett. 1980, 45, 566–569. [Google Scholar] [CrossRef]
- Perdew, J.P.; Zunger, A. Self-interaction correction to density-functional approximations for many-electron systems. Phys. Rev. B 1981, 23, 5048–5079. [Google Scholar] [CrossRef]
- Baroni, S.; De Gironcoli, S.; Dal Corso, A.; Giannozzi, P. Phonons and related crystal properties from density-functional perturbation theory. Rev. Mod. Phys. 2001, 73, 515–562. [Google Scholar] [CrossRef]
- Hall, J.J. Electronic effects in the elastic constants of n-type silicon. Phys. Rev. 1967, 161, 756–761. [Google Scholar] [CrossRef]
- Shishkin, M.; Kresse, G. Self-consistent GW calculations for semiconductors and insulators. Phys. Rev. B 2007, 75, 235102. [Google Scholar] [CrossRef]
- Tan, L.; Chai, C.C.; Fan, Q.Y.; Yang, Y.T. Mechanical and electronic properties of C–Si alloys in the P2221 structure. Chin. J. Phys. 2016, 54, 700–710. [Google Scholar] [CrossRef]
- Wu, Z.J.; Zhao, E.J.; Xiang, H.P.; Hao, X.F.; Liu, X.J.; Meng, J. Crystal structures and elastic properties of superhard IrN2 and IrN3: From first principles. Phys. Rev. B 2007, 76, 054115. [Google Scholar] [CrossRef]
- Wortman, J.J.; Evans, R.A. Young’s modulus, shear modulus, and poisson’s ratio in silicon and germanium. J. Appl. Phys. 1965, 36, 153–156. [Google Scholar] [CrossRef]
- Zhang, Y.H.; Chai, C.C.; Fan, Q.Y.; Yang, Y.T. Mechanical and electronic properties of Si, Ge alloy in Cmmm, structure. Chin. J. Phys. 2016, 54, 298–307. [Google Scholar] [CrossRef]
- He, C.Y.; Zhang, C.X.; Li, J.; Peng, X.Y.; Meng, L.J.; Tang, C.; Zhong, J.X. Direct and quasi-direct band gap silicon allotropes with remarkable stability. Phys. Chem. Chem. Phys. 2016, 18, 9682–9686. [Google Scholar] [CrossRef] [PubMed]
- Fan, Q.Y.; Chai, C.C.; Wei, Q.; Zhou, P.K.; Zhang, J.Q.; Yang, Y.T. Si96: A new silicon allotrope with interesting physical properties. Materials 2016, 9, 284. [Google Scholar] [CrossRef]
- Pugh, S.F. Relations between the elastic moduli and the plastic properties of polycrystalline pure metals. Philos. Mag. 1954, 45, 823–843. [Google Scholar] [CrossRef]
- Fan, Q.Y.; Wei, Q.; Yan, H.Y.; Zhang, M.G.; Zhang, J.Q. A new potential superhard phase of OsN2. Acta Phys. Pol. A 2014, 126, 740–747. [Google Scholar] [CrossRef]
- Hill, R. The elastic behaviour of a crystalline aggregate. Proc. Phys. Soc. Lond. 1952, 65, 349–354. [Google Scholar] [CrossRef]
- Fan, Q.Y.; Wei, Q.; Yan, H.Y.; Zhang, M.G.; Zhang, Z.X.; Zhang, J.Q.; Zhang, D.Y. Elastic and electronic properties of pbca-bn: First-principles calculations. Comp. Mater. Sci. 2014, 85, 80–87. [Google Scholar] [CrossRef]
- Damay, F.; Poienar, M.; Hervieu, M. High-pressure polymorph of LuFe2O4, with room-temperature antiferromagnetic order. Phys. Rev. B 2015, 91, 214111. [Google Scholar] [CrossRef]
- Connétable, D.; Thomas, O. First-principles study of the structural, electronic, vibrational, and elastic properties of orthorhombic nisi. Phys Rev. B 2009, 79, 094101. [Google Scholar] [CrossRef]
- Heyd, J.; Scuseria, G.E.; Ernzerhof, M. Hybrid functionals based on a screened Coulomb potential. J. Chem. Phys. 2003, 118, 8207–8215. [Google Scholar] [CrossRef]
- Heyd, J.; Scuseria, G.E.; Ernzerhof, M. Hybrid functionals based on a screened Coulomb potential. J. Chem. Phys. 2006, 118, 8207–8215. [Google Scholar] [CrossRef]
- Krukau, A.V.; Vydrov, O.A.; Izmaylov, A.F.; Scuseria, G.E. Influence of the exchange screening parameter on the performance of screened hybrid functional. J. Chem. Phys. 2007, 125, 224106. [Google Scholar] [CrossRef] [PubMed]
- Monemar, B. III-V nitrides—Important future electronic materials. J. Mater. Sci. 1999, 10, 227–254. [Google Scholar]
- Szmyd, D.M.; Porro, P.; Majerfeld, A.; Lagomarsino, S. Heavily doped GaAs:Se. I. Photoluminescence determination of the electron effective mass. J. Appl. Phys. 1990, 68, 2367–2375. [Google Scholar] [CrossRef]
- Burstein, E.; Picus, G.S.; Wallis, R.F.; Blatt, F. Zeeman-type magneto-optical studies of interband transitions in semiconductors. Phys. Rev. 1959, 113, 15–33. [Google Scholar] [CrossRef]
- Basile, G.; Bergamin, A.; Cavagenro, G.; Mana, E.; Vittone, G.; Zosi. Measurement of the silicon (220) lattice spacing. Phys. Rev. Lett. 1994, 72, 3133–3136. [Google Scholar] [CrossRef] [PubMed]


| Method | PBE | PBEsol | CA-PZ | |||||||||
|---|---|---|---|---|---|---|---|---|---|---|---|---|
| Space Group | a | b | c | β | a | b | c | β | a | b | c | β |
| P2/m | 7.253 | 3.868 | 6.294 | 105.9 | 7.243 | 3.861 | 6.283 | 105.8 | 7.136 | 3.802 | 6.187 | 105.8 |
| P2221 | 5.429 | 13.112 | 5.265 | - | 5.334 | 12.98 | 5.211 | - | 5.349 | 12.758 | 5.264 | - |
| P2221 c | 5.448 | 13.017 | 5.339 | - | 5.445 | 12.995 | 5.327 | - | 5.364 | 12.803 | 5.248 | - |
| P2221 | 7.495 | 5.359 | 5.410 | - | 7.477 | 5.432 | 5.316 | - | 7.345 | 5.379 | 5.258 | - |
| P2221 f | 7.487 | 5.450 | 5.221 | - | 7.487 | 5.446 | 5.206 | - | 7.365 | 5.373 | 5.123 | - |
| Fd-3m | a = 5.426, 5.402 a, 5.429 e, 5.465 b, 5.431 d | a = 5.466 | a = 5.374, 5.392 a | |||||||||
| S.G. | Method | C11 | C22 | C33 | C44 | C55 | C66 | C12 | C13 | C15 | C23 | C25 | C35 | C46 | B | G | B/G | E | v |
|---|---|---|---|---|---|---|---|---|---|---|---|---|---|---|---|---|---|---|---|
| P2/m | GGA | 159 | 167 | 150 | 63 | 55 | 40 | 29 | 42 | −1 | 51 | 9 | 2 | 8 | 80 | 54 | 1.48 | 132 | 0.22 |
| LDA | 171 | 176 | 160 | 61 | 57 | 40 | 35 | 50 | 0 | 58 | 10 | 3 | 8 | 88 | 54 | 1.63 | 134 | 0.25 | |
| C2/m-16 a | GGA | 146 | 146 | 164 | 48 | 53 | 53 | 51 | 47 | - | 43 | - | - | - | 82 | 51 | 1.61 | 127 | 0.24 |
| C2/m-20 a | GGA | 184 | 167 | 143 | 55 | 52 | 52 | 36 | 46 | - | 46 | - | - | - | 83 | 55 | 1.51 | 135 | 0.23 |
| I-4 a | GGA | 142 | 142 | 145 | 57 | 47 | 55 | 48 | 50 | - | 50 | - | - | - | 80 | 48 | 1.68 | 120 | 0.25 |
| Amm2 a | GGA | 161 | 179 | 131 | 44 | 44 | 51 | 37 | 42 | - | 38 | - | - | - | 78 | 51 | 1.54 | 126 | 0.23 |
| Fd-3m | GGA | 154 | - | - | 79 | - | - | 56 | - | - | - | - | - | - | 88 | 64 | 1.38 | 155 | 0.21 |
| - | LDA | 163 | - | - | 80 | - | - | 58 | - | - | - | - | - | - | 93 | 68 | 1.37 | 164 | 0.21 |
| - | Exp. b | 166 | - | - | 80 | - | - | 64 | - | - | - | - | - | - | 102 | - | - | - | - |
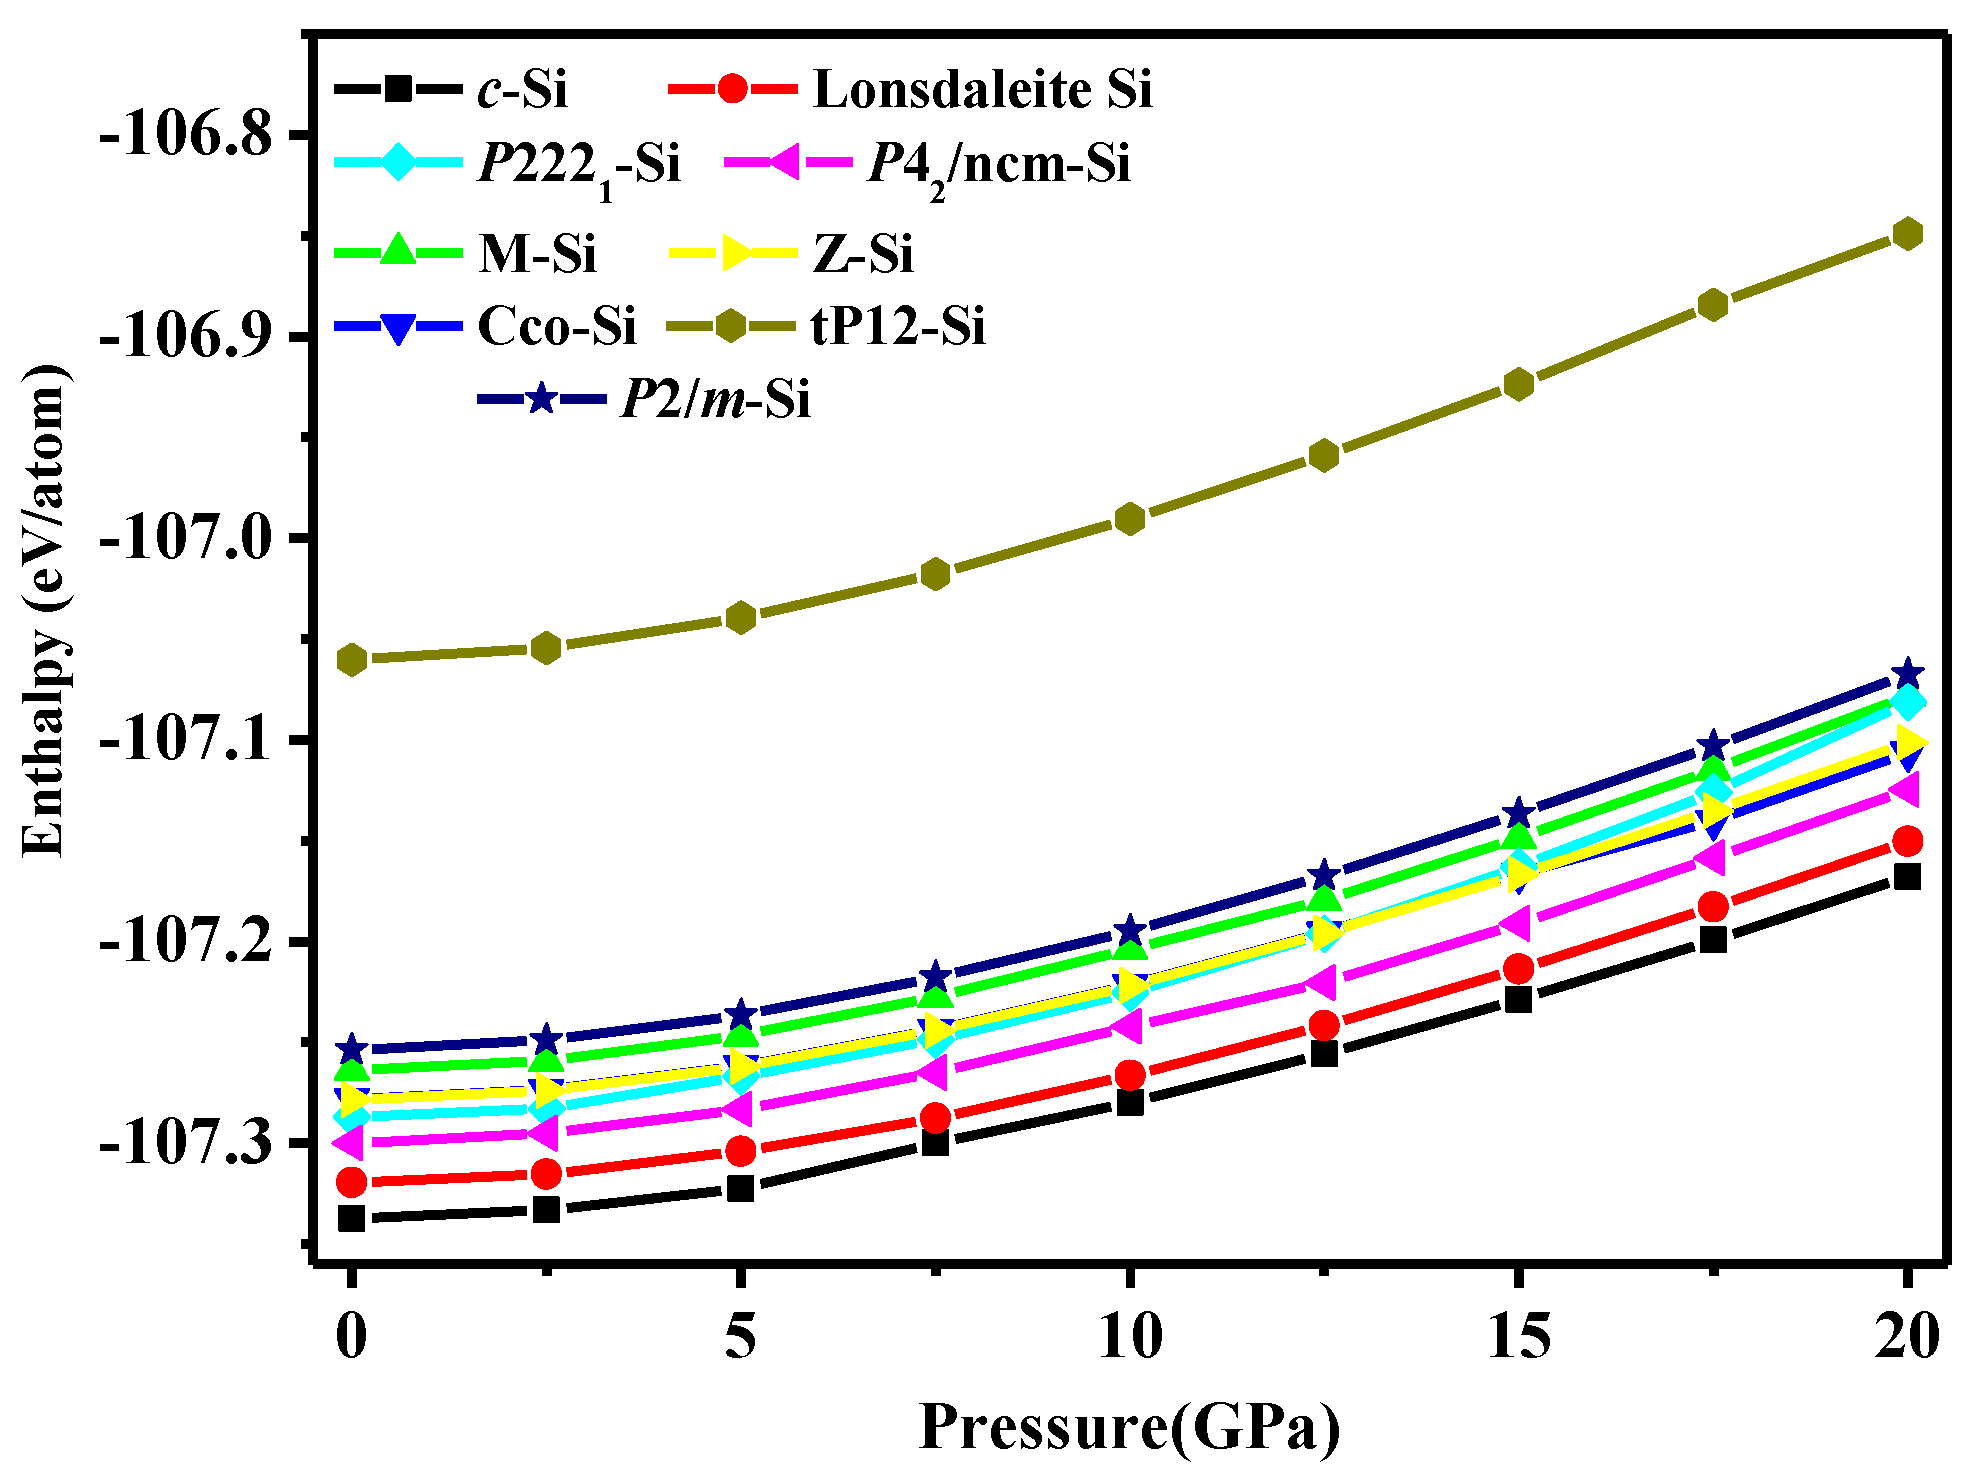
| Diamond Si a | Lonsdaleite a | M a | Cco a | P2221 a | P42/ncm a | Z a | tP12 a | P2/m | P21/m b |
| 0.00 | 0.02 | 0.08 | 0.06 | 0.05 | 0.04 | 0.06 | 0.28 | 0.09 | 0.02 |
| Imma b | Pbam b | Pmmn b | Cmcm b | P-1 c | P21/c c | C2/m-16 a | C2/m-20 a | I-4 a | Amm2 a |
| 0.07 | 0.06 | 0.08 | 0.04 | 0.13 | 0.14 | 0.13 | 0.10 | 0.10 | 0.11 |
| n = 1 (BCO) d | n = 2 (SM) d | n = 3 (SM) d | n = 4 (SM) d | n = 5 (SM) d | n = 6 (SM) d | n = 7 (SM) d | n = 8 (SM) d | n = 9 (SM) d | n = 10 (SM) d |
| 0.09 | 0.05 | 0.04 | 0.03 | 0.03 | 0.02 | 0.02 | 0.02 | 0.02 | 0.01 |
| n = 2 (SO) d | n = 3 (SM) d | n = 4 (SO) d | n = 5 (SM) d | - | - | - | - | - | - |
| 0.07 | 0.05 | 0.03 | 0.03 | - | - | - | - | - | - |
| Space Group | AB | AG | AU | A1 | A2 | A3 |
|---|---|---|---|---|---|---|
| P2/m | 0.000 | 0.028 | 0.269 | 1.056 | 1.036 | 0.578 |
| Amm2 a | 0.641 | 1.359 | 0.151 | 0.839 | 0.750 | 0.766 |
| C2/m-16 a | 0.128 | 1.475 | 0.152 | 0.881 | 0.940 | 1.111 |
| C2/m-20 a | 0.347 | 1.971 | 0.208 | 0.937 | 0.954 | 0.752 |
| I-4 a | 0.014 | 0.691 | 0.070 | 1.006 | 1.006 | 1.167 |
| Fd-3m a | 0.000 | 3.500 | 0.336 | 0.773 | 0.773 | 0.773 |
© 2017 by the authors. Licensee MDPI, Basel, Switzerland. This article is an open access article distributed under the terms and conditions of the Creative Commons Attribution (CC BY) license (http://creativecommons.org/licenses/by/4.0/).
Share and Cite
Bai, C.; Chai, C.; Fan, Q.; Liu, Y.; Yang, Y. A Novel Silicon Allotrope in the Monoclinic Phase. Materials 2017, 10, 441. https://doi.org/10.3390/ma10040441
Bai C, Chai C, Fan Q, Liu Y, Yang Y. A Novel Silicon Allotrope in the Monoclinic Phase. Materials. 2017; 10(4):441. https://doi.org/10.3390/ma10040441
Chicago/Turabian StyleBai, Chaogang, Changchun Chai, Qingyang Fan, Yuqian Liu, and Yintang Yang. 2017. "A Novel Silicon Allotrope in the Monoclinic Phase" Materials 10, no. 4: 441. https://doi.org/10.3390/ma10040441
APA StyleBai, C., Chai, C., Fan, Q., Liu, Y., & Yang, Y. (2017). A Novel Silicon Allotrope in the Monoclinic Phase. Materials, 10(4), 441. https://doi.org/10.3390/ma10040441