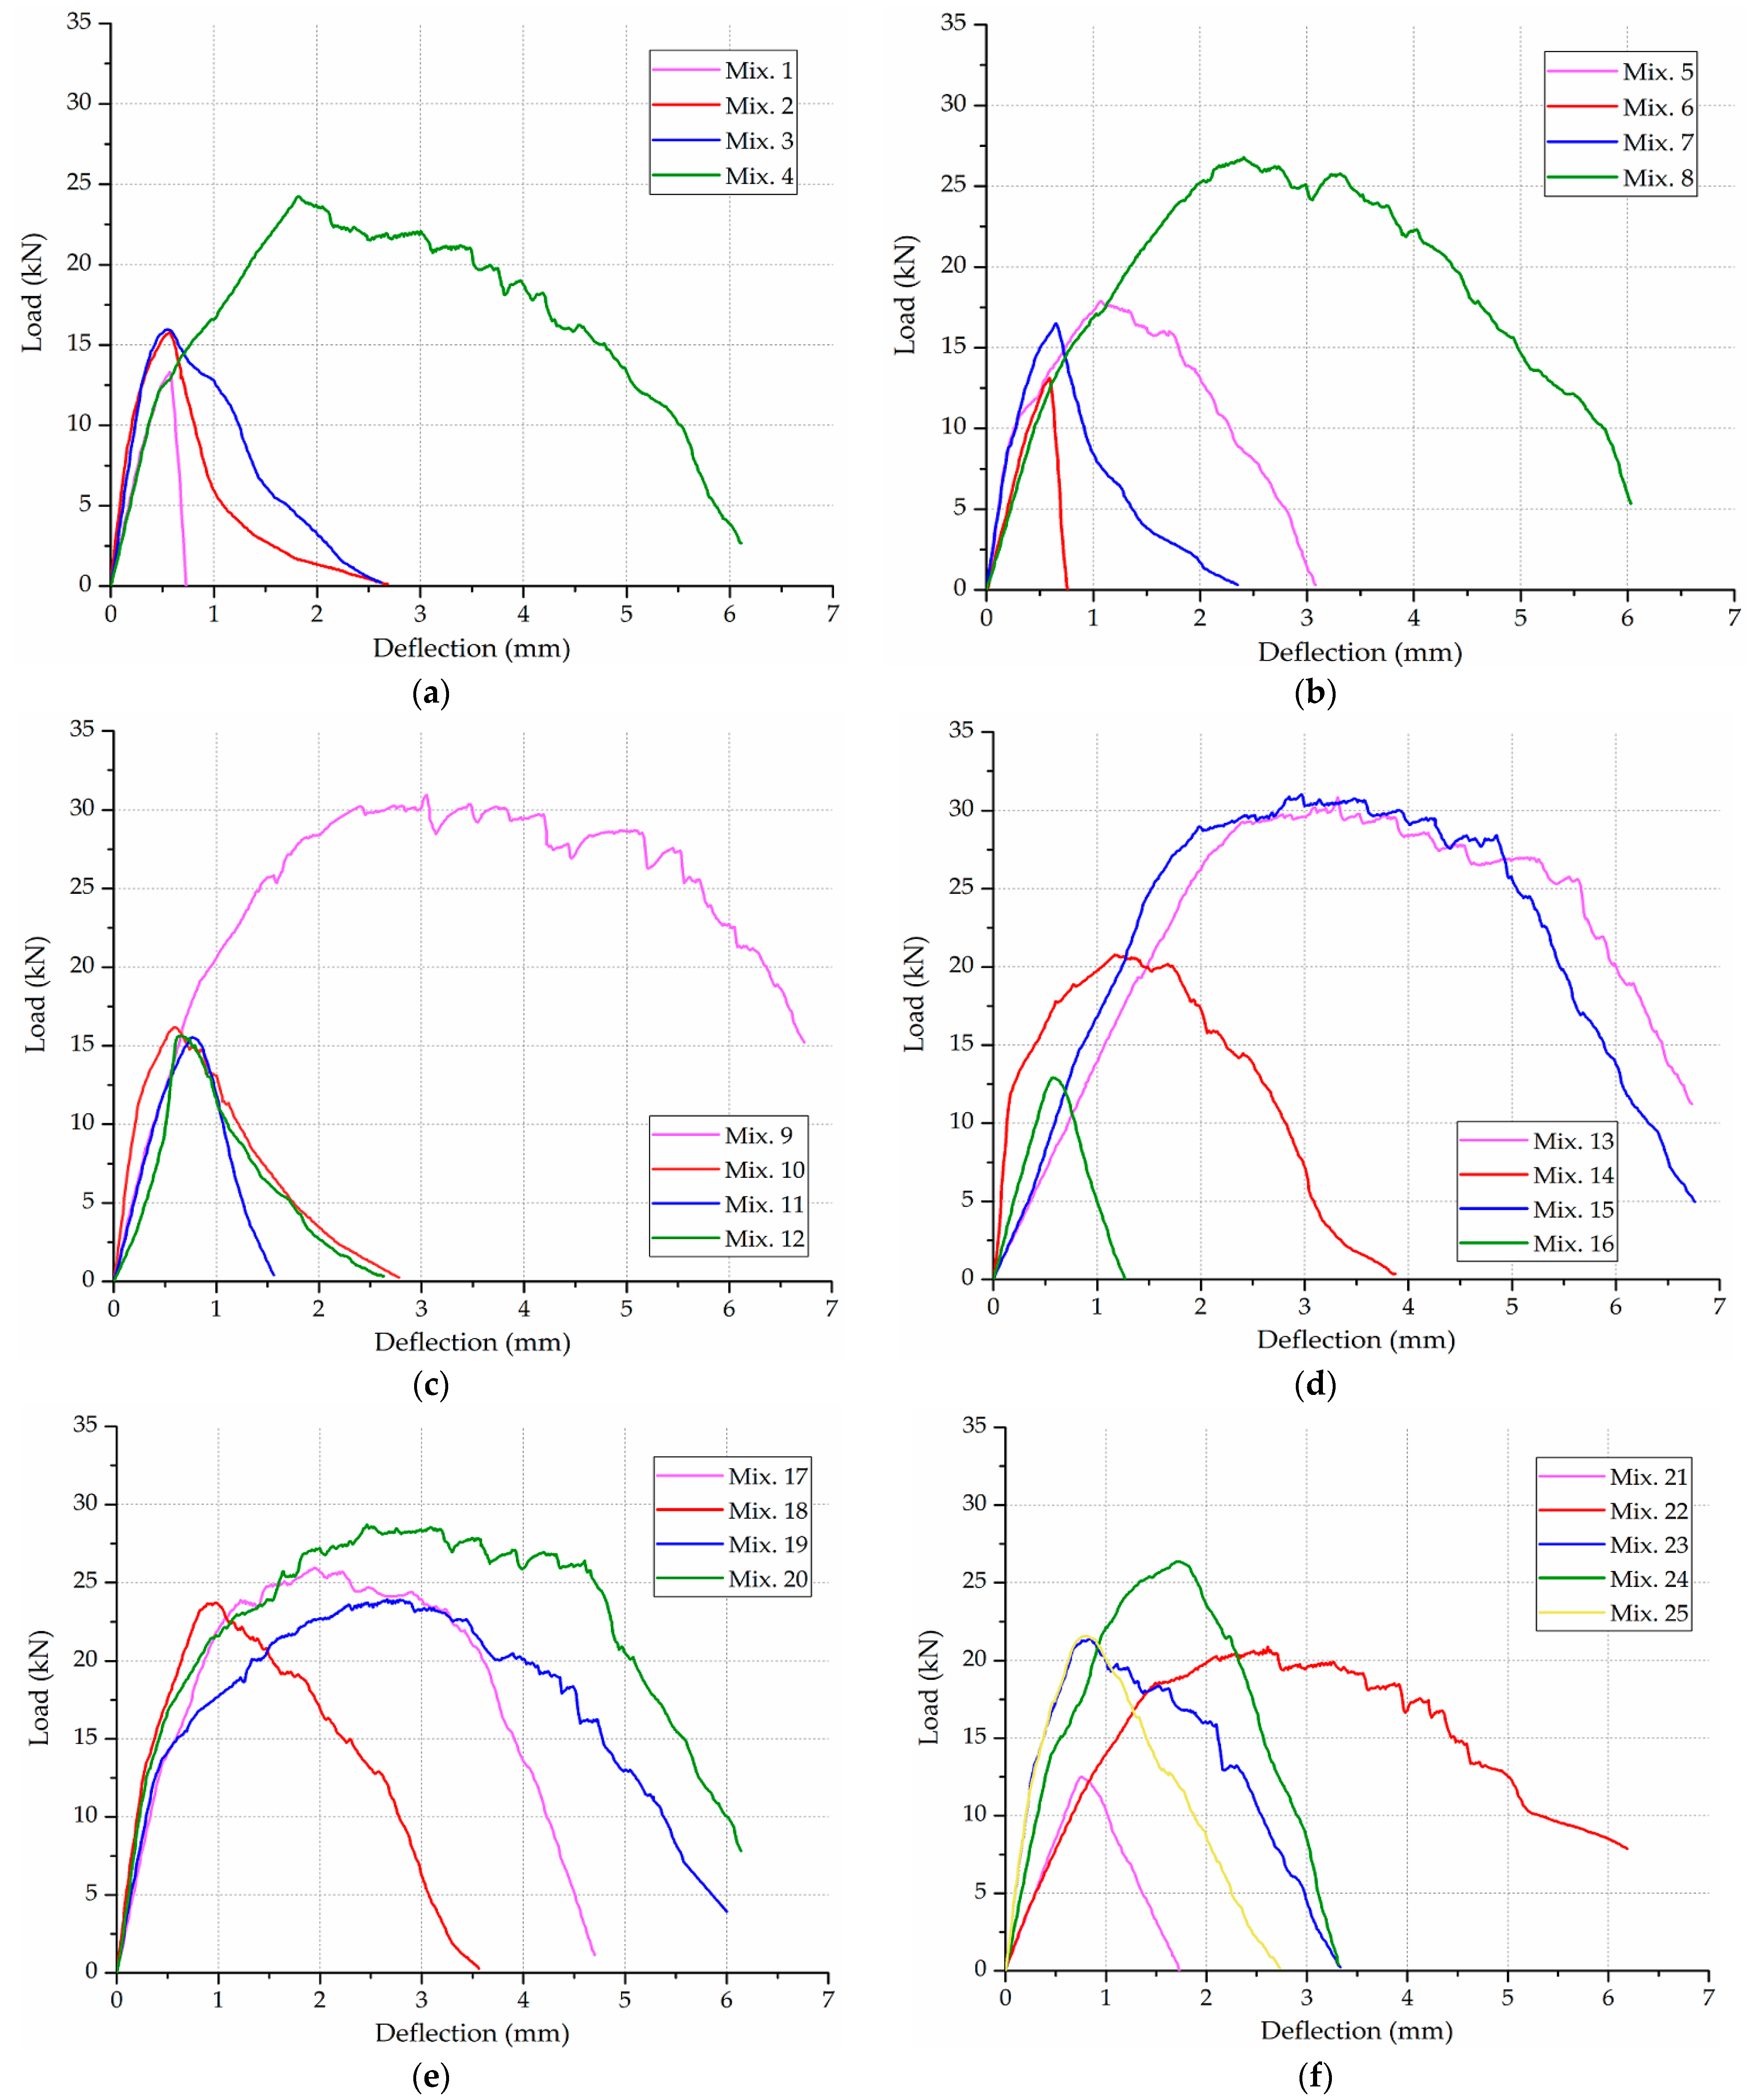
3.1. Flexural Load-Deflection Curves
The flexural load-deflection curves before the freeze-thaw test for all the ECC mixtures are illustrated in
Figure 7.
The load-deflection curve varies in shape according to the set of mix design. Generally, the fibrous ECC specimens (e.g., Mix. 9, 13 and 15) exhibit superior load capacity and post-cracking performance to the plain specimens (e.g., Mix. 1, 6 and 11). The larger area under the load-deflection curve up to a specified deflection for the specimen reinforced with PVA fiber indicates its better energy dissipation capacity. The peak load is discerned from the load-deflection data to calculate the maximum flexural stress, which is equivalent to the flexural strength discussed in this investigation. The effect of mix design factors on the flexural strength and the extent to which they affect this performance characteristic are analyzed in subsequent sections.
3.3. The Identification of Frost-Induced Failure using the M-K Criterion
The ultimate failure (UF) for each mixture represents that the ECC materials are not effective any more. However, the behavior characteristics before UF are of greater concern in this investigation as some unseen features could exist during the frost-induced failure evolution. The M-K criterion was introduced to gain insight into the freeze-thaw working state leap of ECC through the
L-C curve. This non-parametric statistical test is insensitive to outliers and regardless of data distributions [
32,
33,
34]. By examining the sign of all pairwise differences of observed values, the trend in time series are quantified and significant mutational changes are identified. The M-K criterion has been proven to be a powerful tool in climatology [
35], meteorology [
36], hydrology [
37] and the field of construction [
38], providing useful information on the possibility to broaden its application to the detections of other trends. As shown in
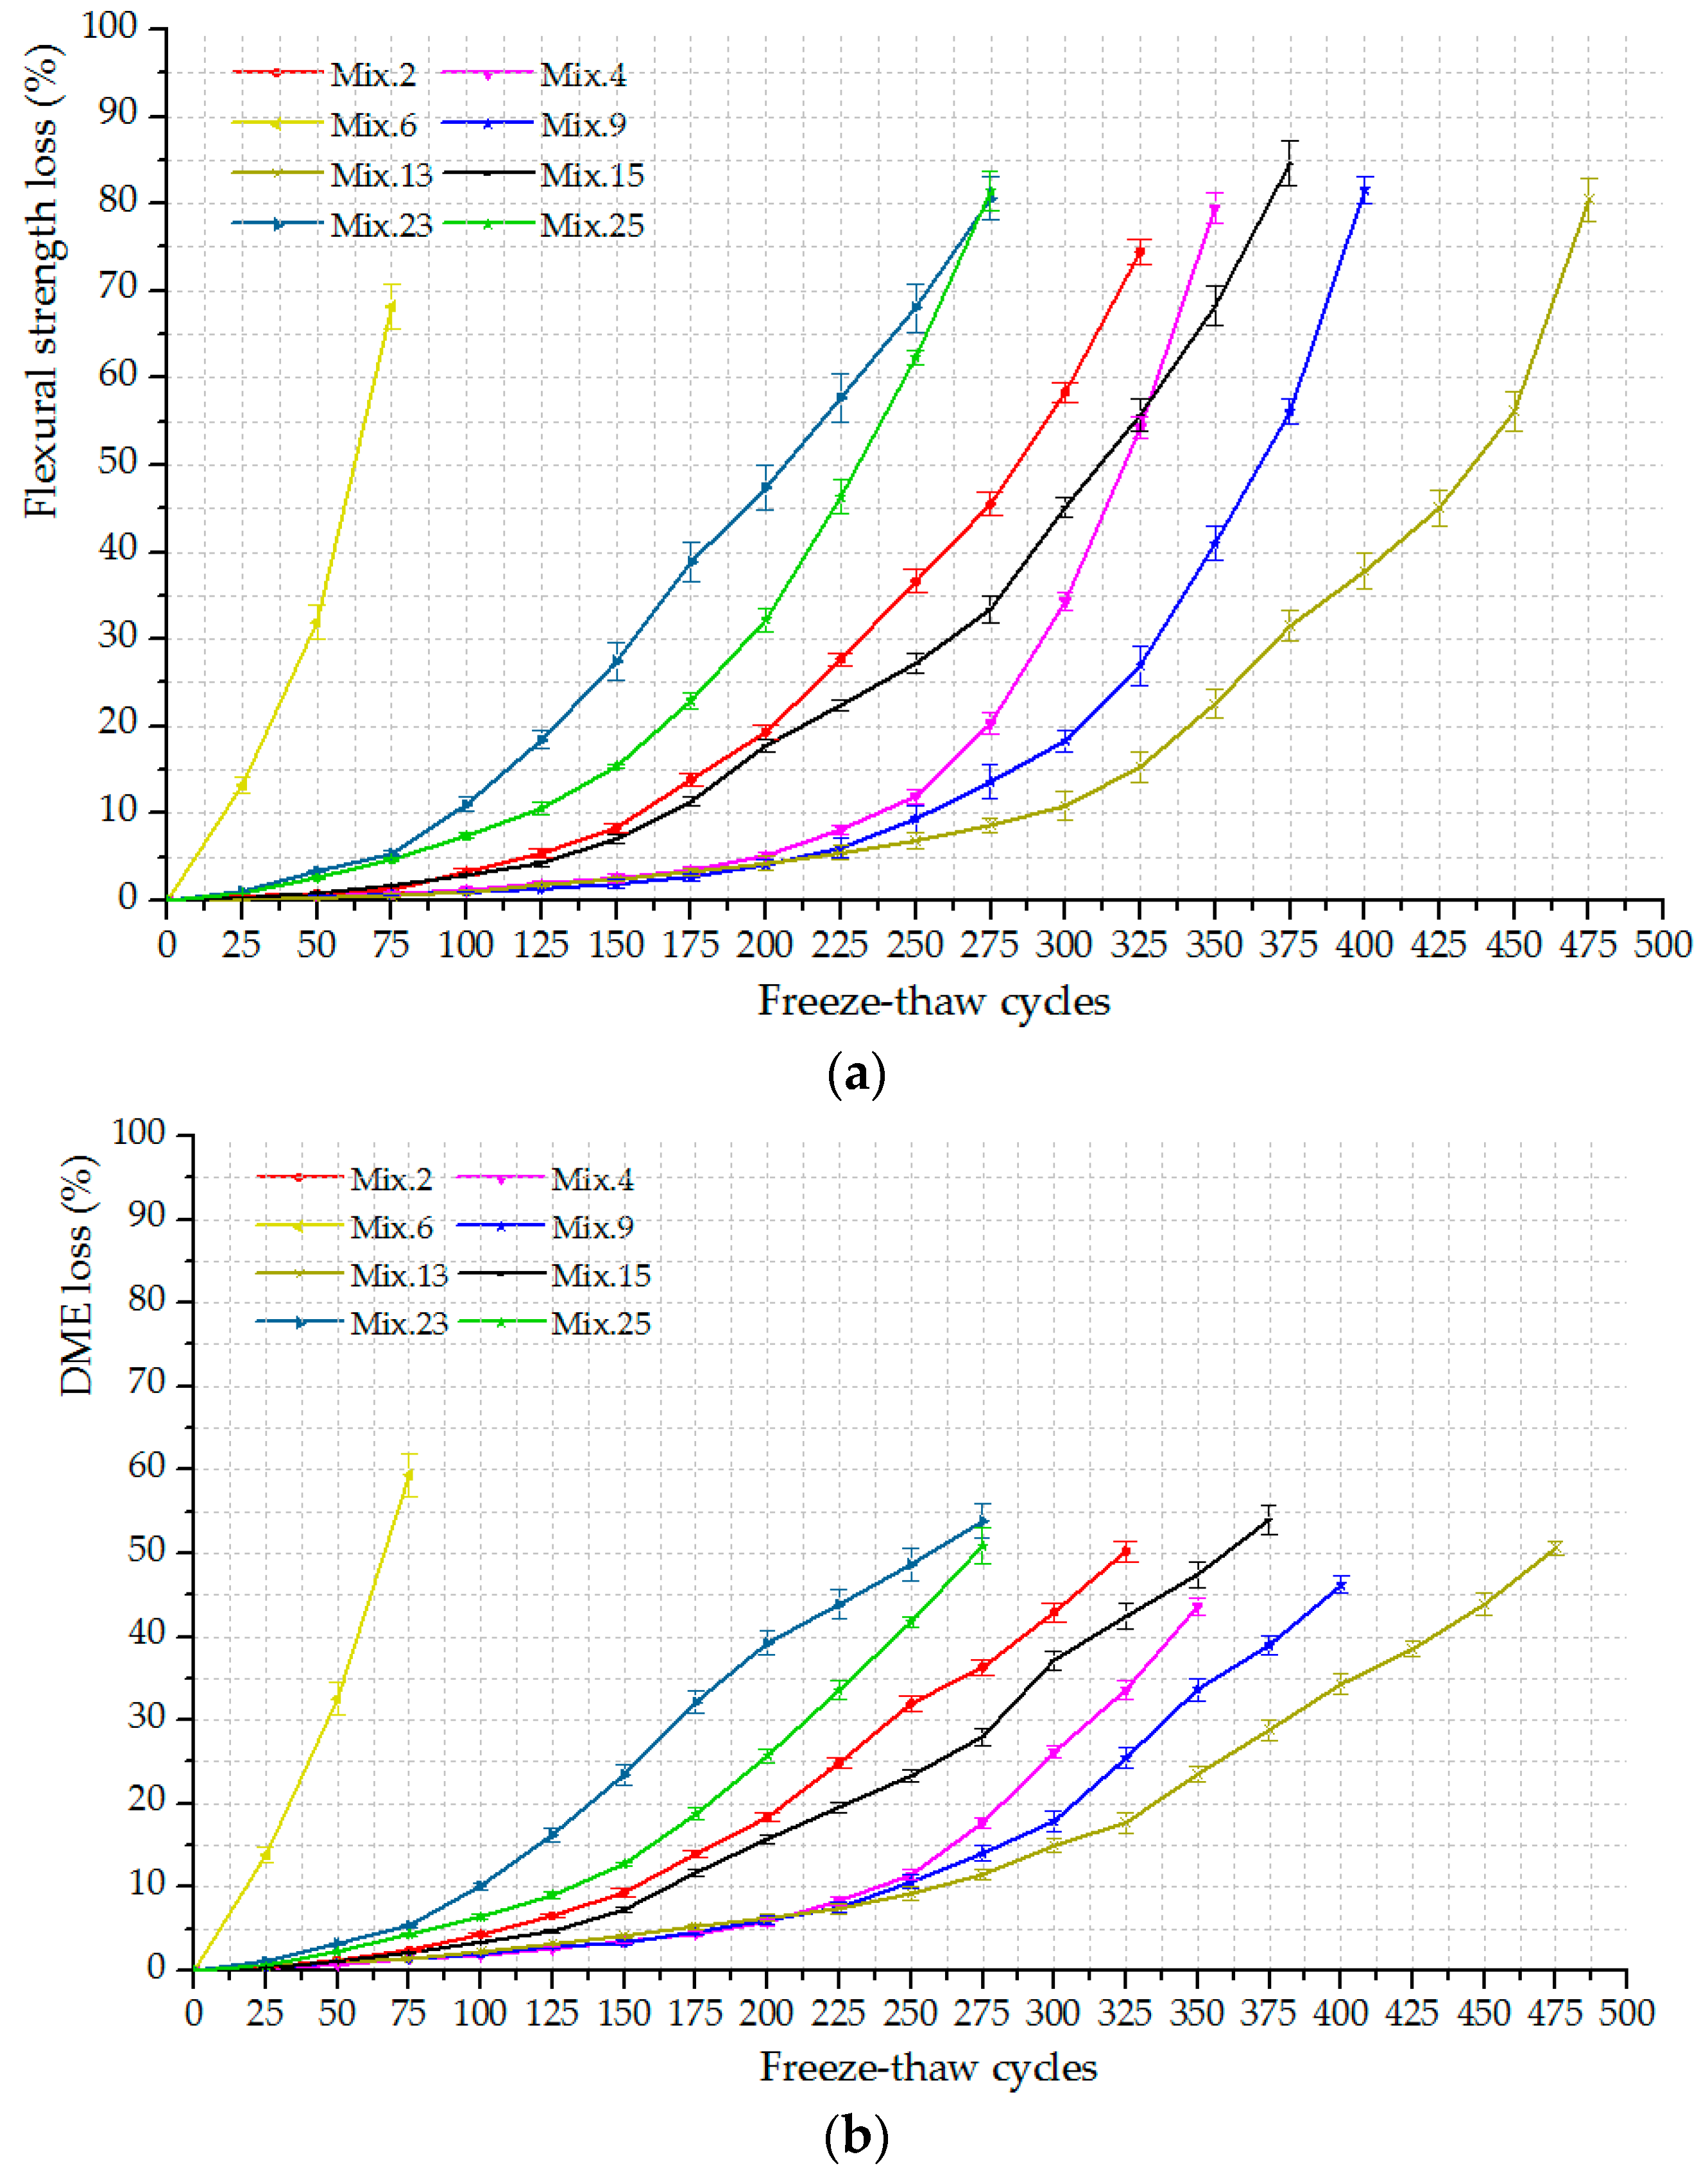
Figure 8, the loss in engineering properties has a temporal variation trend which embodies the working state of ECC materials. With these considerations, the M-K criterion is suitable for detecting the mutation of the working behavior of ECC materials under the freezing and thawing influence. In the application of the M-K criterion, a new stochastic variable
dk at the
kth step of measurement can be defined by,
where
mi is the cumulative number of the samples; “+1” means adding one more to the existing value if the inequality on the right side is satisfied for the
jth comparison. {
L(
i)} is the sequence of the performance loss (flexural strength loss/DME loss) at
ith step of measurement, which is consistent with the
L-C curve. The mean value E(
dk) and variance Var(
dk) of
dk can be calculated by,
Assuming that the {
L(
i)} sequence is statistically independent, a new statistic
UFk is defined by,
Thus, an
UFk-C curve can be formed using the
UFk data. A similar procedure proceeds the inverse {
L(
i)} sequence, which is denoted by {
L′(
i)} as follow,
where
n is the sample capacity. Similarly, the stochastic variable
d′
k at the
kth step of measurement is defined by,
where
mi is also the cumulative number of the samples; “+1” means adding one more to the existing value if the inequality on the right side is satisfied for the
jth comparison. The mean value E(
d′
k) and the variance Var(
d′
k) of
d′
k can be calculated following,
Here,
d′
k represents the degree of the ascending trend of the {
L′(
i)} sequence. It is important to note that the inversed sequence has a changing trend contrary to the original one. As a result, the trend of the inverse sequence should be correctly characterized by the opposite sign so that a new statistic
UB′
k is defined by,
and the statistic
UBk corresponding to the original step of measurement can be calculated by,
An UBk-C curve can be formed using the UBk data. The intersection of the UFk-C and UBk-C curves indicates the mutation point of the L-C curve. Consequently, the working state leaps of ECC materials can be distinguished following this criterion.
By distinguishing the intersections of
UFk and
UBk curves, the M-K criterion reveals two working state leaps for each ECC mixtures. These two significant mutational changes characterize the updated failure induced by a certain number of freeze-thaw cycles. The first mutational change is defined as the initial frost-induced failure (IF), which can be identified by investigating the whole
L-C curve. Then, the following mutational change identified from the
L-C curve segment (from IF on) is defined as the progressive frost-induced failure (PF). The IF and PF indices are the completed freeze-thaw cycles at specific working state leap. The results are summarized in
Table 4 together with the UF indices (the terminal freeze-thaw cycles). For each ECC mixture, the IF and PF indices are determined based on the loss data of flexural strength and then validated by those of the DME. Identical results are obtained from the different data series. It should be noted that such a determination of IF and PF indices is an estimation of the real value because the loss data is collected discontinuously after every 25 cycles.
3.4. The Characterization of Freeze-Thaw Stages
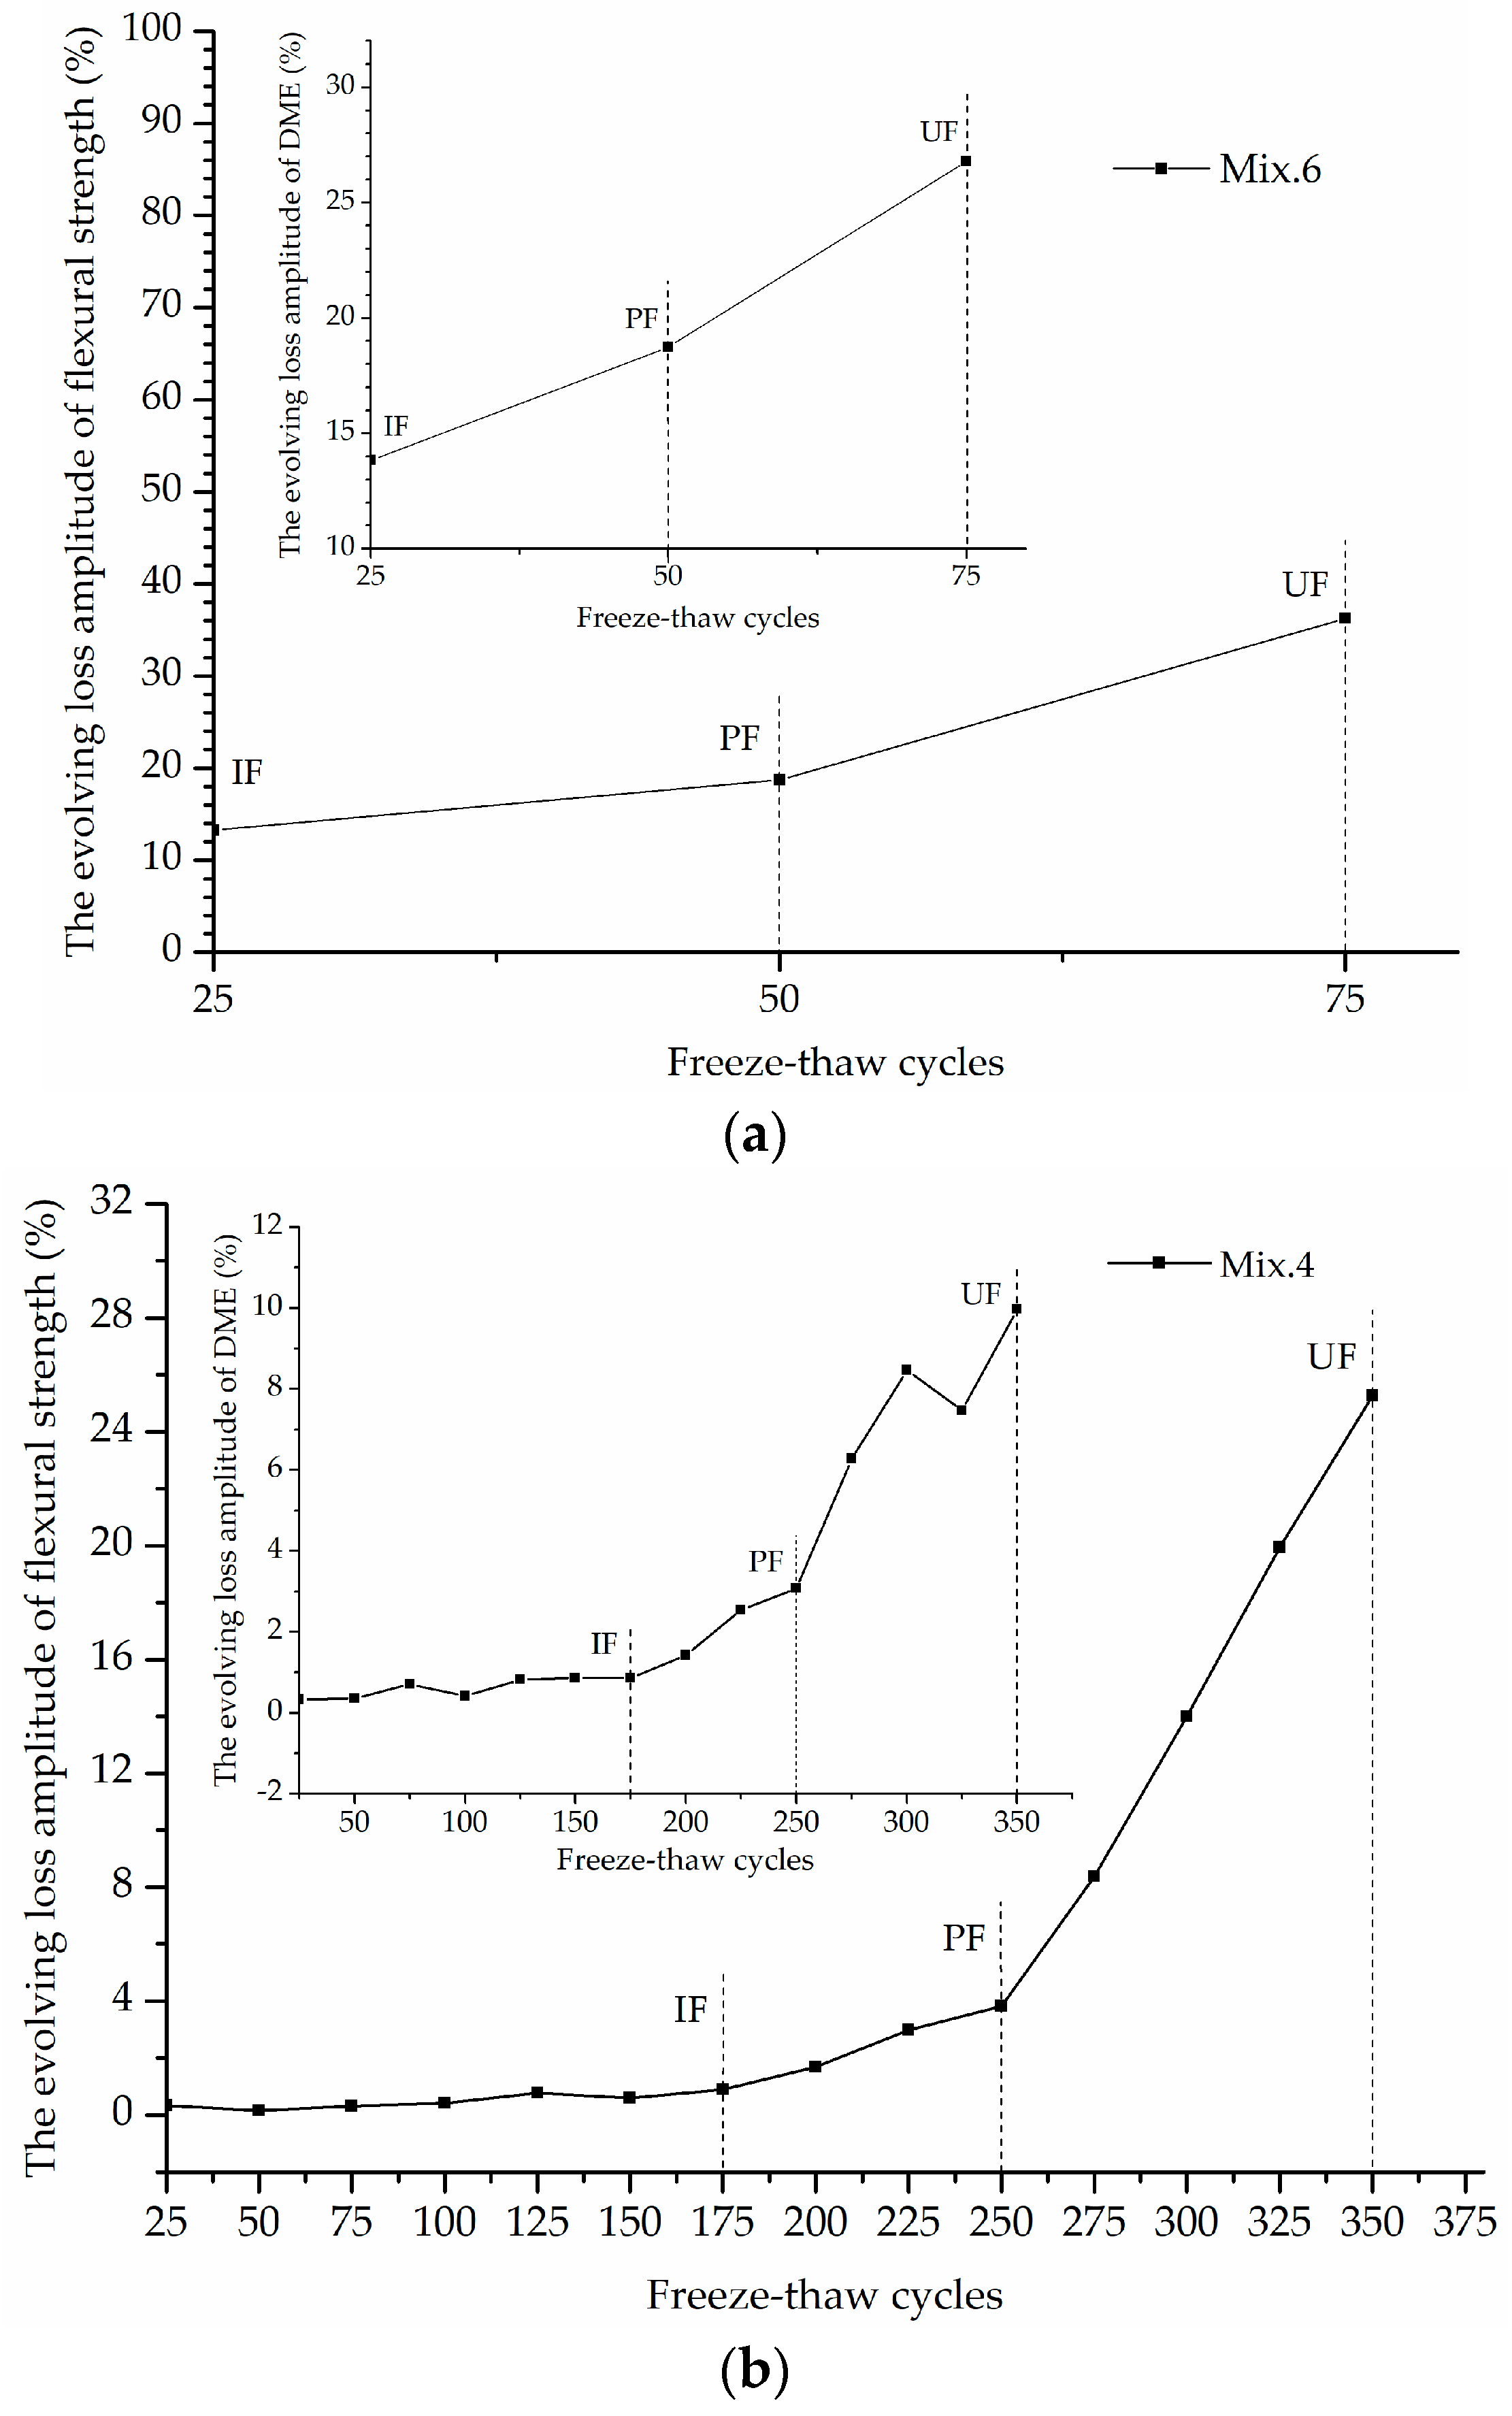
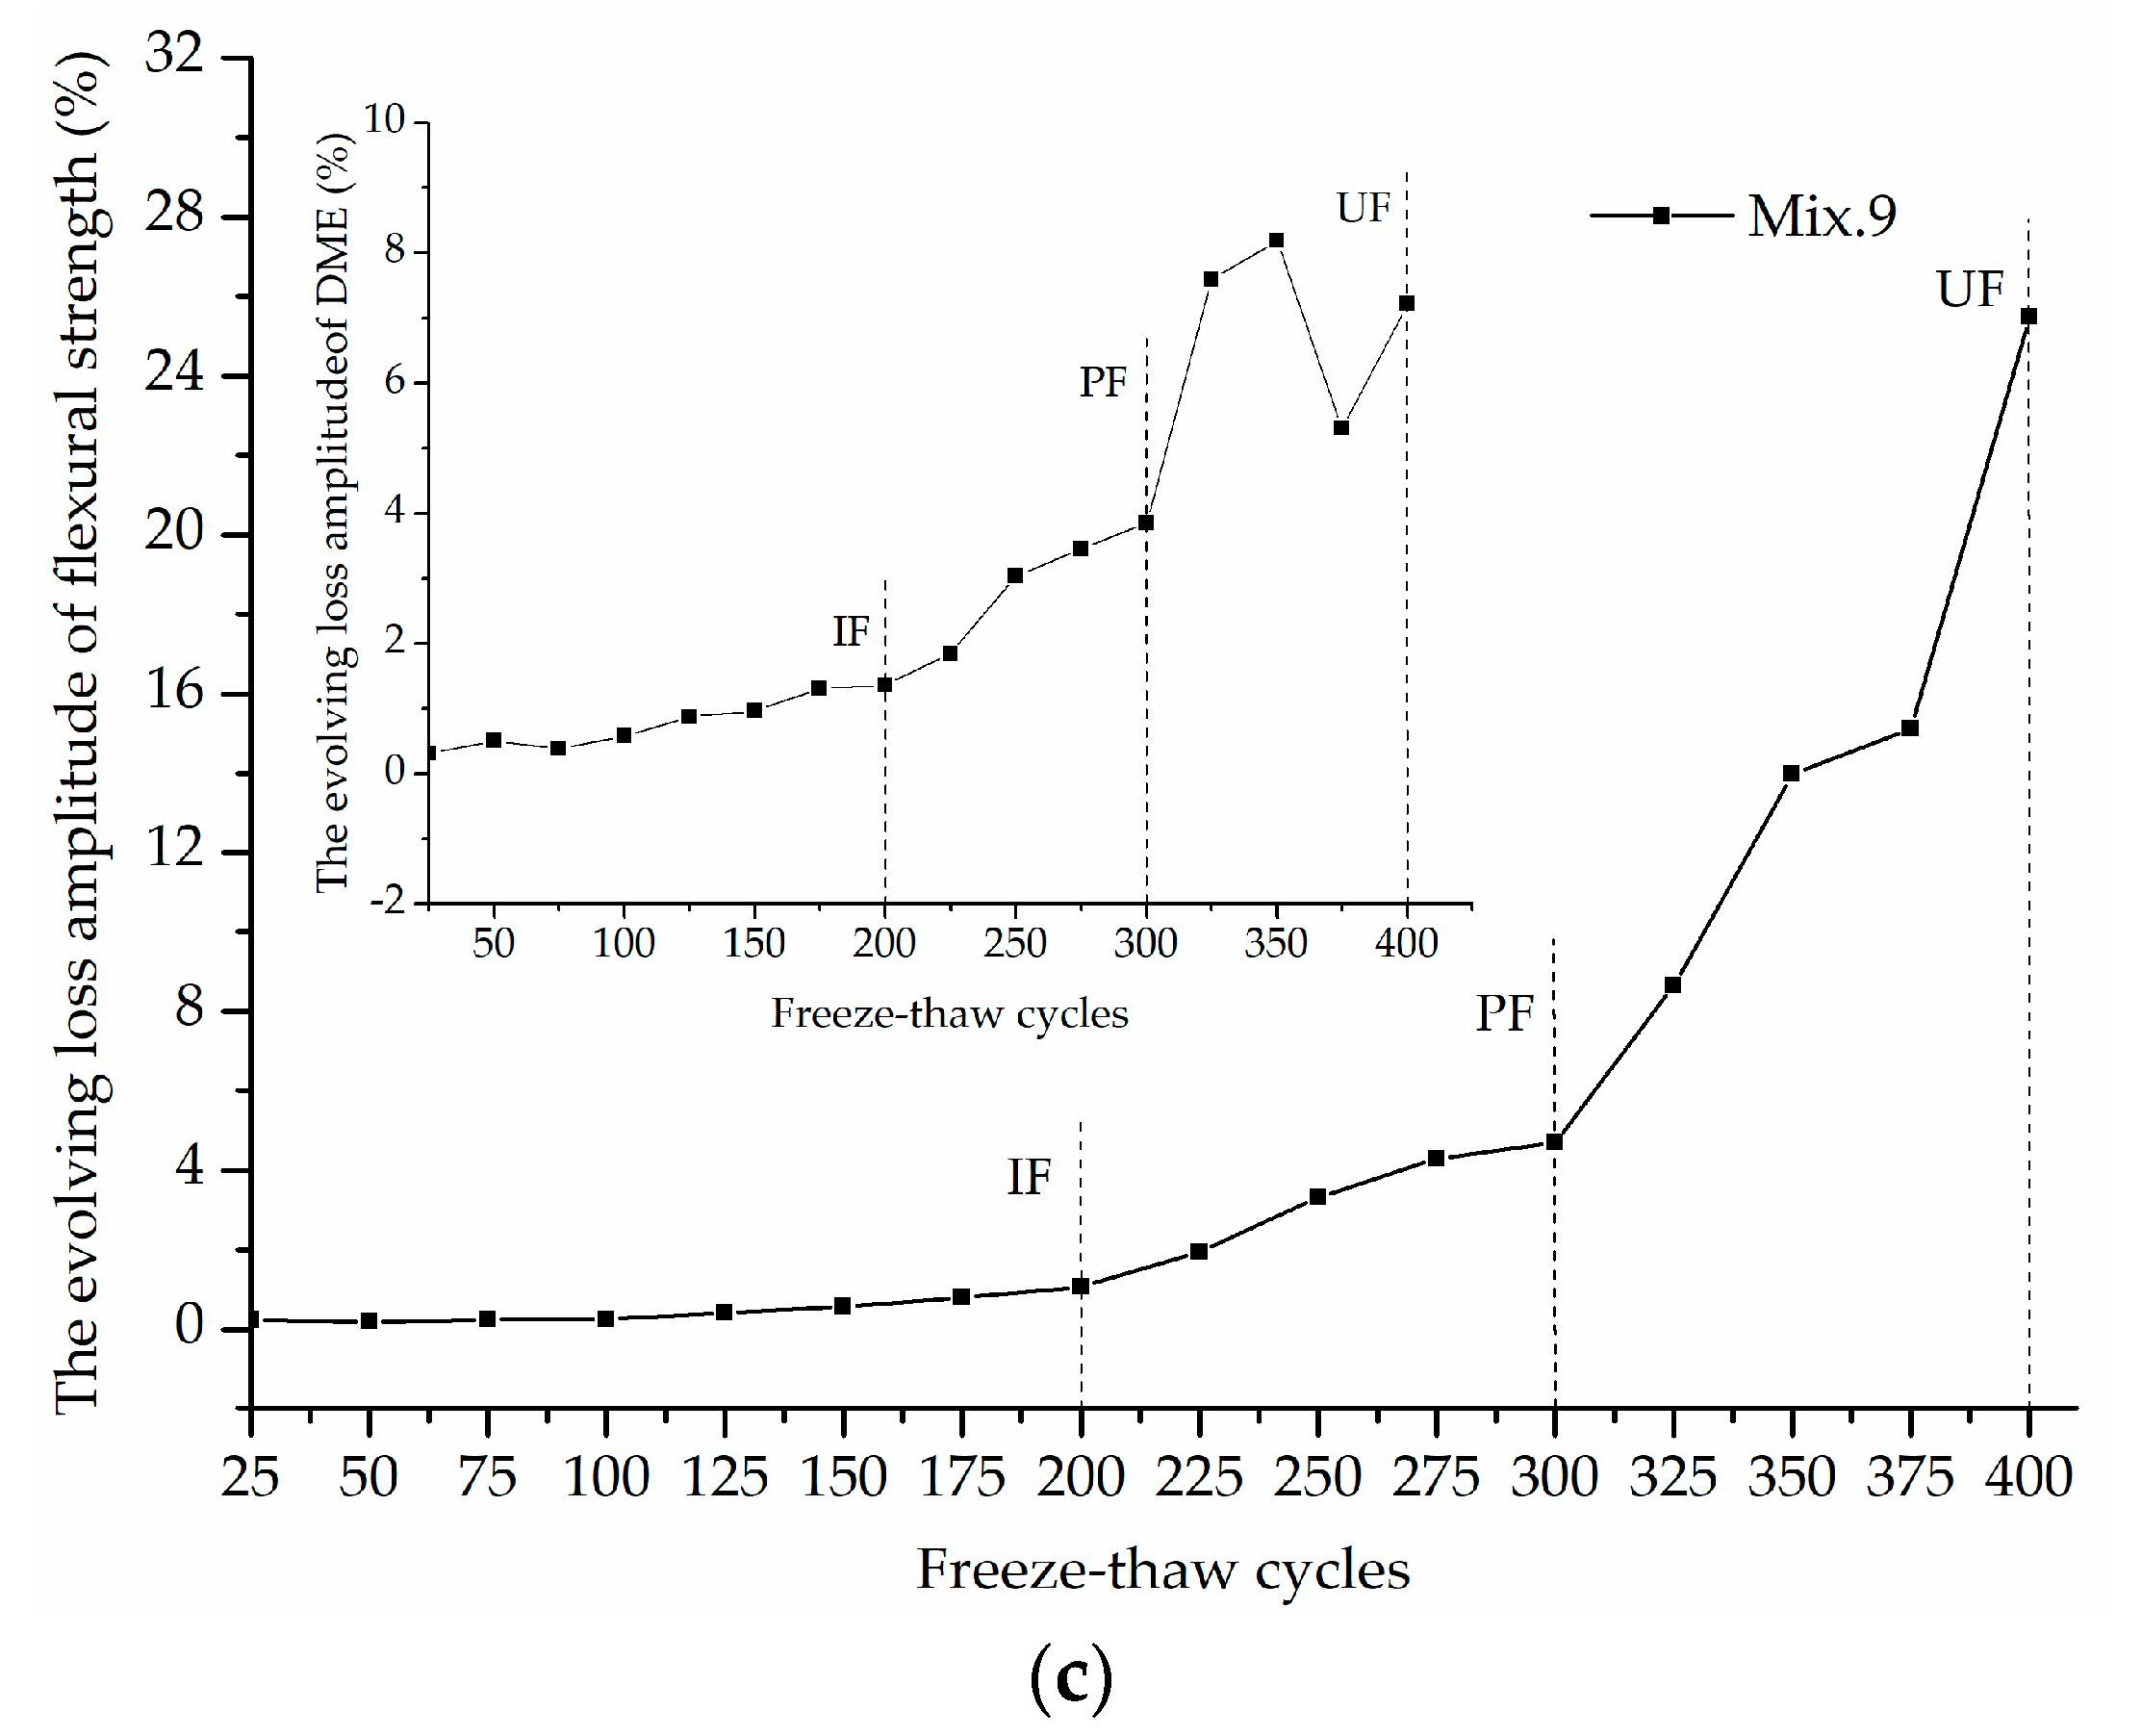
The IF and PF identified using M-K criterion are plotted in the evolving loss amplitude of flexural strength and DME of typical ECC mixtures, as shown in
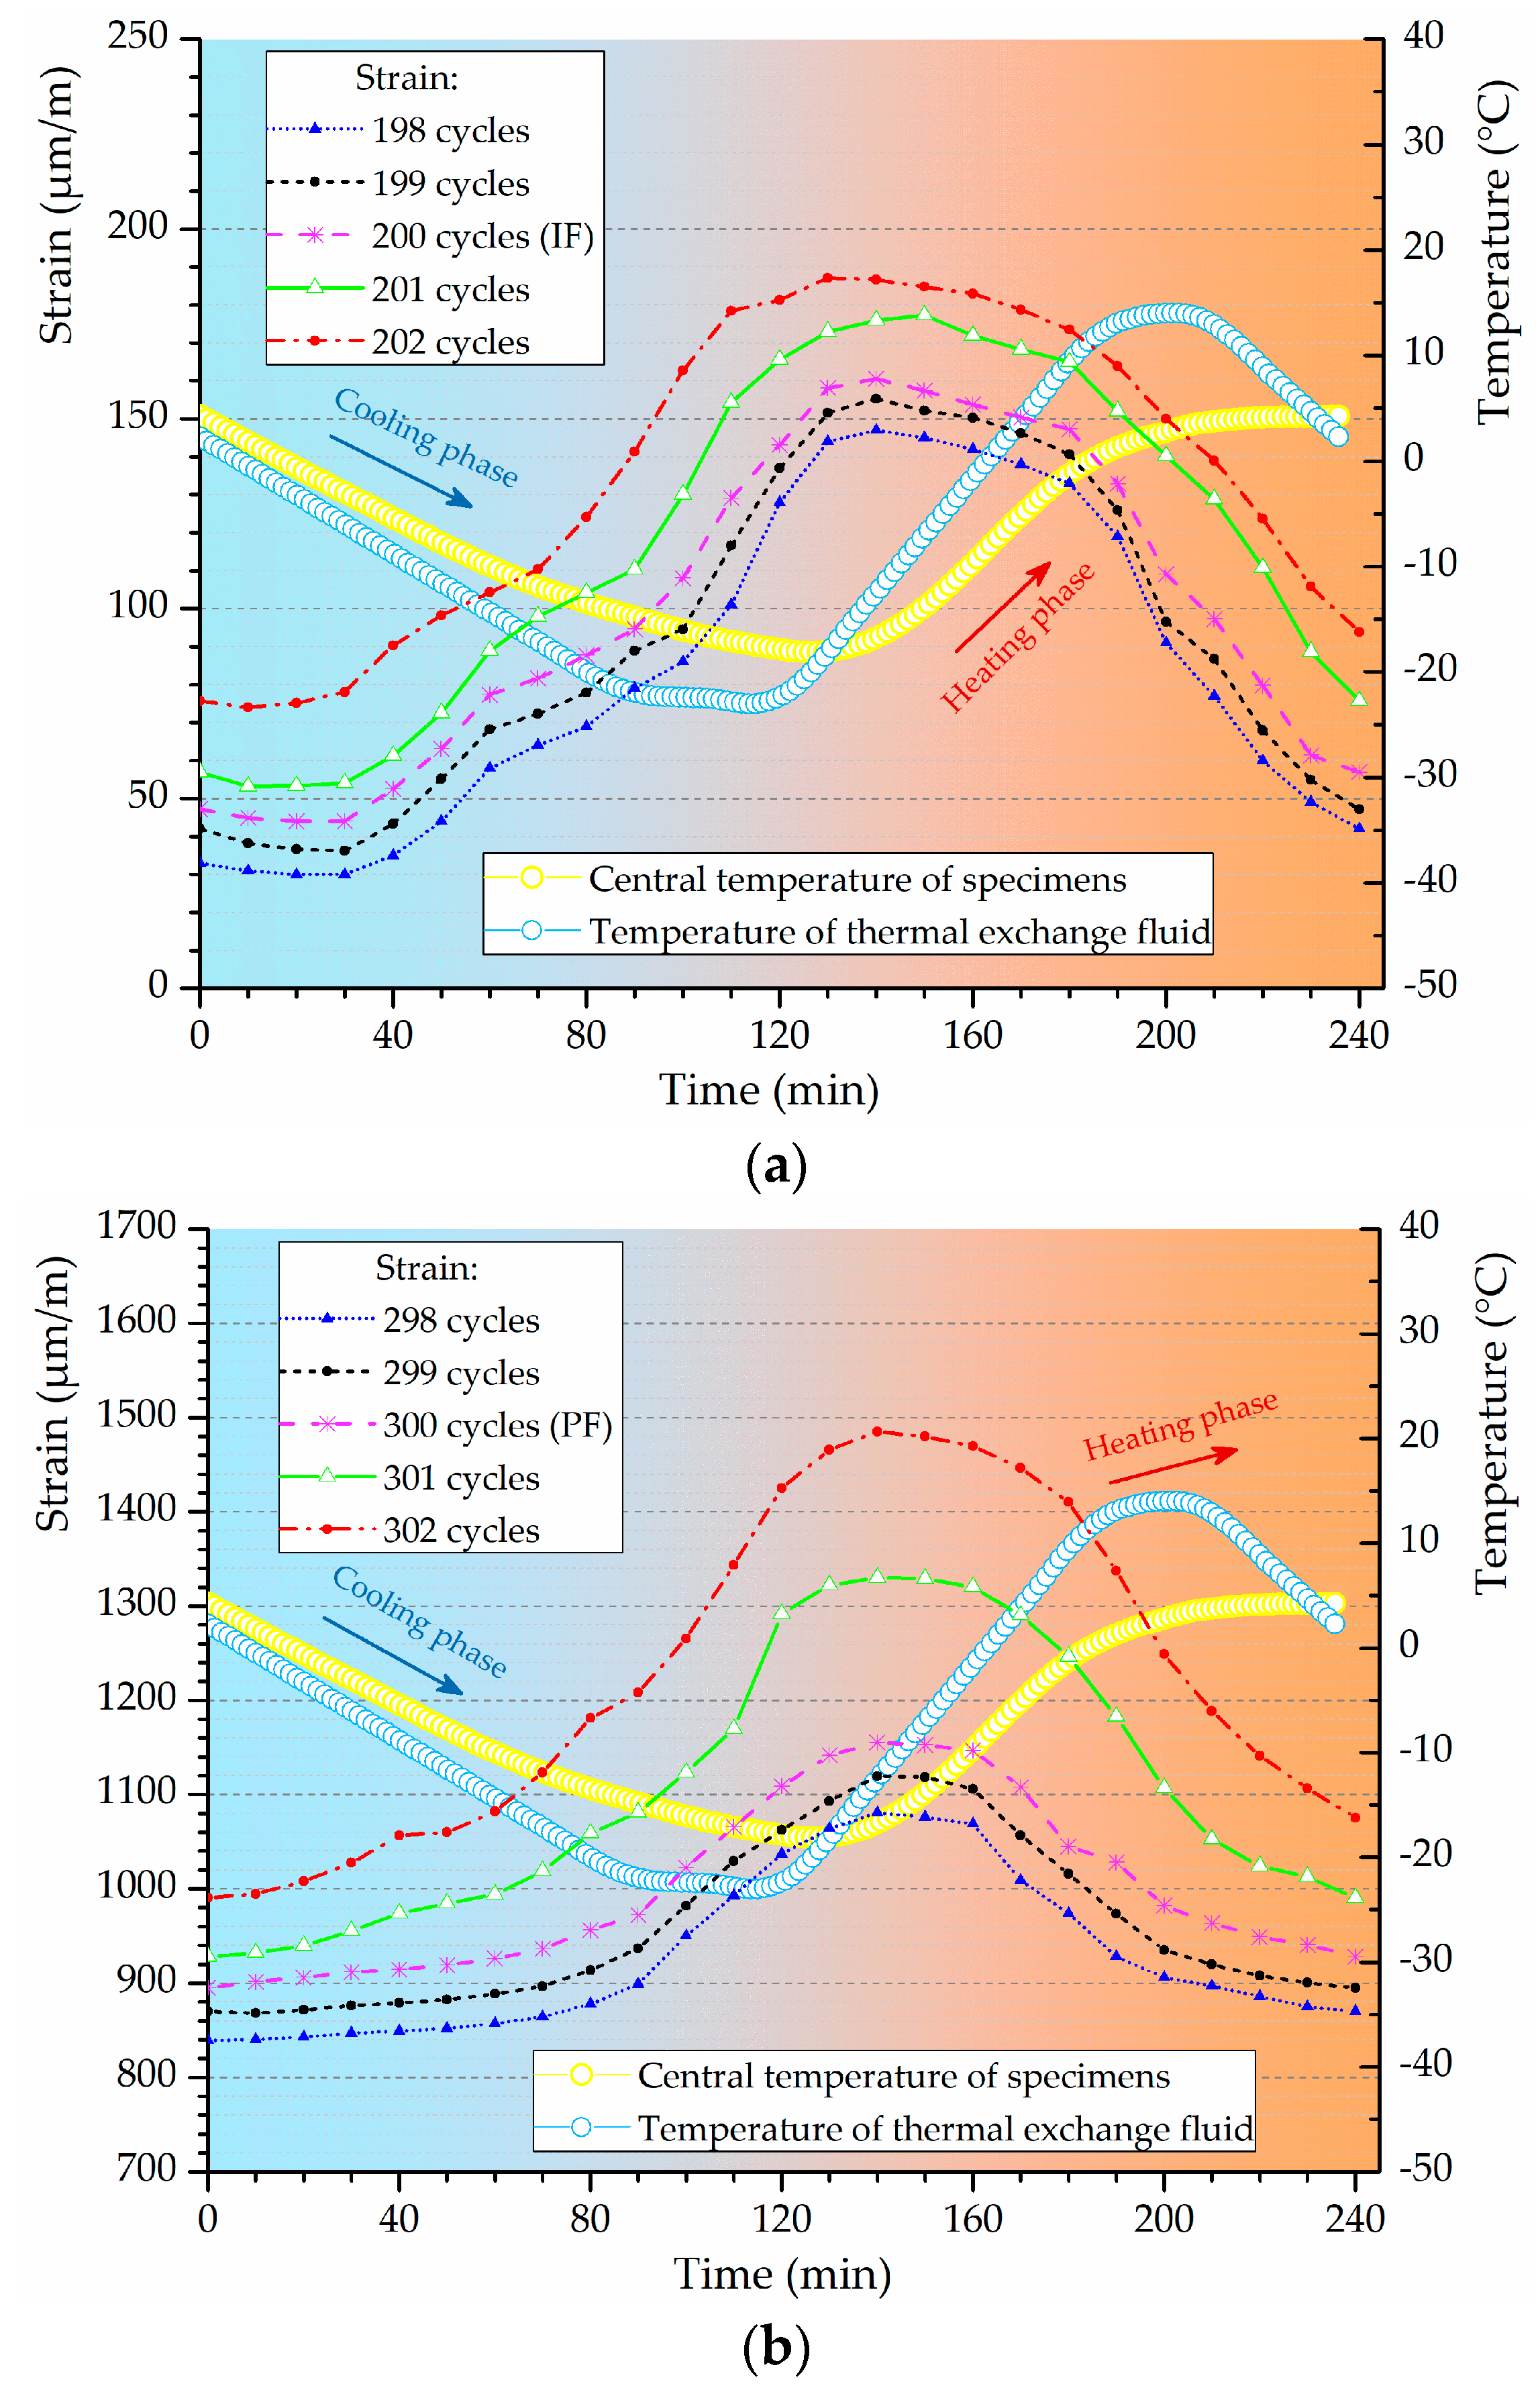
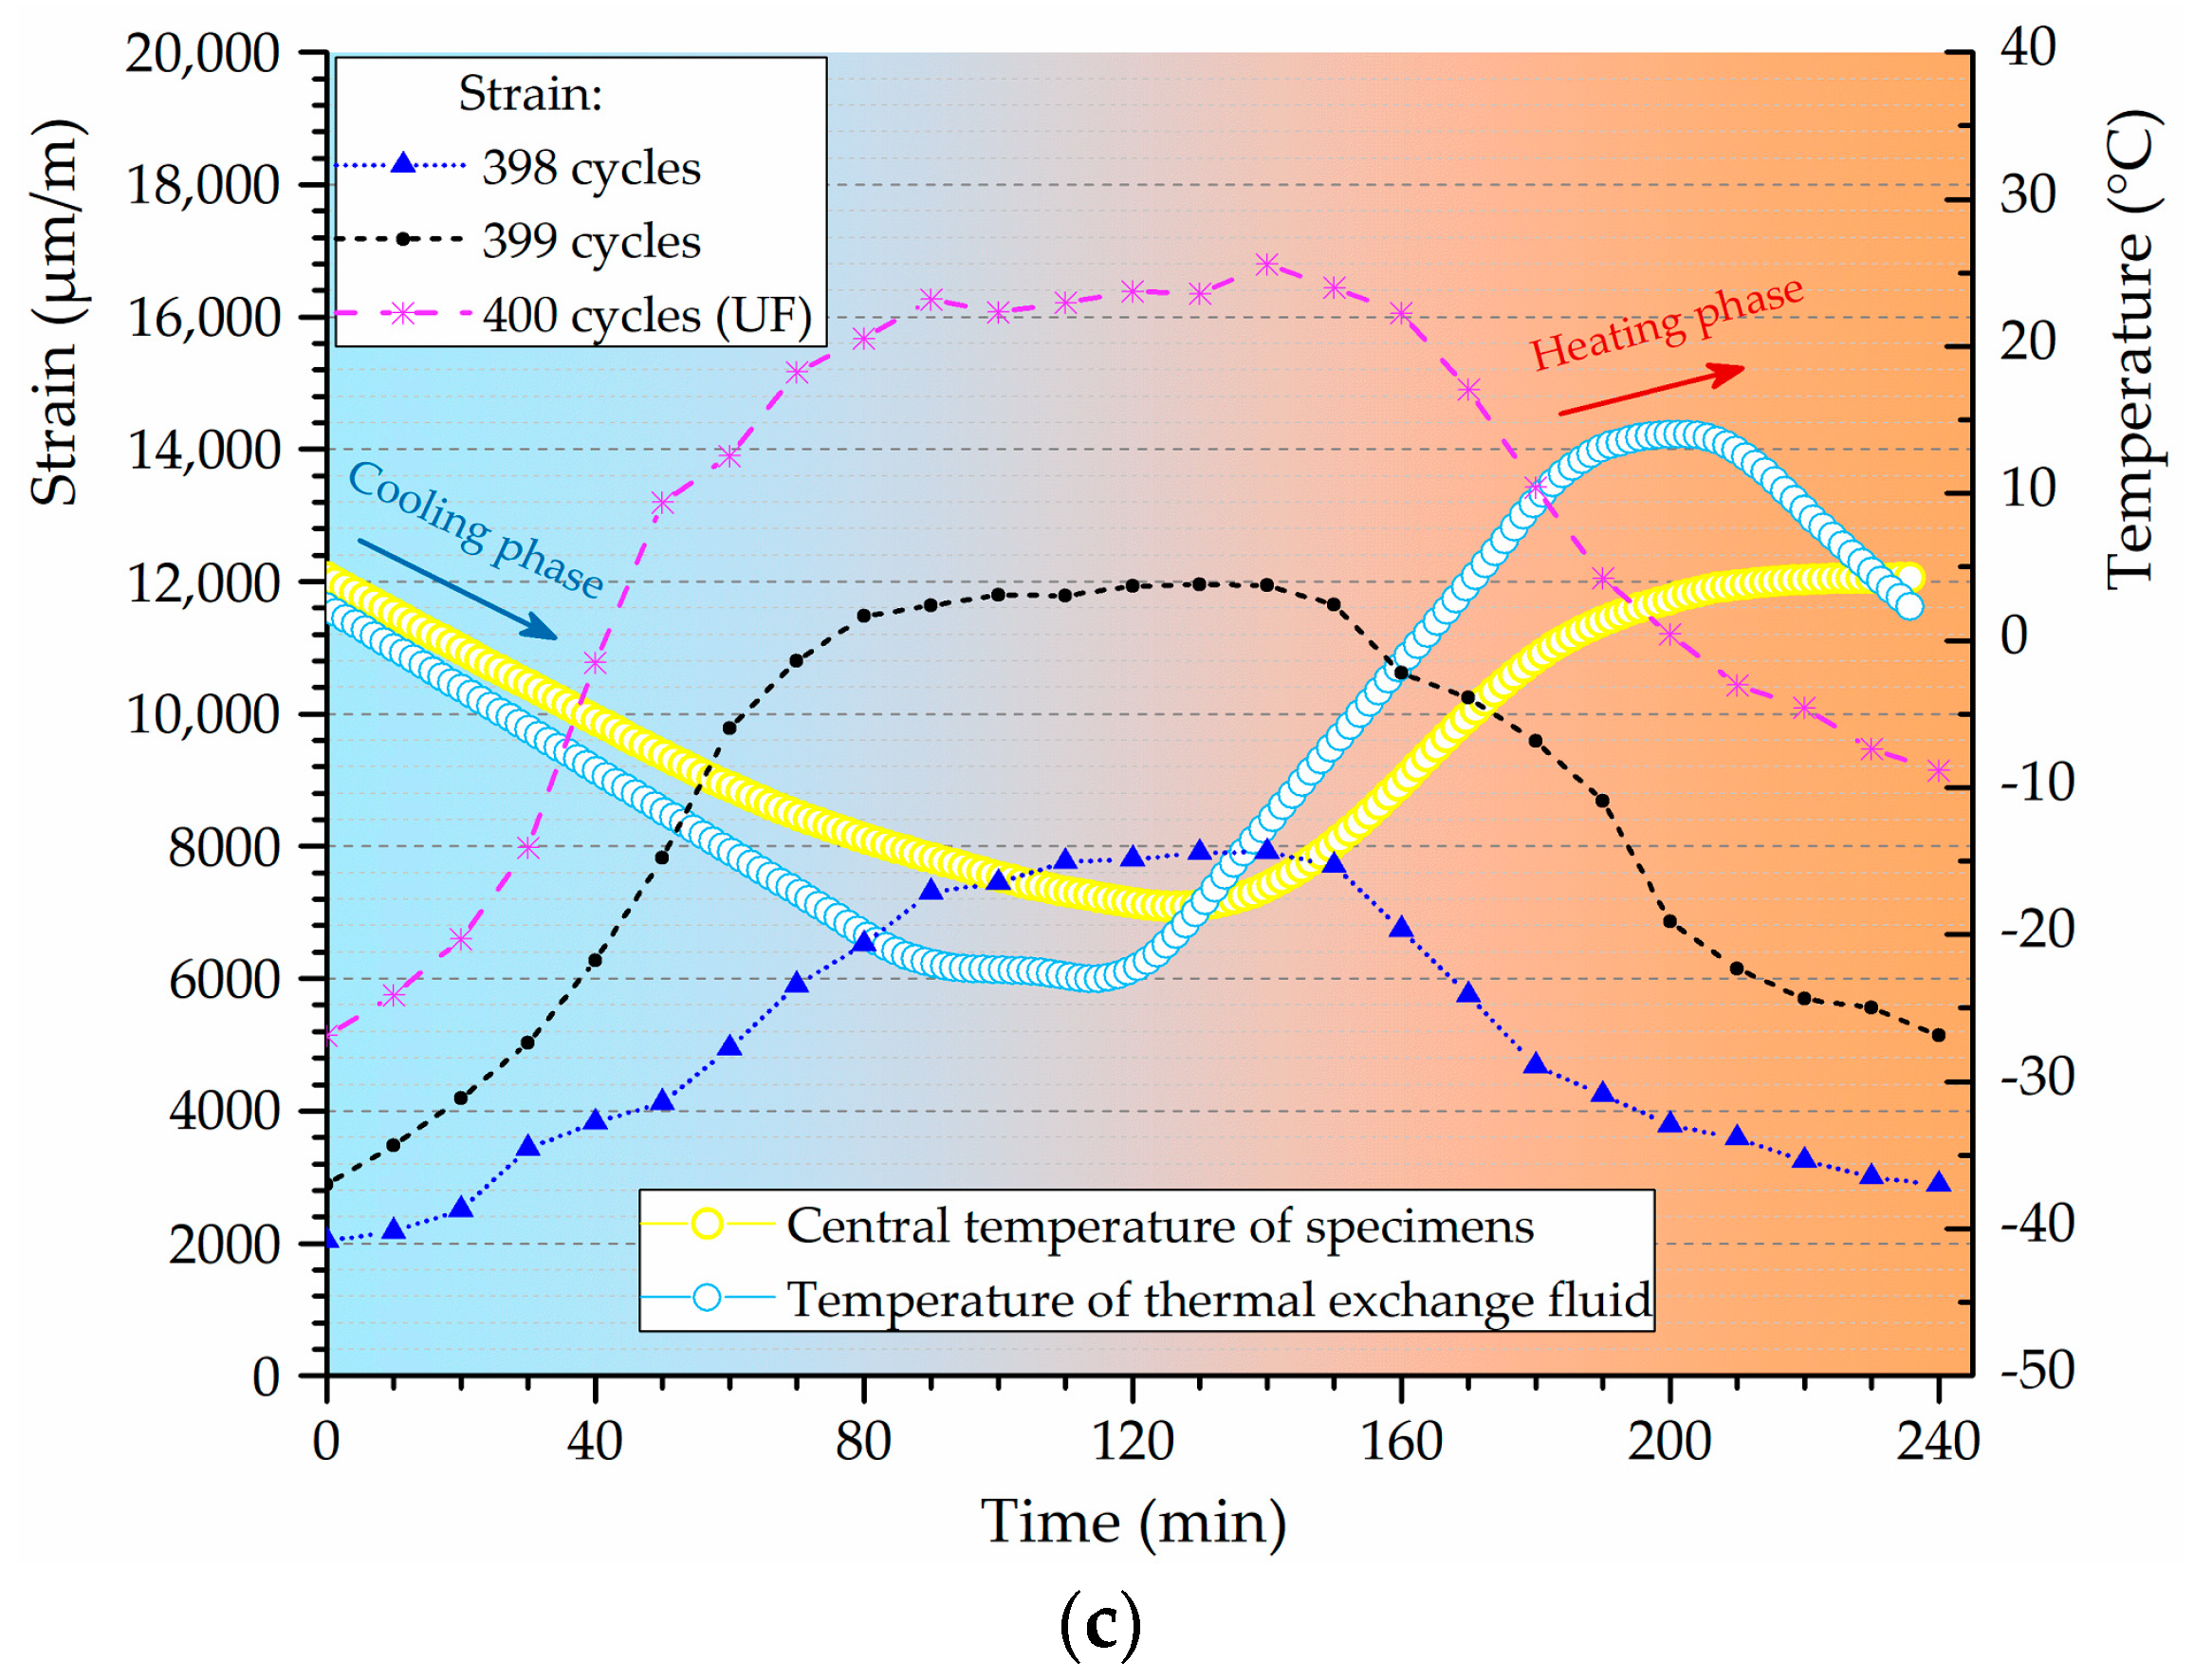
Figure 9. The strain variation curves of Mix. 9 under freeze-thaw cycles around the frost-induced failure points are shown in
Figure 10. Each of the freeze-thaw cycles is divided into cooling and heating phase according to the different temperature variance tendency. The water transformation into ice accompanied by a volume expansion causes the hydraulic pressure in the cooling phase [
39,
40]. Besides, the osmotic pressure is built up as the response to the movement of supercooled gel water from the non-frozen sites to the ice bodies [
41,
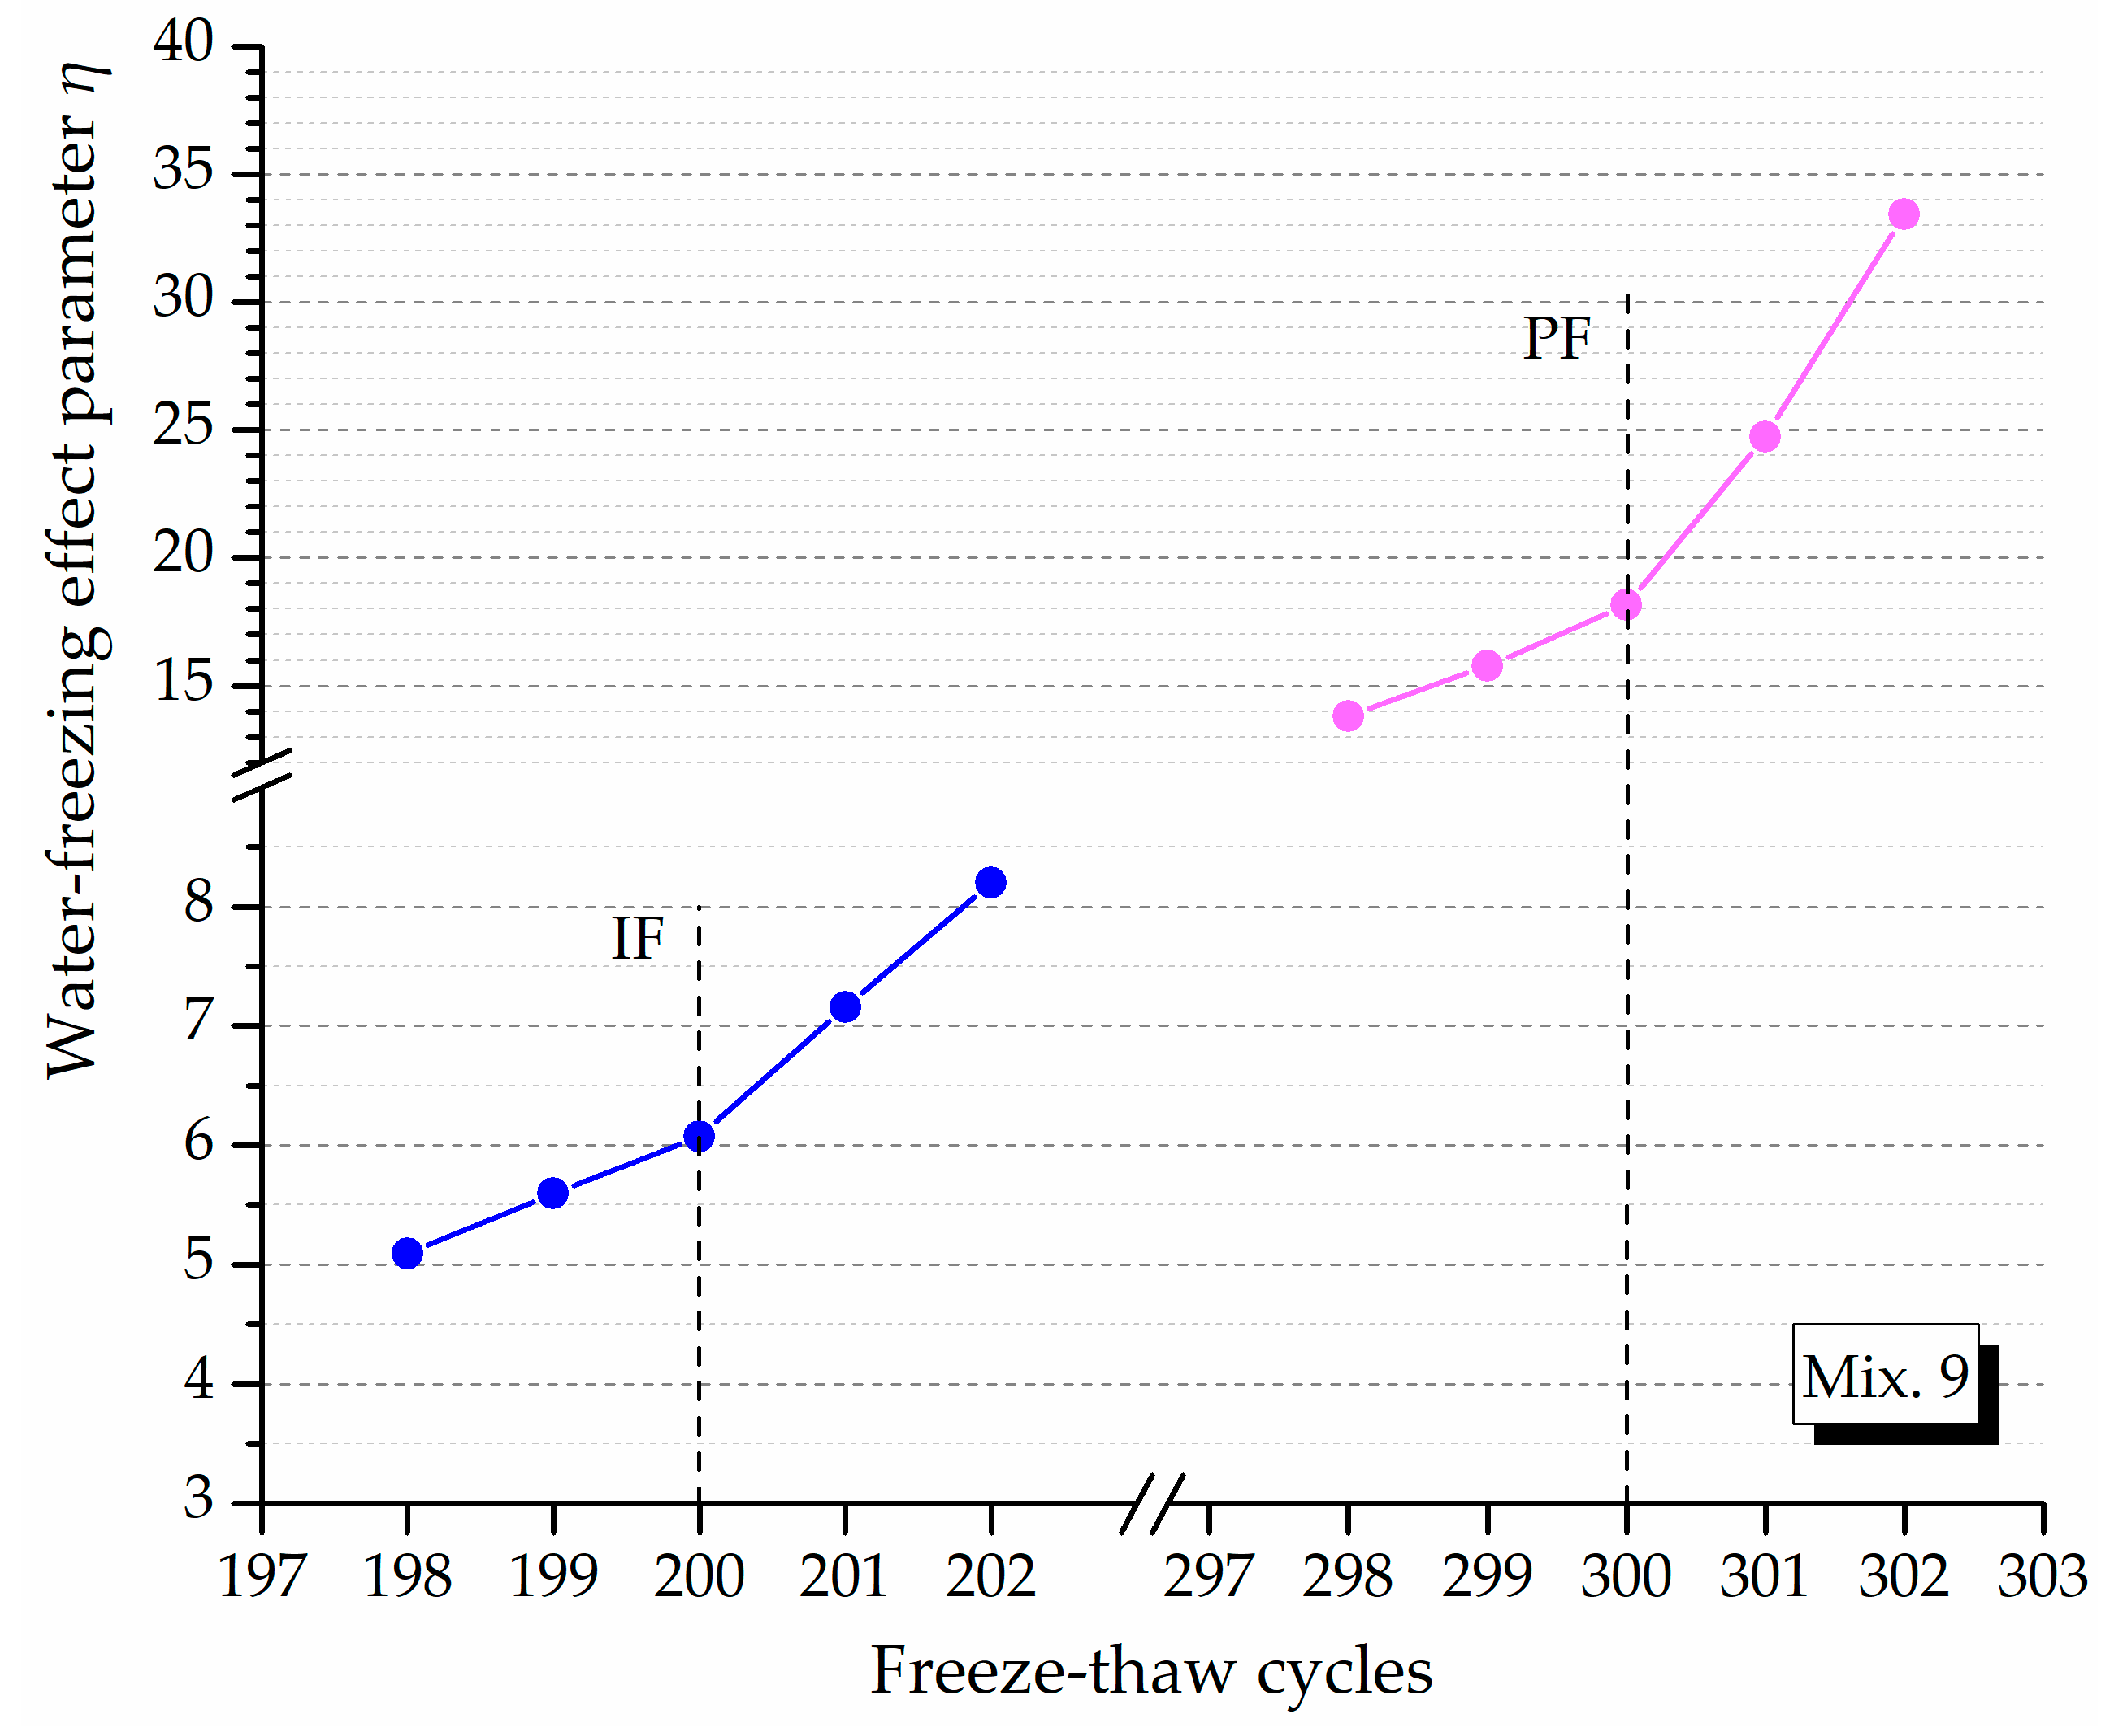
42]. These freezing-induced pressures are among the driving forces for the volumetric change gauged inside the specimen. Assuming that all the pores are filled with water, the volumetric change is mostly related to the freezable water quantities. The water-freezing effect parameter
η is proposed herein to model the volumetric change of ECC specimen in a single freeze-thaw cycle, which is formulated by time integration at a volume unit:
where
ε(
t) (μm/m) is the time-varying strain,
t (min) is the time required for one cycle and
V (cm
3) is the volume of the ECC specimen. The results are illustrated in
Figure 11 and the change of
η value indicates that the content of water that can be frozen is different from the preceding cycles.
The updated failure concept characterizes three different stages of ECC mixtures over their freeze-thaw working state process:
The stable stage. As shown in
Figure 9, the loss in DME and flexural strength grows at quite a slow pace and the developing trend is steady before the
IF, representing a stable stage under the influence of freeze-thaw cycles. During the heating phase, the freezing-induced pressures are being relieved therefore the deformation strain is generally reduced. However, the volumetric change has become plastic after certain cycles of freeze and thaw so that the strain is not able to return to the beginning. This particular strain characteristic could be found in
Figure 10a where the strain variation paths of Mix. 9 are not overlapped at the approach of
IF. Actually, the residual strain is generated, due to the irreversible influence of freeze-thaw action. The residual strain keeps increasing and the mutation of strain variation happens in the wake of
IF. The value of water-freezing effect parameter
η leaps synchronously, as shown in
Figure 11, indicating the content of freezable water is significantly increased from then on. The most possible reason is the initiation of micro-cracks at the
IF. Since the flexural strength and DME are sensitive to the micro-cracking, the sudden change in the evolving loss amplitude of engineering properties is observed directly following the stable stage, as shown in
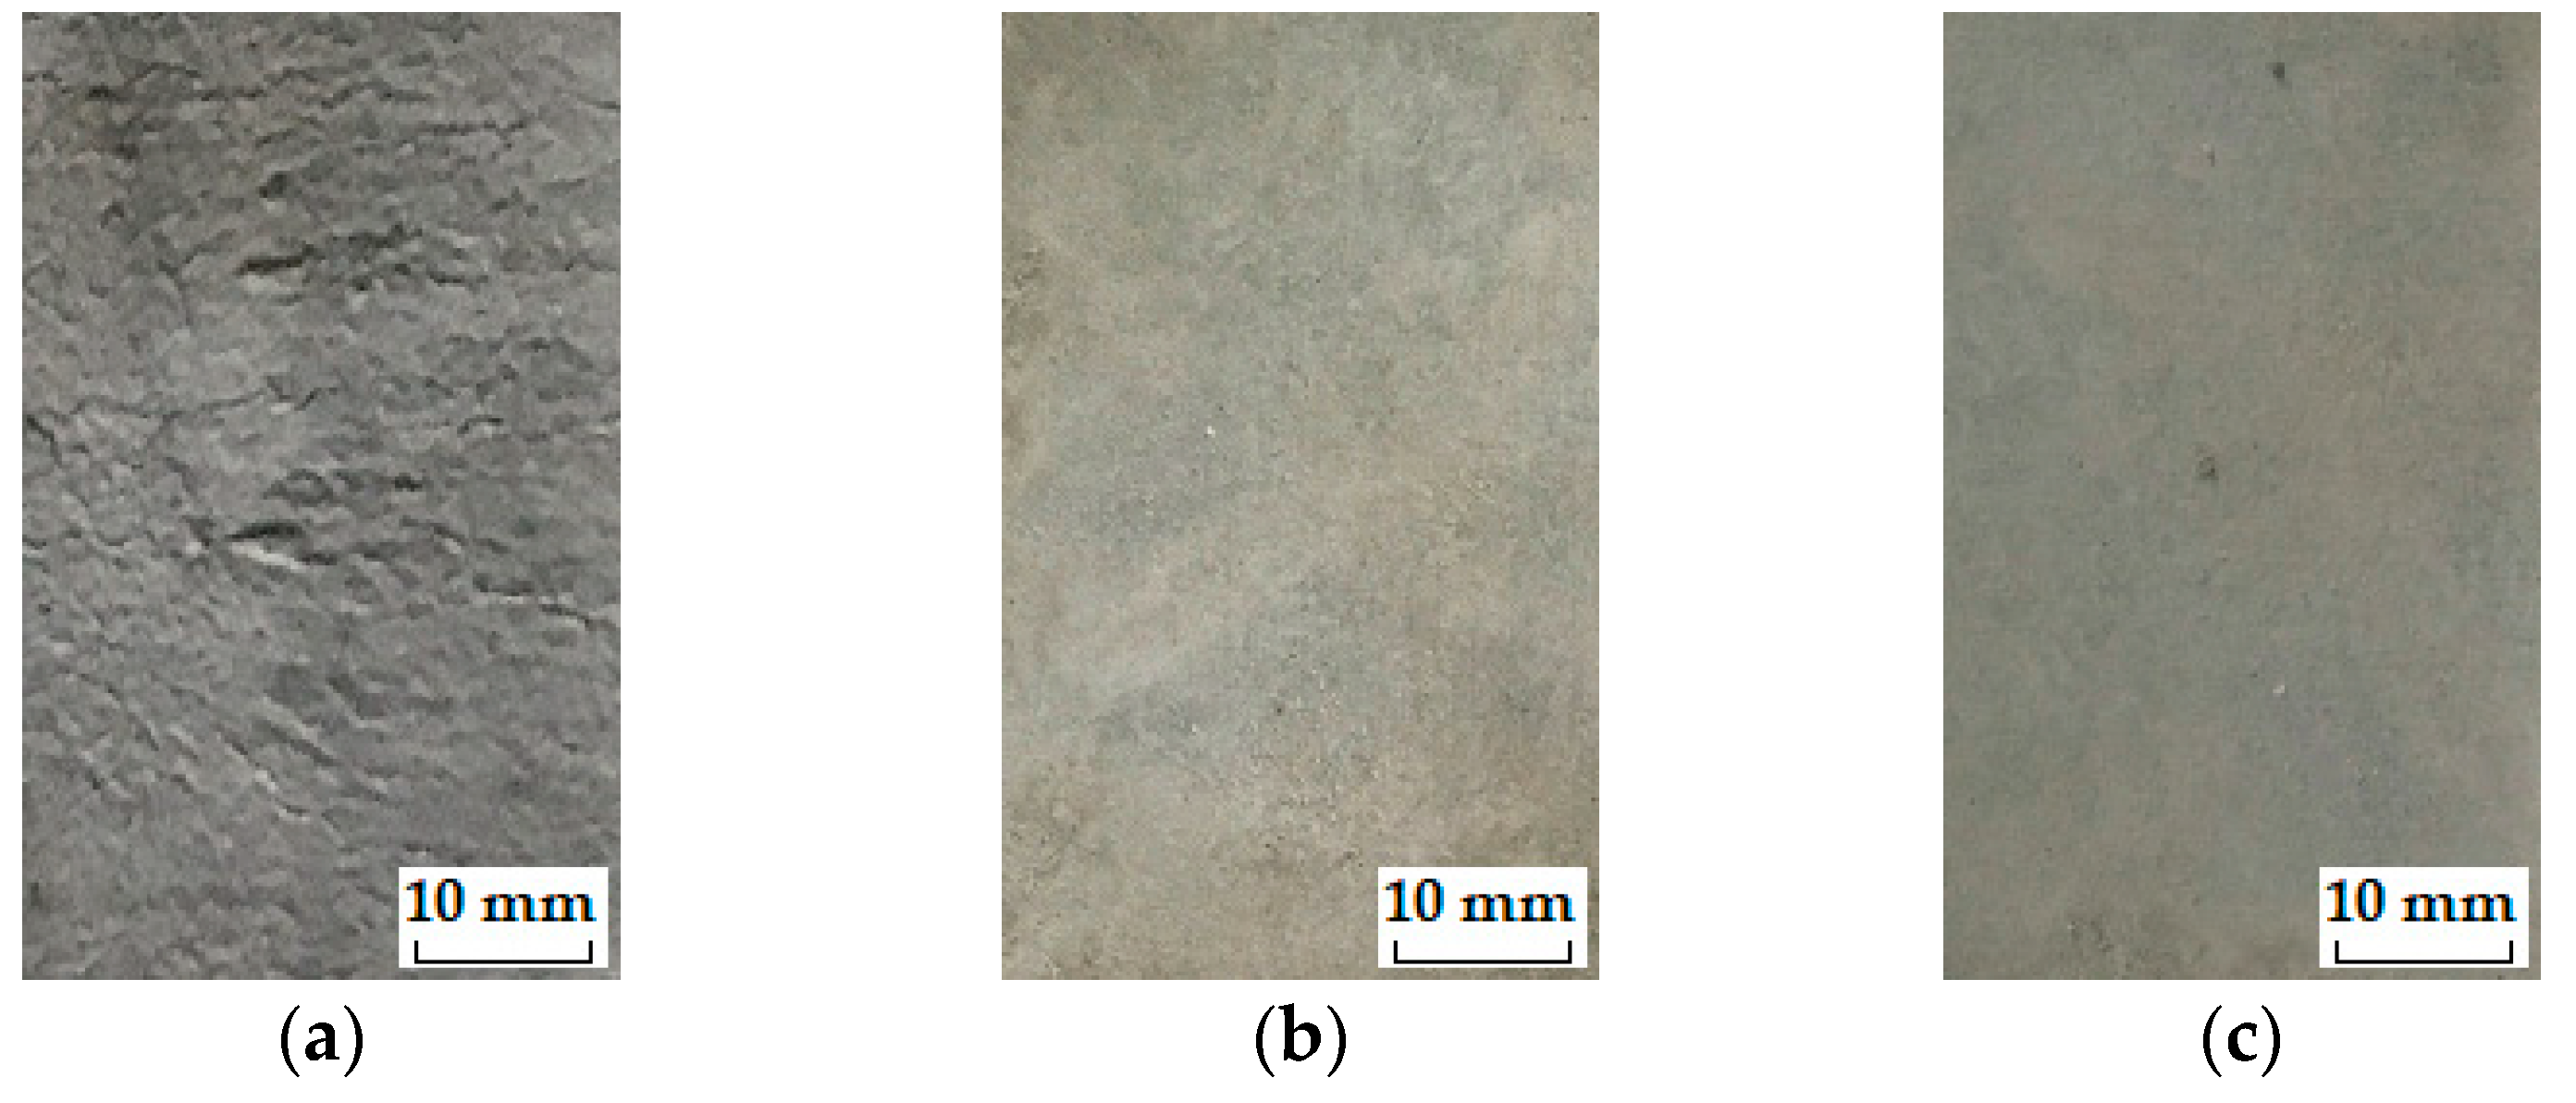
Figure 9. In addition, the ECC mixtures without fibers (Mix. 6) suffer some scaling-off on the surface at the
IF, which is not observed on the fibrous ones (Mix. 4 and 9), as shown in
Figure 12. Normally the plain specimen is cast with more inherent defects, hence spalling is very likely to occur even if the freezing-induced pressures have not been that influential.
The unstable stage. After the
IF, the ECC mixtures experience the greater evolving loss in engineering properties when compared with that in the stable stage, as shown in
Figure 9. Actually, the ECC materials have transited into a stage that is relatively unstable. The residual strain, shown in
Figure 10b, is evidently greater than that of the stable stage, indicating the propagation of micro-cracks. With continuous water supply, the freezing-induced pressures are magnified, and the strain variation mutates immediately after the PF, as shown in
Figure 10b. Meanwhile, another inflexion point for the
η value is found at the PF, as shown in
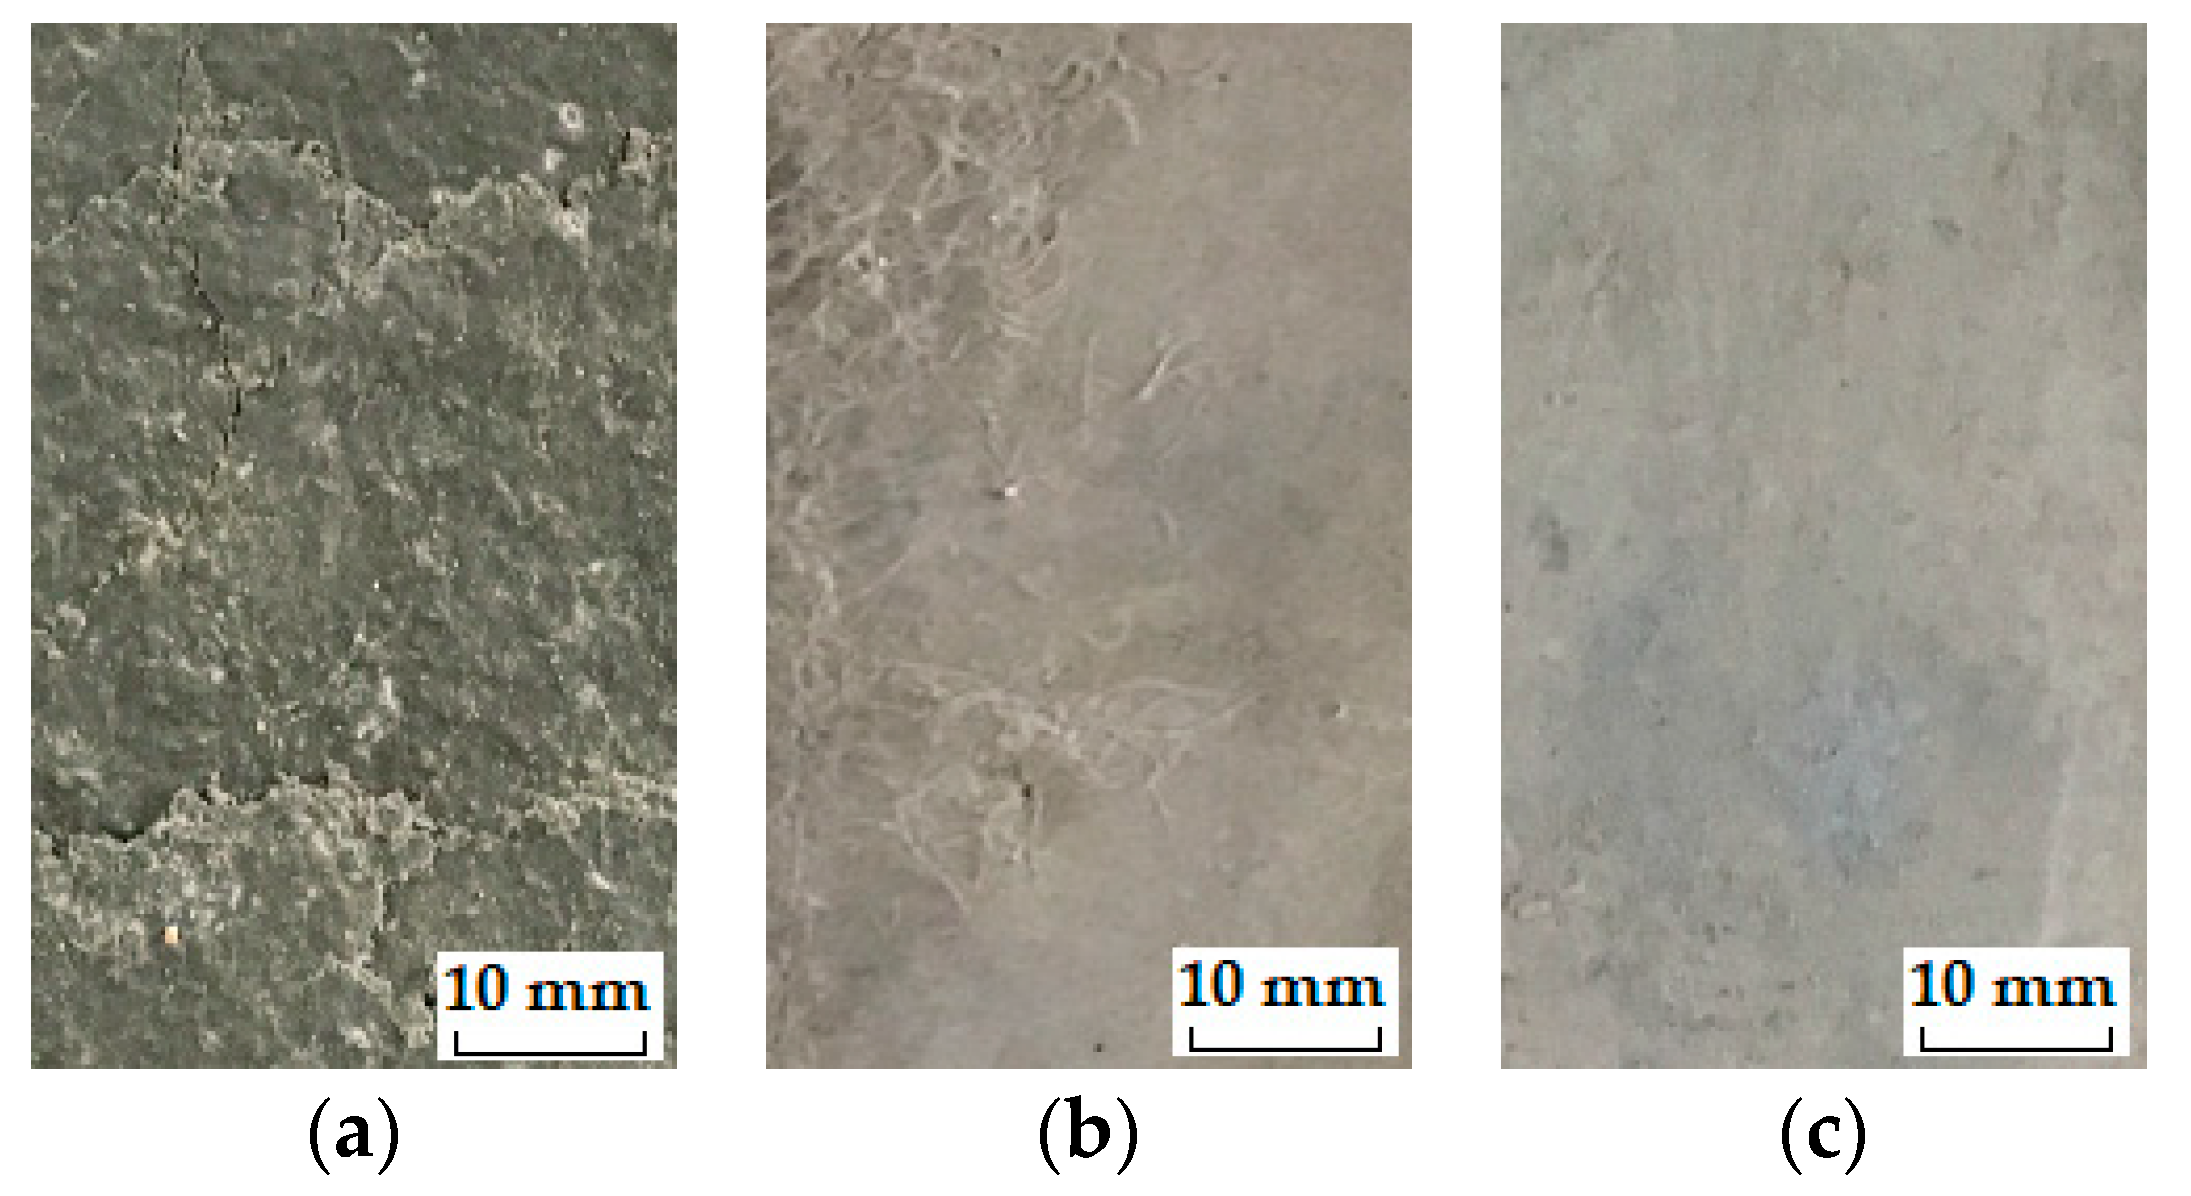
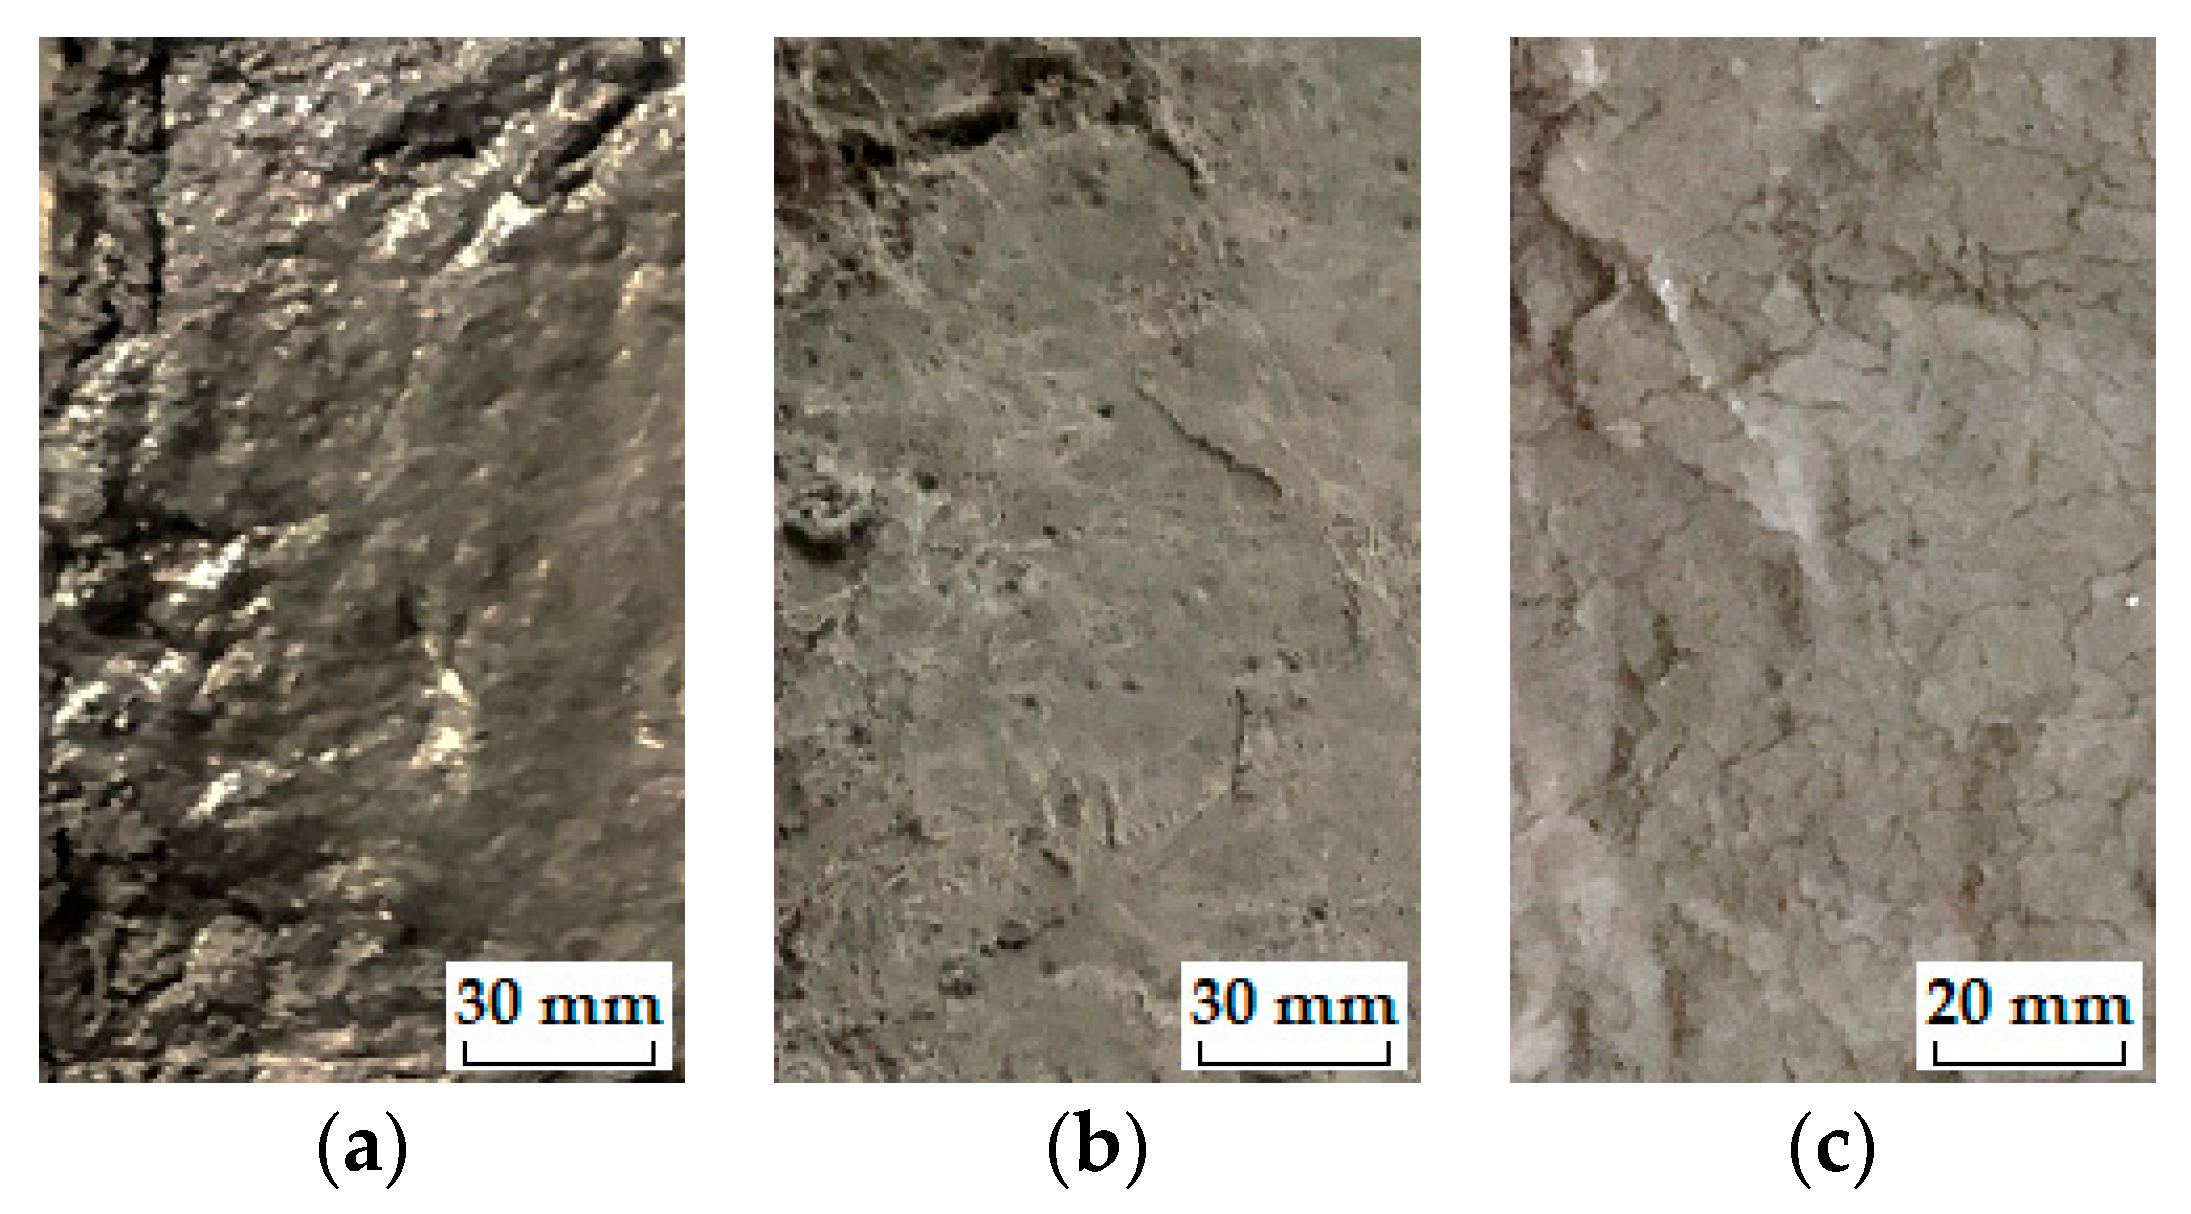
Figure 11. Moreover, the surface scaling is observed on the ECC mixtures reinforced with PVA fibers at the PF, as shown in
Figure 13b,c, yet less noticeable than those prepared without fiber reinforcement, as shown in
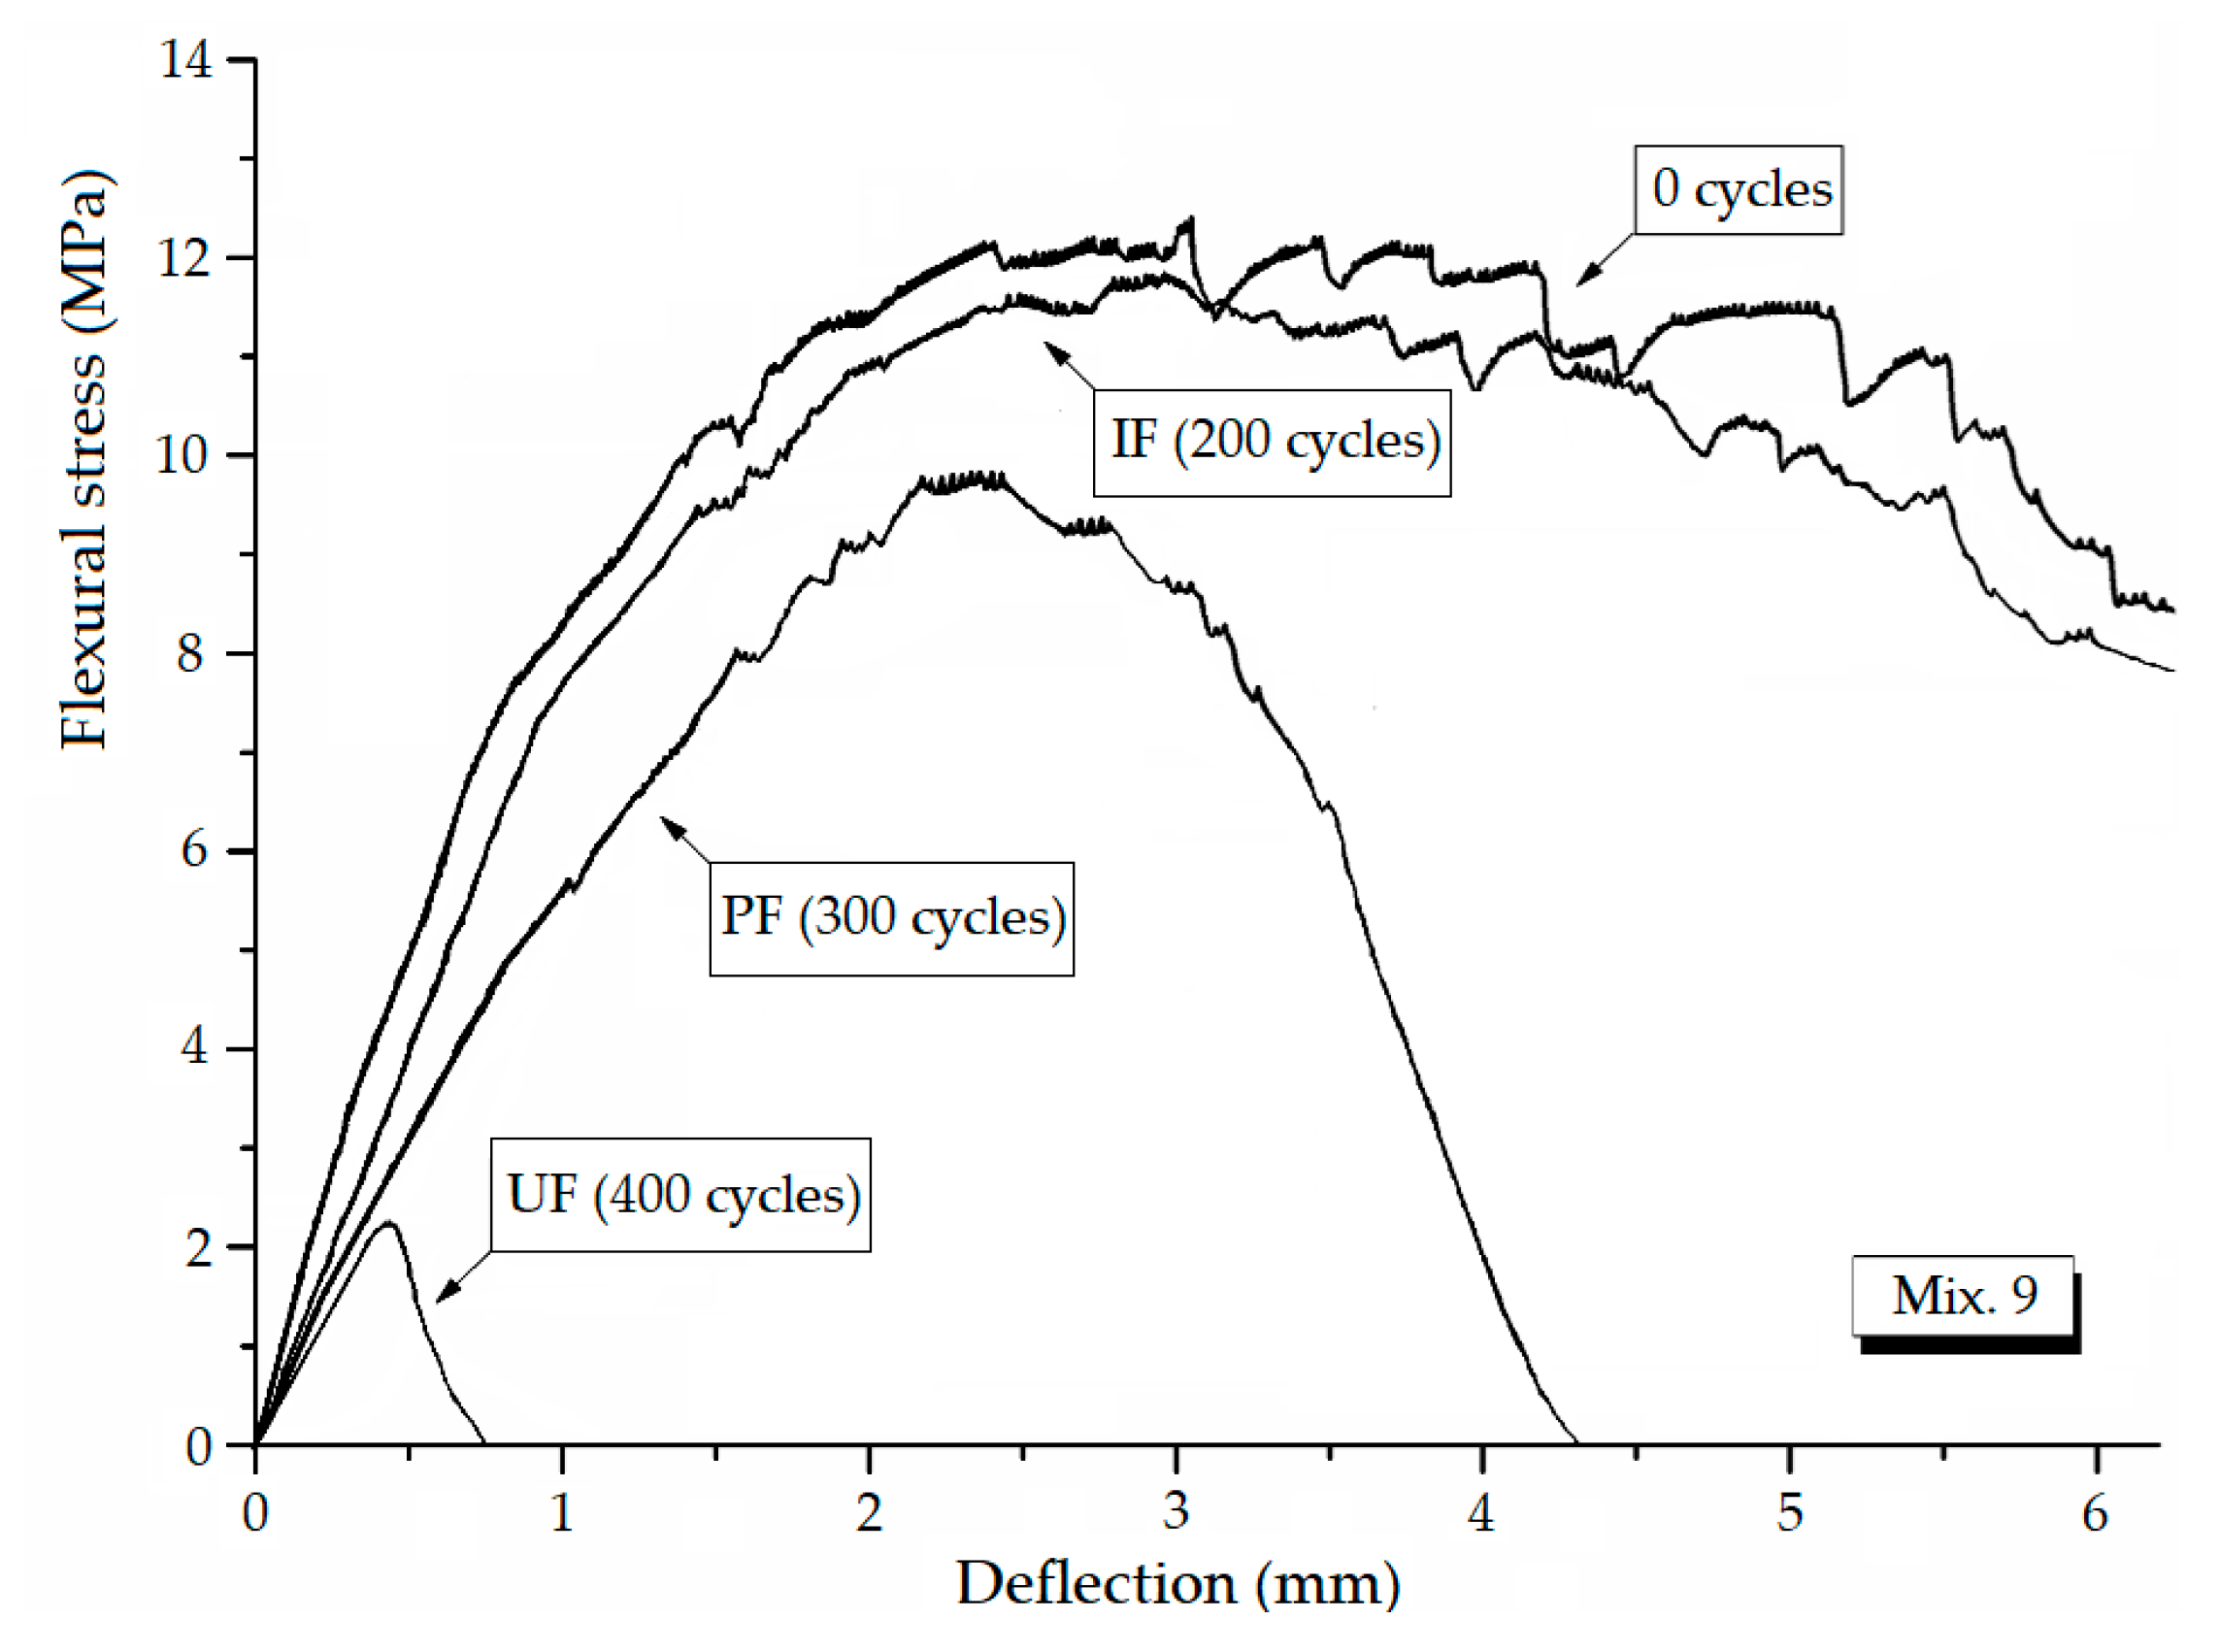
Figure 13a. It implicates that some of the micro-cracks have been connected into networks, thereby forming the macro-cracks. Accordingly, the obvious changes in flexural behavior are found at the end of this stage. The flexural strength decreases, and the energy dissipation capacity is weakened, as shown in
Figure 14.
The yield stage. It can be seen from
Figure 9 that the loss in engineering properties sharply increases after the progressive frost-induced failure, implying that these ECC mixtures go into the yield stage totally different from the previous two. The performance of the ECC materials is declining, due to the massive frost damage during this stage. With the development of freeze-thaw damage, the ECC materials become increasingly porous and permeable. More free water penetrates into the pores and cracks, intensifying the freezing expansion until the occurrence of ultimate failure, as shown in
Figure 15. The freezing-induced pressure is especially great in the later period of yield stage, which makes the ECC matrix produce considerable deformation strain, as shown in
Figure 10c. At the end of this stage, the flexural performance is badly impaired, and the behavior of brittleness is exhibited under the bending load, as shown in
Figure 14.
The ECC’s three-stage working behavior revealed above characterizes the gradual failure process and vividly embodies the essence in the ECC failure evolution under the freeze-thaw influence. Frost-induced failure primarily take place inside the ECC specimens and gradually extend to the exterior (i.e., from micro-cracks to macro-cracks, and finally the destruction). The development of flexural performance loss, DME loss, internal strain and water-freezing effect parameter through different stages reflect the extent to which the freeze-thaw cycles affect the ECC materials.
It can be stated that before and after each individual frost-induced failure point, these ECC mixtures under a certain cyclic freeze-thaw case could belong to different categories with different material characteristics. In this regard, the ECC materials are subjected to impressive damage at the two points, so that the material properties and working behavior have changed in essence for the different stages. The characteristic of ECC materials working in the unstable stage is the micro-cracking at the first failure point and the growth of micro-cracks afterwards. The ECC materials with micro-cracks can still withstand freeze-thaw damage and the span of the unstable stage is extended because of the effectiveness of PVA fiber reinforcement. All these facts are the reflection of the generalized ‘toughness’ brought about by PVA fibers under the influence of freezing and thawing.
Furthermore, these two updated frost-induced failure indices (IF and PF index), along with the UF index, can be developed into a three-level evaluation model assisting the anti-frost design for ECC materials, as well as other cement-based materials. Under this mode, the materials are designed orienting the requirement from a certain level (IF, PF or UF index) depending on their specific use. In other words, the materials prepared for the crucial civil infrastructures are highly recommended to be designed using the IF index as the control level. And the PF index can be employed as the control level for the civil infrastructures of less importance whilst the UF index can be used for common constructions.
3.5. Influence of Multi-Factors on the Performance Characteristics
It is necessary to study how the flexural strength and frost-induced failure indices are affected by different mix design factors. The statistical performance measure of signal-to-noise (S/N) ratio, instead of the average observed values, has been employed to interpret the test data into a value deemed to be the quality response. The S/N ratio is transferred from the loss function, which is introduced to calculate the deviations between the test value and the desired value to evaluate each independent factor or their interaction on the evaluated performance [
43]. The Taguchi method typically provides the S/N ratio with three varieties of quality responses available [
44]. Given that the maximum responses (flexural strength and frost-induced failure indices) are desired, the larger-the-better quality response is applicable for the performance characteristics evaluated herein. The S/N ratio is logarithmically formulated as,
where,
n indicates the number of observations and
y represents the results of the measurement.
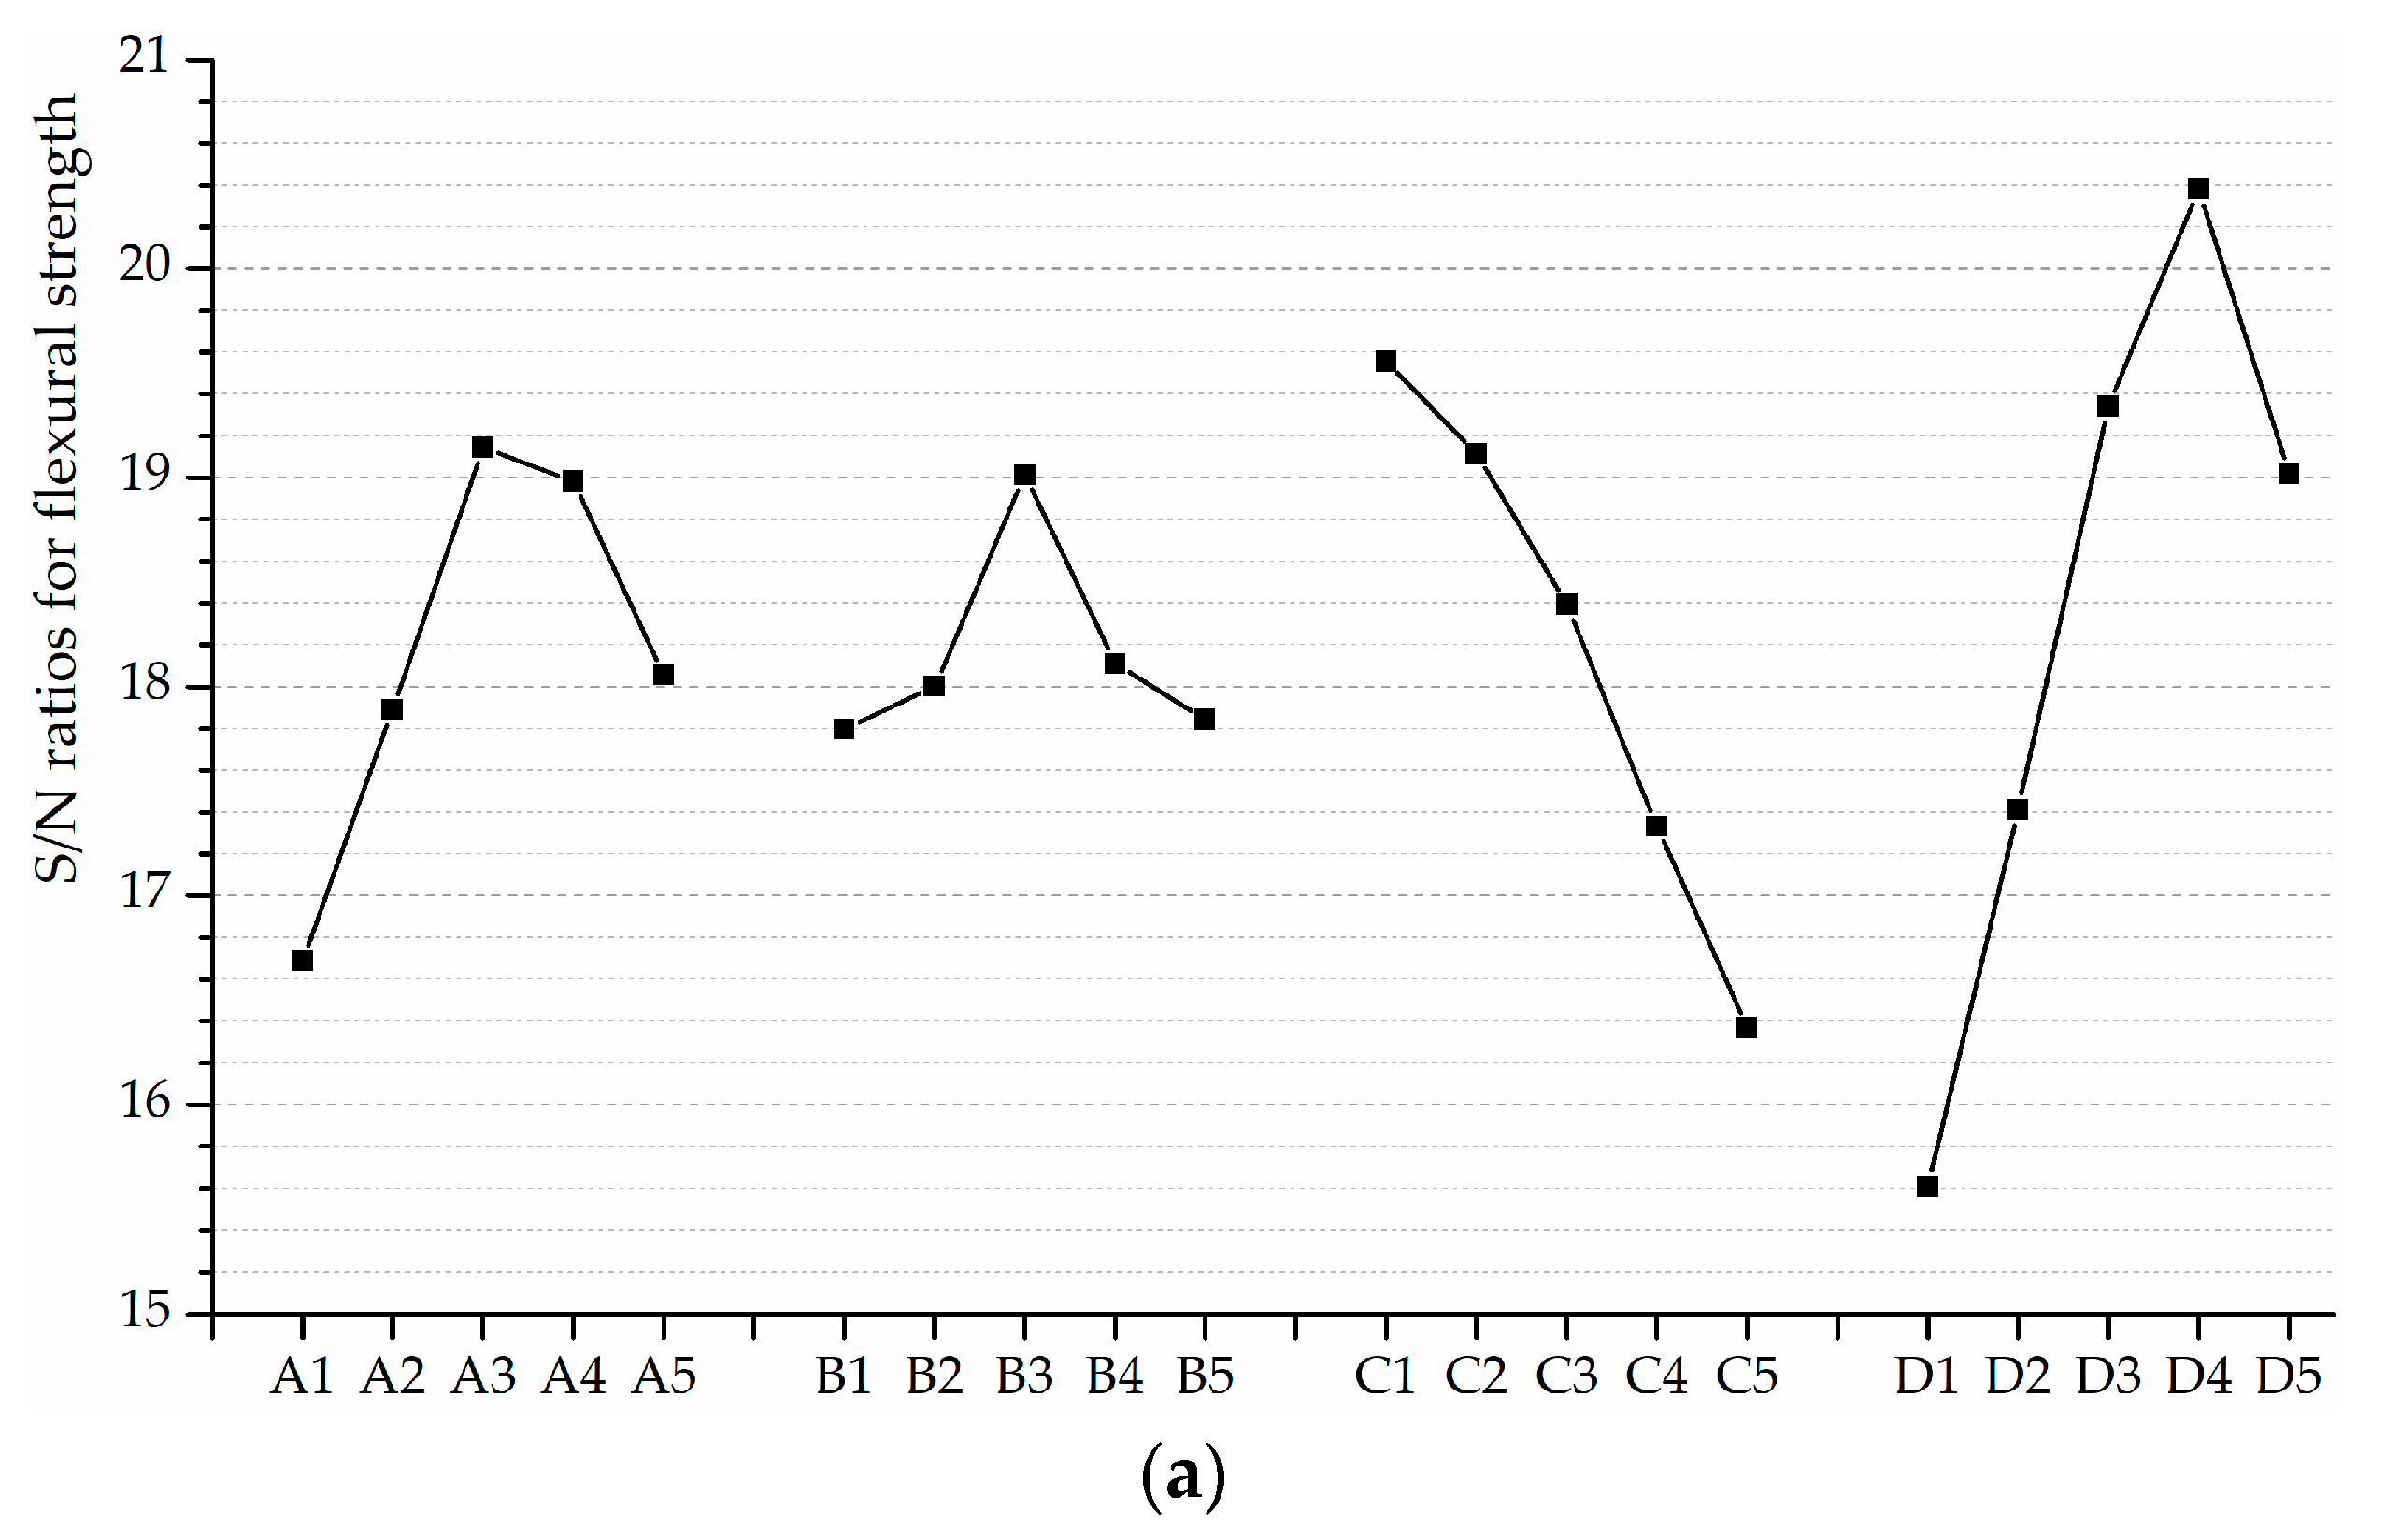
As shown in
Figure 16a, the higher
W/
B has a negative effect on the flexural strength. The flexural strength of ECC is enhanced by 0.5~2 vol.% of the PVA fiber reinforcement. It is attributed to the micro-cracking resisting effect of PVA fibers. Nevertheless, there is a tendency of strength degradation resulting from the blending of fibers. Excessive fibers are likely to worsen the density of specimens, which could interpret the decrease in the flexural strength occurs at the
VPVA beyond 1.5%. Besides, the flexural strength of ECC can obviously benefit from a moderate level of
FA (around 0.35) and
S/
B (around 0.5).
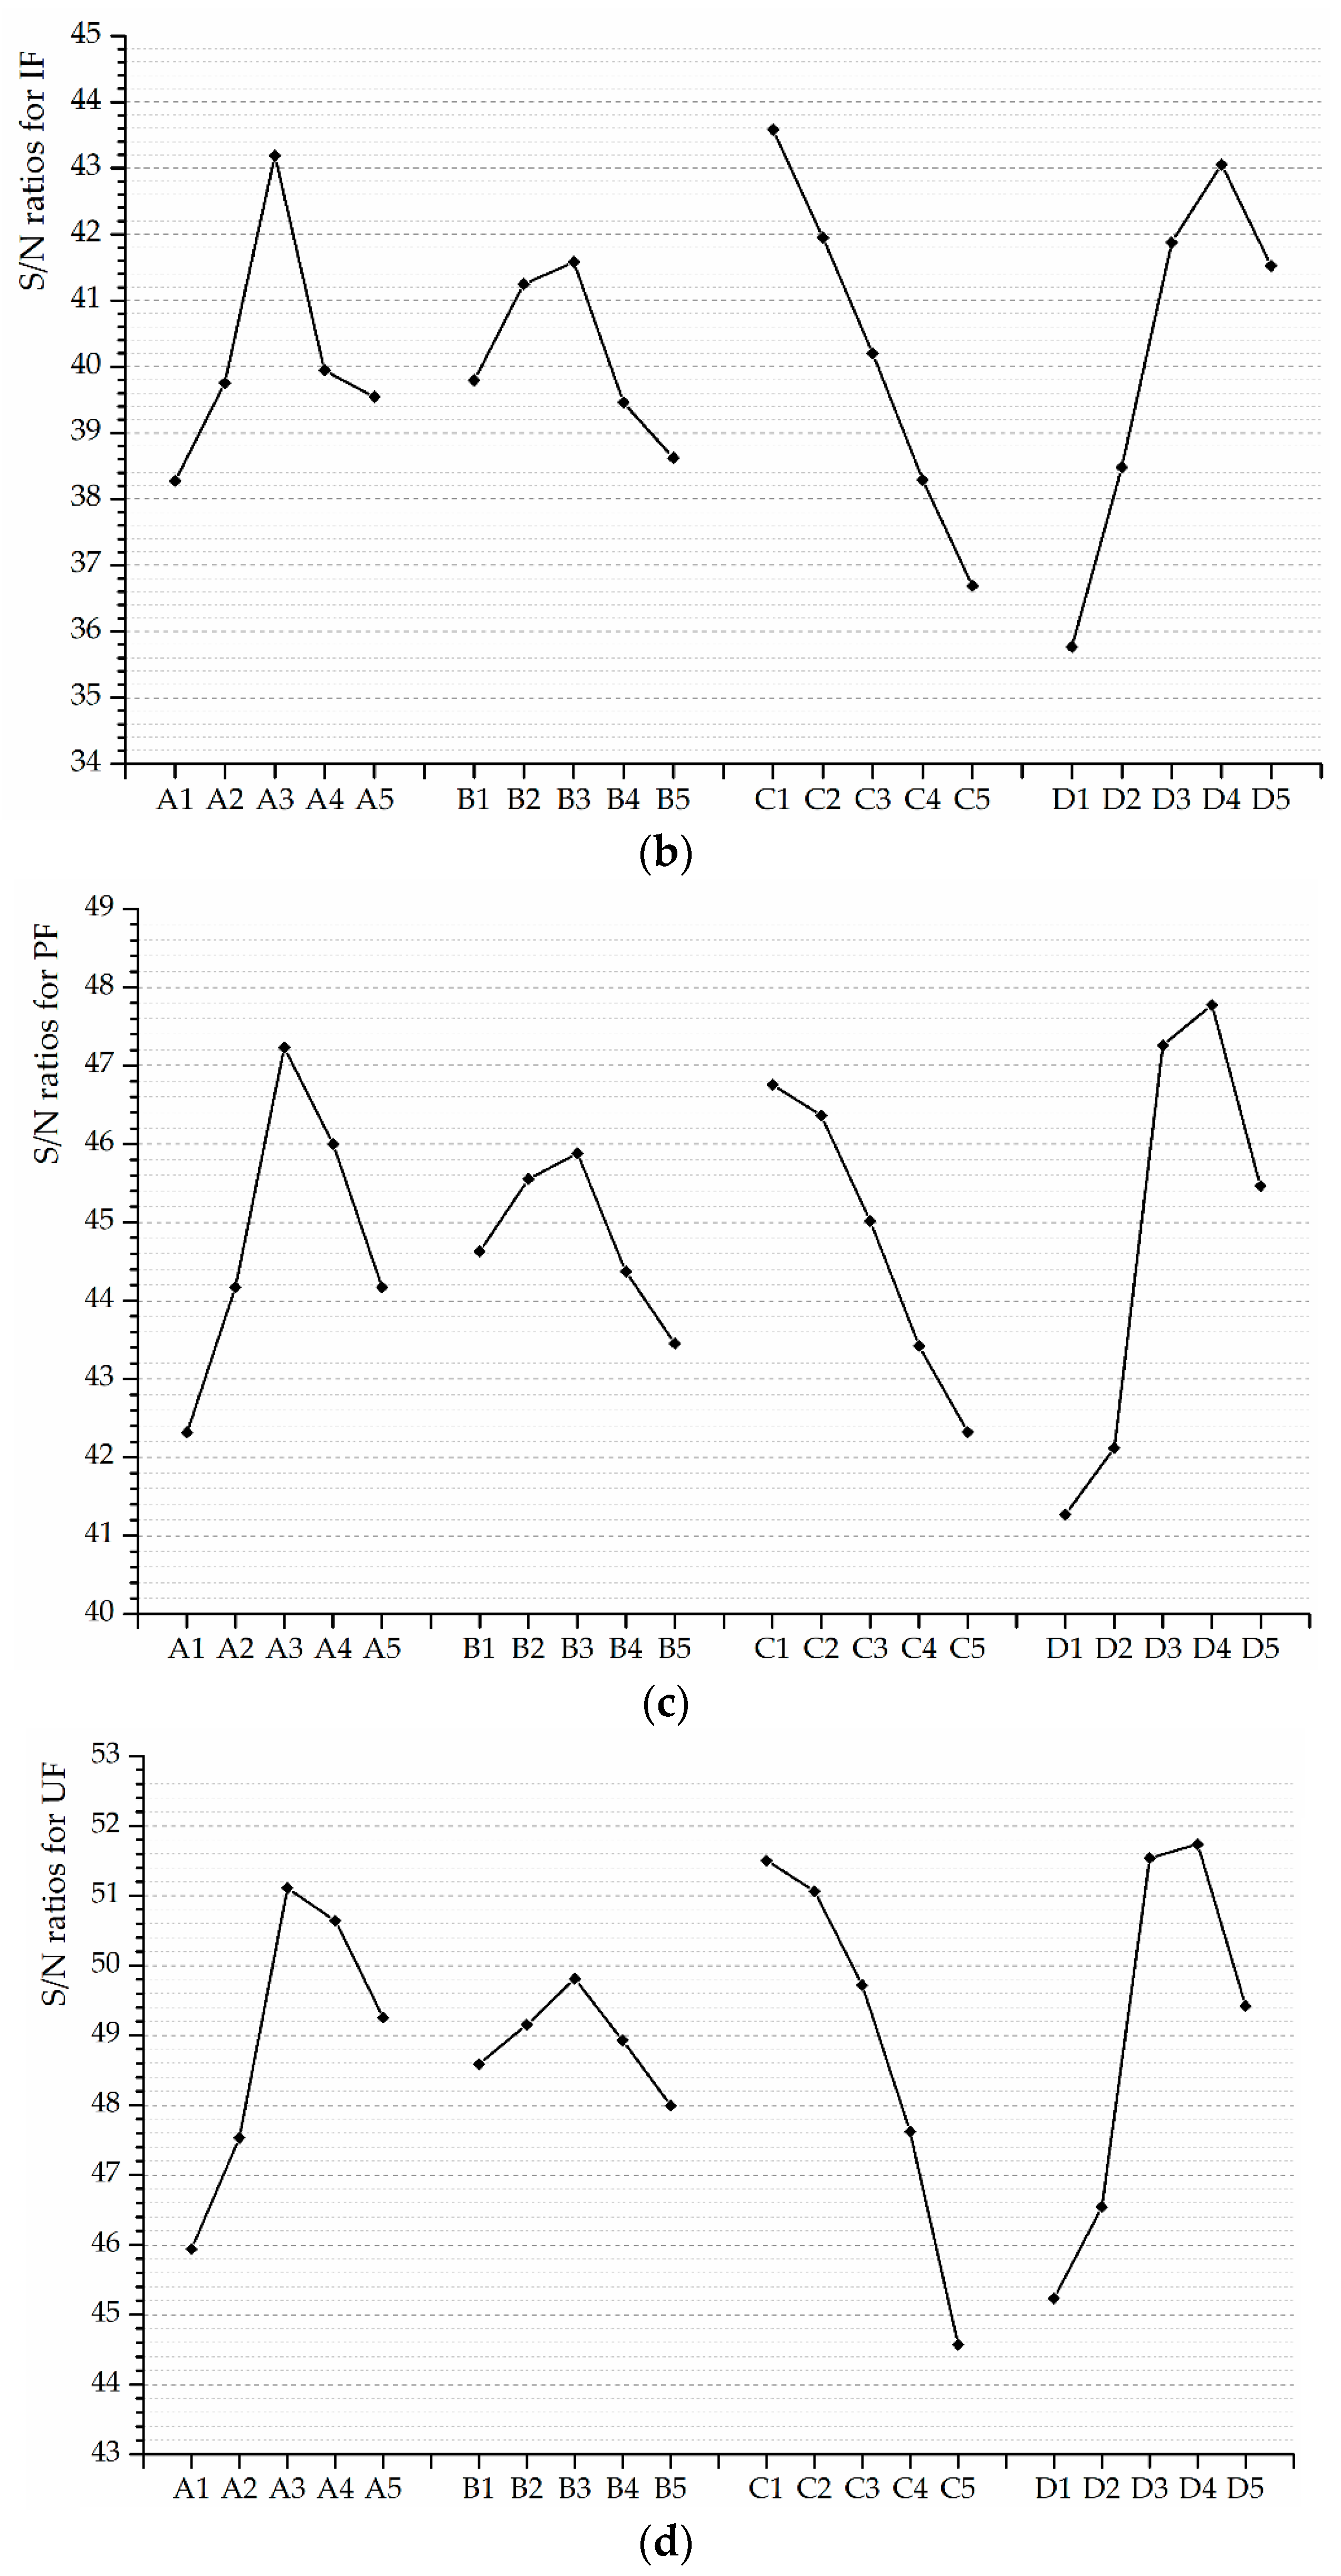
The dependences of these frost-induced failure indices on various factors are plotted in
Figure 16b–d. It is observed that all the indices decrease with the increasing of
W/
B. The more water added during the mixing procedure leads to the earlier occurrence of frost-induced failure, as the porosity characteristics is worse. The promotion to the freeze-thaw resistance is found in the presence of PVA fibers with the volume fraction between 0.5~2.0%. The updated frost-induced failure and the ultimate failure are delayed substantially as a result of PVA fiber reinforcement. The air-entraining and pressure-release effect of PVA fibers facilitate ECC materials to slow the formation of micro-cracks and work in the stable stage for a relatively long period. Even in the unstable stage, the micro-cracks can be bridged by PVA fibers as an effective way to mitigate crack growth. However, a small reduction in the indices is observed in ECC with 2.0 vol.% of PVA fiber reinforcement. It could be explained that excessive fibers are detrimental to their dispersion in fresh cementitious composites, which impairs the density of hardened materials.
As shown in
Figure 16b–d, the substitution of fly ash up to 35% is the most beneficial to the freeze-thaw resistance. The pozzolanic reaction between fly ash and calcium hydroxide generated from the hydration of cement results in the improvement in porosity characteristics. Additional fly ash is consumed by the pozzolanic reaction with aging, which helps to reduce the size and amounts of capillary pores. Consequently, the obvious rise in PF and UF indices is found at
FA = 0.525, as shown in
Figure 16c,d. However, the calcium hydroxide would become insufficient for the pozzolanic reaction if too much cement is replaced by the fly ash. That is why the decline of indices is observed at
FA = 0.7. Moreover, reasonable sand content favors the workability of fresh cementitious composites so that adequate density and strength can be gained before the frost exposure. However, the increase of
S/
B simultaneously decreases the paste ratio, thereby leading to the decline in failure indices, as shown in
Figure 16b,d.
The higher frost-induced failure index indicates the later occurrence of frost-induced failure, i.e., the better freeze-thaw resistance. The optimum mix formulation is deemed to be reachable where each individual factor achieves the highest frost-induced failure indices, namely, to unite the levels of the highest S/N ratios. Therefore, the optimum freeze-thaw resistance mix formulation recommended in this investigation is: A3B3C1D4 (FA: 35.0%, S/B: 0.5, W/B: 0.25, VPVA: 1.5%). This mix formulation is estimated to provide the optimum resistance against frost-induced failure because of the highest IF, PF and UF indices. Besides, some parameters are of little benefit to the performance characteristic (e.g., the 0.25 for S/B, 0.5 for W/B, 0 and 0.005 for VPVA) on account of their low S/N ratios. They are consequently not the ideal selection for the mix design of ECC materials.
3.6. Analysis of Variance
The analysis of variance (ANOVA) is used to perceive the relative importance of each mix design factor. This approach defines
DF as the degree of freedom and
SS as the sum of squares for a given variable. Therefore, the mean square (
MS) is formulated as,
The statistical method of F-test is applied to present the significance of each factor. The statistic
F-value can be calculated as follow,
where
MSf and
MSe are the mean square (variance) for the individual factor and error, respectively. Therefore, the
p-value is determined by,
where
DFf and
DFe are the degree of freedom for the individual factor and error, respectively. The ANOVA is implemented by Minitab 17 and the results are summarized in
Table 5,
Table 6,
Table 7 and
Table 8 using the 95% confidence level. The symbol “O” and “X” denote the significant and insignificant factor, respectively.
Based on the analysis of variance, FA, W/B and VPVA are identified as the significant factors for raising the flexural strength and frost-induced failure indices. The influence of S/B is found to be insignificant, as its F-values are lower than the critical value (3.84) and p-values are lower than 0.05. As the higher F-value represents the greater significance, the ranking of the mix design factors for the flexural strength, IF and PF indices is: VPVA > W/B > FA > S/B, and W/B > VPVA > FA > S/B for the UF index.
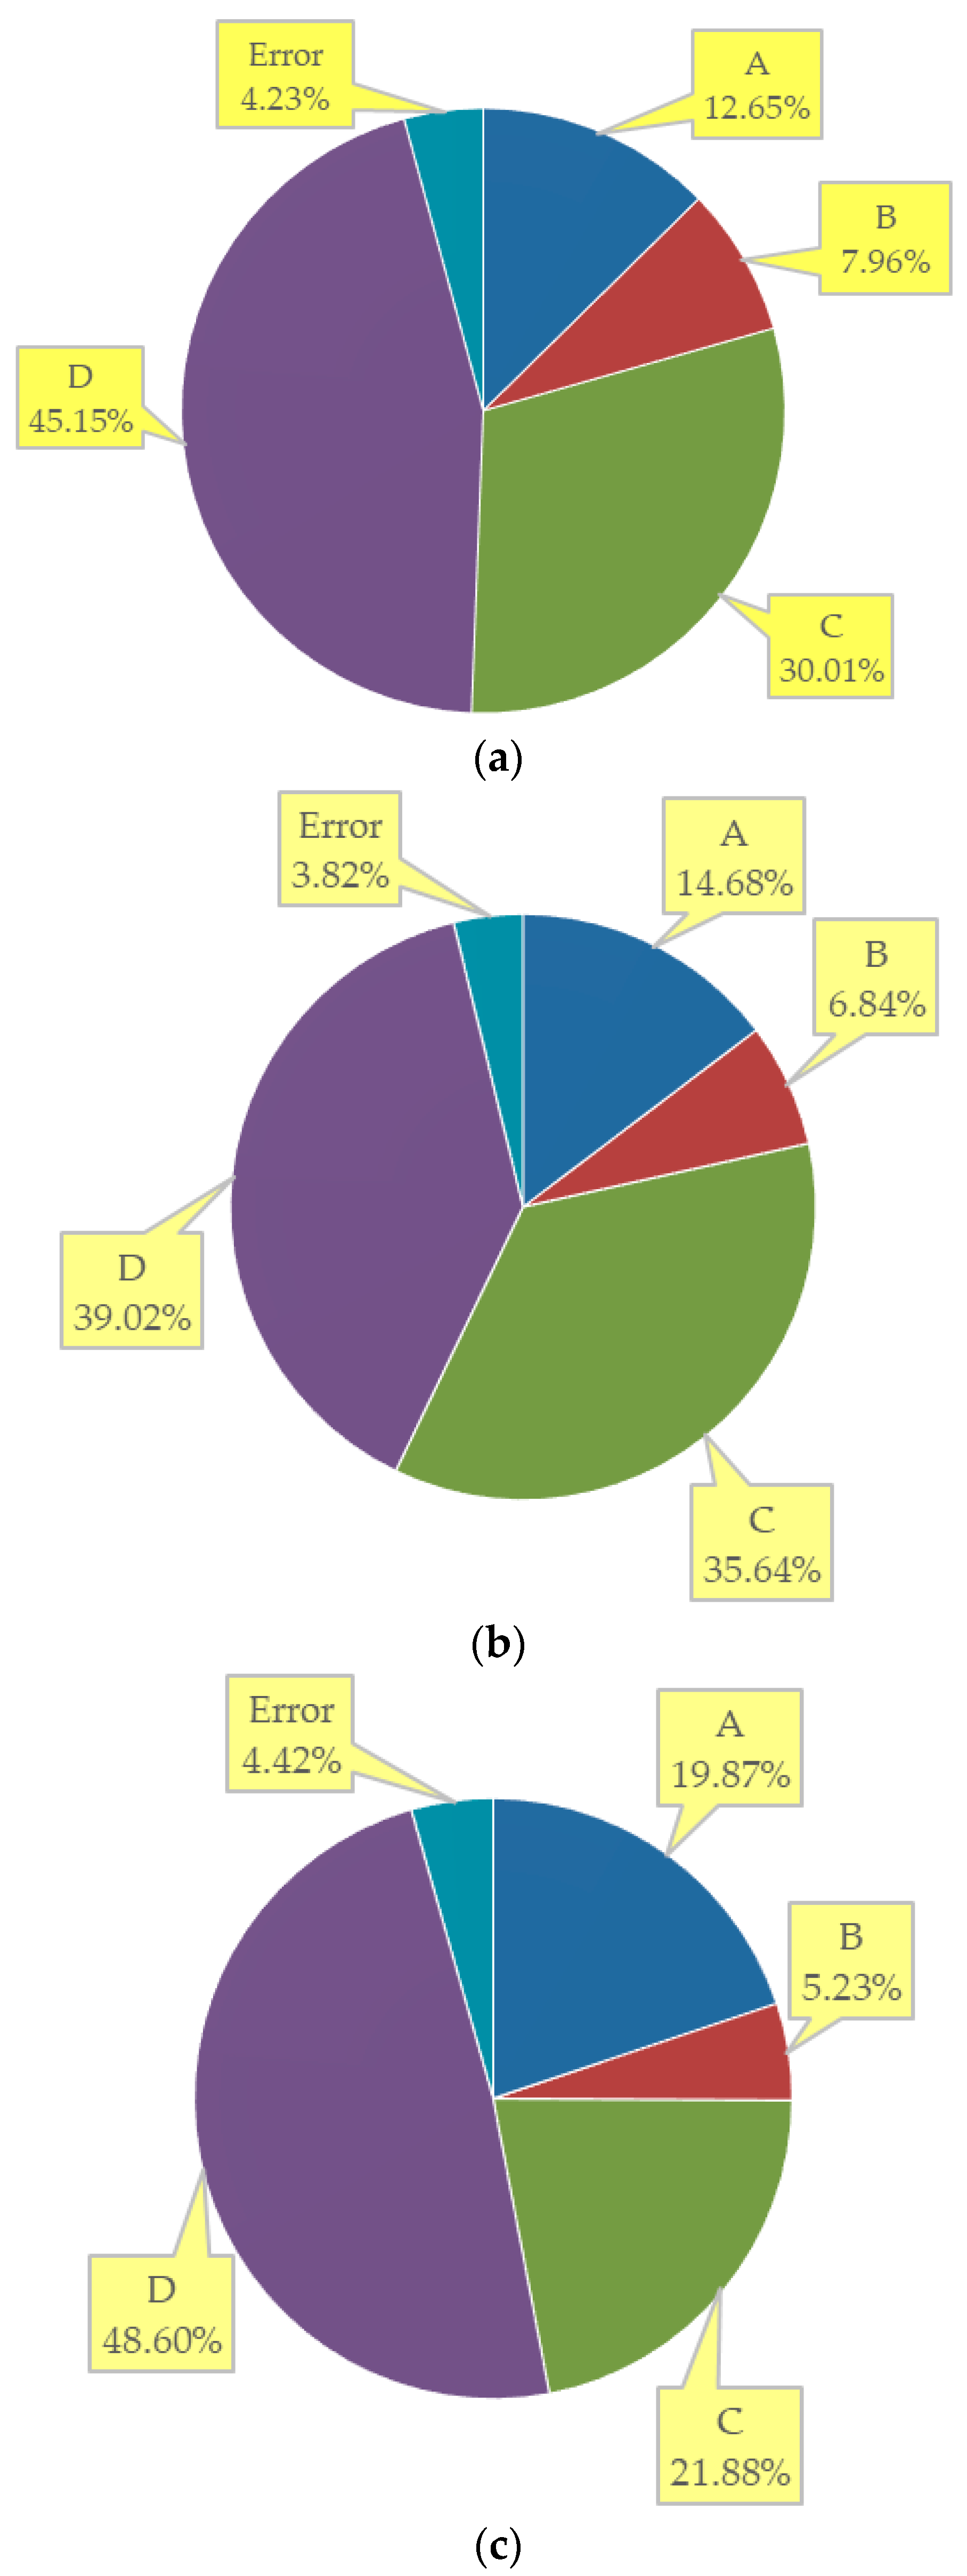
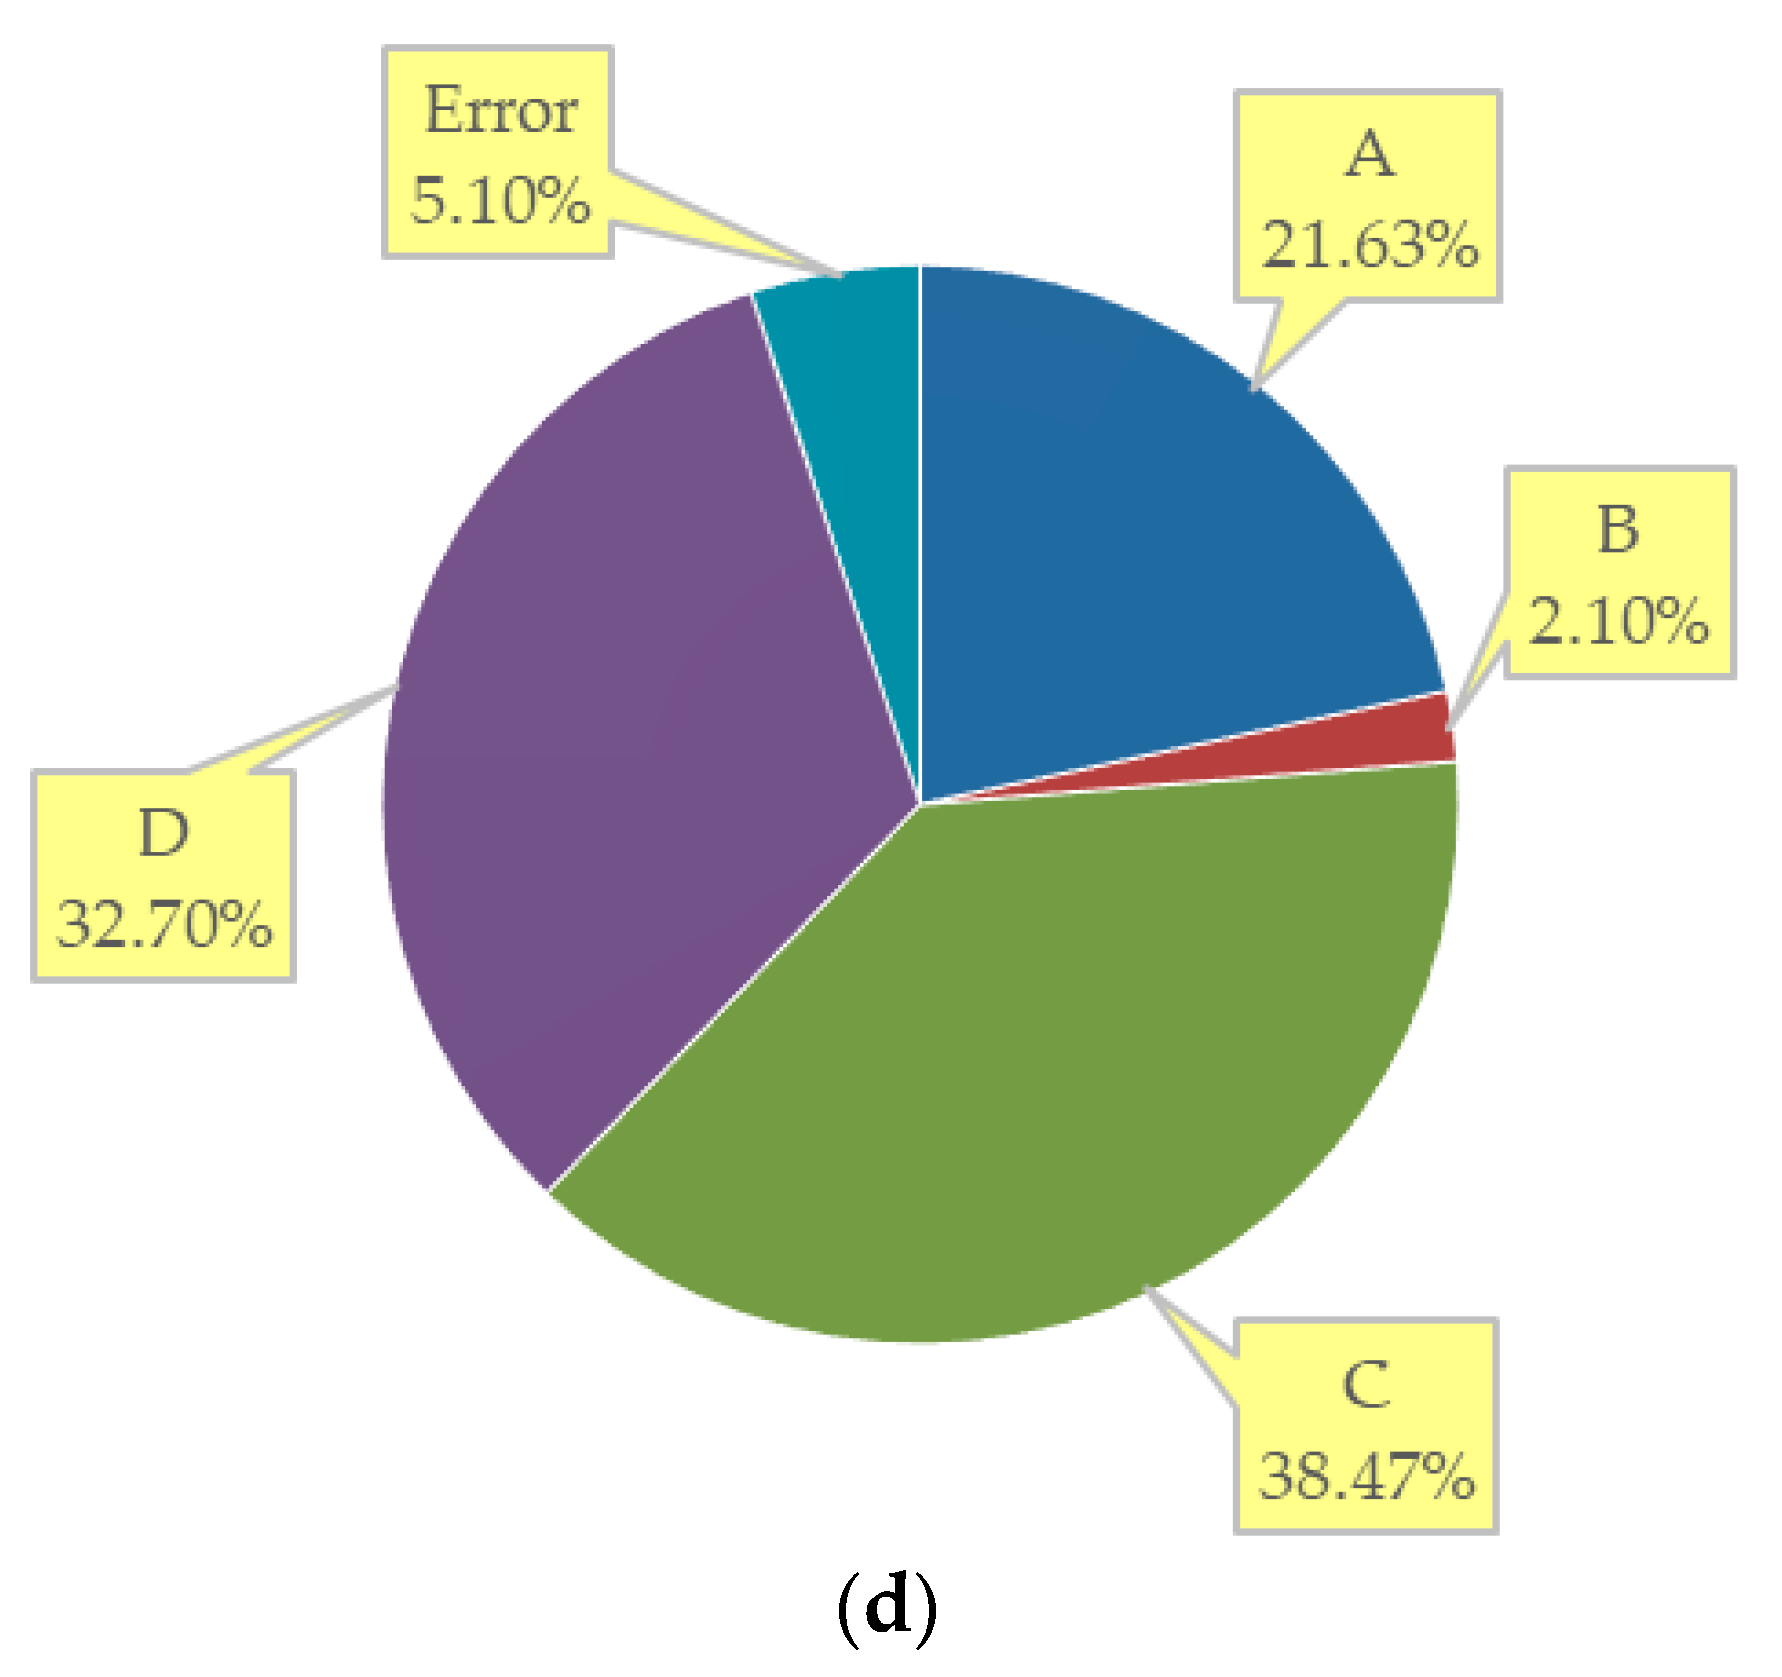
Figure 17 presents the contribution ratio of each factor individually. The
VPVA makes the most contribution to the flexural strength as expected (45.15%), followed is the
W/
B (30.01%). Either of the two factors provides the ratio exceeding the sum of
FA and
S/
B (20.61%). In terms of the IF index, the
VPVA is observed to account for the highest percentages underneath the total contributions which achieves 39.02%. Furthermore, the contribution of PVA fiber reinforcement to resist the PF is more impressive (48.60%), implying the merits of PVA fibers as an effective reinforcement system for enhancing the freeze-thaw “toughness” of the ECC materials. The
W/
B contributes 38.47% to the UF index, more than that obtained with any other factors. The contribution ratios of
FA are 14.68%, 19.87% and 21.63% respectively, implying that finer fractions of the fly ash are conducive to the freeze-thaw resistance. It could be attributed to the relatively significant effect of water-to-binder ratio, the volume fraction of PVA fibers and ground fly ash content on the development of strength and density prior to the frost exposure.
3.7. Confirmation Experiment
Since the optimum mix formulation (A3B3C1D4) inferred from the analysis on the influence of multi-factors is not included in the
L25 orthogonal array, it is necessary to confirm the actual values of frost-induced failure indices for this formulation. Specimens are prepared following the combination of
FA (35%),
S/
B (0.5),
W/
B (0.25) and
VPVA (1.5%), and then subjected to the rapid freeze-thaw test. The tests of fundamental transverse and flexural strength are conducted after every 25 cycles. The results regarding the loss rates of DME and flexural strength are used in the trend analysis by the M-K criterion. The tested values for the IF and PF indices are thus determined. Meanwhile, the frost-induced failure index for the mix formulation (A3B3C1D4) is estimated by,
where
is the average value of the failure index;
,
,
and
are the means of failure indices corresponding to mix design factors at their respective optimal levels;
FE denotes the estimated value of the failure index. With the reliability of the condition assumed to be 95%, the confidence interval can be calculated, as follows [
45],
where
F0.05(1,
fe) is the
F-value for the confidence interval of 95% with
fe referring to the errors’ freedom degree;
Ve is the error variance;
S is the number of replications for confirmation experiments;
N is the total number of experiments;
Tdof is the total degrees of freedom associated with the estimated value.
The experimental and estimated values for the frost-induced indices are summarized in
Table 9. It is evident that the experimental values are well within the 95% confidence interval.


