Abstract
In this study, we demonstrate how Zn and Sn influence hardening behavior and cluster formation during pre-aging and paint bake treatment in Al–Mg–Si alloys via hardness tests, tensile tests, and atom probe tomography. Compared to the standard alloy, the Sn-modified variant shows reduced cluster size and yield strength in the pre-aged condition. During the paint bake cycle, the clusters start to grow very fast and the alloy exhibits the highest strength increment. This behavior is attributed to the high vacancy binding energy of Sn. Adding Zn increases the formation kinetics and the size of Mg–Si co-clusters, generating higher yield strength values for both the pre-aged and paint baked conditions. Simultaneous addition of Zn and Sn creates a synergistic effect and produces an alloy that exhibits moderate strength (and good formability) in the pre-aged condition and accelerated hardening behavior during the paint bake cycle.
Keywords:
Al–Mg–Si alloy; Zn; Sn; paint bake; Al–Mg–Si–Zn–Sn alloys; cluster formation; hardening behavior 1. Introduction
Al–Mg–Si alloys (6xxx series) are characterized by medium to high strength, high fracture toughness and good resistance against corrosion and stress corrosion cracking. They also feature good weldability [1,2]. For these reasons, Al–Mg–Si alloys are widely used for components in various applications. Due to their good recyclability and the excellent formability of sheet materials in the T4 condition, they are particularly attractive for the automotive industry [3,4]. Modern automotive sheet alloys are designed to harden during the so-called paint bake cycle (PBC), where the complete car body is heated to elevated temperatures for a limited period. Both a pronounced increase in strength during the PBC and a reduced tendency for natural aging (NA) prior to the PBC must be ensured. Recently, an attempt was made to reduce the paint bake temperature in order to realize polymer-based components and save energy.
Diffusion processes and the resulting cluster formation directly after quenching are known to cause natural aging in Al–Mg–Si alloys. This produces an undesirable increase in strength, a decrease in formability, and a reduction in age hardening potential [5,6,7]. To counteract these effects, a pre-aging heat treatment procedure is usually performed. This is typically carried out immediately after quenching at temperatures between 60 and 200 °C [8]. According to Zhen and Kang [9], pre-aging is assumed to suppress negative cluster formation during natural aging, but generates a high number density of β′′ phase nuclei, stimulating the subsequent paint bake response. An alternative method for suppressing the natural aging effect was recently presented by Pogatscher et al. [10,11,12]. Their studies showed that adding Sn inhibits cluster formation and improves subsequent artificial aging. This effect is attributed to the trapping of vacancies by Sn atoms at low temperatures. At elevated temperatures, i.e., during the PBC, Sn releases the vacancies and fast non-equilibrium diffusion is enabled. This desirable Sn addition effect, called “diffusion on demand” [10], has been confirmed by other authors [13,14,15,16].
While it is desirable to retard the kinetics of cluster formation at room temperature, the reverse is true for artificial aging. For paint bake hardening, using Zn additions in Al–Mg–Si alloys has proven to be an effective approach [17,18,19,20]. Saito et al. [21] showed that hardness increases after ageing at 185 °C if 1 wt % Zn is added to an Al–Mg–Si alloy. They detected an increased number density of needle-shaped precipitates from the Al–Mg–Si system, but no phases containing zinc. Guo et al. [18] carried out DSC measurements on Al–Mg–Si alloys with varying Zn content. They observed a shift of the precipitation peak at 250 °C, known as the β′′-peak, to lower temperatures when 3 wt % Zn was added. They also reported that the type of precipitate is not affected by Zn addition, i.e., no Mg–Zn precipitates were observed [18].
In this study, the above approaches of adding Sn to retard natural aging and alloying Zn to promote aging in the paint PBC were combined in various experimental alloys to investigate hardening behavior and cluster formation during pre-aging and PBC. Four different experimental alloys were investigated: (1) standard Al–Mg–Si as reference; (2) Al–Mg–Si with Zn addition; (3) Al–Mg–Si with Sn addition; and (4) Al–Mg–Si with both Zn and Sn addition. Via hardness and atom probe tomography (APT) measurements, we characterized and evaluated the influence of the alloying elements individually and in combination.
2. Materials and Methods
The alloys were produced by gravity casting at AMAG Rolling GmbH, Ranshofen, Austria. The Al–Mg–Si base alloy with different additions of other elements were melted in an induction furnace and then cast into preheated gravity dies to obtain ingots with a size of 170 × 80 × 40 mm3. Subsequently, the ingots were homogenized in a two-step procedure at temperatures of 540 and 565 °C. Afterwards they were first hot- and then cold-rolled to 1.5 mm thick sheets. The solution heat treatment took place in an air furnace at 560 °C for 15 min, and was followed by water quenching. Subsequently, the sheets were pre-aged at a temperature of 110 °C for 5 h (denoted as the “T4P” condition). Afterwards, 2% of pre-straining was applied. Half of the samples were tested in this condition and the other half was subjected to a modified paint bake hardening treatment/cycle (PBC) at a reduced temperature of 165 °C for 20 min (“T6P” condition). The alloy with Zn and Sn additions was also overaged to the “T7” condition at 170 °C for 120 h.
The nominal compositions of the experimental alloys are listed in Table 1. It should be noted that all alloys exhibit the same Mg and Si levels and differ only in their Zn and Sn content.

Table 1.
Composition of experimental alloys in wt %.
To analyze the hardening behavior during pre-aging and PBC, Brinell hardness measurements were carried out on a Diatestor 2 RC (Wolpert, Aachen, Germany). A ball diameter of 2.5 mm, a load of 306 N (31.25 kp) and a dwell time of 10 s were applied according to DIN EN ISO 6506-1. Tensile tests were also performed on an Inspekt 250 (Hegewald & Peschke, Nossen, Germany) machine according to EN ISO 6892-1 to analyze mechanical properties.
To analyze the clustering behavior at the atomic scale, APT measurements were conducted. For this purpose, small 15 × 15 mm² samples were ground to a thickness of 0.5 mm. Then, small rods of 15 × 15 × 0.5 mm3 were cut from these sheets and electropolished using a standard two-step method to form a small tip. First, we performed “rough polishing” with an electrolyte consisting of 25% perchloric in 75% acetic acid. Then, we carried out “fine polishing” using a solution of 2% perchloric acid in butanol. The measurements were conducted on a LEAPTM 4000X HR (Cameca, Madison, WI, USA) in voltage mode at a temperature of 40 K. This system has a detection efficiency of ~37%, meaning only 37% of the atoms arriving at the detector are amplified. We used a pulse fraction of 20% and a detection rate of 1%. Data reconstruction was carried out using IVASTM 3.6.8 software from Cameca. To minimize influences from crystallographic artefacts, we limited our analysis to cubes with an identical volume of 30 × 30 × 100 nm3 which lay away from major crystallographic poles. The clustering of the atoms of interest was determined by an algorithm based on Voronoi tessellation of the solute atoms and Delaunay triangulation to test the random distribution of the solid solution (as described elsewhere [22,23,24]). The data were analyzed using custom scripts in MATLAB R2016a from MathWorks. 3D atom maps, cluster size, Mg/Mg + Si distribution, and proxigrams were used to visualize the results of the APT in this study. The 3D atom maps show a 3D picture of the most important atoms: Si, Mg, Zn, and Sn. The Mg/Mg + Si distribution is deployed to display detailed information about the Mg and Si ratio within the clusters. The proxigrams illustrate the element content in the cluster, starting in the center of a cluster. For this analysis, the data of all identical cluster types are averaged, and the clusters are regarded as spheres. Of course, this procedure does not account for the exact geometry of the clusters, but it reflects for the differences between the various conditions and alloys. The mean cluster size of the Mg–Si co-clusters indicates how many Mg and Si atoms participate in the local elemental enrichment.
It is important to note that for reasons of simplification and ease of readability, all detected aggregates were referred to as clusters according to the cluster detection algorithm used, even if different types of precursor of the β phase might be present.
3. Results
3.1. Hardness and Tensile Tests
Figure 1 shows the hardness and yield strength values of the experimental alloys in the T4P and T6P conditions. Significant differences in hardness and yield strength are obtained depending on the type of alloy already in the T4P condition. Compared to the reference alloy without Sn or Zn, the strength of the alloy with Sn addition is slightly lower, while the alloy with Zn addition exhibits the highest strength value. When Zn and Sn are added simultaneously (Alloy Zn + Sn), hardness and yield strength are significantly higher than the reference value and only slightly lower compared to Alloy Zn. After the paint bake treatment (T6P condition), the various hardening potentials of the alloys become discernible. Alloy Sn has the greatest hardness increase (19 HBW) and almost reaches the T6P strength of the Reference. For Alloy Zn and Alloy Zn + Sn, the hardness and yield strength in the T6P condition is higher compared to the Reference and both alloys exhibit comparable strength levels after bake hardening. Obviously, the paint bake response of Alloy Zn + Sn is significantly higher than that of Alloy Zn (17 HBW compared to 13 HBW and 95 MPa compared to 63 MPa). This is highly desirable because it enables forming in a state of low strength and high ductility, while still generating high final hardness and yield strength.
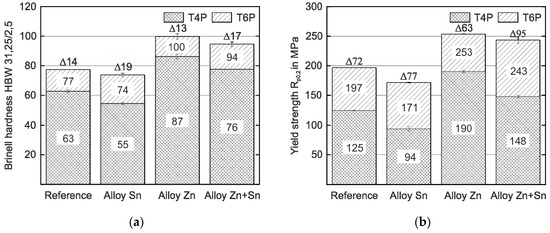
Figure 1.
Hardness (a) and yield strength values (b) of the reference and experimental alloys in the T4P and T6P conditions (average scatter ±1 HBW and ±2 MPa, respectively). The hardness and strength difference, ∆, between T4P and T6P states is indicated.
3.2. Atom Probe Tomography
To shed light on the origins of the age hardening responses, we carried out an extensive APT analysis. This should make it possible to correlate the mechanical properties with the presence of the atomic clusters responsible for hardness evolution.
3.2.1. Comparison of T4P and T6P Conditions
Reference Alloy
Figure 2 shows the results of atom probe tomography measurements of the Reference in T4P and T6P conditions, and Table 2 displays the corresponding cluster properties. In Figure 2a, small aggregations of Mg and Si atoms are visible in the atom maps; they indicate clustering. Figure 2b presents the T6P condition after paint bake treatment. Significant cluster growth is recognizable. This can also be seen in Figure 2c,d: the larger circles indicate bigger clusters in T6P. Small sporadic needle shaped phases also occur in this condition. It is also worth mentioning that the Mg/Mg + Si ratio changes from 0.4 in T4P condition to 0.6 in T6P condition, i.e., the clusters contain more Mg than Si after the paint bake treatment (see average Mg/Si ratio in Table 2). This assumption is confirmed by the proxigrams in Figure 2e,f. The latter show, starting from the center of the clusters, the concentration trends of the most important phase forming elements Mg, Si, and Cu. The Mg and Si concentrations are increased to a distance of ~2 nm in T4P and ~3 nm in T6P. Afterwards, at a greater distance, they show a constant level, which indicates the matrix concentration. There are no big differences in the Cu concentration trend, which indicates that Cu participates only slightly in the cluster. Table 2 presents data for the mean cluster size, average Mg/Si ratio, and number density of Mg–Si clusters in T4P and T6P conditions. It is obvious that the mean cluster size doubles and the number density decreases after PBC. These values are reflected well in the 3D atom maps in Figure 2a,b.
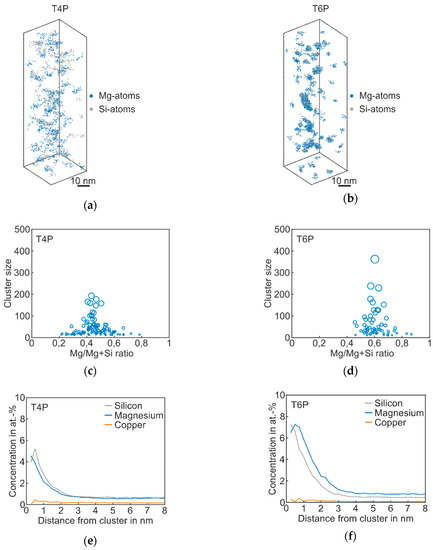
Figure 2.
APT analyses of Reference alloy visualizing the 3D atom maps of Mg–Si co-clusters (a,b) in T4P and T6P conditions. The corresponding cluster size distributions and proxigrams are shown in (c–f). The different circle diameters in (c) and (d) indicate the cluster size.
Table 2.
Properties of the Mg–Si clusters of Reference alloy in T4P and T6P conditions.
Alloy Sn
Figure 3 shows the atom probe results of Alloy Sn in the T4P and T6P states, and Table 3 the corresponding cluster properties in the same fashion as for the Reference. The 3D atom map in Figure 3a exhibits only very small cluster agglomerations. It follows that Sn does not participate in clustering, but, instead, is distributed homogenously in the matrix. However, for the T4P condition, adding Sn produces a significantly reduced mean cluster size. In condition T6P, however, the mean cluster size is much larger, increasing from 24 to 63 (Table 3). Sn atoms in condition T6P are also not enriched in the clusters. Interestingly, the number density does not change between the two conditions. The cluster size distributions in Figure 3c,d display the difference between the cluster evolutions of T4P and T6P. It is noticeable that the Mg/Mg + Si ratio does not change after the paint bake treatment and remains at ~0.6. Thus, the clusters in T4P condition are Mg-rich and not Si-rich as in the Reference alloy. This is also visible in the proxigrams in Figure 3e,f, which show higher Mg cluster content in both conditions. The Cu and Sn concentrations remain unaffected.
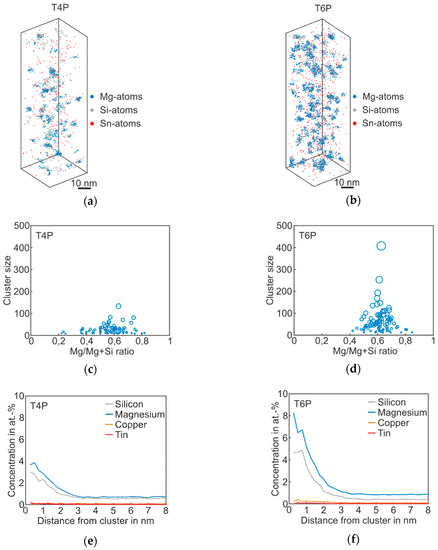
Figure 3.
APT analyses of Alloy Sn visualizing the 3D atom maps of Mg–Si co-clusters (a,b) in T4P and T6P conditions. The corresponding cluster size distributions and proxigrams are shown in (c–f). The different circle diameters in (c) and (d) indicate the cluster size.
Table 3.
Properties of the Mg–Si clusters of Alloy Sn in T4P and T6P conditions.
Alloy Zn
The results of the APT analysis of Alloy Zn are presented in Figure 4, and the corresponding cluster properties in Table 4. Compared to the T4P condition of the Reference, the Mg–Si co-clusters in the 3D atom maps appear bigger, which is also confirmed by the mean cluster size of 49; see Table 4. As shown in the proxigram in Figure 4e, the Zn atoms partially agglomerate in the Mg–Si co-clusters. The Zn concentration increases when compared to the matrix concentration, which is visualized by the dotted line. After paint bake treatment, the clusters are somewhat coarser, but the overall structure does not change strongly, as shown in Figure 4b,d. The clusters still consist primarily of Mg and Si atoms, with a slight enrichment in Zn. Typical Zn-containing phases such as η’ were not detected [25]. Thus, we still assign this type of alloy to the Mg–Si–family, despite the elevated Zn content. The Mg/Mg + Si ratio does not change during paint bake treatment, but remains at a value of ~0.6, i.e., the average Mg/Si ratio remains at 1.7 (Table 4). Compared to the Reference, the number density in both T4P and T6P conditions is higher.
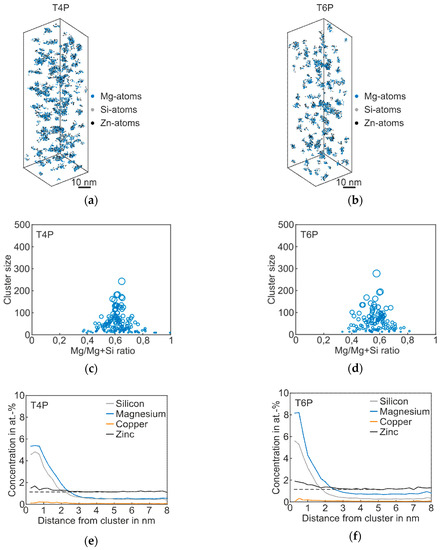
Figure 4.
APT analyses of Alloy Zn visualizing the 3D atom maps of Mg–Si co-clusters (a,b) in T4P and T6P conditions. The corresponding cluster size distributions and proxigrams are shown in (c–f). The different circle diameters in (c) and (d) indicate the cluster size. The dotted lines in (e,f) reflect the matrix concentration level of Zn.
Table 4.
Properties of the Mg–Si clusters of Alloy Zn in T4P and T6P conditions.
Alloy Zn + Sn
The APT results of the combination of Zn and Sn in Alloy Zn + Sn and the corresponding cluster properties are presented in Figure 5 and Table 5.
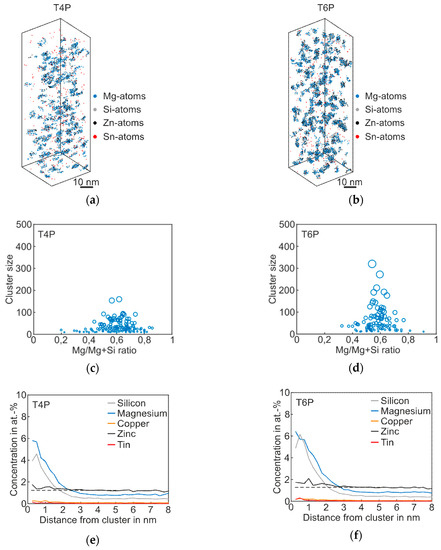
Figure 5.
APT analyses of Alloy Zn + Sn visualizing the 3D atom maps of Mg–Si co-clusters (a,b) in T4P and T6P conditions. The corresponding cluster size distributions and proxigrams are shown in (c–f). The different circle diameters in (c) and (d) indicate the cluster size. The dotted lines in (e,f) reflect the matrix concentration level of Zn.
Table 5.
Properties of the Mg–Si clusters of Alloy Zn + Sn in the T4P and T6P condition.
The co-clusters of Mg and Si in Figure 5a appear to be not as numerous and large as those of Alloy Zn. They are smaller in size but not as small as those of Alloy Sn. Much bigger clusters are visible after paint bake treatment (Figure 5b). This is also evident in the mean cluster size (Table 5). As in Alloy Sn and Alloy Zn, the Mg-enrichment is more pronounced than that of Si (Mg/(Mg + Si) ≈ 0.6) and does not change during the PBC. Zn is slightly enriched in the clusters.
3.2.2. T7 Condition
Alloy Zn + Sn
Figure 6 shows the 3D atom map and the corresponding proxigram of Alloy Zn + Sn in the overaged T7 condition. As expected, coarse plate- and needle-like phases are visible. The proxigram in Figure 6b illustrates the Mg content, which is two times higher than Si. The Zn concentration within the phases is twice as high as the matrix concentration, and the Cu content also increases in this condition. Interestingly, even after long-term artificial aging, there is still no η-phase (MgZn2) and no precursors are detectable [26].
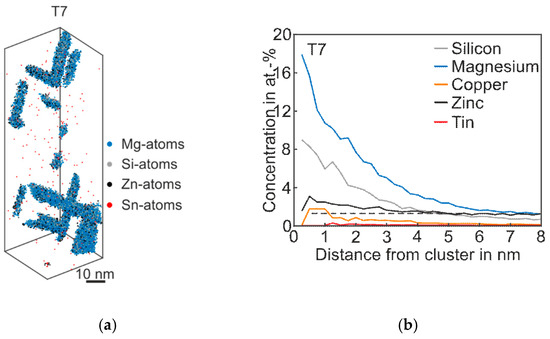
Figure 6.
APT analyses of Alloy Zn + Sn visualizing the 3D atom maps of Mg–Si co-clusters (a) in T7 condition. The corresponding proxigram is presented in (b). The dotted line indicates the matrix concentration level of Zn.
4. Discussion
The presented results provide a fairly clear picture of how the modifying elements Sn, Zn, and Sn + Zn influence the early stages of precipitate formation and, thus, the mechanical properties as represented by hardness and yield strength values of Al–Mg–Si alloys. A summary of the most relevant results of the ATP cluster analysis is presented in Figure 7. For both the T4P and T6P conditions, Figure 7a shows the mean cluster size of the Mg–Si co-clusters, and Figure 7b displays the number density of clusters in these states. Sn obviously retards cluster growth in condition T4P but accelerates it during PBC. On the other hand, the addition of Zn generates an increased number density of clusters independent of the presence of Sn.
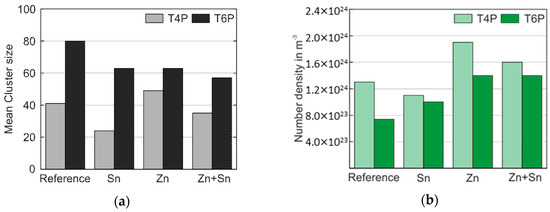
Figure 7.
(a) Mean cluster size of the Mg–Si co-clusters in the T4P and T6P conditions; (b) the corresponding number density, N.
Before discussing the elemental influences on cluster size and cluster number density, we will take a closer look at the relationship between cluster formation and yield strength. Hardening is controlled by interactions between dislocations and clusters. An appropriate approach to describing the flow stress increase by the presence of clusters delivers the “dispersed barrier model” [27,28],
where M is the Taylor factor, µ the shear modulus, b the Burgers vector, d and N the cluster obstacle size and cluster number density, and α the cluster barrier strength. We now take the liberty of simplification and set the mean cluster size determined by APT as obstacle size d. For the various alloys in conditions T4P and T6P, we calculate the values listed in Table 6 and illustrate the correlation to the yield strength values in Figure 8.
Table 6.
Hardening variables of the Mg–Si co-clusters in T4P and T6P condition (data in arbitrary units (a.u.)).
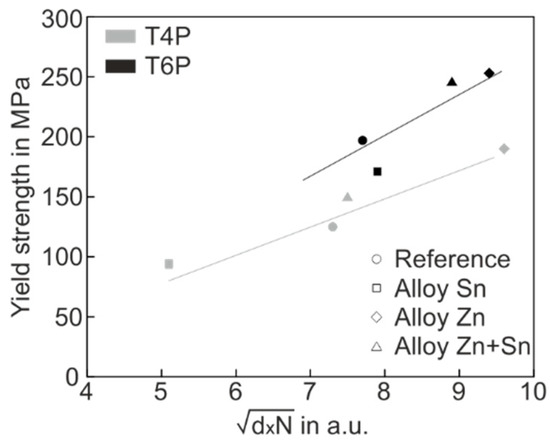
Figure 8.
Yield strength versus of all experimental alloys in the T4P (grey) und T6P (black) conditions.
In Figure 8, two special features are easy to recognize. Firstly, the yield stress values of both T4P and T6P states correlate quite well with , which supports the applicability of the hardening model. Secondly, the T6P data (black) lie predominantly above the T4P data (grey), indicating a greater hardening effect on the part of the T6P clusters, i.e., the cluster barrier strength α in Equation (1) is significantly higher for T6P clusters than for T4P clusters. The greater barrier strength of the T6P clusters is not surprising because these clusters were transformed into a more mature state by the PBC treatment.
We now discuss the influence of Sn, Zn, and Sn + Zn on the cluster parameters.
Alloy Sn shows a reduced number density of Mg–Si co-clusters and a smaller mean cluster size compared to the Reference. We attribute these effects to the vacancy binding effect of Sn, as often described in the literature [10,11,12,29]. At the T4P temperature, substitutional diffusion is inhibited. At the PBC temperature of 165 °C, however, Sn releases the trapped vacancies, generating rapid cluster growth.
With the addition of Zn in Alloy Zn, there is an increase in both mean cluster size and especially number density. Zinc does not form clusters by itself, but stimulates the nucleation and growth of Mg–Si co-clusters. These findings agree well with those in the literature [17,30,31,32]. Zn has an attractive vacancy binding energy [33,34]) and it can thus be assumed that when Zn atoms are present, more vacancies survive the quenching procedure. In contrast to Sn addition, however, the critical temperature for releasing the trapped vacancies is already exceeded during the T4P treatment at 110 °C, and rapid nucleation and growth can take place. Only a slight enrichment of Zn in the clusters was detected, which might be related to the Mg–Zn formation enthalpy (−6.1 kJ/mol), calculated by Wolverton [35]. Guo et al. [31] postulate that the Mg atoms can diffuse more easily to the clusters when Zn is present, perhaps explaining not only the faster nucleation and growth of the clusters but also the increased concentration of Mg atoms within the clusters (mean Mg/Si ratio ≈ 1.7). In accordance with our findings, Yuan et al. [30] also detected no Mg–Zn phases in Al–Mg–Si–Cu–Zn–Mn. They also observed an enhanced nucleation process and a higher number density of β′′ precipitates. Ding et al. [17] measured zinc containing phases after excessive artificial aging (170 °C for 120 h or 200 °C for 24 h). In our study, however, no η-phase or their precursors were detected, not even in overaged T7 condition after long-term artificial aging (Figure 6).
Alloy Zn + Sn shows a synergetic effect of Zn and Sn. The obtained number density and mean cluster size of the Mg–Si co-clusters are reduced compared with those of Alloy Zn in T4P. Here, too, adding Sn also retards the formation of clusters. However, the mean cluster size and the number density have higher values than those of Alloy Sn due to the abovementioned contribution of Zn to the nucleation and growth of clusters.
5. Conclusions
This study investigated the influence of Zn and Sn on hardening behavior and cluster formation in Al–Mg–Si alloys. The following conclusions were drawn:
- Adding Sn produces a decrease in hardness in the pre-aged condition because Sn-trapping of vacancies suppresses cluster formation. The vacancies are released from the Sn atoms during the paint bake process, leading to rapid growth of already existing clusters. Consequently, the hardness increase from the pre-aged to the paint baked condition is more pronounced than in the Sn-free reference alloy.
- Adding Zn promotes Mg–Si co-cluster formation. The number density and average size of the Mg–Si co-clusters are significantly increased, generating the highest hardness even in the pre-aged condition. During the paint bake cycle, further cluster growth takes place and, thus, the Zn-modified alloy shows the highest hardness value.
- Simultaneous addition of both Sn and Zn produces a synergetic effect. The size of the clusters is slightly decreased by the presence of Sn, but their number density stays high because of Zn. This causes a hardness which is lower than that of the solely Zn-modified alloy in the pre-aged condition, but more pronounced hardening is achieved during the paint bake cycle. This is preferred, since it enables the forming of sheets in the soft pre-aged condition and application in the hard paint baked state.
In general, the results show that the combined addition of Sn and Zn to Al–Mg–Si alloys is of particular interest when considering the applicability of reduced paint bake temperatures.
Author Contributions
Conceptualization: F.G., S.P., P.J.U. and H.W.H.; Methodology: F.G., P.F. and H.W.H.; Software: F.G. and H.W.H.; Investigation: F.G. and P.F.; Writing—original draft preparation: F.G.; Writing—review and editing: F.G., P.J.U, S.P. and H.W.H.; Visualization: F.G.; Supervision: H.W.H.; Project administration: H.W.H.; Funding acquisition: H.W.H.
Funding
The Christian Doppler Research Association—Christian Doppler Laboratory for Advanced Aluminum Alloys, the Austrian Federal Ministry for Digital and Economic Affairs and the National Foundation for Research funded this project.
Acknowledgments
The authors thank AUDI AG and AMAG Rolling GmbH for their financial support and for production of the aluminum alloys. Financial support from the Christian Doppler Research Association, the Austrian Federal Ministry for Digital and Economic Affairs and the National Foundation for Research, Technology and Development is gratefully acknowledged. The authors are very thankful to M. Erlwein, AUDI AG, and W. Fragner, AMAG Rolling GmbH, for their excellent support and cooperation within the joint research project.
Conflicts of Interest
The authors declare no conflicts of interest.
References
- Polmear, I.; St John, D.; Nie, J.-F.; Qian, M. Light Alloys: Metallurgy of the Light Metals; Butterworth-Heinemann: Oxford, UK, 2017. [Google Scholar]
- Mrówka-Nowotnik, G. Influence of chemical composition variation and heat treatment on microstructure and mechanical properties of 6xxx alloys. Arch. Mater. Sci. Eng. 2010, 46, 98–107. [Google Scholar]
- Hirsch, J. Recent development in aluminium for automotive applications. Trans. Nonferrous Met. Soc. China 2014, 24, 1995–2002. [Google Scholar] [CrossRef]
- Holmestad, R.; Bjørge, R.; Ehlers, F.J.H.; Torsæter, M.; Marioara, C.D.; Andersen, S.J. Characterization and structure of precipitates in 6xxx Aluminium Alloys. J. Phys. Conf. Ser. 2012, 371, 012082. [Google Scholar] [CrossRef]
- Zheng, G.W.; Li, H.; Lei, C.; Fu, J.; Bian, T.J.; Yang, J.C. Natural aging behaviors and mechanisms of 7050 and 5A90 Al alloys: A comparative study. Mater. Sci. Eng. A 2018, 718, 157–164. [Google Scholar] [CrossRef]
- Cuniberti, A.; Tolley, A.; Riglos, M.V.C.; Giovachini, R. Influence of natural aging on the precipitation hardening of an AlMgSi alloy. Mater. Sci. Eng. A 2010, 527, 5307–5311. [Google Scholar] [CrossRef]
- Cao, L.; Rometsch, P.A.; Couper, M.J. Clustering behaviour in an Al–Mg–Si–Cu alloy during natural ageing and subsequent under-ageing. Mater. Sci. Eng. A 2013, 559, 257–261. [Google Scholar] [CrossRef]
- Ostermann, F. Anwendungstechnologie Aluminium; Springer-Verlag: Berlin, Germany, 2015. [Google Scholar]
- Zhen, L.; Kang, S.B. The effect of pre-aging on microstructure and tensile properties of Al-Mg-Si alloys. Scr. Mater. 1997, 36, 1089–1094. [Google Scholar] [CrossRef]
- Pogatscher, S.; Antrekowitsch, H.; Werinos, M.; Moszner, F.; Gerstl, S.S.A.; Francis, M.F.; Curtin, W.A.; Löffler, J.F.; Uggowitzer, P.J. Diffusion on Demand to Control Precipitation Aging: Application to Al-Mg-Si Alloys. Phys. Rev. Lett. 2014, 112, 225701. [Google Scholar] [CrossRef]
- Werinos, M.; Antrekowitsch, H.; Ebner, T.; Prillhofer, R.; Uggowitzer, P.J.; Pogatscher, S. Hardening of Al–Mg–Si alloys: Effect of trace elements and prolonged natural aging. Mater. Des. 2016, 107, 257–268. [Google Scholar] [CrossRef]
- Pogatscher, S.; Antrekowitsch, H.; Werinos, M.; Rank, G.; Kais, A.; Prillhofer, R.; Loffler, J.F.; Uggowitzer, P.J. Statistical and Thermodynamic Optimization of Trace-Element Modified Al-Mg-Si-Cu Alloys. In Light Metals 2015; Hyland, M., Ed.; John Wiley & Sons, Inc.: Hoboken, NJ, USA, 2015; pp. 263–270. [Google Scholar]
- Sadhukhan, S.; Kundu, M.; Ghosh, M. Effect of Trace Added Sn on Mechanical Properties of Al-Zn-Mg Alloy. Adv. Mater. Res. 2014, 828, 73–80. [Google Scholar] [CrossRef]
- Werinos, M.; Antrekowitsch, H.; Fragner, W.; Ebner, T.; Uggowitzer, P.; Pogatscher, S. Influence of Sn-solubility on Suppression of Natural Aging in an AA6061 Aluminum Alloy. In Proceedings of the Materials Science & Technology 2014 Conference and Exhibition, Pittsburgh, PA, USA, 12–16 October 2014; Volume 2. [Google Scholar]
- Saga, M.; Kikuchi, M. Effect of Sn Addition on the Two-Step Aging Behavior in Al-Mg-Si Alloys for Automotive Application. In Proceedings of the 9th International Conference on Aluminium Alloys, Brisbane, Australia, 2–5 August 2004. [Google Scholar]
- Pogatscher, S.; Werinos, M.; Antrekowitsch, H.; Uggowitzer, P.J. The Role of Vacancies in the Aging of Al-Mg-Si Alloys. Mater. Sci. Forum 2014, 794, 1008–1013. [Google Scholar] [CrossRef]
- Ding, X.P.; Cui, H.; Zhang, J.X.; Li, H.X. The effect of Zn on the age hardening response in an Al–Mg–Si alloy. Mater. Des. 2015, 59, 1229–1235. [Google Scholar] [CrossRef]
- Guo, M.X.; Zhang, Y.; Zhang, X.K.; Zhang, J.S.; Zhuang, L.Z. Non-isothermal precipitation behaviors of Al-Mg-Si-Cu alloys with different Zn contents. Mater. Sci. Eng. A 2016, 669, 20–32. [Google Scholar] [CrossRef]
- Yan, L.; Zhang, Y.; Li, X.; Li, Z.; Wang, F.; Liu, H.; Xiong, B. Effect of Zn addition on microstructure and mechanical properties of an Al–Mg–Si alloy. Prog. Nat. Sci. Mater. Int. 2014, 24, 97–100. [Google Scholar] [CrossRef]
- Cao, C.; Zhang, D.; He, Z.; Zhuang, L.; Zhang, J. Enhanced and accelerated age hardening response of Al-5.2Mg-0.45Cu (wt%) alloy with Zn addition. Mater. Sci. Eng. A 2016, 666, 34–42. [Google Scholar] [CrossRef]
- Saito, T.; Wenner, S.; Osmundsen, E.; Marioara, C.D.; Andersen, S.J.; Røyset, J.; Lefebvre, W.; Holmestad, R. The effect of Zn on precipitation in Al–Mg–Si alloys. Philos. Mag. 2014, 94, 2410–2425. [Google Scholar] [CrossRef]
- Felfer, P.; Ceguerra, A.V.; Ringer, S.P.; Cairney, J.M. Detecting and extracting clusters in atom probe data: A simple, automated method using Voronoi cells. Ultramicroscopy 2015, 150, 30–36. [Google Scholar] [CrossRef]
- Aurenhammer, F. Voronoi Diagrams—A Survey of a Fundamental Geometric Data Structure. ACM Comput. Surv. 1991, 23, 345–405. [Google Scholar] [CrossRef]
- Du, Q.; Faber, V.; Gunzburger, M. Centroidal Voronoi Tessellations: Applications and Algorithms. SIAM Rev. 1999, 41, 637–676. [Google Scholar] [CrossRef]
- Park, J.K.; Ardell, A.J. Microstructures of the commercial 7075 Al alloy in the T651 and T7 tempers. MTA 1983, 14, 1957–1965. [Google Scholar] [CrossRef]
- Marioara, C.D.; Lefebvre, W.; Andersen, S.J.; Friis, J. Atomic structure of hardening precipitates in an Al–Mg–Zn–Cu alloy determined by HAADF-STEM and first-principles calculations: Relation to η-MgZn2. J. Mater. Sci. 2013, 48, 3638–3651. [Google Scholar] [CrossRef]
- Hull, D.; Bacon, D.J. Introduction to Dislocations; Elsevier: Amsterdam, The Netherlands, 2011. [Google Scholar]
- Zinkle, S.J.; Matsukawa, Y. Observation and analysis of defect cluster production and interactions with dislocations. J. Nucl. Mater. 2004, 329, 88–96. [Google Scholar] [CrossRef]
- Pogatscher, S.; Antrekowitsch, H.; Leitner, H.; Ebner, T.; Uggowitzer, P.J. Mechanisms controlling the artificial aging of Al–Mg–Si Alloys. Acta Mater. 2011, 59, 3352–3363. [Google Scholar] [CrossRef]
- Yuan, B.; Guo, M.; Wu, Y.; Zhang, J.; Zhuang, L.; Lavernia, E.J. Influence of treatment pathways on the precipitation behaviors of Al-Mg-Si-Cu-(Zn)-Mn alloys. J. Alloy. Compd. 2019, 797, 26–38. [Google Scholar] [CrossRef]
- Guo, M.X.; Zhang, Y.D.; Li, G.J.; Jin, S.B.; Sha, G.; Zhang, J.S.; Zhuang, L.Z.; Lavernia, E.J. Solute clustering in Al-Mg-Si-Cu-(Zn) alloys during aging. J. Alloy. Compd. 2019, 774, 347–363. [Google Scholar] [CrossRef]
- Li, Y.; Gao, G.; Wang, Z.; Di, H.; Li, J.; Xu, G. Effects of the Mg/Si Ratio on Microstructure, Mechanical Properties, and Precipitation Behavior of Al–Mg–Si–1.0 wt%-Zn Alloys. Materials 2018, 11, 2591. [Google Scholar] [CrossRef] [PubMed]
- Perry, A.J. Solute-Vacancy Interaction Energies and the Effect of 0.009 at.% Mg on the Ageing Kinetics of an A1-4.01 at.% Zn Alloy. Acta Metall. 1966, 14, 1143–1156. [Google Scholar] [CrossRef]
- Wolverton, C. Solute–vacancy binding in aluminum. Acta Mater. 2007, 55, 5867–5872. [Google Scholar] [CrossRef]
- Wolverton, C. Crystal structure and stability of complex precipitate phases in Al–Cu–Mg–(Si) and Al–Zn–Mg alloys. Acta Mater. 2001, 49, 3129–3142. [Google Scholar] [CrossRef]


© 2019 by the authors. Licensee MDPI, Basel, Switzerland. This article is an open access article distributed under the terms and conditions of the Creative Commons Attribution (CC BY) license (http://creativecommons.org/licenses/by/4.0/).