Article

Complete Stress–Strain Curves of Self-Compacting Steel Fiber Reinforced Expanded-Shale Lightweight Concrete under Uniaxial Compression

1
International Joint Research Lab for Eco-building Materials and Engineering of Henan, North China University of Water Resources and Electric Power, Zhengzhou 450045, China
2
Henan Provincial Collaborative Innovation Center for Water Resources High-efficient Utilization and Support Engineering, Zhengzhou 450046, China
3
School of Civil Engineering and Communications, North China University of Water Resources and Electric Power, Zhengzhou 450045, China
*
Authors to whom correspondence should be addressed.
Materials 2019, 12(18), 2979; https://doi.org/10.3390/ma12182979
Submission received: 22 August 2019 / Revised: 13 September 2019 / Accepted: 13 September 2019 / Published: 14 September 2019

Abstract

:
To expand the structural application of steel fiber reinforced expanded-shale lightweight concrete (SFRELC), a self-compacting SFRELC with high-workability was developed based on previous research. As part of the investigation, the present study focuses on the adaptability of formulas used for the complete stress–strain curves of steel fiber reinforced lightweight-aggregate concrete and conventional concrete under uniaxial compression. On the basis of mix proportion of SFRELC, self-compacting SFRELC was designed with the volume fraction of steel fiber as 0%, 0.4%, 0.8%, 1.2%, 1.6%, and 2.0%. Eighteen cylindrical specimens with dimensions of Φ150 mm × 300 mm were tested to measure the uniaxial compressive stress–strain curves of self-compacting SFRELC. Results indicated that, with the increasing volume fraction of steel fiber, the compressive strain at the peak-stress of the stress–strain curve increased, while the slope of the descending portion decreased. This increased the energy absorption of self-compacting SFRELC with a higher compression toughness. With a comparison of test results between four groups of calculation models, a group of formulas is selected to express the complete stress–strain curves of self-compacting SFRELC under uniaxial compression.

1. Introduction

In view of the brittleness of lightweight-aggregate concrete [1,2,3], and the utilization of local sintered expanded-shale as fine and coarse aggregates, a new concrete material called steel fiber reinforced expanded-shale lightweight concrete (SFRELC) was developed. To investigate SFRELC with different flowabilities, classified as plastic, flowing, and high flowing with the slump varied from 60 mm to 200 mm, a series of experimental investigations have been performed to study the mechanical properties, including compressive strength and toughness, tensile strength, flexural strength and toughness, deformation and modulus of elasticity, strength developments and complete stress-strain curves [4,5,6,7,8,9,10,11,12], carbonization and freeze–thaw resistance [10,13], as well as autogenous and drying shrinkage [14]. This confirmed the good mechanical performance, durability, and steady volume of SFRELC. To further enlarge the application of SFRELC, self-compacting technology is worthy of study, in order to support the mechanical vibration procedure during construction [15,16,17,18,19,20,21]. As a core point, the stress–strain relationship of self-compacting SFRELC is of great importance for the design of concrete structures.
Based on previous studies, the stress–strain relationship of vibro-compacting lightweight aggregate concrete (LAC), with or without steel fiber, has been conducted by some researchers [11,22,23,24,25,26,27,28,29,30,31]. For LAC, with the peak stress varied from 18 MPa to 89 MPa, peak strains also presented an increasing tendency from about 2000 με to 6000 με, while the ratios of peak stress to strain, namely the secant modulus, significantly increased from 7 GPa to 15 GPa. The secant modulus was lower than 12–25 GPa of normal weight concrete (NWC), and this is due to the shape of the stress–strain curves being more linear as the peak stress of LAC increased with the higher deformability [22,23,24,25,26,27]. While in Campione’s study [25], the residual stress in the descending portion was about 26% of the peak stress for LAC and 67% for NWC at the same strain of 6000 με. Compared with the shape of the compressive stress–strain curves for LAC, more brittle behavior, namely a steeper and shorter descending curve, was observed with respect to NWC of the same strength.
Steel fiber was added to enhance the toughness of LAC, while the stress–strain relationship of steel fiber reinforced lightweight-aggregate concrete (SFRLAC) was significantly influenced. According to researches [11,25,29,30,31], hooked-ends steel fiber with aspect ratios of 60–67, or thin-plate cutting corrugated steel fiber with an aspect ratio of 27, was used to enhance the LAC with expanded-shale or other kinds of lightweight aggregates. The results showed that the shape of ascending curves was almost similar with the increased peak stresses at about 0–29%, the increased peak strains at about 15–55%, while the secant modulus presented a decrement of about 5–33%. Thus, the slope of the ascending portion of stress–strain in curves increased with the volume fraction of steel fiber, which indicates that the addition of steel fiber could promote the stiffness of SFRLAC. For the descending portion, slopes became smaller with the increasing volume fraction of steel fiber. The residual stresses of stress–strain curves for SFRLAC at a certain strain of 6000 με were about 47–76% of their peak stresses with the volume fraction of steel fiber of 2.0% [11,25,29,30]. The effect of steel fiber on the promotion of the toughness and ductility of SFRLAC connected with the type and aspect ratio of steel fibers.
According to the experimental study of compressive stress–strain curves of vibro-compacting SFRELC, and the analysis a large number of test curves of LAC and SFRLAC, a unified stress–strain model was proposed for the prediction of complete compressive stress–strain curves of LAC and SFRLAC [11]. The proposed model was also modified and adopted by Ding et al. to get a good prediction for the complete compressive stress–strain curves of self-compacting steel fiber reinforced concrete (SFRC) under uniaxial compression [32]. Meanwhile, Aslani’s model [33,34] was proposed to predict the stress–strain relationship of self-compacting fiber reinforced concrete with different strengths, at different curing ages, in their own experiments. Cunha’s model [35,36] was put forward based on the calculation model in CEB-FIP model code 1990 [37] for self-compacting fiber reinforced concrete. The results showed that Cunha’s model had a good prediction for the ascending portion but underestimated for the descending portion of the compressive stress–strain curves in both Aslani’s and Ding’s researches.
Based on the above reviews, no study was carried out on the compressive stress–strain model of self-compacting SFRELC, and the adaptability and applicability of the present models of LAC and SFRLAC have not been confirmed. Therefore, this paper focuses on the assessment and numerical prediction of the complete stress–strain curves of self-compacting SFRELC under uniaxial compression. Eighteen cylindrical specimens were prepared for self-compacting SFRELC with a varying volume fraction of steel fiber from 0% to 2.0%. Based on the test results, the proposed model, Aslani’s model, Cunha’s model, and the FIP model were verified to predict the stress–strain curve of self-compacting SFRELC. Meanwhile, the energy absorption ability of self-compacting SFRELC, as characterized by the compression toughness ratio, is also discussed.

2. Preparation of Experimental Study

2.1. Raw Materials

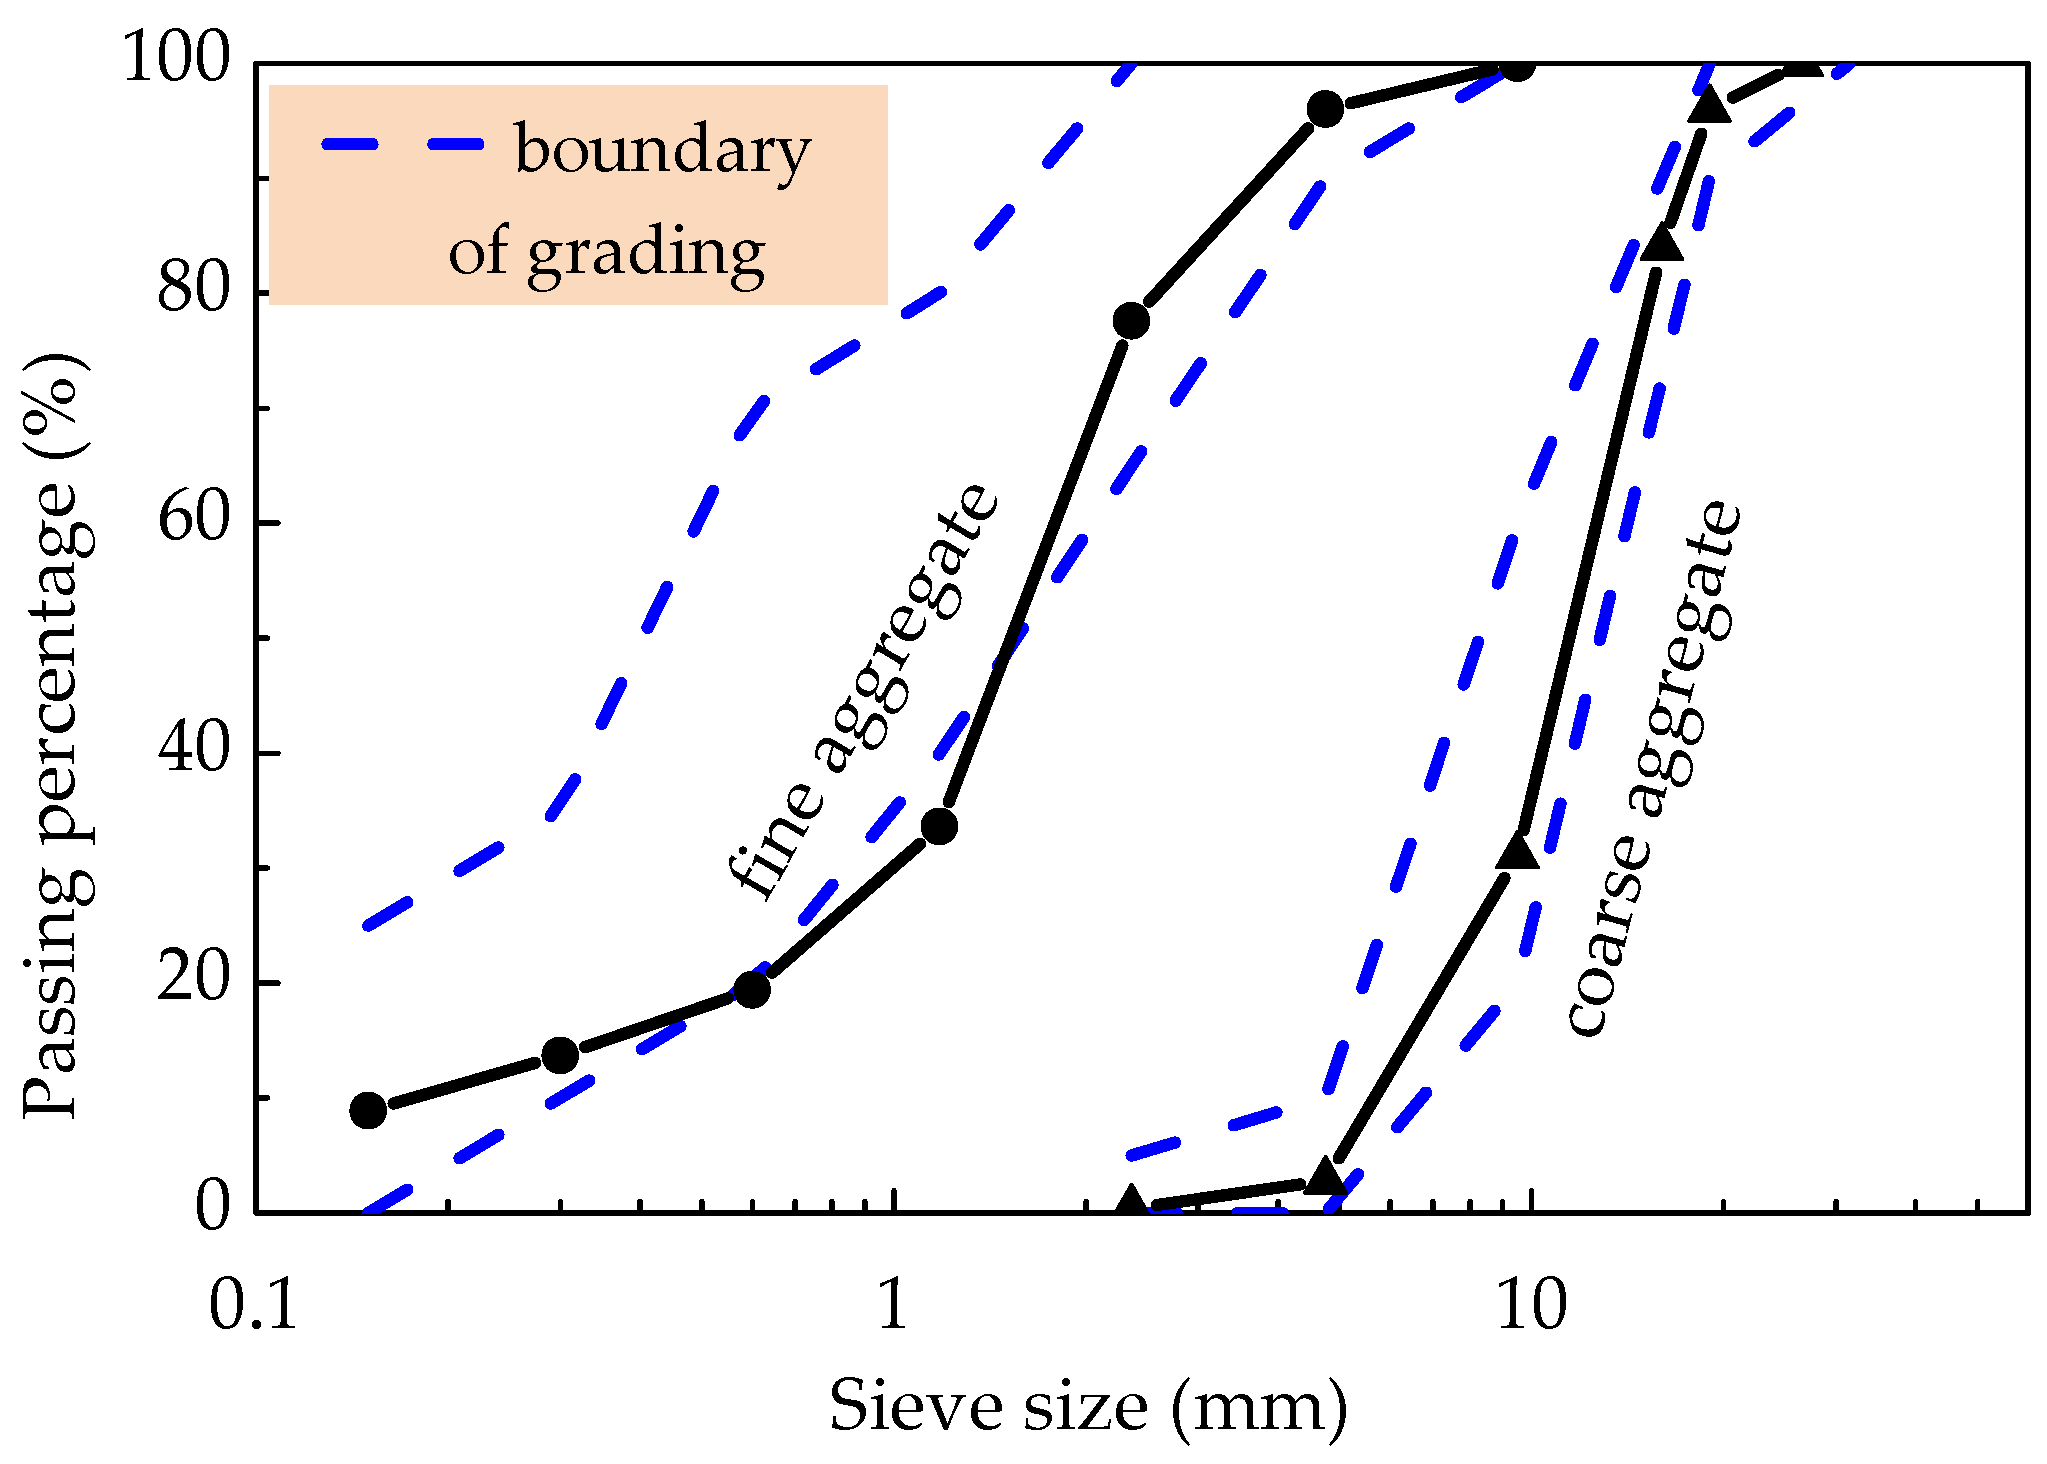
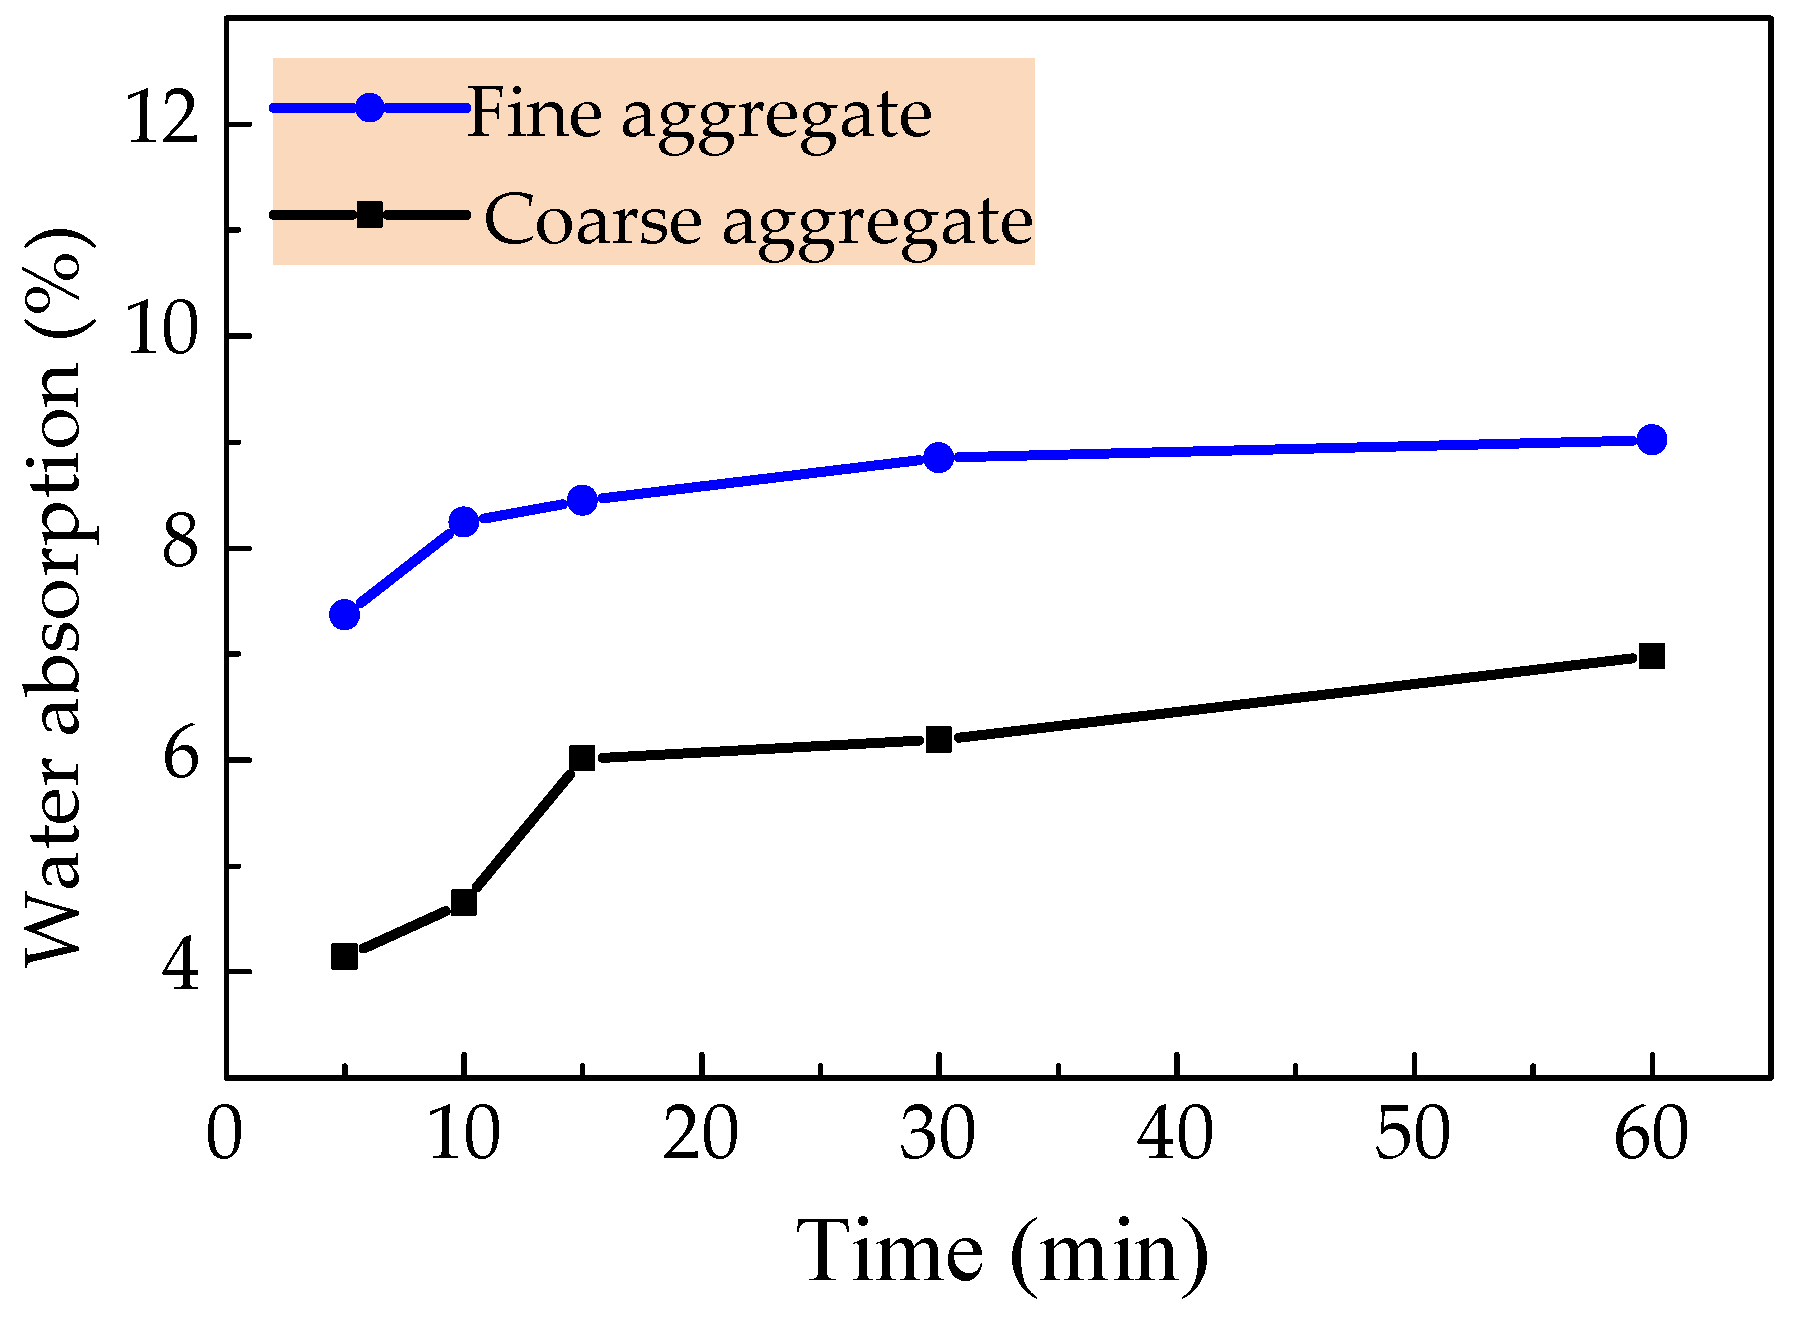
Common Portland cement meeting the requirements of China code GB 175 was used [38], of which the physical and mechanical properties are presented in Table 1. Fly ash satisfying the indices of class-II specified in China code GB/T1596 [39] was used as the admixture, the density was 2070 kg/m3, the residual amount on a square hole sieve of 45 μm was 20%, and the water demand ratio was about 92%. As in the previous study [9,11] and presented in Figure 1a,b, high-strength sintering expanded shales in continuous gradation of 5–20 mm was used for the coarse aggregate, and the ceramsite sand, the byproduct of sintering expanded shale sieved as continuous gradation within 0.16–5 mm was used for the fine aggregate. The grading curves of coarse expanded-shales and ceramsite sand are drawn in Figure 2, their particle gradation basically met the requirement in China code GB/T 17431.2 [40]. The physical and mechanical properties are listed in Table 2, and the water absorption curves are displayed in Figure 3 to be used as the basis of selecting the presoaking time. At the same time, the 24 h water absorptions of expanded shale and ceramsite sand were measured as 7.45% and 9.75%. Due to the water absorptions within 1 h reaching 93.5% and 92.6% of 24 h water absorptions for expanded shale and ceramsite sand respectively, the rational presoaking time was chosen as 1 h. The steel fiber exhibited in Figure 1c was crimped cut with thin-plate, the length lf = 36.7 mm, the equivalent diameter df = 1.35 mm, and the aspect ratio lf/df = 27.2. Others included the polycarboxylic acid superplasticizer with a water-reducing rate no less than 30%, and tap water as mixing water.

2.2. Mix Proportions

The water/binder ratio (w/b) was chosen as 0.30 to make the self-compacting SFRELC. The volume fraction of steel fiber vf = 0%, 0.4%, 0.8%, 1.2%, 1.6%, and 2.0%, respectively. The volume ratio of ceramsite sand was 50% when vf = 0%, 0.4%, and 0.8%, and then increased 0.2% with the increment of vf = 0.4%. About 30% mass of cement was replaced by fly-ash. The details of mix proportion are presented in Table 3. Where the dosage of super-plasticizer was determined through testing according to the workability of fresh self-compacting SFRELC. As the saturated dry surface condition of expanded shale and ceramsite sand was adopted for the preparation of a fresh mixture of SFRELC, the dosage of presoaking water with 1 h water absorption was added additionally.

2.3. Test Methods

The expanded shale and ceramsite sand were presoaked for 1 h, and then mixed with cement, fly ash and steel fiber using a horizontal spindle forced mixer. The workability of fresh self-compacting SFRELC was measured according to the specifications in China code JGJ/T283 [41]. Three cubic specimens with dimension of 150 mm were used to test the compressive strength, three cylinder specimens with dimensions of Φ150 mm × 300 mm were used for measuring the uniaxial compressive stress–strain curves, and the mean values were adopted in accordance with the test method in China standards GB/T50081 [42], CECS13:2009 [43], and ACI 544.4R [44]. Specimens were cured in a standard curing room at (20 ± 2) °C temperature and 95% RH for 28 days before testing.
With the requirement of the sufficient rigidity of test machine to get a complete stress-strain curve of concrete under uniaxial compression [11], a 3000 kN electro-hydraulic servo universal testing machine with sufficient rigidity and higher loading control precision made by SANS Co. Ltd., as exhibited in Figure 4, was used as a loading device in this study. The loading speed was maintained as the strain rate among (20–50) × 10−6/s. The stress and strain data were measured by a load transducer and two displacement meters on two symmetric sides of each specimen.

3. Results and Analysis

3.1. Workability and Density

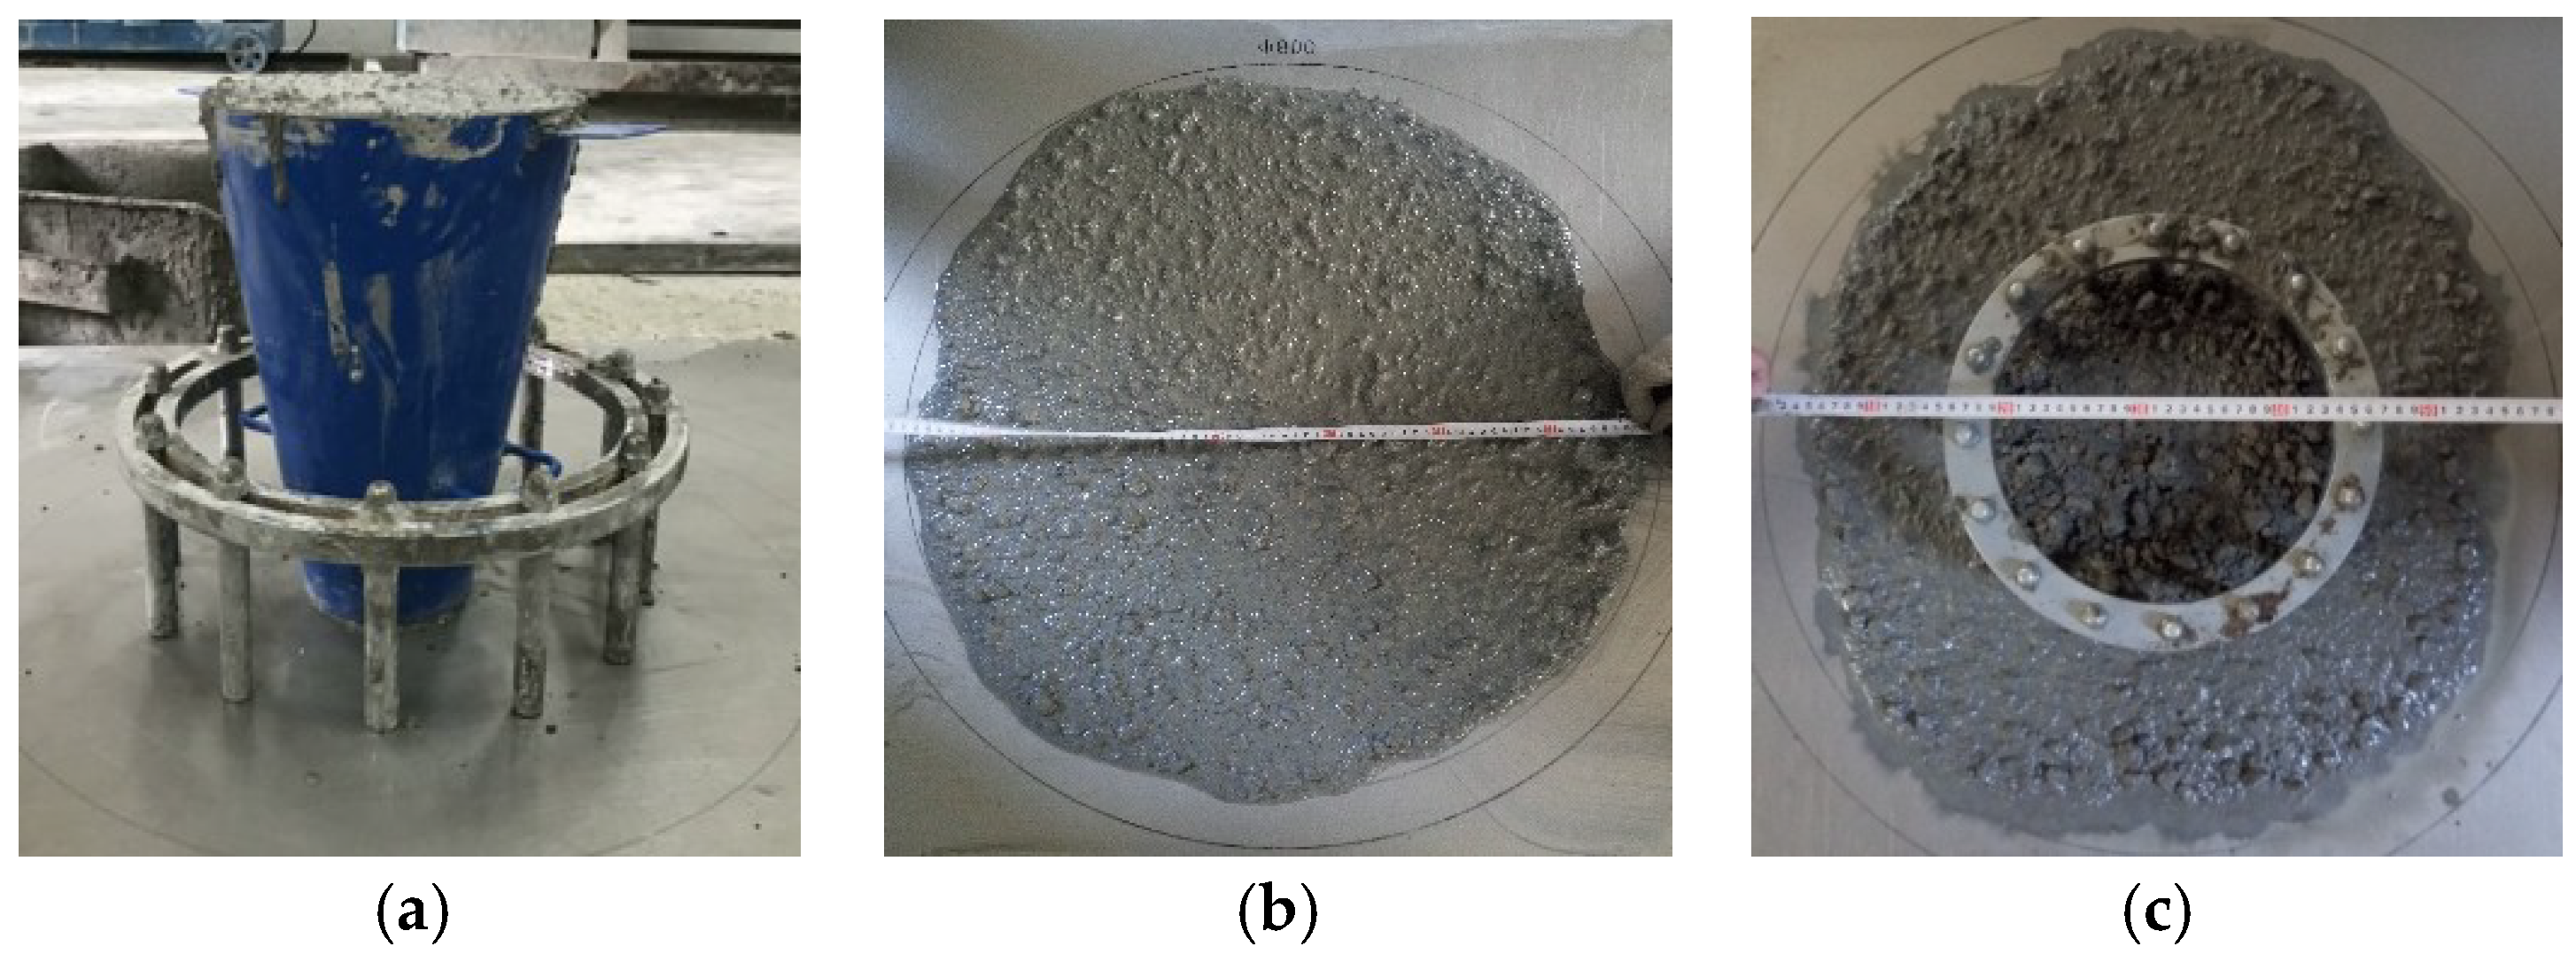
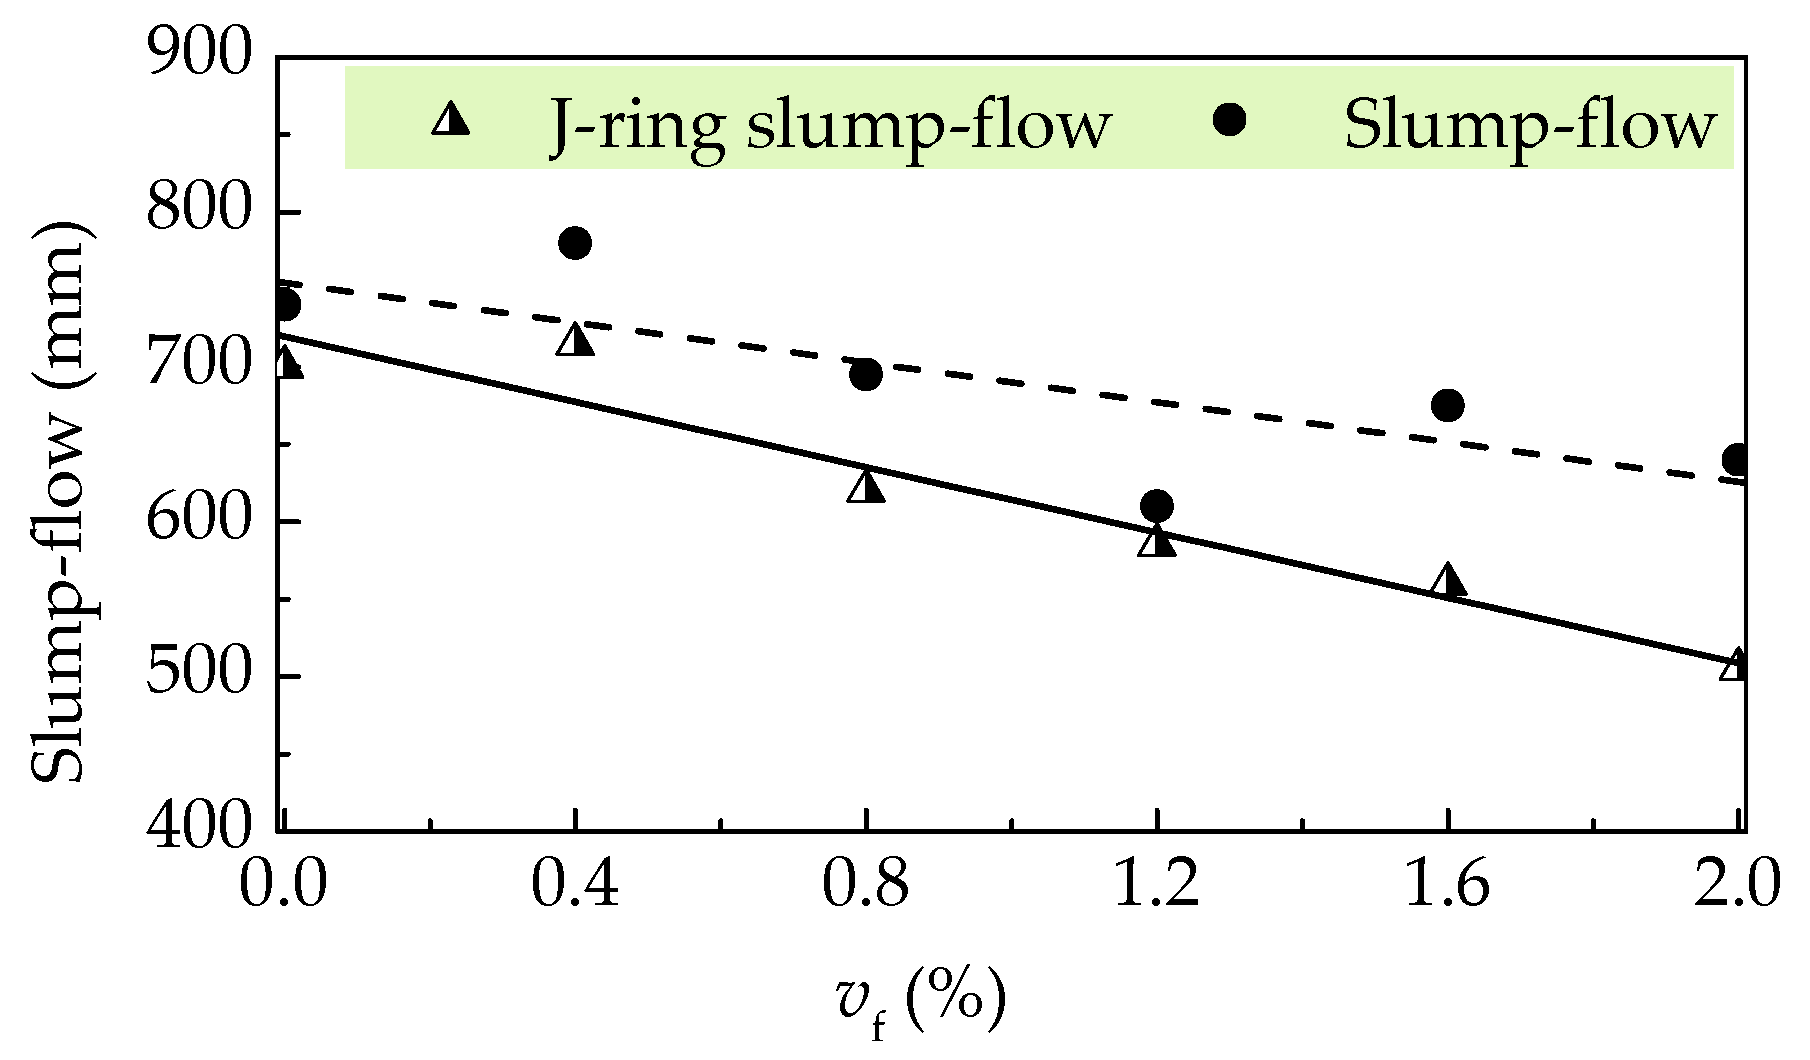
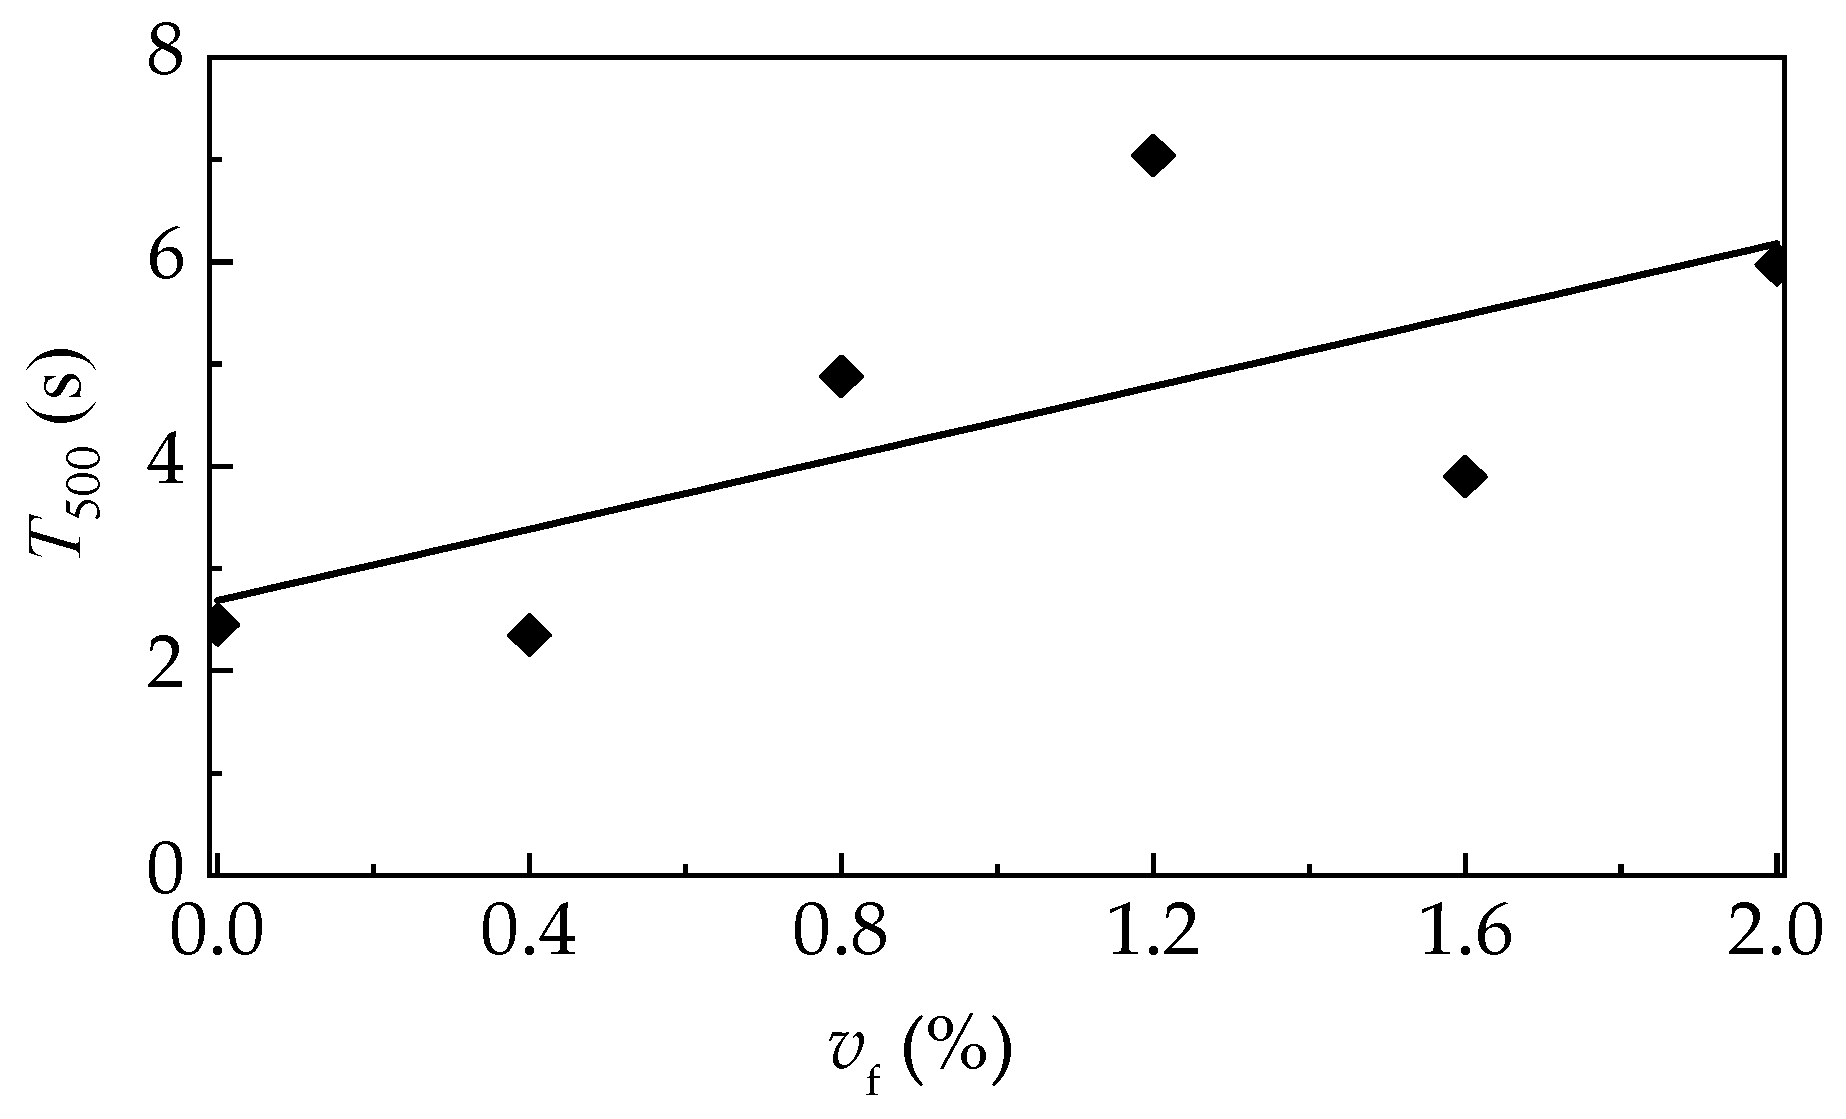
Figure 5 displays the inverted slump cone method for slump flow and J-ring slump flow tests to evaluate the filling and passing abilities of self-compacting SFRELC. Test results are illustrated in Figure 6 and Figure 7. Represented by the decreased slump-flow, J-ring slump flow, and the increased slump-flow time (T500), the filling ability decreases with the increase of vf. With the vf increasing from 0% to 2.0%, the slump flow and J-ring slump flow deceased 13.5% and 27.9%, respectively, while the T500 increased from 2.35 s to 7.04 s. The maximum value of T500 took place corresponding to the minimum slump flow at vf = 1.2%. This is due to the insufficient dosage of water reducer. The J-ring slump-flow expressed a faster reduction than the slump-flow, which indicated a fast declination of passing ability of self-compacting SFRELC with the increase of vf. In general, the slump-flows for all mixes of self-compacting SFRELC were 610–780 mm, which met the performance level SF1 and SF2 specified in China code JGJ/T283 [41]. J-ring slump flows were 505–715 mm, and the T500 was longer than 2 s. This met the requirements of a reinforced concrete structure cast by self-compacting SFRELC [34,36].
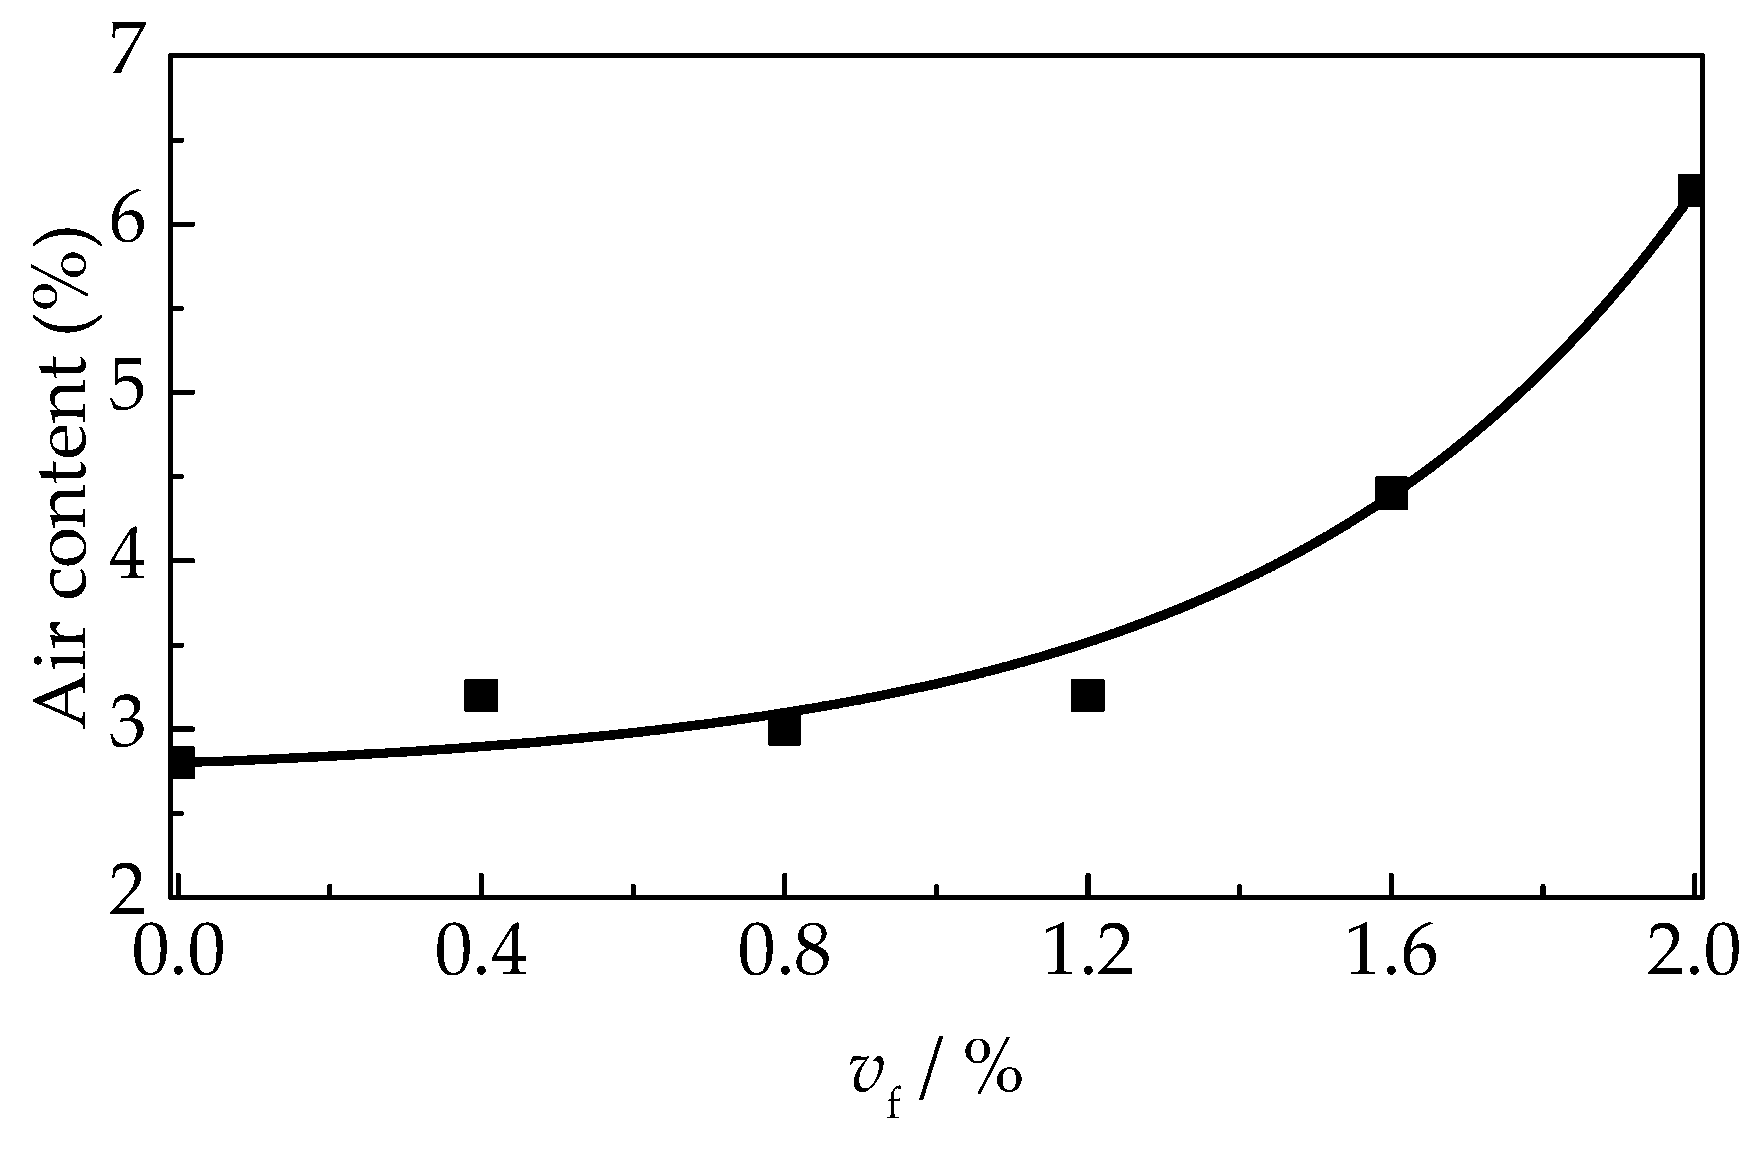
As presented in Figure 8, the air content of self-compacting SFRELC were more and more sensitive with the addition of steel fiber, especially when vf was over 1.2%. The air content grew slightly when vf = 0–1.2% but had a great increase from 4.4% to 6.2% when vf varied from 1.6% to 2.0%. However, the densities of self-compacting SFRELC increased with vf despite the increase of air content. This is due to the larger density of steel fiber. It should be noted that the higher air content may lead the reduce of the densities of self-compacting SFRELC, as displayed in Figure 9. The dry density of self-compacting SFRELC ranges from 1542 kg/m3 to 1784 kg/m3. It is about 25.7–35.8% lower than that of NWC.

3.2. Uniaxial Compressive Stress-Strain Curves of Self-Compacting SFRELC

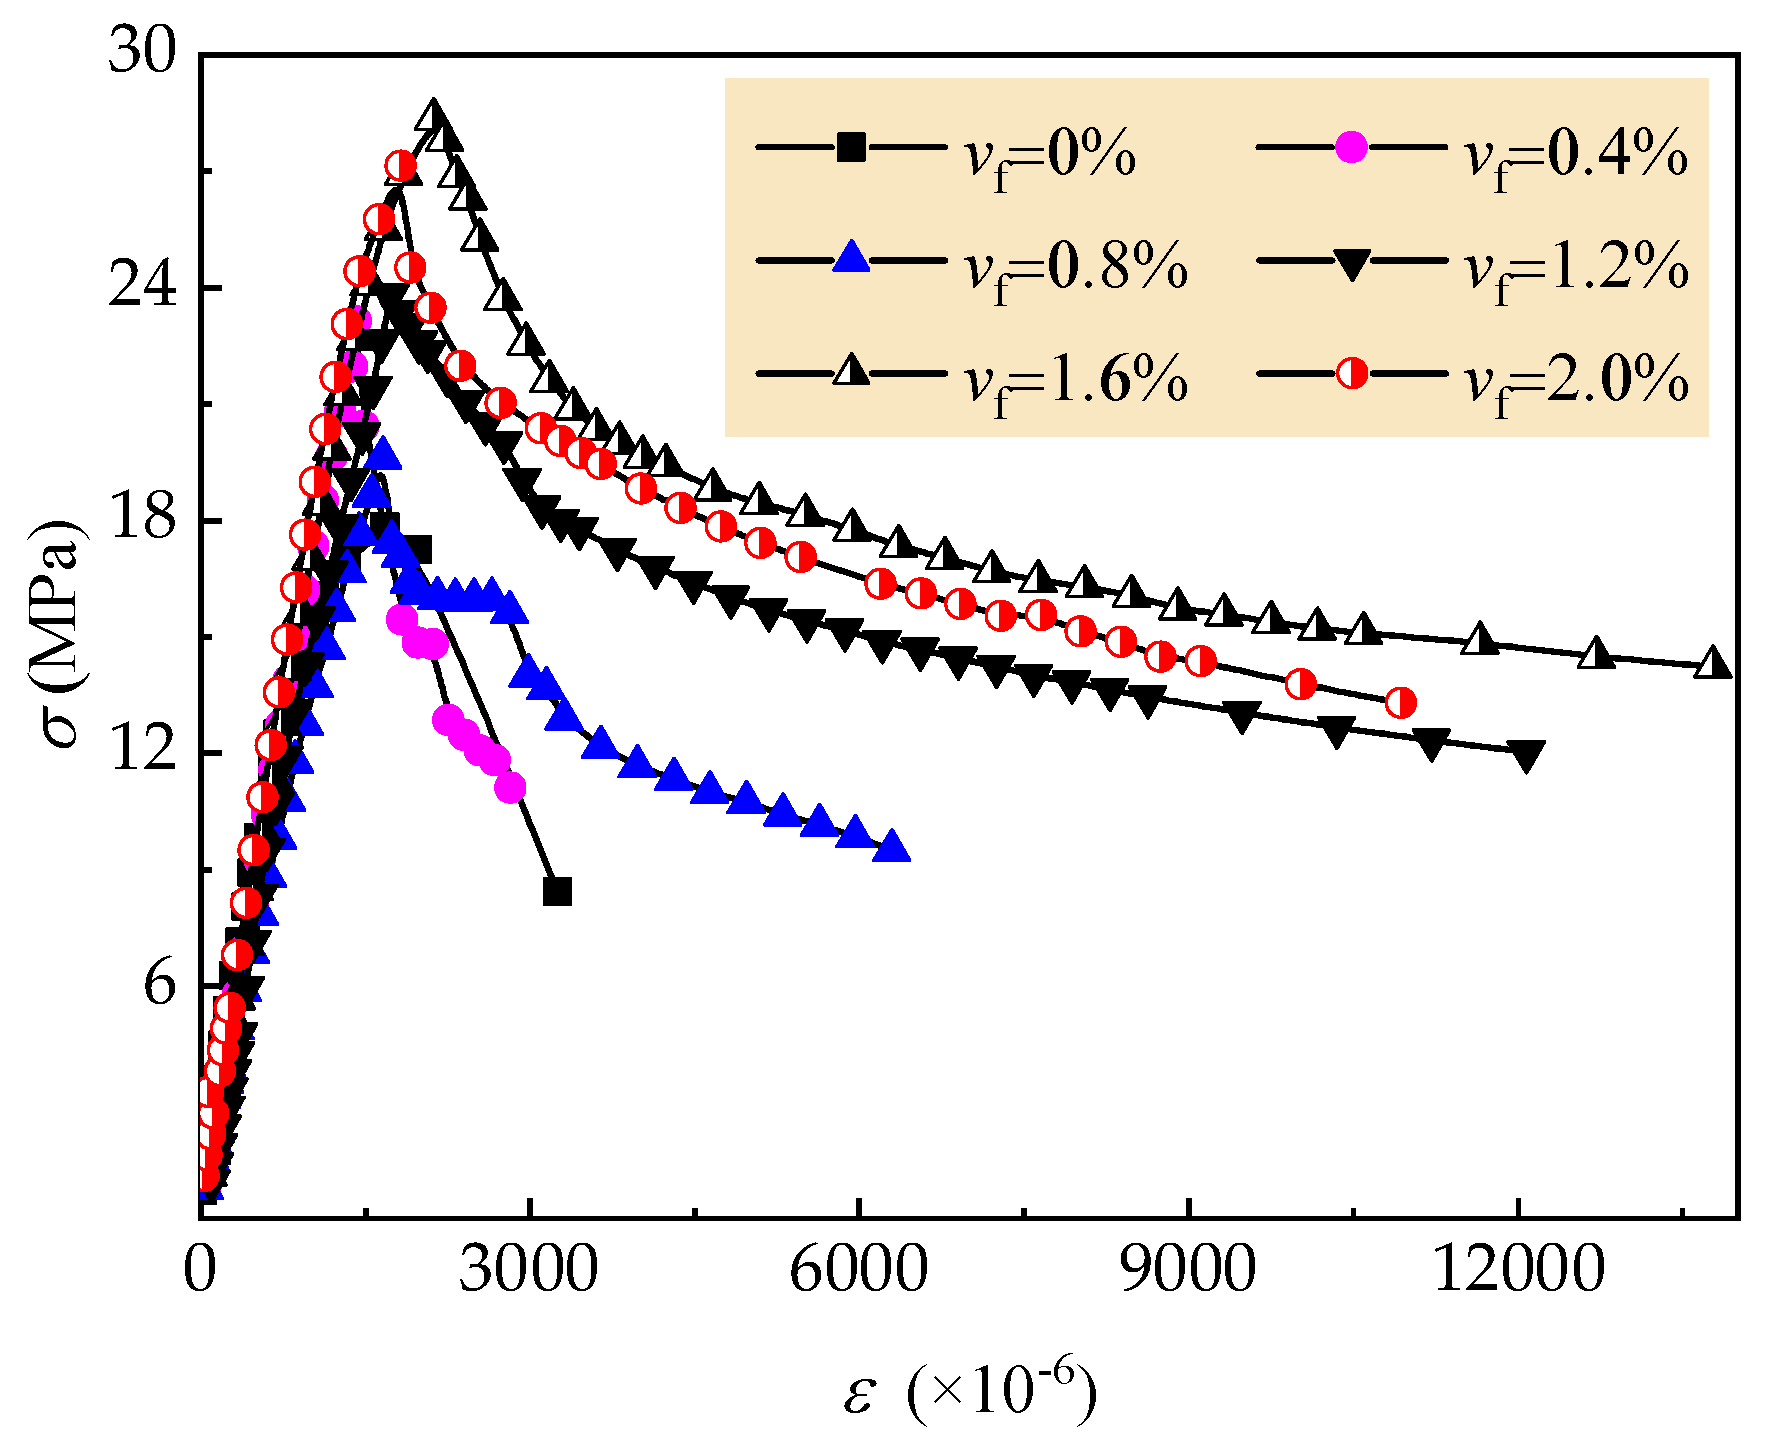
Figure 10 presents the uniaxial compressive stress–strain curves of tested self-compacting SFRELC. With the increase of vf, the curves had a trend with a steeper slope at the ascending portion and slower slope at the descending portion. The peak-stress fc,r and corresponding strain εc,r trend increased linearly.
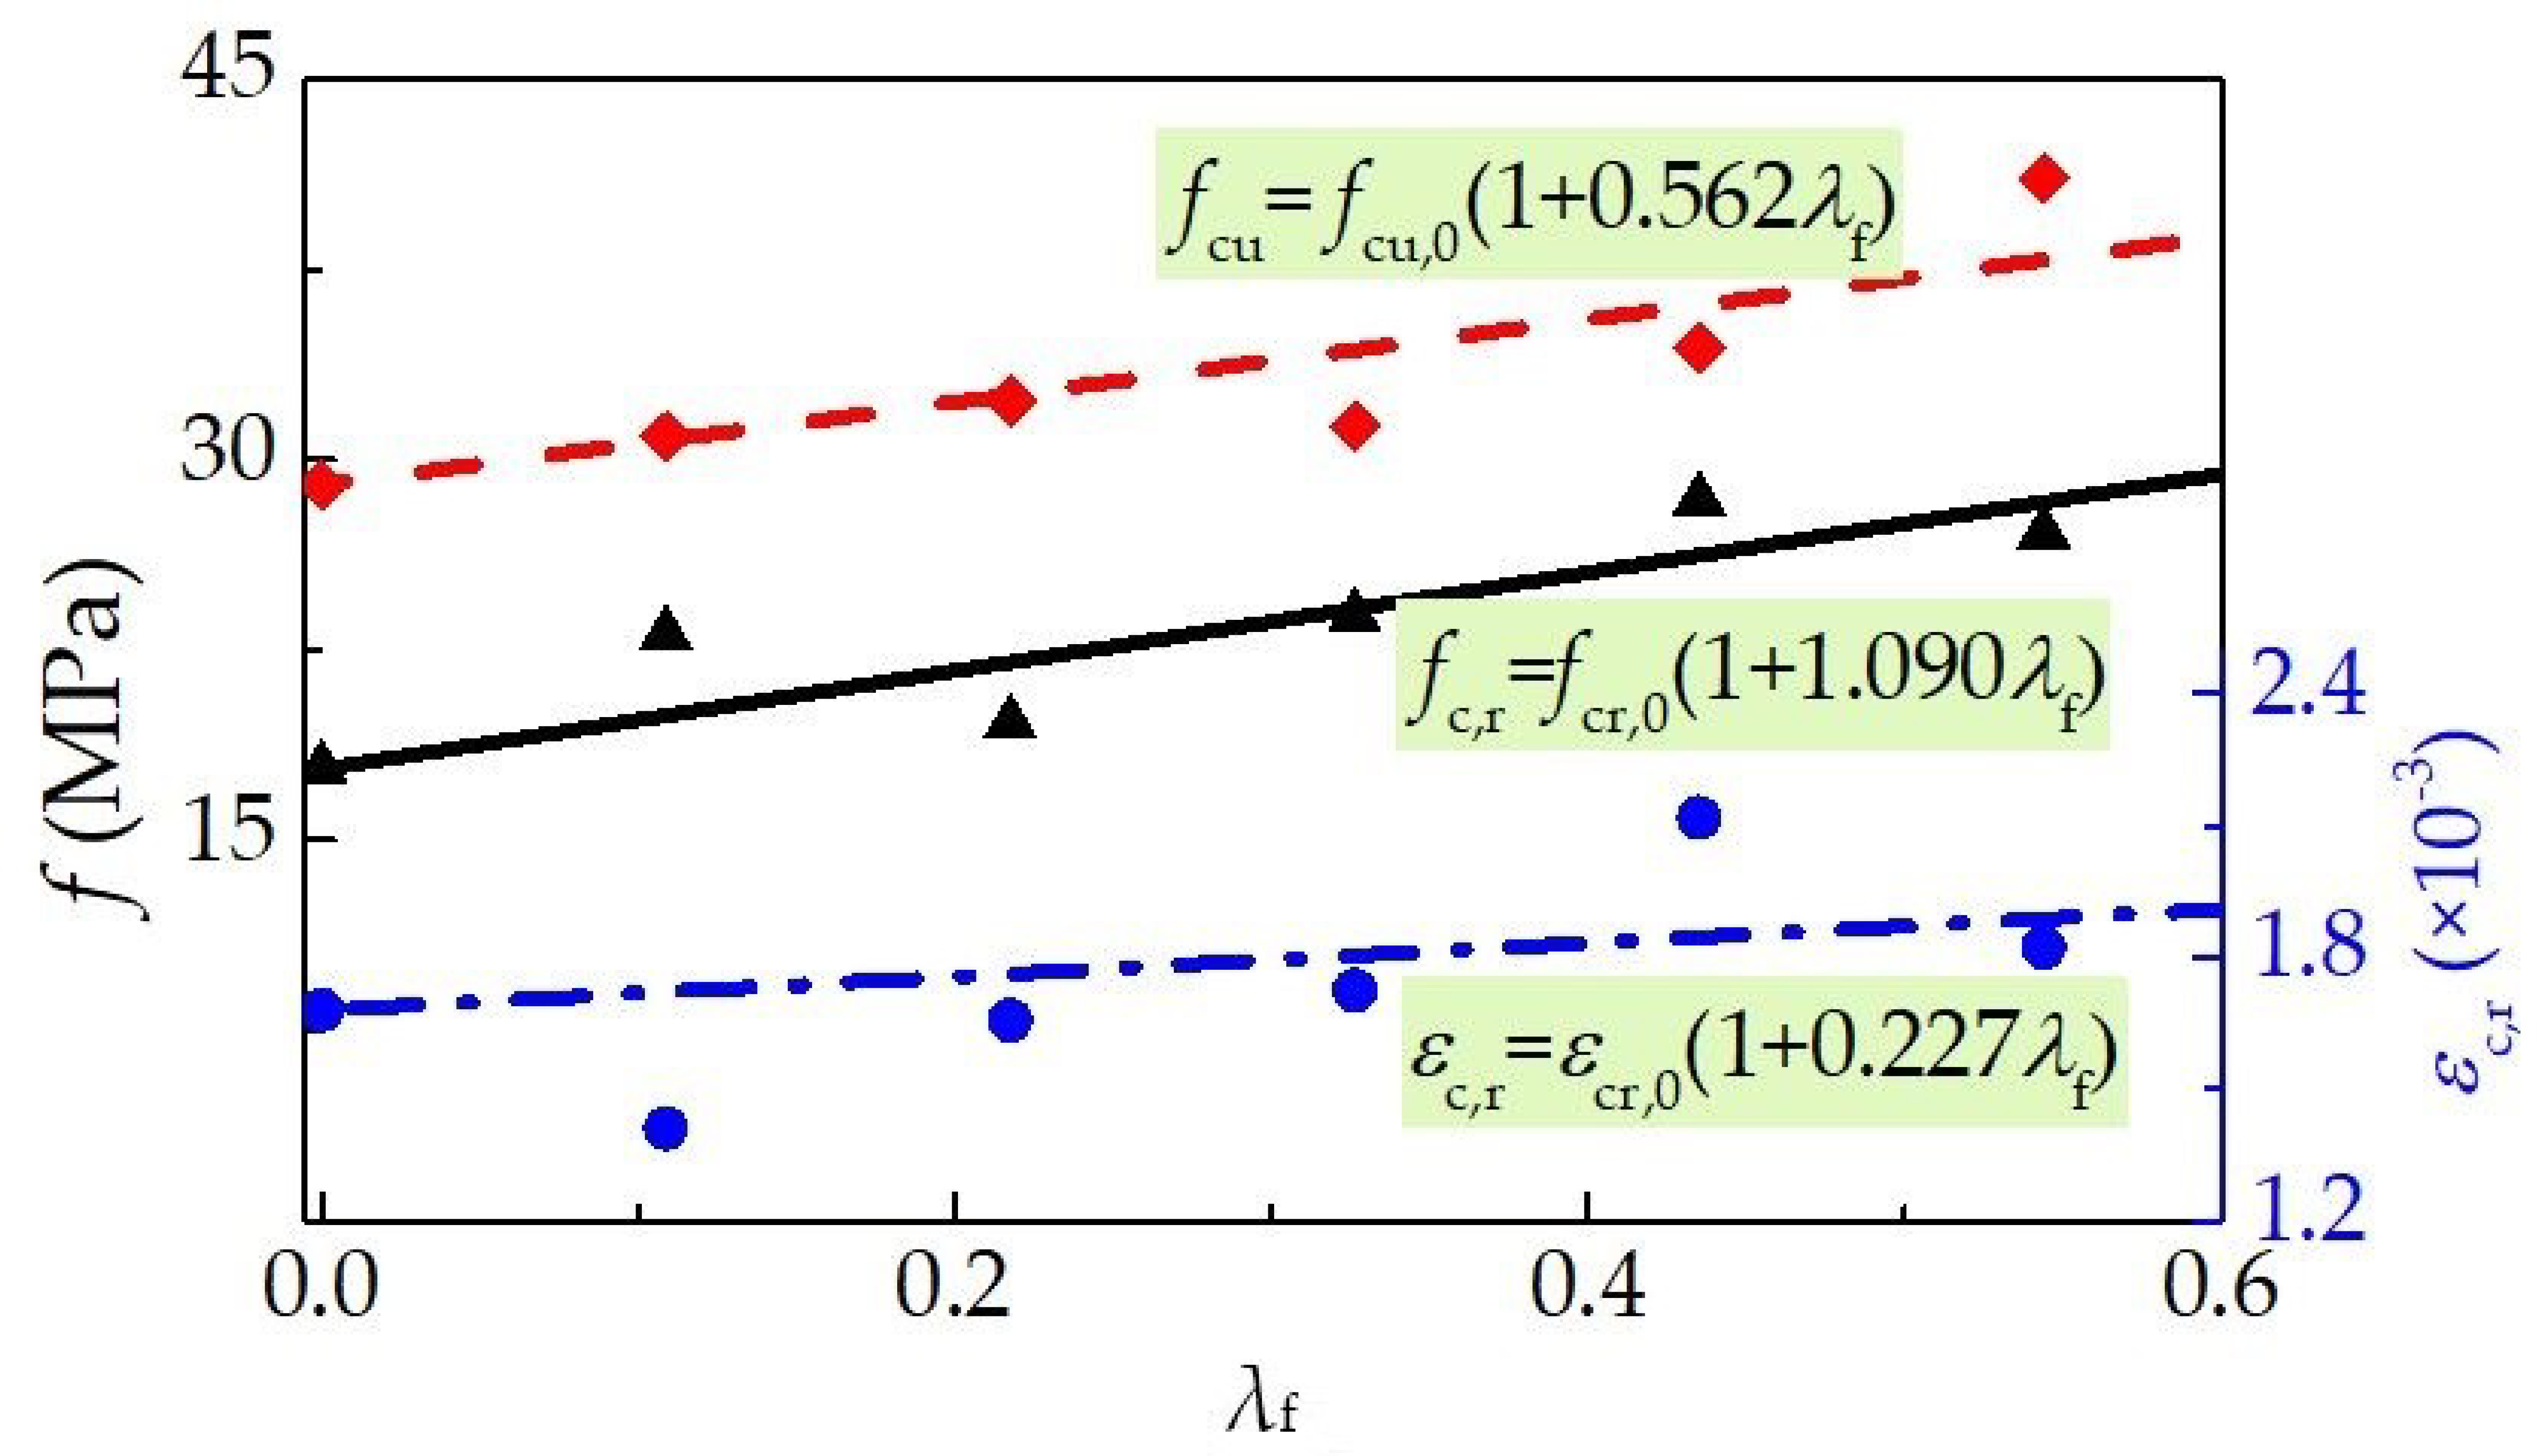
The test results of peak-stress (fc,r) and peak strain (εc,r) are summarized in Table 4 and exhibited in Figure 11, while the variation of cubic compressive strength fcu is also displayed, in which the fiber factor λf = lf/df·vf = 27.2vf. It can be seen that the compressive strengths and peak strains increased with the vf due to the enhanced restraining effect of steel fiber on the transversal deformation of the specimen. With the vf varying from 0% to 2.0%, the increments of fcu, fc,r and εc,r are 35.5%, 51.3% and 27.1%. According to the fitting formulas in Figure 11, the increment ratio of fcu, fc,r and εc,r with the increase of vf are 0.562, 1.090 and 0.227, respectively. This indicates that the effect of steel fiber on fc,r is higher than that on the fcu, and the values of fc,r/εc,r namely the secant modulus increase with the addition of steel fiber. The slope of ascending portion increased with the increasing volume fraction of steel fiber. Values of fc,r are about 0.6–0.8 times of fcu in Table 4, which are lower than that reported in the experiments of Li et al. [7] of flowing SFRELC with the same raw materials and mix proportions. This may be attributed to the slower loading rate having a significant effect on the testing results.
According to China code GB50010 [45], εcu was defined as the strain corresponding to 0.5fc,r at the descending portion of stress-strain curves. The test results are presented in Table 4, and exhibited in Figure 12 as the relative values of εcu/εc,r with a varying λf. The obvious increasing relationship between εcu/εc,r and λf indicates that the ductility of self-compacting SFRELC after breaking was promoted by the addition of steel fibers. With the vf increased from 0% to 2.0%, εcu/εc,r was from 1.87 to 7.11, 2.8 times increase. The maximum value was achieved at vf = 1.2%.

3.3. Compression Toughness

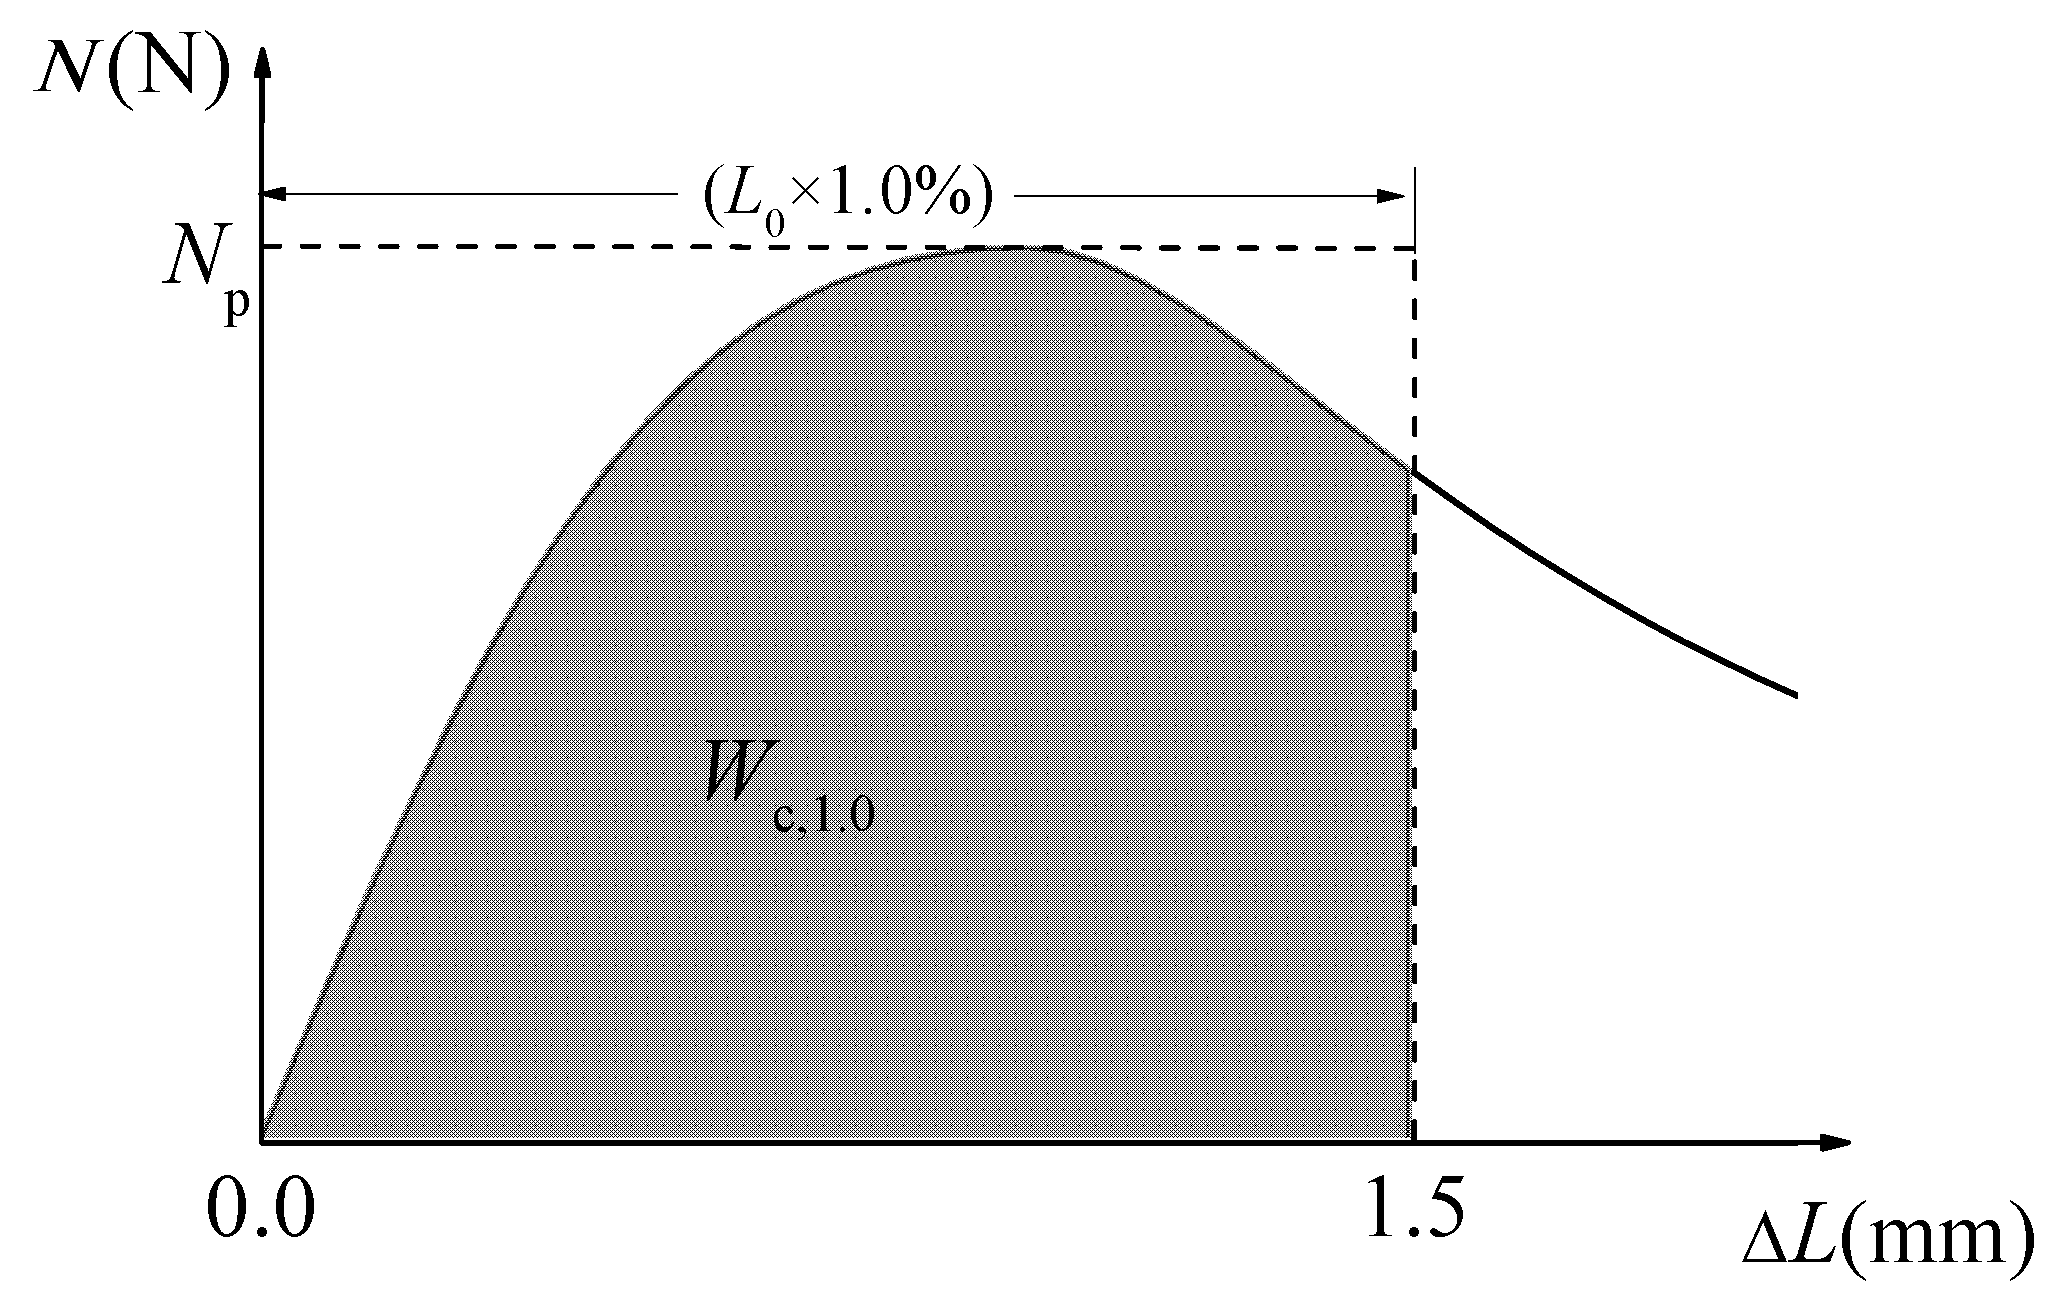
Table 4 summarizes the test results of compression absorbed energy (Wc,1.0) and compression toughness ratio (Re,1.0). The Wc,1.0 was calculated by the area under the compressive load-deformation curve within the uniaxial compressive deformation of 1.0% standard gauge length of 150 mm, as presented in Figure 13. Re,1.0 was used to evaluate the energy absorption ability of self-compacting SFRELC during compression deformation, which can be calculated as follows [9].
R e , 1.0 = W c , 1.0 N p L 0 × 1.0 %
where, Np is the peak compressive load, L0 is the standard gauge length.
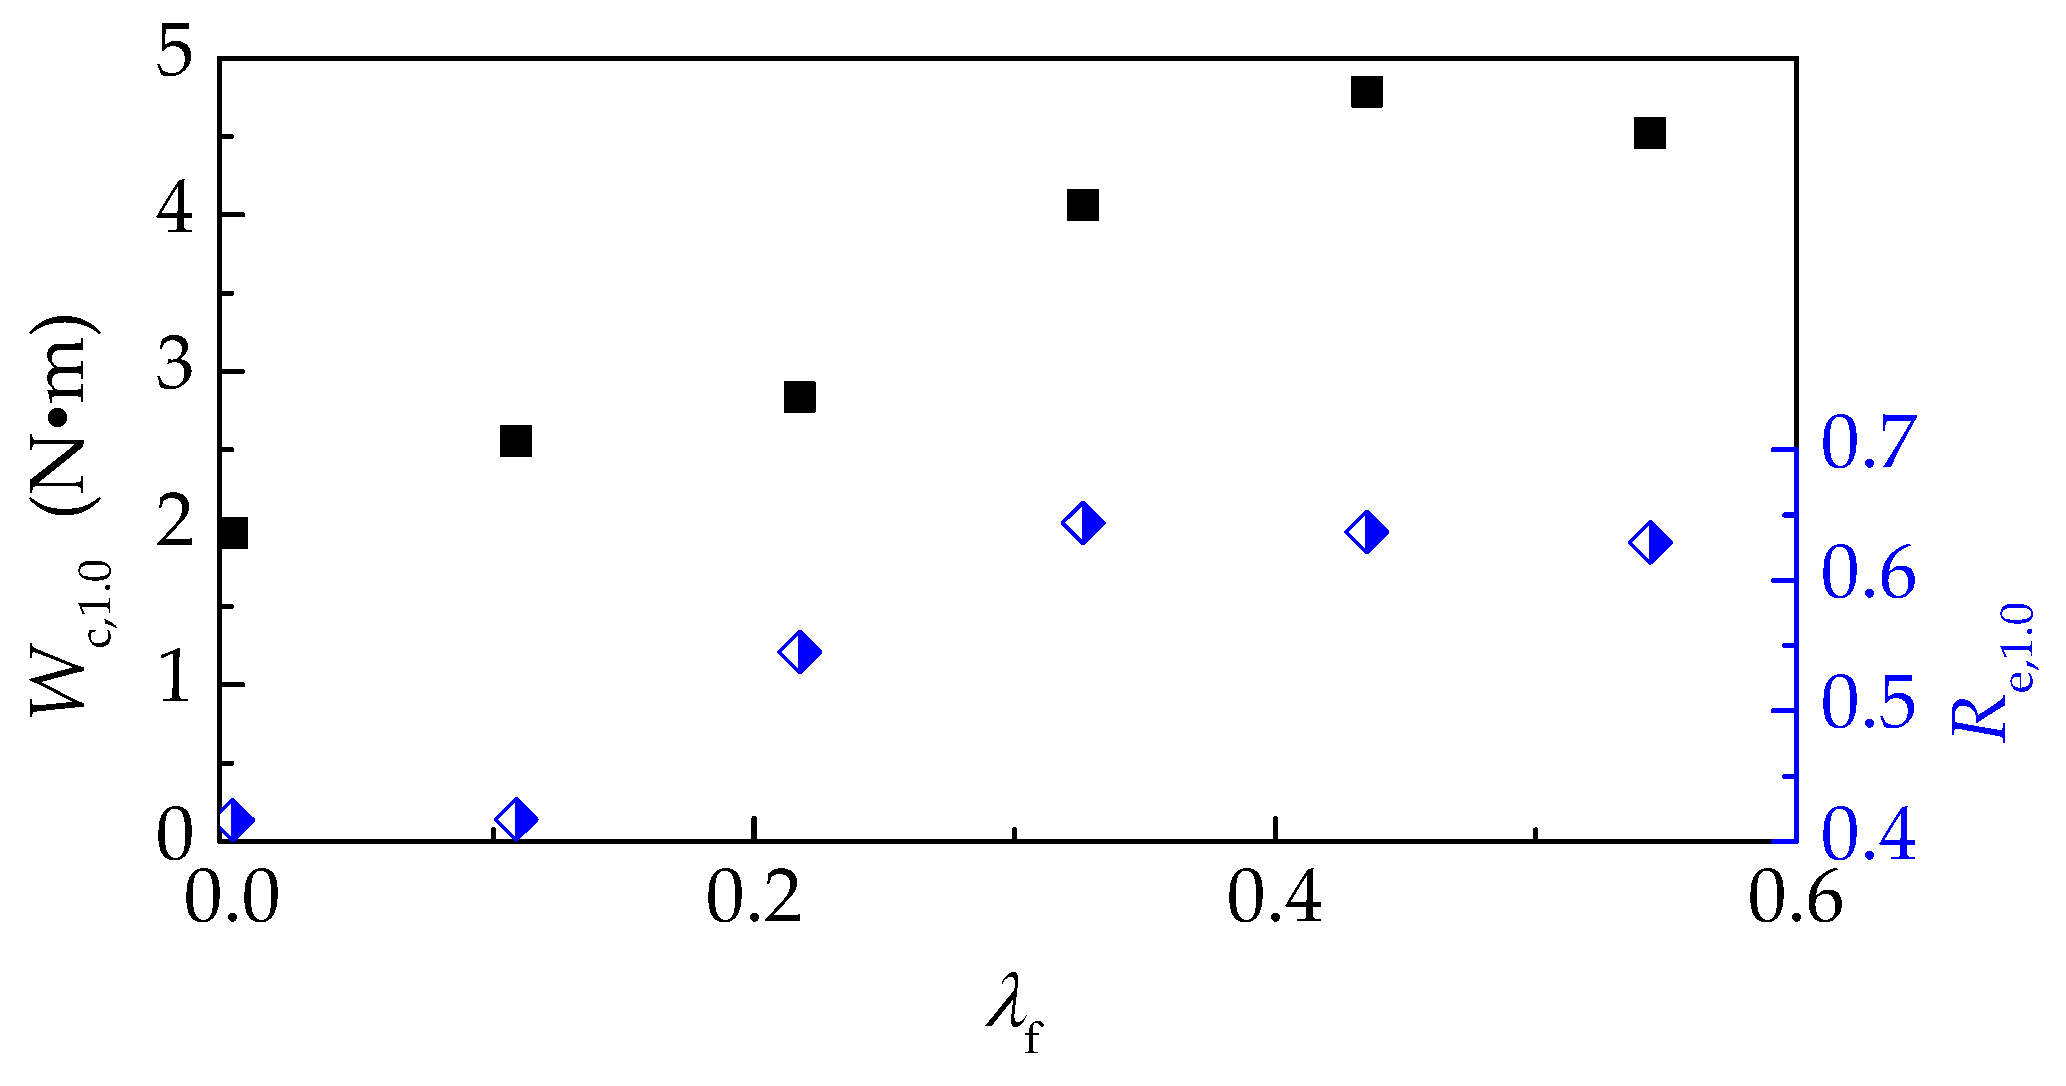
Figure 14 presents the variations of compression absorbed energy (Wc,1.0) and compression toughness ratio (Re,1.0). With the vf = 0.4%, the presence of steel fiber improves Wc,1.0 about 30% but almost no enhancement on Re,1.0. This indicates that the crack-bridging effect of smaller amount steel fibers mainly reflects at the pre-peak to arrest the transversal expanded deformation. With the vf varying from 0.4% to 1.2%, the toughening effect of steel fiber was outstanding, and the increments of Wc,1.0 and Re,1.0 were 59% and 54.5%, respectively. When the vf increased to 1.6% or 2.0%, Wc,1.0 and Re,1.0 had no significant promotion. This may be due to the unfavorable effect of large content steel fibers on the compactness of self-compacting SFRELC, which results in the decrease of loading capacities after peak loads. According to previous test results [9], the Re,1.0 of vibro-compacting SFRELC increased, even when vf was up to 2.0%. It can be said that the self-compacting SFRELC has a higher sensibility for steel fibers than the vibro-compacting SFRELC, and the volume fraction of steel fiber in self-compacting SFRELC should not be greater than 1.2%.

4. Evaluation for Compressive Stress-Strain Curve of Self-Compacting SFRELC

4.1. The Proposal Model

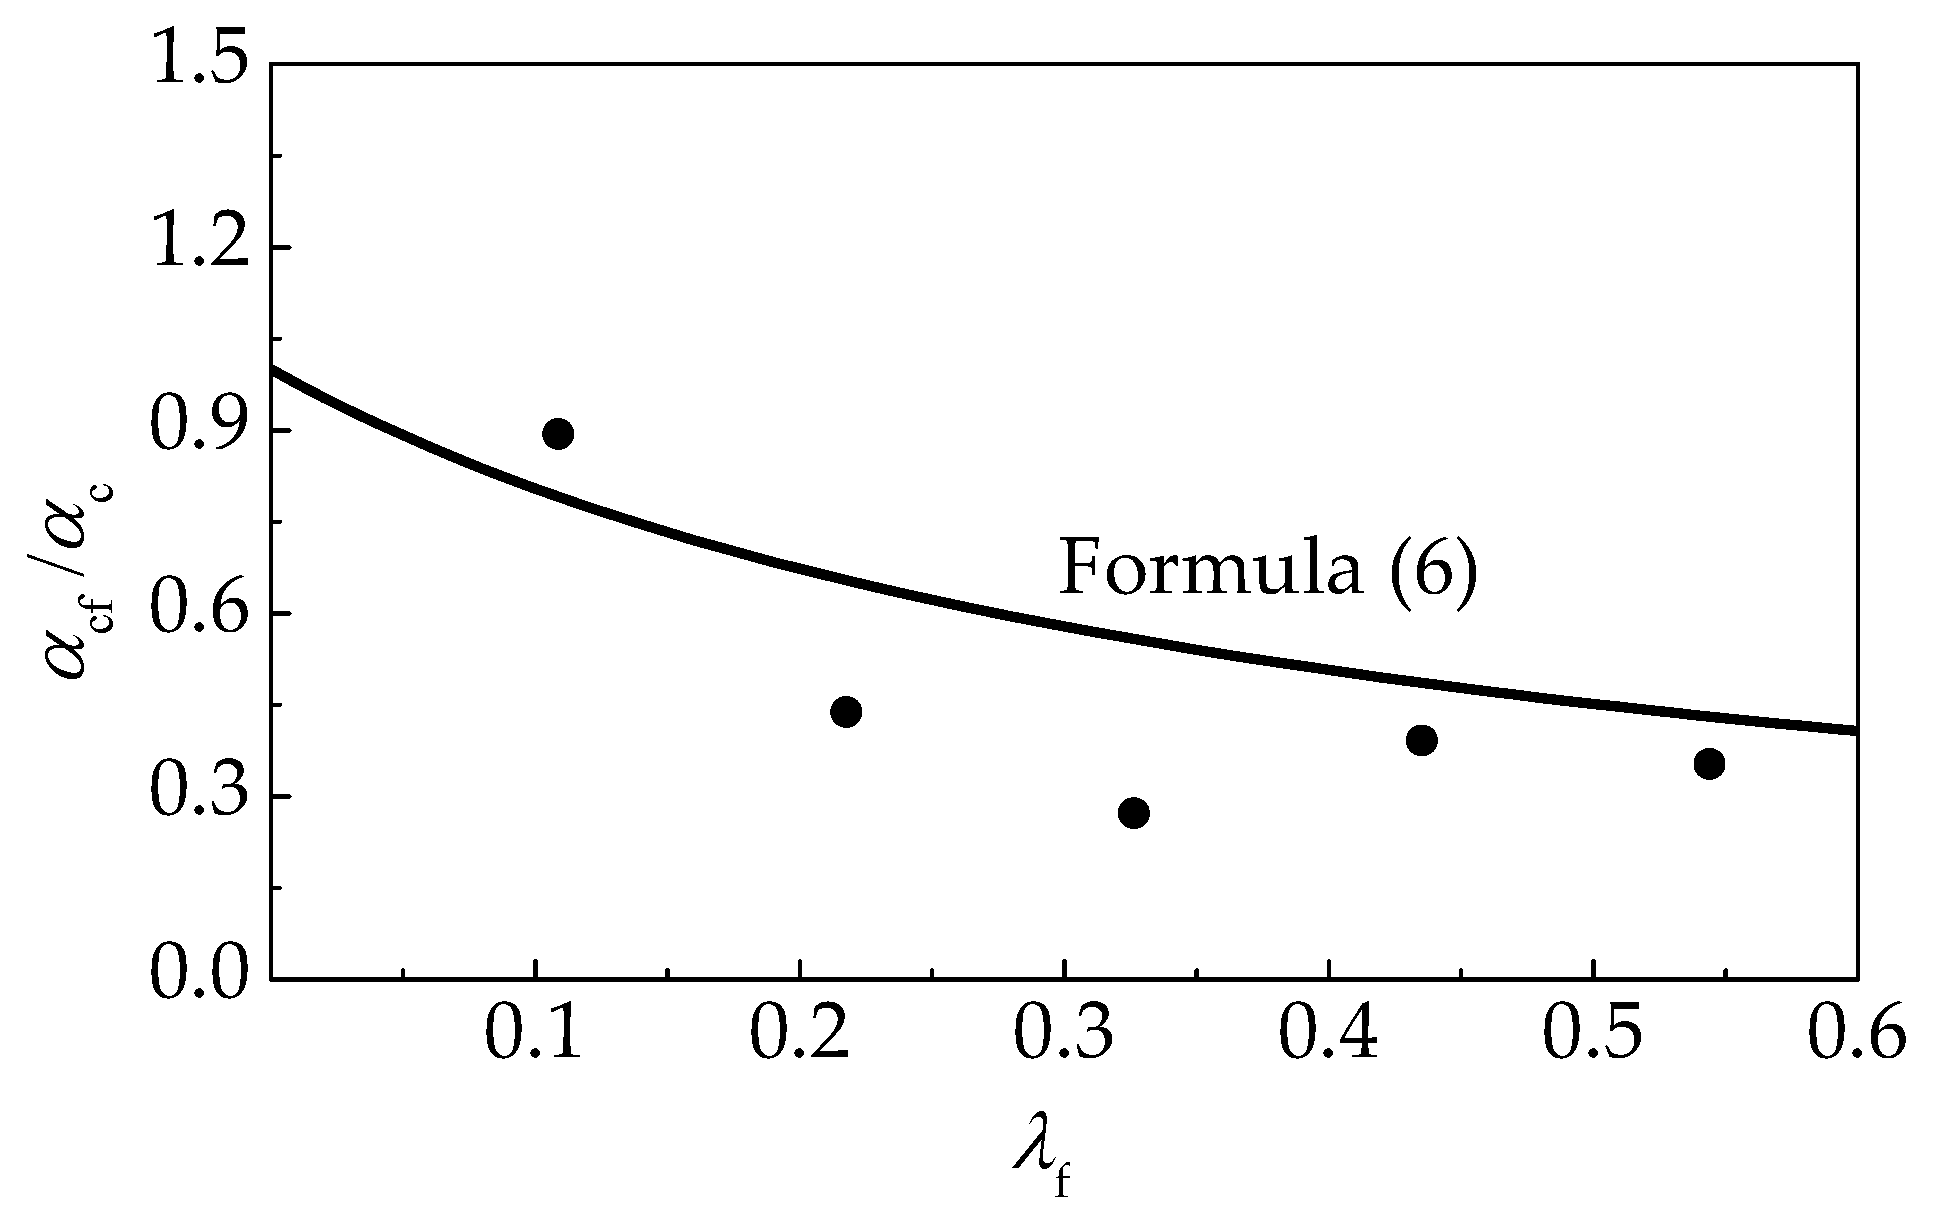
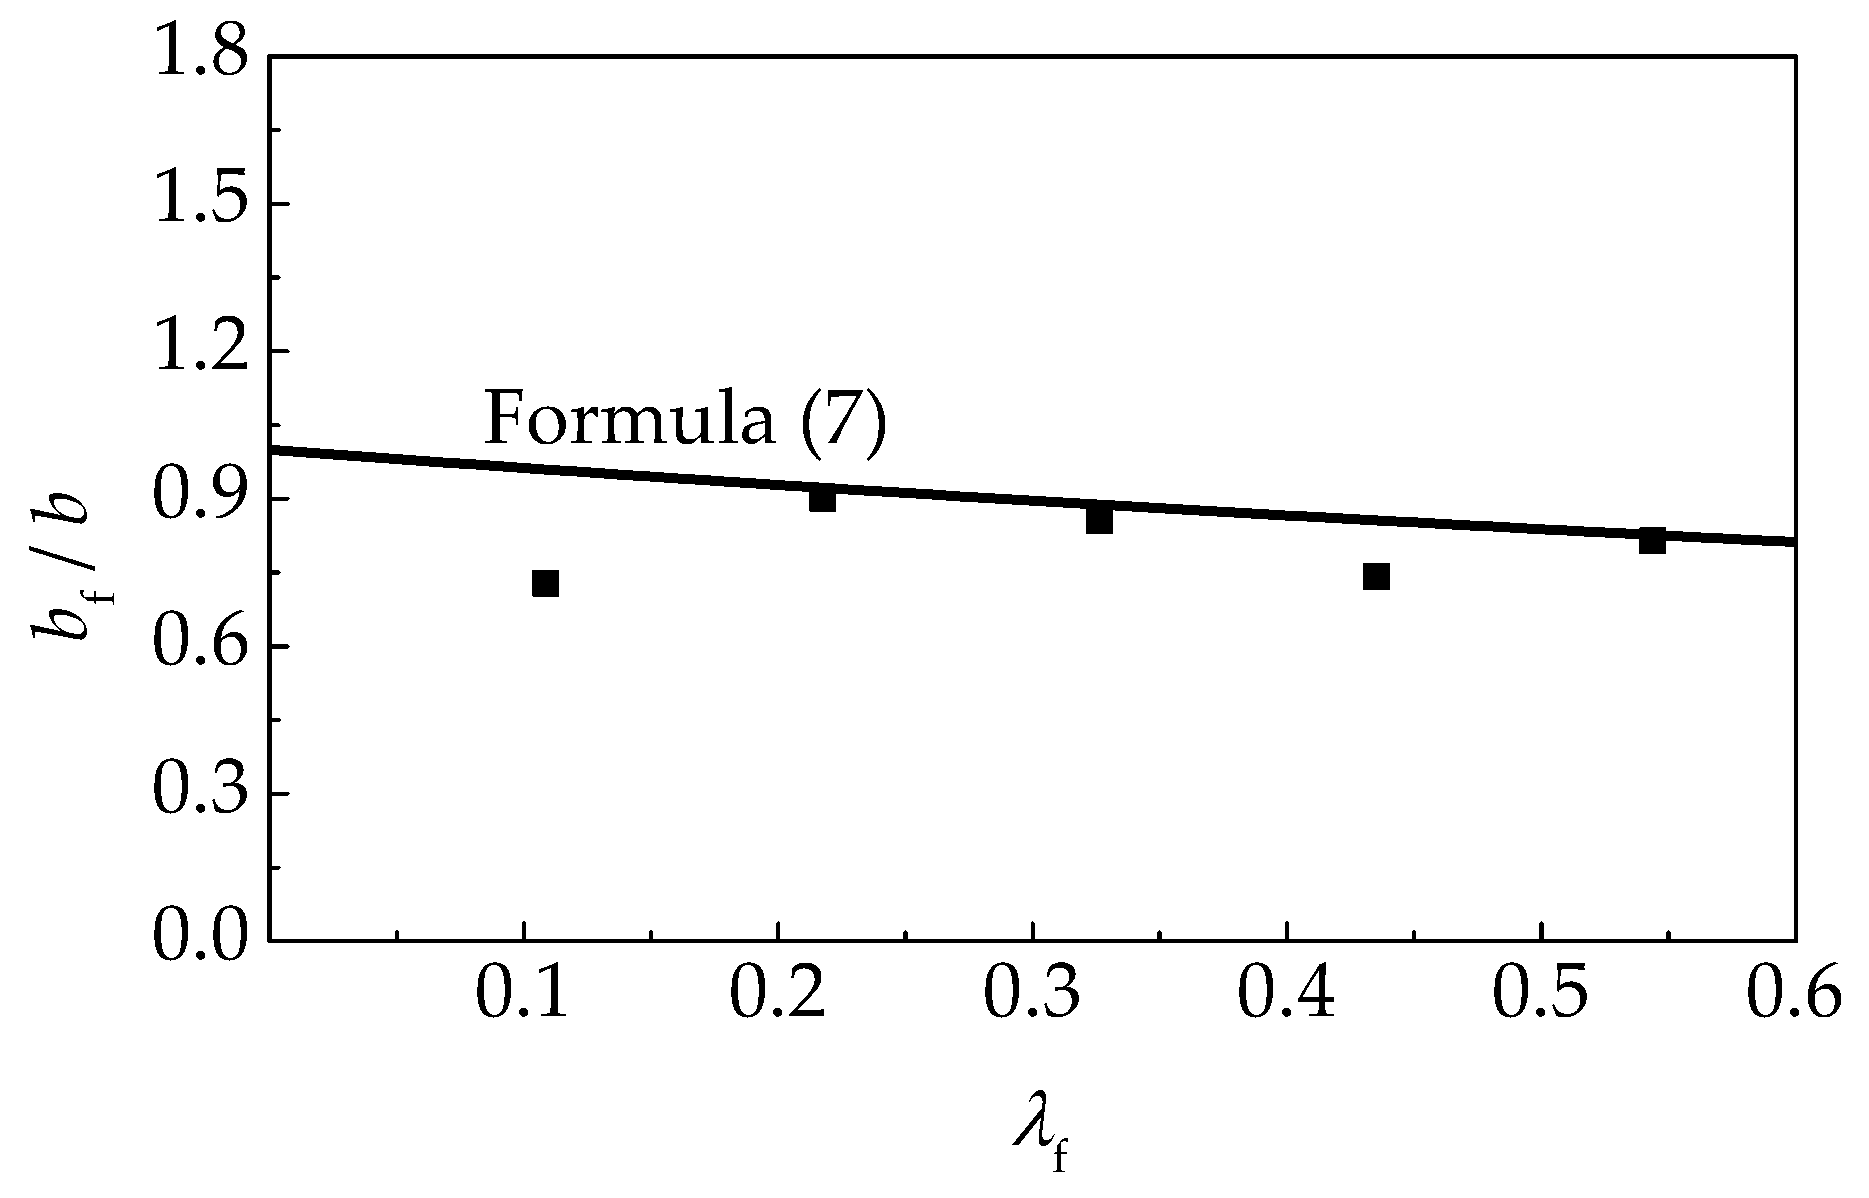
According to the China code GB50010 and previous report [11,45], the complete stress-strain curve of lightweight aggregate concrete and vibro-compacting SFRELC can be expressed as Formulas (2)–(4). The ascending portion of the curves were calculated by Formula (2), and the coefficient n was determined by Formula (3). The descending portions of curves were fitted using Formula (4), in which αc and b are statistical parameters relating to the shape of descending portion of the stress-strain curve of lightweight aggregate concrete. According to the calculation model in report [11], αc is calculated by Formula (5). For vibro-compacting SFRELC, αcf and bf have the same meanings with αc and b, and can be calculated by Formulas (6) and (7).
When 0 ≤ ε c ε c , r ≤ 1,
σ c f c , r = n ε c ε c , r n 1 + ( ε c ε c , r ) n
n = E c ε c , r E c ε c , r f c , r
When ε c ε c , r > 1,
σ c f c , r = ε c ε c , r α c ( ε c ε c , r 1 ) b + ε c ε c , r
α c = 0.00022 f c , r 2.75 + 0.746
α c , f / α c = 1 / ( 1 + 2.43 λ f )
b f / b = 1 / ( 1 + 0.386 λ f )
where, σc and εc are the stress and the strain at any point of stress-strain curve, n is a material parameter that depends on the shape of stress-strain curves, fc,r and εc,r are the peak-stress and the peak-strain respectively, Ec is the modulus of elasticity of concrete. λf is the fiber factor.
The tested values of αcf/αc and bf/b for self-compacting SFRELC are displayed in Figure 15 and Figure 16. A good fitness can be achieved compared with the calculation results of Formulas (6) and (7).
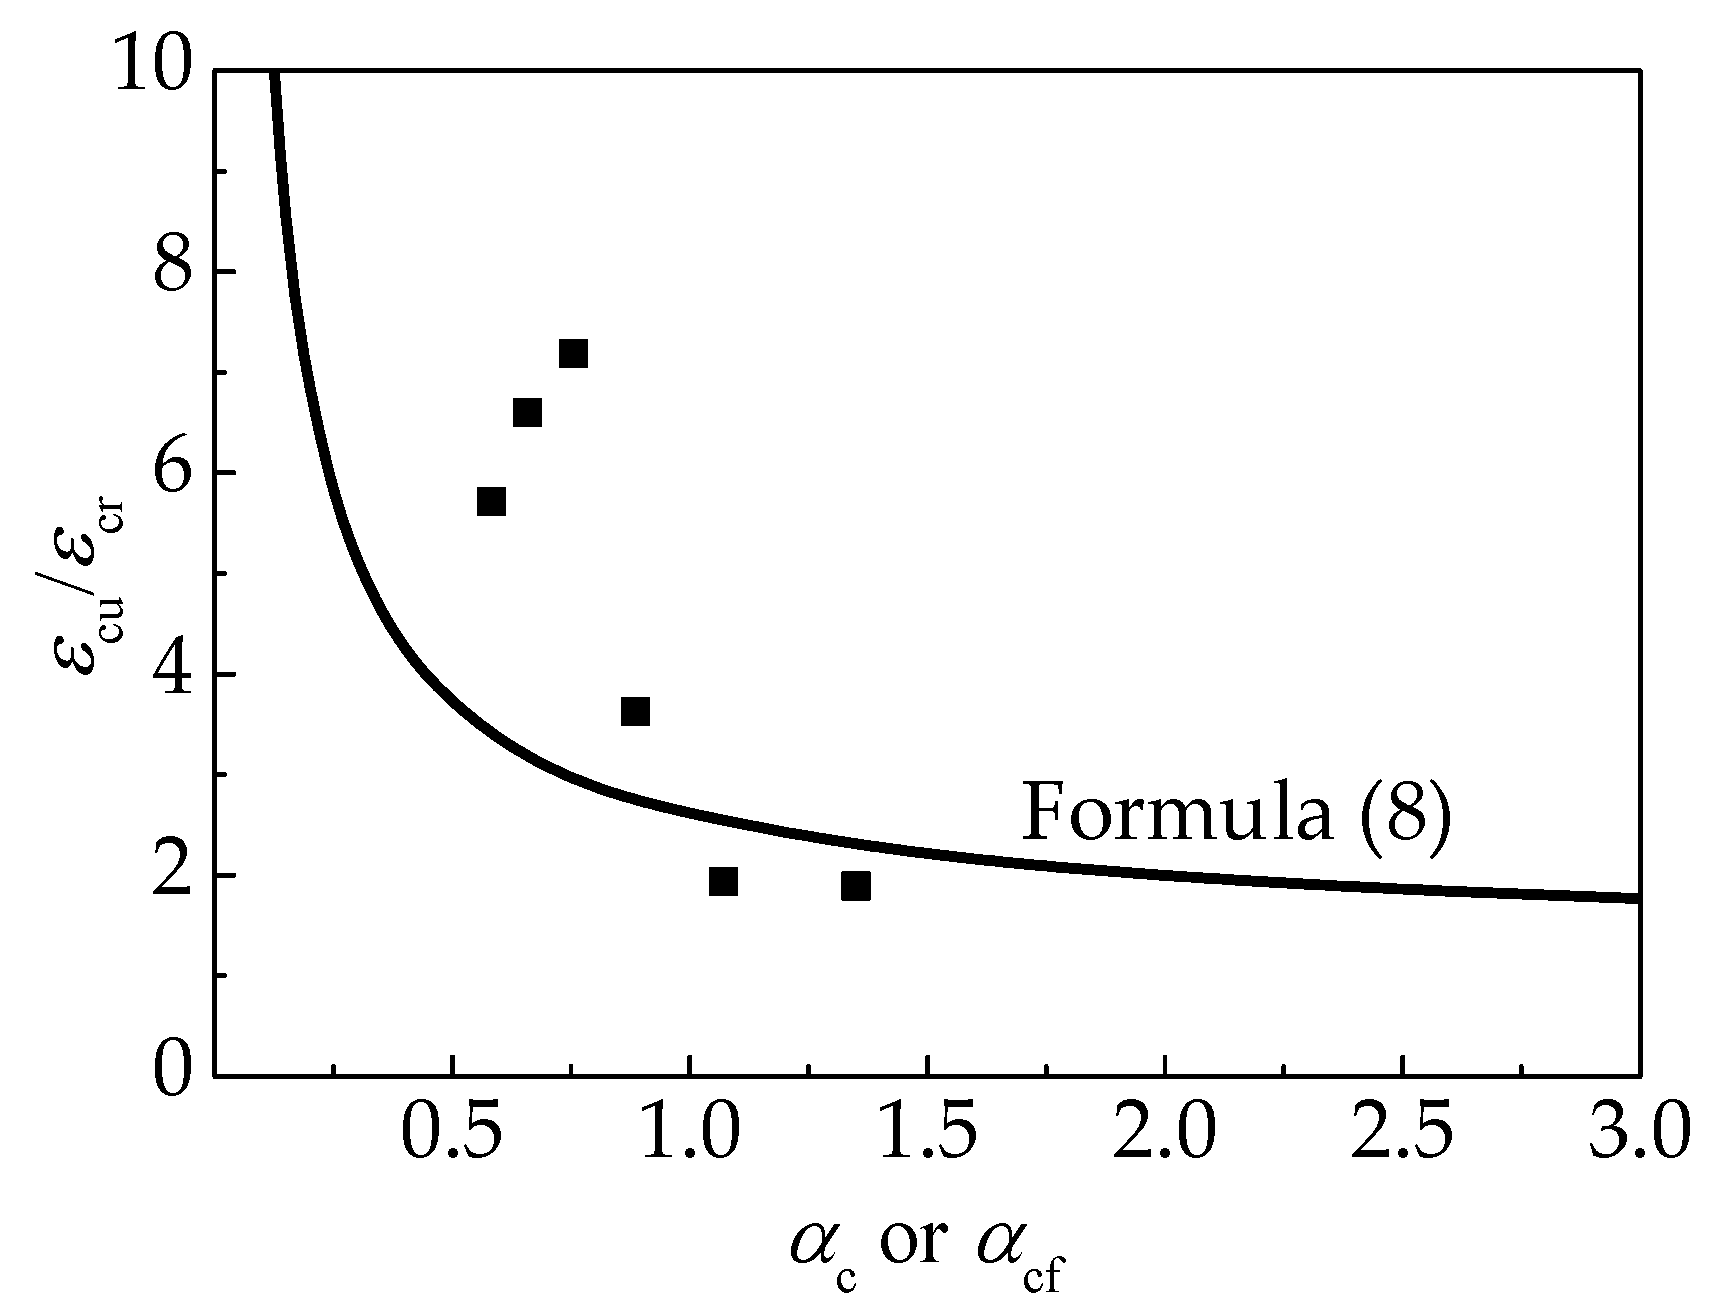
The relationship between εcu/εc,r and αc or αc,f is shown in Figure 17, which fits the Formula (8) specified in China Code GB50010 for conventional concrete as follows [45],
ε cu ε c , r = 1 2 α cf ( 1 + 2 α cf + 1 + 4 α cf )

4.2. Aslani’ Model

Aslani’s model for compressive stress–strain curves is the same in form with Formula (2) [32,33,34]. The material parameter n can be calculated by Formulas (9)–(14).
When 0 ≤ ε c ε c , r ≤ 1,
n = [ 1.02 1.17 ( E c 1 / E c ) ] 0.74 .
When ε c ε c , r > 1,
n = [ 1.02 1.17 ( E c 1 / E c ) ] 0.74 + ( ρ + 28 ω ) .
where,
ρ = ( 135.16 0.1744 f c , r ) 0.46
ω = 0.83 exp ( 911 / f c , r )
E c 1 = E c ( ν 1 ) ν
ν = f c , r 17 + 0.8 .
In these formulas, Ec1 is the secant modulus, and ρ,ω are the coefficients corresponding to the fc,r in Formula (10).

4.3. Cunha’ and FIP Model

The basic form for Cunha’s model and the FIP model [35,36,37] is presented as Formulas (15)–(17).
When ε c ε c , lim ,
σ c f c = E c E c 1 ε c ε c , r ( ε c ε c , r ) 2 1 + ( E c E c 1 2 ) ε c ε c , r .
When ε c ε c , lim ,
σ c f c = { [ 1 ε c , lim / ε c , r ξ ( 1 2 α ) 2 1 ( ε c , lim / ε c , r ) 2 1 α ] ( ε c ε c , r ) 2 + [ 1 ε c , lim / ε c , r 2 α ξ ( 1 2 α ) 2 ] ε c ε c , r } 1
ξ = 4 [ ( ε c , lim ε c , r ) 2 ( E c E c 1 2 ) + 2 ε c , lim ε c , r E c E c 1 ] [ ε c , lim ε c , r ( E c E c 1 2 ) + 1 ] 2 .
where, εc,lim is the limited strain at stress of αfc,r which may be calculated by Formula (18).
ε c , lim = 1 2 [ ( 1 α ) E c E c 1 + 2 α ] + [ 1 4 [ ( 1 α ) E c E c 1 + 2 α ] 2 α ] 0.5
For Cunha’s model, the parameter α is related to the curing age t of concrete as presented in Formula (19), and value of α at curing age t = 28d is 0.9.
α = 0.9 exp { 0.005 [ 1 ( 28 t ) 1.16 ] }
For the FIP model, α = 0.5.

4.4. Fitness with Tested Curves

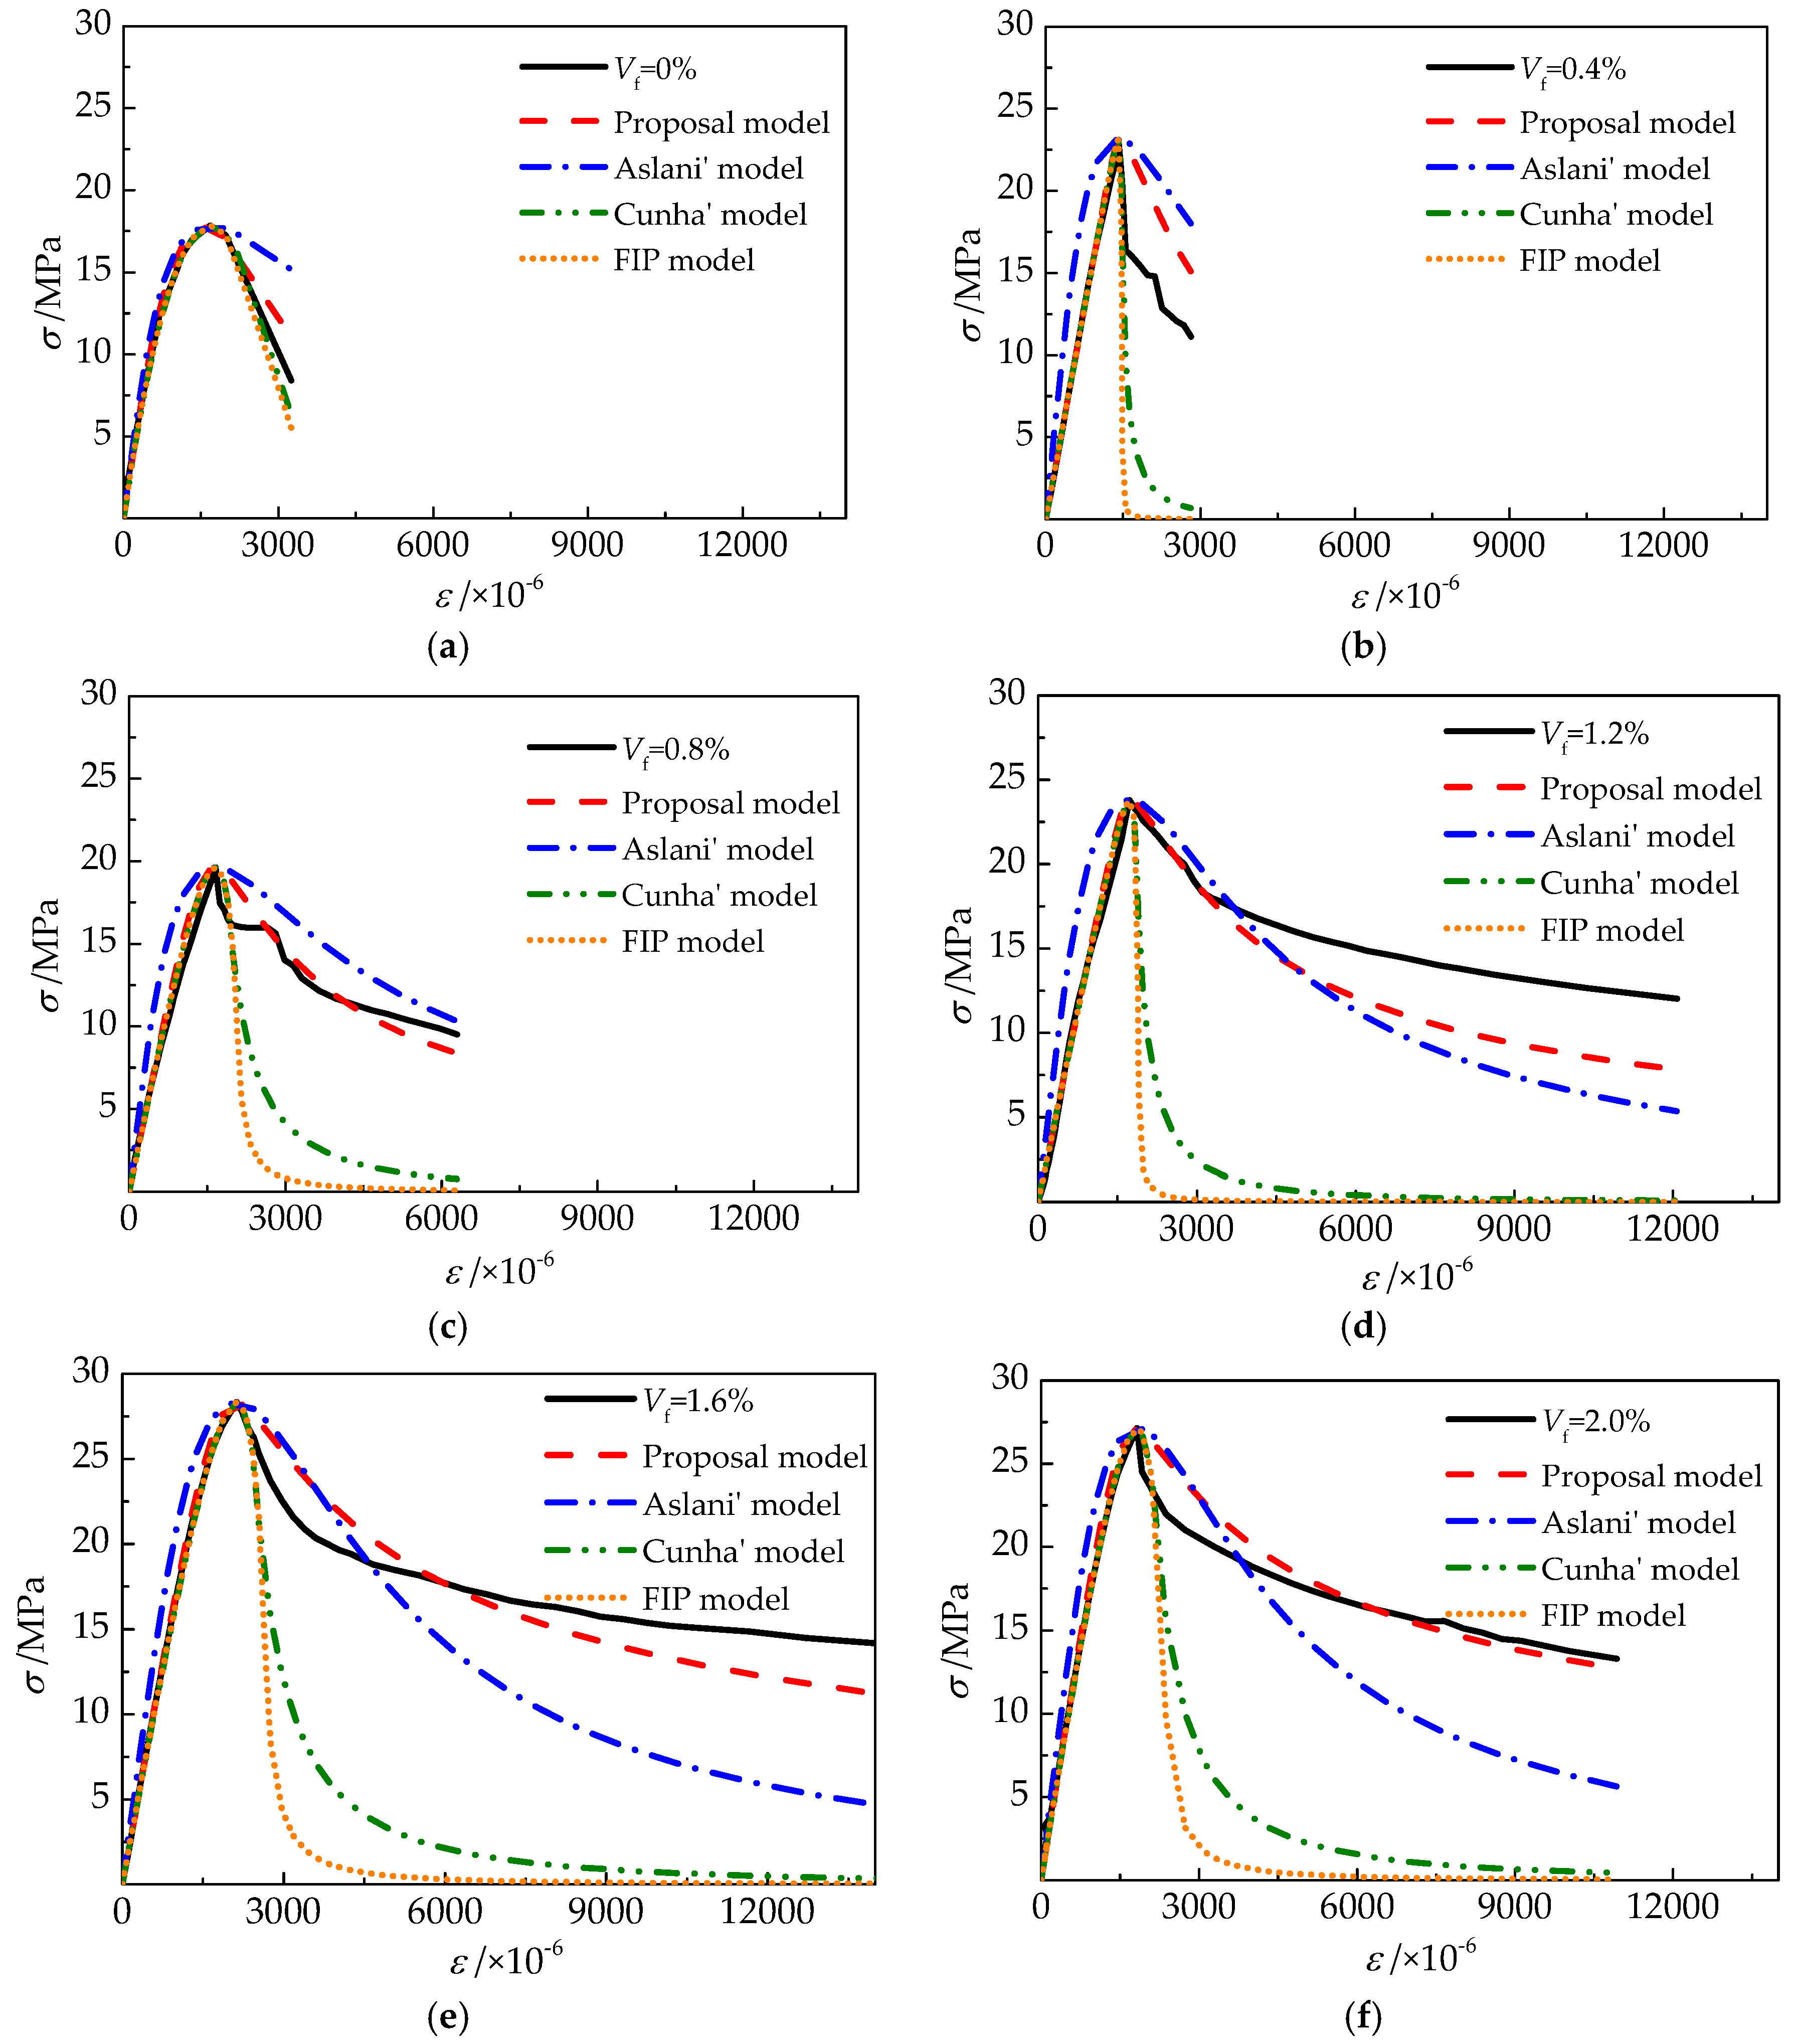
The tested compressive stress–strain curves are compared with the proposed model, Aslani’s model, Cunha’s model, and the FIP model, respectively. As exhibited in Figure 18, the good fitness by the four calculation models are in the order of the proposed model, Aslani’s model, Cunha’s model, and the FIP model. Based on the numerical analysis of test data, a similar conclusion will be obtained.
In this paper, the average predictive ratio of calculate to test stress (AVG) and coefficient of variation (COV) at the same strain are used to evaluate the degree of fitting. Formulas (20)–(21) are used to calculate the AVG and COV of fitting curves with the four models and results are displayed in Table 5.
A V G = ( i = 1 n σ cal σ c ) / n
C O V = S D / A V G
where, σc is the stress at any point of stress-strain curve,; σcal is the calculate stress at the same strain with σc, and SD is the standard deviation of σcal/σc.
For the proposed model, AVG and COV in the ascending portion are 0.935–1.101 and 0.019–0.185, while those in the descending portion are 0.991–1.303 and 0.065–0.156, with the volume fraction of steel fiber varying from 0% to 2.0%. For Aslani’s model, AVG and COV in the ascending portion are 0.875–1.665 and 0.090–0.273, and those in the descending portion are 0.811–1.413 and 0.051–0.356. For Cunha’s model, AVG and COV in the ascending portion are 0.875–1.098 and 0.023-0.181, and those in the descending portion are 0.189–0.947 and 0.138–1.557. For the FIP model, AVG and COV in the ascending portion are 0.458–1.098 and 0.023–0.345, and those in the descending portion are 0.092–0.300 and 0.281–2.765. These results display that nearly all of the four models but Aslani’s model have a good prediction for the ascending portion of the test curves. The proposed model is an effective predictor for complete test curves of self-compacting SFRELC. Aslani’s model shows a good fitness for curves of vf = 0–0.8%, but slightly worse than the proposed model when vf = 1.2–2.0%. Both Cunha’s model and the FIP model are inappropriate for the prediction of the descending portion in compressive stress–strain curves of self-compacting SFRELC.

5. Conclusions

Based on the test results and analysis, the following conclusions can be drawn:
(1)
Self-compacting SFRELC with a slump flow of larger than 600 mm was prepared in this experiment. Slump-flow and J-ring slump-flow decreased while slump-flow time (T500) increased with the increase of vf. Drying densities increased about 12.2% with the vf increased from 0% to 2.0%.
(2)
With the increasing vf, the uniaxial compressive stress-strain curves of self-compacting SFRELC trends to be steep at ascending portion and a slower slope at descending portion. With the vf varying from 0% to 2.0%, the increments of fcu, fc,r and εc,r are 35.5%, 51.3% and 27.1% respectively. Values of fc,r are about 0.6–0.8 times fcu, which may be attributed to the loading rate being slower than that used in the test of axial compressive strength. The residual strengths increased with the increase of volume fraction of steel fiber.
(3)
With the vf varied from 0.4% to 1.2%, the toughening effect of steel fiber was outstanding, and the increments of Wc,1.0 and Re,1.0 are 59% and 54.5%, respectively. When the vf reached to 1.6% and 2.0%, the Wc,1.0 and Re,1.0 had no significant promotion. Therefore, the optimal vf for self-compacting SFRELC can be taken as 1.2%.
(4)
Based on the values of AVG and COV for the predictive ratios, and a comparison of calculations and test curves, the proposed model has a good fitness with the tested curves of self-compacting SFRELC, and Aslani’s model is slightly worse. Cunha’s model and the FIP model are suitable for the ascending portion, but inappropriate for the descending portion. As such, the proposed model is suggested in this paper.

Author Contributions

Methodology, M.Z. and S.Z.; Tests, Data Interpretation and Writing-Original Draft Preparation, M.Z., B.Z., P.S. and Y.F.; Writing-Review and Editing, M.Z. and X.Z.; Writing-Review and Funding Acquisition, X.Z. and S.Z.

Funding

This study was funded by [State Key Research and Development Plan, China] grant number [2017YFC0703904], [NCWU Innovation Funds for Doctoral Candidate] grant number [201715601], [Key Scientific and Technological Research Project of University in Henan, China] grant number [16A560024], and [Innovative Sci-Tech Team of Eco-building Material and Structural Engineering of Henan Province, China] grant number [YKRZ-6-066].

Conflicts of Interest

The authors declare no conflict of interest.

References

  1. JGJ 51-2002. Ministry of Housing and Urban-Rural Construction of the People’s Republic of China. Technical Specification of Lightweight Aggregate Concrete; China Building Industry Press: China, Beijing, 2002. (In Chinese) [Google Scholar]
  2. JGJ12-2006. Ministry of Housing and Urban-Rural Construction of the People’s Republic of China. Technical Specification for Lightweight Aggregate Concrete Structures; China Building Industry Press: China, Beijing, 2006. (In Chinese) [Google Scholar]
  3. Hassanpour, M.; Shafigh, P.; Mahmud, H.B. Lightweight aggregate concrete fiber reinforcement—A review. Constr. Build. Mater. 2012, 37, 452–461. [Google Scholar] [CrossRef]
  4. Zhao, S.B.; Li, C.Y.; Qian, X.J. Experimental study on mechanical properties of steel fiber reinforced full lightweight concrete. Geotech. Special Pub. 2011, 212, 233–239. [Google Scholar]
  5. Pan, L.Y.; Yuan, H.; Zhao, S.B. Experimental study on mechanical properties of hybrid fiber reinforced full lightweight aggregate concrete. Adv. Mater. Res. 2011, 197–198, 911–914. [Google Scholar] [CrossRef]
  6. Li, C.Y.; Chen, H.; Zhao, S.B. Mechanical properties of steel fiber reinforced light-aggregate concrete. Adv. Mater. Res. 2012, 366, 12–15. [Google Scholar] [CrossRef]
  7. Li, X.K.; Shen, Z.; Chen, M.H.; Zhao, M.S. Experimental study on compressive properties of steel-fiber-reinforced lightweight-aggregate fly-ash concrete. J. Guangxi Univ. Nat. Sci. Ed. 2015, 1, 106–111. (In Chinese) [Google Scholar]
  8. Shen, Z.; Chen, M.H.; Zhao, M.S.; Li, X.K. Experimental study on tensile properties of steel fiber reinforced lightweight-aggregate fly-ash flowable concrete. In Architectural Engineering and New Materials; DEStech Publications, Inc.: Lancaster, PA, USA, 2015; pp. 1–8. [Google Scholar]
  9. Zhao, M.L.; Zhao, M.S.; Chen, M.H.; Li, J.; Law, D. An experimental study on strength and toughness of steel fiber reinforced expanded-shale lightweight concrete. Constr. Build. Mater. 2018, 183, 493–501. [Google Scholar] [CrossRef]
  10. Li, X.K.; Zhang, X.Y.; Li, M.Q.; Zhao, M.S.; Li, C.Y. Experiments on development of strength and carbonization of steel fiber reinforced full-lightweight concrete. J. Civ. Eng. Manage. 2017, 2, 46–50. (In Chinese) [Google Scholar]
  11. Zhao, S.B.; Zhao, M.S.; Zhang, X.Y.; Peng, Z.J.; Huang, T.H. Study on complete stress-strain curves of steel fiber reinforced lightweight-aggregate concrete under uniaxial compression. J. Build. Struct. 2019, 5, 181–190. (In Chinese) [Google Scholar]
  12. Li, X.K.; Li, C.Y.; Zhao, M.L.; Yang, H.; Zhou, S.Y. Testing and prediction of shear performance for steel fiber reinforced expanded-shale lightweight concrete beams without web reinforcements. Materials 2019, 12, 1594. [Google Scholar] [CrossRef] [PubMed]
  13. Zhao, M.S.; Zhang, X.Y.; Song, W.H.; Li, C.Y.; Zhao, S.B. Development of steel fiber reinforced expanded-shale lightweight concrete with high freeze-thaw resistance. Adv. Mater. Sci. Eng. 2018, 2018, 9573849. [Google Scholar]
  14. Zhao, S.B.; Li, C.Y.; Zhao, M.S.; Zhang, X.Y. Experimental study on autogenous and drying shrinkage of steel fiber reinforced lightweight-aggregate concrete. Adv. Mater. Sci. Eng. 2016, 2016, 2589383. [Google Scholar] [CrossRef]
  15. Li, J.J.; Chen, Y.H.; Wan, C.J. A mix-design method for lightweight aggregate self-compacting concrete based on packing and mortar film thickness theories. Constr. Build. Mater. 2017, 157, 621–634. [Google Scholar] [CrossRef]
  16. Wu, Z.M.; Zhang, Y.G.; Zheng, J.J.; Ding, Y.N. An experimental study on the workability of self-compacting lightweight concrete. Constr. Build. Mater. 2009, 23, 2087–2092. [Google Scholar] [CrossRef]
  17. Wang, Y.M.; Liu, X.J. Mix proportion design and basic mechanical property experiment of self- compacting lightweight concrete. Concrete 2012, 6, 111–113. (In Chinese) [Google Scholar]
  18. Wu, X.; Wang, J.F.; Fan, X.L.; Zhang, X.; Wu, Z.M. Thermal behavior of self-compacting lightweight concrete subjected to the elevated temperature. J. Mater. Sci. Eng. 2014, 32, 313–317. (In Chinese) [Google Scholar]
  19. Iqbal, S.; Ali, A.; Holschemacher, K.; Bier, T.A. Mechanical properties of steel fiber reinforced high strength lightweight self-compacting concrete (SHLSCC). Constr. Build. Mater. 2015, 98, 325–333. [Google Scholar] [CrossRef]
  20. Zhang, Y.G.; Wu, X.; Bi, Q.W. Shrinkage and creep performance of self-consolidating lightweight concrete. J. Mater. Sci. Eng. 2014, 32, 35–39. (In Chinese) [Google Scholar]
  21. Wu, X.; Fu, T.F.; Wu, Z.M. Experimental study on double-K fracture parameters and fracture energy of self-consolidating lightweight concrete. Eng. Mech. 2010, 27, 249–254. (In Chinese) [Google Scholar]
  22. Wang, Z.Y.; Ding, J.T.; Guo, Y.S. Stress-strain curves of structural lightweight aggregate concretes. Concrete. 2005, 3, 39–41. (In Chinese) [Google Scholar]
  23. Liu, X.; Yin, J.; He, Y.Q.; Hou, Y. Experimental study of stress-strain curves of lightweight aggregate concrete. J. Inner Mongolia Univ. Sci. Technol. 2010, 29, 277–280. (In Chinese) [Google Scholar] [CrossRef]
  24. Wang, Y.Q.; Wang, C.R.; Chen, Y.X.; Ni, Y. Stress-strain relationships for concrete in axial compression. J. Tianjin Univ. 1983, 2, 29–40. (In Chinese) [Google Scholar]
  25. Campione, G.; Mendola, L.L. Behavior in compression of lightweight fiber reinforced concrete confined with transverse steel reinforcement. Cem. Concr. Compos. 2004, 26, 645–656. [Google Scholar] [CrossRef]
  26. Floyd, O.S.; Arthur, H.N.; Salvador, M. Mechanical properties of high-strength lightweight concrete. ACI J. 1986, 83, 606–613. [Google Scholar]
  27. Zhang, M.H.; Gjvorv, O.E. Mechanical Properties of High-Strength Lightweight Concrete. Aci Mater. J. 1991, 88, 240–247. [Google Scholar]
  28. Shannag, M.J. Characteristics of lightweight concrete containing mineral admixtures. Constr. Build. Mater. 2011, 25, 658–662. [Google Scholar] [CrossRef]
  29. Oğuz, A.D.; Rüstem, G.; Abdulkadir, C.A. Effect of steel fibers on the mechanical properties of natural lightweight aggregate concrete. Mater. Lett. 2005, 59, 3357–3363. [Google Scholar]
  30. Shafigh, P.; Mahmud, H.; Jumaat, M.Z. Effect of steel fiber on the mechanical properties of oil palm shell lightweight concrete. Mater. Des. 2011, 32, 3926–3932. [Google Scholar] [CrossRef]
  31. Lucyna, D. Modification of properties of structural lightweight concrete with steel fibres. J. Civ. Eng. Manag. 2011, 17, 36–44. [Google Scholar]
  32. Ding, X.X.; Li, C.Y.; Li, Y.Z.; Lu, Y.Z.; Song, C.; Zhao, S.B. Experimental and numerical study on stress-strain behavior of self-compacting SFRC under uniaxial compression. Constr. Build. Mater. 2018, 185, 30–38. [Google Scholar] [CrossRef]
  33. Aslani, F.; Nejadi, S. Mechanical characteristics of self-compacting concrete with and without fibres. Mag. Concr. Res. 2013, 65, 608–622. [Google Scholar] [CrossRef] [Green Version]
  34. Aslani, F.; Nejadi, S. Self-compacting concrete incorporating steel and polypropylene fibers: Compressive and tensile strengths, moduli of elasticity and rupture, compressive stress–strain curve, and energy dissipated under compression. Compos. Part B Eng. 2013, 53, 121–133. [Google Scholar] [CrossRef]
  35. Cunha, V.M.C.F.; Barros, J.A.O.; Sena-Cruz, J. Modelling the influence of age of steel fibre reinforced self-compacting concrete on its compressive behavior. Mater. Struct. 2008, 41, 465–478. [Google Scholar] [CrossRef]
  36. Aslani, F.; Natoori, M. Stress-strain relationships for steel fiber reinforced self-compacting concrete. Struct. Eng. Mech. 2013, 46, 295–322. [Google Scholar] [CrossRef]
  37. Comité Euro–International du Béton. CEB-FIP Model Code 1990–Design Code; Redwood Books: Trowbridge, UK, 1993. [Google Scholar]
  38. GB 175-2007. General Administration of Quality Supervision, Inspection and Quarantine of the People’s Republic of China. Common Portland Cement; China Standard Press: Beijing, China, 2007. (In Chinese) [Google Scholar]
  39. GB/T 1596-2005. General Administration of Quality Supervision, Inspection and Quarantine of the People’s Republic of China. Fly Ash Used for Cement and Concrete; China Standard Press: Beijing, China, 2005. (In Chinese) [Google Scholar]
  40. GB/T 17431.2-2010. Ministry of Housing and Urban-Rural Construction of the People’s Republic of China. Lightweight aggregates and Its Test Methods—Part 2: Test Methods for Lightweight Aggregates; China Building Industry Press: Beijing, China, 2010. (In Chinese) [Google Scholar]
  41. JGJ/T 283-2012. Ministry of Housing and Urban-Rural Construction of the People’s Republic of China. Technical Specification for Application of Self-compacting Concrete; China Building Industry Press: Beijing, China, 2012. (In Chinese) [Google Scholar]
  42. GB/T 50081-2002. Ministry of Housing and Urban-Rural Construction of the People’s Republic of China. Standard for Test Method of Mechanical Properties on Ordinary Concrete; China Building Industry Press: Beijing, China, 2002. (In Chinese) [Google Scholar]
  43. CECS 13:2009. Ministry of Housing and Urban-Rural Construction of the People’s Republic of China. Standard Test Methods for Fiber Reinforced Concrete; China Standard Press: Beijing, China, 2009. (In Chinese) [Google Scholar]
  44. American Concrete Institute. Design Considerations for Steel Fiber Reinforced Concrete; ACI 544.4R; ACI Committee 544: Farmington Hills, MI, USA, 1988. [Google Scholar]
  45. GB 50010-2010. Ministry of Housing and Urban-Rural Construction of the People’s Republic of China. Code for Design of Concrete Structures; China Building Industry Press: Beijing, China, 2010. (In Chinese) [Google Scholar]
Figure 1. Figures of raw materials: (a) coarse expanded-shale; (b) ceramsite sand; (c) steel fiber.
Materials 12 02979 g001
Figure 2. Grading curves of coarse expanded-shale and ceramsite sand.
Materials 12 02979 g002
Figure 3. Water absorption curves of ceramsite sand and coarse expanded-shale.
Materials 12 02979 g003
Figure 4. Equipment and instrument used in the test: (a) overall perspective; (b) testing device for load and deformation.
Materials 12 02979 g004
Figure 5. Tests for the workability of fresh self-compacting SFRELC: (a) testing device; (b) slump flow; (c) J-ring slump flow.
Materials 12 02979 g005
Figure 6. Slump flow with a varying vf.
Materials 12 02979 g006
Figure 7. Slump flow time with a varying vf.
Materials 12 02979 g007
Figure 8. Variation of the air content with vf.
Materials 12 02979 g008
Figure 9. Variation of the density with vf.
Materials 12 02979 g009
Figure 10. Stress-strain curves of tested self-compacting SFRELC with different vf.
Materials 12 02979 g010
Figure 11. Variation of fcu, fc,r and εc,r with a varying λf.
Materials 12 02979 g011
Figure 12. Change of εcu/εc,r with λf.
Materials 12 02979 g012
Figure 13. Calculation diagram for Re,1.0.
Materials 12 02979 g013
Figure 14. Variation of Wc,1.0 and Re,1.0 with a varying λf.
Materials 12 02979 g014
Figure 15. Relationship between λf and αcf/αc.
Materials 12 02979 g015
Figure 16. Relationship between λf and bf/b.
Materials 12 02979 g016
Figure 17. Relationship between εcu/εc,r and αc/αc,f.
Materials 12 02979 g017
Figure 18. Test and calculated stress-strain curves of self-compacting SFRELC. (a) vf = 0%; (b) vf = 0.4%; (c) vf = 0.8%; (d) vf = 1.2%; (e) vf = 1.6%; (f) vf = 2.0%.
Materials 12 02979 g018
Table 1. Physical and mechanical properties of cement.
Density
(kg/m3)
Water Requirement of Normal Consistency
(%)
Setting Time (min)Compressive Strength (MPa)Flexural Strength (MPa)
InitialFinal3d28d3d28d
308526.416024529.454.76.29.4
Table 2. Physical and mechanical properties of expanded shale and ceramsite sand.
Particle Size (mm)Apparent Density (kg/m3)Bulk Density (kg⋅m3)1 h Water Absorption (%)Mud Content (%)Cylinder Compressive Strength (MPa)
5–2012628276.980.77.4
0.16–513508509.020.11-
Table 3. Mix proportion of self-compacting SFRELC.
w/bvf (%)Volume Ratio of Sand
(%)
Cement (kg/m3)Fly Ash (kg/m3)Coarse Aggregate (kg/m3)Fine Aggregate (kg/m3)Super-Plasticizer (kg/m3)
0.300504081754244170.210
0.4504194220.210
0.8504134280.210
1.2523914500.214
1.6543684720.222
2.0563464940.231
Table 4. Test result of compressive strength and toughness.
w/cvf
(%)
λffcu
(MPa)
fc,r
(MPa)
εc,r
(×10−3)
εc,u
(×10−3)
Ec
(GPa)
Wc,1.0
(N·mm)
Re,1.0
0.300029.01 17.841.6801 3.176521.57196766.10.42
0.40.108830.92 23.131.4116 2.731717.14255427.20.42
0.80.217632.28 19.621.6569 6.011415.35283445.10.55
1.20.326431.30 23.81.7252 12.396415.13406151.20.64
1.60.435234.41 28.352.1190 13.984717.42478505.50.64
2.00.54441.12 27.131.8224 10.413219.72452164.40.63
Table 5. Calculation results of AVG and COV.
vf/%Proposal ModelAslani’s ModelCunha’s ModelFIP Model
Ascending PortionAscending PortionAscending PortionDescending PortionAscending PortionDescending PortionAscending PortionDescending Portion
AVGCOVAVGCOVAVGCOVAVGCOVAVGCOVAVGCOVAVGCOVAVGCOV
01.0170.1771.080.1440.8750.1981.2340.3090.8750.1810.9470.1380.4580.3450.8070.281
0.41.0180.0231.3030.1011.6030.21.4130.1431.0190.0230.3590.9811.0190.0230.1532.152
0.80.9880.1341.0250.0881.380.1251.1580.0510.9690.1220.4560.8370.9690.1220.31.396
1.21.1010.1270.8670.1561.6650.2730.8320.2651.0980.130.1891.5571.0980.130.0922.765
1.61.0180.0190.9910.1111.2660.090.8110.3560.9950.0230.3181.0910.9950.0230.1981.739
2.00.9350.1851.0360.0651.1530.1680.8250.3150.9110.1770.3041.0990.9110.1770.1821.685