Effects of Rubber Size on the Cracking Resistance of Rubberized Mortars

Abstract
:1. Introduction
2. Experiments
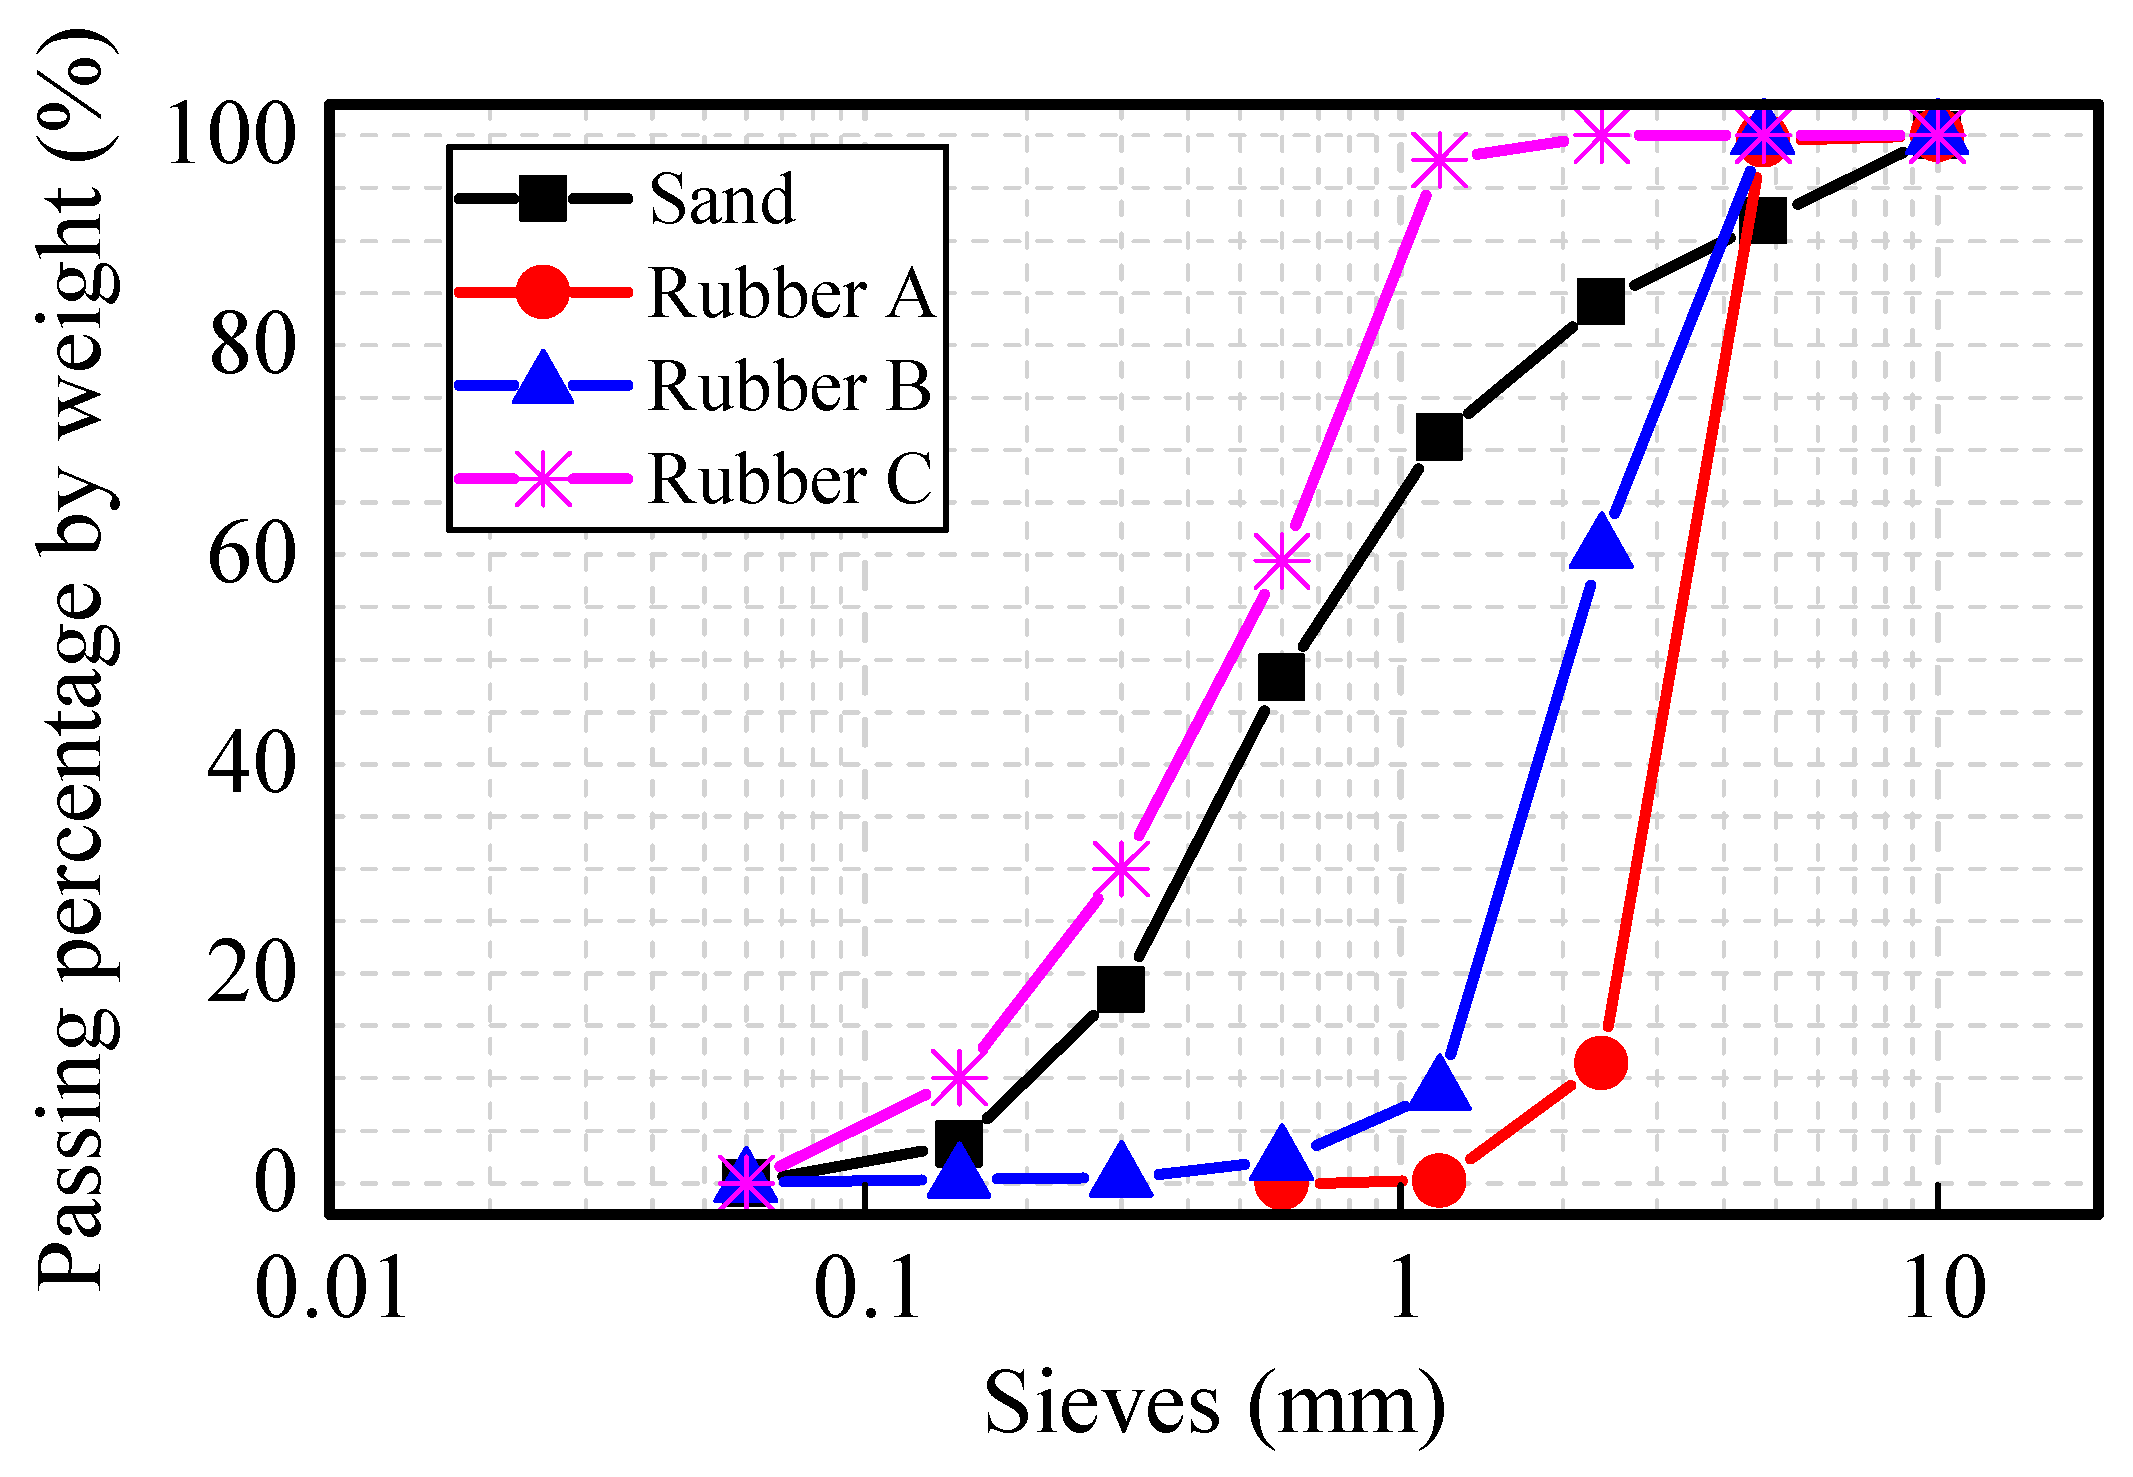
2.1. Materials and Mix Proportions
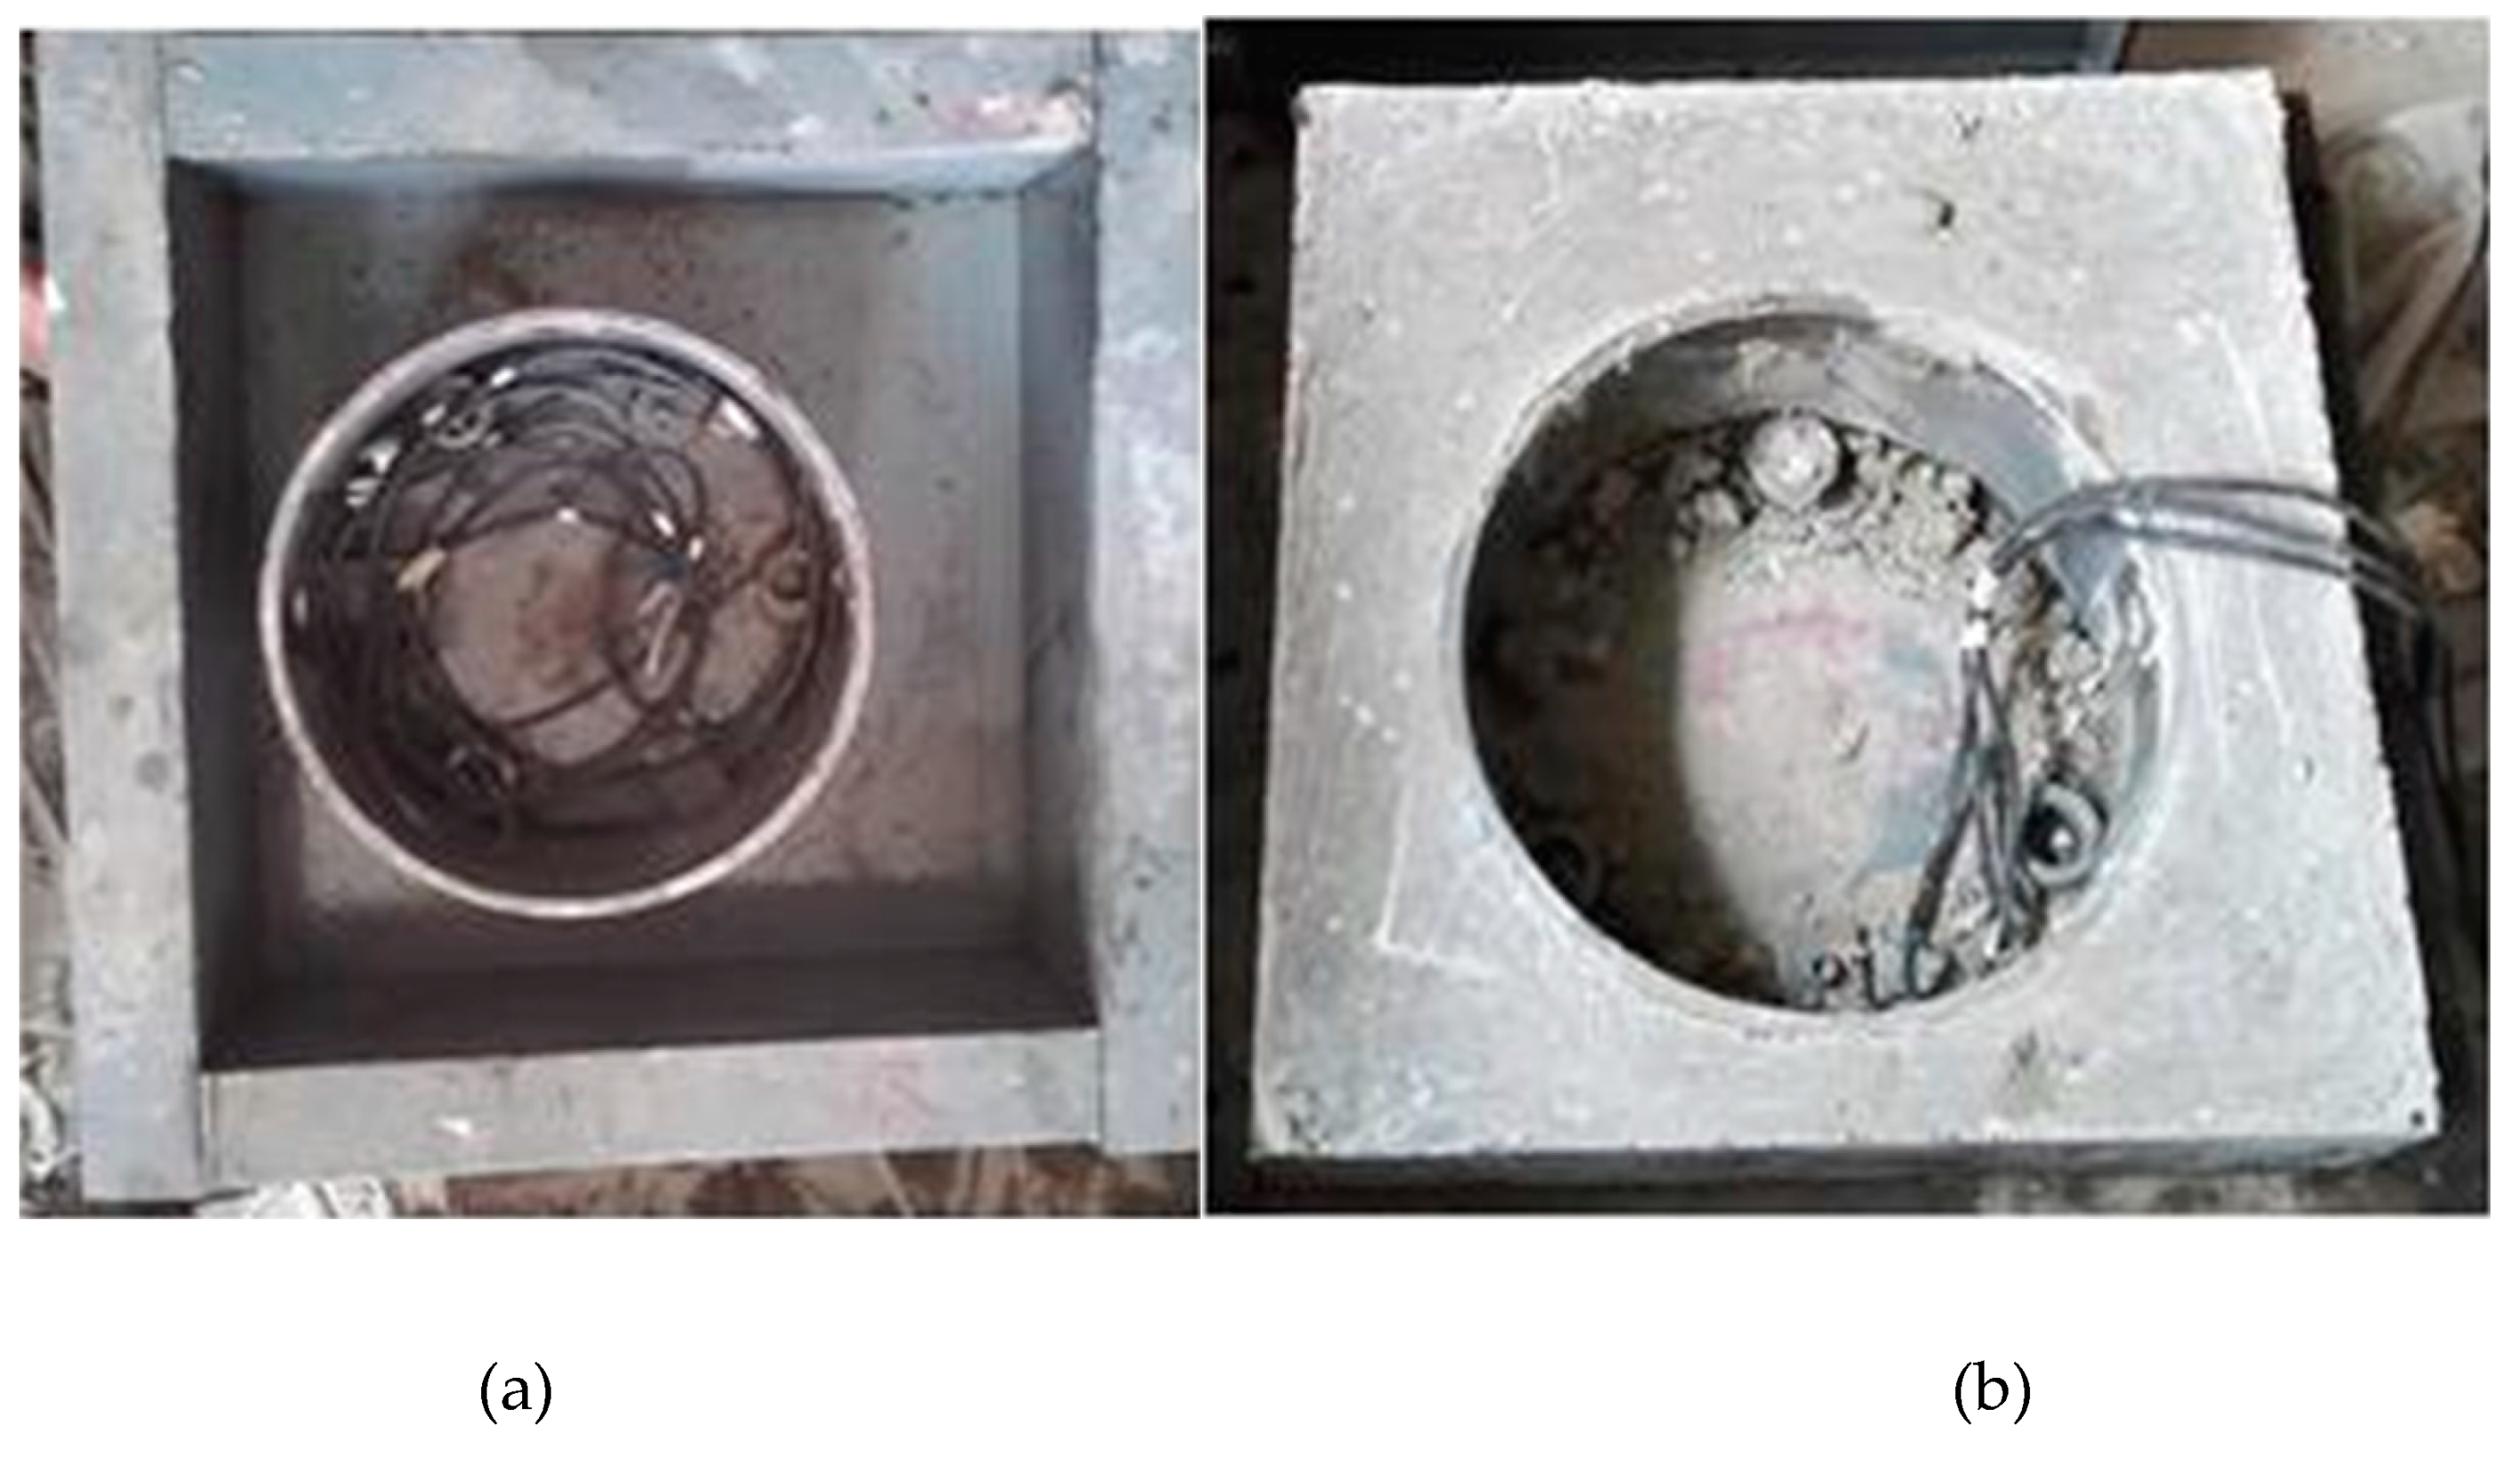
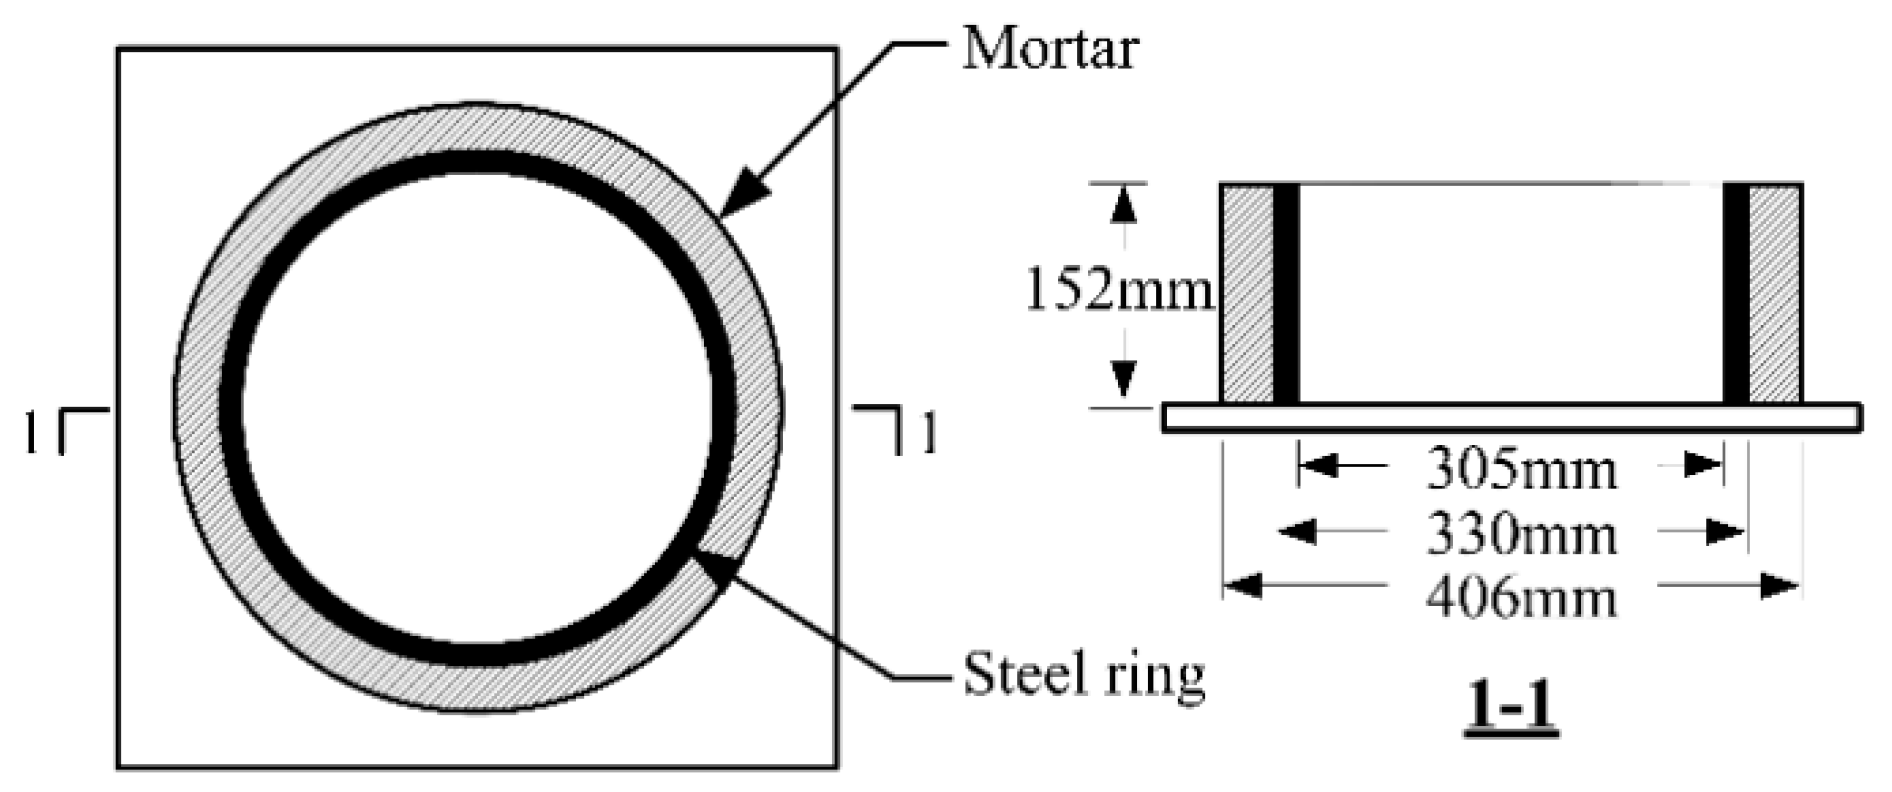
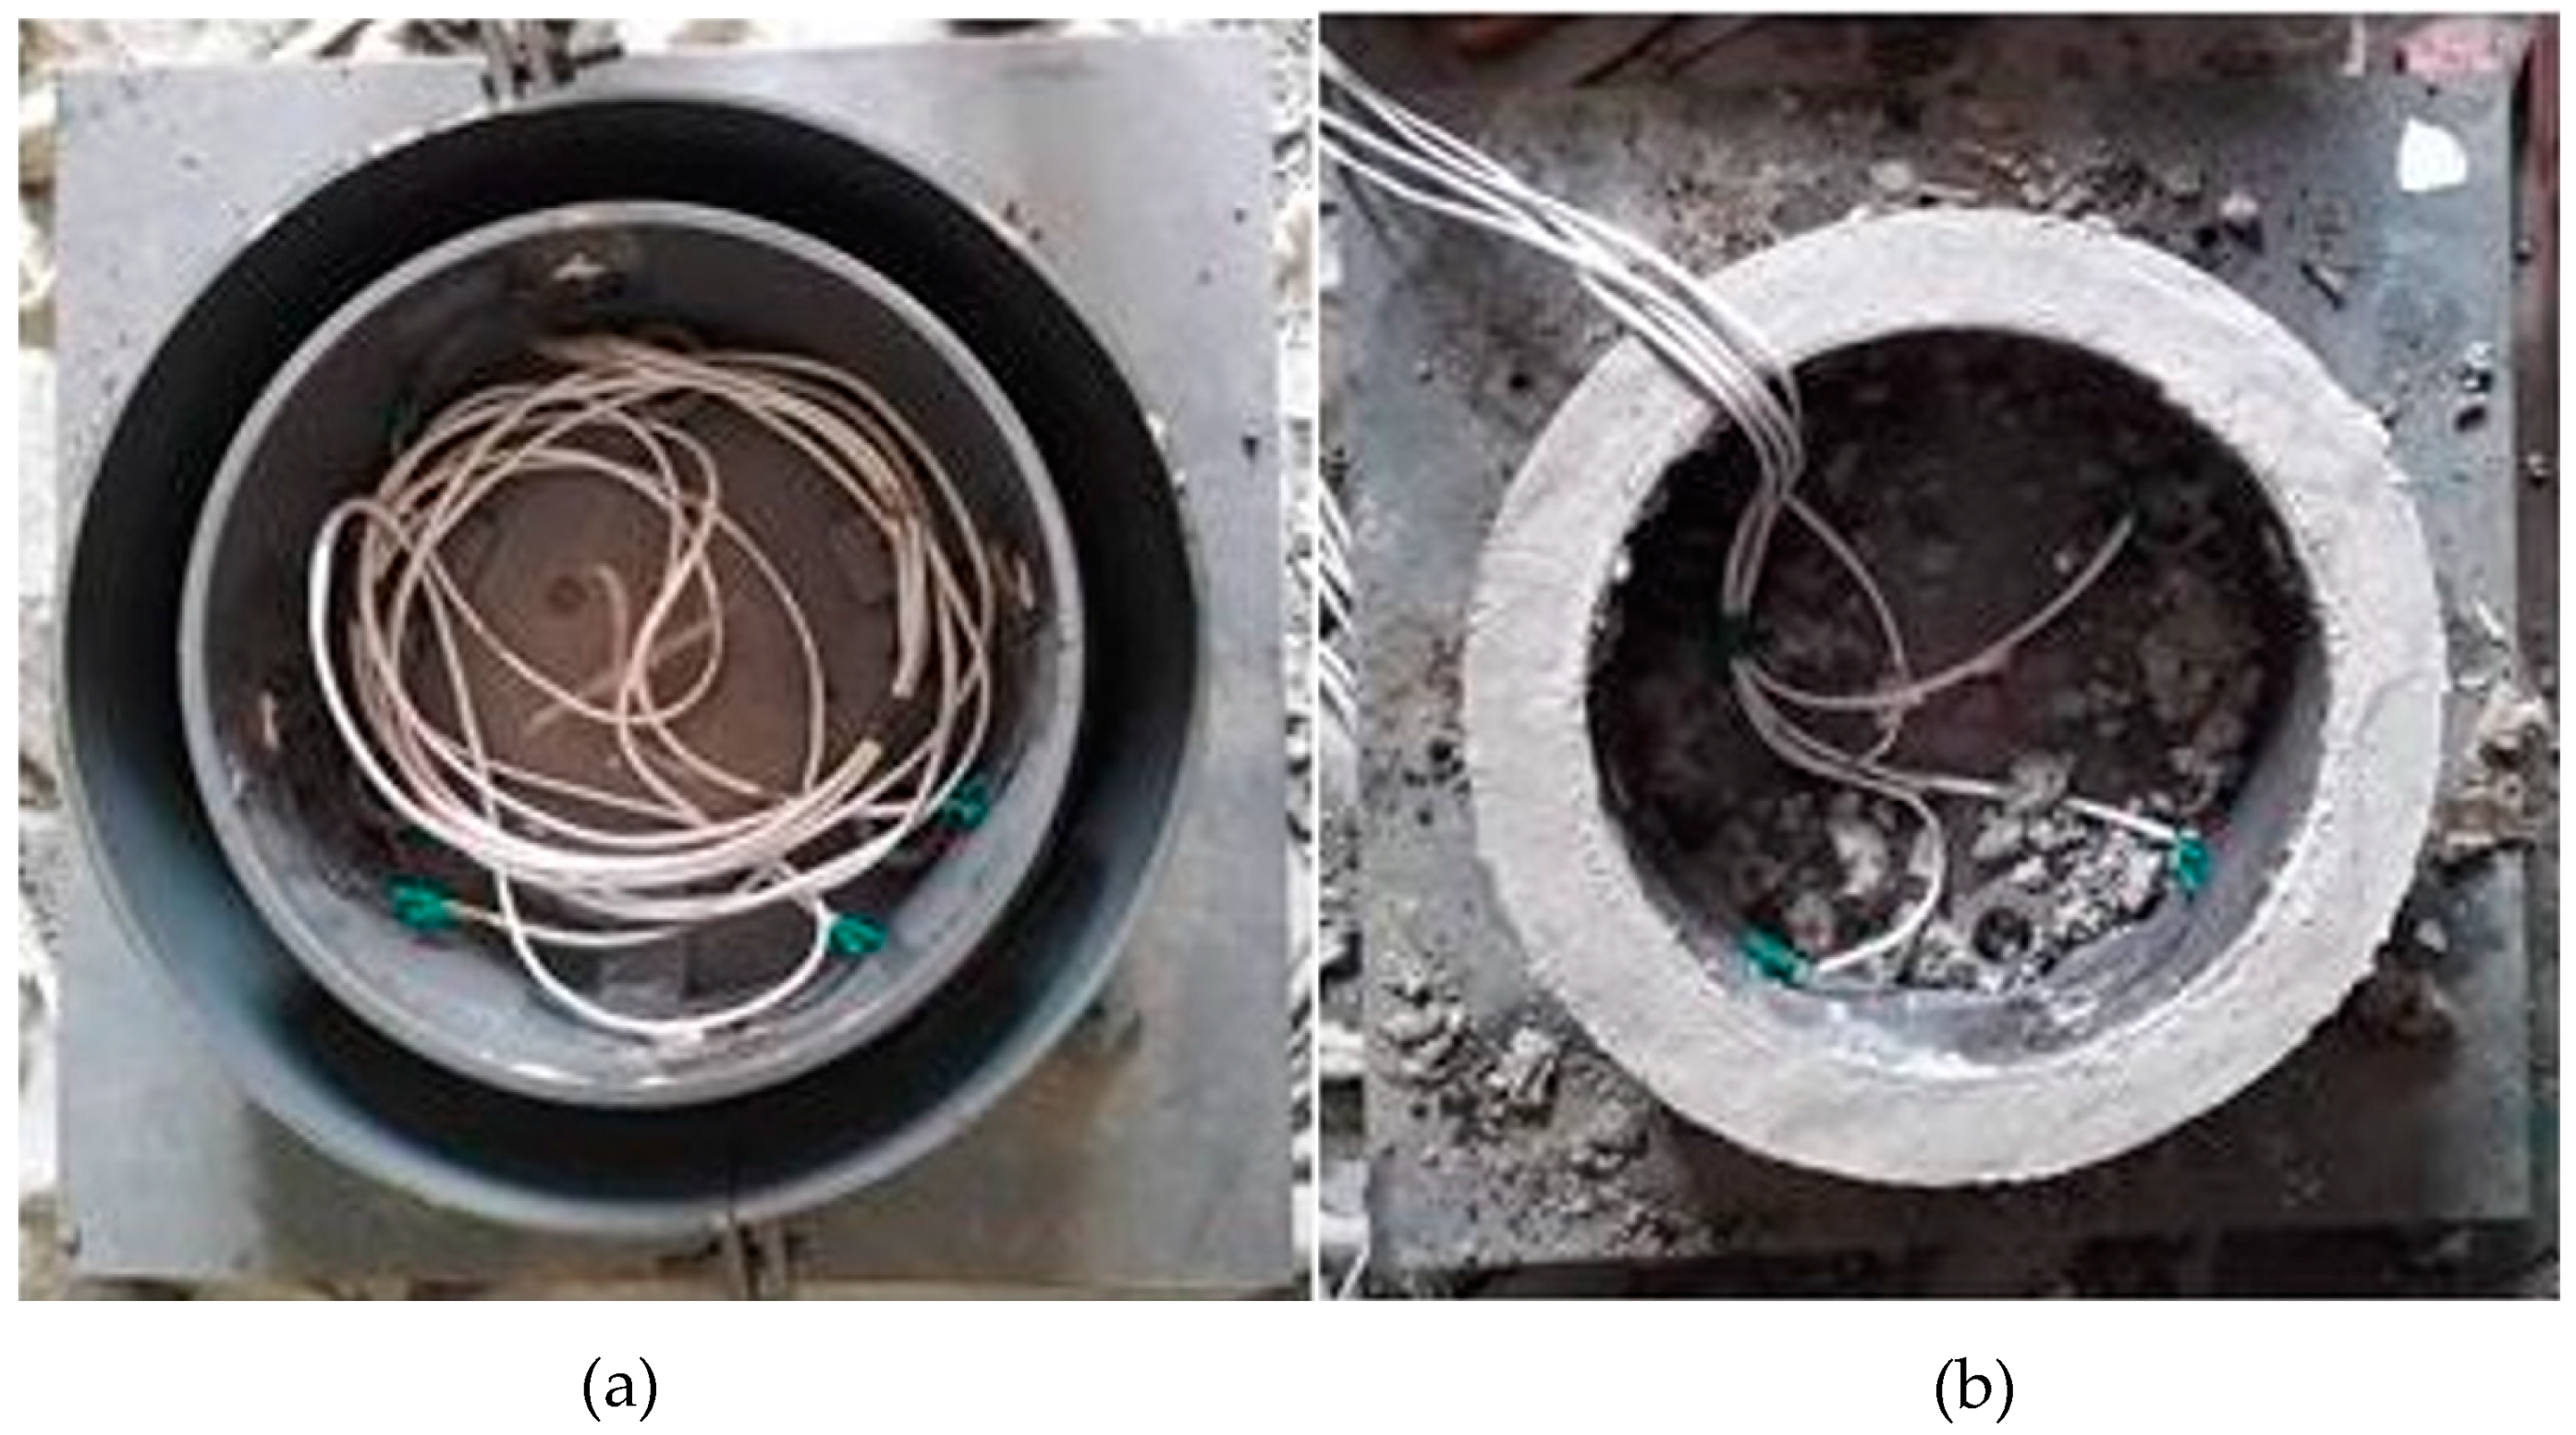
2.2. RSERST
2.3. RRST
2.4. Mechanical Test
2.5. SEM Test
3. Results and Discussions
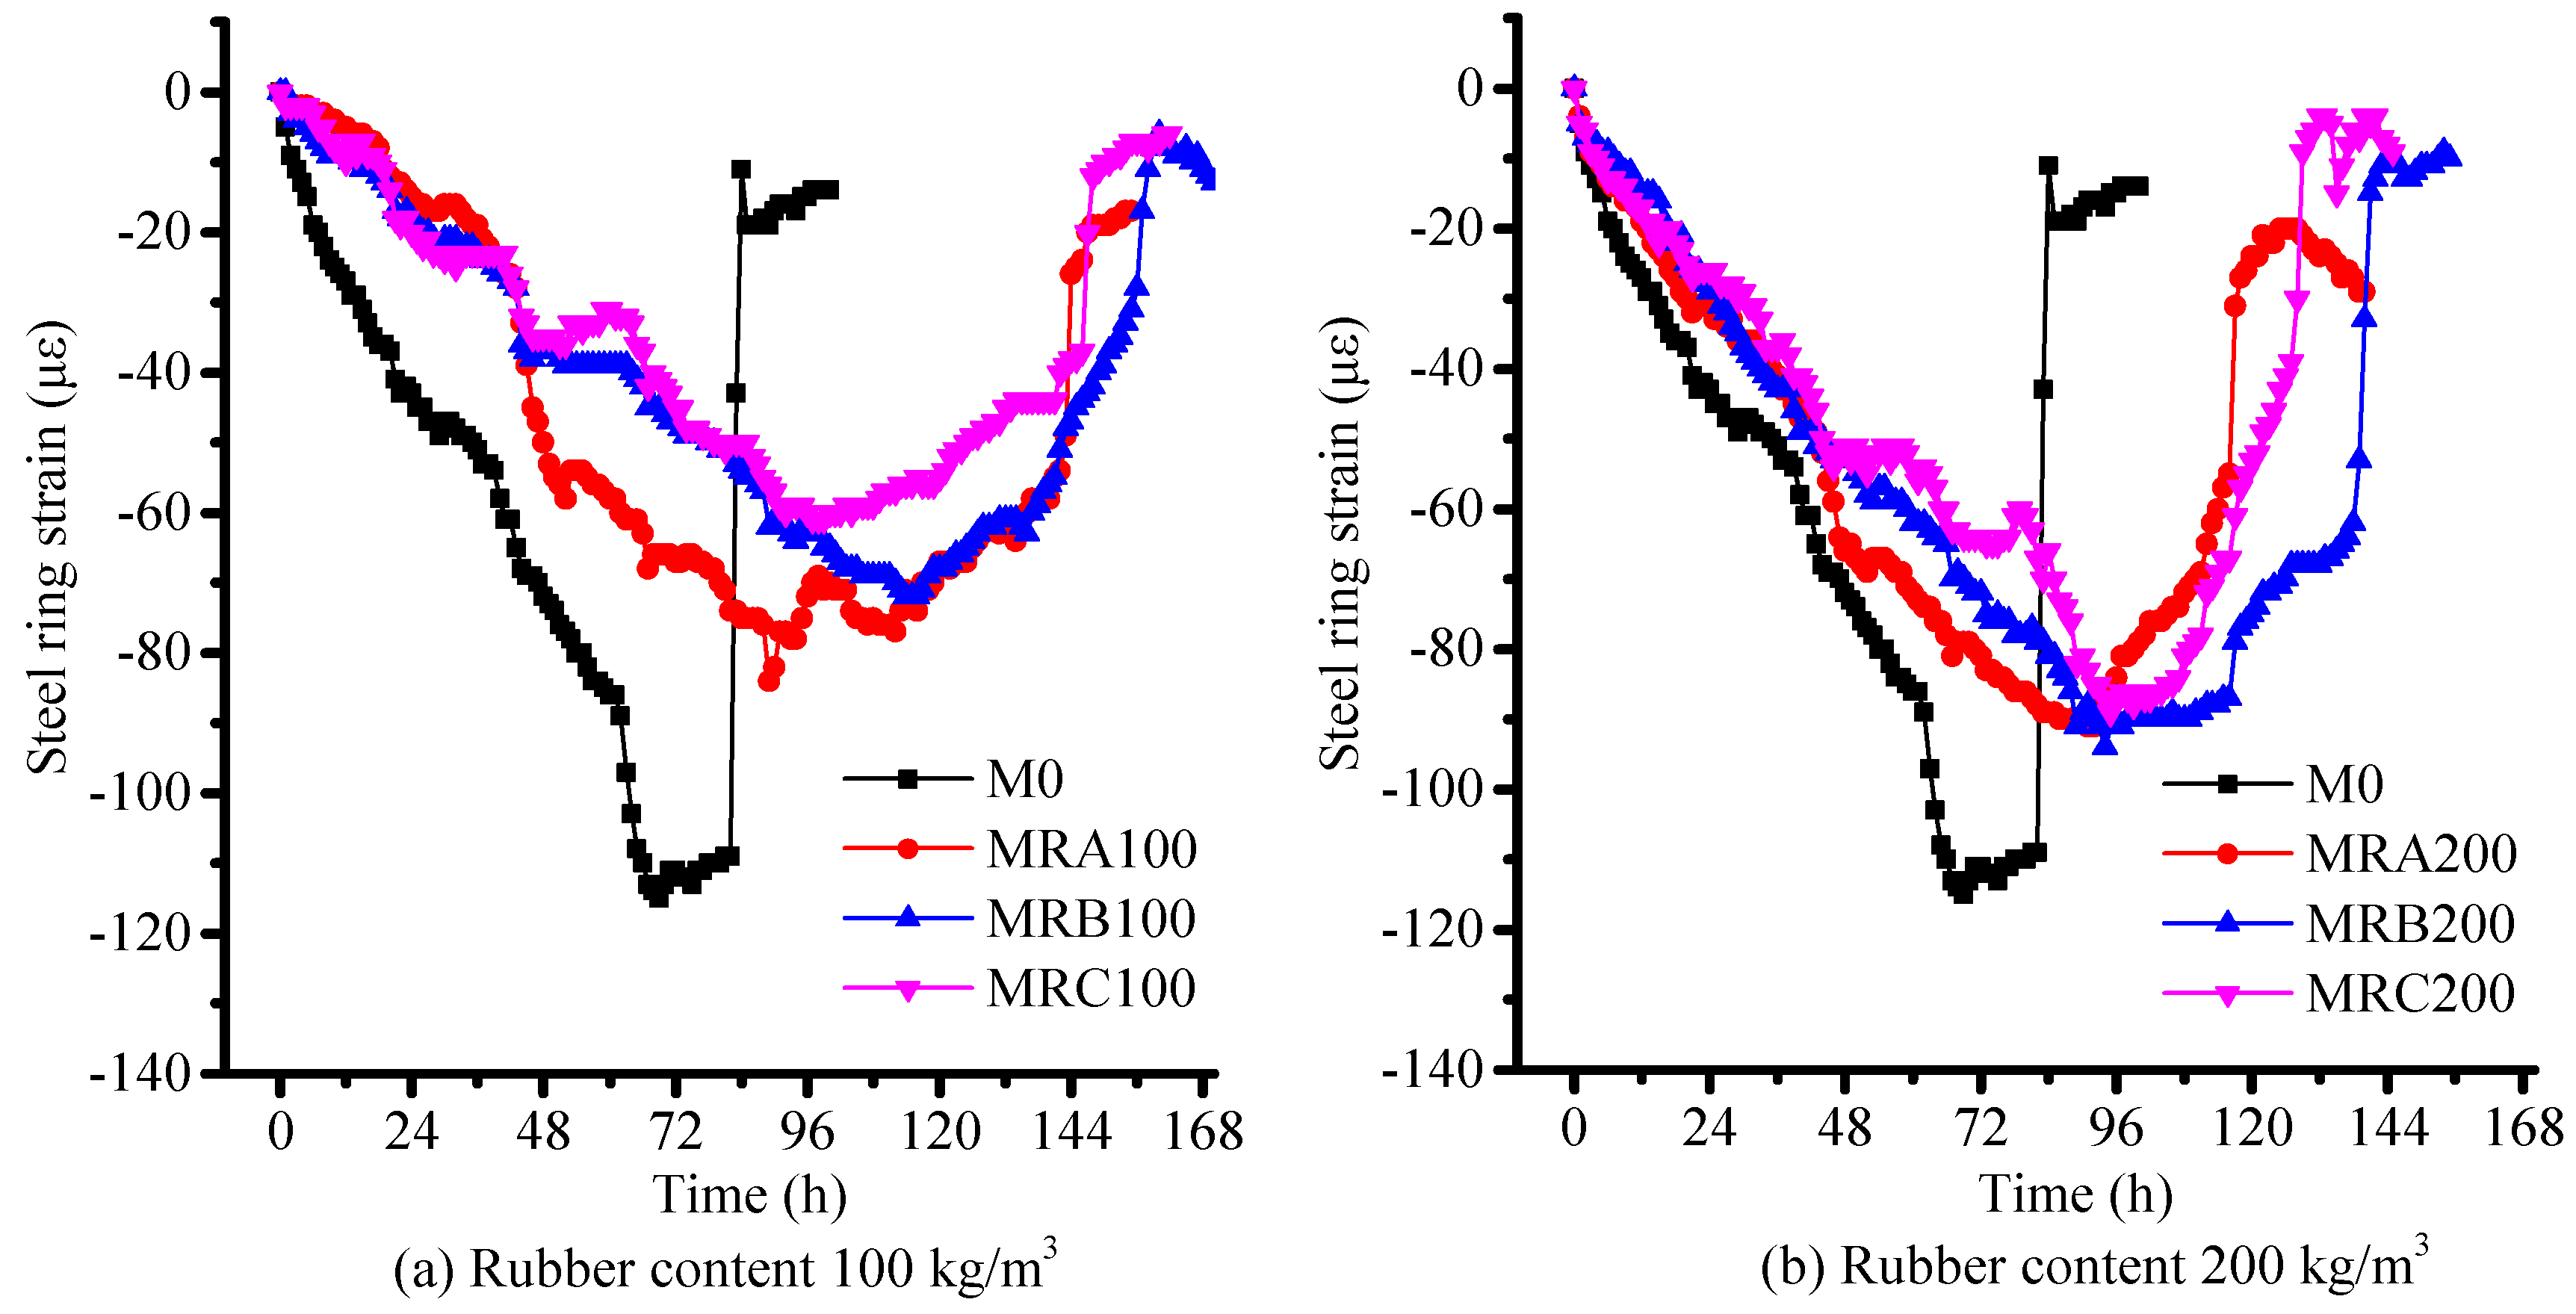
3.1. RSERST Results
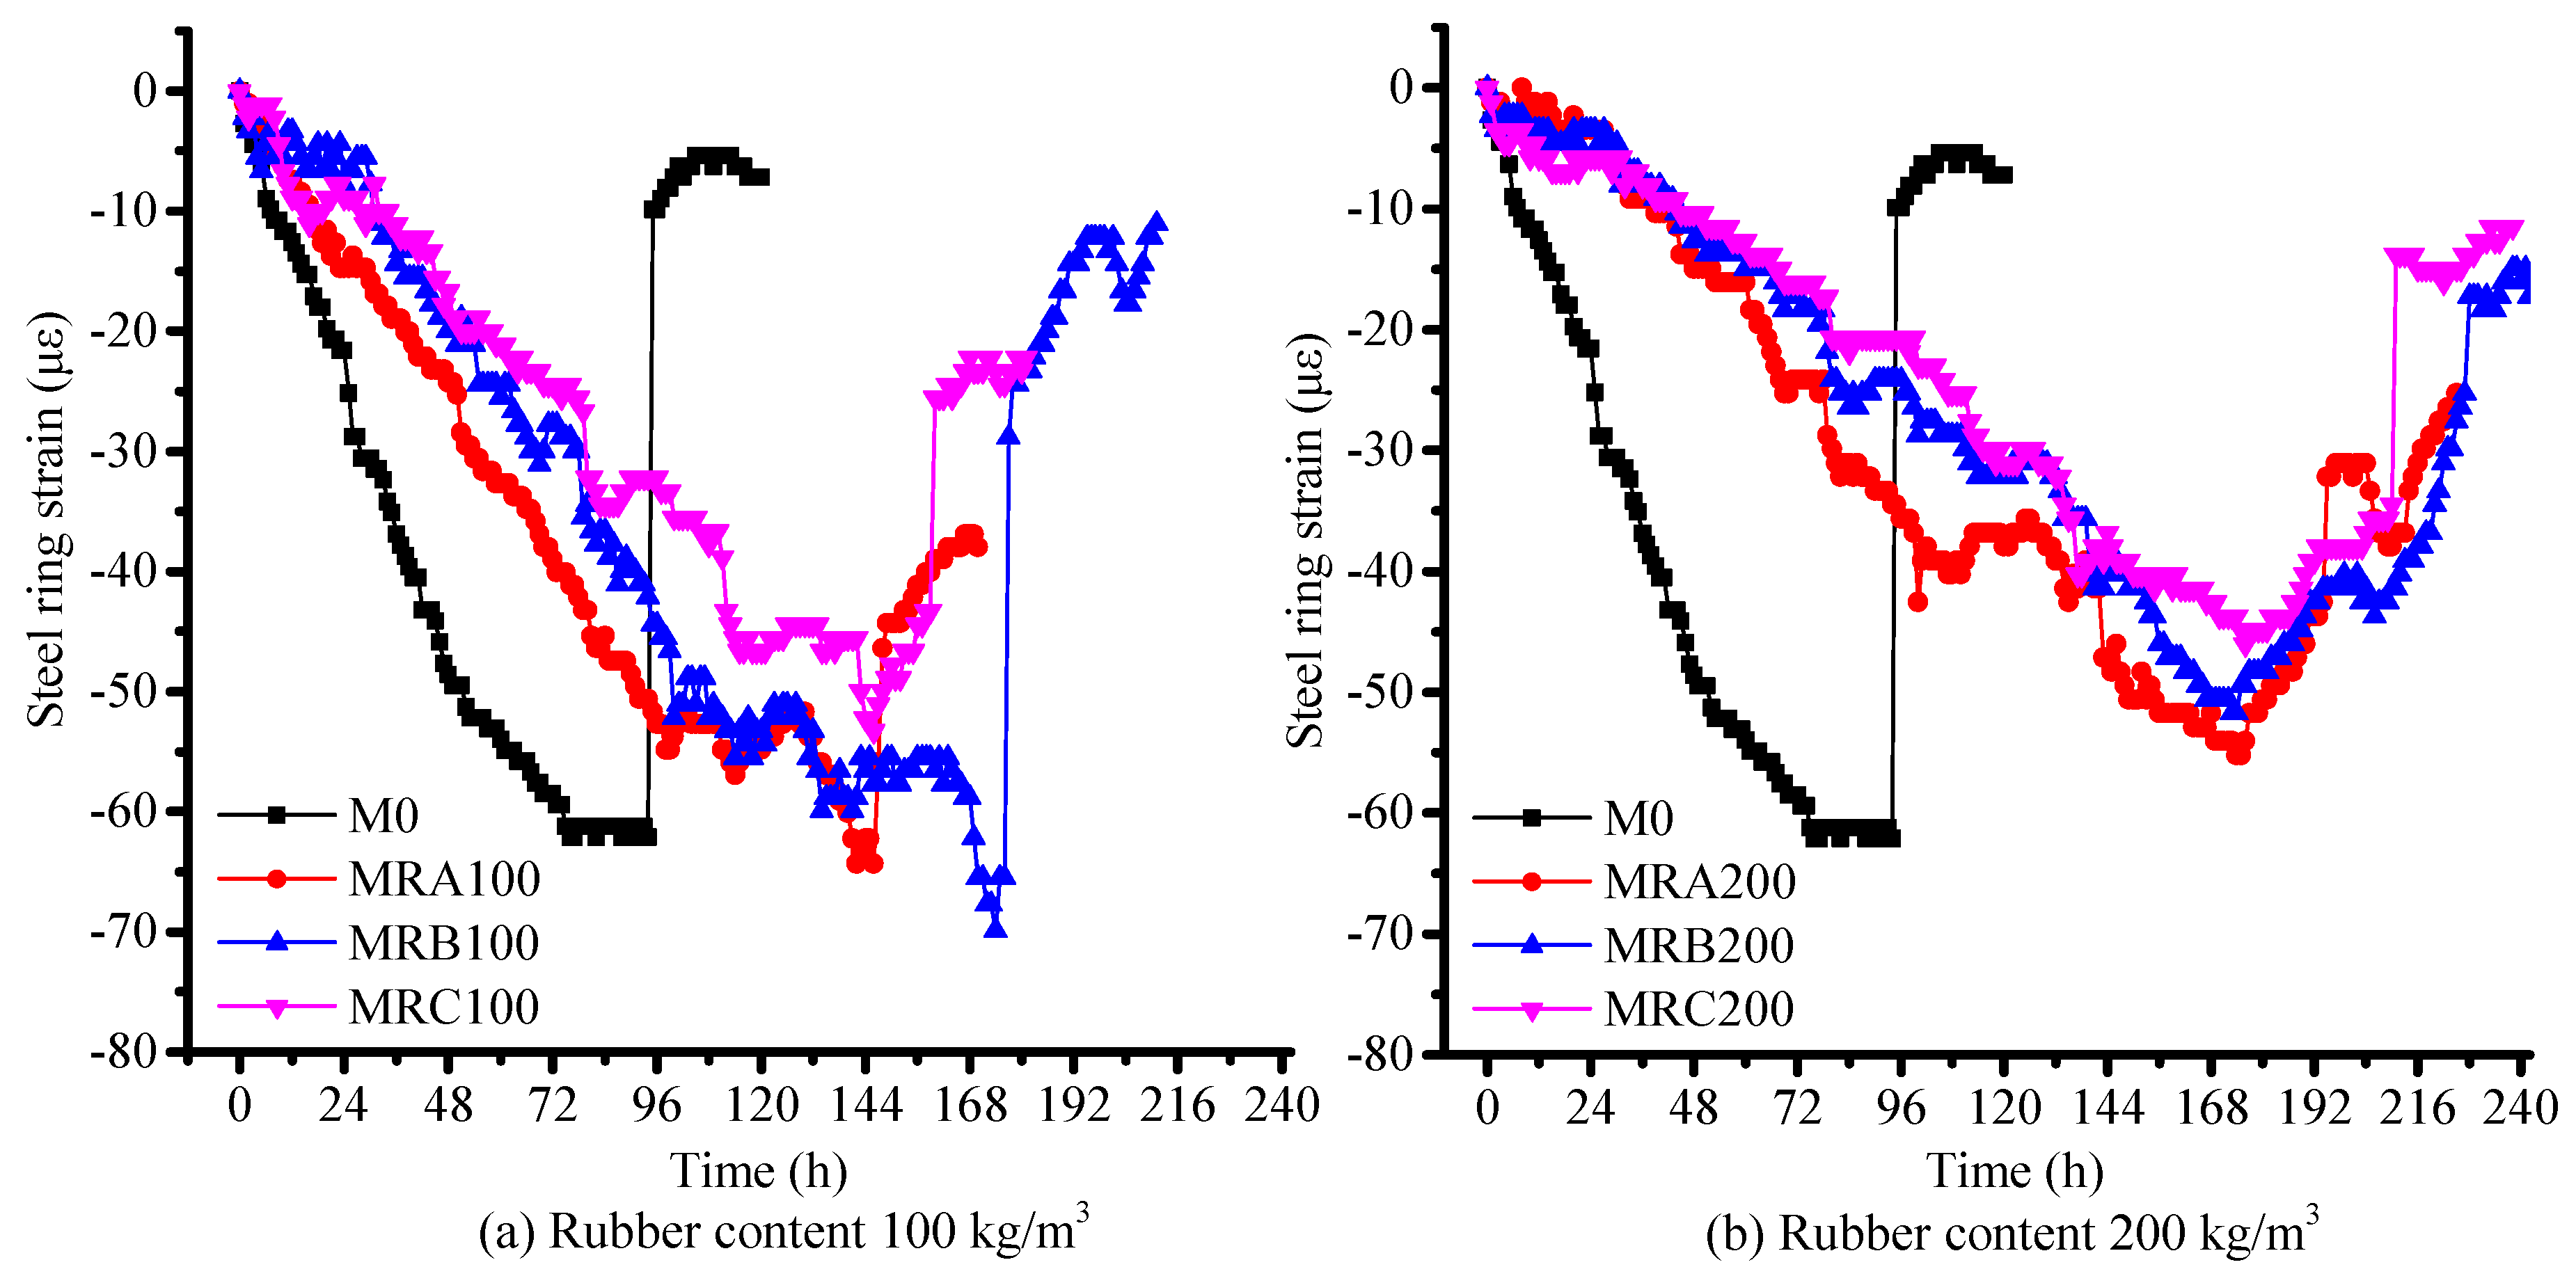
3.2. RRST Results
3.3. Mechanical Strengths
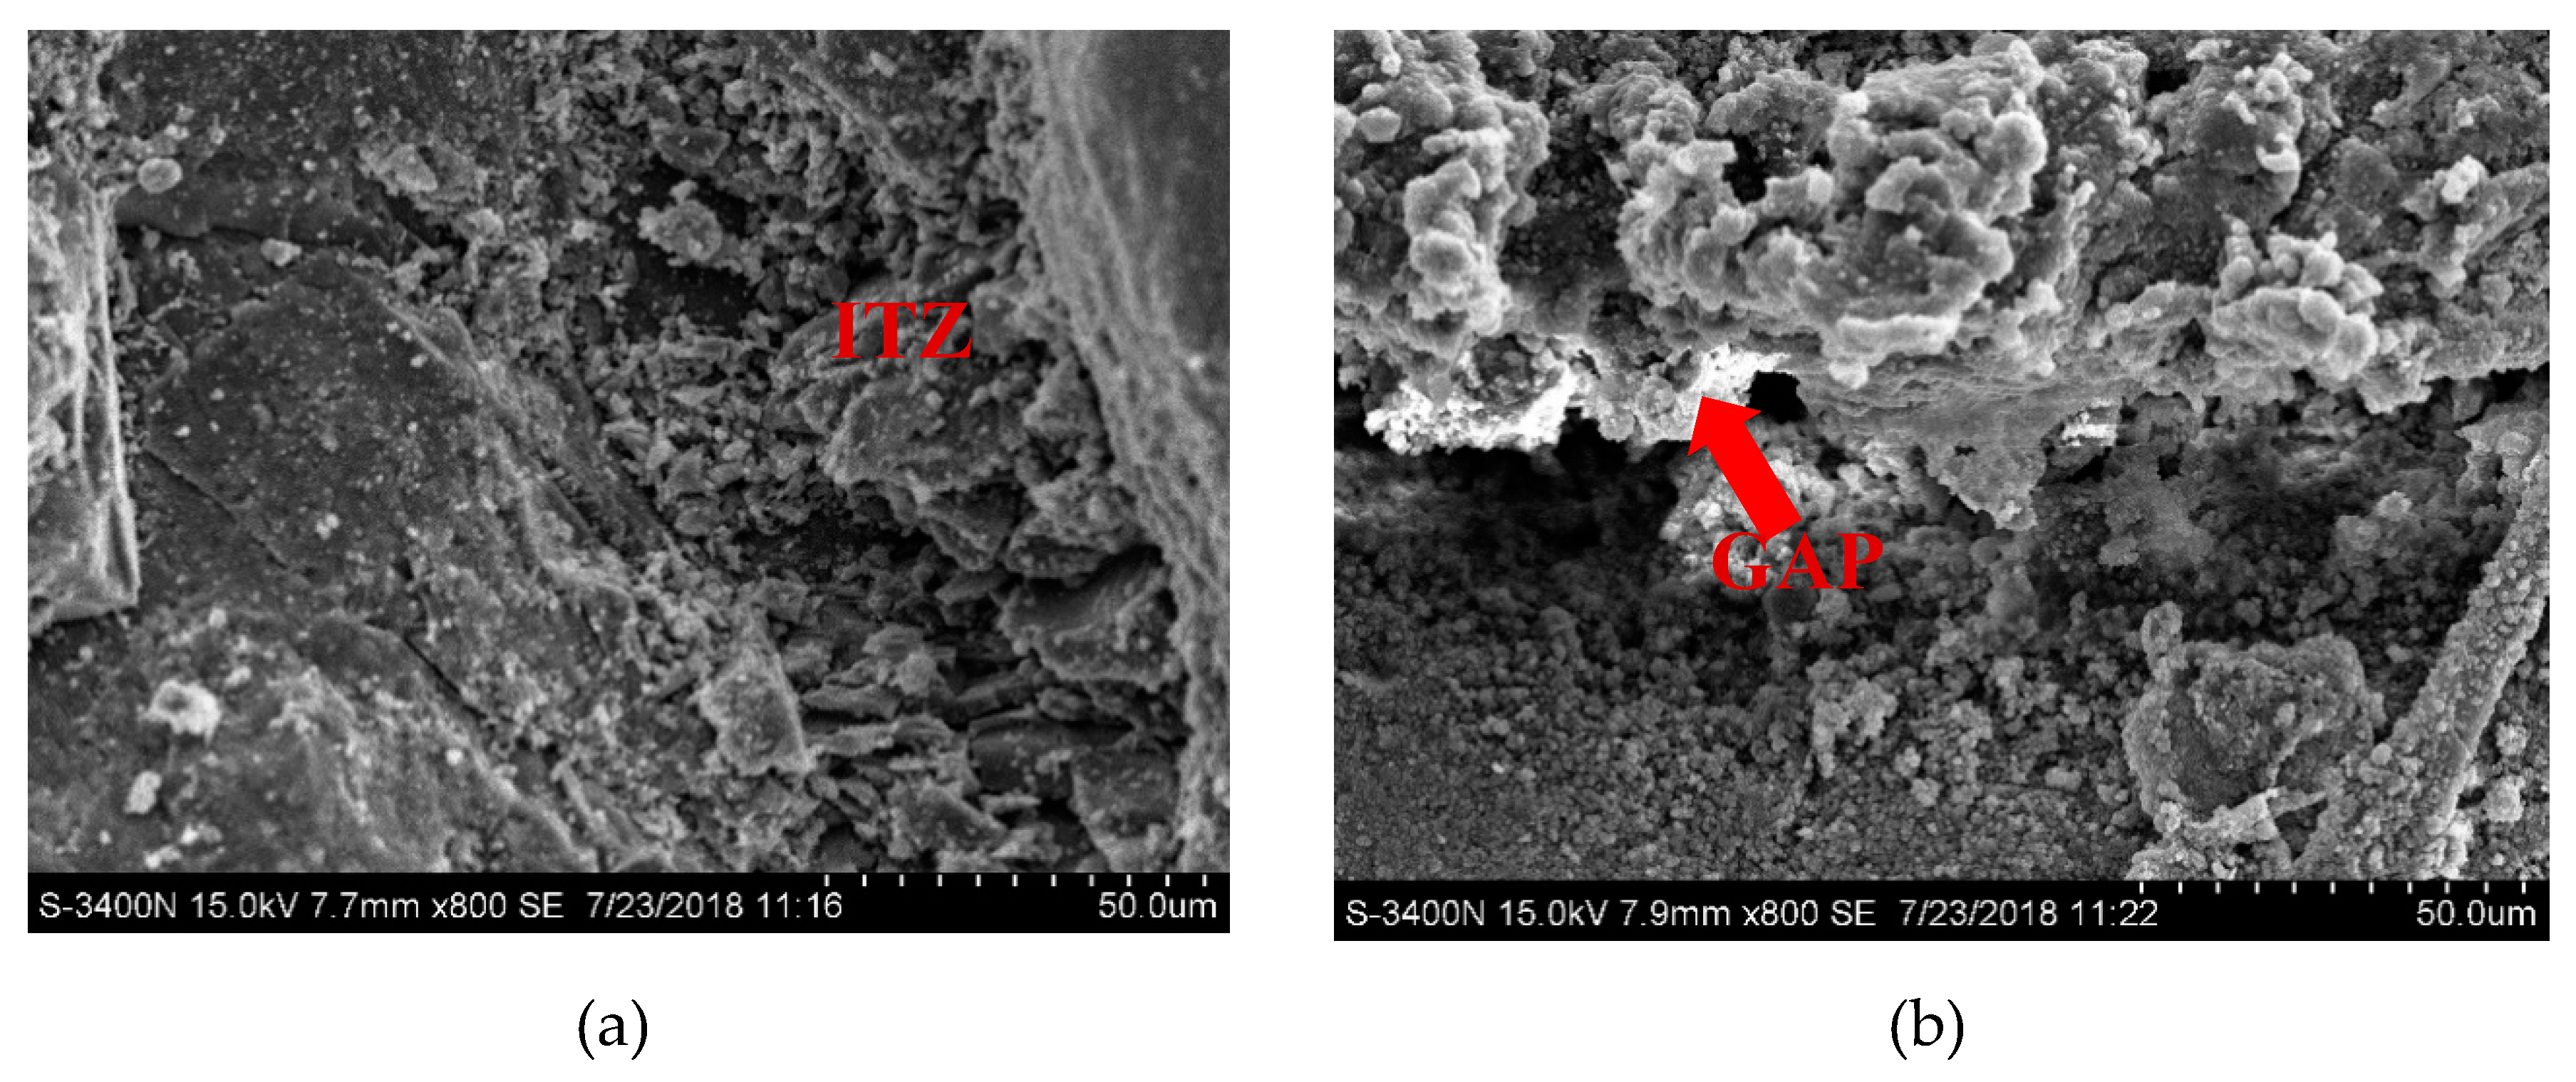
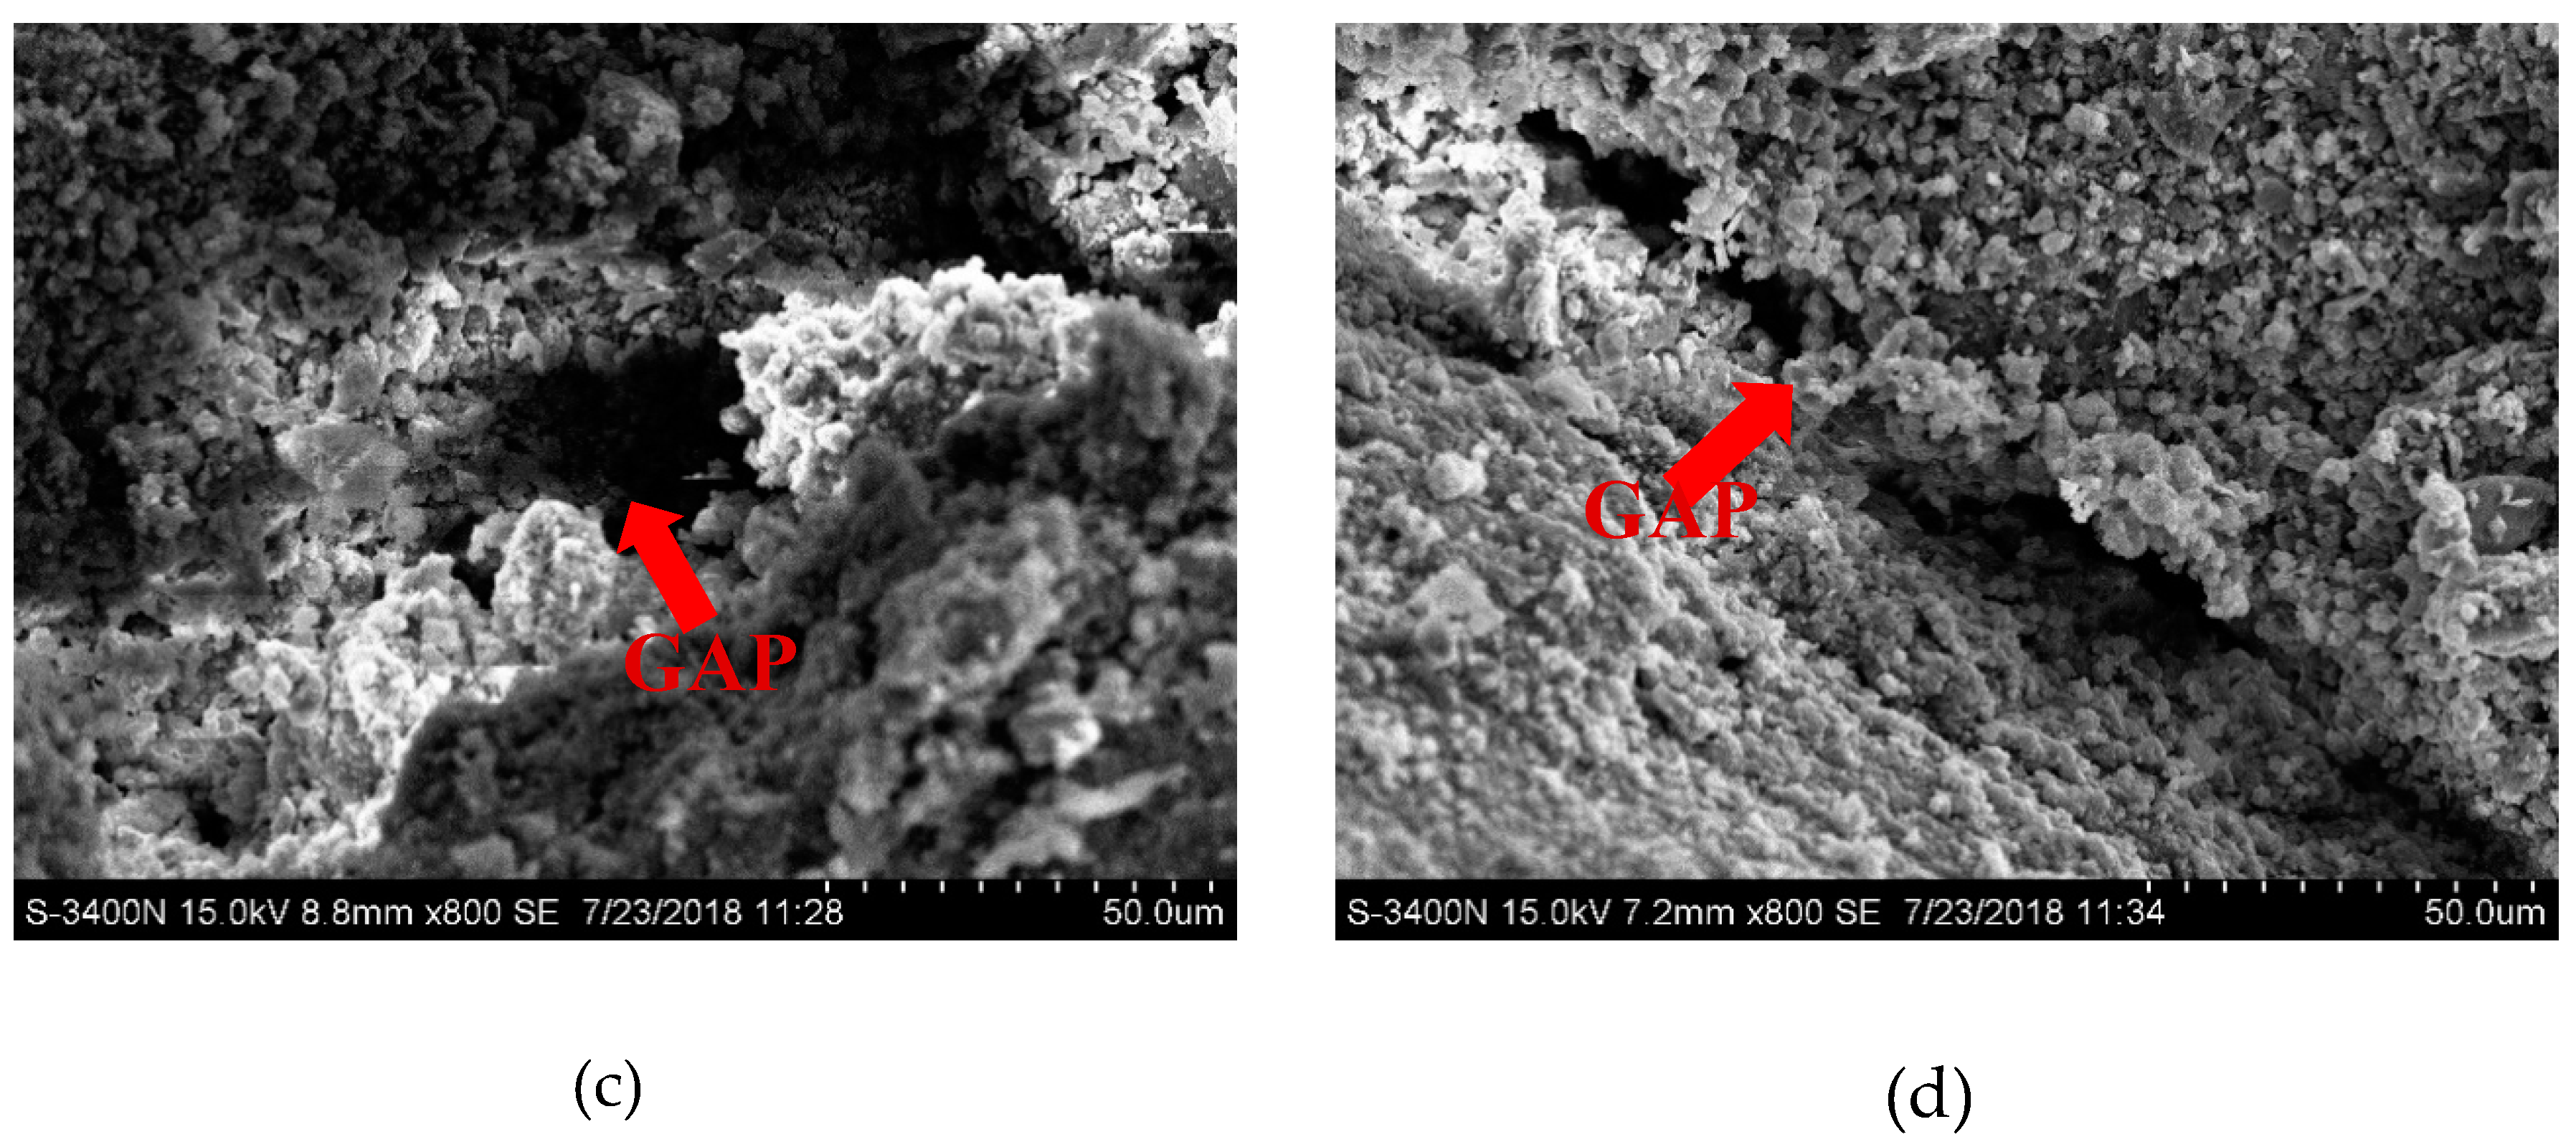
3.4. SEM Results for the ITZ
3.5. Discussions
3.5.1. Comparison of RSERST and RRST
3.5.2. Comparison of Restraint Circumferential Stress and Flexural Tensile Strength
3.5.3. Intensification Factor of RSERST Restriction Degree
4. Conclusions
- RSERST can predict the cracking position and shorten the test period, and the restriction degree is higher in RSERST than in RRST. The average intensification factor is .
- Both RRST and RSERST revealed that the addition of rubber can delay cracking. The content and size of rubber can both contribute to the cracking resistance of rubberized mortars. With rubber of equal content, the cracking inhibitory effect of Rubber B is higher than that of Rubbers A and C.
- The bonding interface between sand and cement is better than that between rubber and cement. The particle size of the rubber does not affect much on the ITZ position of rubber and cement paste. For the strength differences of the three types of rubberized mortar, it is mainly because the specific surface area increased as the rubber size decreased, which lead to more ITZ positions and pore structures.
- The addition of rubber will inhibit the development of mortar tensile strength. With rubber particles of a smaller size, more additional pores are introduced, leading to more obvious reduction effects. While, as the rubber is a soft filling, with a smaller particle size, the rubber distribution is more uniform, leading to better cracking inhibition effect. The effect of rubber particle size is opposite in two aspects. Therefore, rubber particle B, which is of medium size, performed best in the cracking inhibition.
Author Contributions
Funding
Conflicts of Interest
References
- Bravo, M.; de Brito, J. Concrete made with used tyre aggregate: Durability-related performance. J. Clean. Prod. 2012, 25, 42–50. [Google Scholar] [CrossRef]
- Zhou, Z.; Qiao, P. Prediction of Restrained Shrinkage Cracking of Shotcrete Rings Using Fracture Mechanics–Based Approach. J. Mater.Civ. Eng. 2019, 31, 04019214. [Google Scholar] [CrossRef]
- Cao, Q. Effect of Fibers and Expansive Agent on Shrinkage of Self-Consolidating Concrete under Two Curing Schemes. J. Mater. Civ. Eng. 2019, 31, 04019204. [Google Scholar] [CrossRef]
- Chang, H. A novel method for assessing C-S-H chloride adsorption in cement pastes. Constr. Build. Mater. 2019, 225, 324–331. [Google Scholar] [CrossRef]
- Toledo Filho, R.D. Free, restrained and drying shrinkage of cement mortar composites reinforced with vegetable fibres. Cem. Concr. Compos. 2005, 27, 537–546. [Google Scholar] [CrossRef]
- Yung, W.H.; Yung, L.C.; Hua, L.H. A study of the durability properties of waste tire rubber applied to self-compacting concrete. Constr. Build. Mater. 2013, 41, 665–672. [Google Scholar] [CrossRef]
- Hao, R.X.; Dong, S.F.; Guo, X.Y. The Research of Scrap Tire Rubber Powder Effect on the Performance of Cracking Mortar. Adv. Mater. Res. 2012, 472–475, 1777–1781. [Google Scholar] [CrossRef]
- Alsaif, A. Fatigue performance of flexible steel fibre reinforced rubberised concrete pavements. Eng. Struct. 2019, 193, 170–183. [Google Scholar] [CrossRef]
- Alsaif, A. Mechanical performance of steel fibre reinforced rubberised concrete for flexible concrete pavements. Constr. Build. Mater. 2018, 172, 533–543. [Google Scholar] [CrossRef]
- Lv, J. Effects of rubber particles on mechanical properties of lightweight aggregate concrete. Constr. Build. Mater. 2015, 91, 145–149. [Google Scholar] [CrossRef]
- Siddique, R.; Naik, T.R. Properties of concrete containing scrap-tire rubber--an overview. Waste Manag. 2004, 24, 563–569. [Google Scholar] [CrossRef] [PubMed]
- Huang, X. On the use of recycled tire rubber to develop low E-modulus ECC for durable concrete repairs. Constr. Build. Mater. 2013, 46, 134–141. [Google Scholar] [CrossRef]
- Turatsinze, A.; Garros, M. On the modulus of elasticity and strain capacity of Self-Compacting Concrete incorporating rubber aggregates. Resour. Conserv. Recycl. 2008, 52, 1209–1215. [Google Scholar] [CrossRef]
- Ho, A.C. Effects of rubber aggregates from grinded used tyres on the concrete resistance to cracking. J. Clean. Prod. 2012, 23, 209–215. [Google Scholar] [CrossRef]
- Turatsinze, A.; Measson, M.; Faure, J.P. Rubberised concrete: From laboratory findings to field experiment validation. Int. J. Pavement Eng. 2016, 19, 883–892. [Google Scholar] [CrossRef]
- Sukontasukkul, P. Use of crumb rubber to improve thermal and sound properties of pre-cast concrete panel. Constr. Build. Mater. 2009, 23, 1084–1092. [Google Scholar] [CrossRef]
- Sukontasukkul, P.; Tiamlom, K. Expansion under water and drying shrinkage of rubberized concrete mixed with crumb rubber with different size. Constr. Build. Mater. 2012, 29, 520–526. [Google Scholar] [CrossRef]
- Su, H. Properties of concrete prepared with waste tyre rubber particles of uniform and varying sizes. J. Clean. Prod. 2015, 91, 288–296. [Google Scholar] [CrossRef] [Green Version]
- Gesoğlu, M. Abrasion and freezing–thawing resistance of pervious concretes containing waste rubbers. Constr. Build. Mater. 2014, 73, 19–24. [Google Scholar] [CrossRef]
- Yilmaz, A.; Degirmenci, N. Possibility of using waste tire rubber and fly ash with Portland cement as construction materials. Waste Manag. 2009, 29, 1541–1546. [Google Scholar] [CrossRef]
- Liu, F. Study of impact performance of rubber reinforced concrete. Constr. Build. Mater. 2012, 36, 604–616. [Google Scholar] [CrossRef]
- Hossain, A.B.; Weiss, J. Assessing residual stress development and stress relaxation in restrained concrete ring specimens. Cem. Concr. Compos. 2004, 26, 531–540. [Google Scholar] [CrossRef]
- Yoo, D.Y. Influence of ring size on the restrained shrinkage behavior of ultra high performance fiber reinforced concrete. Mater. Struct. 2013, 47, 1161–1174. [Google Scholar] [CrossRef]
- Gao, Y.; Zhang, J.; Han, P. Determination of stress relaxation parameters of concrete in tension at early-age by ring test. Constr. Build. Mater. 2013, 41, 152–164. [Google Scholar] [CrossRef]
- Zhu, H.; Li, H.R.; Zhu, X.C. On concrete restrained eccentric ring and squared eccentric ring shrinkage test methods. Constr. Build. Mater. 2015, 84, 239–244. [Google Scholar] [CrossRef]
- JGJ/T70-2009, Standard for Test Method of Performance on Building Mortar; Construction Ministry of China: Beijing, China, 2009.
- GB/T17671-1999, Method of Testing Cements-Determination of Strength; State Bureau of Quality and Technical Supervision: Beijing, China, 1999.
- Kawashima, S.; Shah, S.P. Early-age autogenous and drying shrinkage behavior of cellulose fiber-reinforced cementitious materials. Cem. Concr. Compos. 2011, 33, 201–208. [Google Scholar] [CrossRef]
- Hossain, A.B.; Weiss, J. The role of specimen geometry and boundary conditions on stress development and cracking in the restrained ring test. Cem. Concr. Res. 2006, 36, 189–199. [Google Scholar] [CrossRef]
- Day, K.W. Concrete Mix Design, Quality Control and Specification, 2nd ed.; E&FN Spon: London, UK, 1999. [Google Scholar]
- Swamy, R.N.; Stavrides, H. Some statistical considerations of steel fiber composites. Cem. Concr. Res. 1976, 6, 201–216. [Google Scholar] [CrossRef]


| Properties | Cement | Sand | Rubber |
|---|---|---|---|
| Specific density (kg/m3) | 3100 | 2650 | 1050 |
| Water absorption (%) | – | 1.3 | 0.35 |
| Chemical Compound | CaO | SiO2 | Al2O3 | Fe2O3 | SO3 | MgO | Lgnition Loss |
|---|---|---|---|---|---|---|---|
| Percentage (%) | 63.11 | 22.60 | 5.03 | 4.38 | 2.24 | 1.46 | 1.18 |
| Rubber Hydrocarbon | Carbon Black | Acetone Extract | Isoprene | Water | Ash Content | Fiber Content | Metal Content | Others |
|---|---|---|---|---|---|---|---|---|
| 45.2 | 25.8 | 14.2 | 12.1 | 0.8 | 0.9 | 0.5 | 0.08 | 0.42 |
| Mix | Rubber | Cement | Water | Sand |
|---|---|---|---|---|
| M0 | 0 | 2 | 1 | 5 |
| MRA100 | 0.33 | 2 | 1 | 4.17 |
| MRA200 | 0.67 | 2 | 1 | 3.33 |
| MRB100 | 0.33 | 2 | 1 | 4.17 |
| MRB200 | 0.67 | 2 | 1 | 3.33 |
| MRC100 | 0.33 | 2 | 1 | 4.17 |
| MRC200 | 0.67 | 2 | 1 | 3.33 |
| NO. | M0 | MRA100 | MRA200 | MRB100 | MRB200 | MRC100 | MRC200 |
|---|---|---|---|---|---|---|---|
| 1 | 43.5 | 30.5 | 17.5 | 30.0 | 16.5 | 22.7 | 12.1 |
| 2 | 43.3 | 29.7 | 19.6 | 26.4 | 17.7 | 20.1 | 12.0 |
| 3 | 43.2 | 29.3 | 19.5 | 28.9 | 17.1 | 21.4 | 13.5 |
| 4 | 42.9 | 28.8 | 19.0 | 29.4 | 17.1 | 20.4 | 12.7 |
| 5 | 42.7 | 28.5 | 20.3 | 29.5 | 16.3 | 19.1 | 13.2 |
| 6 | 42.3 | 28.5 | 18.2 | 27.0 | 16.9 | 21.8 | 12.9 |
| 7 | 41.3 | 28.1 | 21.0 | 30.3 | 19.0 | 20.5 | 10.7 |
| 8 | 42.7 | 27.6 | 17.7 | 26.5 | 20.8 | 20.8 | 11.3 |
| 9 | 41.0 | 27.3 | 20.7 | 24.2 | 17.2 | 19.6 | 11.0 |
| 10 | 40.5 | 26.9 | 22.7 | 29.5 | 16.5 | 19.9 | 13.7 |
| 11 | 39.8 | 26.1 | 19.8 | 27.3 | 18.4 | 17.8 | 11.9 |
| 12 | 36.1 | 25.7 | 15.9 | 29.7 | 17.5 | 18.8 | 9.2 |
| Mean (x) | 41.6 | 28.1 | 19.3 | 28.2 | 17.6 | 20.2 | 12.0 |
| SD (σ) | 2.09 | 1.40 | 1.81 | 1.90 | 1.29 | 1.36 | 1.31 |
| COV () % | 5.03 | 5.12 | 9.39 | 6.74 | 7.31 | 6.72 | 10.90 |
| NO. | M0 | MRA100 | MRA200 | MRB100 | MRB200 | MRC100 | MRC200 |
|---|---|---|---|---|---|---|---|
| 1d | 2.2 | 2.0 | 1.7 | 2.2 | 1.6 | 2.1 | 1.6 |
| 3d | 4.3 | 3.5 | 3.3 | 3.5 | 3.1 | 3.2 | 2.9 |
| 7d | 6.0 | 5.0 | 4.0 | 4.7 | 3.7 | 4.2 | 3.4 |
| 28d | 7.2 | 5.9 | 4.9 | 5.6 | 4.7 | 5.1 | 4.0 |
| M0 | MRA100 | MRA200 | MRB100 | MRB200 | MRC100 | MRC200 | |
|---|---|---|---|---|---|---|---|
| RSERST | 82.25 | 116.25 | 143.50 | 139.25 | 157.00 | 128.25 | 147.00 |
| RRST | 94.50 | 147.25 | 194.50 | 176.50 | 227.75 | 160.00 | 210.50 |
| Time saved | 12.25 | 31.00 | 51.00 | 37.25 | 70.75 | 31.75 | 63.50 |
| Sample | |||
|---|---|---|---|
| M0 | 4.69 | 4.36 | 1.08 |
| MRA100 | 4.33 | 4.00 | 1.08 |
| MRA200 | 4.21 | 3.36 | 1.25 |
| MRB100 | 4.47 | 4.03 | 1.11 |
| MRB200 | 3.76 | 3.30 | 1.14 |
| MRC100 | 3.92 | 3.16 | 1.24 |
| MRC200 | 3.50 | 2.74 | 1.28 |
| Mean () | 1.17 | ||
| SD (σ) | 0.09 | ||
| COV (σ/) | 0.07 |
© 2019 by the authors. Licensee MDPI, Basel, Switzerland. This article is an open access article distributed under the terms and conditions of the Creative Commons Attribution (CC BY) license (http://creativecommons.org/licenses/by/4.0/).
Share and Cite
Yu, Y.; Zhu, H. Effects of Rubber Size on the Cracking Resistance of Rubberized Mortars. Materials 2019, 12, 3132. https://doi.org/10.3390/ma12193132
Yu Y, Zhu H. Effects of Rubber Size on the Cracking Resistance of Rubberized Mortars. Materials. 2019; 12(19):3132. https://doi.org/10.3390/ma12193132
Chicago/Turabian StyleYu, Yong, and Han Zhu. 2019. "Effects of Rubber Size on the Cracking Resistance of Rubberized Mortars" Materials 12, no. 19: 3132. https://doi.org/10.3390/ma12193132
APA StyleYu, Y., & Zhu, H. (2019). Effects of Rubber Size on the Cracking Resistance of Rubberized Mortars. Materials, 12(19), 3132. https://doi.org/10.3390/ma12193132