The Effects of Multi-Walled Carbon Nanotubes and Steel Fibers on the AC Impedance and Electromagnetic Shielding Effectiveness of High-Performance, Fiber-Reinforced Cementitious Composites

Abstract
:1. Introduction
2. Materials and Methods
2.1. Materials
2.2. Mixture Proportions and Sample Preparation
2.3. Testing Methods
3. Results and Discussion
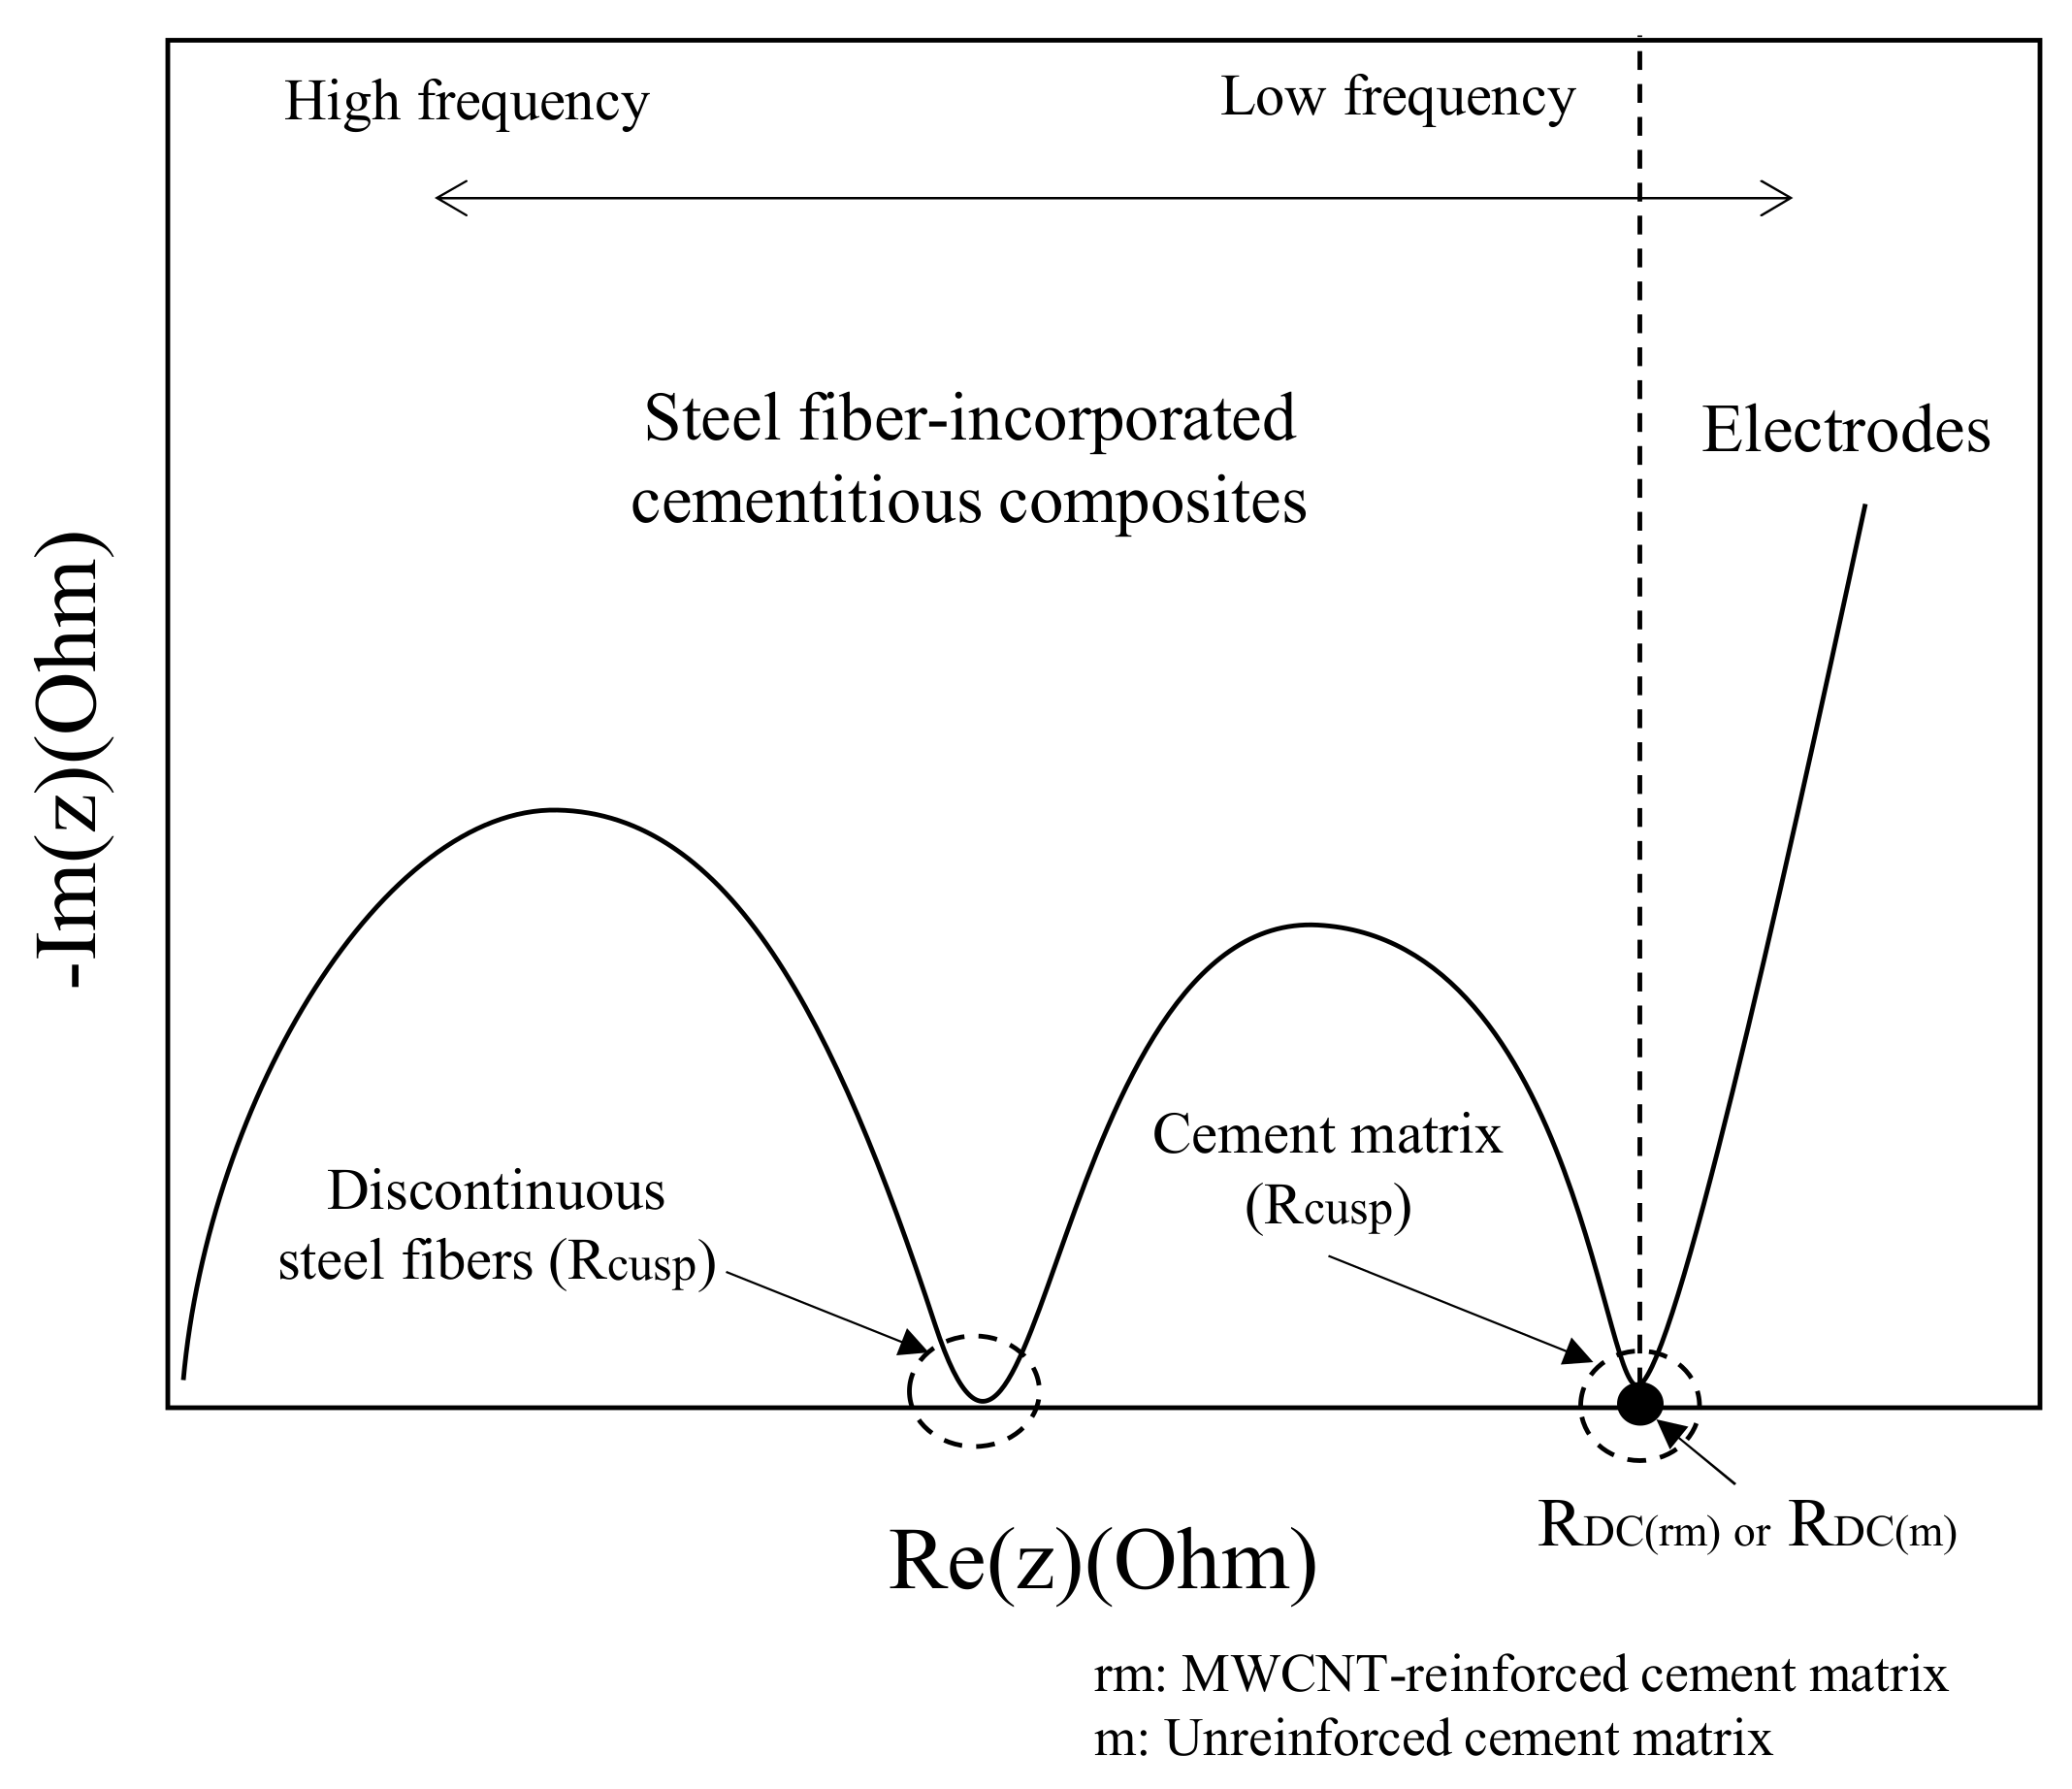
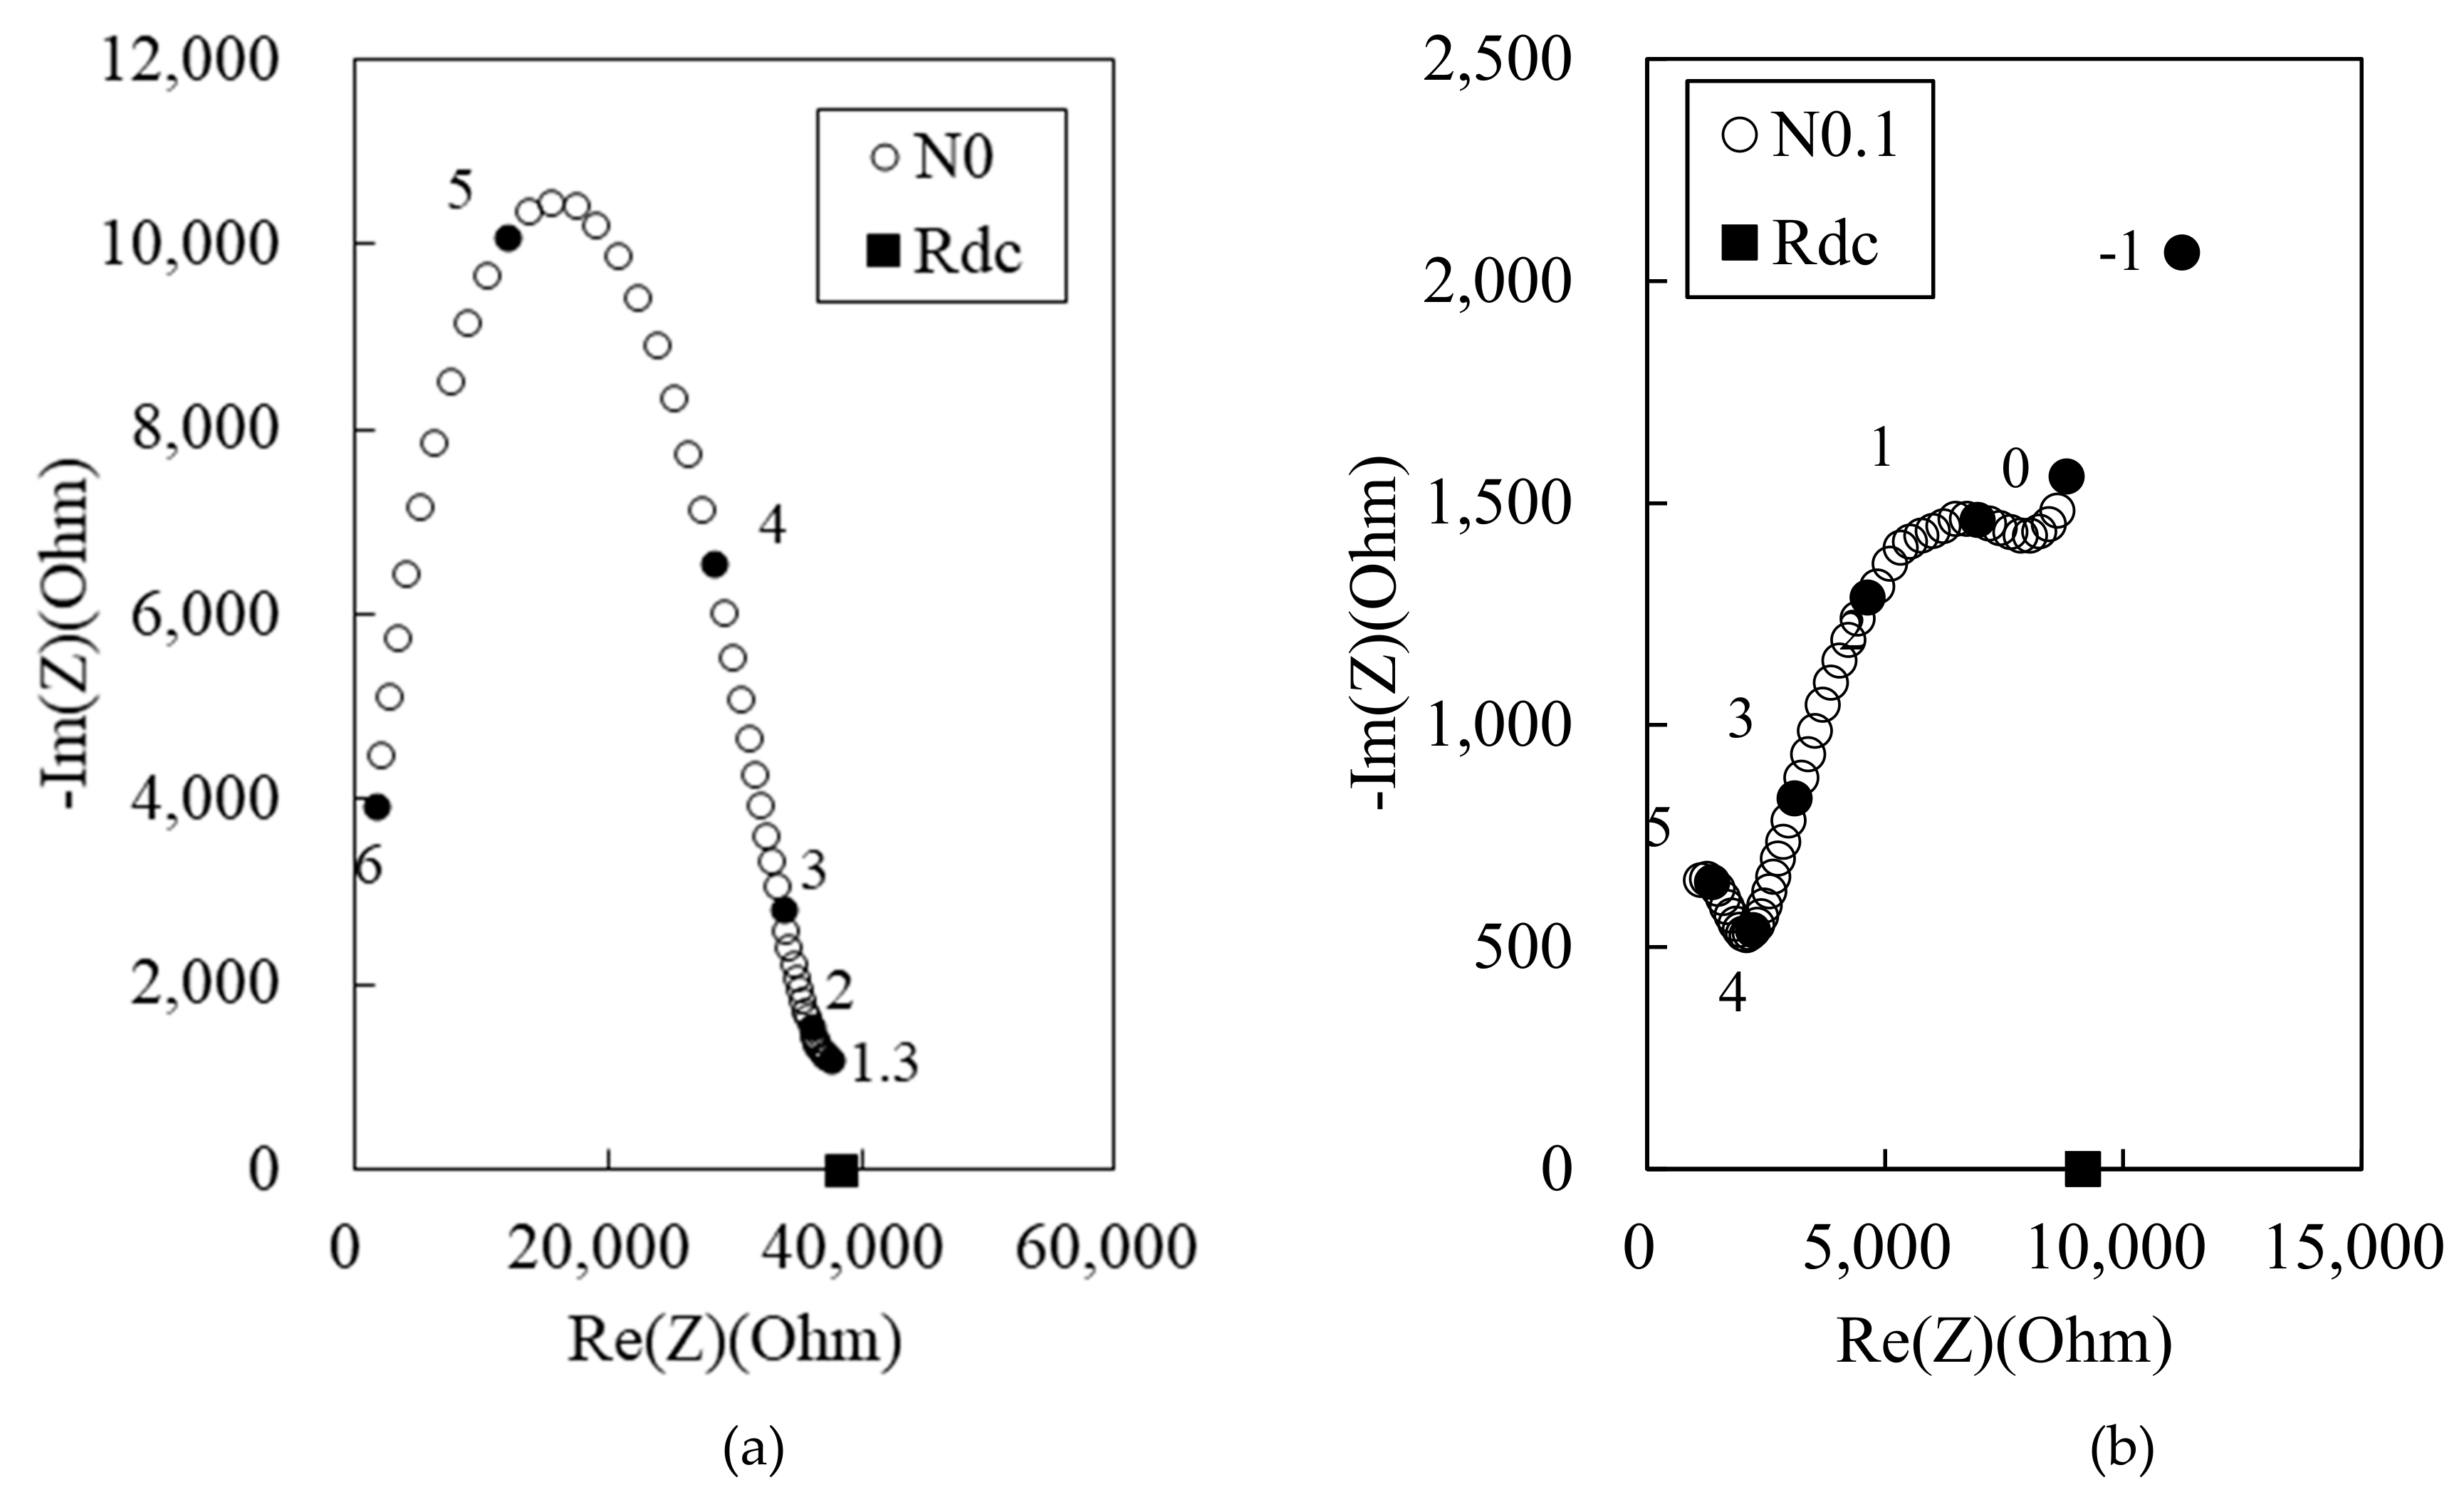
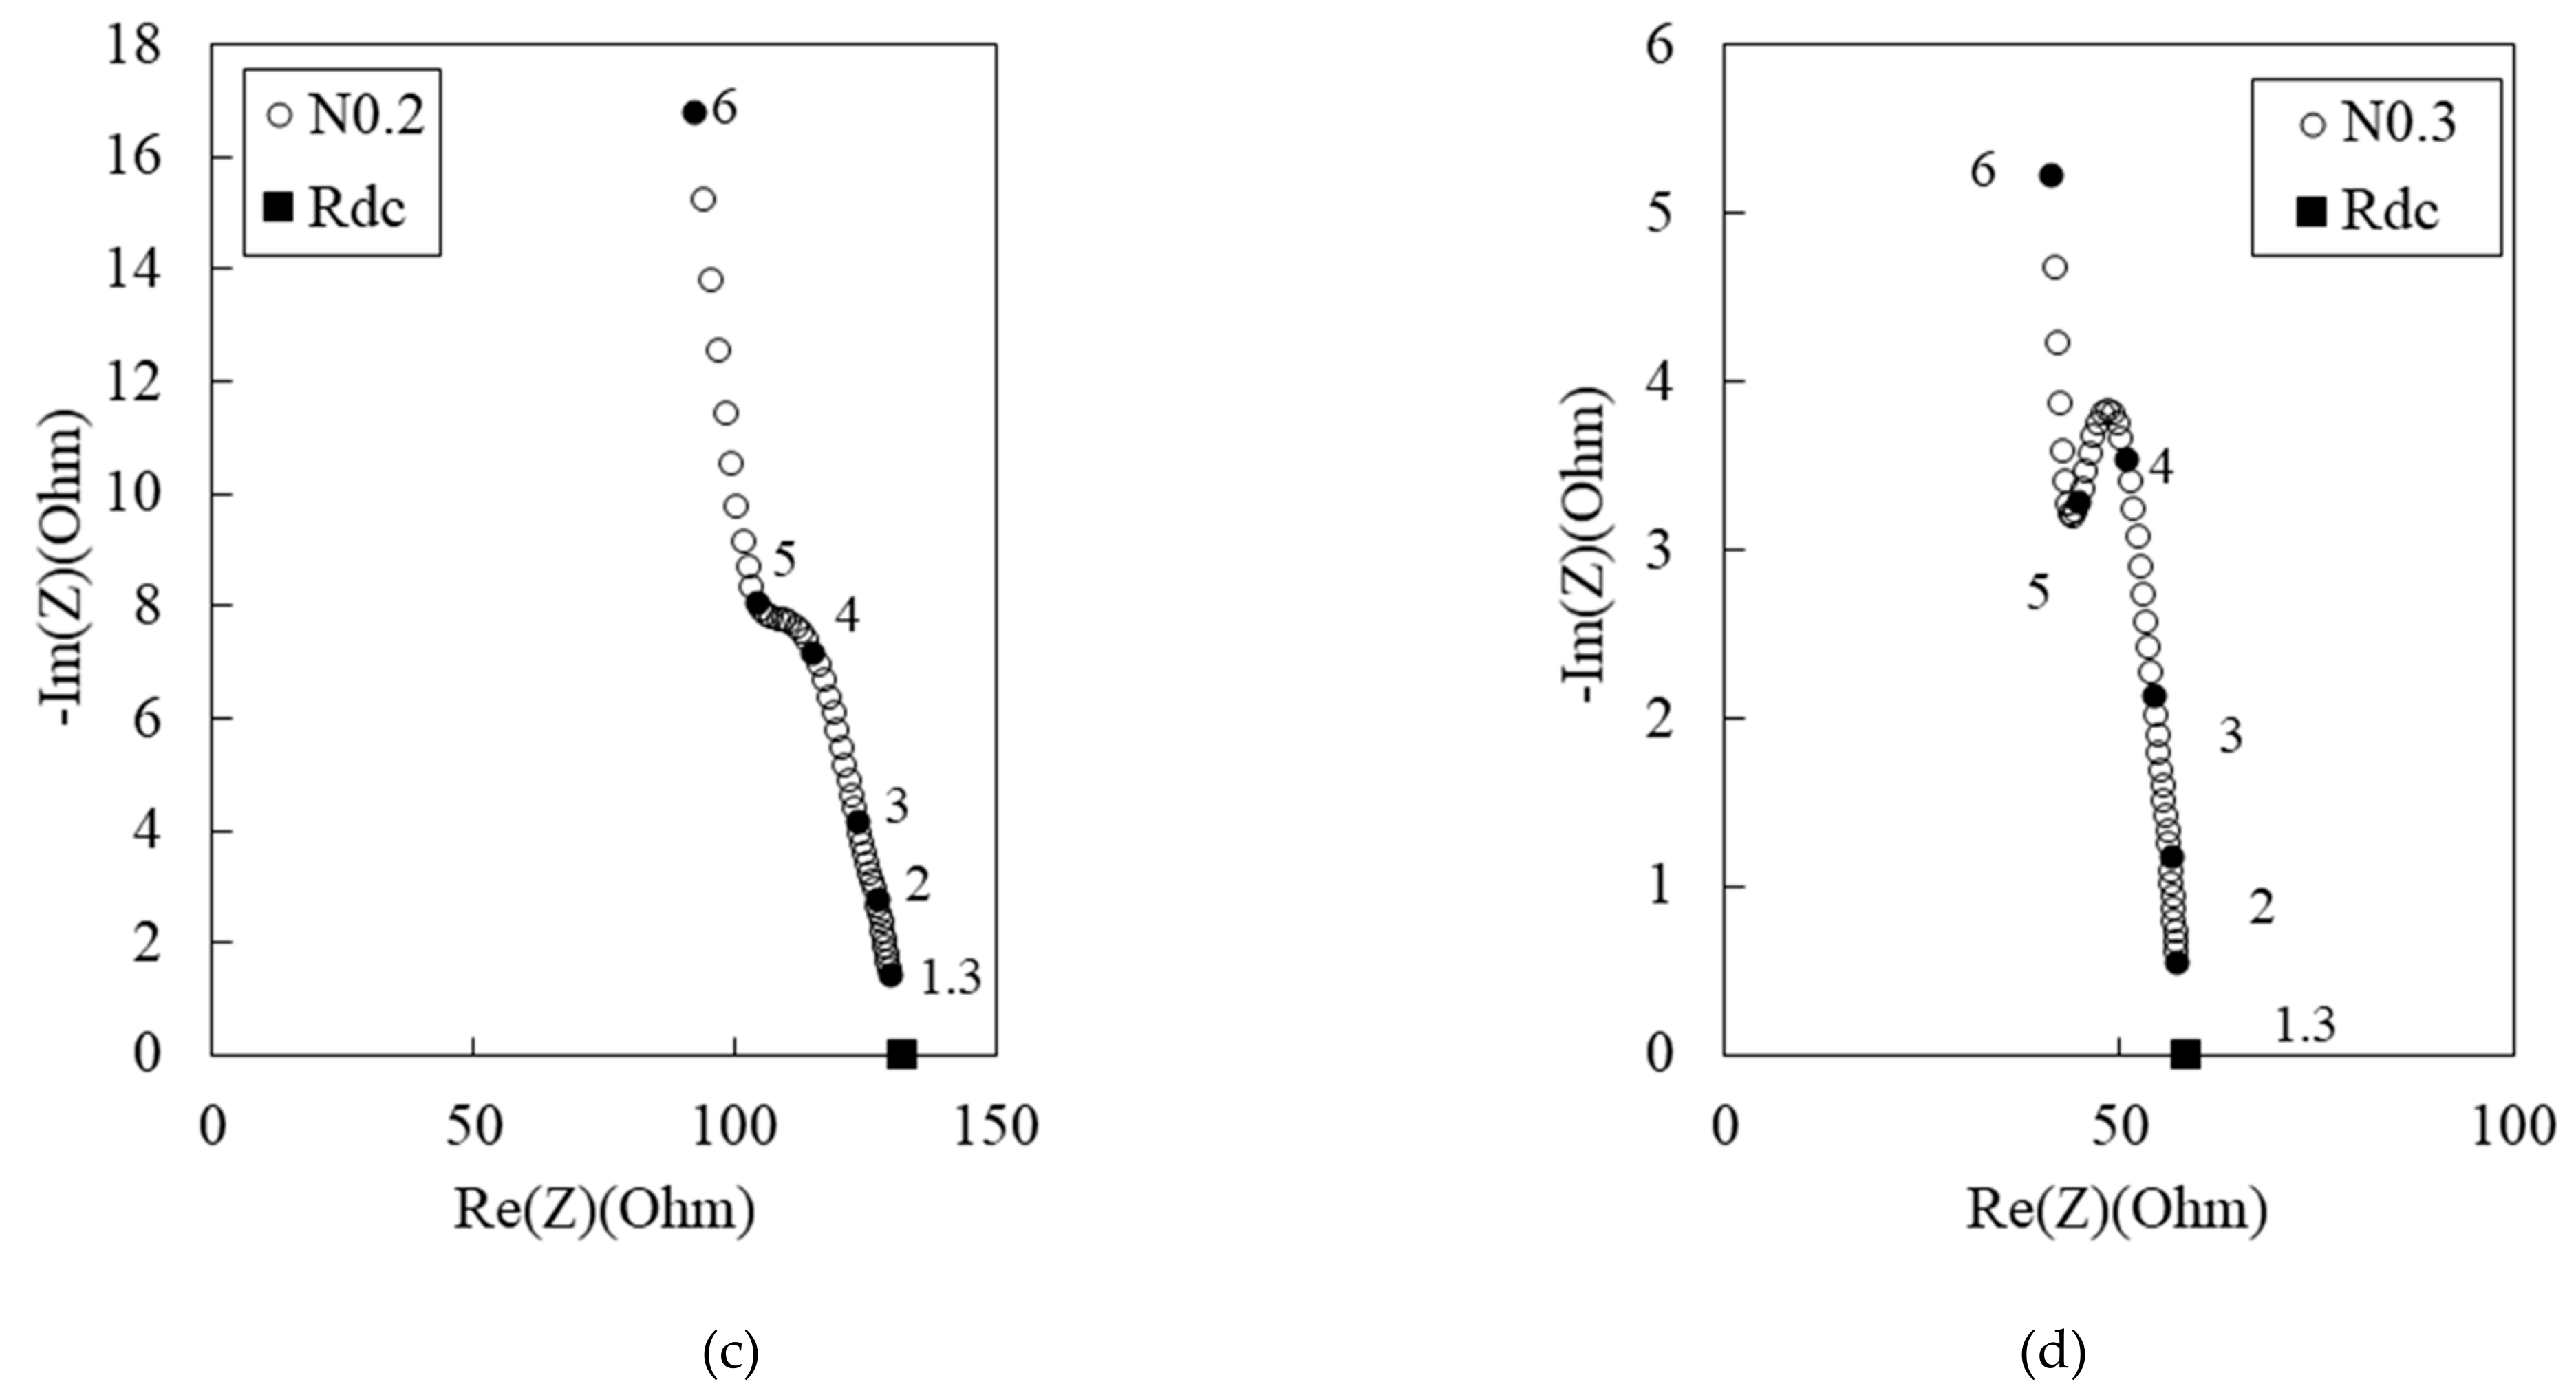
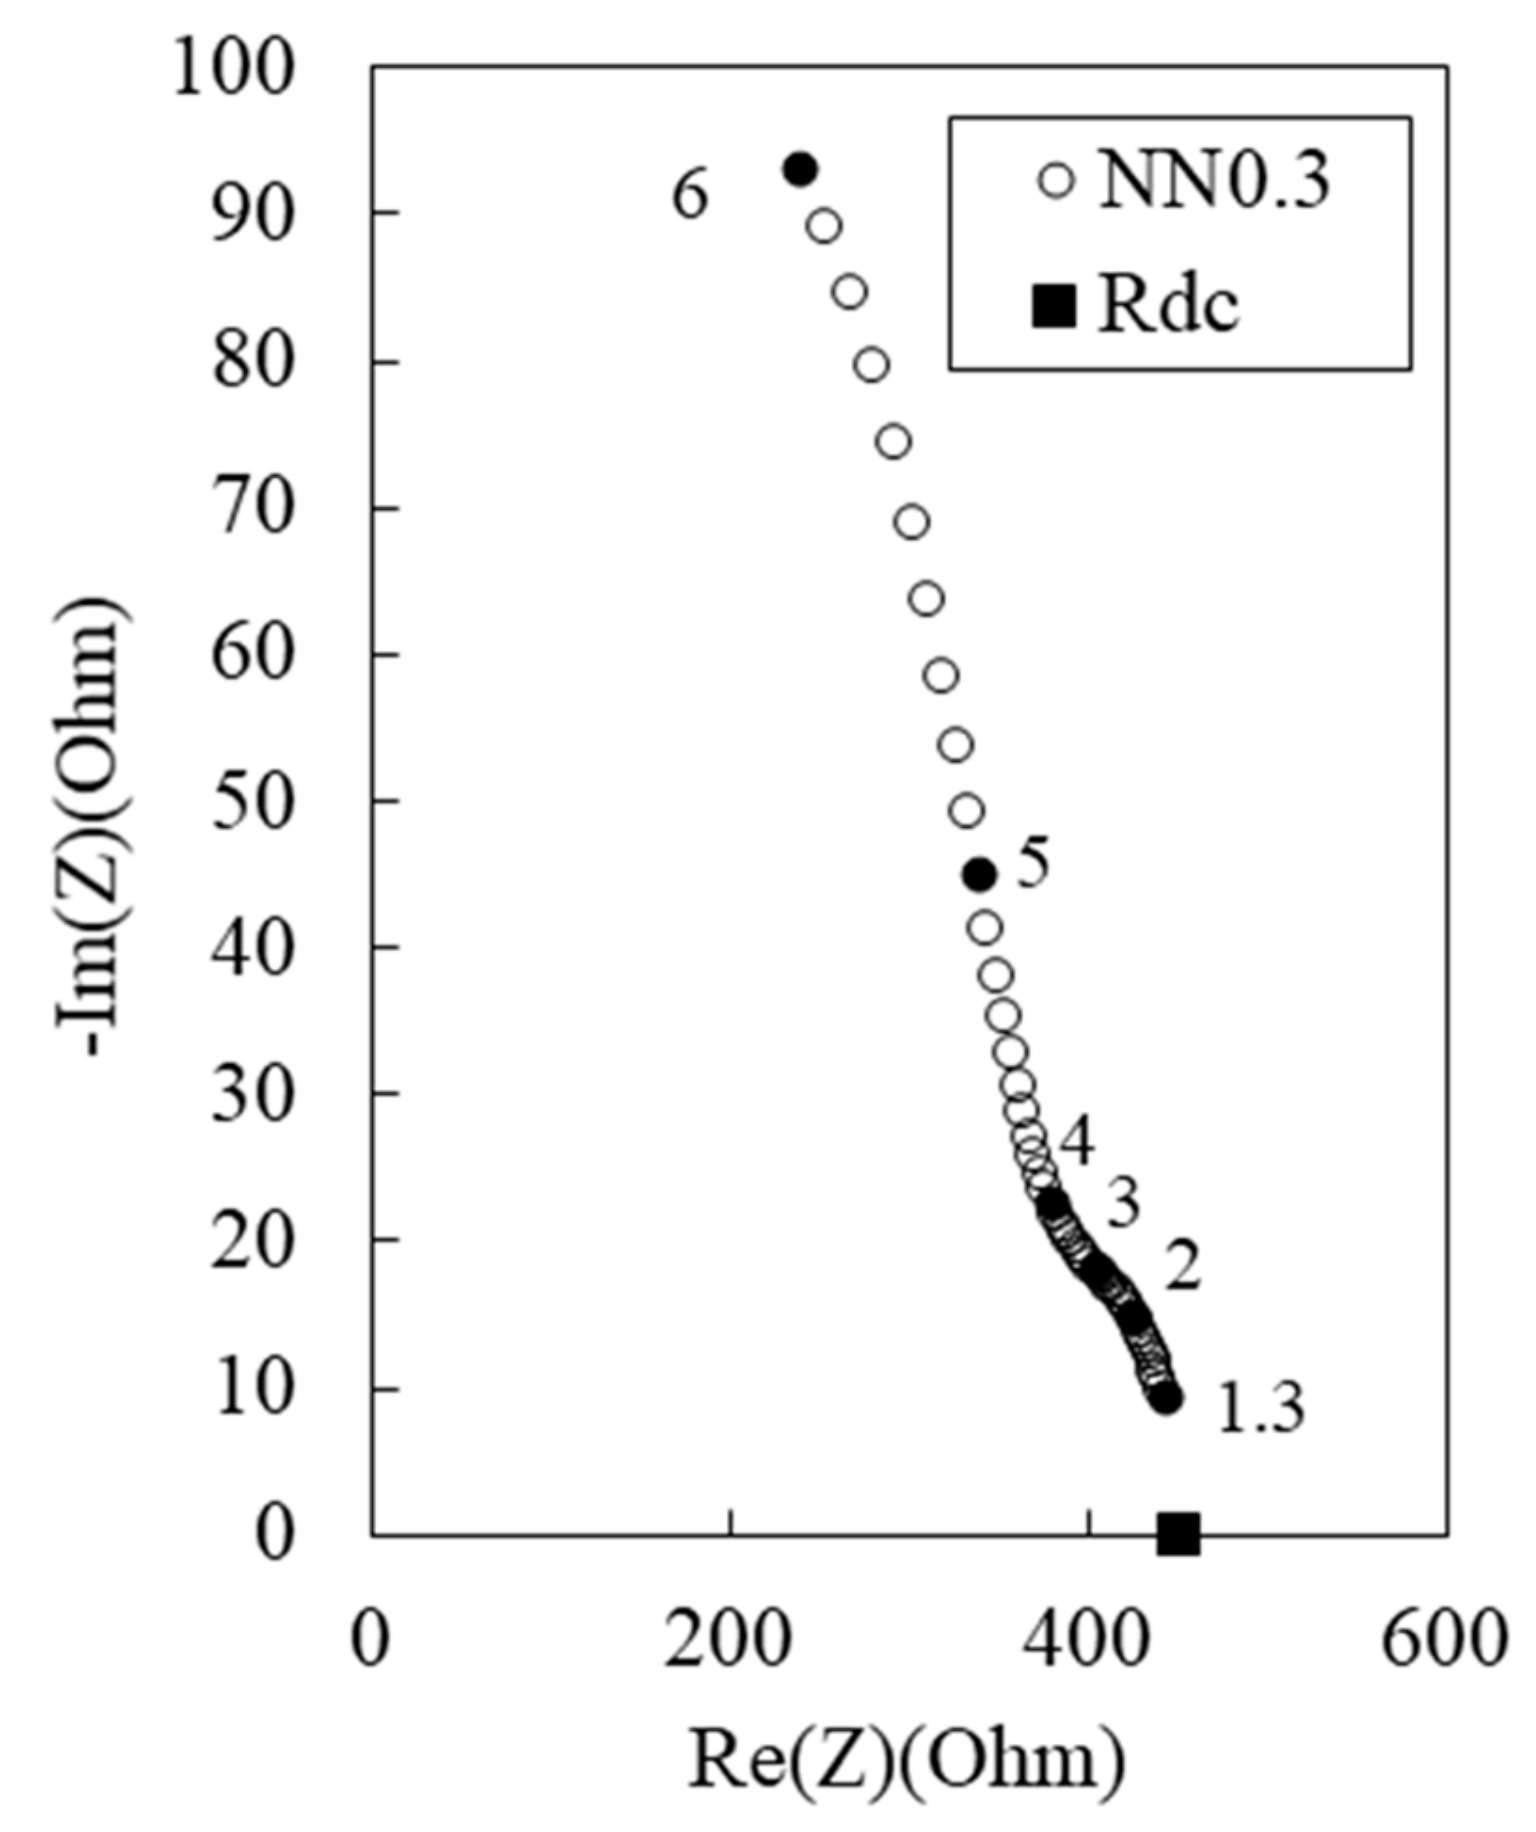
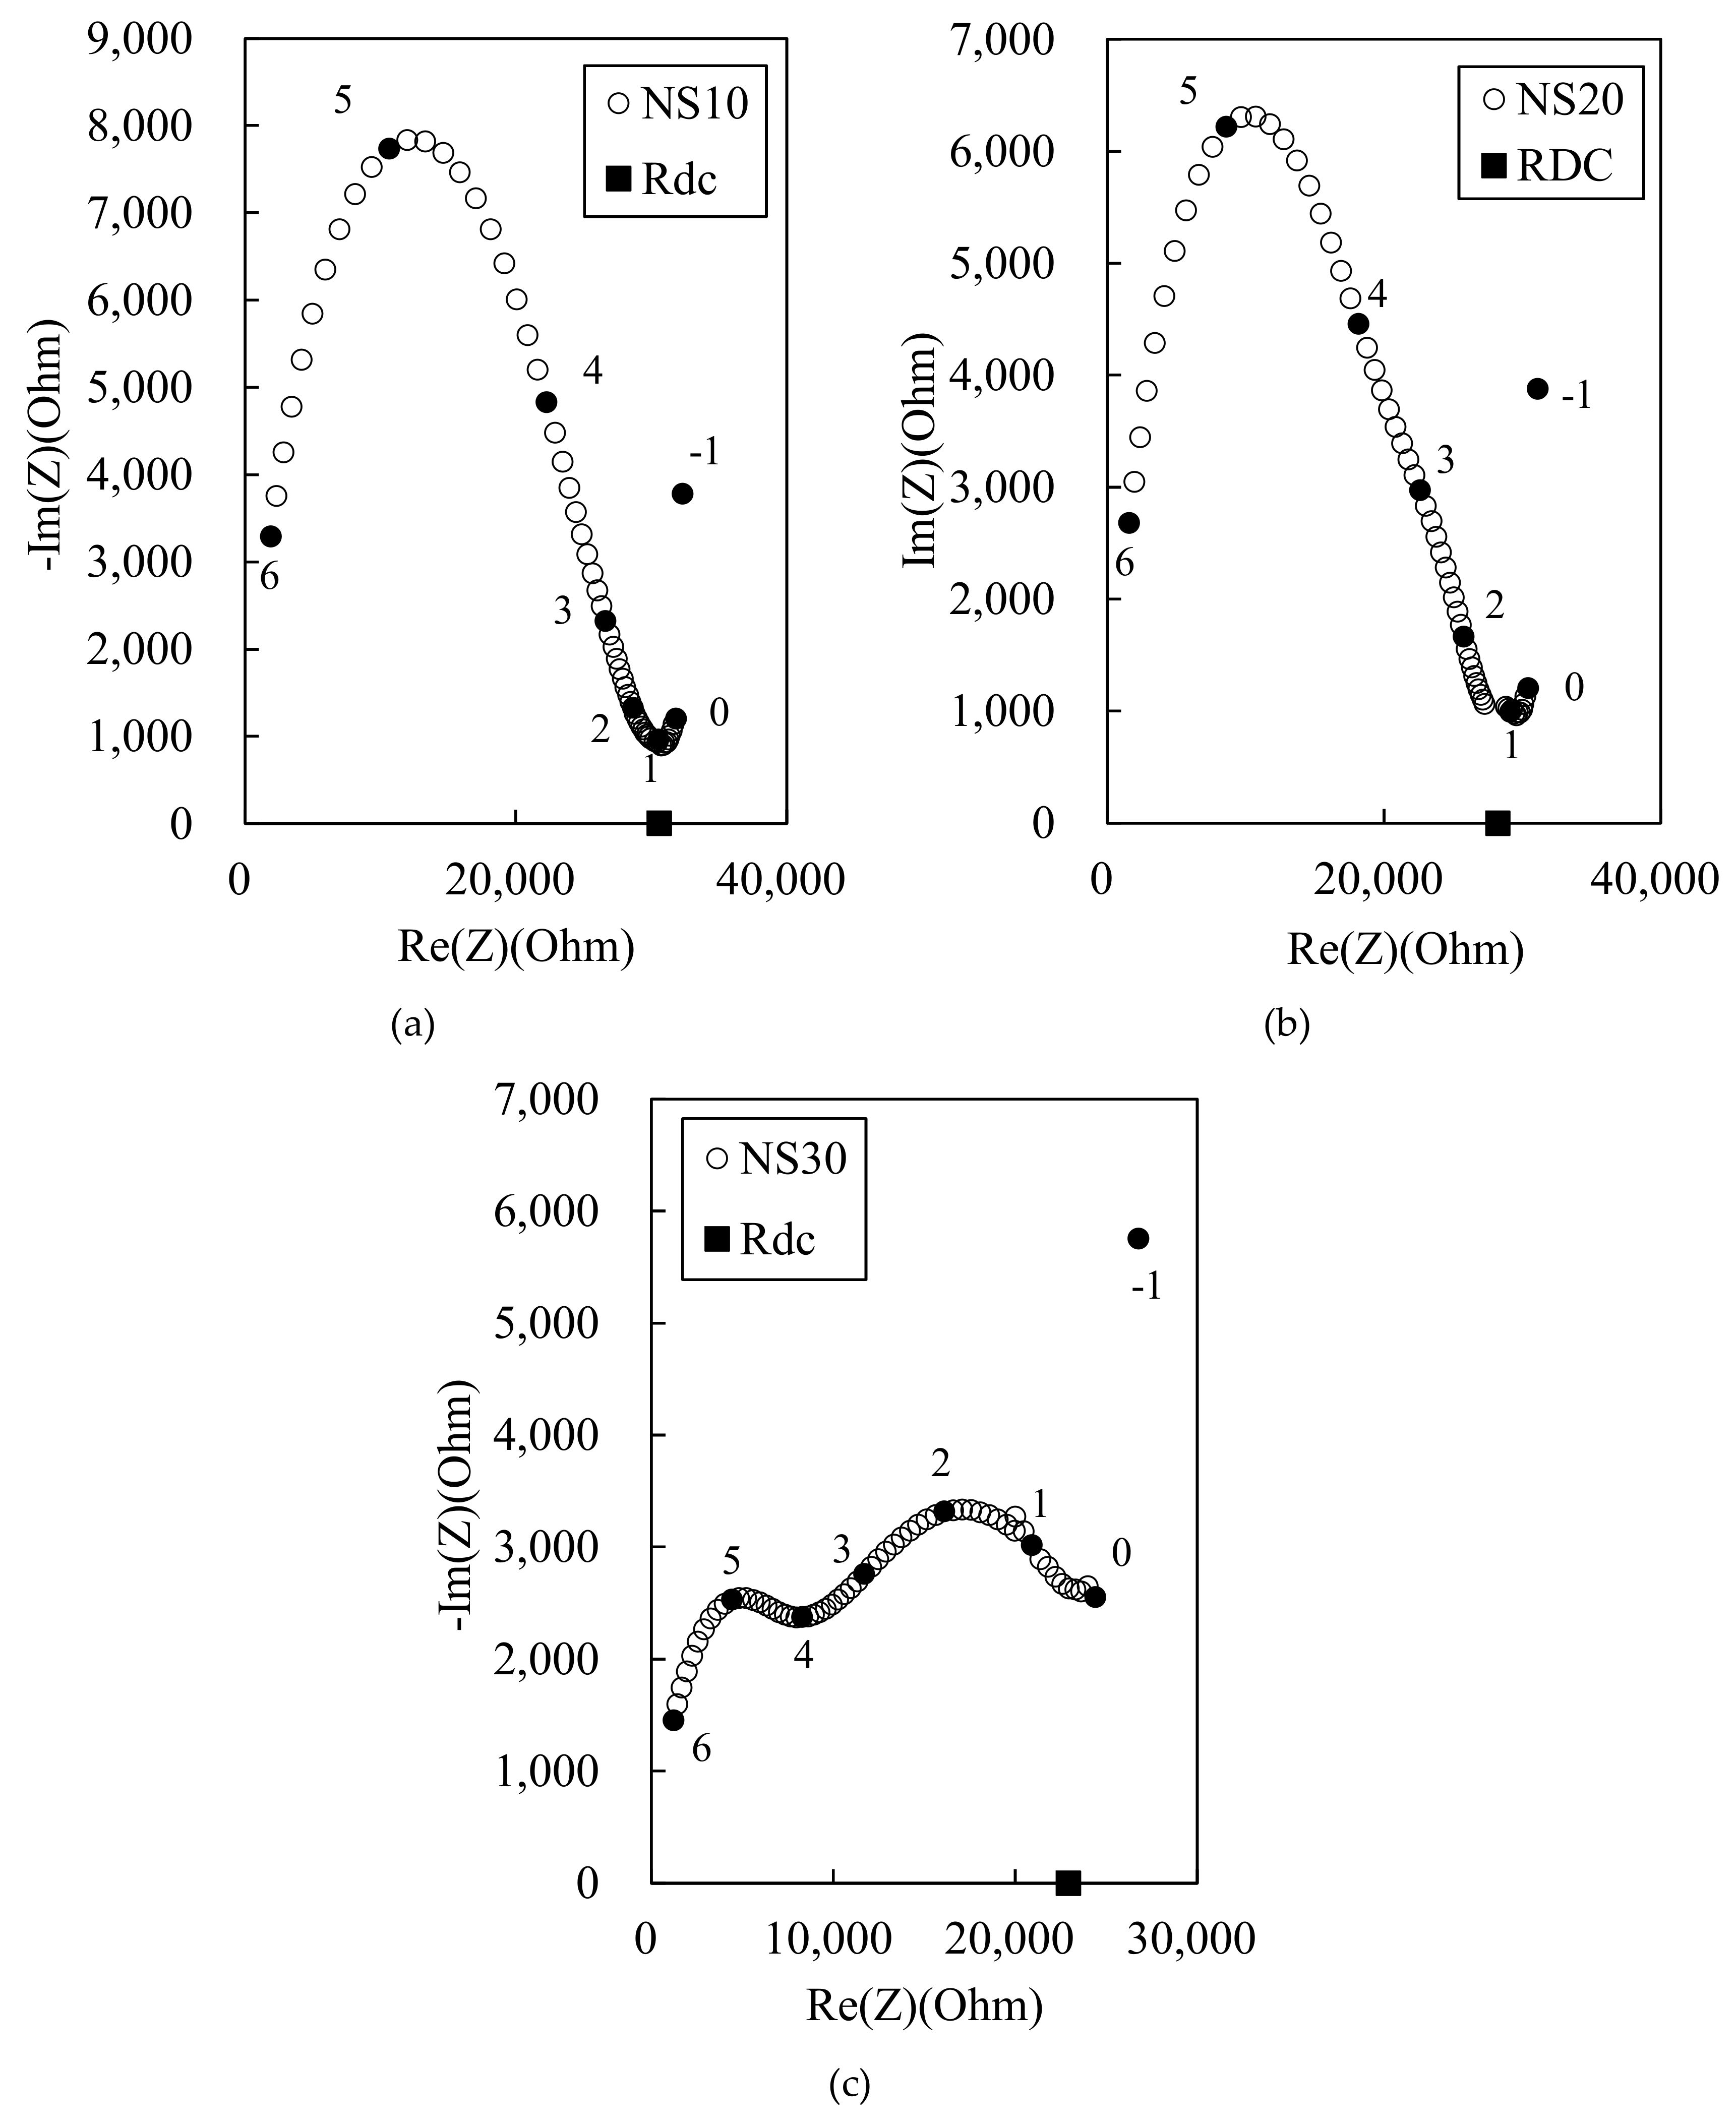
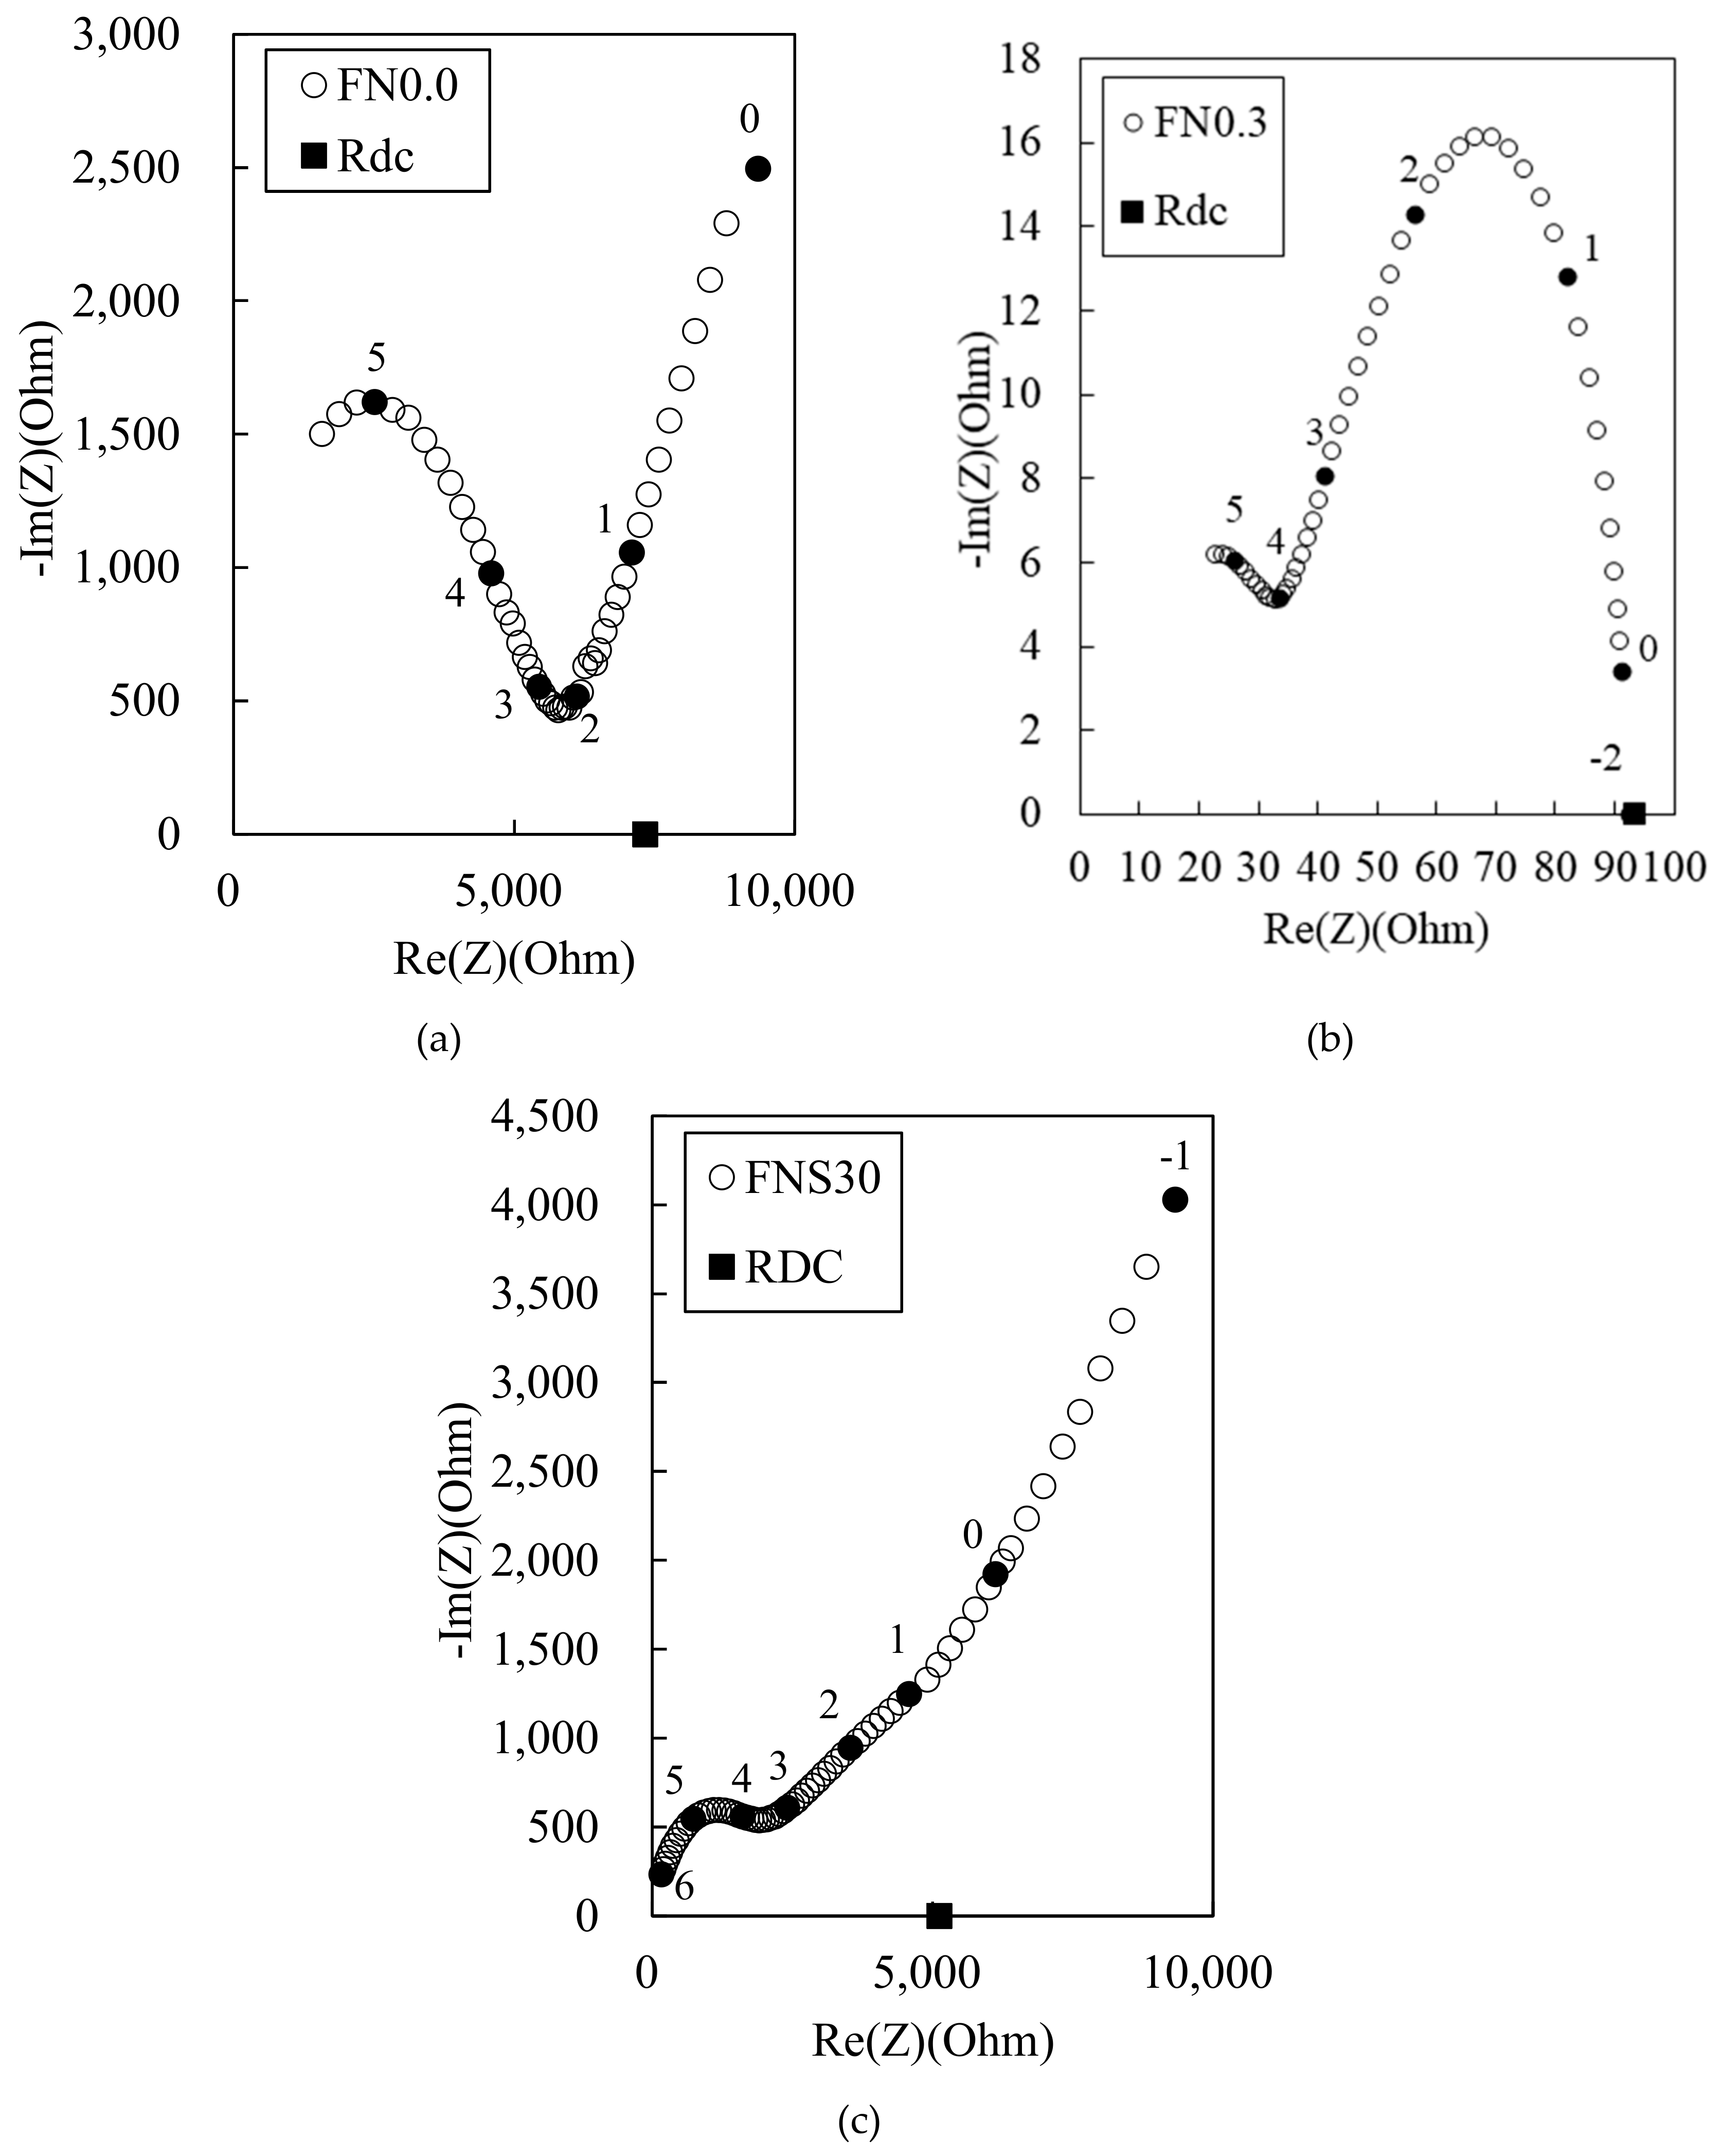
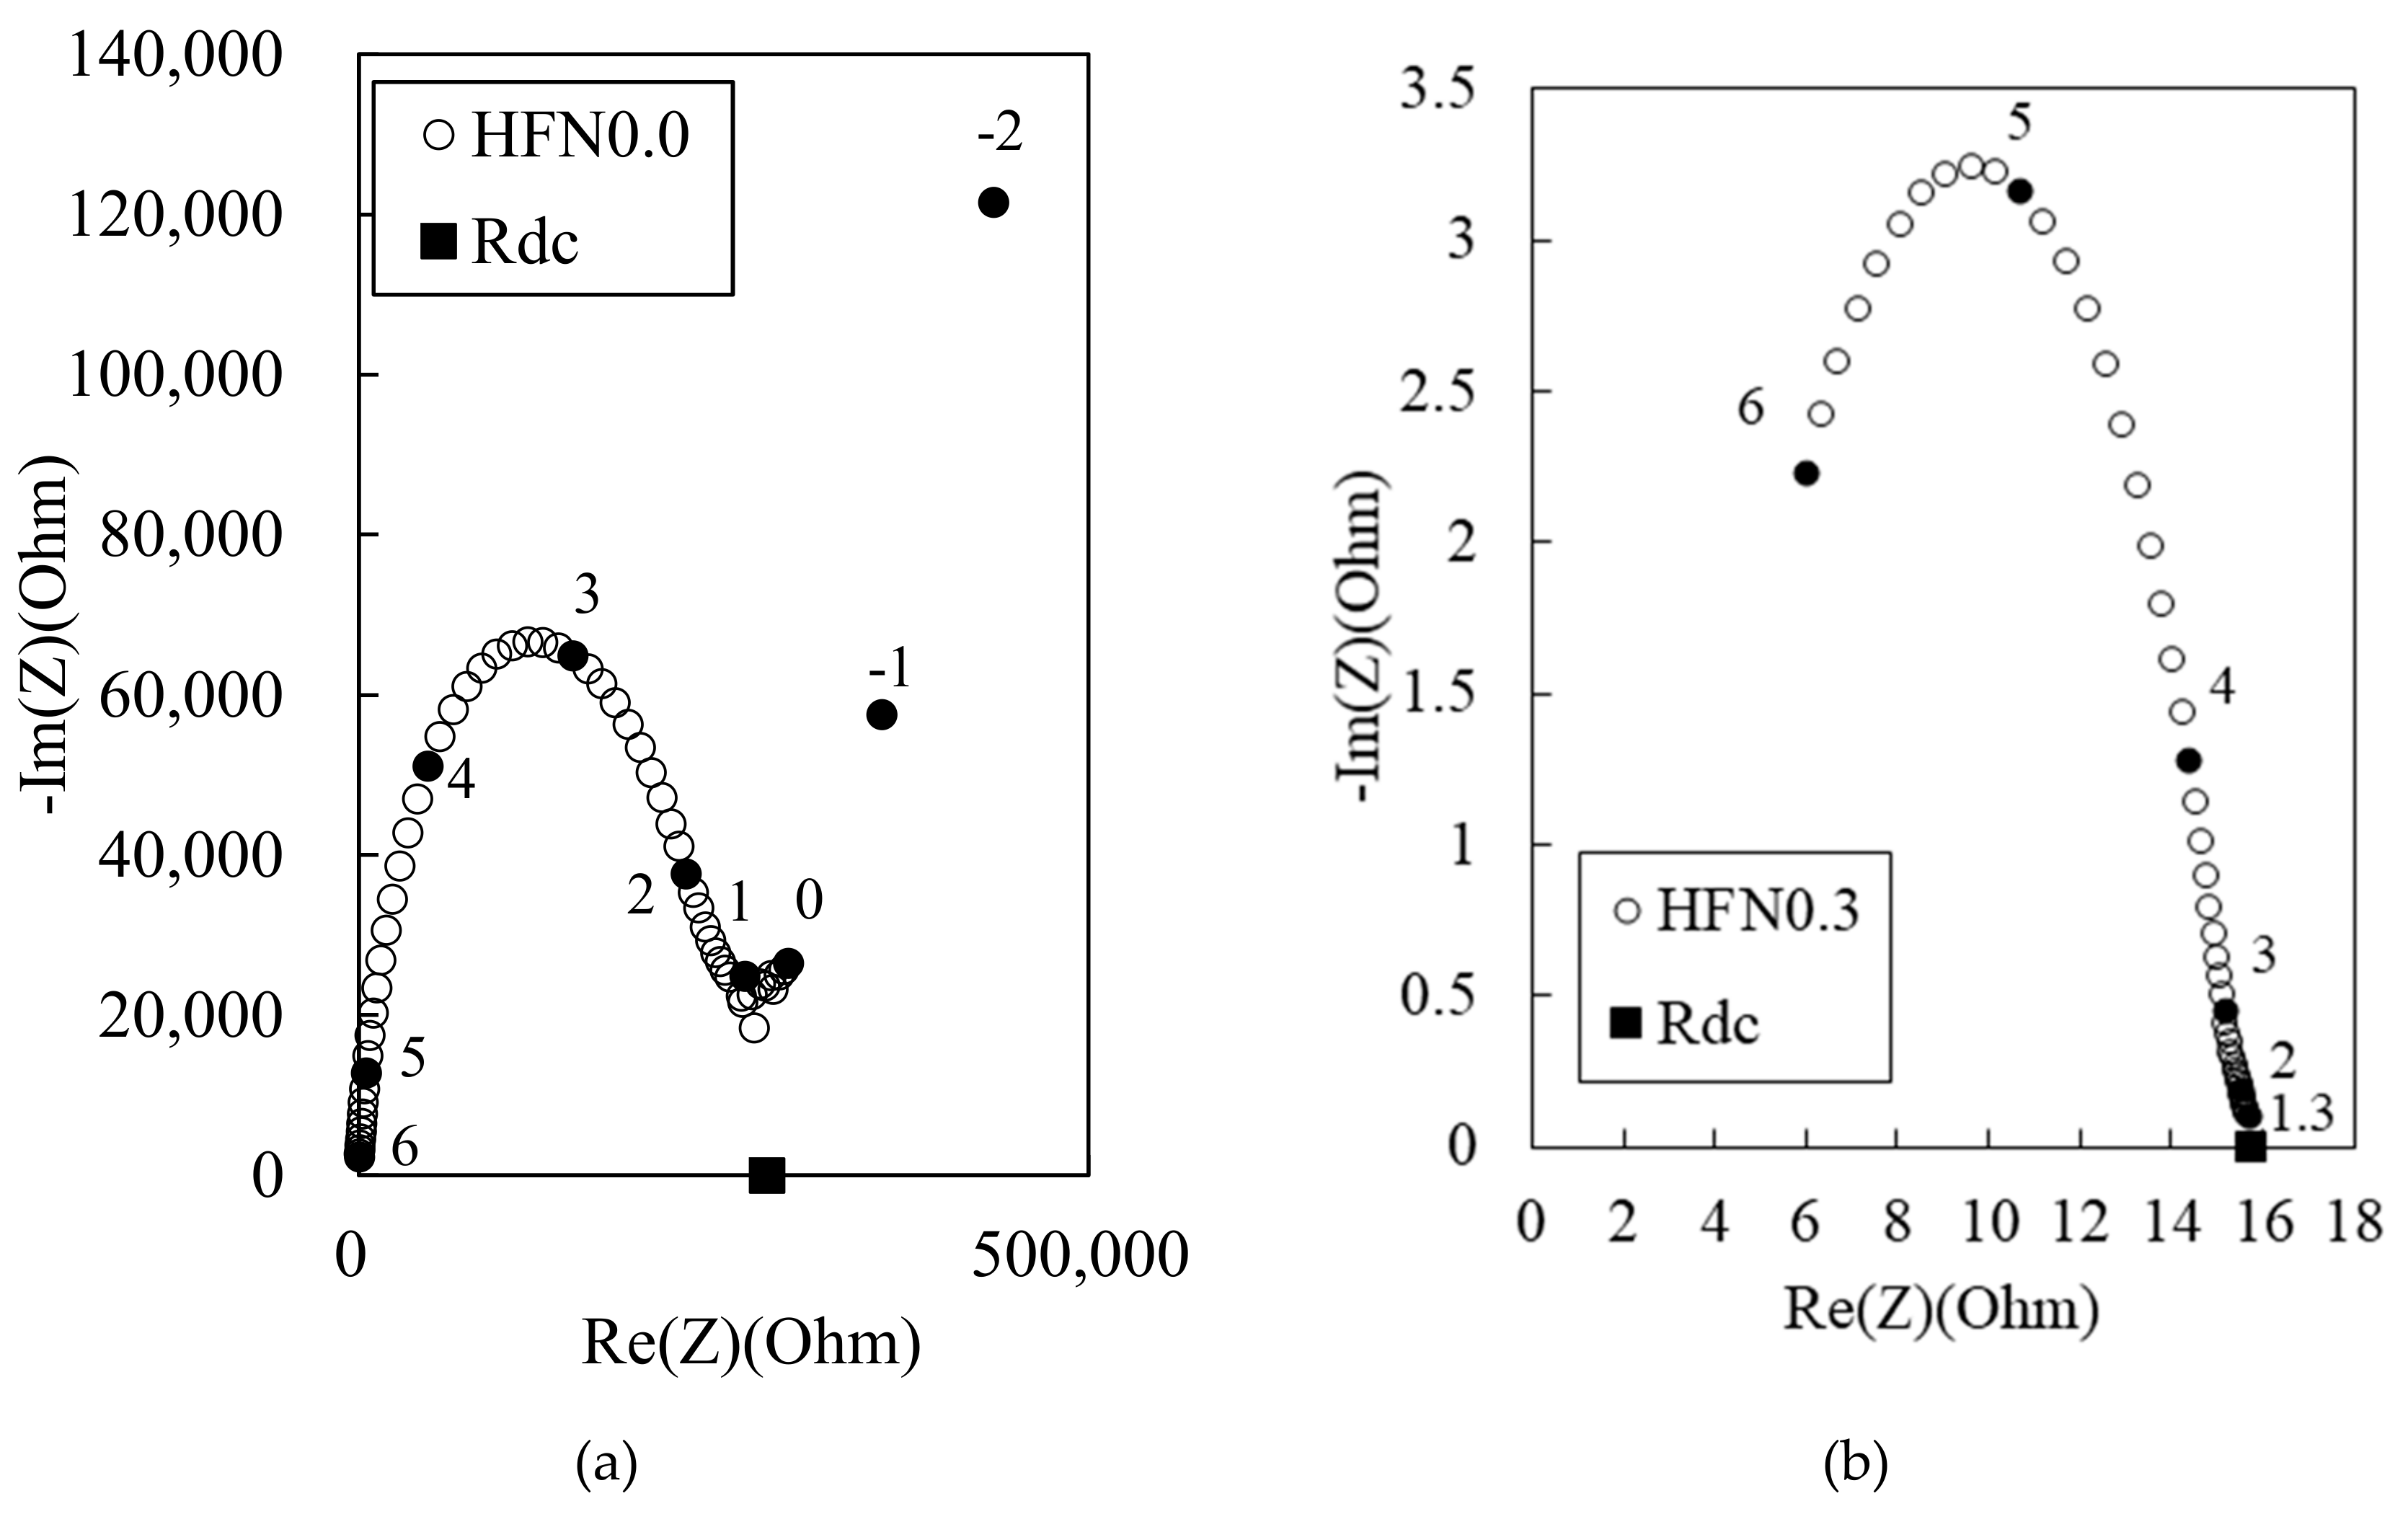
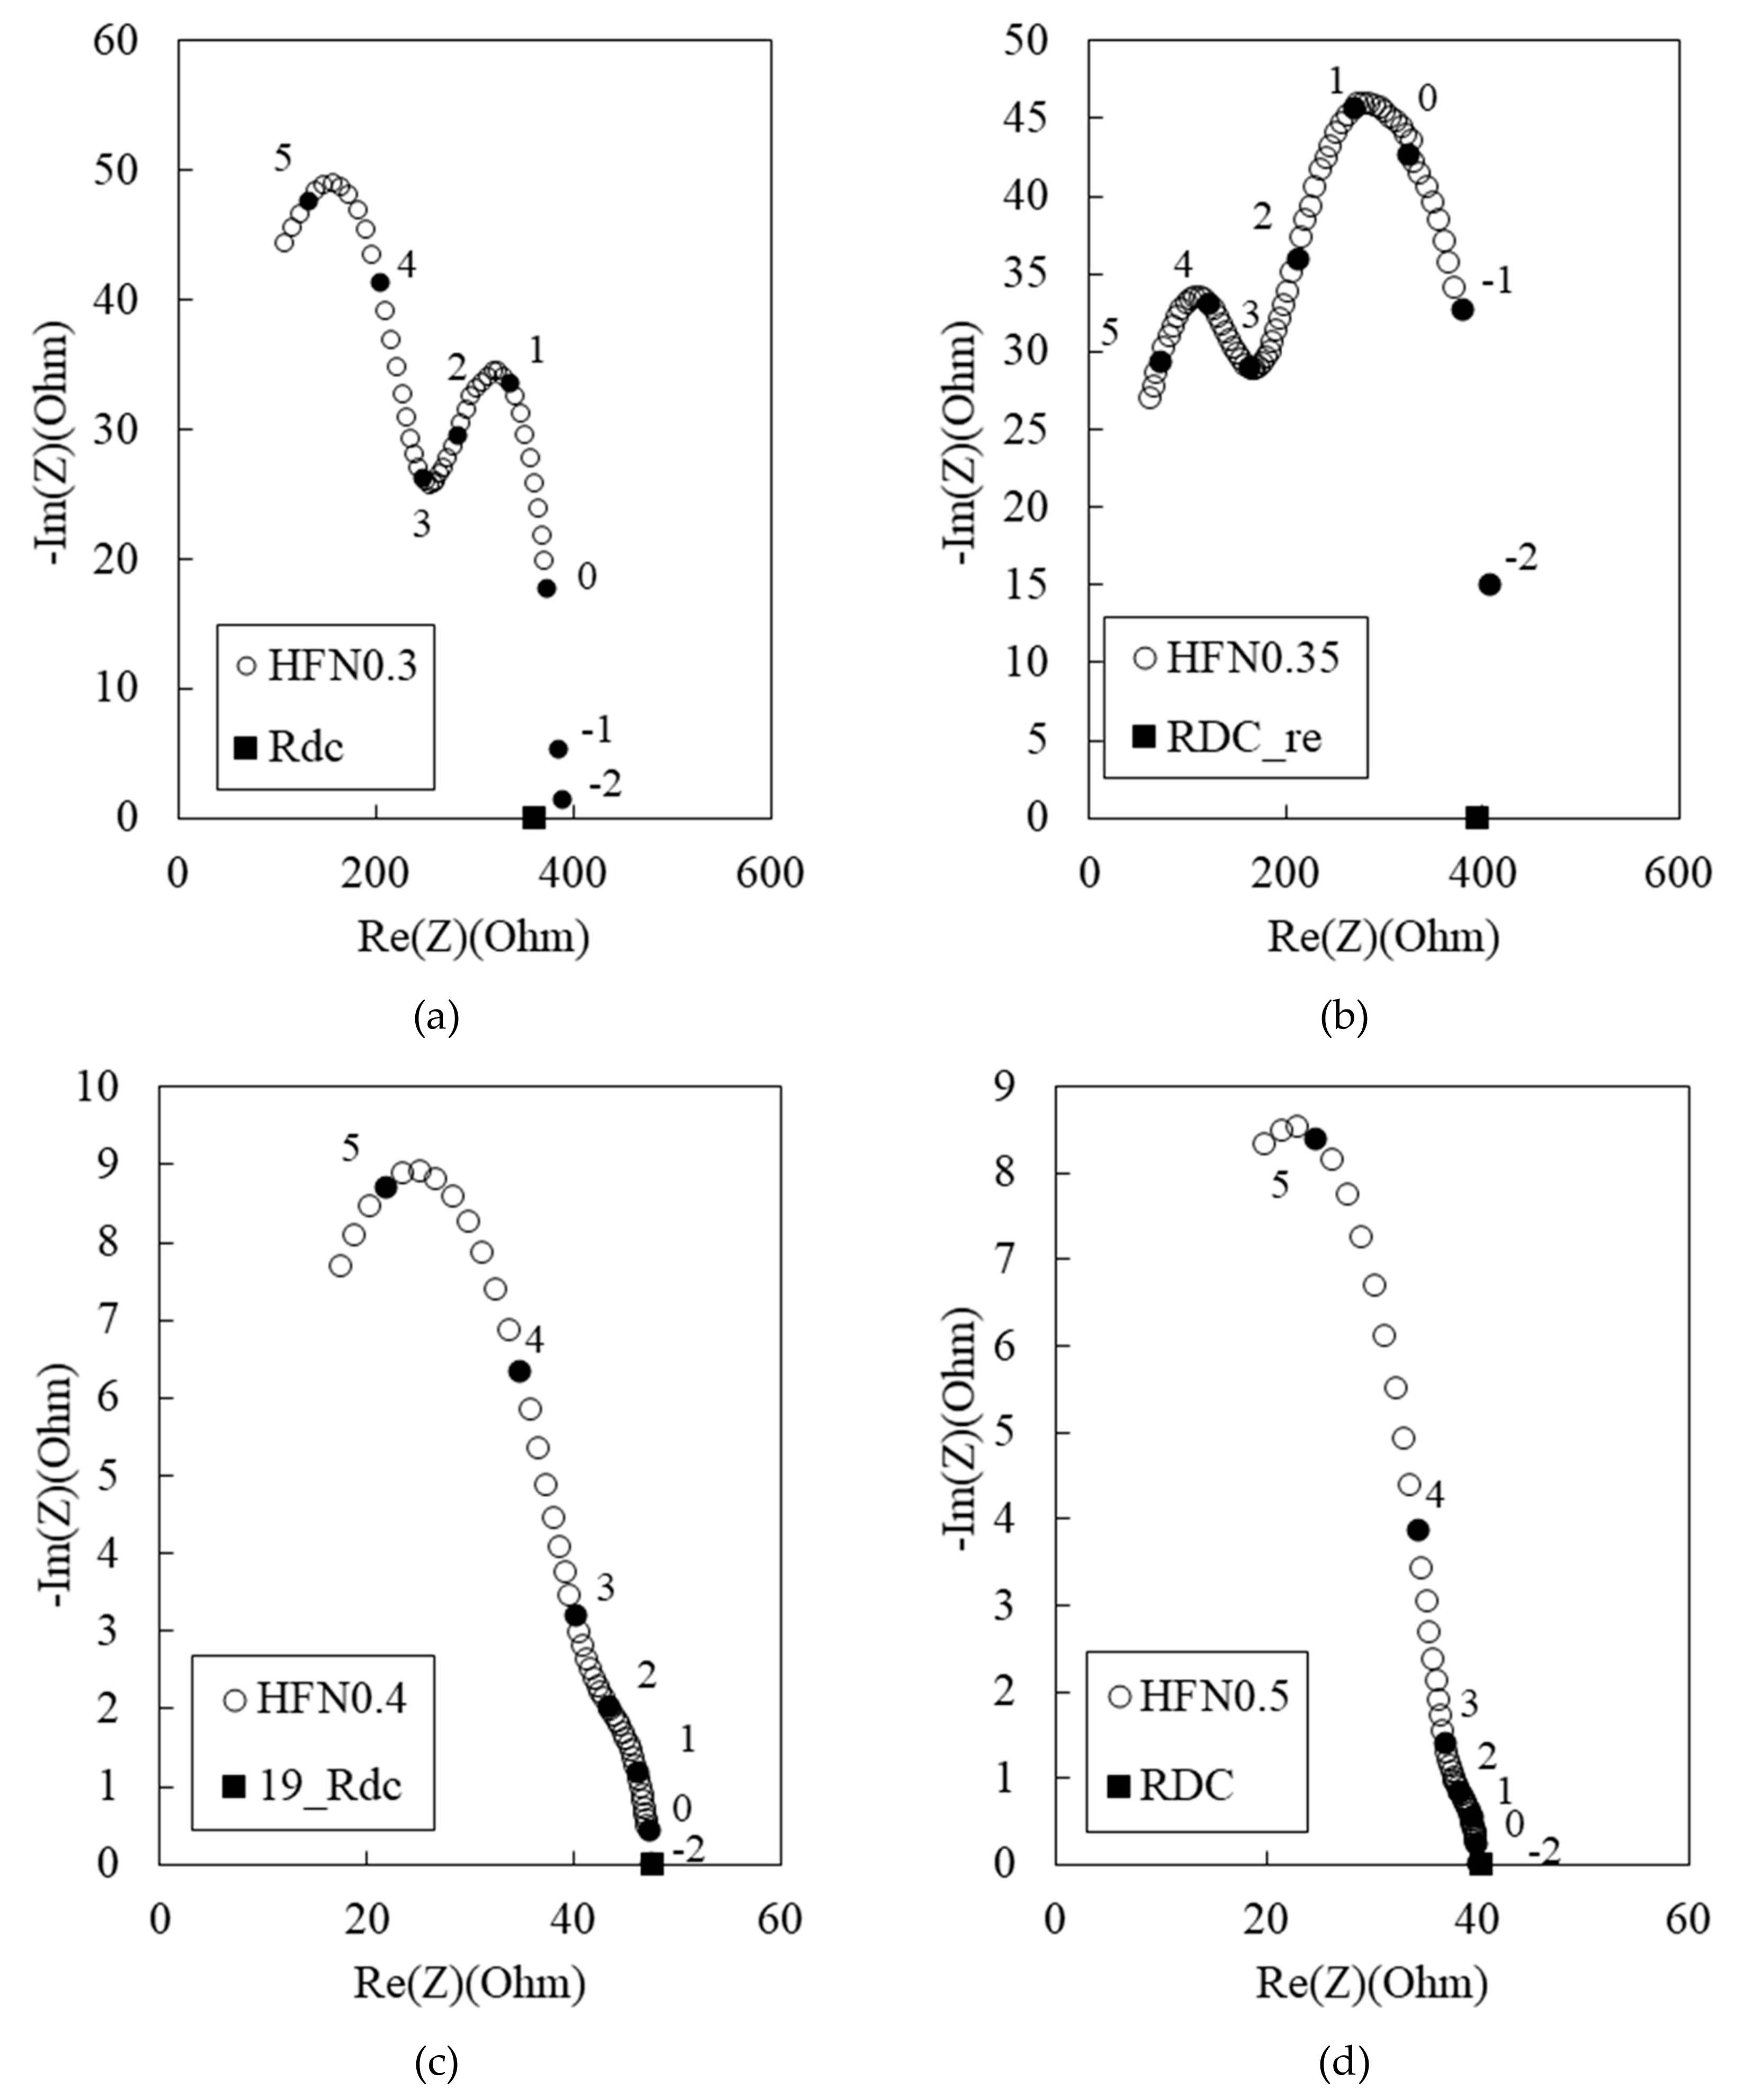
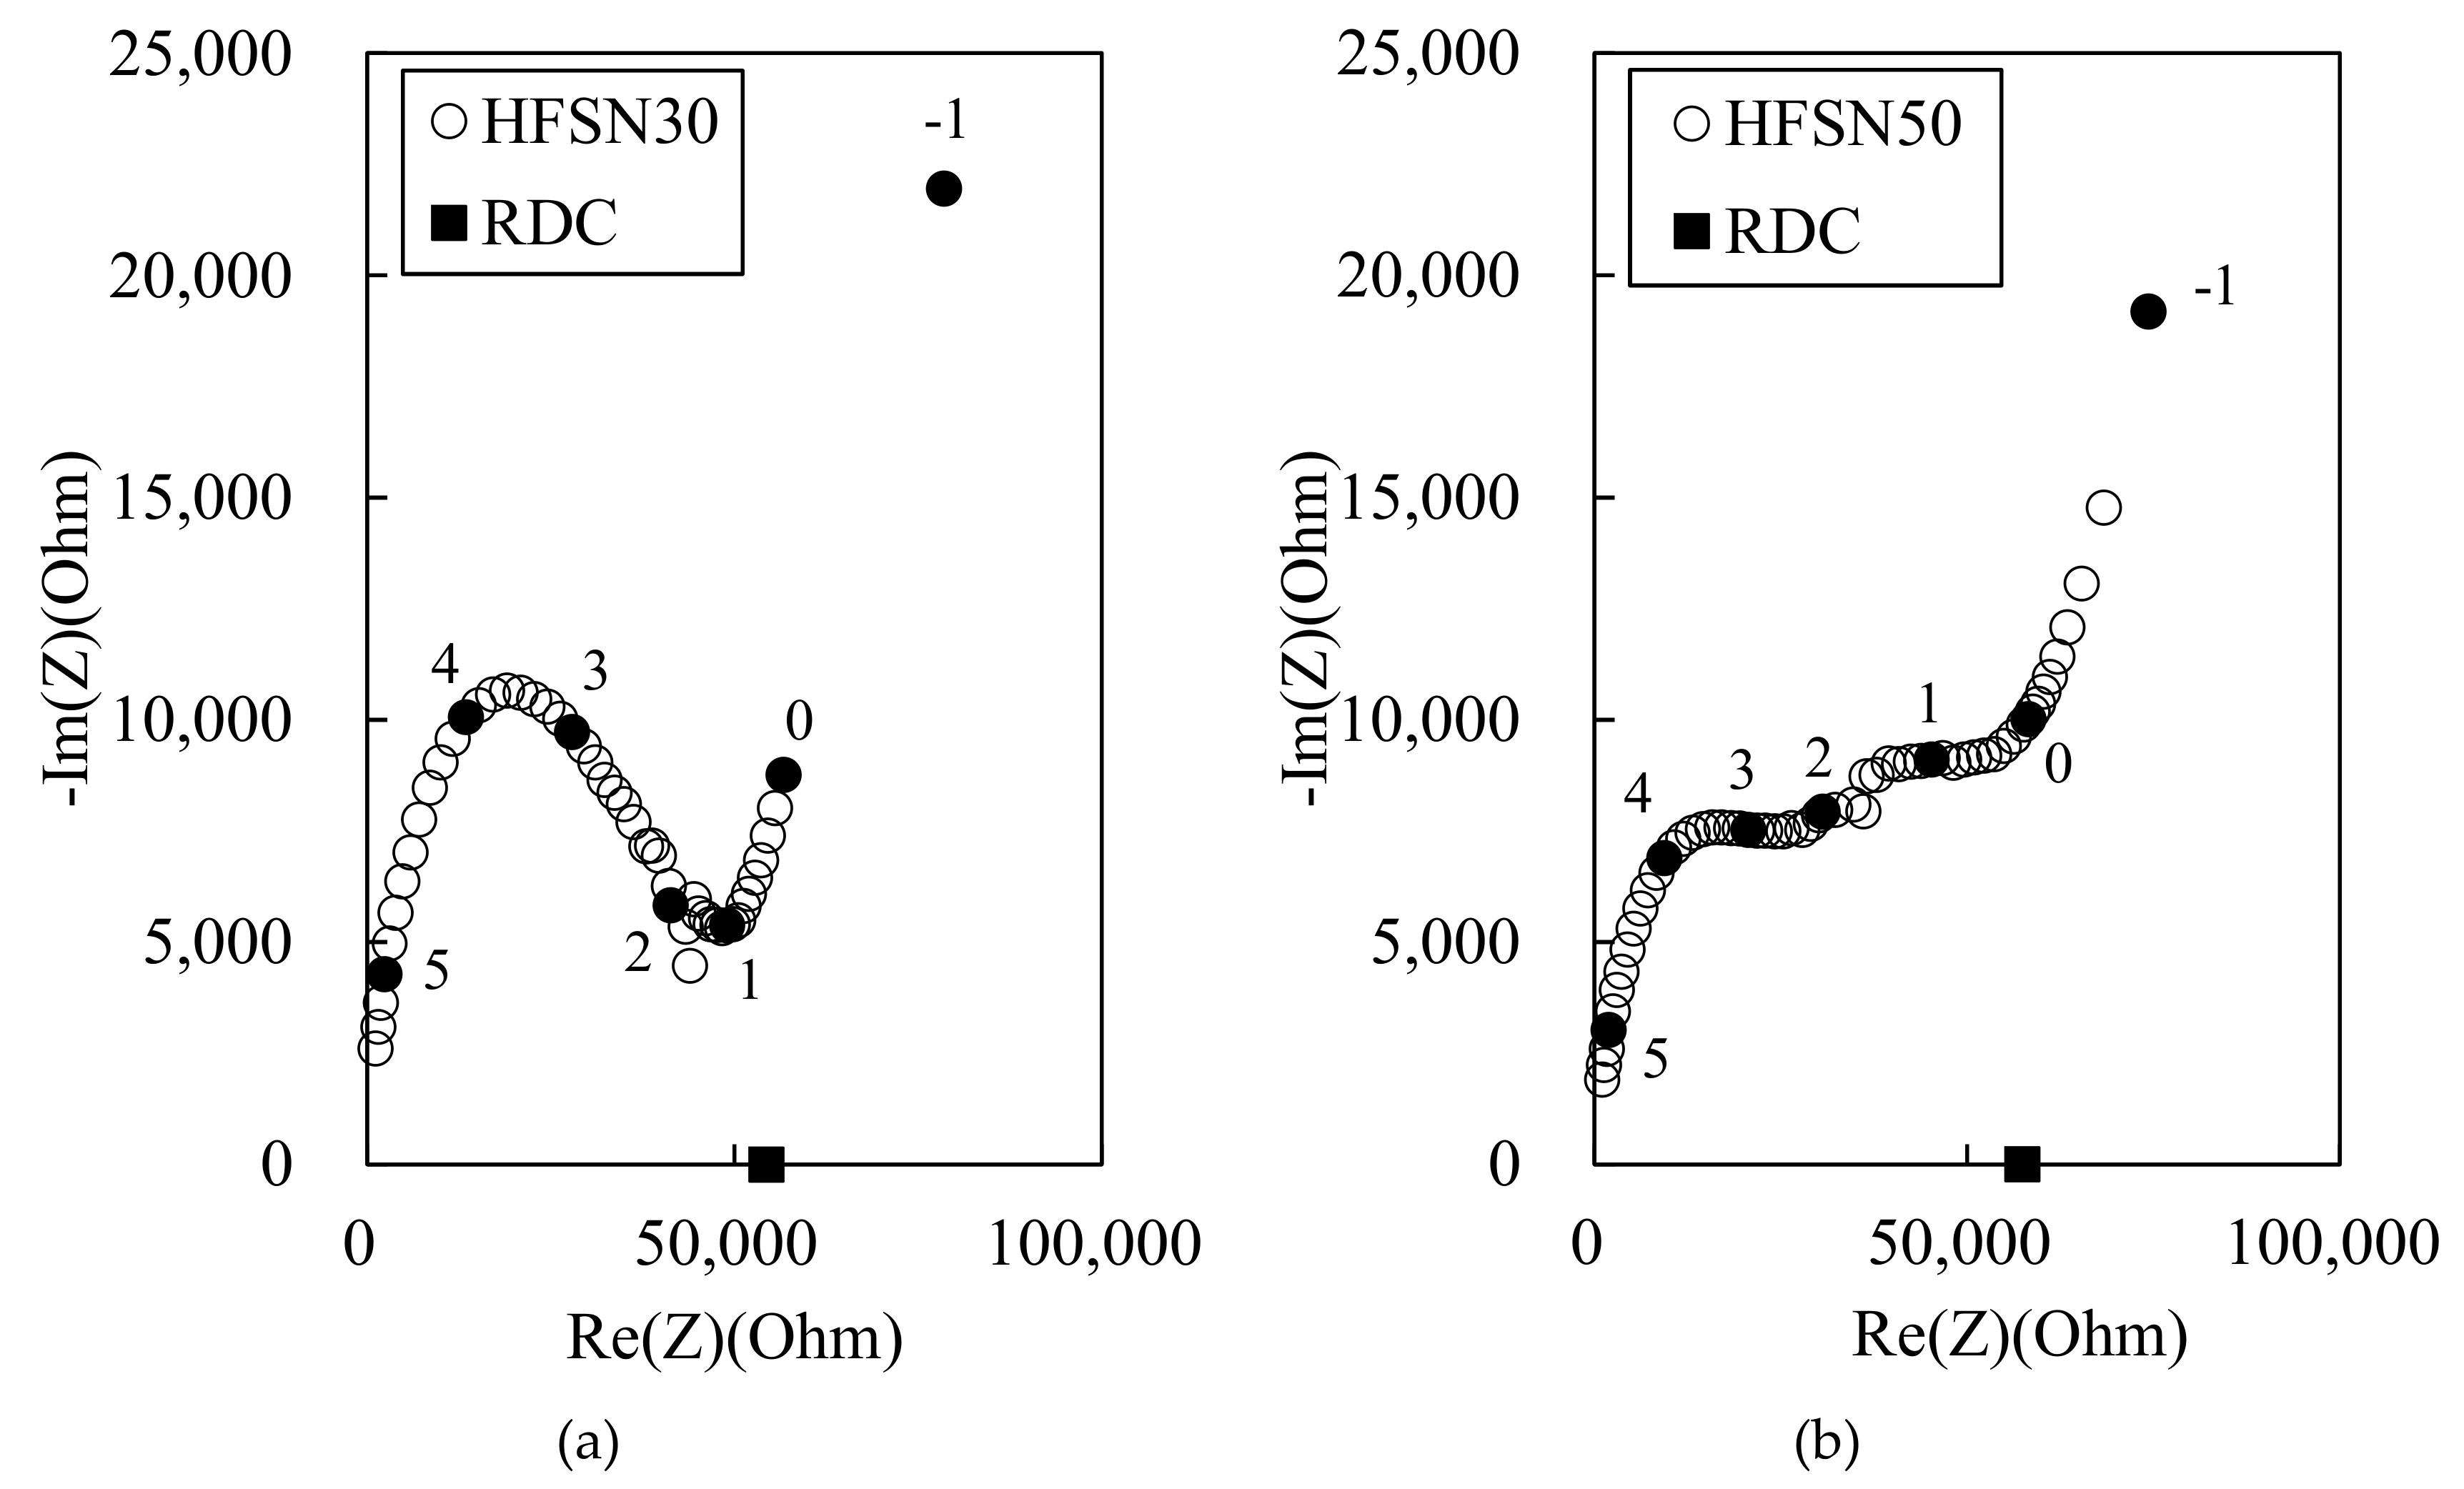
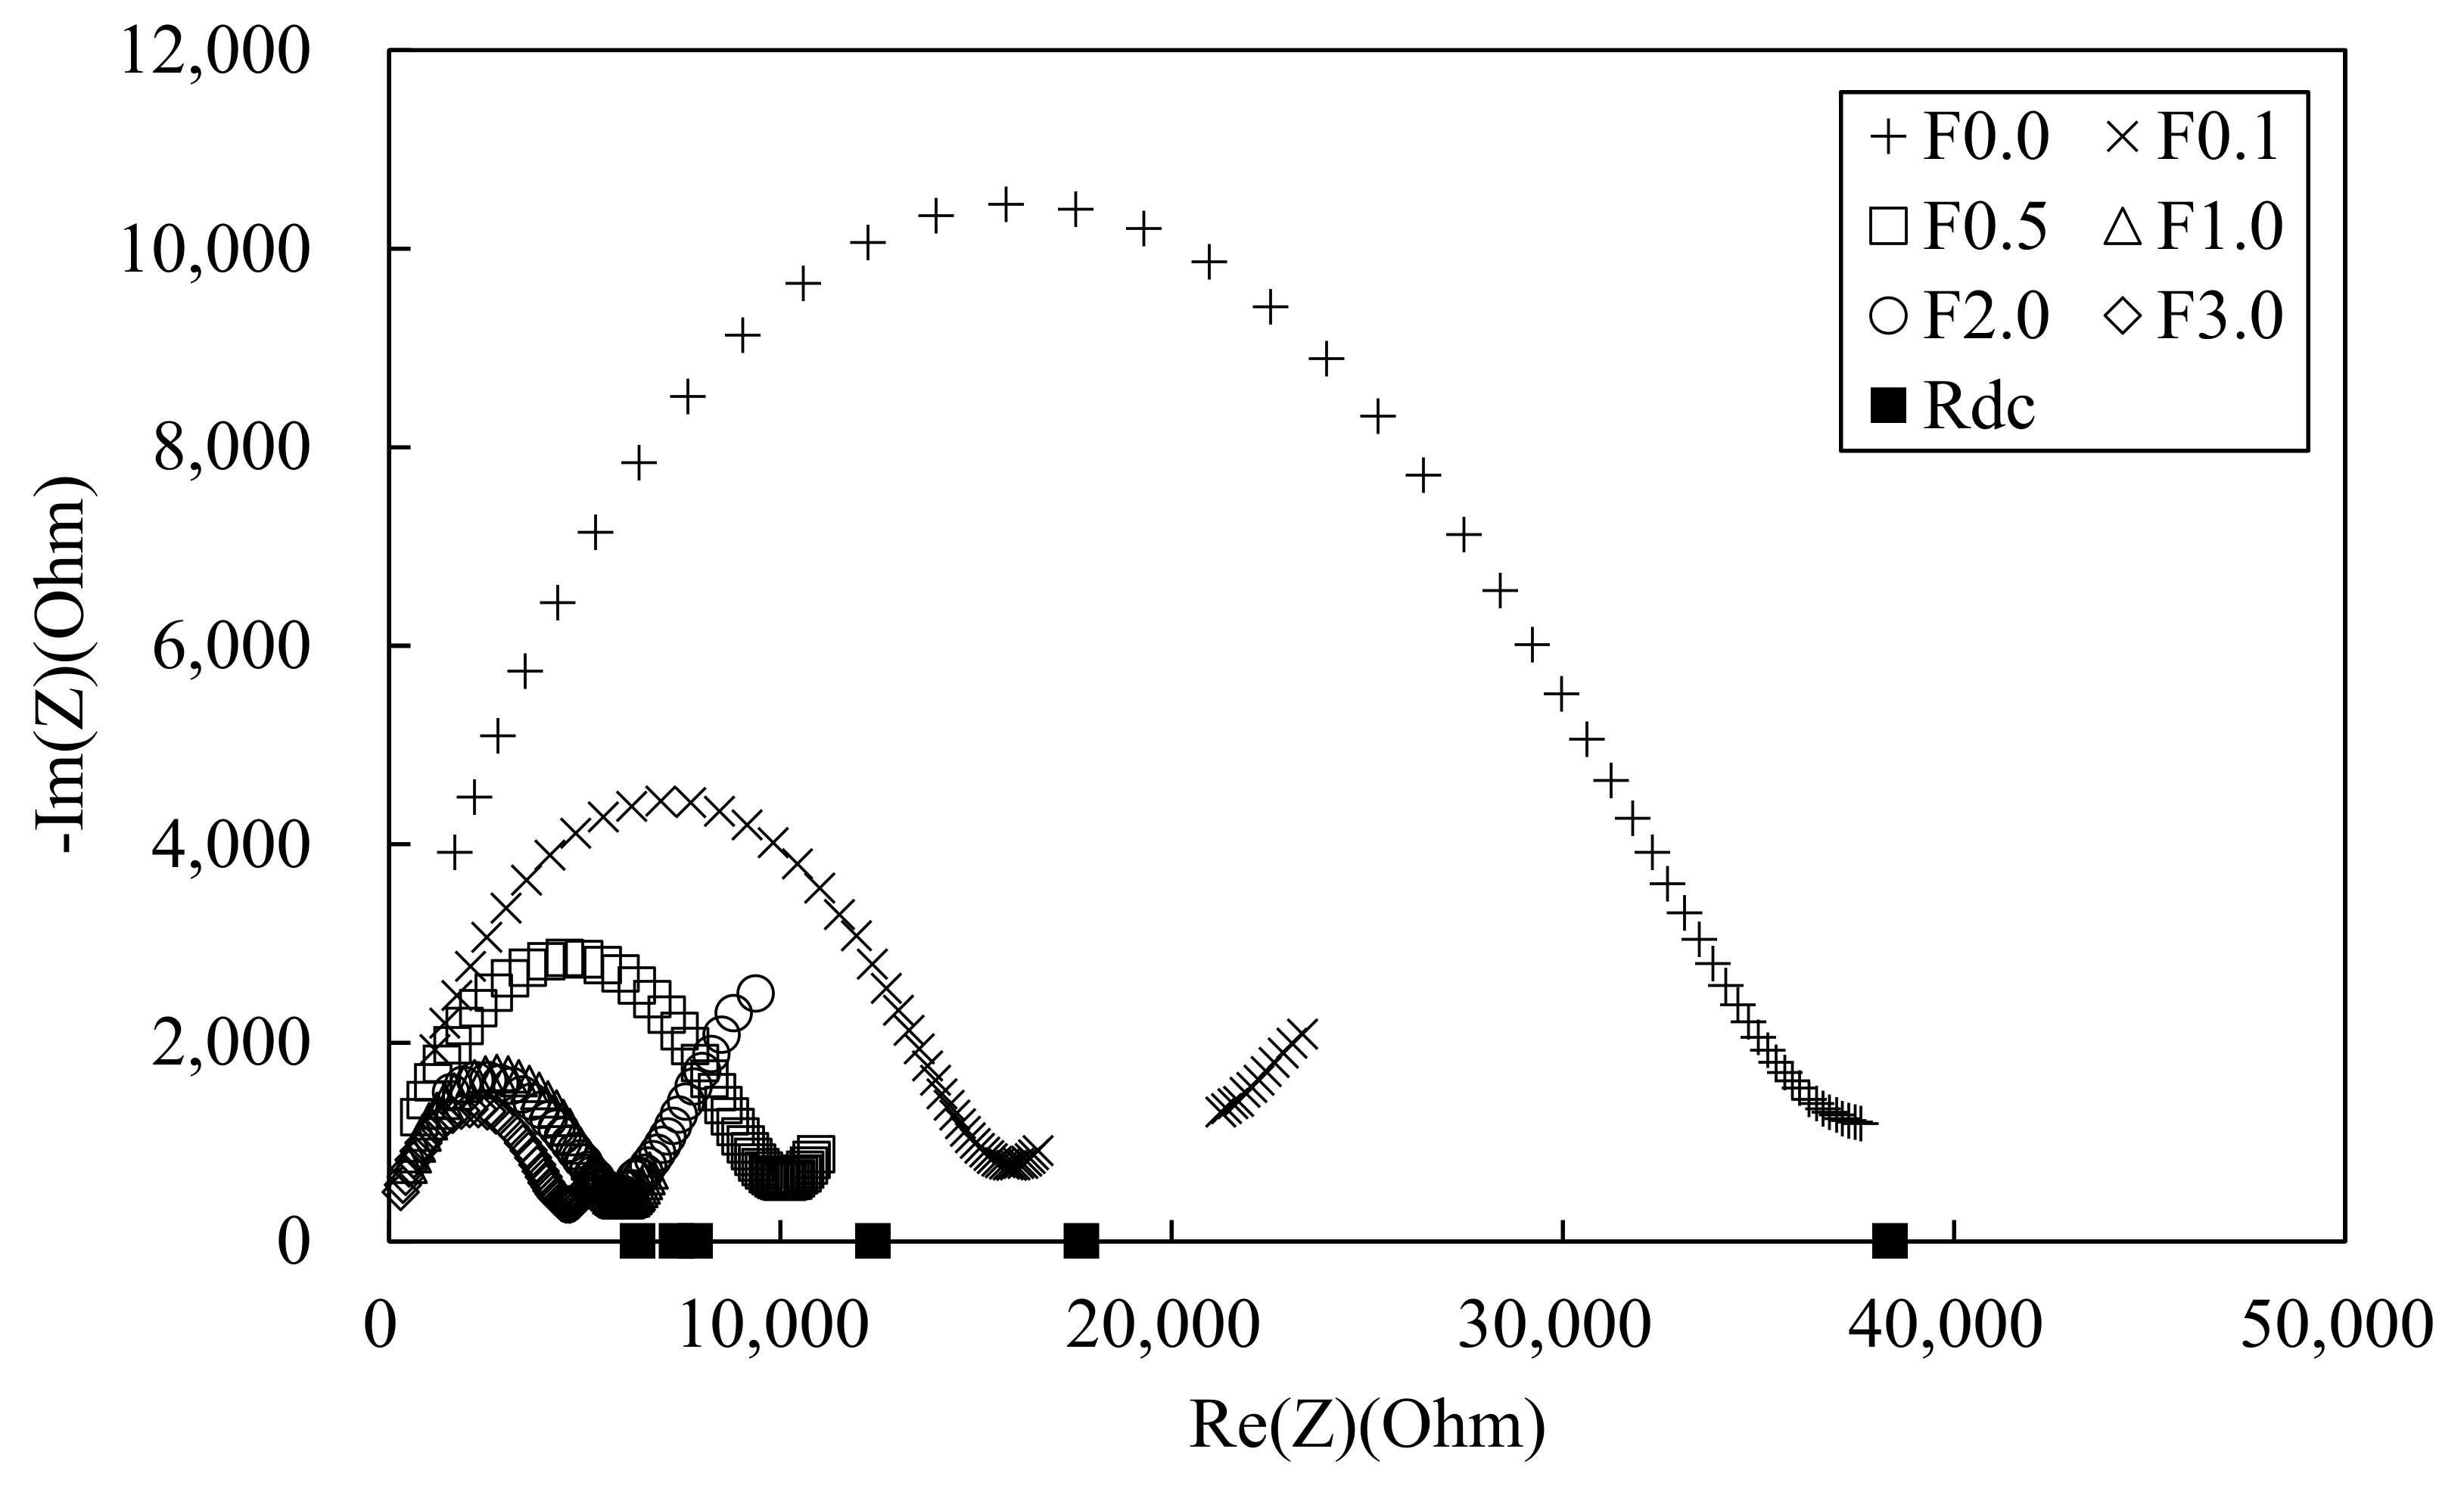
3.1. AC Impedance Spectrum Response
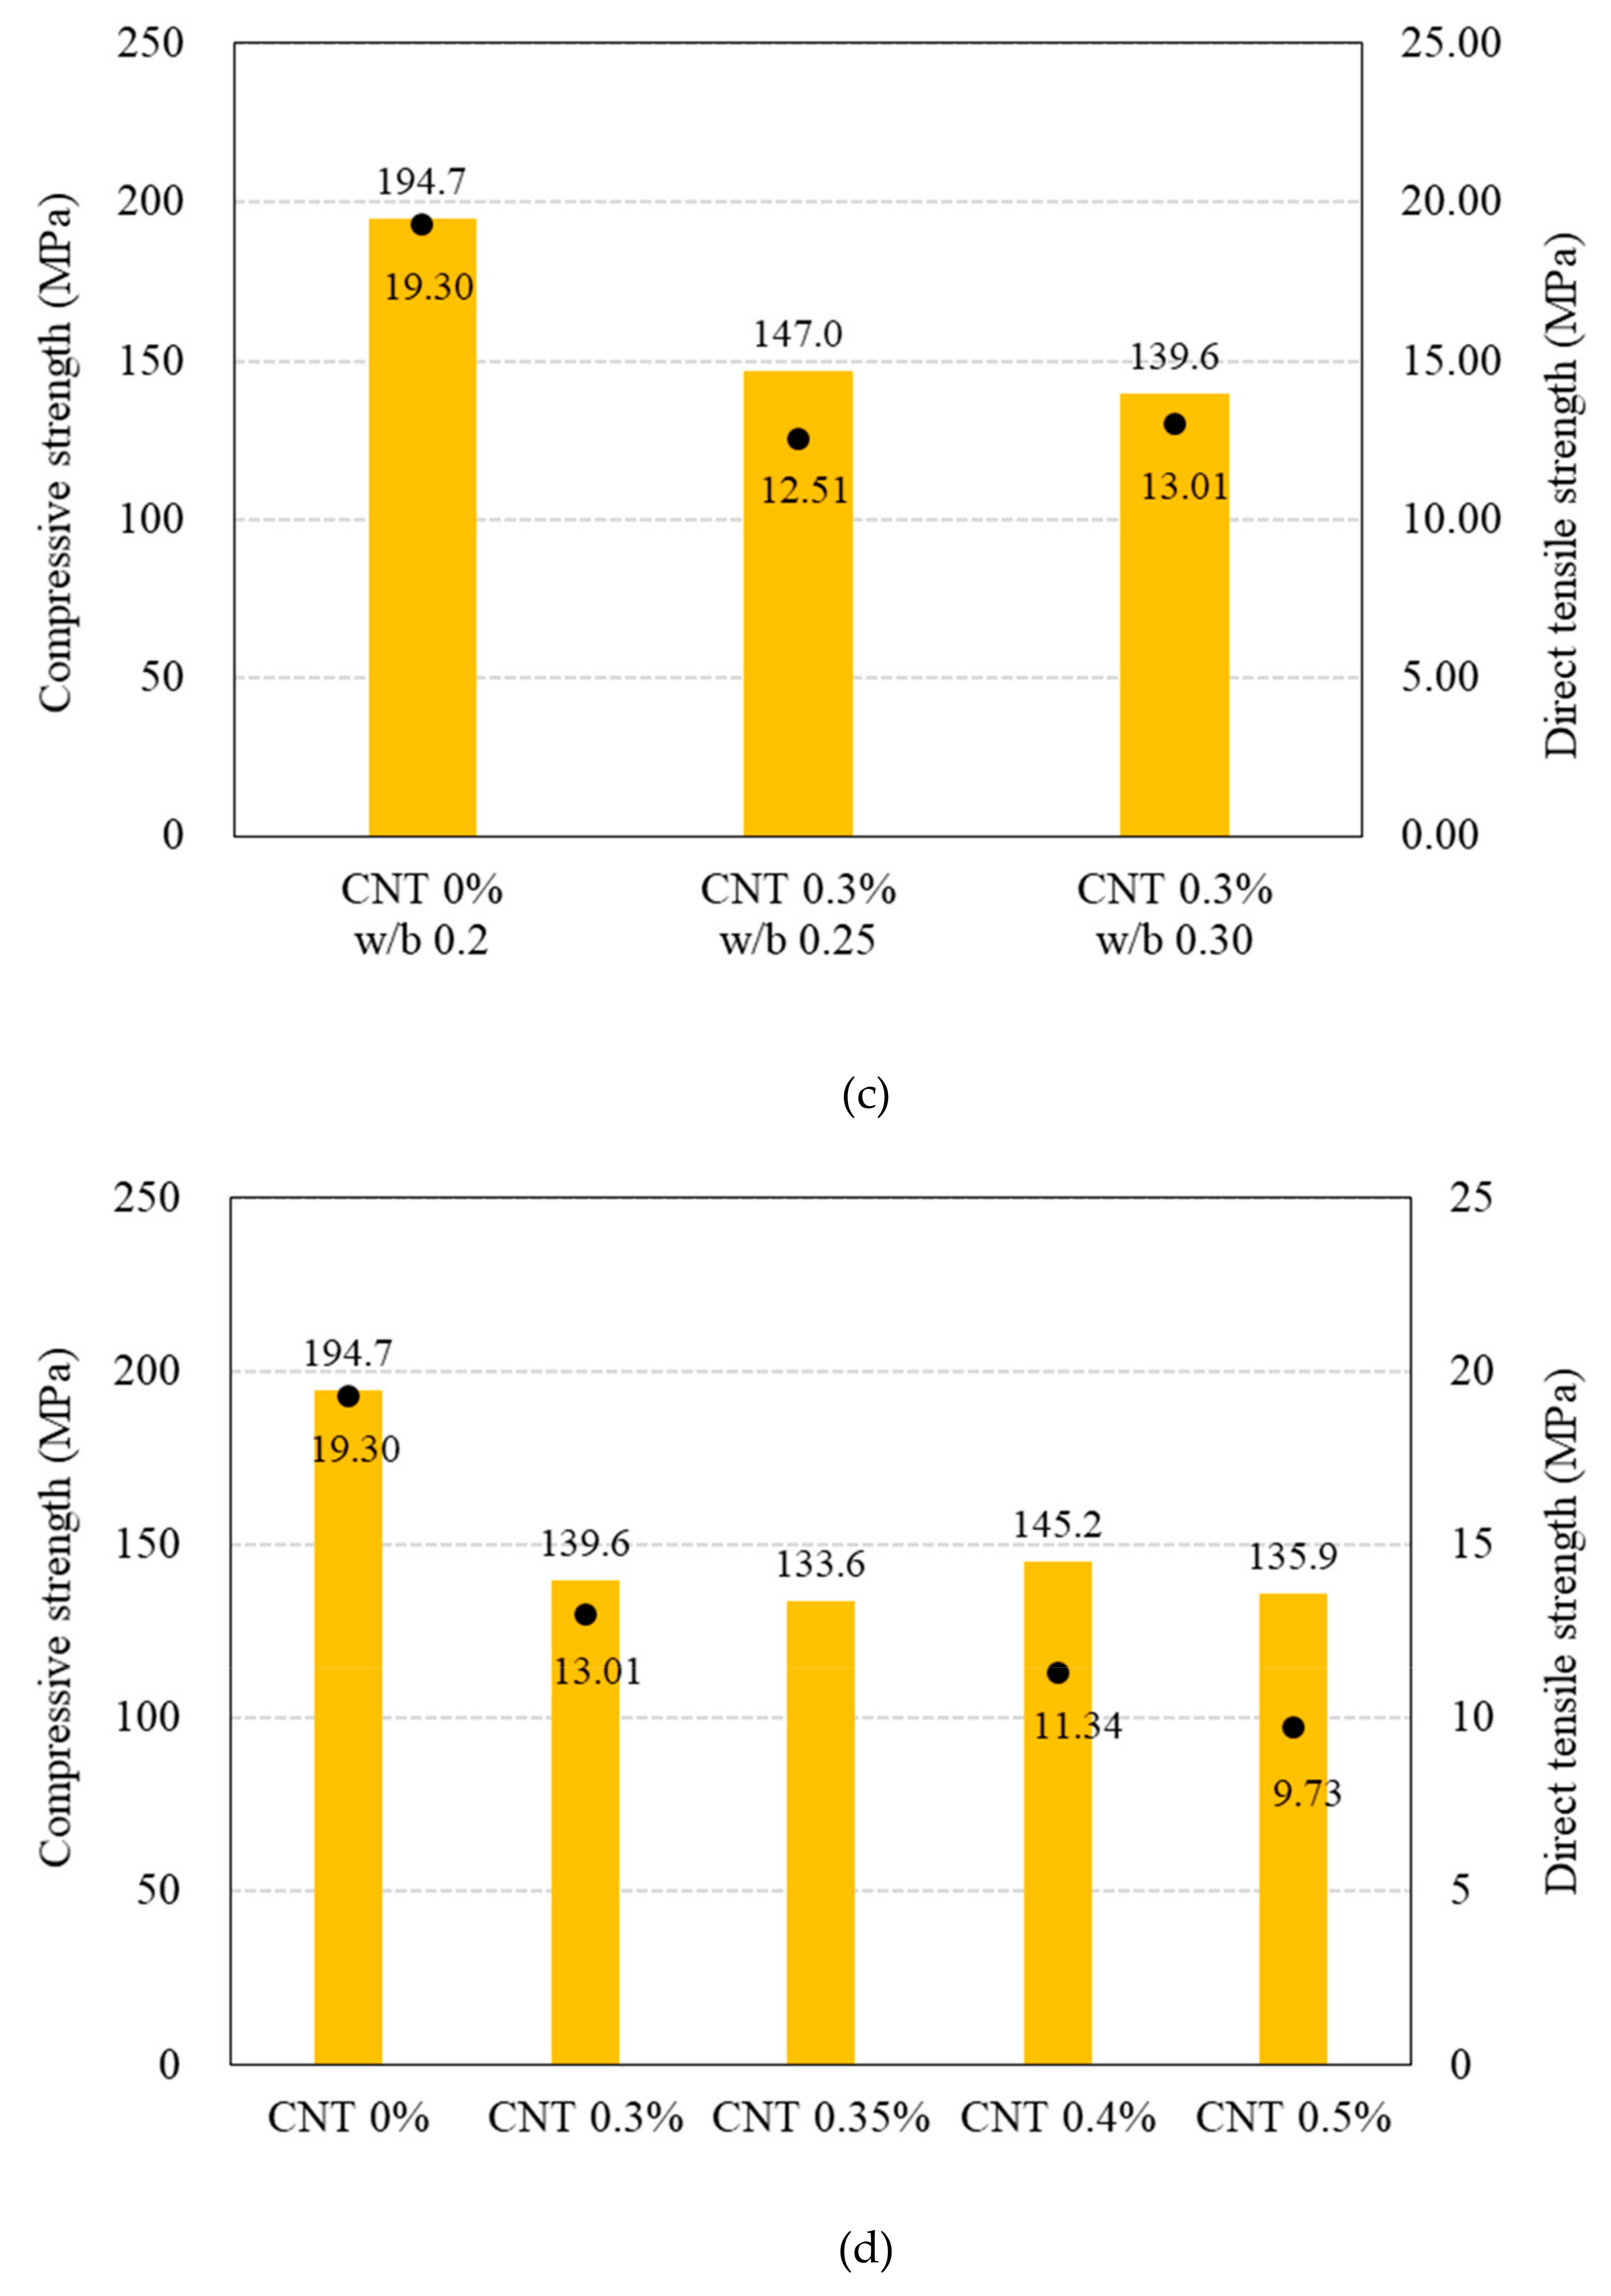
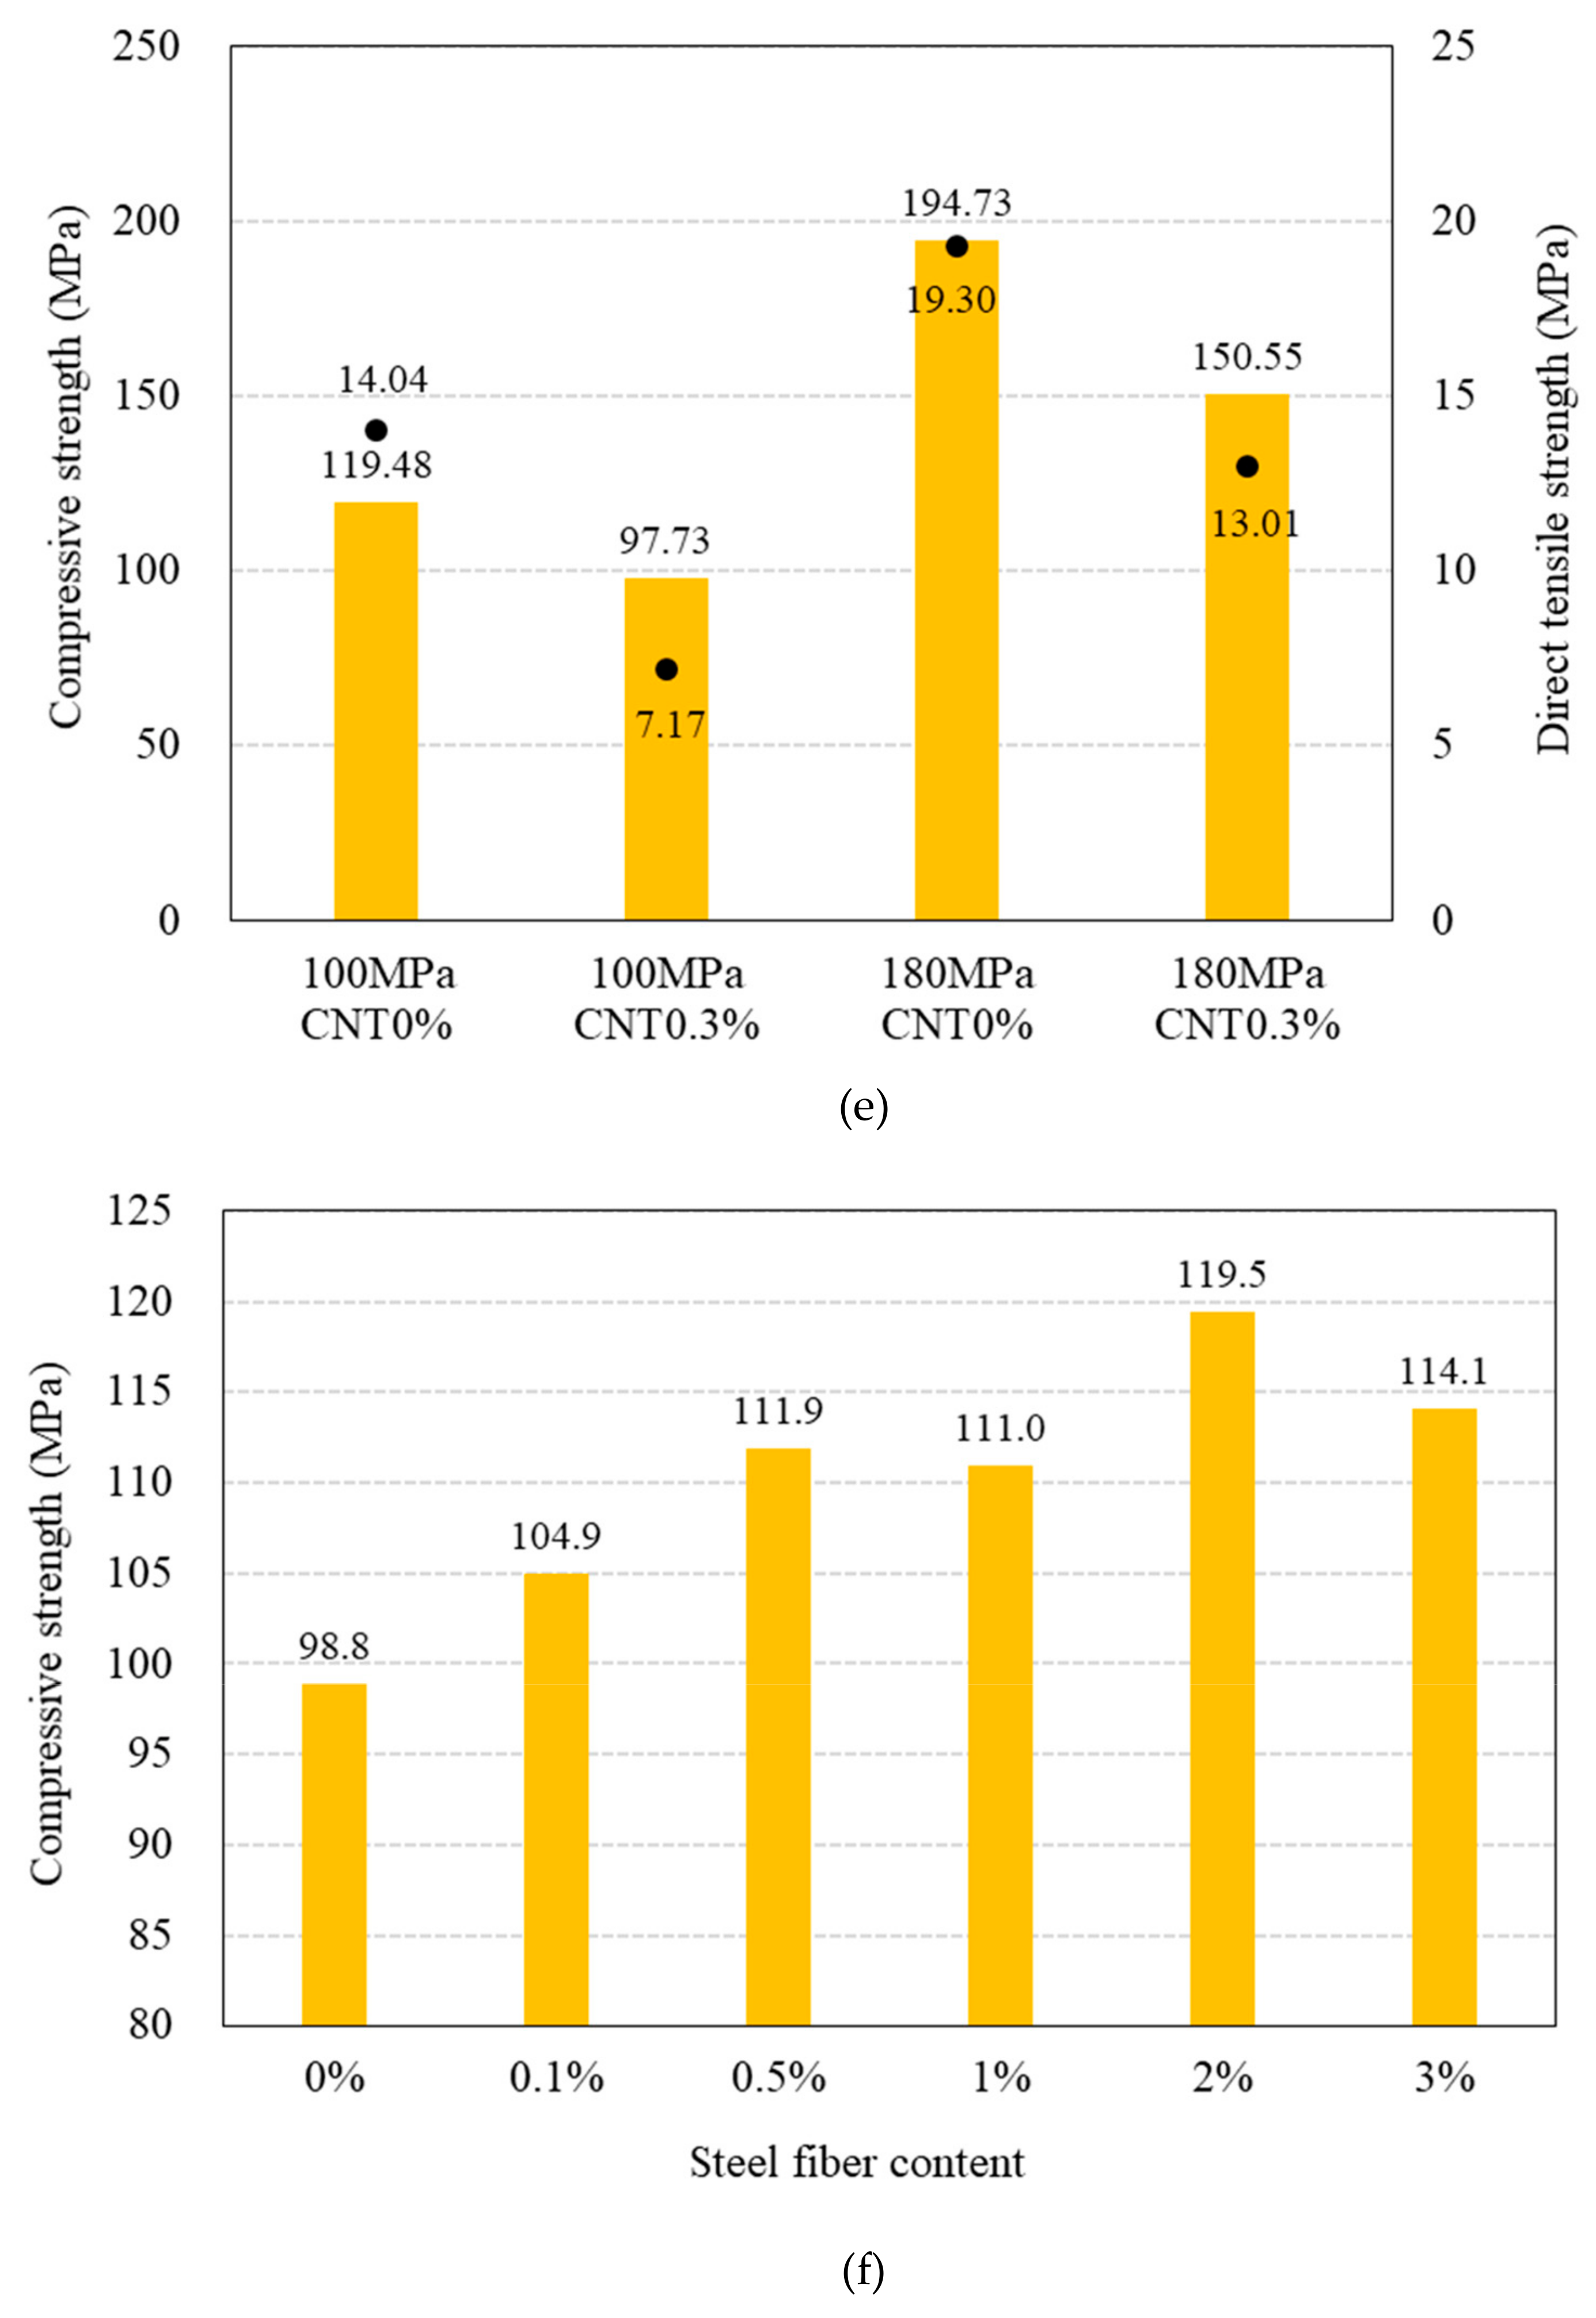
3.2. Compressive Strength and Flowability
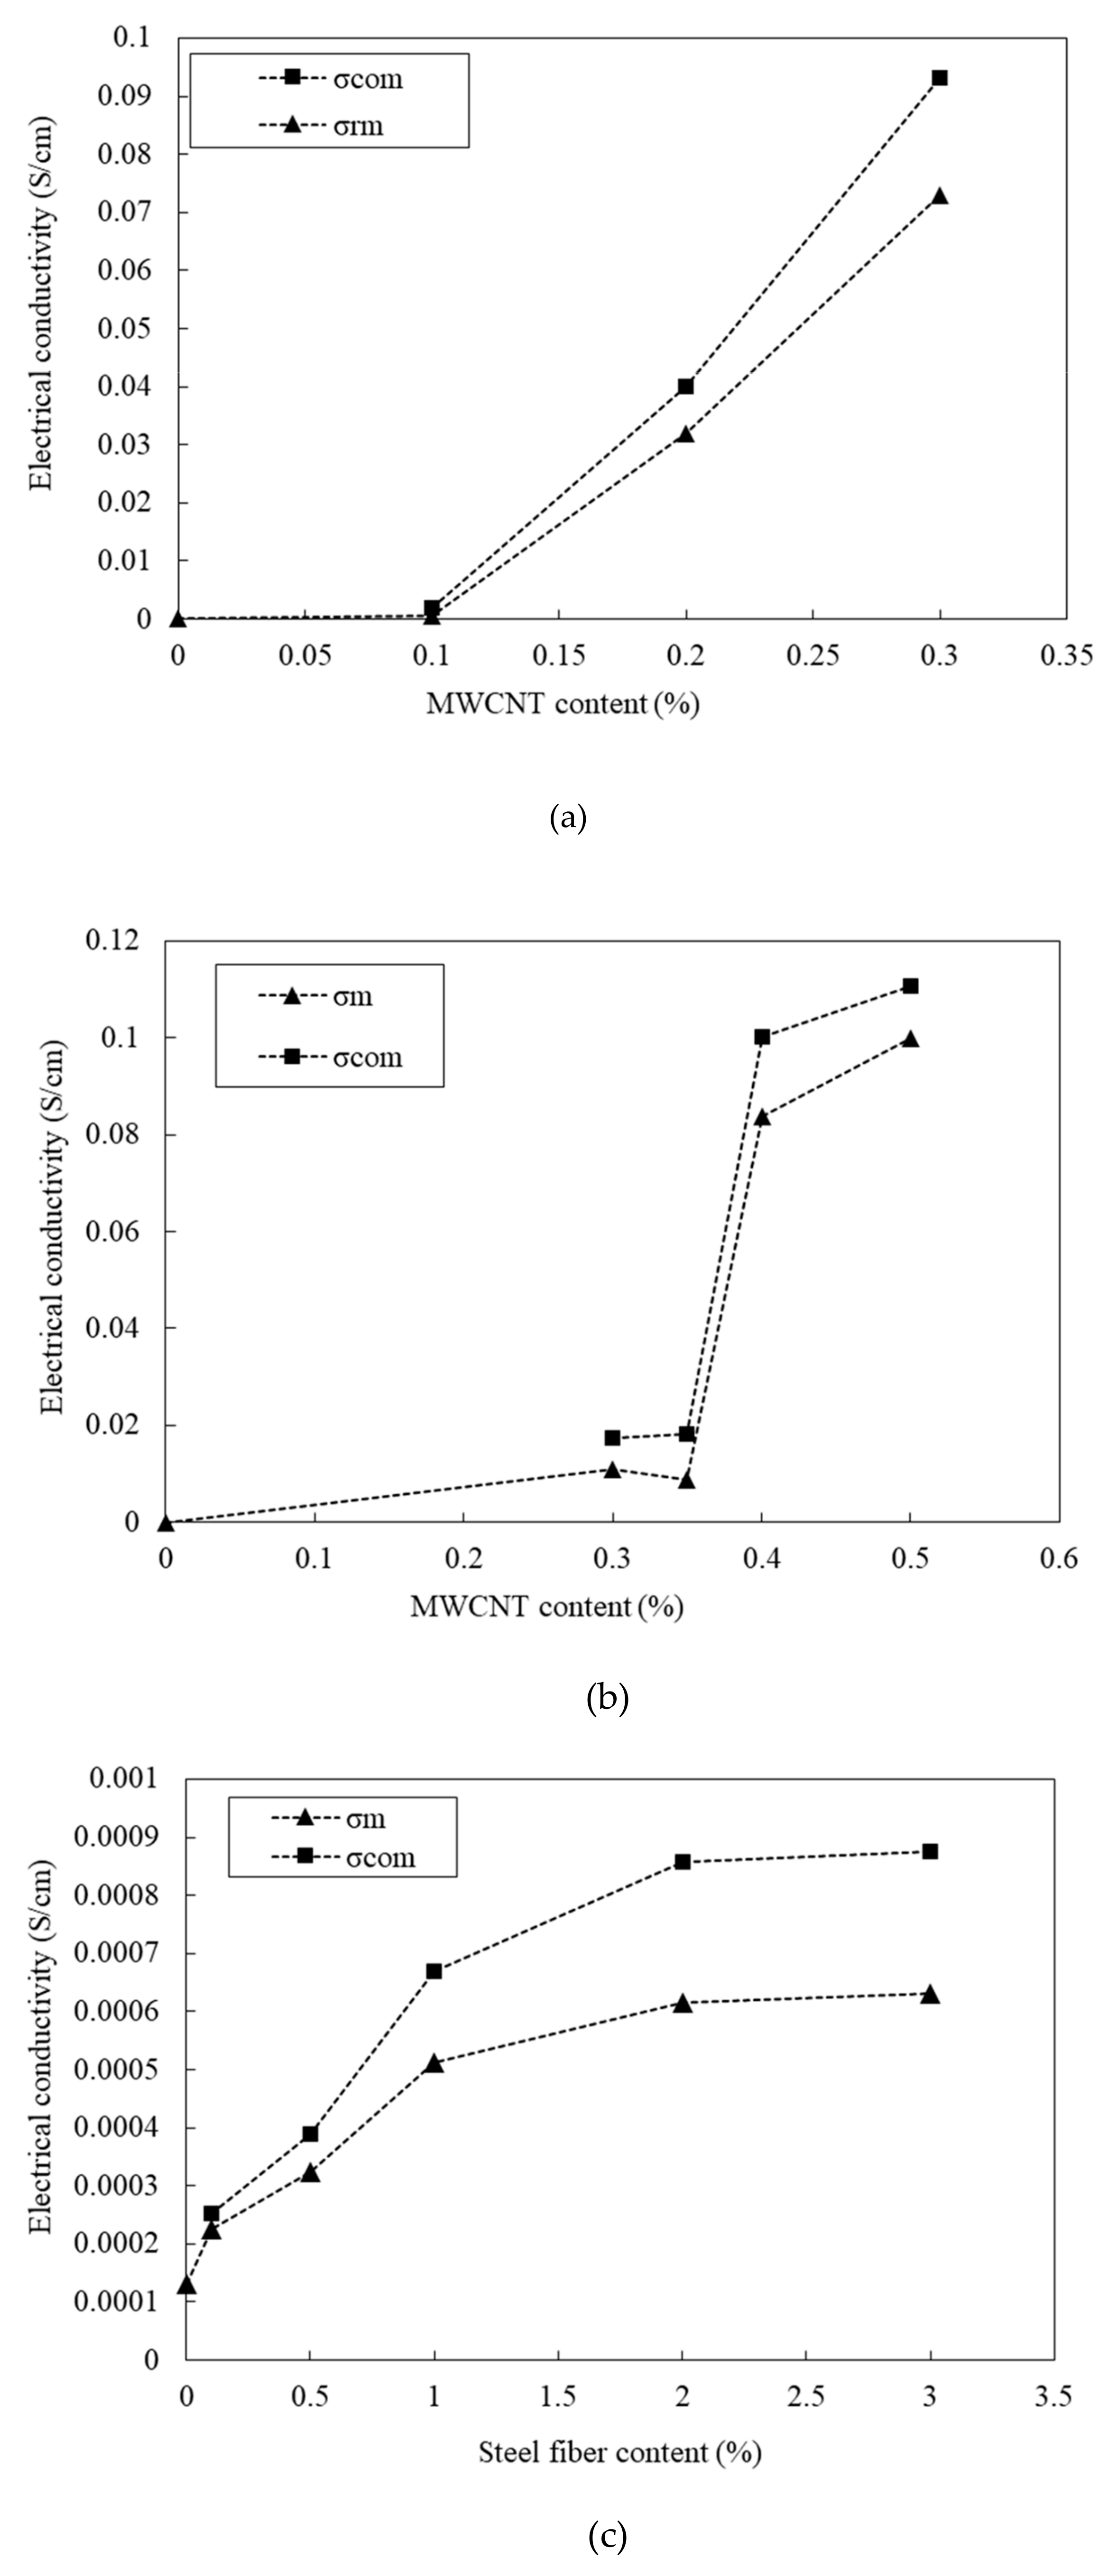
3.3. Electrical Conductivity and Percolation Path/Threshold
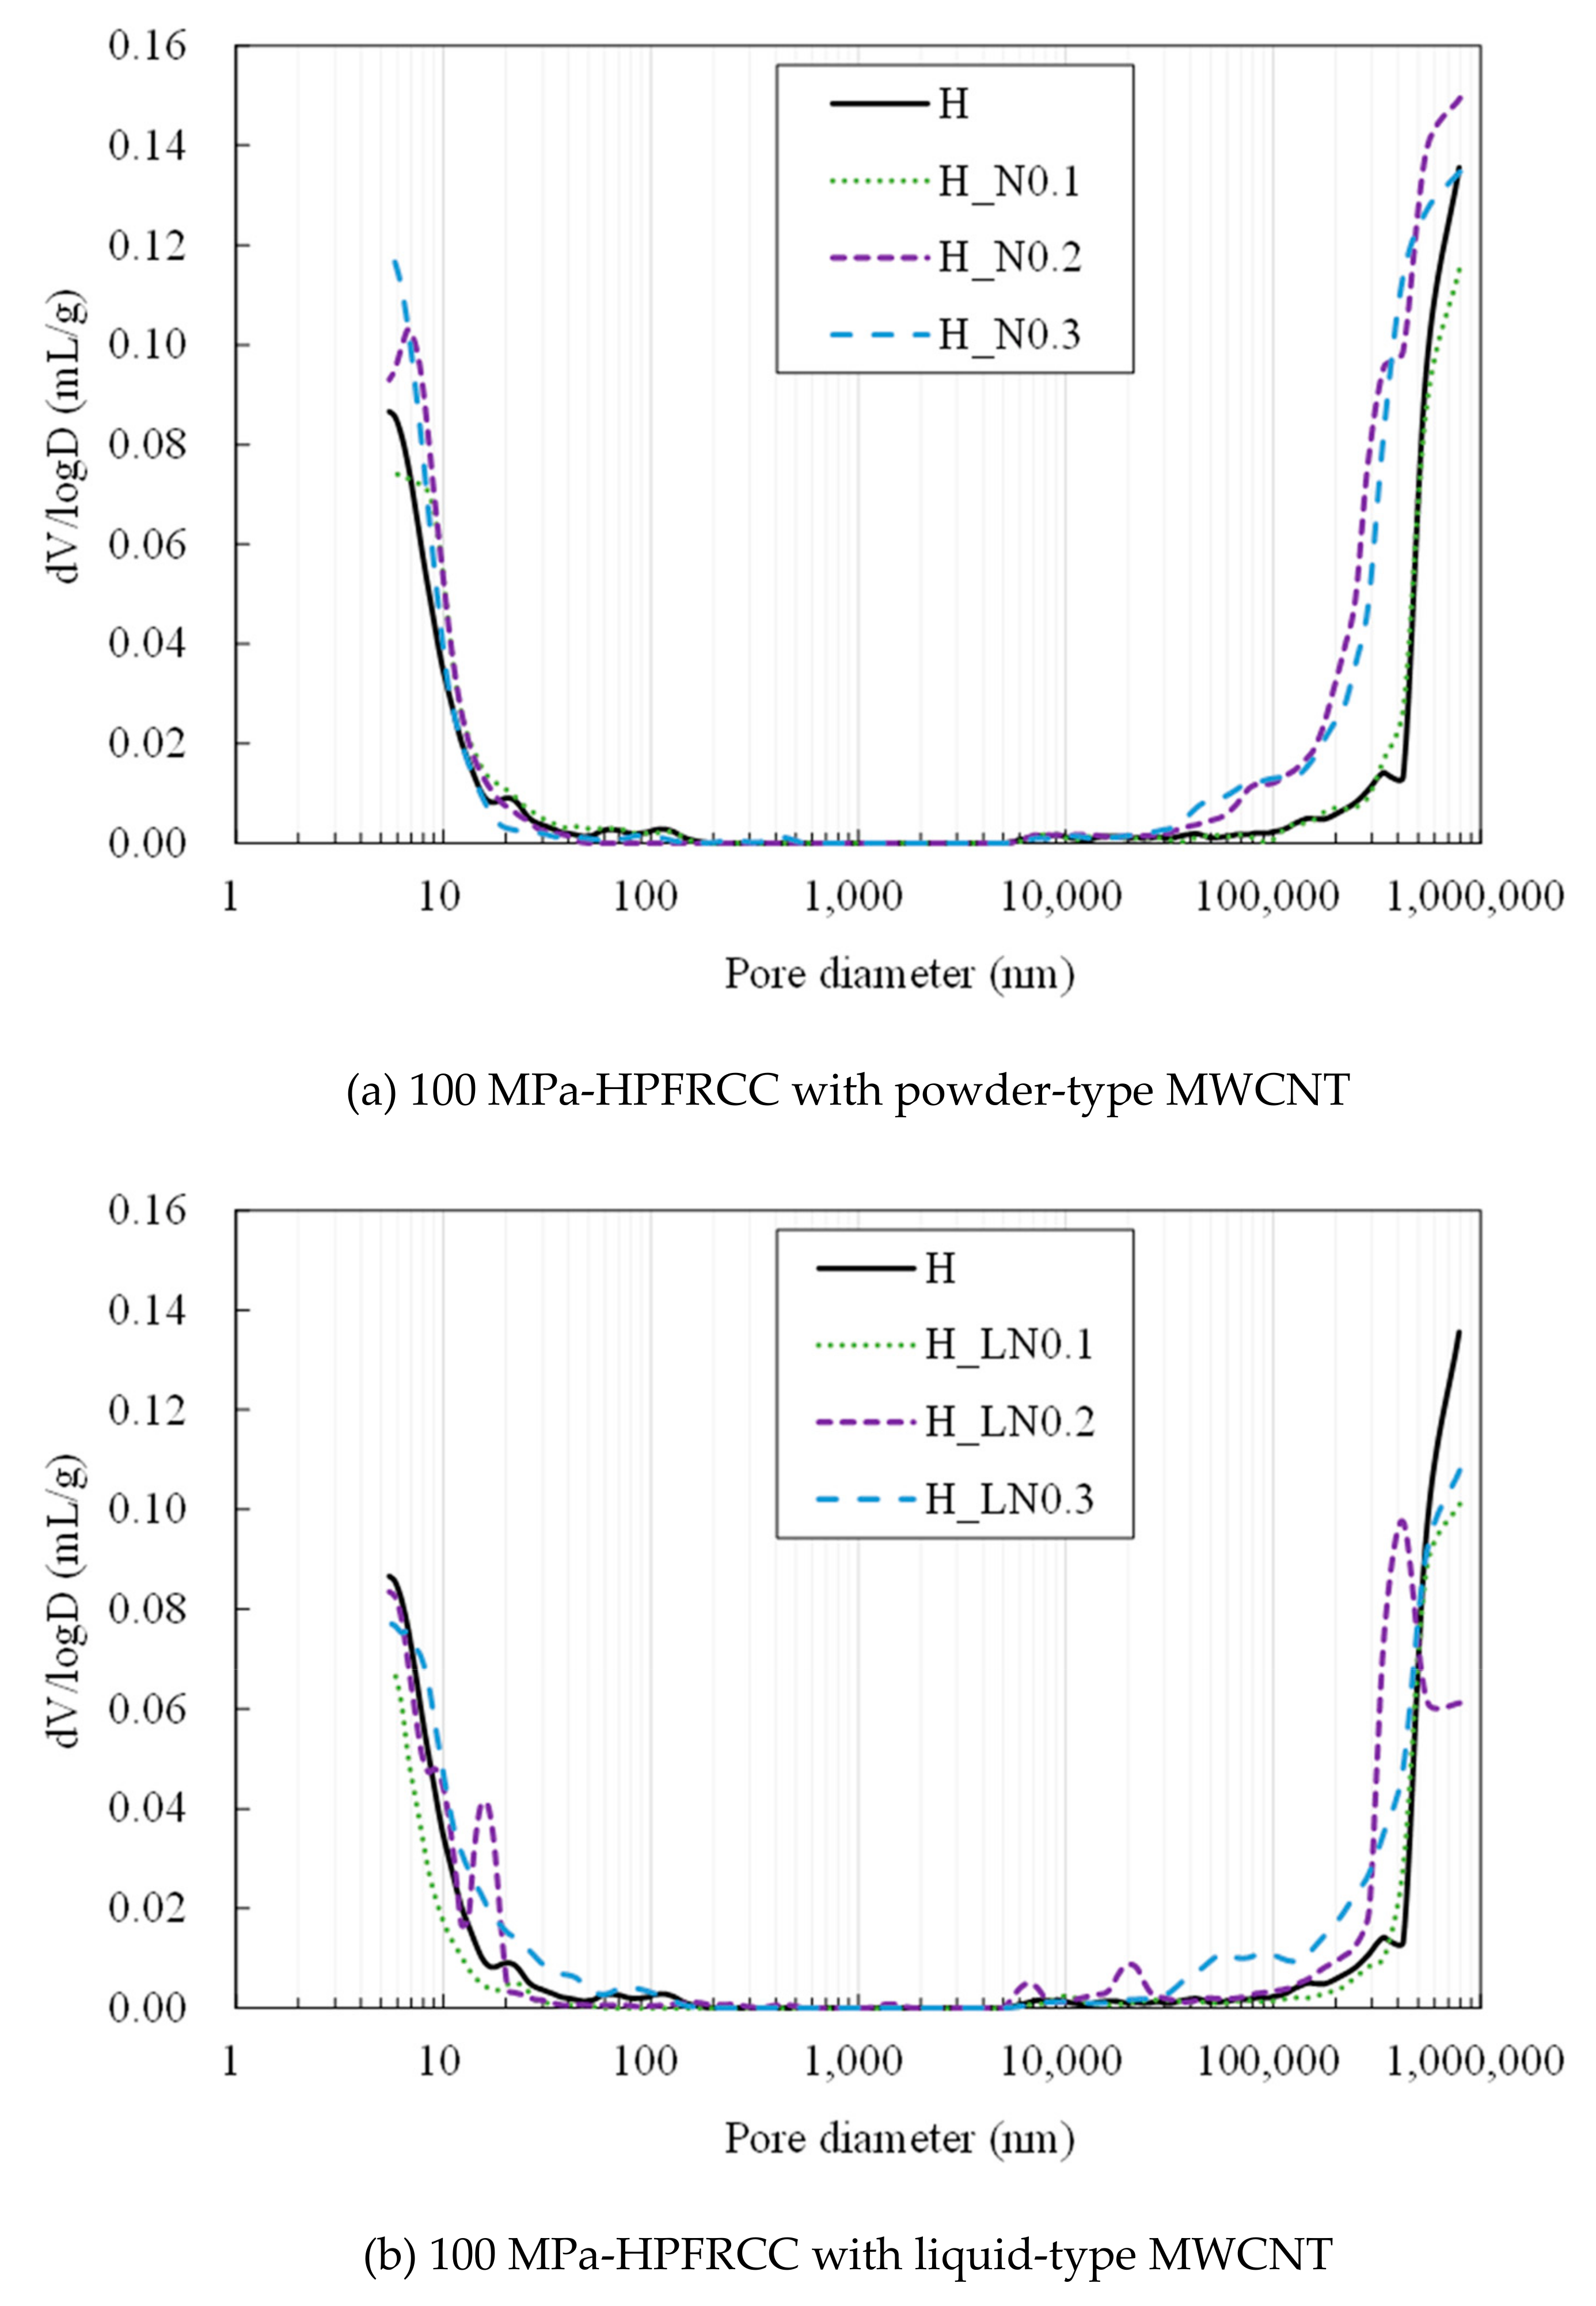
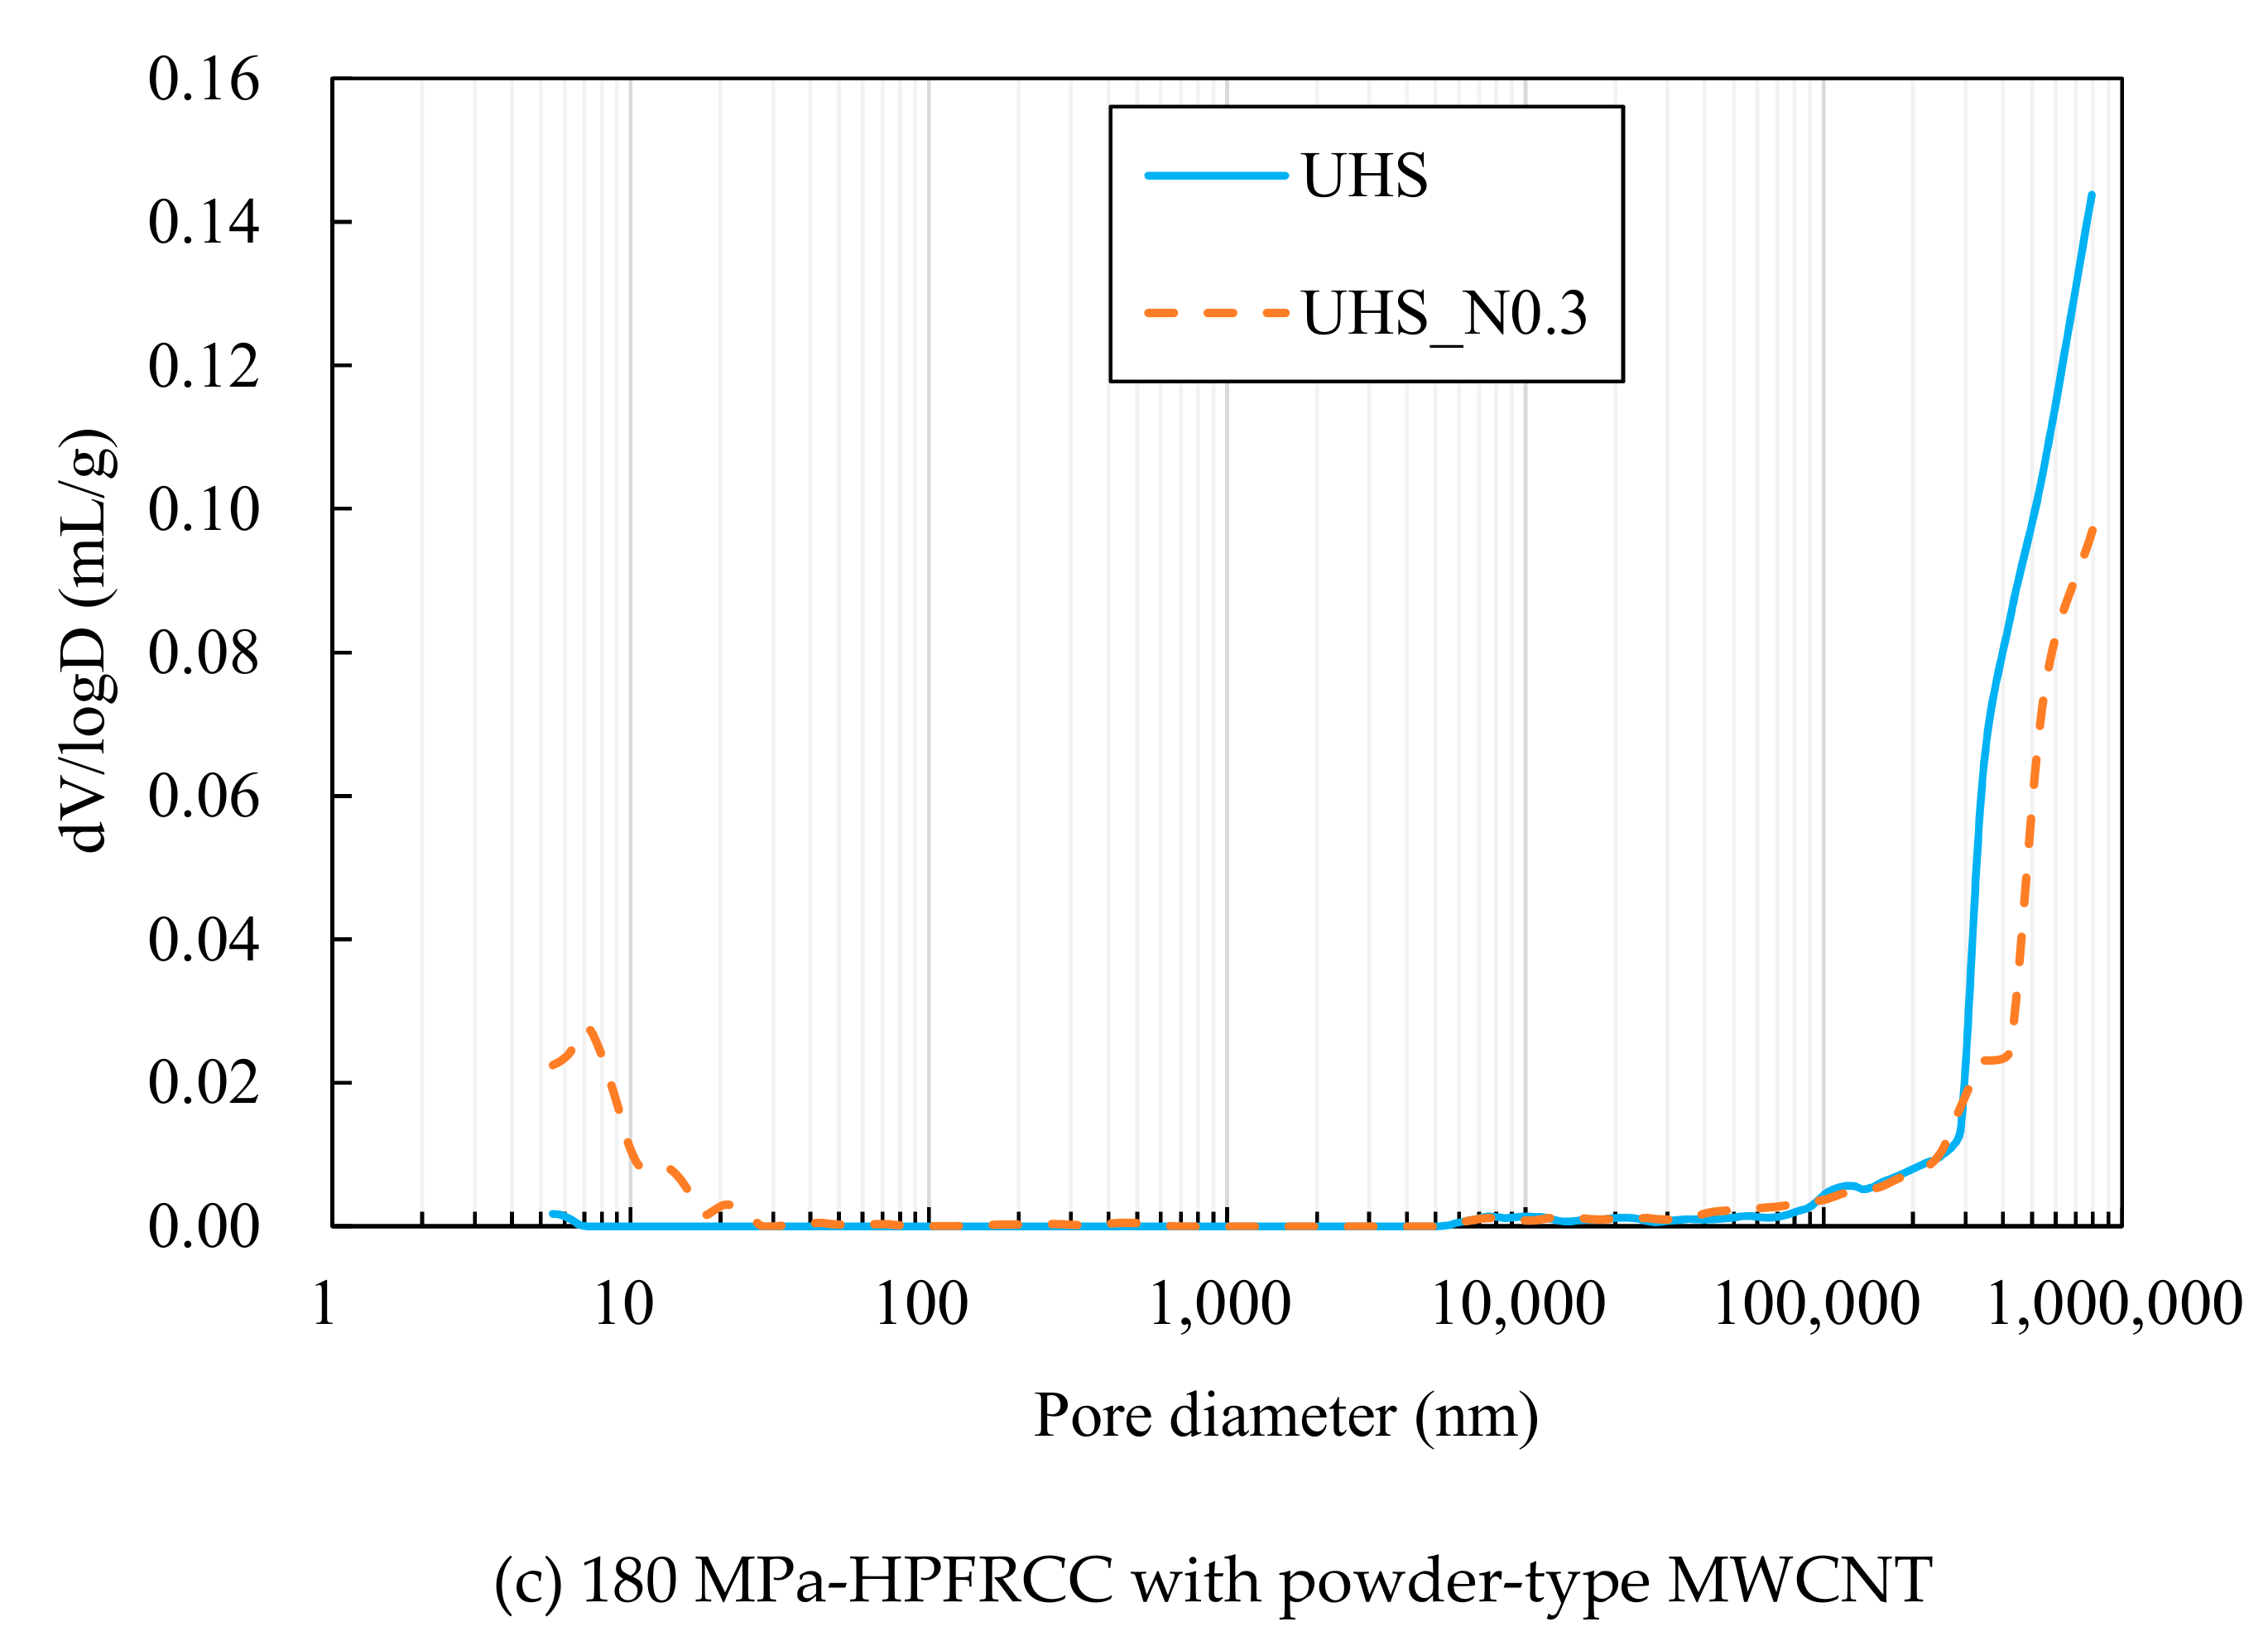
3.4. Mercury Intrusion Porosimetry (MIP)
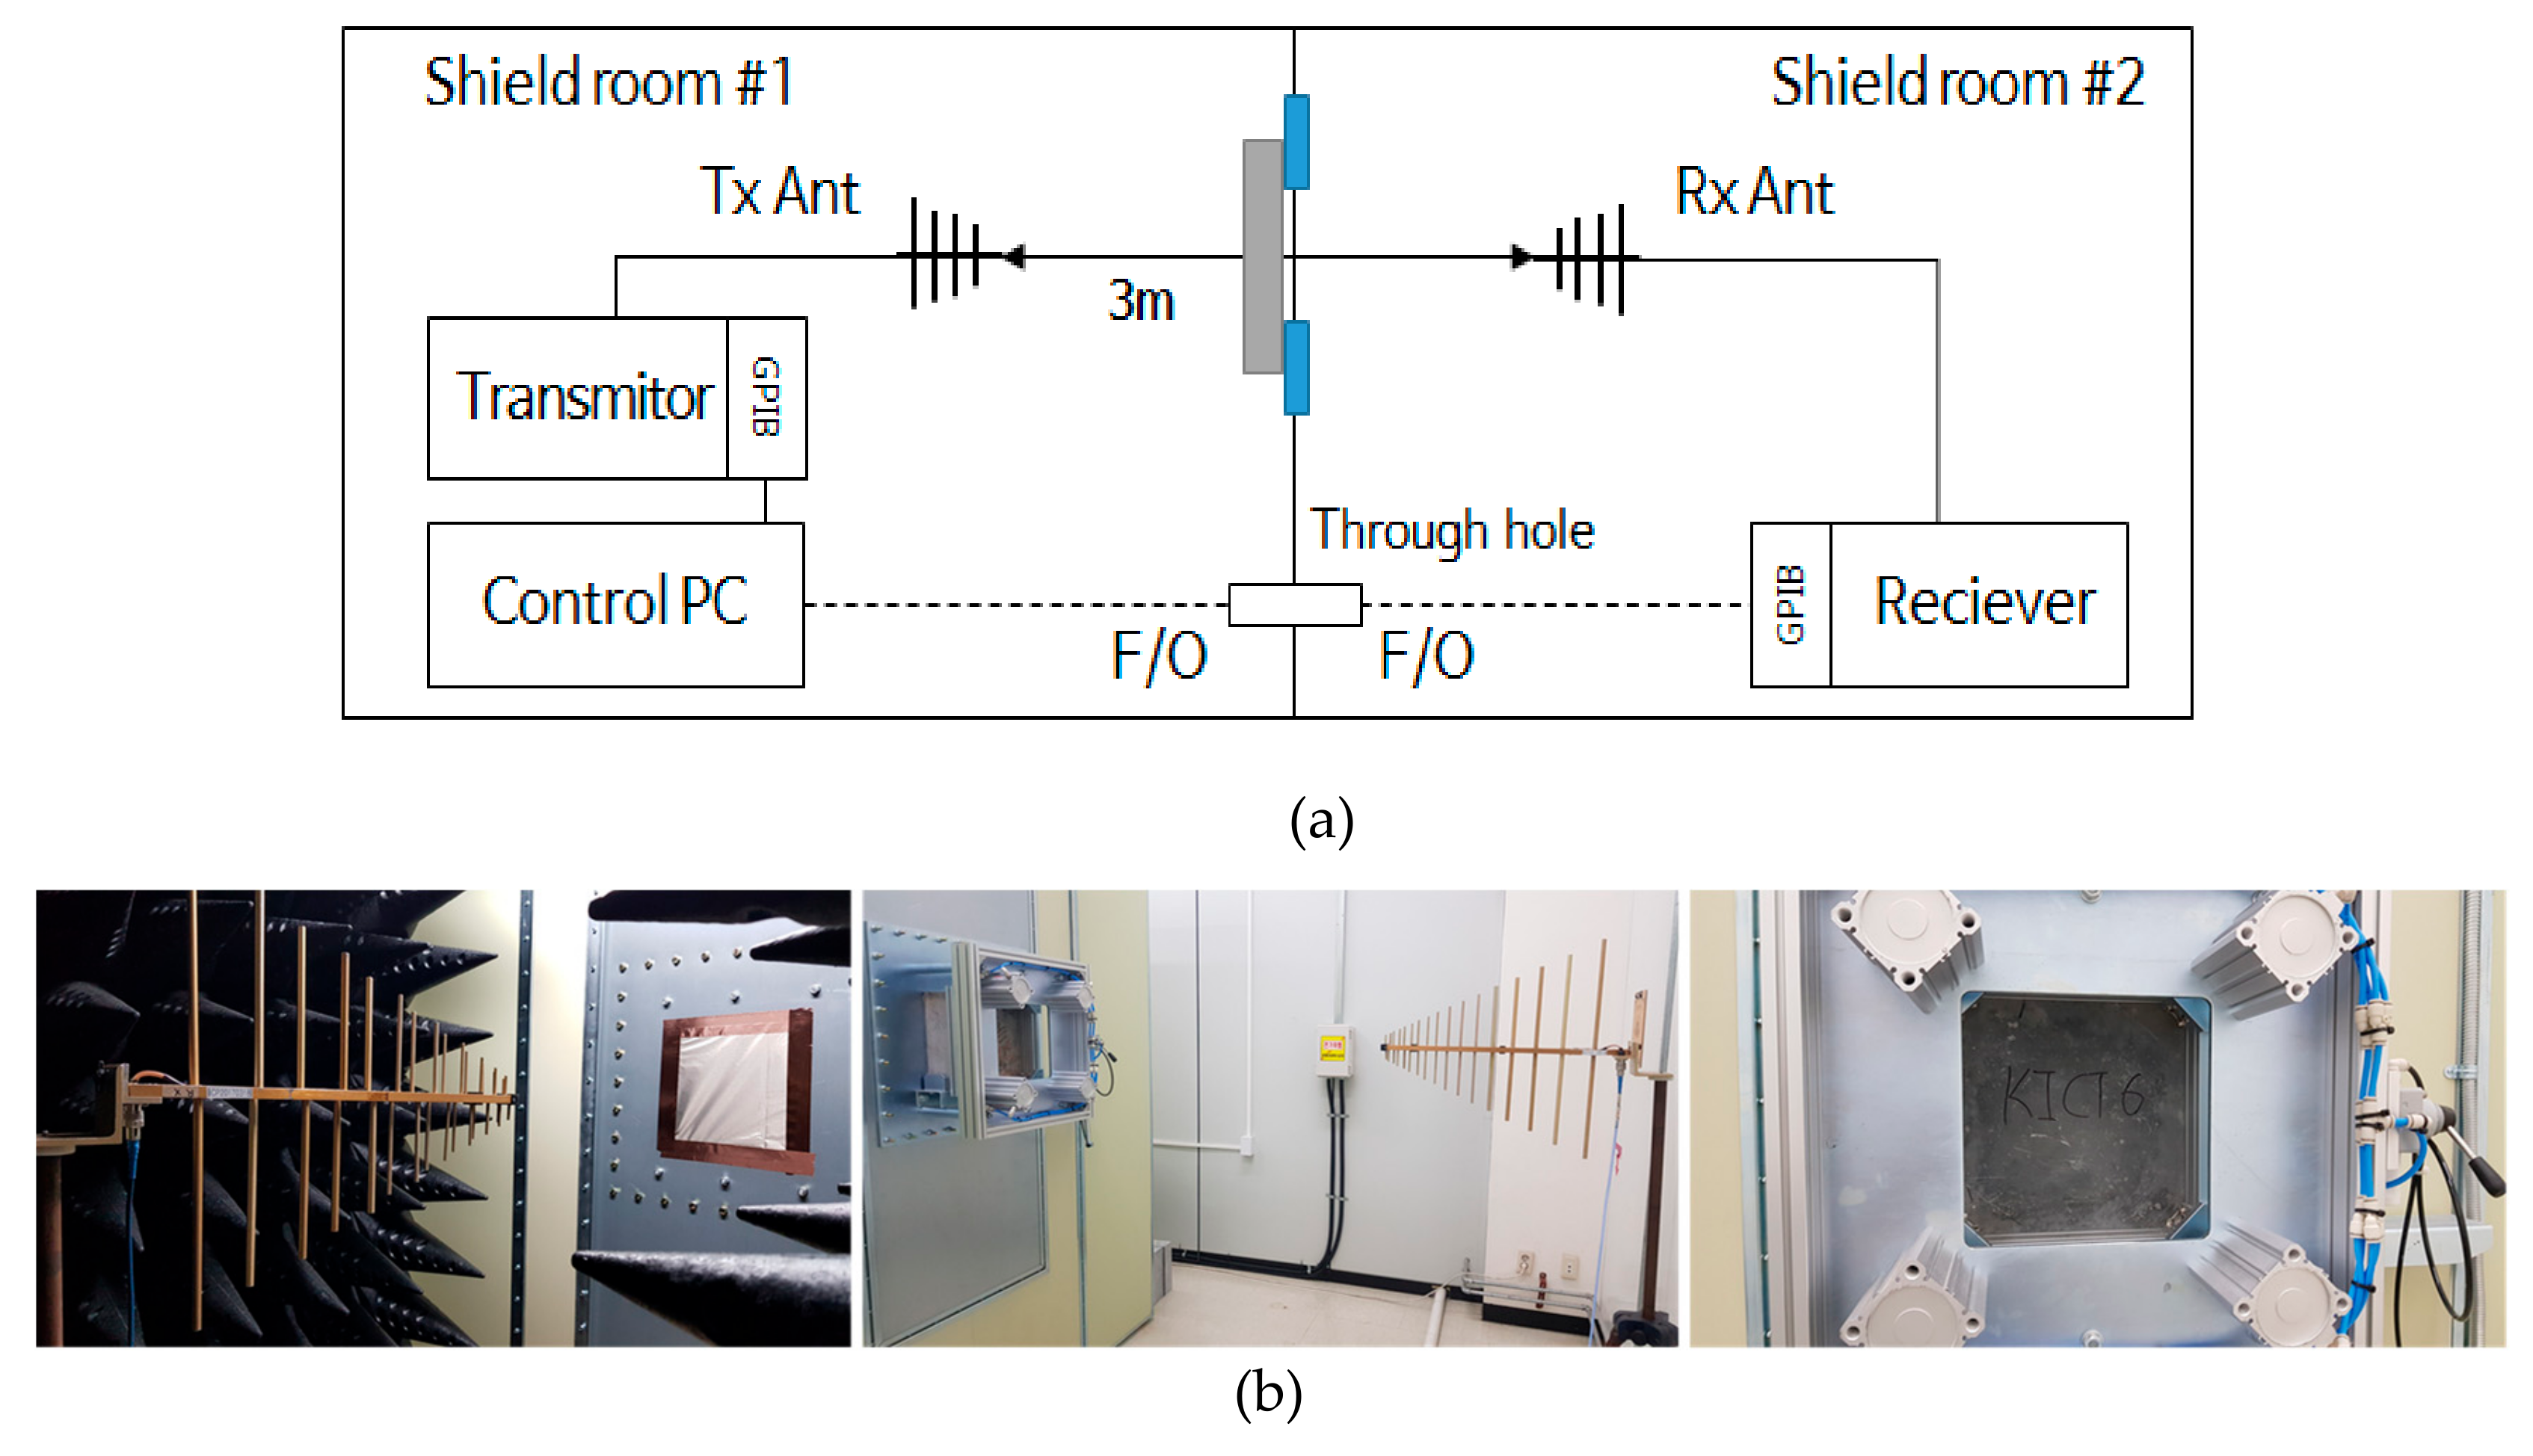
3.5. Electromagnetic Shielding Effectiveness
4. Concluding Remarks
- The electrical conductivity of the 100 MPa HPFRCC with 0.30% MWCNT was 0.093 S/cm and that of the 180 MPa HPFRCC with 0.4% MWCNT and 2.0% steel fiber was 0.10 S/cm. To achieve a high electrical conductivity, adding MWCNTs was more beneficial than adding steel fibers.
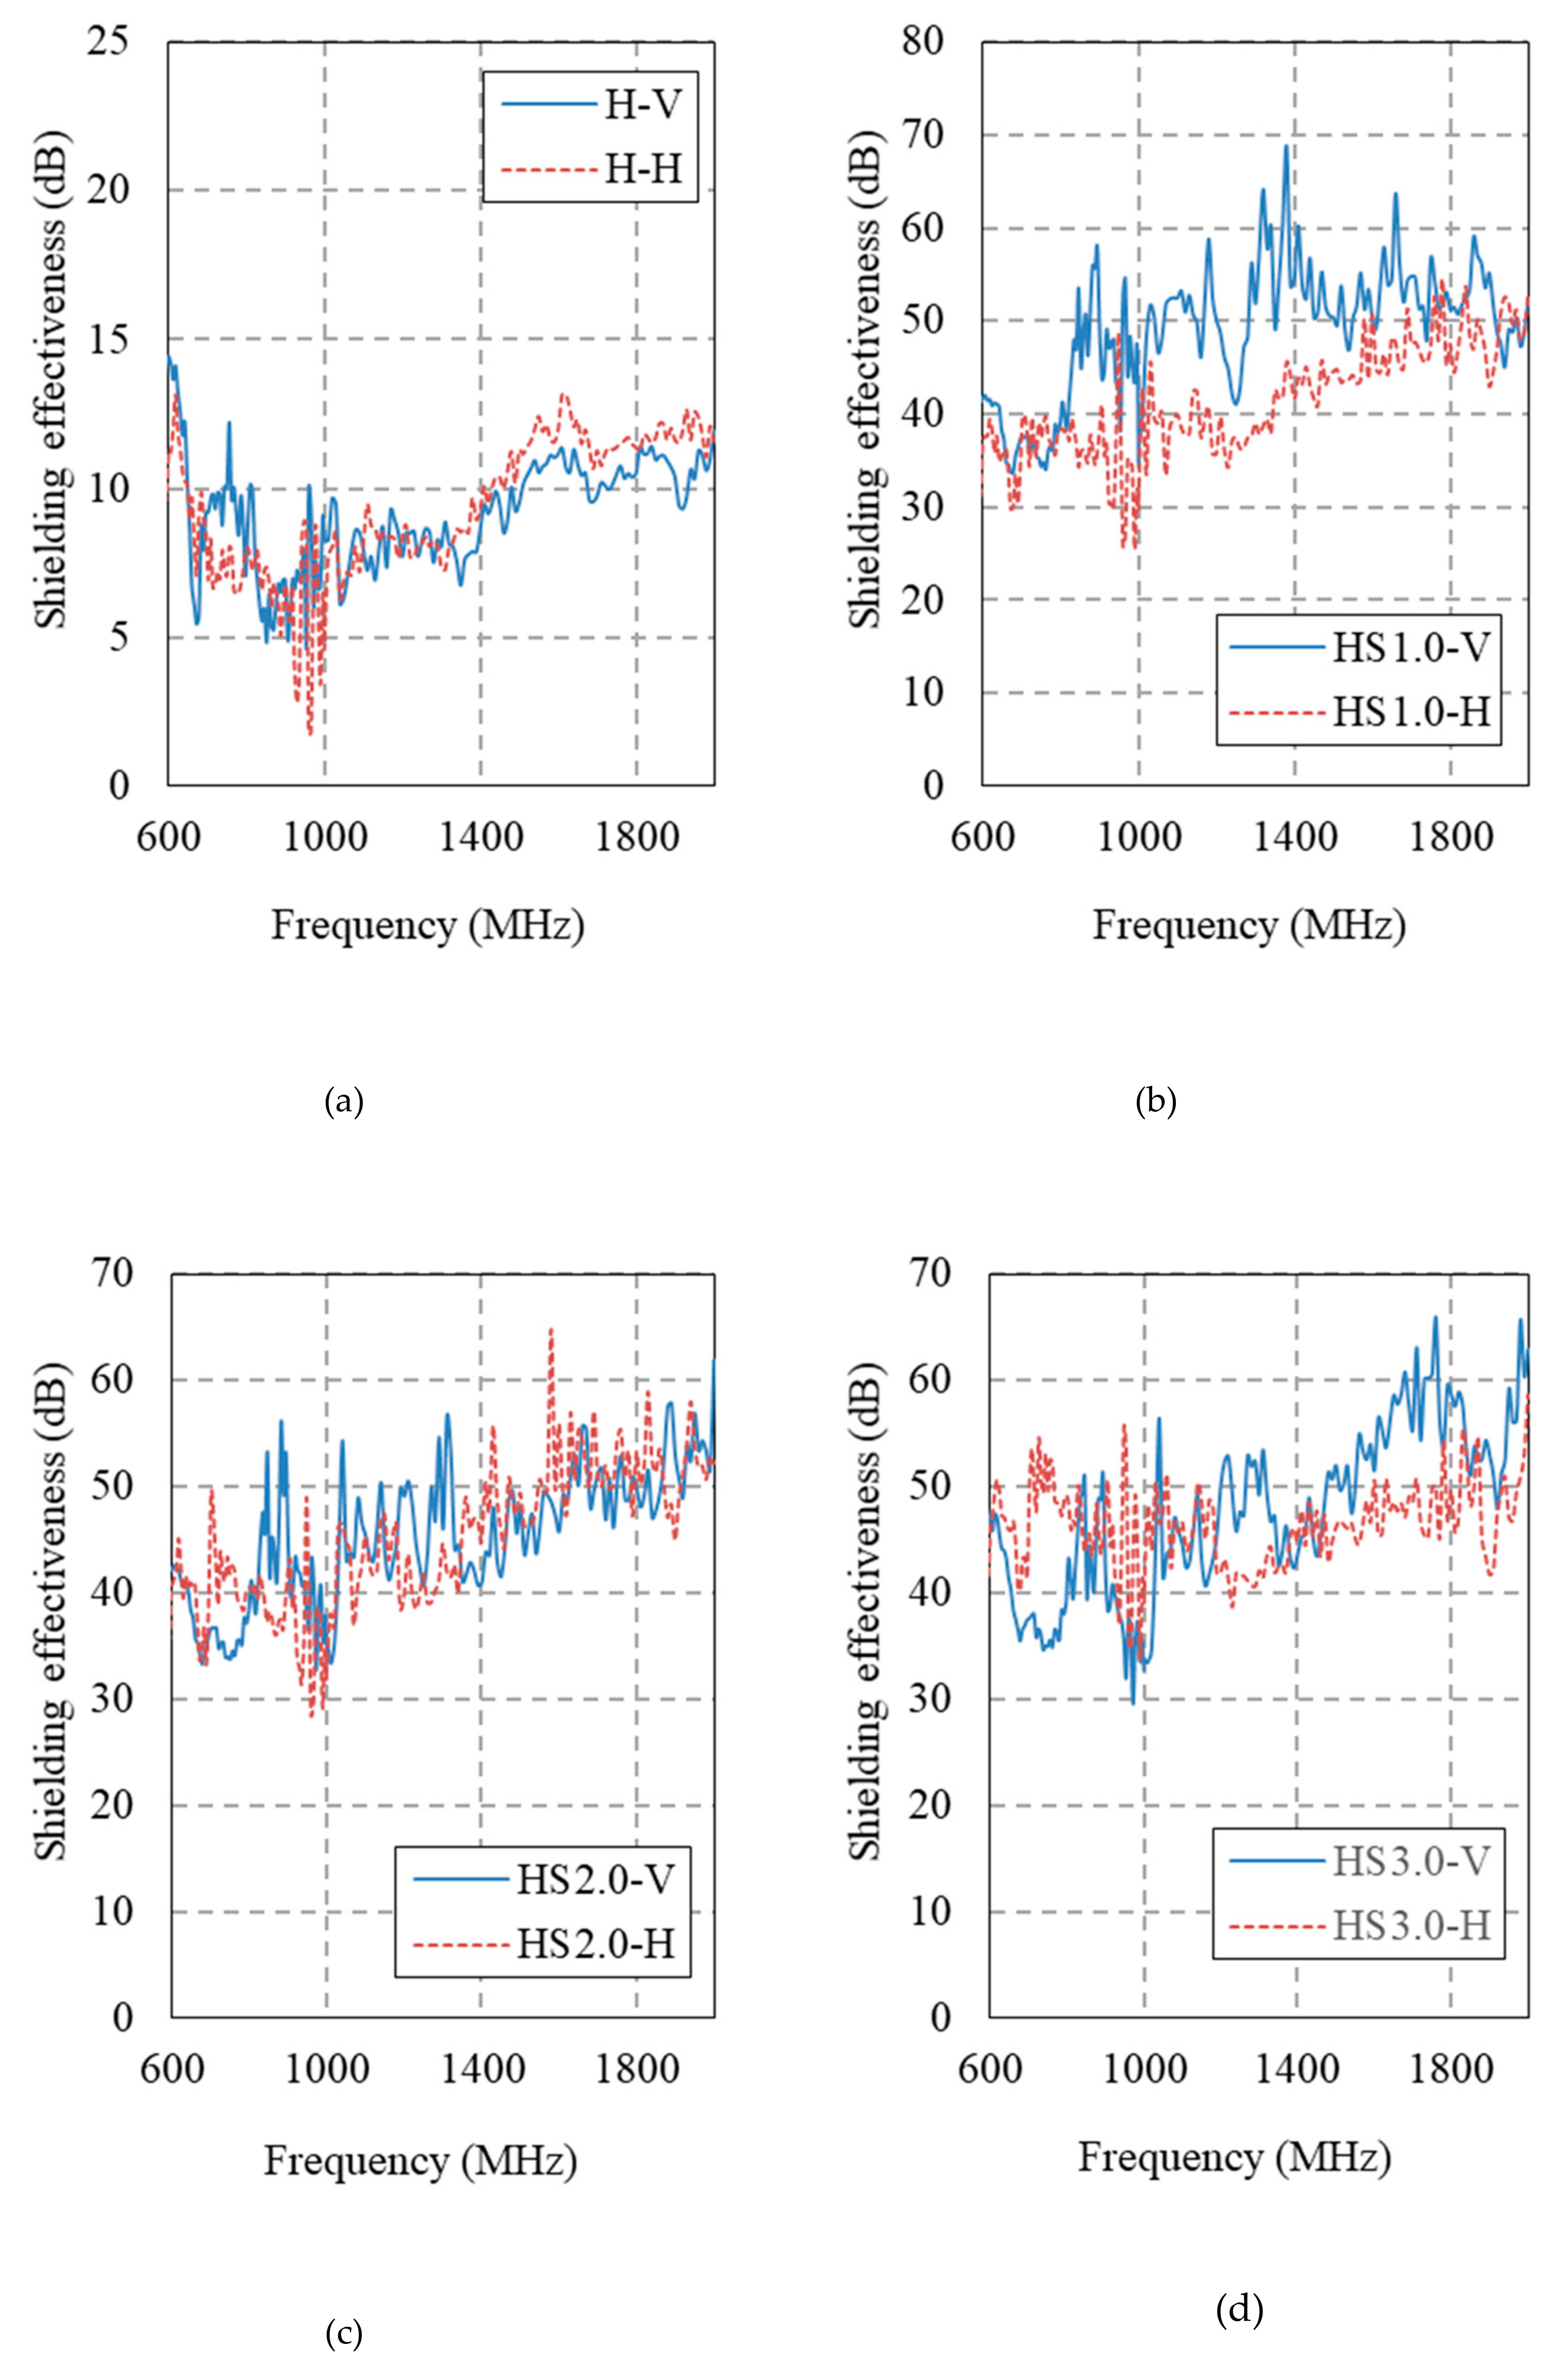
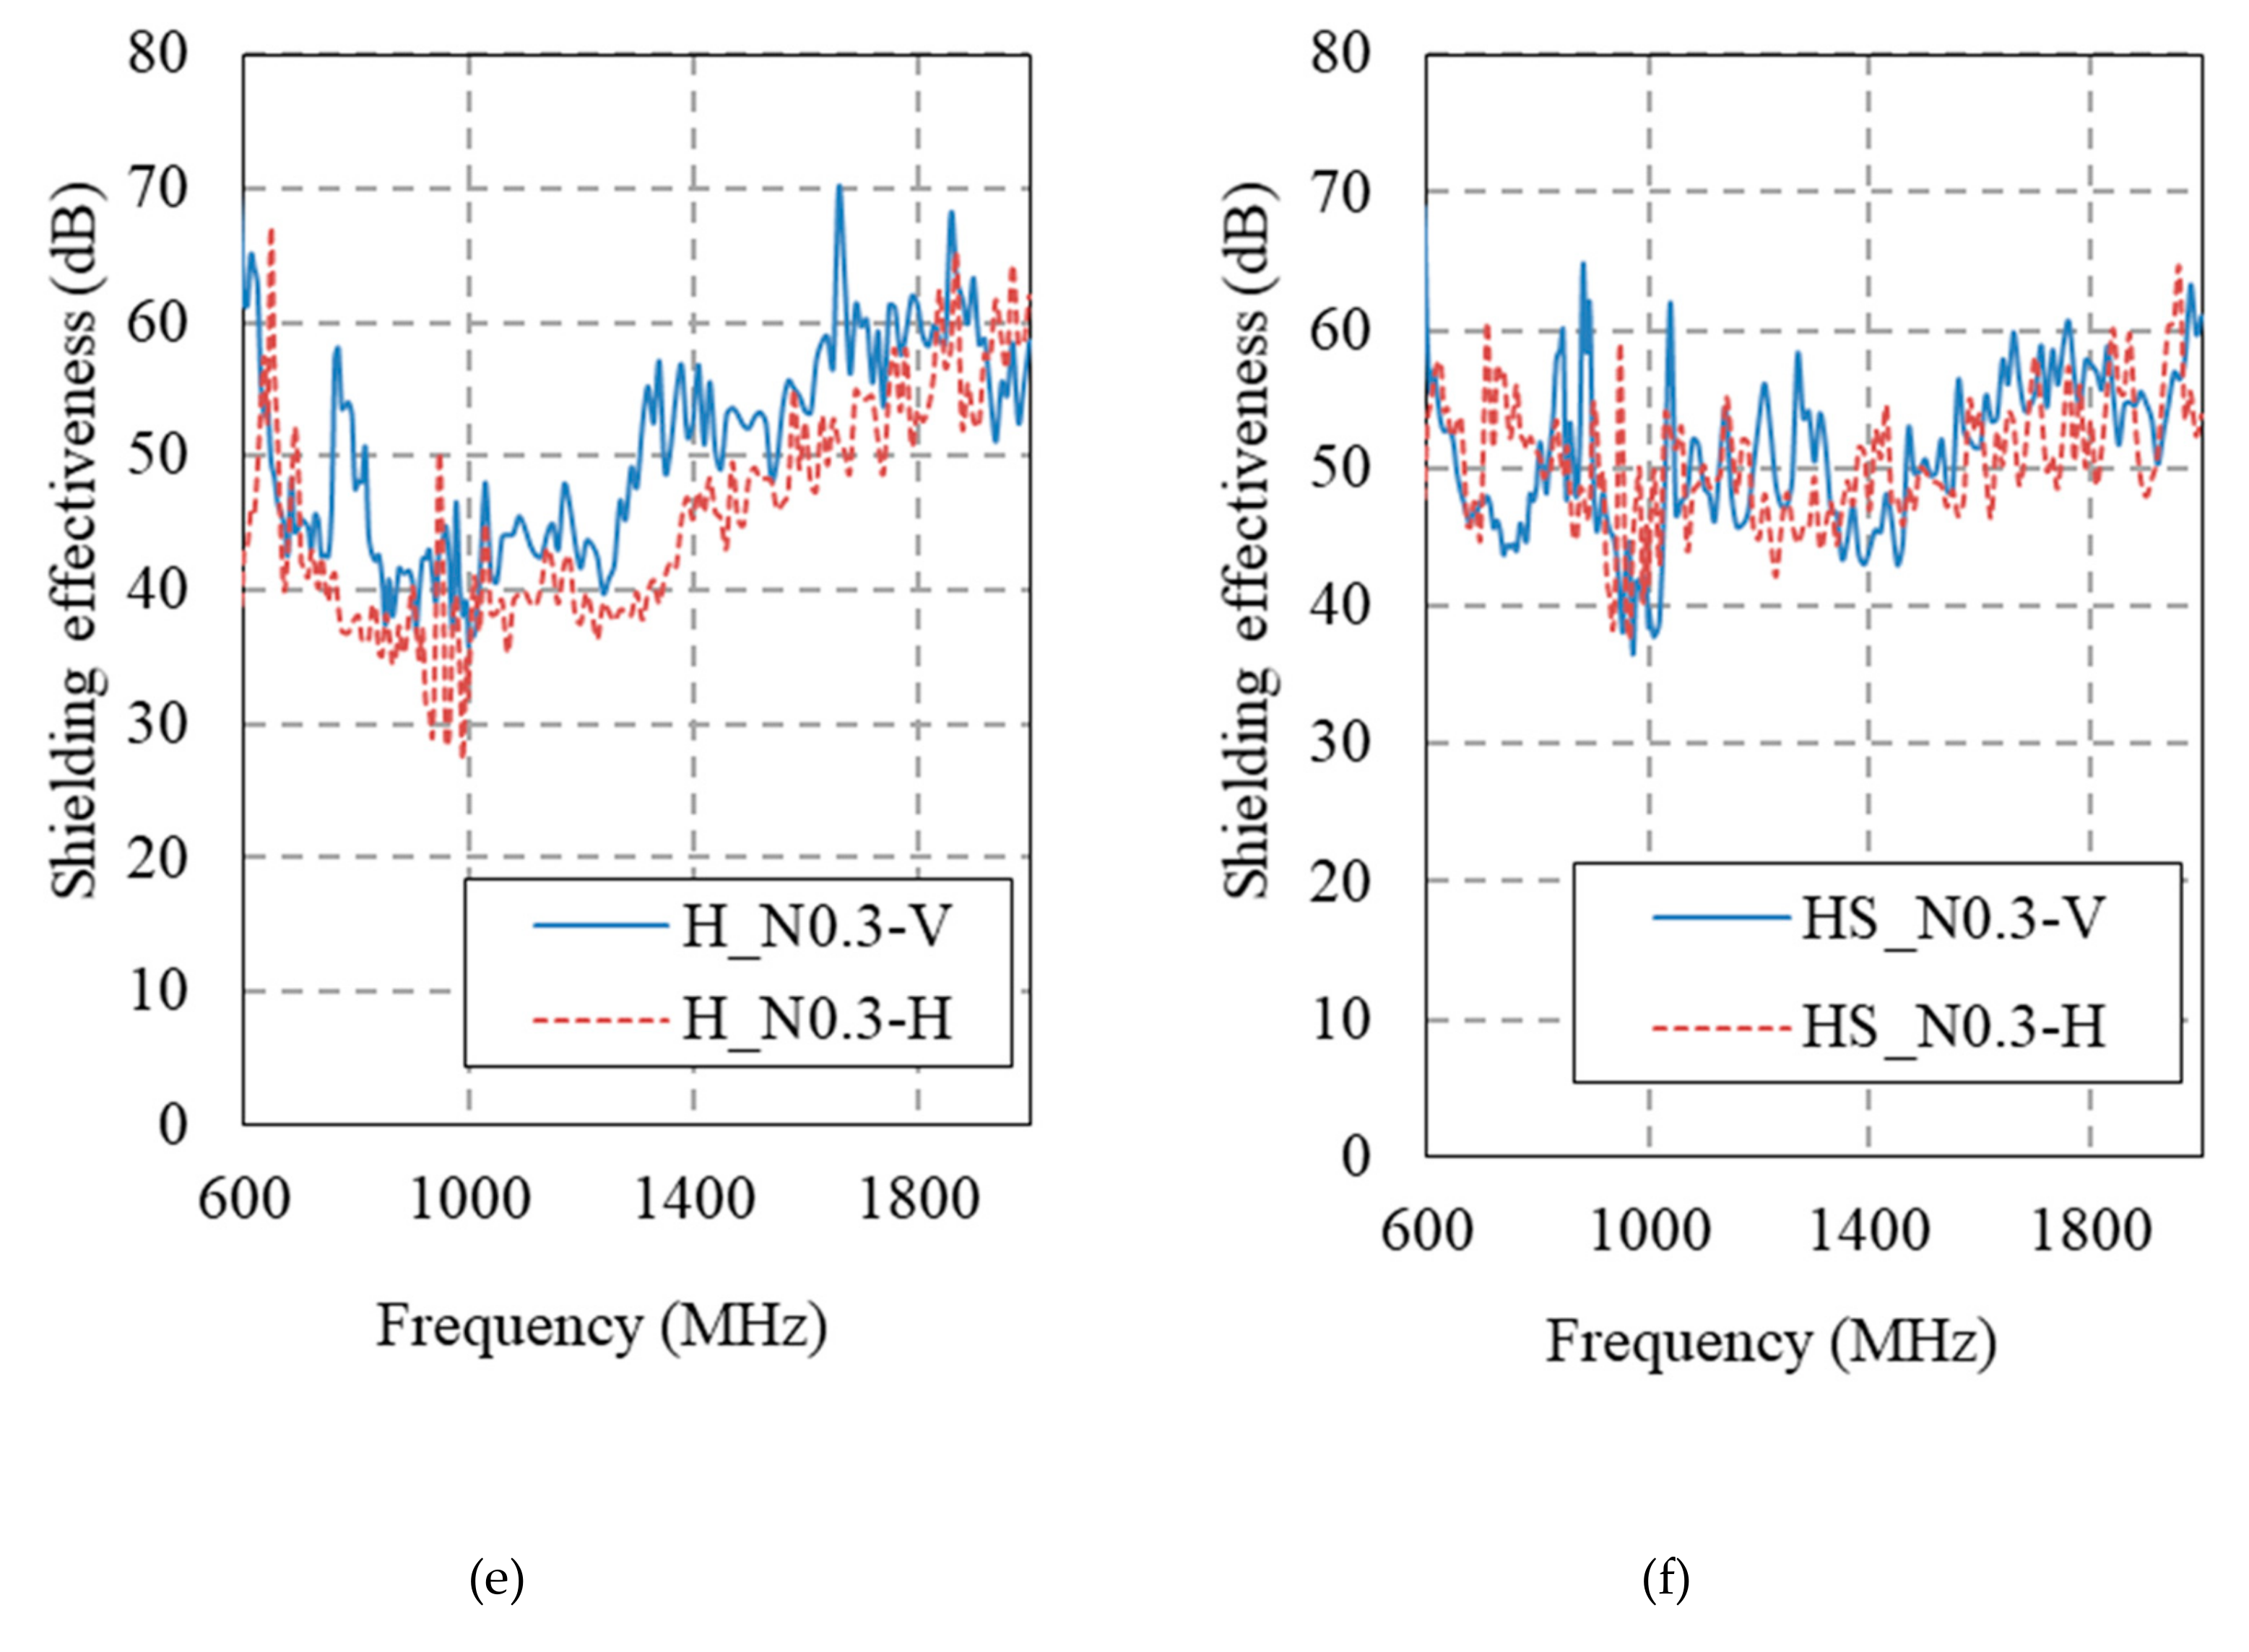
- At 2.0% steel fiber and 0.3% MWCNT contents, the SE values of the HPFRCC were found to be 45.8 dB (horizontal) and 42.1 dB (vertical), which were slightly higher than those (37.9 dB (horizontal)) at 2.0% steel fiber content and that (39.2 dB (horizontal)) at 0.3% MWCNT content.
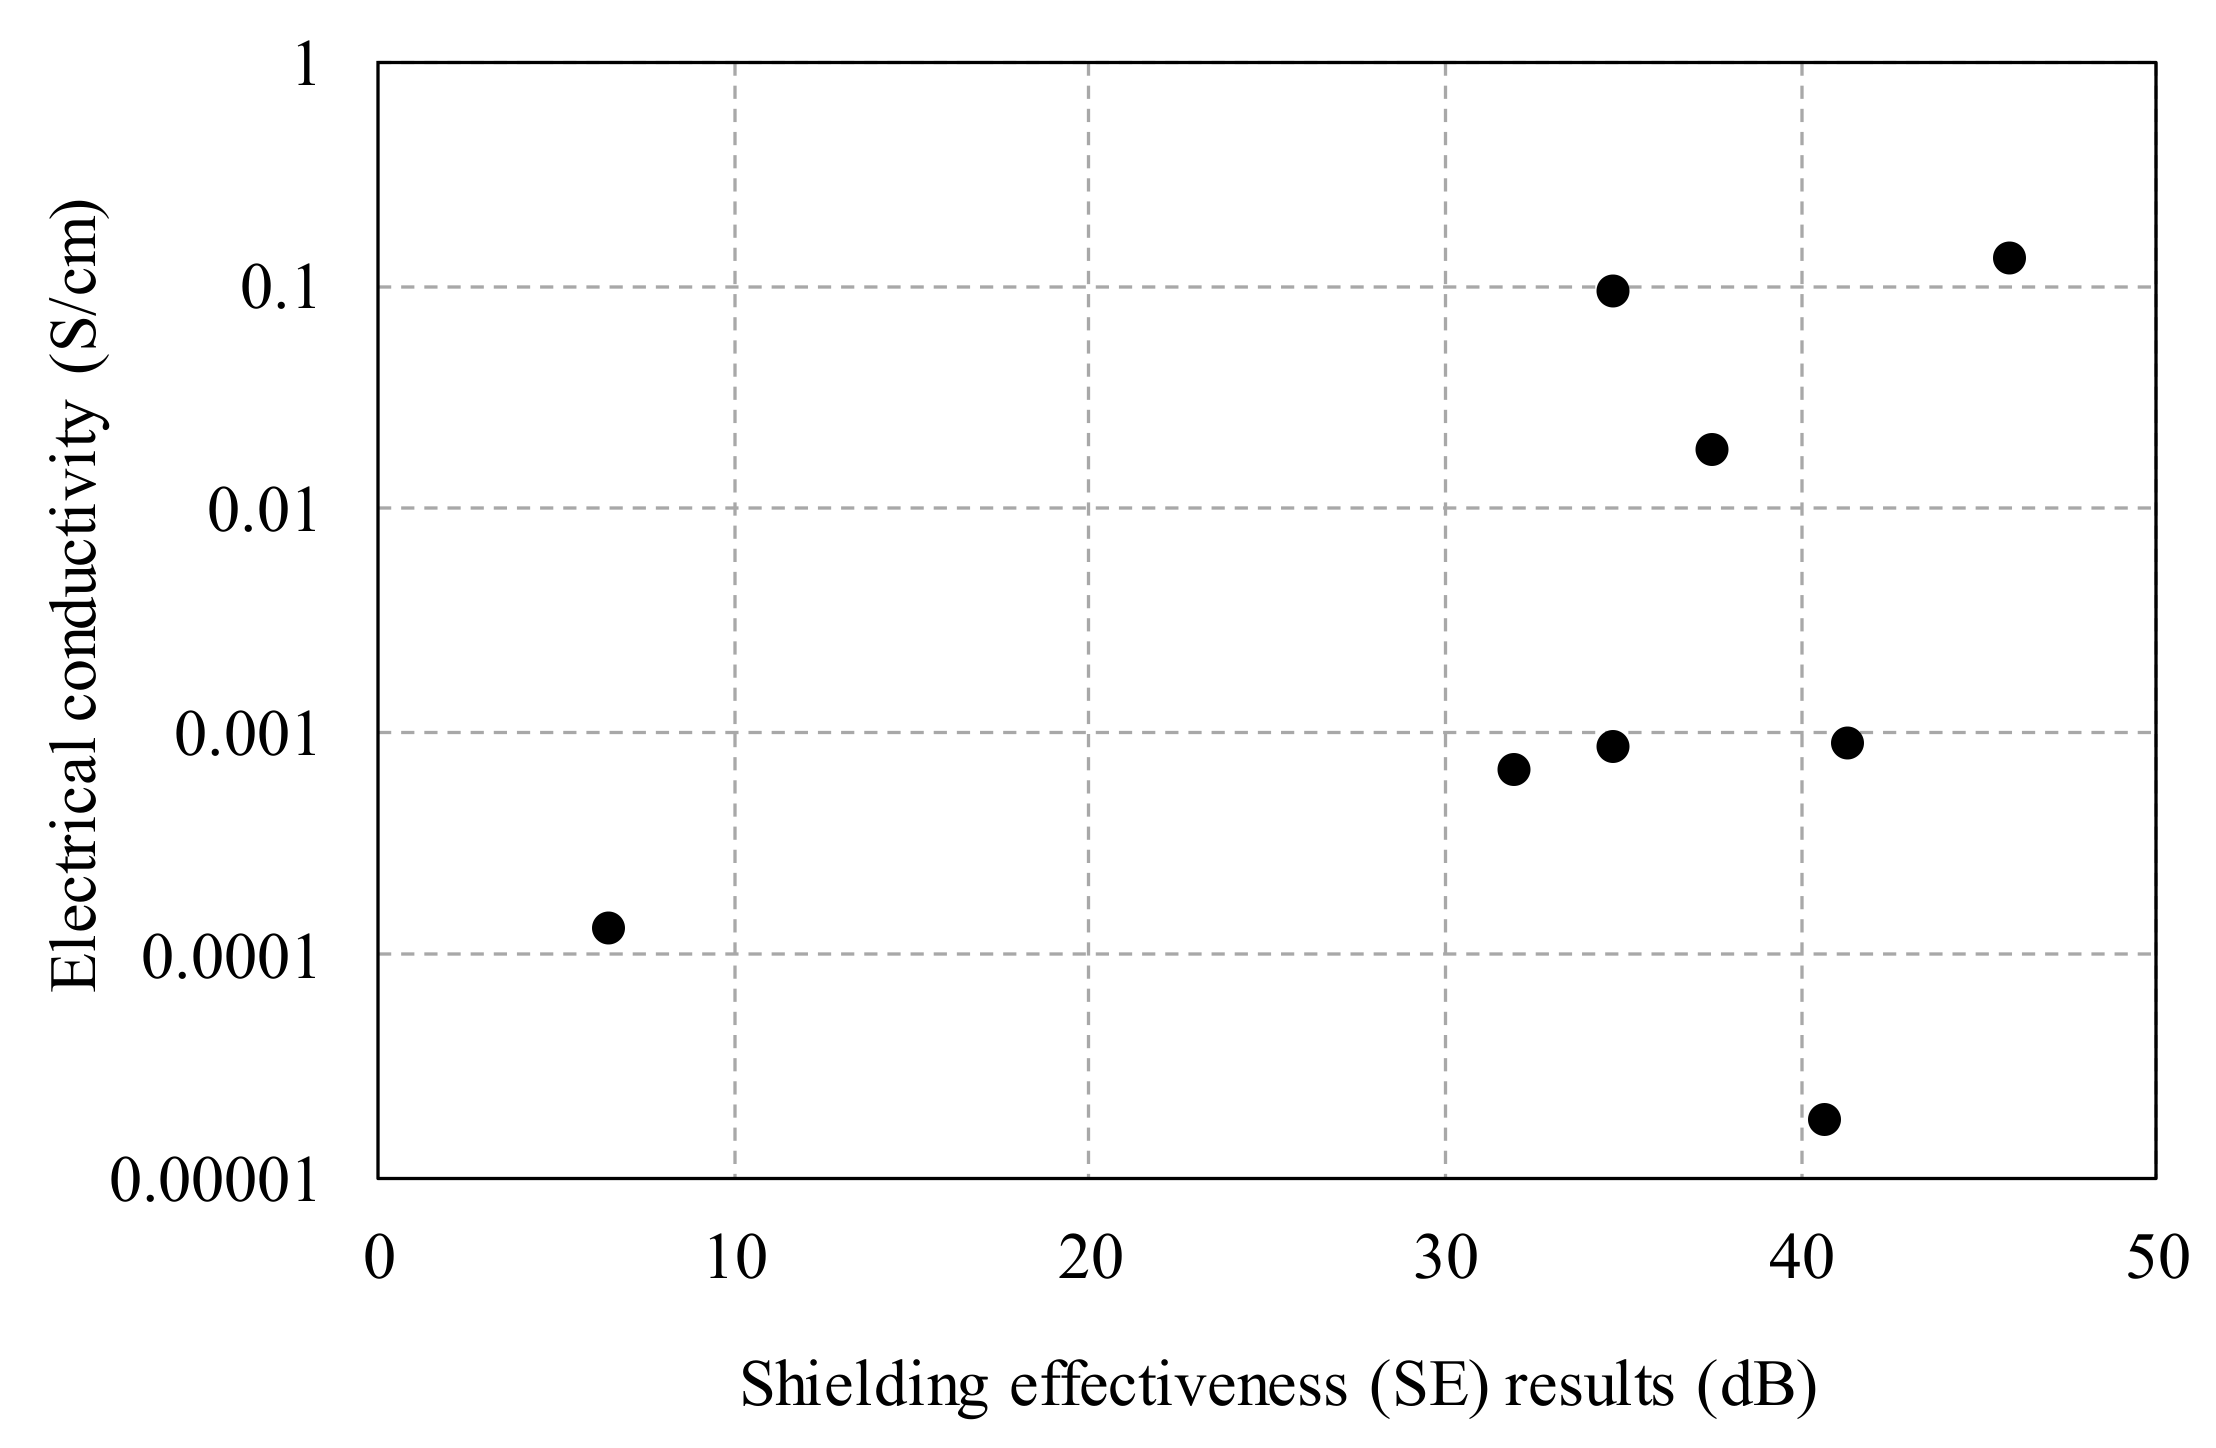
- The synergy effect in the use of both steel fibers and MWCNTs on the shielding effectiveness was not observed in the HPFRCC. There was no direct relationship between the electrical conductivity and the SE results of the HPFRCC with MWCNTs and steel fibers. The incorporation of steel fibers did not result in any electrical percolation path in the HPFRCC at the micro level; therefore, a high electrical conductivity could not be achieved. At the macro level, the proper dispersion of the steel fibers into the HPFRCC helped reflect and absorb the electromagnetic waves, consequently increasing the electromagnetic SE. Although there was no electrical percolation path in the HPFRCC, a high electromagnetic SE could be achieved.
- The electrical conductivity of the HPFRCC with 2.0% steel fiber content was 0.00086 S/cm, and the SE values were 45.8 dB (horizontal) and 42.1 dB (vertical) at 1 GHz. Despite the electrical conductivity of the HPFRCC being as low as 10−5 S/cm, the SE value was as high as 40 dB. The formation of the electrical percolation path with the addition of MWCNTs had a positive effect on the electromagnetic SE. The electrical conductivity of the HPFRCC with 0.3% MWCNT content was 0.093 S/cm, which was high enough to form a percolation path, and the SE values were 34.7 dB (horizontal) and 39.2 dB (vertical) at 1 GHz.
- In summary, the incorporation of steel fibers at the macro level can help improve the electromagnetic SE regardless of the formation of percolation paths, whereas the incorporation of MWCNTs at the micro level can help improve the electromagnetic SE only when percolation paths are formed in the cement matrix.
Author Contributions
Funding
Conflicts of Interest
References
- Naaman, A.E.; Wille, K. The path to ultra-high performance fiber reinforced concrete (UHP-FRC): Five decades of progress. Proc. Hipermat 2012, 3–15. [Google Scholar]
- Song, Q.; Yu, R.; Shui, Z.; Rao, S.; Wang, X.; Sun, M.; Jiang, C. Steel fibre content and interconnection induced electrochemical corrosion of Ultra-High Performance Fibre Reinforced Concrete (UHPFRC). Cem. Concr. Compos. 2018, 94, 191–200. [Google Scholar] [CrossRef]
- Wansom, S.; Kidner, N.J.; Woo, L.Y.; Mason, T.O. AC-impedance response of multi-walled carbon nanotube/cement composites. Cem. Concr. Compos. 2006, 28, 509–519. [Google Scholar] [CrossRef]
- Berrocal, C.G.; Hornbostel, K.; Geiker, M.R.; Löfgren, I.; Lundgren, K.; Bekas, D.G. Electrical resistivity measurements in steel fibre reinforced cementitious materials. Cem. Concr. Compos. 2018, 89, 216–229. [Google Scholar] [CrossRef] [Green Version]
- Hixson, A.D.; Woo, L.Y.; Campo, M.A.; Mason, T.O.; Garboczi, E.J. Intrinsic conductivity of short conductive fibers in composites by impedance spectroscopy. J. Electroceram. 2001, 7, 189–195. [Google Scholar] [CrossRef]
- Torrents, J.M.; Mason, T.O.; Garboczi, E.J. Impedance spectra of fiber-reinforced cement-based composites: A modeling approach. Cem. Concr. Res. 2000, 30, 585–592. [Google Scholar] [CrossRef]
- Jang, S.H.; Hochstein, D.P.; Kawashima, S.; Yin, H. Experiments and micromechanical modeling of electrical conductivity of carbon nanotube/cement composites with moisture. Cem. Concr. Compos. 2017, 77, 49–59. [Google Scholar] [CrossRef] [Green Version]
- Lee, H.K.; Nam, I.W.; Tafesse, M.; Kim, H.K. Fluctuation of electrical properties of carbon-based nanomaterials/cement composites: Case studies and parametric modeling. Cem. Concr. Compos. 2019, 102, 55–70. [Google Scholar] [CrossRef]
- Paul, S.C.; van Rooyen, A.S.; van Zijl, G.P.; Petrik, L.F. Properties of cement-based composites using nanoparticles: A comprehensive review. Constr. Build. Mater. 2018, 189, 1019–1034. [Google Scholar] [CrossRef]
- Wansom, S.; Janjaturaphan, S. Evaluation of fiber orientation in plant fiber-cement composites using AC-impedance spectroscopy. Cem. Concr. Res. 2013, 45, 37–44. [Google Scholar] [CrossRef]
- Ford, S.J.; Shane, J.D.; Mason, T.O. Assignment of features in impedance spectra of the cement-paste/steel system. Cem. Concr. Res. 1998, 28, 1737–1751. [Google Scholar] [CrossRef]
- Mason, T.O.; Campo, M.A.; Hixson, A.D.; Woo, L.Y. Impedance spectroscopy of fiber-reinforced cement composites. Cem. Concr. Compos. 2002, 24, 457–465. [Google Scholar] [CrossRef]
- Hu, X.; Shi, C.; Liu, X.; Zhang, J.; de Schutter, G. A review on microstructural characterization of cement-based materials by AC impedance spectroscopy. Cem. Concr. Compos. 2019, 100, 1–14. [Google Scholar] [CrossRef]
- Song, G. Equivalent circuit model for AC electrochemical impedance spectroscopy of concrete. Cem. Concr. Res. 2000, 30, 1723–1730. [Google Scholar] [CrossRef]
- Keddam, M.; Takenouti, H.; Novoa, X.R.; Andrade, C.; Alonso, C. Impedance measurements on cement paste. Cem. Concr. Res. 1997, 27, 1191–1201. [Google Scholar] [CrossRef]
- Kong, L.; Hou, L.; Bao, X. Application of AC impedance technique in study of lightweight aggregate-paste interface. Constr. Build. Mater. 2015, 82, 332–340. [Google Scholar] [CrossRef]
- Gu, P.; Xie, P.; Beaudoin, J.J.; Brousseau, R. AC impedance spectroscopy (I): A new equivalent circuit model for hydrated portland cement paste. Cem. Concr. Res. 1992, 22, 833–840. [Google Scholar] [CrossRef]
- Xie, P.; Gu, P.; Xu, Z.; Beaudoin, J.J. A rationalized AC impedence model for microstructural characterization of hydrating cement systems. Cem. Concr. Res. 1993, 23, 359–367. [Google Scholar] [CrossRef]
- Guan, H.; Liu, S.; Duan, Y.; Cheng, J. Cement based electromagnetic shielding and absorbing building materials. Cem. Concr. Compos. 2006, 28, 468–474. [Google Scholar] [CrossRef]
- Cao, J.; Chung, D.D.L. Colloidal graphite as an admixture in cement and as a coating on cement for electromagnetic interference shielding. Cem. Concr. Res. 2003, 33, 1737–1740. [Google Scholar] [CrossRef]
- Nam, I.W.; Kim, H.K.; Lee, H.K. Influence of silica fume additions on electromagnetic interference shielding effectiveness of multi-walled carbon nanotube/cement composites. Constr. Build. Mater. 2012, 30, 480–487. [Google Scholar] [CrossRef]
- Kim, H.K.; Nam, I.W.; Lee, H.K. Enhanced effect of carbon nanotube on mechanical and electrical properties of cement composites by incorporation of silica fume. Compos. Struct. 2014, 107, 60–69. [Google Scholar] [CrossRef]
- Kim, H.K.; Park, I.S.; Lee, H.K. Improved piezoresistive sensitivity and stability of CNT/cement mortar composites with low water–binder ratio. Compos. Struct. 2014, 116, 713–719. [Google Scholar] [CrossRef]
- Lee, N.K.; Koh, K.T.; Kim, M.O.; Ryu, G.S. Uncovering the role of micro silica in hydration of ultra-high performance concrete (UHPC). Cem. Concr. Res. 2018, 104, 68–79. [Google Scholar] [CrossRef]
- Layssi, H.; Ghods, P.; Alizadeh, A.R.; Salehi, M. Electrical resistivity of concrete. Concr. Int. 2015, 37, 41–46. [Google Scholar]


| (wt %) | XRF | Rietveld Analysis | |||
|---|---|---|---|---|---|
| OPC | Fly Ash | Silica Fume | Compound | OPC | |
| SiO2 | 20.6 | 38.07 | 95.31 | C3S | 62.2 |
| Al2O3 | 5.0 | 14.54 | 0.1 | C2S | 11.0 |
| Fe2O3 | 3.4 | 5.42 | 0.35 | C4AF | 11.0 |
| CaO | 60.7 | 22.78 | 0.21 | C3A | 4.2 |
| MgO | 2.6 | 2.67 | 0.8 | Calcite | 5.1 |
| SO3 | 2.38 | 5.45 | 0.55 | Gypsum | 0.7 |
| K2O | 0.98 | 5.83 | - | Anhydrite | - |
| Na2O | 0.15 | 0.92 | 0.19 | Ye’elimite (C) | - |
| TiO2 | 0.27 | 3.62 | - | Ye’elimite (O) | - |
| P2O5 | 0.11 | 1.52 | 0.03 | CT | - |
| Others | <0.25 | 1.19 | - | C2AS | - |
| LOI | 0.75 | 7.1 | 2.46 | Hemihydrate | - |
| Quartz | - | ||||
| Arcanite | - | ||||
| Others | 2.2 | ||||
| TYPE OF FIBER | Density (kg/cm3) | Tensile Strength (MPa) | Length (mm) | (mm/mm) |
|---|---|---|---|---|
| Straight | 7.8 | 2500 | 19.5 | 97.5 |
| Mixture | w/b a Ratio (w/c) | OPC | Fly Ash | Micro Silica | CNT (%) | Fine Aggregate | Fill-er | SP Agent | Steel Fiber c (%) | |
|---|---|---|---|---|---|---|---|---|---|---|
| Powder | Liquid b | |||||||||
| H | 0.3 (0.35) | 1 | 0.2 | 0.1 | - | - | 1.2 | 0.2 | 0.015 | - |
| H_N0.1 | 0.3 (0.35) | 1 | 0.2 | 0.1 | 0.1 | - | 1.2 | 0.2 | 0.018 | - |
| H_N0.2 | 0.3 (0.35) | 1 | 0.2 | 0.1 | 0.2 | - | 1.2 | 0.2 | 0.022 | - |
| H_N0.3 | 0.3 (0.35) | 1 | 0.2 | 0.1 | 0.3 | - | 1.2 | 0.2 | 0.026 | - |
| H_N0.4 | 0.3 (0.35) | 1 | 0.2 | 0.1 | 0.4 | - | 1.2 | 0.2 | - | - |
| H_NN0.3 | 0.3 (0.35) | 1 | 0.2 | 0.1 | 0.3 | - | 1.2 | 0.2 | 0.026 | - |
| H_LN0.1 | 0.3 (0.35) | 1 | 0.2 | 0.1 | - | 0.1 | 1.2 | 0.2 | 0.018 | - |
| H_LN0.2 | 0.3 (0.35) | 1 | 0.2 | 0.1 | - | 0.2 | 1.2 | 0.2 | 0.022 | - |
| H_LN0.3 | 0.3 (0.35) | 1 | 0.2 | 0.1 | - | 0.3 | 1.2 | 0.2 | 0.026 | - |
| HS | 0.3 (0.35) | 1 | 0.2 | 0.1 | - | - | 1.2 | 0.2 | 0.015 | 2.0 |
| HS_N | 0.3 (0.35) | 1 | 0.2 | 0.1 | 0.3 | - | 1.2 | 0.2 | 0.030 | 2.0 |
| HS_LN | 0.3 (0.35) | 1 | 0.2 | 0.1 | - | 0.3 | 1.2 | 0.2 | 0.030 | 2.0 |
| UHS | 0.2 (0.25) | 1 | - | 0.25 | - | - | 1.2 | 0.2 | 0.051 | 2.0 |
| UHS_LN0.3w | 0.25 (0.30) | 1 | - | 0.25 | 0.3 | - | 1.2 | 0.2 | 0.066 | 2.0 |
| UHS_LN0.3 | 0.3 (0.35) | 1 | - | 0.25 | 0.3 | - | 1.2 | 0.2 | 0.032 | 2.0 |
| UHS_N0.35 | 0.3 (0.35) | 1 | - | 0.25 | 0.35 | - | 1.2 | 0.2 | 0.032 | 2.0 |
| UHS_N0.4 | 0.3 (0.35) | 1 | - | 0.25 | 0.4 | - | 1.2 | 0.2 | 0.032 | 2.0 |
| UHS_N0.5 | 0.3 (0.35) | 1 | - | 0.25 | 0.5 | - | 1.2 | 0.2 | 0.035 | 2.0 |
| UHS_LN0.3 | 0.3 (0.35) | 1 | - | 0.25 | - | 0.3 | 1.2 | 0.2 | 0.026 | 2.0 |
| UHS_LN0.5 | 0.3 (0.35) | 1 | - | 0.25 | - | 0.5 | 1.2 | 0.2 | 0.026 | 2.0 |
| Mixture (without Steel Fiber) | Mini Slump Flow (mm) | Mixture (with Steel Fiber) | Mini Slump Flow (mm) |
|---|---|---|---|
| H | 200 | H100 | 240 |
| N0.1 | 215 | H100N | 130 |
| N0.2 | 150 | H100SN | 160 |
| N0.3 | 150 | H180 | 250 |
| N0.4 | - | H180N0.3w | 150 |
| NN0.3 | 160 | H180N0.3 | 230 |
| SN0.1 | 250 | H180N0.35 | 170 |
| SN0.2 | 220 | H180N0.4 | 160 |
| SN0.3 | 170 | H180N0.5 | 150 |
| H180SN0.3 | 200 | ||
| H180SN0.5 | 160 |
| Sample | Pore Volume (mL/g) | Porosity (%) | Total Intrusion Volume (mL/g) | |
|---|---|---|---|---|
| 5–100 nm | 1–1000 μm | |||
| H | 0.031 | 0.043 | 15.83 | 0.0819 |
| H_N0.1 | 0.028 | 0.030 | 11.36 | 0.0582 |
| H_N0.2 | 0.031 | 0.070 | 18.14 | 0.1012 |
| H_N0.3 | 0.028 | 0.065 | 16.62 | 0.0933 |
| H_LN0.1 | 0.014 | 0.027 | 8.39 | 0.042 |
| H_LN0.2 | 0.026 | 0.037 | 11.97 | 0.064 |
| H_LN0.3 | 0.031 | 0.042 | 14.24 | 0.074 |
| UHS | <0.001 | 0.045 | 9.12 | 0.046 |
| UHS_N0.3 | 0.008 | 0.029 | 7.37 | 0.037 |
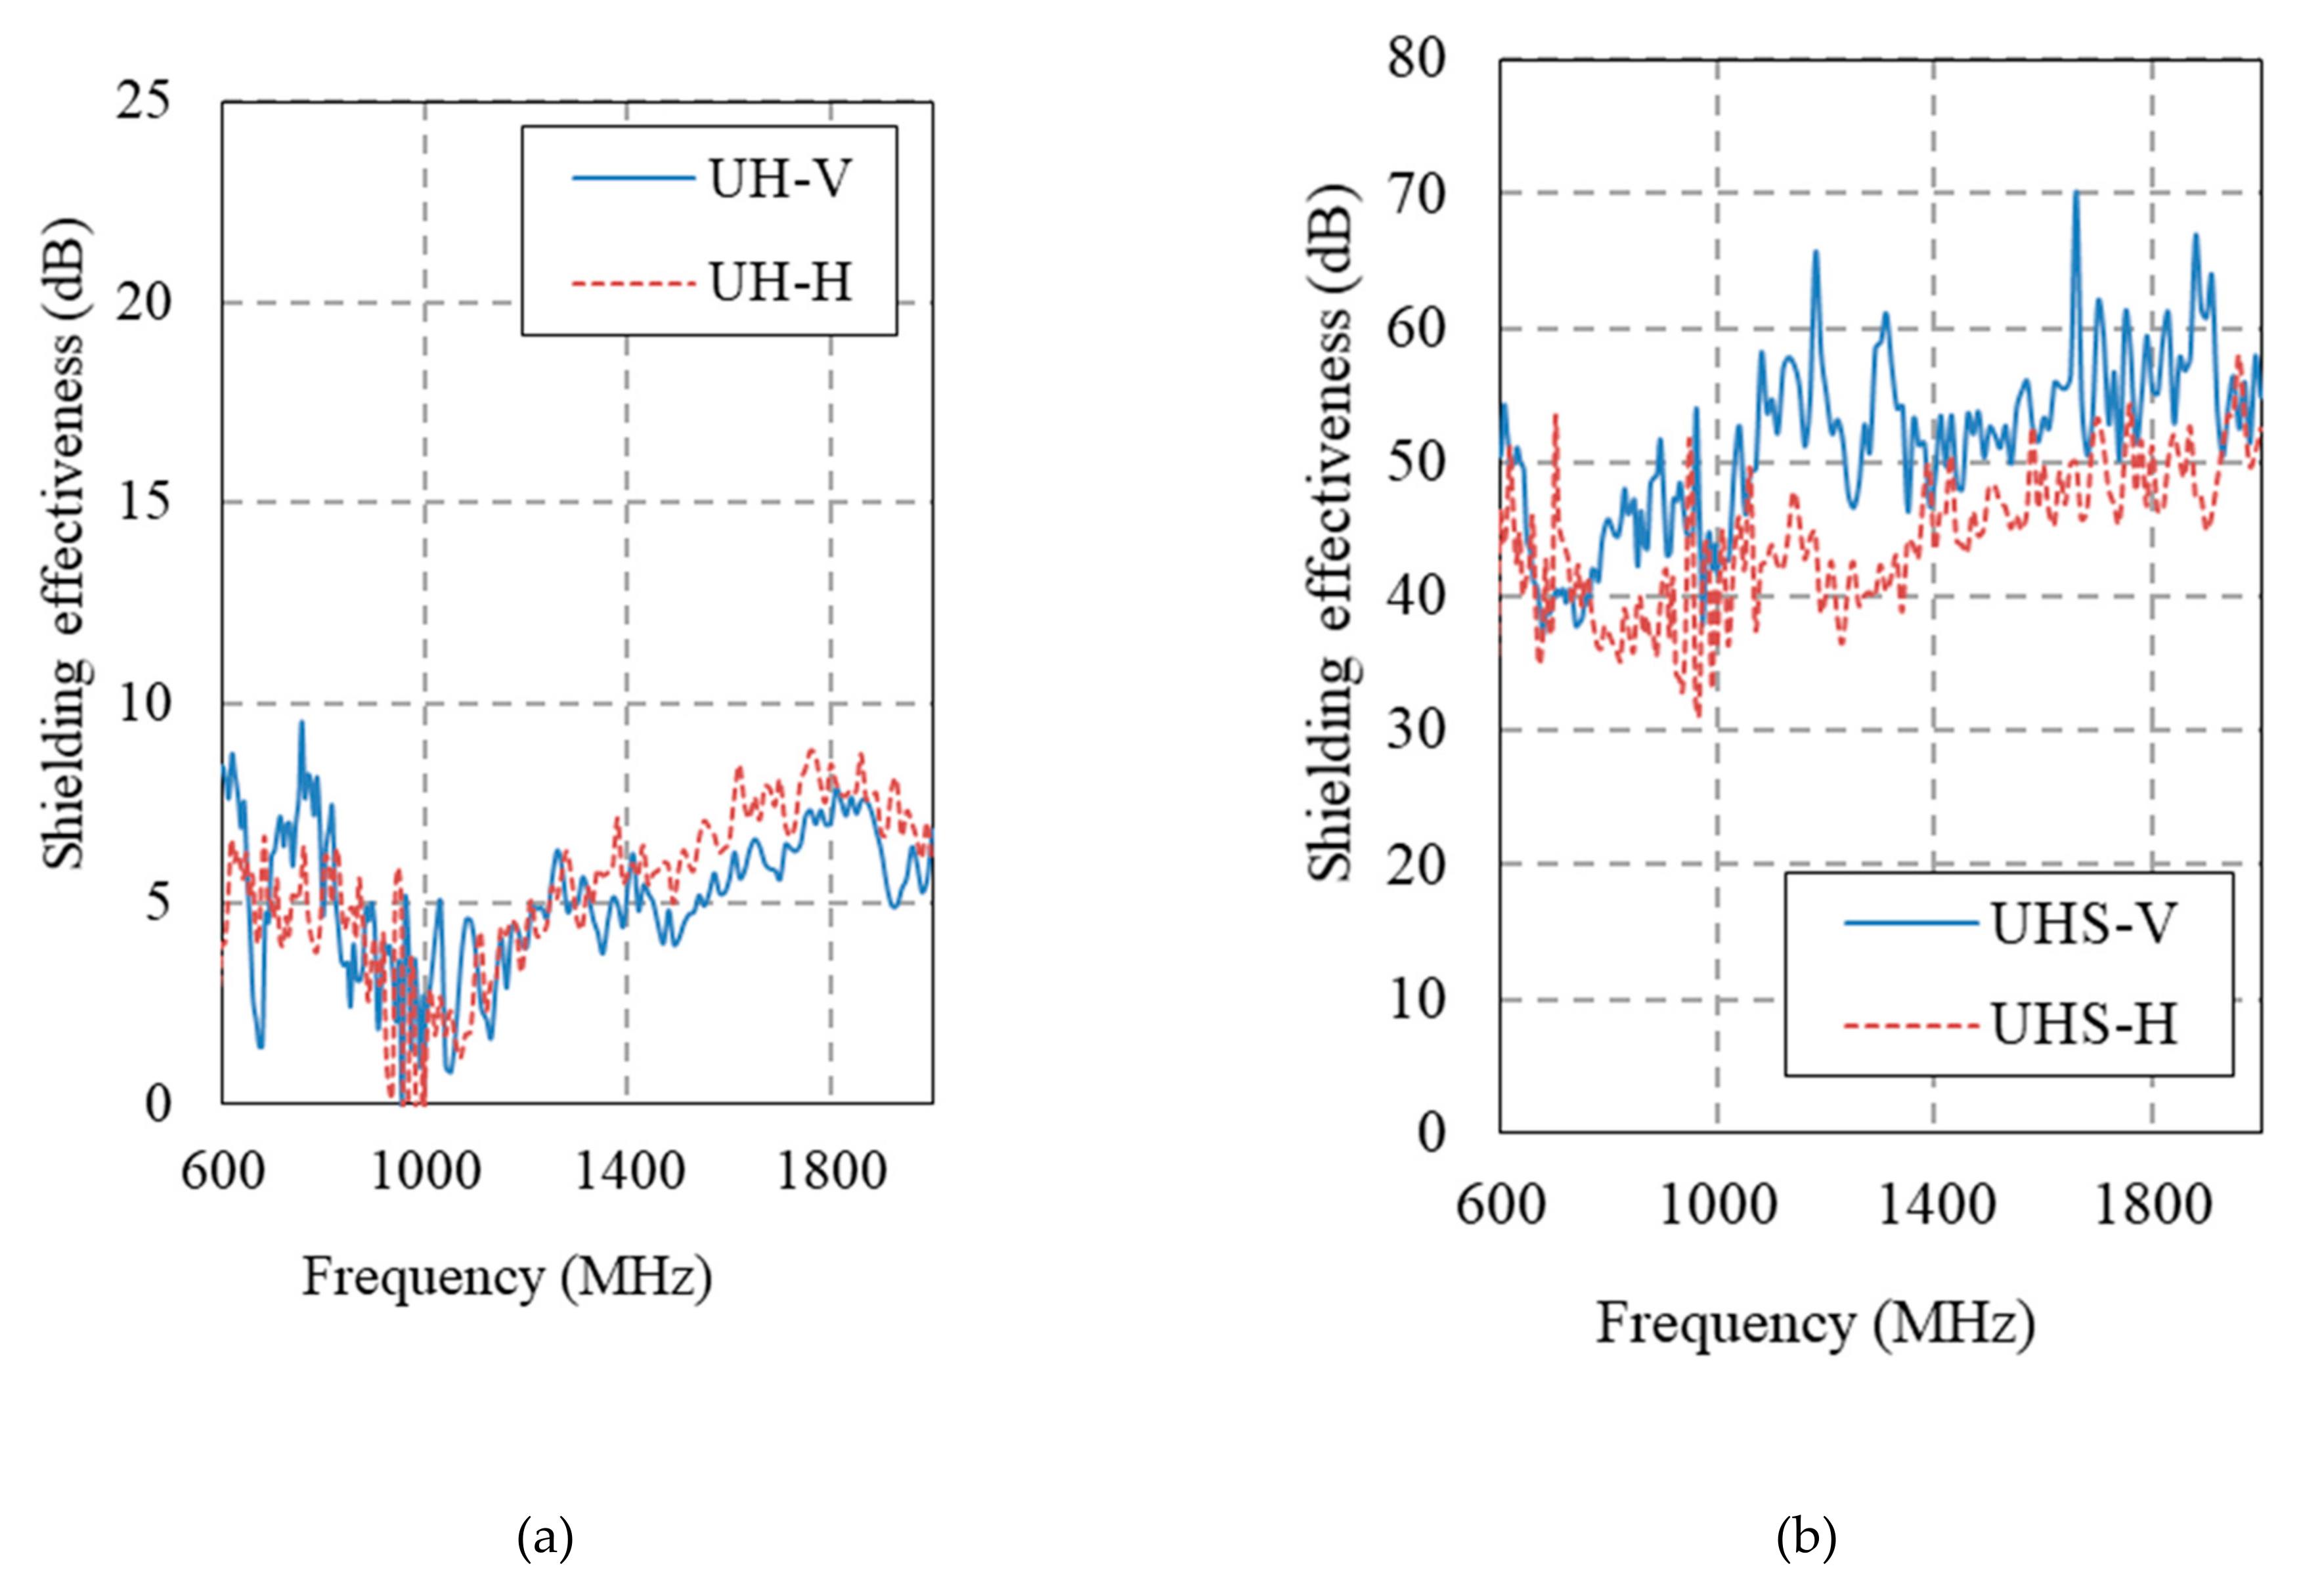
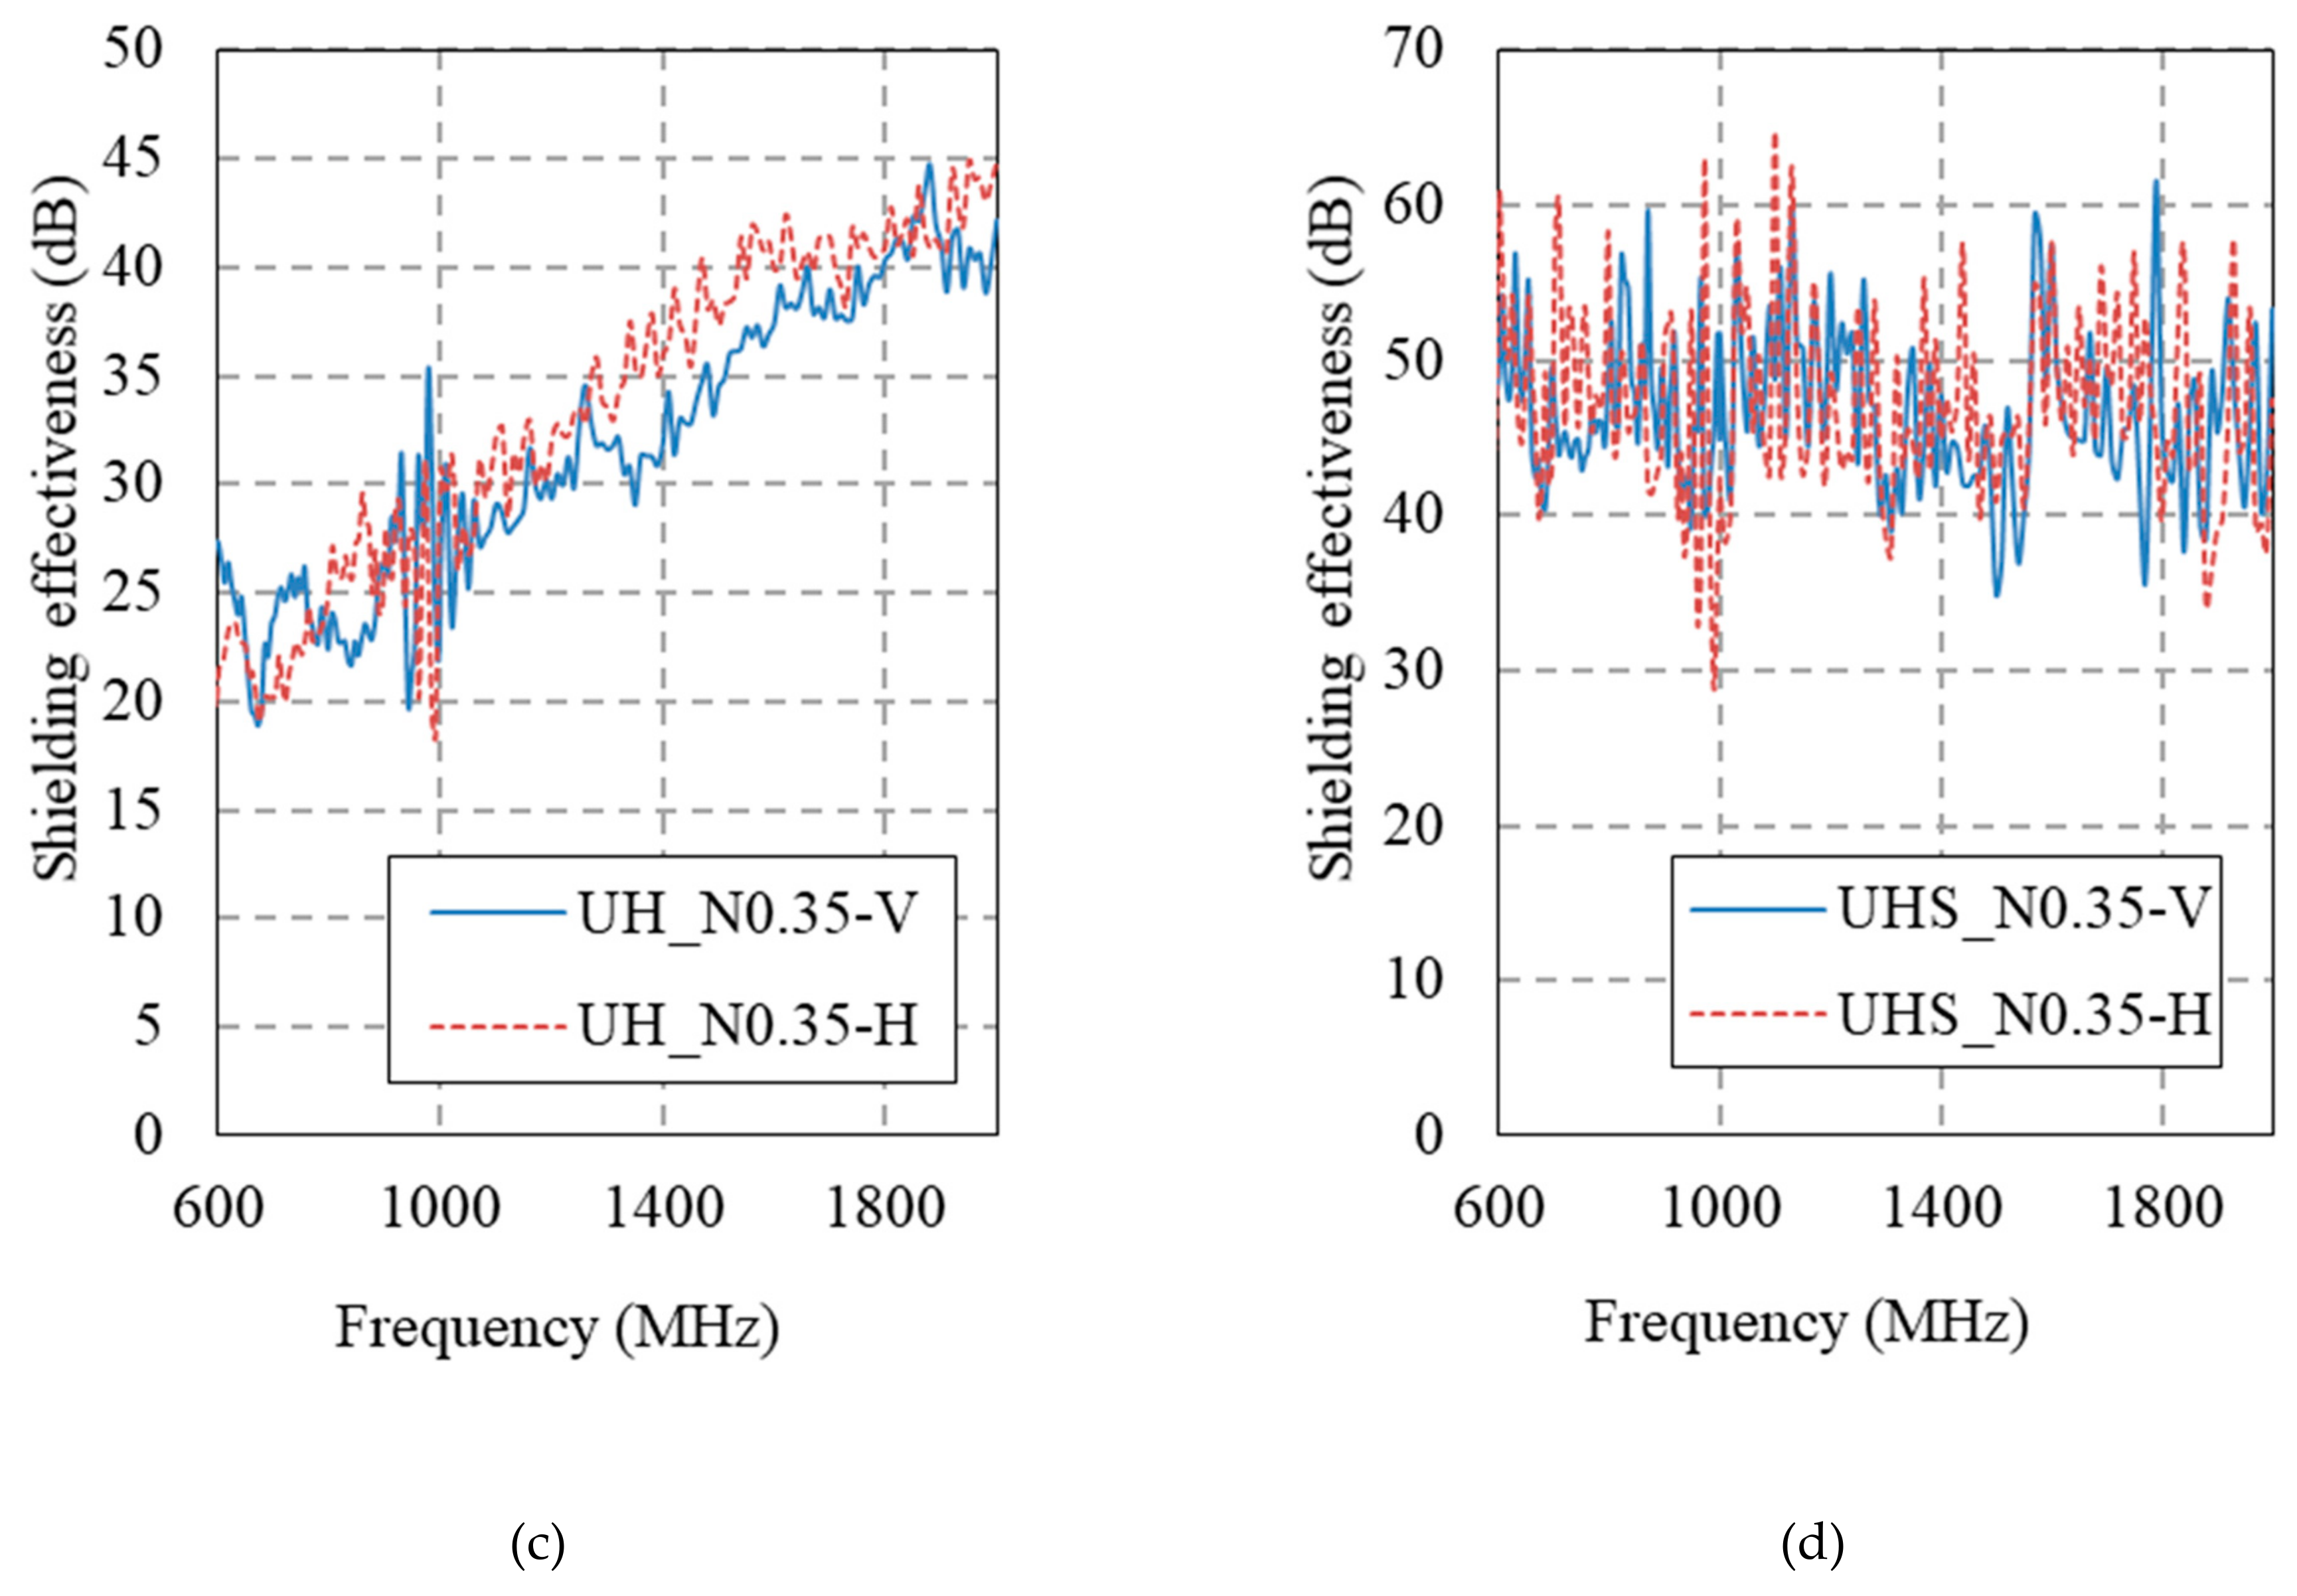
| Sample | Frequency (MHz) | Horizontal (dB) | Vertical (dB) |
|---|---|---|---|
| H | 1000 | 6.5 | 9.06 |
| HS1.0 | 1000 | 31.86 | 47.33 |
| HS2.0 | 1000 | 34.65 | 37.9 |
| HS3.0 | 1000 | 41.25 | 35.59 |
| H_N0.3 | 1000 | 34.72 | 39.19 |
| HS_N0.3 | 1000 | 45.82 | 42.11 |
| UH | 1000 | 1.42 | 2.72 |
| UHS | 1000 | 40.65 | 43.91 |
| UH_N0.35 | 1000 | 28.37 | 21.87 |
| UHS_N0.35 | 1000 | 37.47 | 51.72 |
© 2019 by the authors. Licensee MDPI, Basel, Switzerland. This article is an open access article distributed under the terms and conditions of the Creative Commons Attribution (CC BY) license (http://creativecommons.org/licenses/by/4.0/).
Share and Cite
Lee, N.; Kim, S.; Park, G. The Effects of Multi-Walled Carbon Nanotubes and Steel Fibers on the AC Impedance and Electromagnetic Shielding Effectiveness of High-Performance, Fiber-Reinforced Cementitious Composites. Materials 2019, 12, 3591. https://doi.org/10.3390/ma12213591
Lee N, Kim S, Park G. The Effects of Multi-Walled Carbon Nanotubes and Steel Fibers on the AC Impedance and Electromagnetic Shielding Effectiveness of High-Performance, Fiber-Reinforced Cementitious Composites. Materials. 2019; 12(21):3591. https://doi.org/10.3390/ma12213591
Chicago/Turabian StyleLee, Namkon, Sungwook Kim, and Gijoon Park. 2019. "The Effects of Multi-Walled Carbon Nanotubes and Steel Fibers on the AC Impedance and Electromagnetic Shielding Effectiveness of High-Performance, Fiber-Reinforced Cementitious Composites" Materials 12, no. 21: 3591. https://doi.org/10.3390/ma12213591
APA StyleLee, N., Kim, S., & Park, G. (2019). The Effects of Multi-Walled Carbon Nanotubes and Steel Fibers on the AC Impedance and Electromagnetic Shielding Effectiveness of High-Performance, Fiber-Reinforced Cementitious Composites. Materials, 12(21), 3591. https://doi.org/10.3390/ma12213591