Effect of Different Aluminum Substitution Rates on the Structure of Tobermorite

Abstract
:1. Introduction
2. Experimental Work
2.1. Chemicals and Synthesis
2.2. Characterization
2.3. Cation Adsorption Capacity
3. Results and Discussion
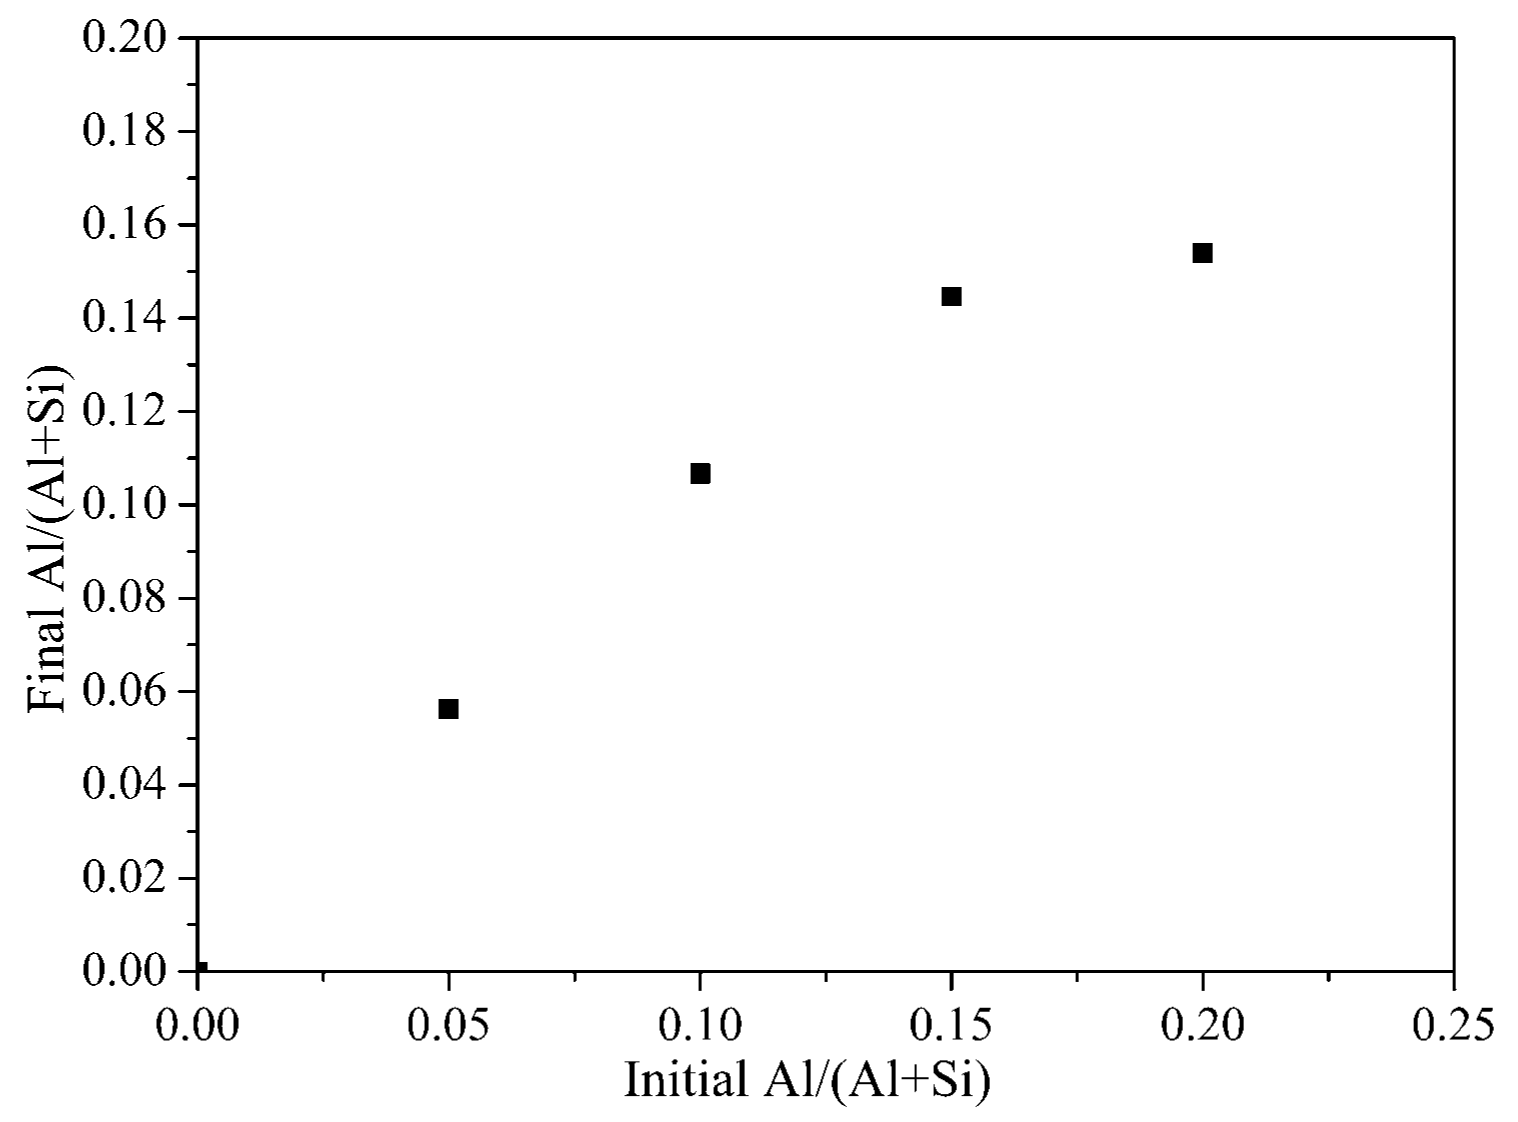
3.1. XRD and SEM–EDS
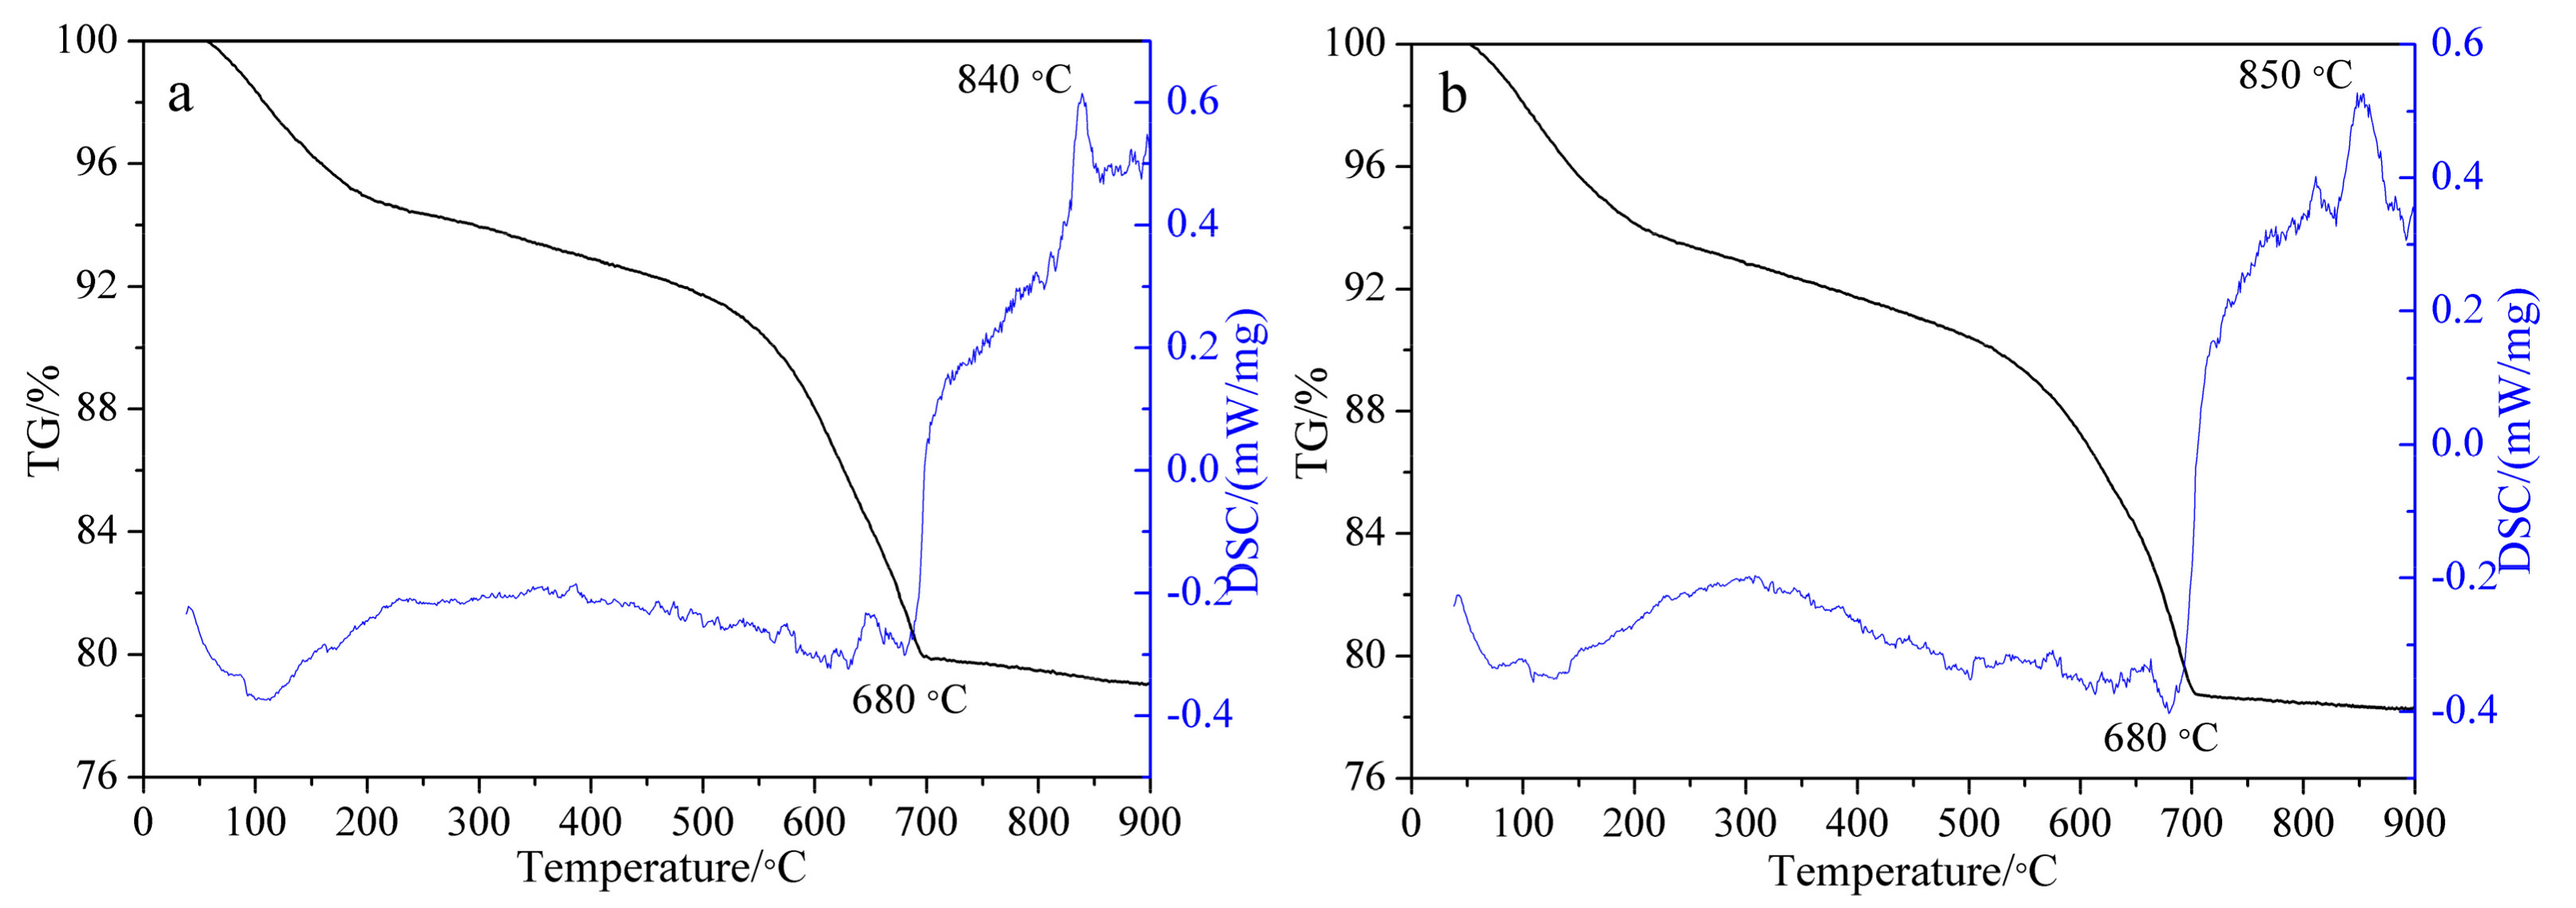
3.2. TG-DSC
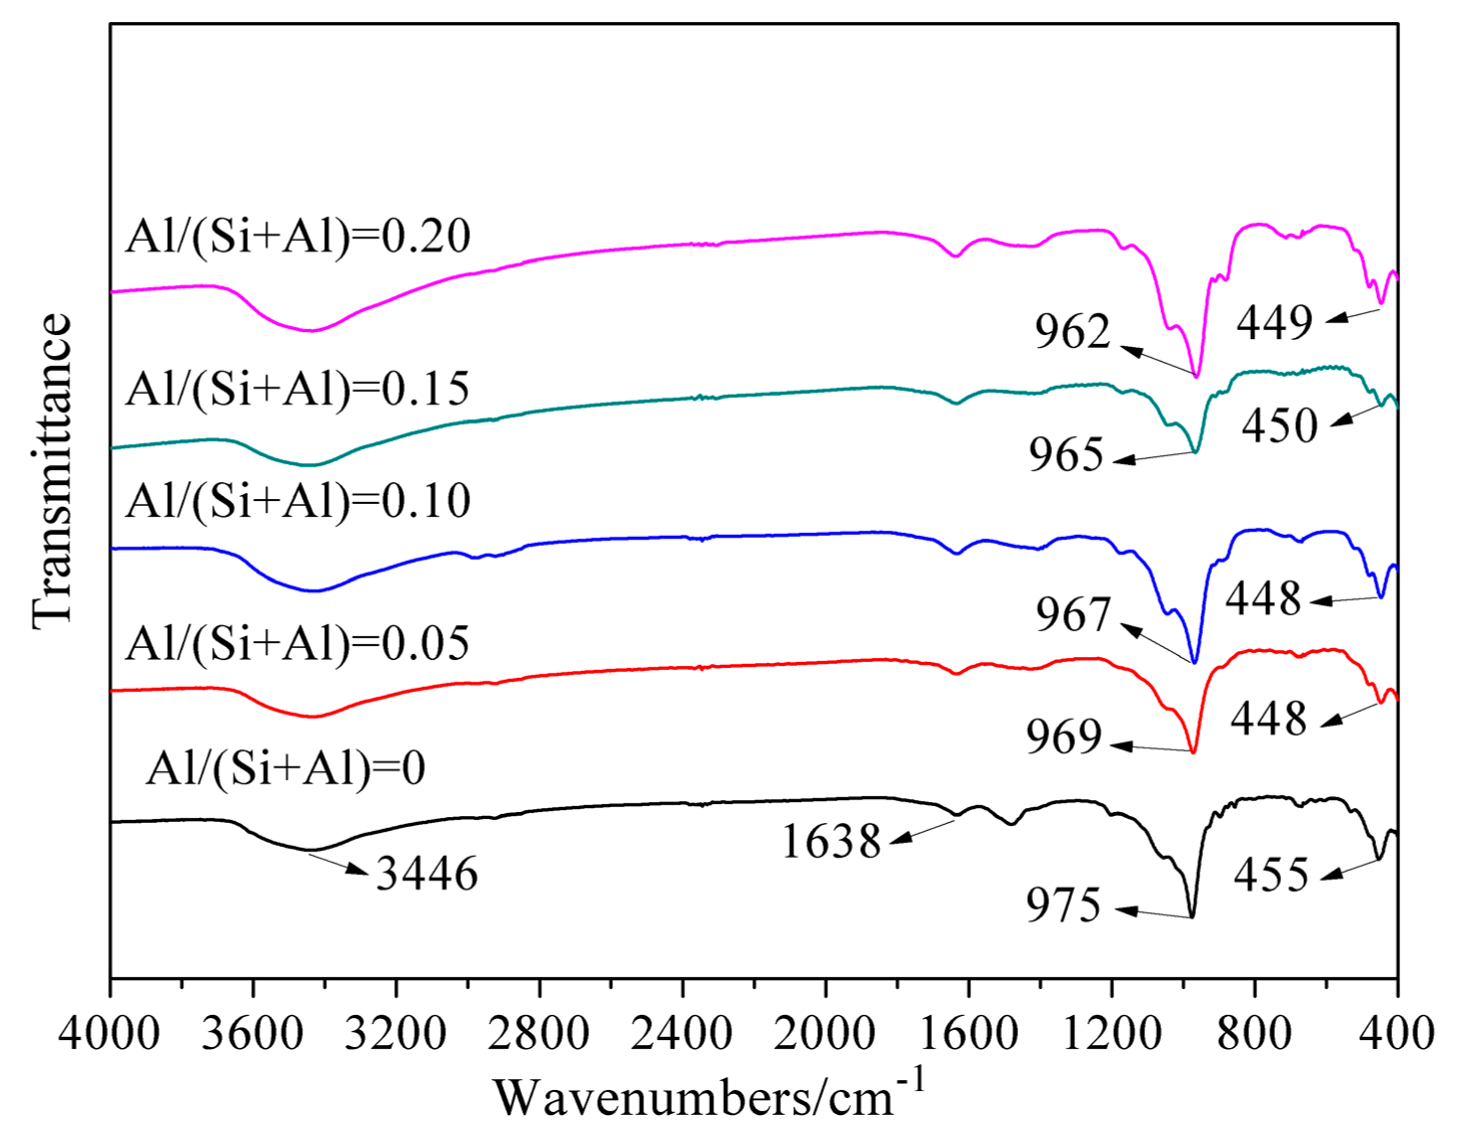
3.3. FT–IR
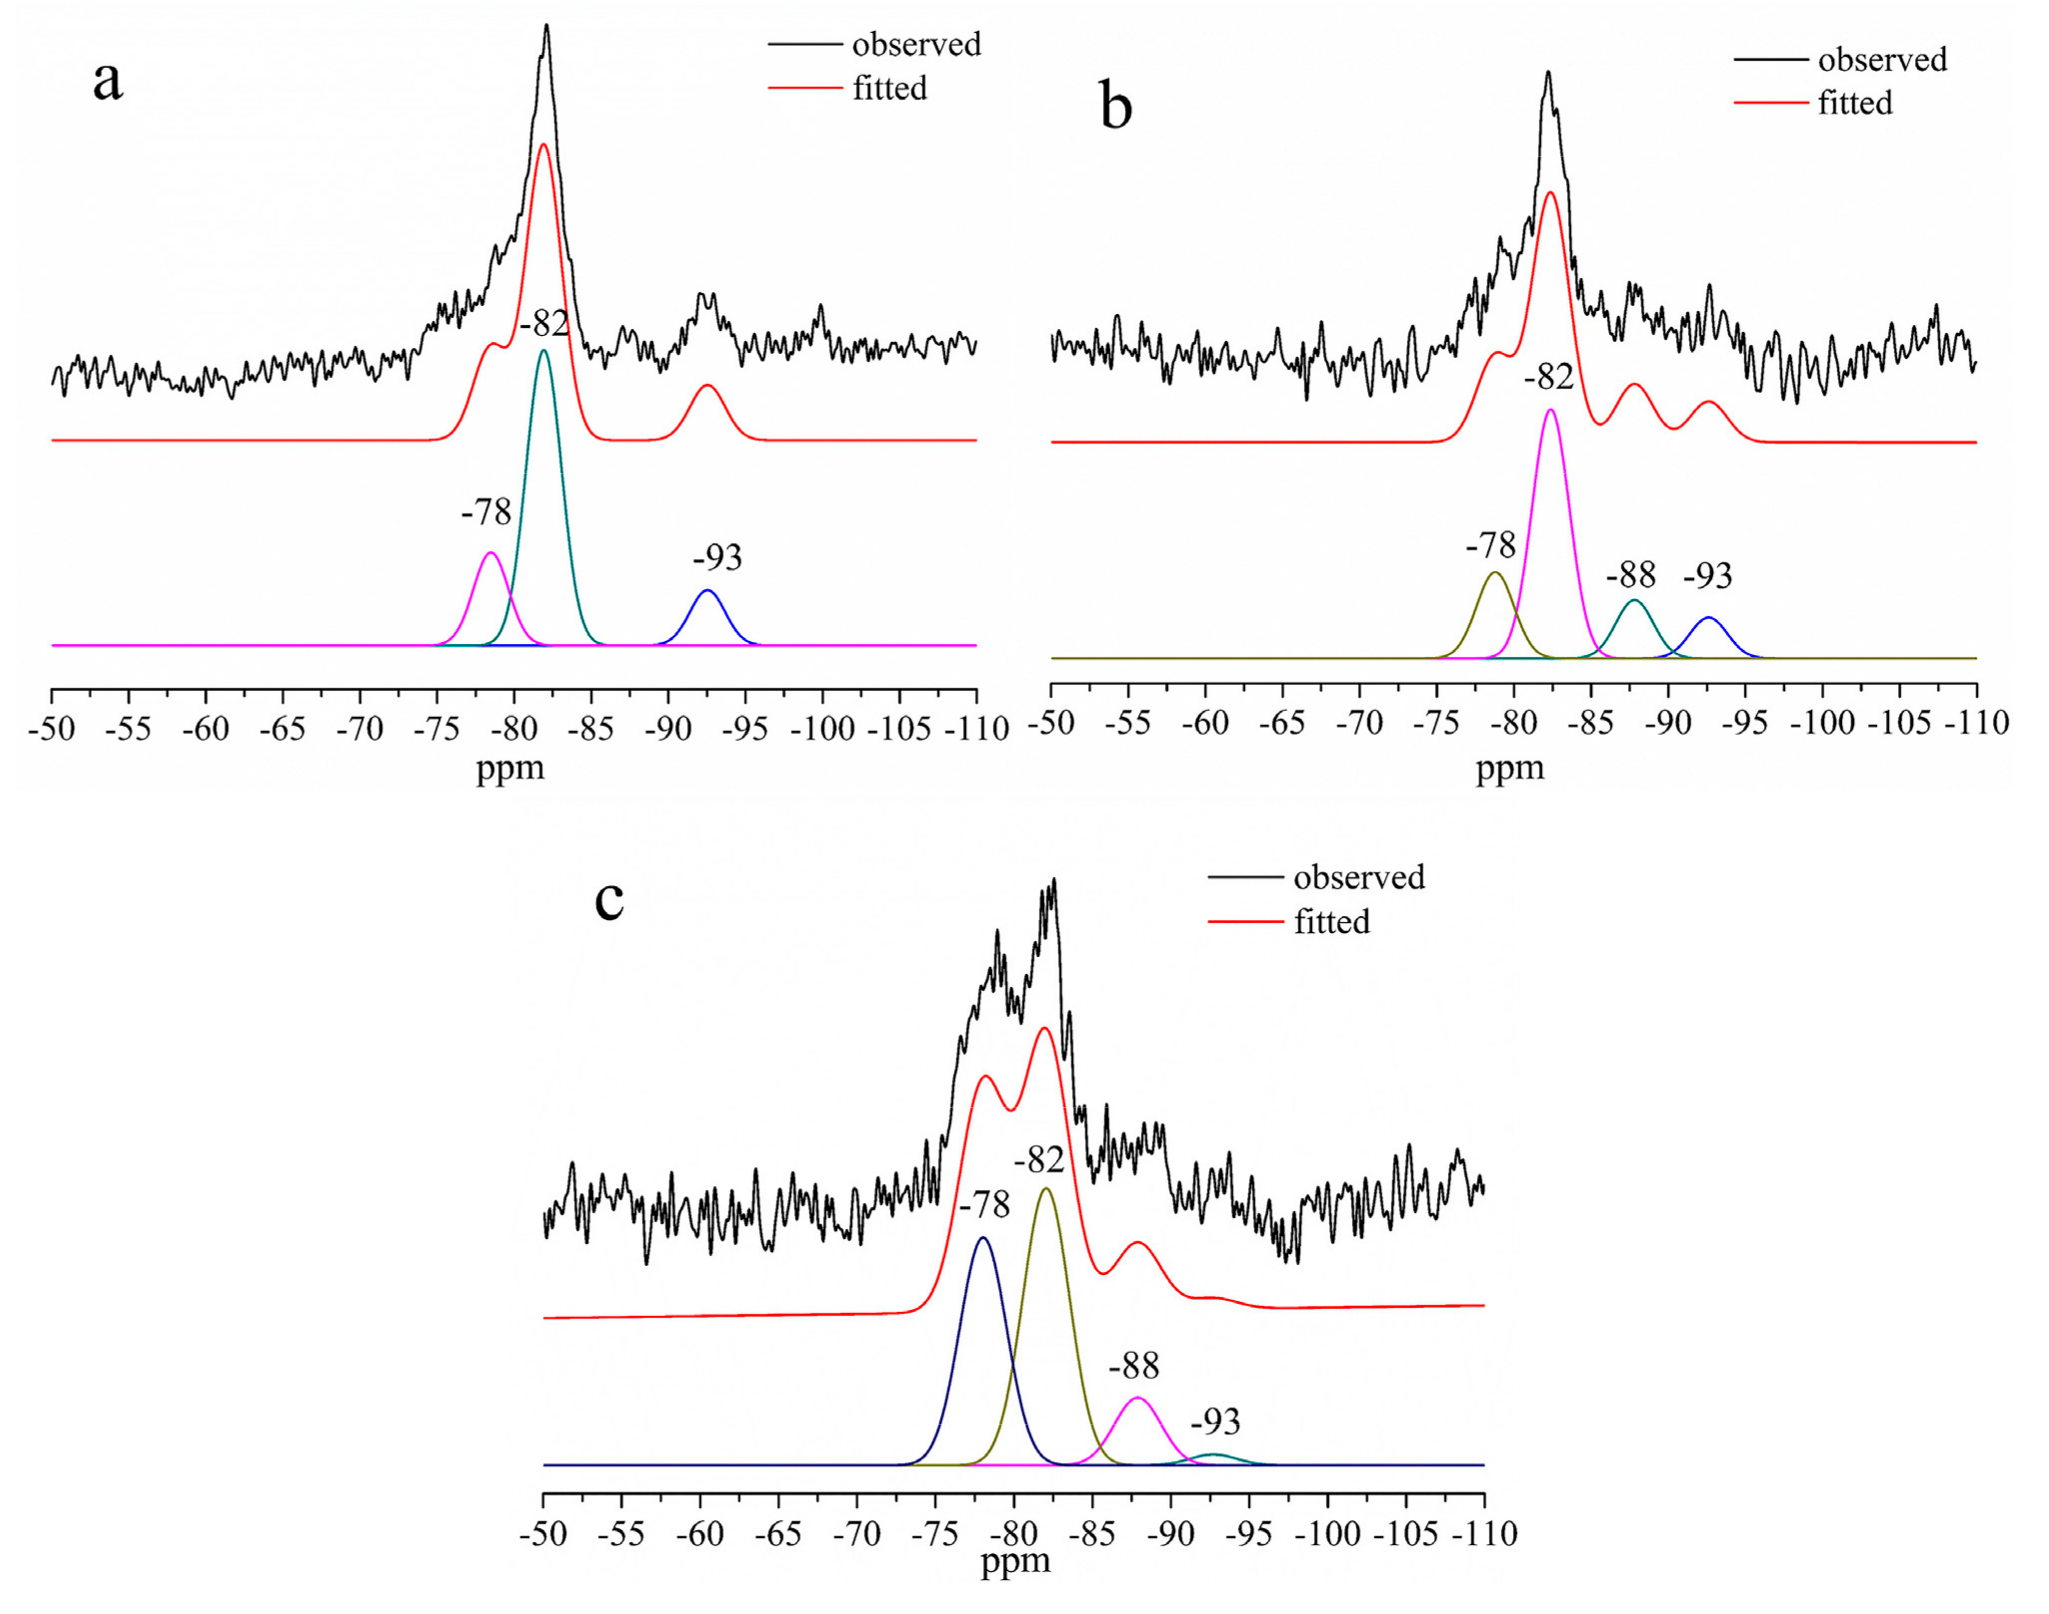
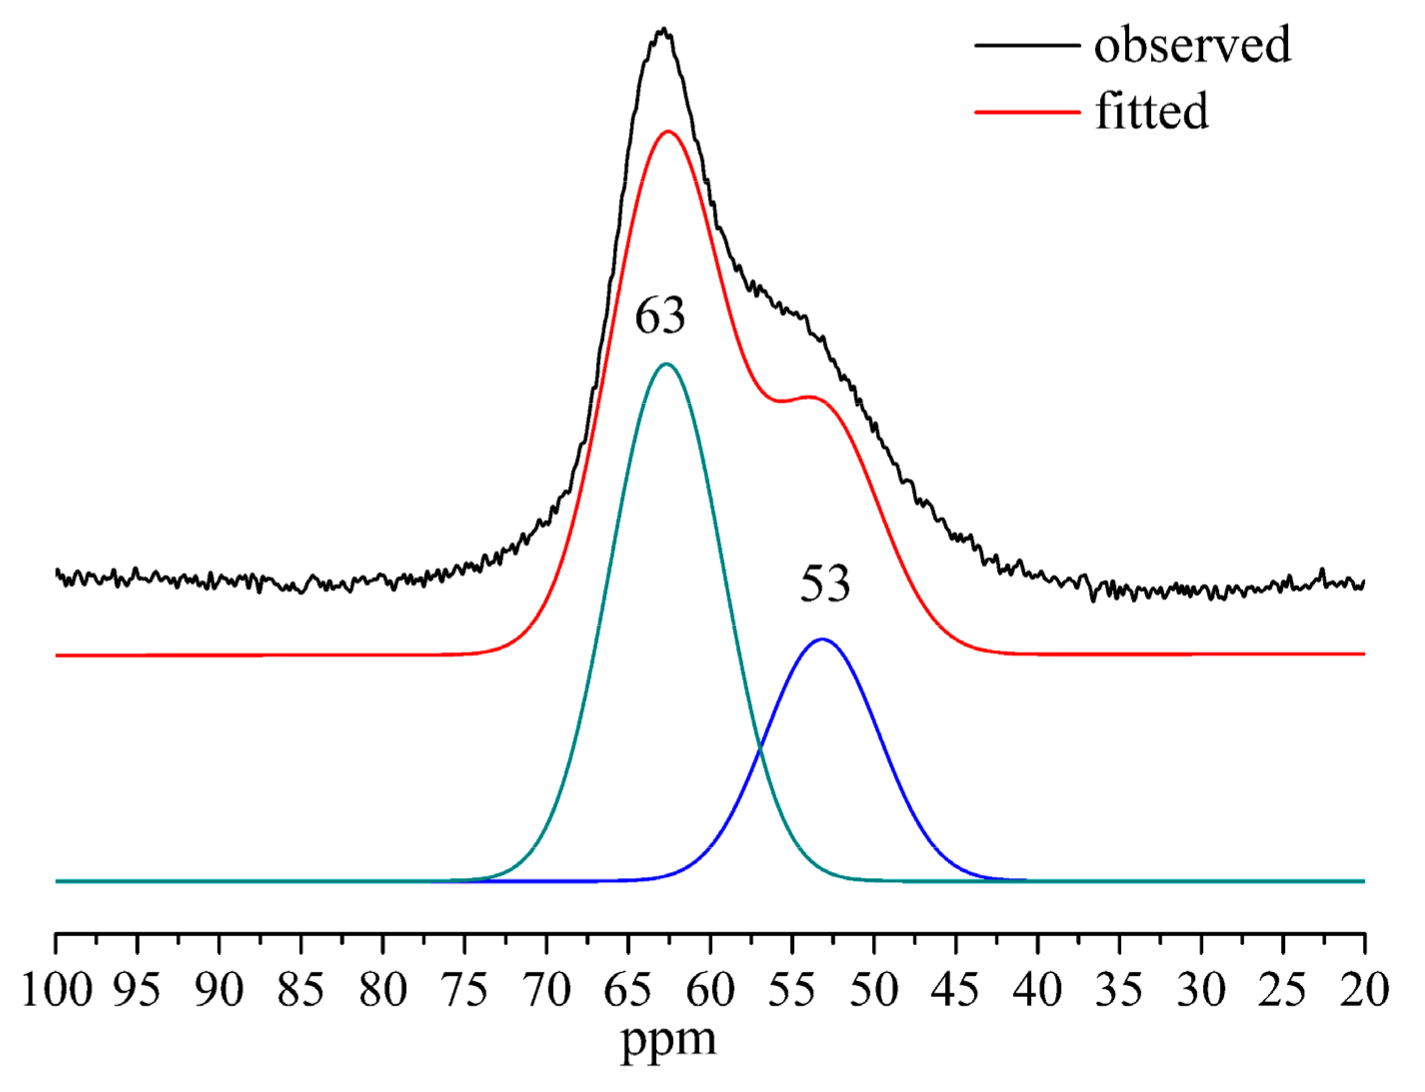
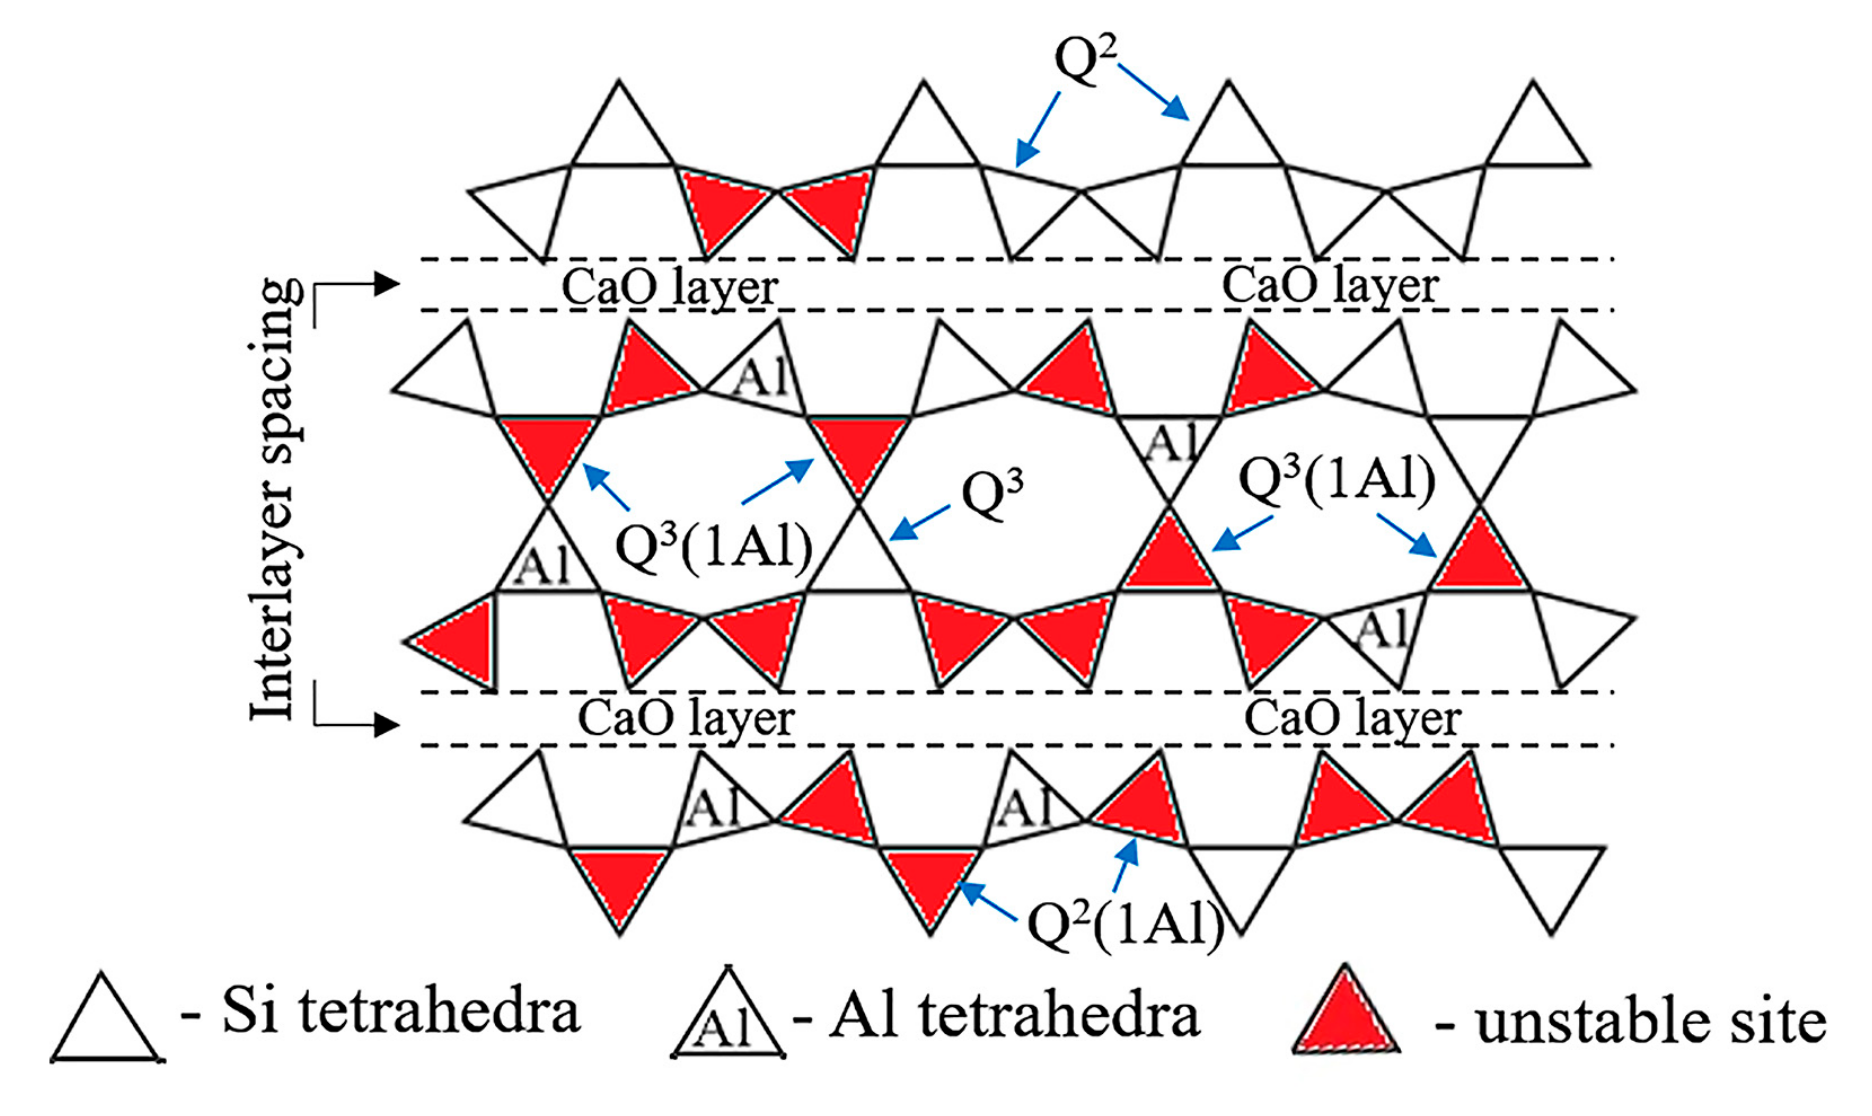
3.4. 29Si and 27Al MAS–NMR
3.5. Adsorption Capacity
4. Conclusions
Author Contributions
Funding
Conflicts of Interest
References
- Komarneni, S.; Komarneni, J.S.; Newalkar, B.; Stout, S. Microwave-hydrothermal synthesis of Al-substituted tobermorite from zeolites. Mater. Res. Bull. 2002, 37, 1025–1032. [Google Scholar] [CrossRef]
- Komrneni, S.; Roy, D.M.; Roy, R. Al-substituted tobermorite -shows cation exchange. Cem. Concr. Res. 1982, 6, 773–780. [Google Scholar] [CrossRef]
- Komarneni, S.; Roy, D.M. Tobermorites-a new family of cation exchangers. Science 1983, 4611, 647–648. [Google Scholar] [CrossRef] [PubMed]
- Qu, X.; Zhao, Z.; Zhao, X. Microstructure and characterization of aluminum-incorporated calcium silicate hydrates (C-S-H) under hydrothermal conditions. RSC Adv. 2018, 8, 28198–28208. [Google Scholar] [CrossRef]
- Mitra, N.; Sarkar, P.K.; Prasad, D. Intermolecular dynamics of ultraconfined interlayer water in tobermorite: Influence on mechanical performance. Phys. Chem. Chem. Phys. 2019, 21, 11416–11423. [Google Scholar] [CrossRef]
- Paradiso, P.; Santos, R.L.; Horta, R.B.; Lopes, J.N.C.; Ferreira, P.J.; Colaço, R. Formation of nanocrystalline tobermorite in calcium silicate binders with low C/S ratio. Acta Mater. 2018, 152, 7–15. [Google Scholar] [CrossRef]
- Luo, F.; Wei, C.; Xue, B.; Wang, S.; Jiang, Y. Dynamic hydrothermal synthesis of Al-substituted 11 Å tobermorite from solid waste fly ash residue-extracted Al2O3. Res. Chem. Intermed. 2013, 39, 693–705. [Google Scholar] [CrossRef]
- Youssef, H.; Ibrahim, D.; Komarneni, S.; Mackenzie, K.J.D. Synthesis of 11 Å Al-substituted tobermorite from trachyte rock by hydrothermal treatment. Ceram. Int. 2010, 36, 203–209. [Google Scholar] [CrossRef]
- Smalakys, G.; Siauciunas, R. The synthesis of 1.13 nm tobermorite from carbonated opoka. J. Therm. Anal. Calorim. 2018, 134, 493–502. [Google Scholar] [CrossRef]
- Bernstein, S.; Fehr, K.T. The formation of 1.13 nm tobermorite under hydrothermal conditions: 1. the influence of quartz grain size within the system CaO-SiO2-D2O, Prog. Cryst. Growth Charact. Mater. 2012, 58, 84–91. [Google Scholar] [CrossRef]
- Jauberthie, R.; Temimi, M.; Laquerbe, M. Hydrothermal transformation of tobermorite gel to 10 Å tobermorite. Cem. Concr. Res. 1996, 26, 1335–1339. [Google Scholar] [CrossRef]
- Wang, Z.; Ma, S.; Zheng, S.; Wang, X. Incorporation of Al and Na in Hydrothermally Synthesized Tobermorite. J. Am. Ceram. Soc. 2017, 100, 792–799. [Google Scholar] [CrossRef]
- Mutisya, S.M.; Miranda, C.R. The surface stability and morphology of tobermorite 11Å from first principles. Appl. Surf. Sci. 2018, 444, 287–292. [Google Scholar] [CrossRef]
- Guo, X.; Meng, F.; Shi, H. Microstructure and characterization of hydrothermal synthesis of Al-substituted tobermorite. Constr. Build. Mater. 2017, 133, 253–260. [Google Scholar] [CrossRef]
- Jackson, M.D.; Moon, J.; Gotti, E.; Taylor, R.; Chae, S.R.; Kunz, M.; Emwas, A.H.; Meral, C.; Guttmann, P.; Levitz, P.; et al. Material and elastic properties of Al-tobermorite in ancient roman seawater concrete. J. Am. Ceram. Soc. 2013, 96, 2598–2606. [Google Scholar] [CrossRef]
- Chappex, T.; Scrivener, K.L. The effect of aluminum in solution on the dissolution of amorphous silica and its relation to cementitious systems. J. Am. Ceram. Soc. 2013, 96, 592–597. [Google Scholar] [CrossRef]
- Hou, D.; Li, Z. Molecular dynamics study of water and ions transport in nano-pore of layered structure: A case study of tobermorite. Microporous Mesoporous Mater. 2014, 195, 9–20. [Google Scholar] [CrossRef]
- Faucon, P.; Petit, J.C.; Charpentier, T.; Jacquinot, J.F.; Adenot, F. Silicon Substitution for Aluminum in Calcium Silicate Hydrates. J. Am. Ceram. Soc. 1999, 82, 1307–1312. [Google Scholar] [CrossRef]
- Komarneni, S.; Roy, R.; Roy, D.M.; Fyfe, C.A.; Kennedy, G.J.; Bothner-By, A.A.; Dadok, J.; Chesnick, A.S. 27Al and29Si magic angle spinning nuclear magnetic resonance spectroscopy of Al-substituted tobermorites. J. Mater. Sci. 1985, 20, 4209–4214. [Google Scholar] [CrossRef]
- Black, L.; Stumm, A.; Garbev, K.; Stemmermann, P.; Hallam, K.R.; Allen, G.C. X-ray photoelectron spectroscopy of aluminium-substituted tobermorite. Cem. Concr. Res. 2005, 35, 51–55. [Google Scholar] [CrossRef]
- Huang, X.; Jiang, D.; Tan, S. Novel hydrothermal synthesis method for tobermorite fibers and investigation on their thermal stability. Mater. Res. Bull. 2002, 37, 1885–1892. [Google Scholar] [CrossRef]
- Guo, X.; Song, M. Micro-nanostructures of tobermorite hydrothermal-synthesized from fly ash and municipal solid waste incineration fly ash. Constr. Build. Mater. 2018, 191, 431–439. [Google Scholar] [CrossRef]
- Guo, X.; Meng, F. Microstructure of Hydrothermally Synthesized Fly Ash- based Tobermorite Doped with Aluminum. Chin. J. Mater. Res. 2018, 32, 513–517. [Google Scholar] [CrossRef]


| ppm | −78 | −82 | −88 | −93 |
|---|---|---|---|---|
| Si Sites | Q1, Q2(1Al) | Q2 | Q3(1Al) | Q3 |
| Al/(Al + Si) = 0 | 20.96% | 66.56% | - | 12.48% |
| Al/(Al + Si) = 0.1 | 19.85% | 57.29% | 13.44% | 9.43% |
| Al/(Al + Si) = 0.2 | 39.03% | 47.47% | 11.60% | 1.90% |
| - | Mass of Samples (g) | Volume of NaOH Solution (μL) | R(Na+) (mg/L) | c(Na+) (mol/L) | Adsorption Capacity (mmol/g) |
|---|---|---|---|---|---|
| NaOH solution | - | 1200 | 8.5 | 0.55 | - |
| Al/(Al + Si) = 0 | 0.1509 | 1200 | 6.7 | 0.43 | 0.95 |
| Al/(Al + Si) = 0.15 | 0.1504 | 1200 | 5.9 | 0.38 | 1.37 |
© 2019 by the authors. Licensee MDPI, Basel, Switzerland. This article is an open access article distributed under the terms and conditions of the Creative Commons Attribution (CC BY) license (http://creativecommons.org/licenses/by/4.0/).
Share and Cite
Liao, W.; Li, W.; Fang, Z.; Lu, C.; Xu, Z. Effect of Different Aluminum Substitution Rates on the Structure of Tobermorite. Materials 2019, 12, 3765. https://doi.org/10.3390/ma12223765
Liao W, Li W, Fang Z, Lu C, Xu Z. Effect of Different Aluminum Substitution Rates on the Structure of Tobermorite. Materials. 2019; 12(22):3765. https://doi.org/10.3390/ma12223765
Chicago/Turabian StyleLiao, Wei, Wenqing Li, Zhenggang Fang, Chunhua Lu, and Zhongzi Xu. 2019. "Effect of Different Aluminum Substitution Rates on the Structure of Tobermorite" Materials 12, no. 22: 3765. https://doi.org/10.3390/ma12223765