4.1. Mineralogical, Chemical and Petrographic Studies
The mineralogy obtained by XRD shows calcite and quartz to be the most abundant mineral phases in all mortars, although in different relative amounts. Sample CI-T-9 displays the highest quartz content. Feldspars and phyllosilicates are present in all samples but in minor amounts. Only Samples CI-T-9 and CI-TE-9 contain iron oxides (hematite and goethite) corresponding to the rock fragments used as aggregates (
Table 2).
Table 3 shows the quantitative chemical results of major elements determined by X-ray fluorescence. The chemical composition is in accordance with the identified mineral phases. High values of Si in all samples are related to such silicates as quartz, phyllosilicates and feldspars. In fact, sample CI-T-9 shows the highest SiO
2 value (~41 wt %) corresponding to a quartz-enriched sample. On the contrary sample CI-M-3 has the lowest SiO
2 value (~32 wt %). The high Ca content is mainly due to the presence of calcite, as well as the LOI value. CI-M-3 sample shows the highest CaO (~32 wt %) and LOI values (~29 wt %), indicating the major content of calcite in this sample. On the contrary, samples CI-T-9, CI-T-10 and CI-T-11 have the lowest Ca values (~26 wt %), indicating low carbonate content. Samples CI-M-3, CI-T-9, CI-T-10 and CI-T-11 display the highest Al, K, Mg and Ti values related to the relatively high phyllosilicate contents. Iron content is related to the presence of iron oxides/hydroxides (i.e., hematite and goethite) and phyllosilicates and the highest values correspond to samples with high Al, K, Mg and Ti values (i.e., samples CI-M-3, CI-T-9, CI-T-10 and CI-T-11).
Textural and mineralogical differences of mortars imply variations in the hydric characteristics since the pore system could vary [
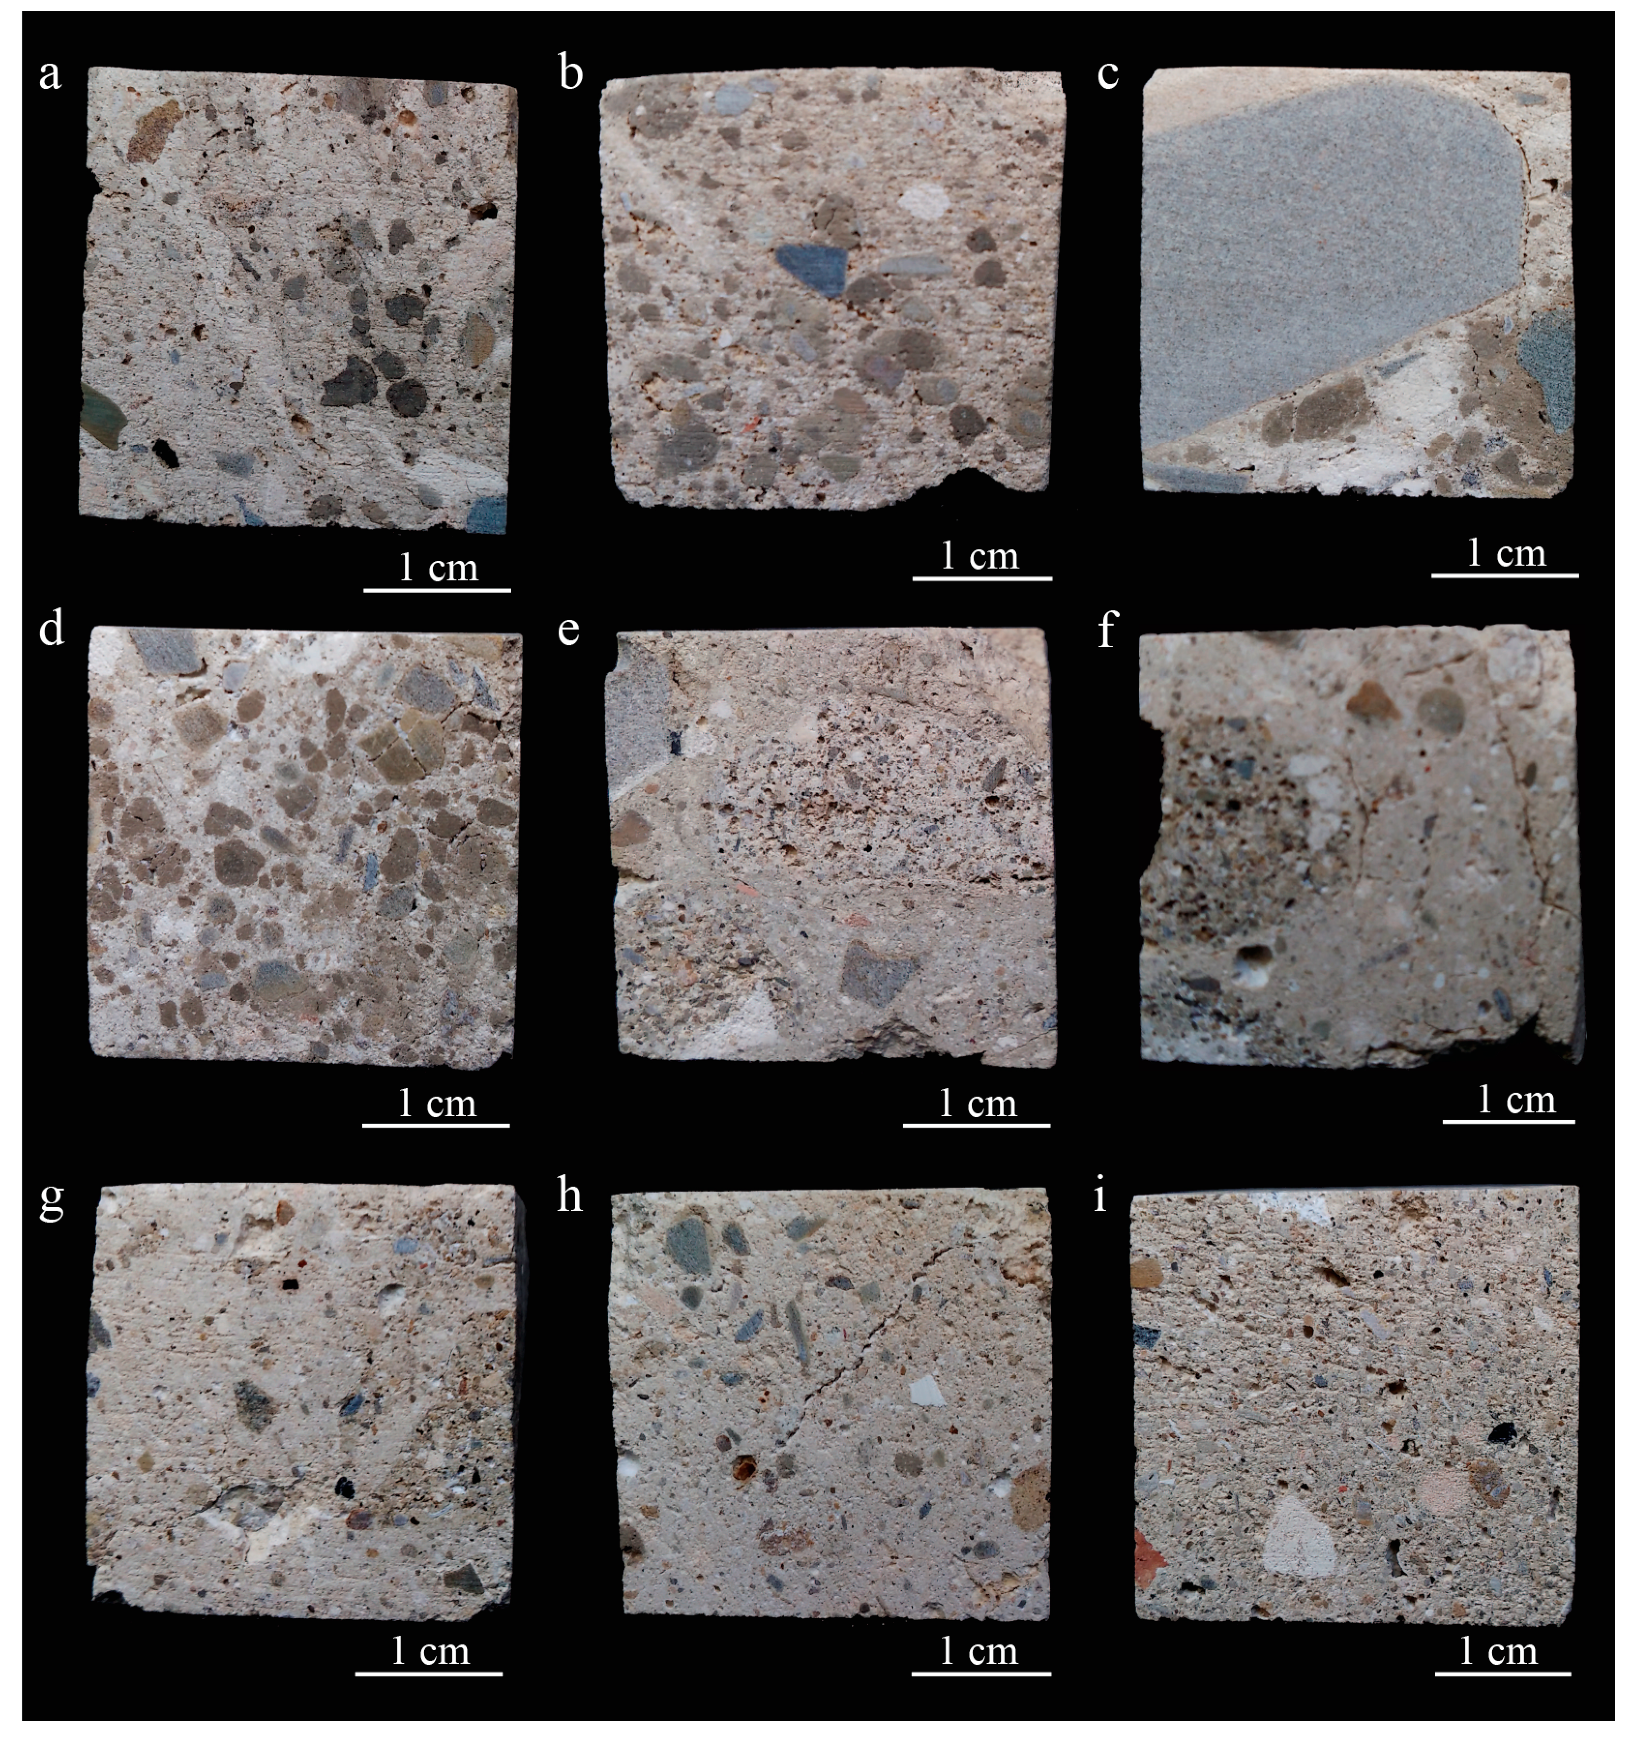
41]. Macroscopically all samples show a heterogeneous texture both in aggregate size and nature (
Figure 3a,b). Nevertheless, some samples contain aggregates that are bigger in size (
Figure 3c) and in large amounts (
Figure 3d) particularly in the case of Sample CI-T-9. Reused mortar fragments more than 1 cm in size (
Figure 3e–g) and cracks can also be seen with the naked eye (
Figure 3h). Within the heterogeneous texture of mortar samples, CI-M-3 has fewer aggregates in a more homogeneous texture compared with the other samples (
Figure 3i). Porosity at the edge of larger aggregates can be observed (
Figure 3c).
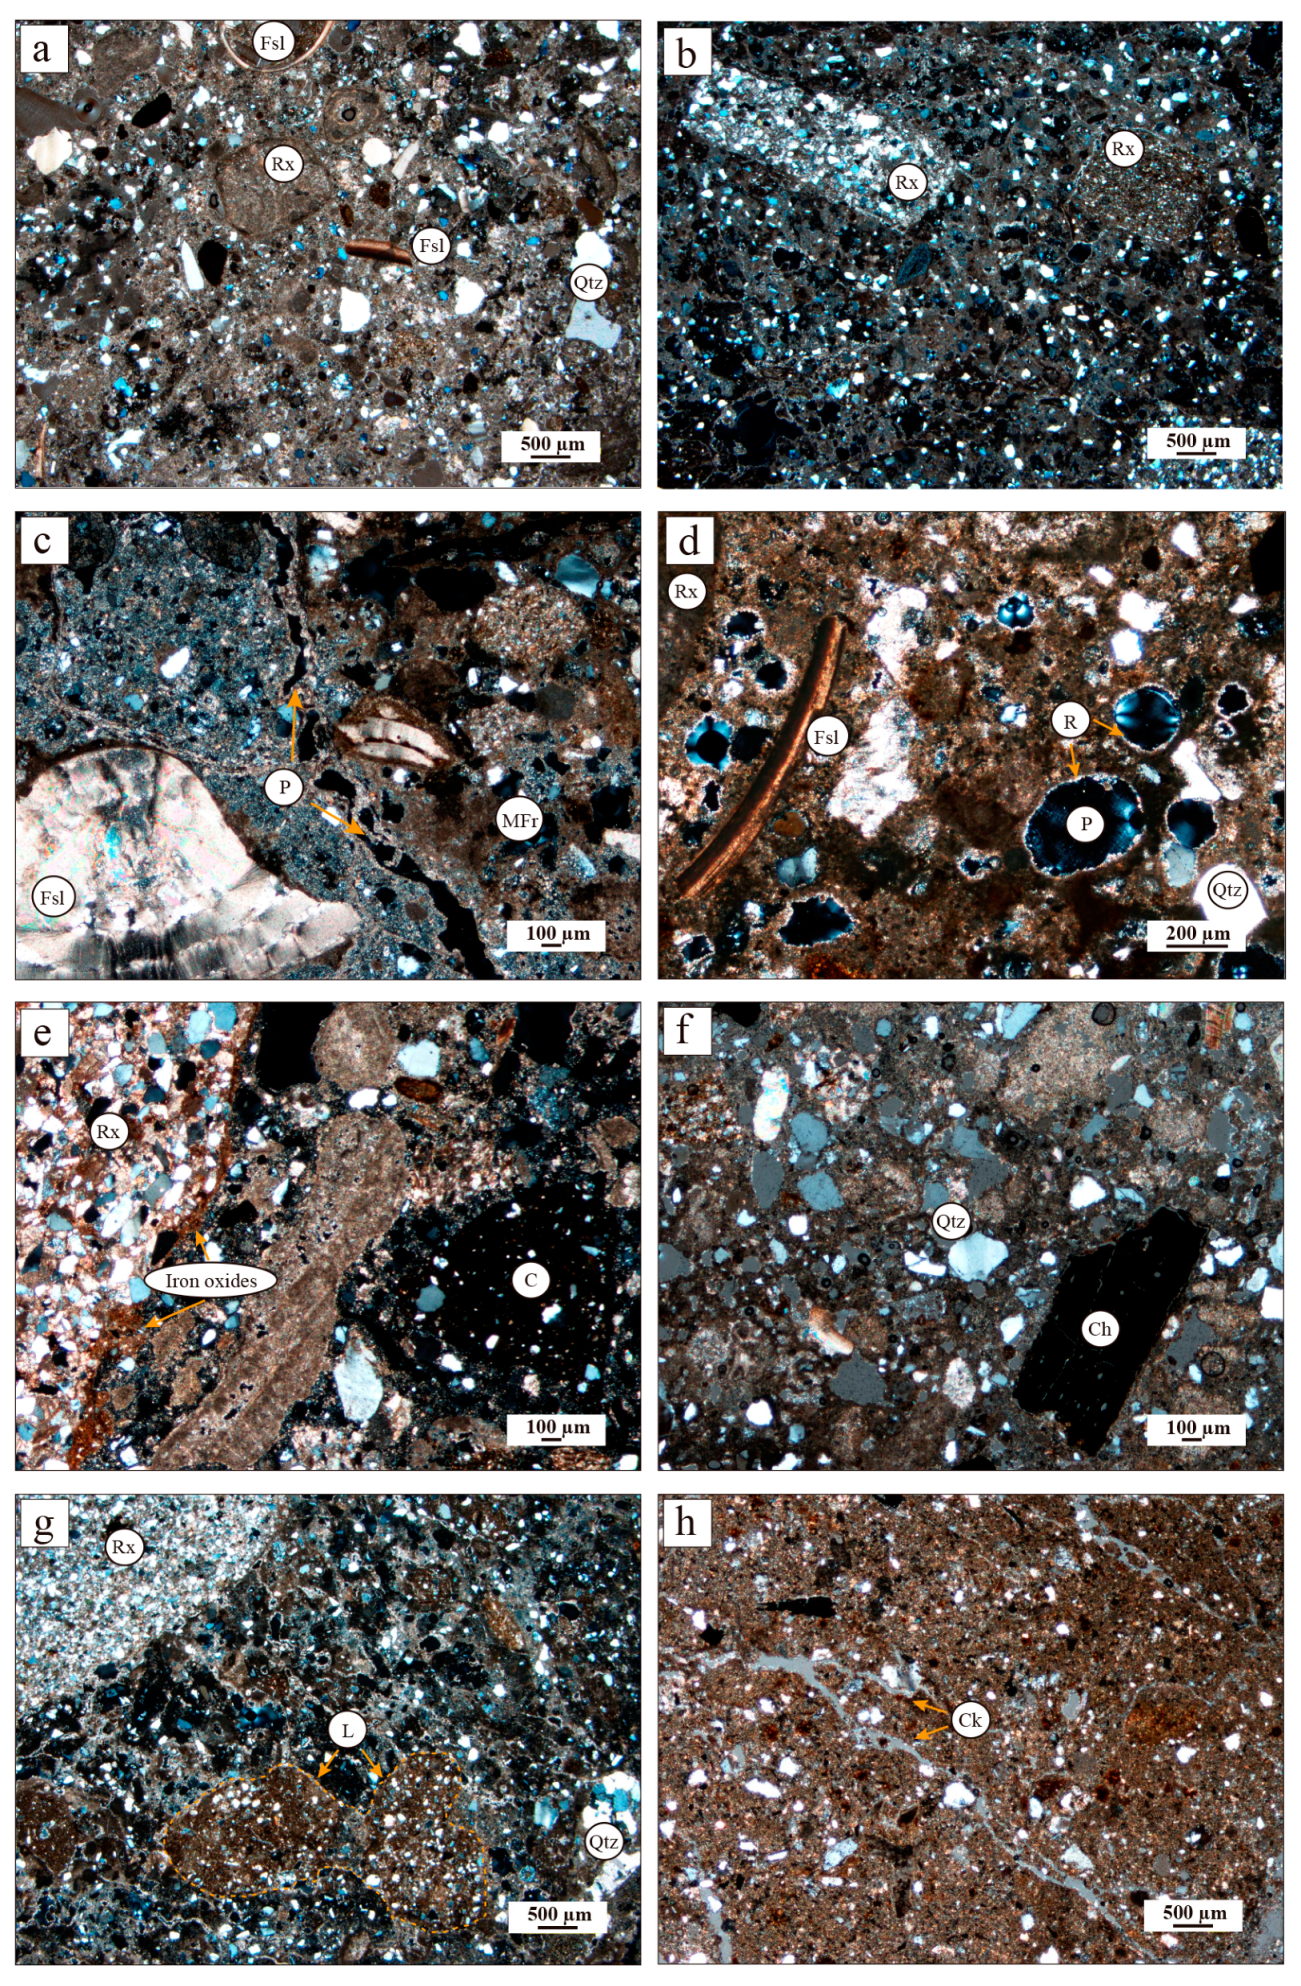
The petrographic study improves the observed macroscopic features. Microscopically all the samples also exhibit heterogeneous texture (
Figure 4). The matrix is formed by micritic calcite. Aggregates consist of heterometric and angular to subangular detrital quartz, sandstone, marl and calcarenite rock fragments (
Figure 4a,b). A great variety of bioclast fragments (echinoderm plates, foraminifers and molluscs) are present due to the crushing of the rocks used as aggregate (
Figure 4c,d). The quartz grains range from 0.05 µm to 0.25 µm in size. The smaller rock fragments are subangular while the largest are rounded (
Figure 4b,e). Some sandstone fragments contain iron oxides (
Figure 4e). Rounded ceramic fragments < 1 mm in size and charcoal fragments can also be seen dispersed in the matrix (
Figure 4e,f). In samples CI-T-11, CI-T-12 and CI-TE-9, reused mortar fragments of <2 cm in grain size have also been observed (
Figure 4c). Heterometric quartz-bearing lime lumps can be observed within the binder matrix (
Figure 4g). The pores in the matrix are irregularly shaped and <200 µm in size and some show recrystallizations of secondary calcite inside (
Figure 4d). Porosity at the edge of some aggregates can also be observed microscopically (
Figure 4c). Samples CI-T-11, CI-T-12, CI-TE-8 and CI-TE-9 display microcracks in the matrix (
Figure 4h). Sample CI-M-3 is characterised by fewer sandstone fragments and a more homogeneous texture compared with the rest of the samples.
The petrographic characteristics confirm the mineralogical and chemical composition of mortars. Samples with a large number of sandstone fragments correspond to the samples with the highest silica content. The matrix-supported texture of samples and the presence of fossils and calcareous rock fragments explain the high Ca content and the calcite identified by XRF and XRD, respectively. Sample CI-M-3 shows the lowest siliceous aggregate content as well as the highest presence of calcite as reflected in the Ca and LOI content obtained by chemical analysis (
Table 2). The iron contents are associated with hematite and goethite present in sandstones and with the phyllosilicates in the matrix. The iron phases were not detected by XRD in most samples since the content is under the detection limit of the analytical method.
4.2. Pore System and Hydric Behaviour
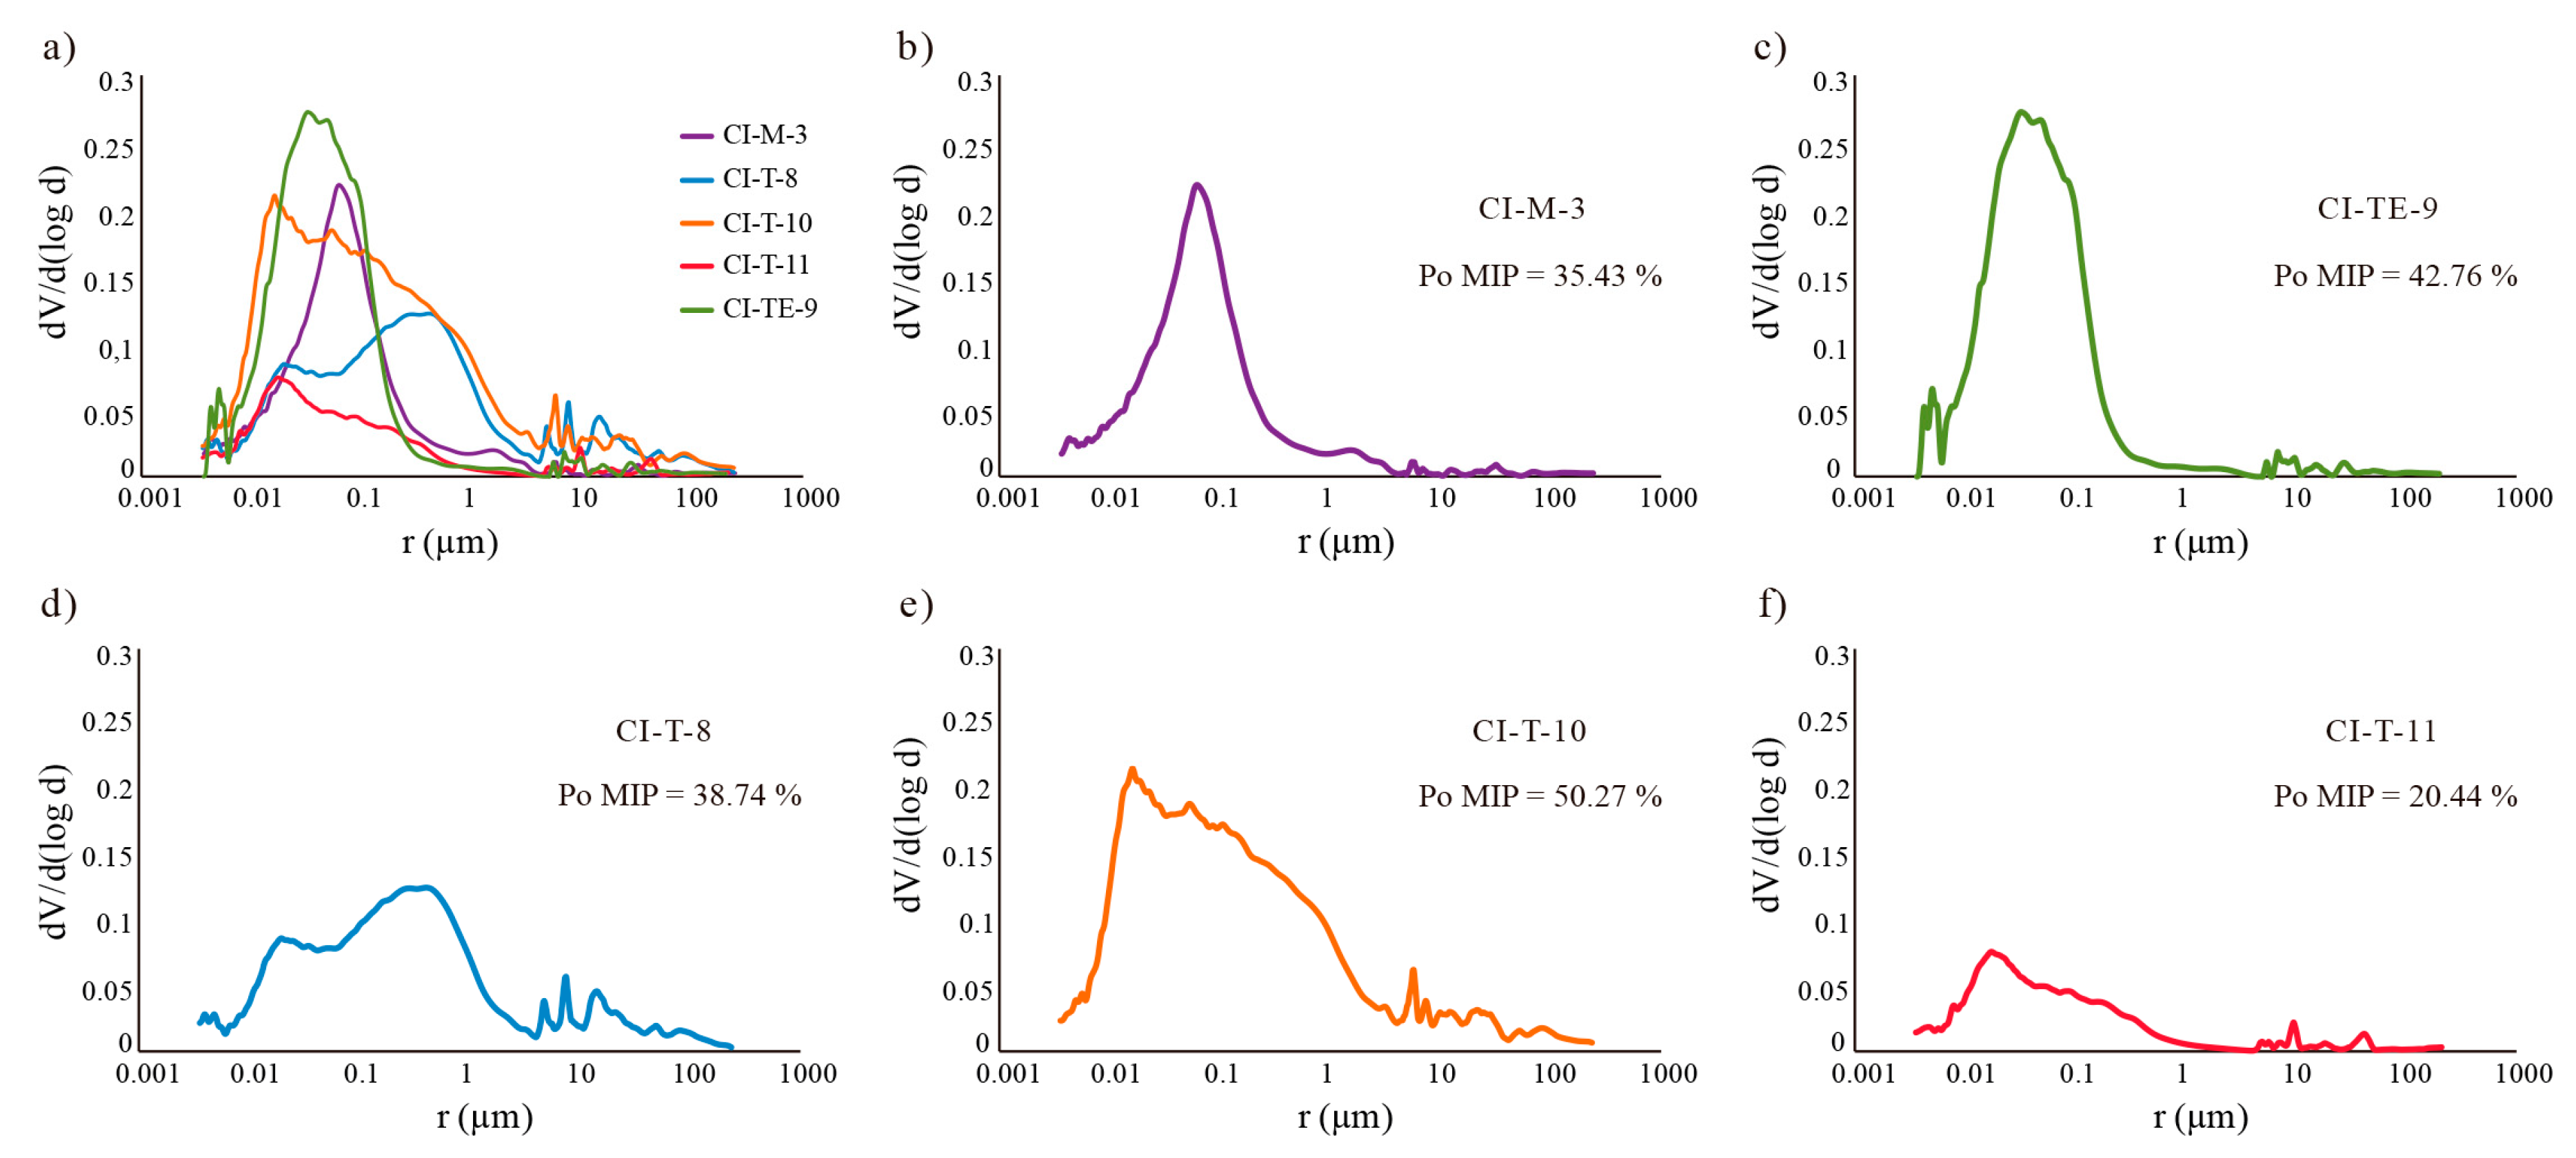
Mercury intrusion porosimetry (MIP) values are summarised in
Table 4. Samples CI-T-10 and CI-TE-9 show the highest porosity values (50.27% and 42.76%, respectively). Samples CI-T-11 and CI-TE-8 have the lowest PMIP values (20.44% and 2.48%, respectively) due to the presence of coarse aggregate with low porosity, resulting in an anomalous MIP value. The small sample size required in the measurement could include coarse and low porous aggregates affecting the results.
Another fundamental characteristic of the pore system is the pore size distribution since the pore size affects the water circulation in the material [
42,
43]. MIP results indicate a large volume of small pores (0.01 < r < 1 μm) connected to larger pores (1 < r < 10 μm) in all samples (
Figure 5). In this type of network, larger pores empty first whereas smaller pores remain full of liquid and dry more slowly [
44]; therefore, the presence of two main families of pores strongly influences the drying behaviour of the material. However, pore size distribution is not the same in all samples (
Figure 5a). Samples CI-M-3 and CI-TE-9 possess a nearly unimodal size distribution ranging between 0.01 µm and 1 µm although a second smaller family of pores ranging between 1 µm and 10 µm can be observed (
Figure 5b,c). Sample CT-T-8 has a bimodal distribution of large pores of between 0.1 and 1 µm and a second smaller family between 0.01µm and 0.1 µm in size (
Figure 5d). Samples CI-T-10 and CI-T-11 have a more heterogeneous pore size distribution but the Sample CI-T-10 possesses a large pore volume (
Figure 5e,f).
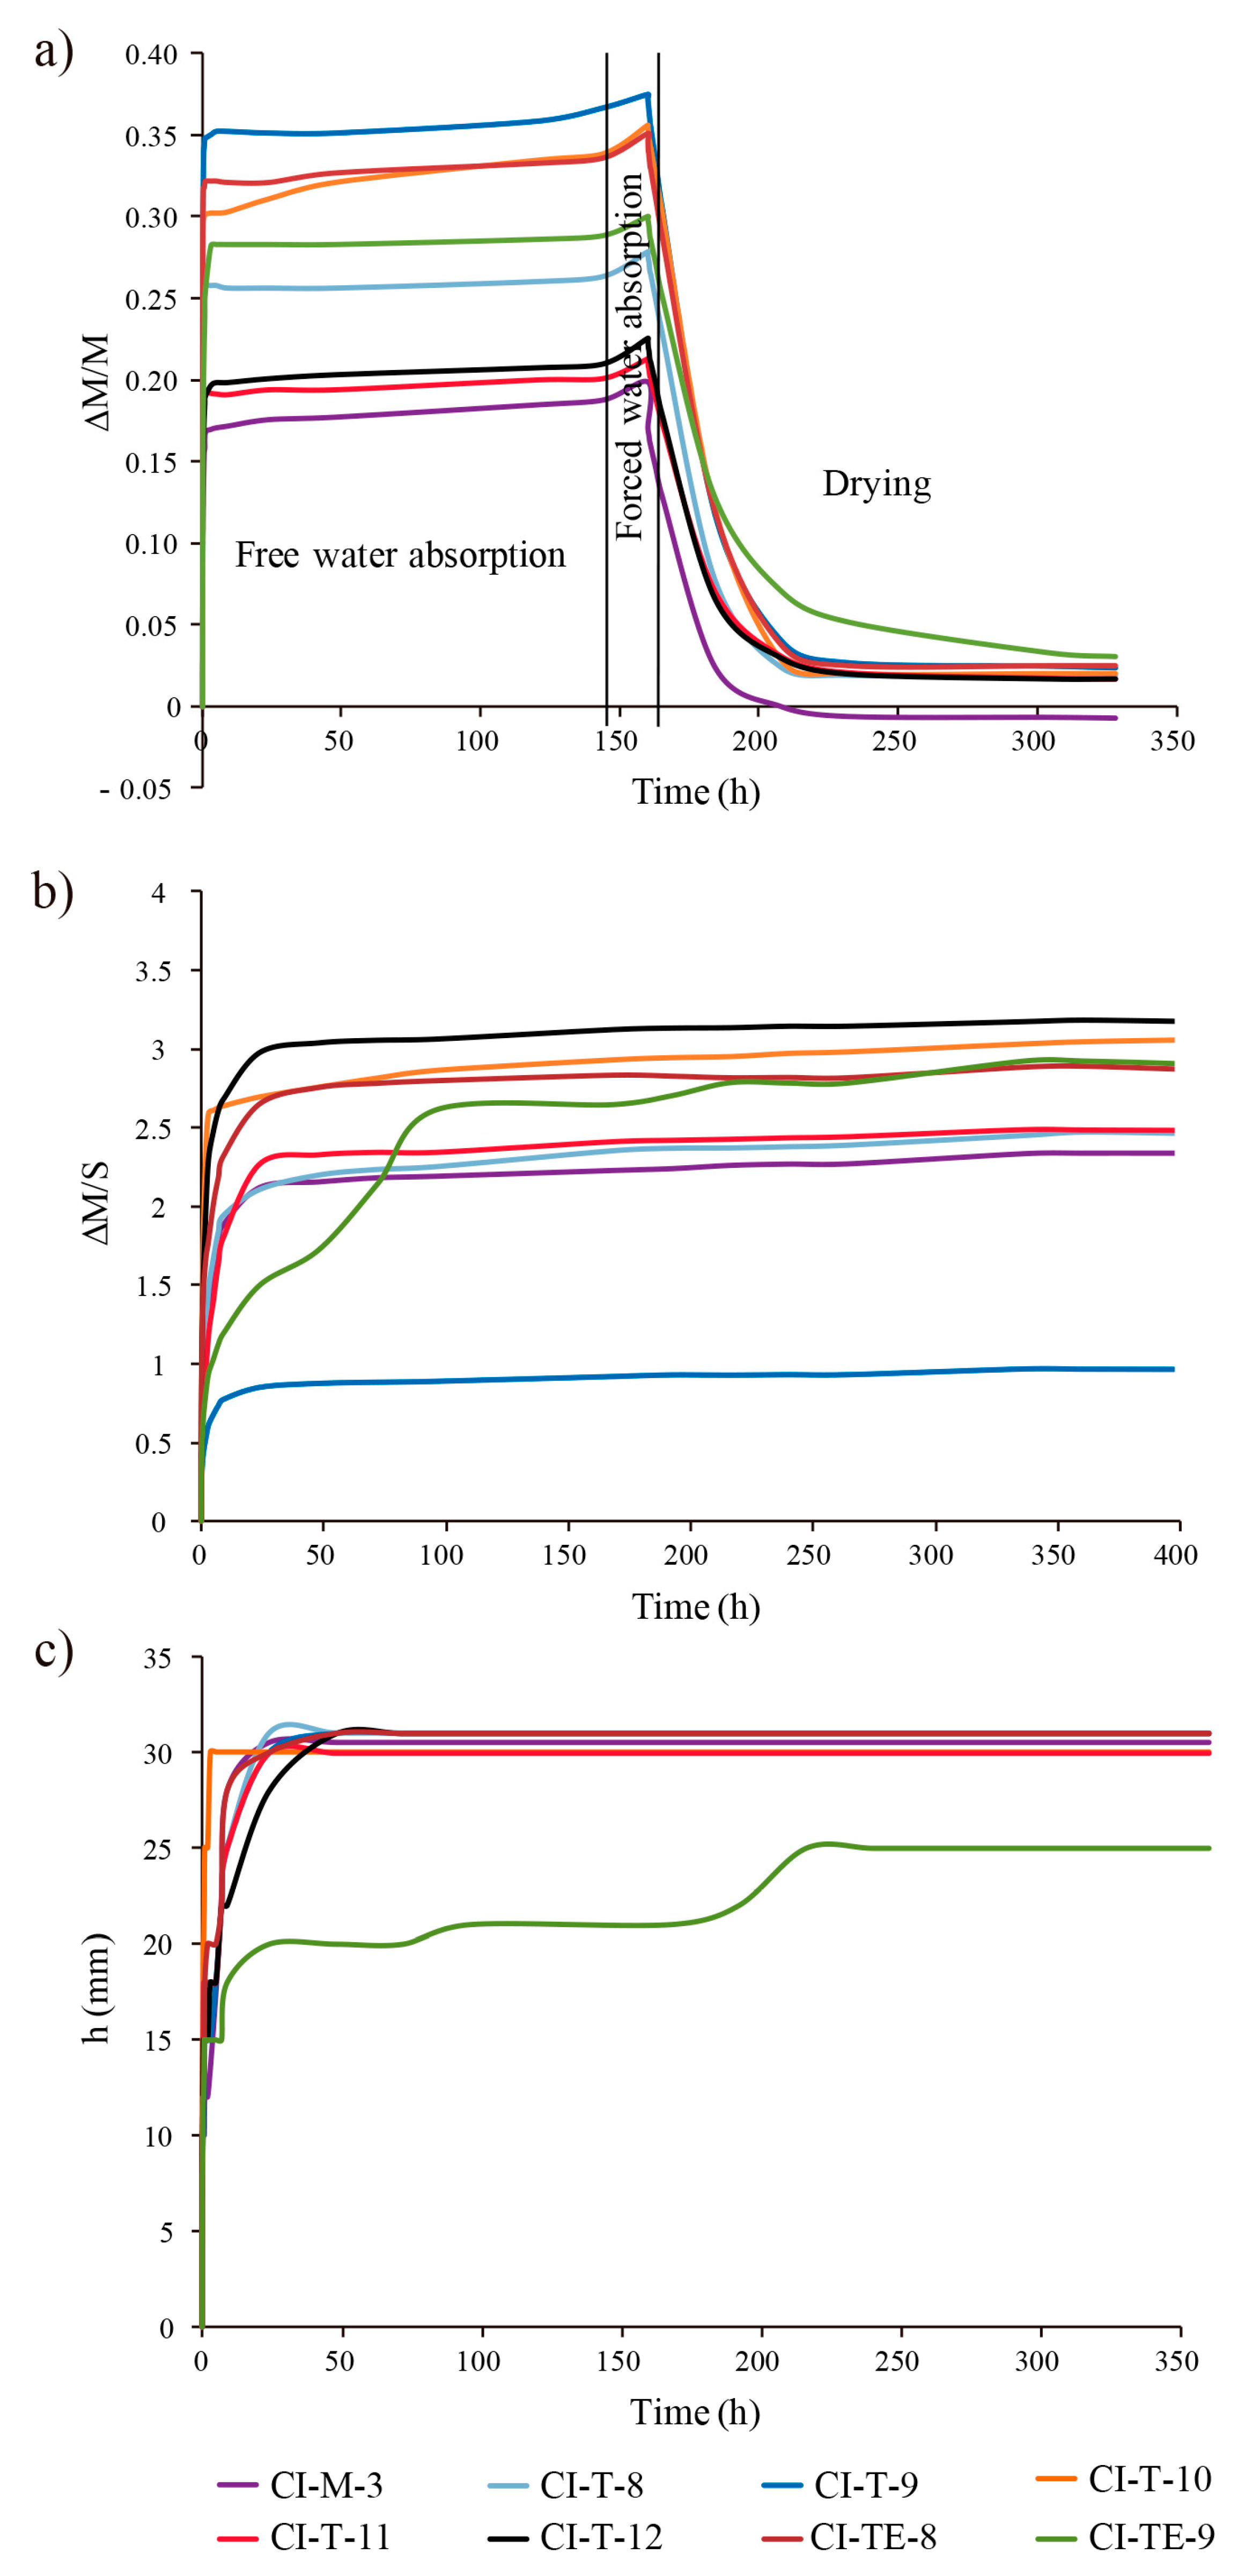
To complete the study on the pore system, hydric tests were also carried out (
Figure 6).
Table 4 shows the results of the hydric behaviour of mortar samples and their porosity accessible to water and mercury. Although the open porosity values obtained from the hydric tests (P
HT) and by mercury intrusion porosimetry (P
MIP) are very similar, the MIP values are always slightly higher. These differences are due to the fact that different liquids are used (H
2O and Hg, respectively) and at different pressures (atmospheric pressure in the hydric tests and an injection pressure of 414 MPa in MIP analysis). Open porosity (P
HT) has a direct effect on the durability of mortars because it allows water circulation within the structure favouring the entry of aggressive agents contained in the water. Therefore, the accessible porosity values are an important parameter to evaluate the possible deterioration of materials [
45]. Samples CI-T-9, CI-T-10, CI-TE-8 and CI-TE-9 present the highest open porosity values (P
HT > 40%) while CI-M-3 shows the lowest values (35.43%).
Samples CI-T-9, CI-T-10, CI-TE-8 and CI-TE-9 display the highest free water absorption (A
b, >28%) and forced water absorption (A
f, >30%) levels whereas sample CI-M-3 shows the lowest values (A
b = 18.80% and A
f = 19.90%). Samples CI-T-8, CI-T-11 and CI-T-12 have intermediate water absorption and forced water absorption values (
Table 4,
Figure 6a). The lowest degree of pore interconnection values (A
x) are in samples CI-T-10, CI-TE-8 and CI-TE-9 and, above all, in CI-T-9, indicating that water flows more easily inside mortars due to a better interconnection between the pores. On the contrary, CI-T-12 has the highest A
x values (almost 7%) indicating a more tortuous pore system hindering the flow of water inside the mortar (
Table 4). The saturation coefficient (S) is directly related to the interconnectivity of the pores. In fact, the higher values are in samples CI-T-9, CI-TE-8 and CI-TE-9 (>93%). The absorption coefficient (C
a) values are the highest (>15 g/min
0.5) in samples CI-T-9, CI-T-10 and CI-TE-8. This value together with the degree of interconnection affects the water content capacity.
During the drying, two different drying phases occur. In the first drying phase, the evaporation of water from the wet surface is constant (constant rate drying) and the porosity has no significant influence on the drying rate [
44,
46]. In the second phase, drying depends on the pore radii and the degree of interconnection. When drying goes from constant velocity to a decreasing velocity the critical moisture content is reached and the drying rate changes. Then the water loss depends on the movement of water towards the surface through the capillary pores (falling rate period) [
44,
47]. Drying velocity is given by the desorption index (D
i). Samples CI-T-9, CI-T-10 and CI-TE-8 present lower D
i values indicating fast drying, while CI-T-11, CI-T-12 and CI-TE-9 present with higher values took longer to dry (
Table 4). Samples showing lower D
i values correspond to samples with lower degree of pore interconnection (A
x) indicating that water flows easily outwards. On the contrary samples with high D
i and A
x values dry more slowly, indicating that water is retained longer in the mortar pore system, thus affecting its durability.
Regarding capillary uptake curves, samples absorb water quickly at the beginning of the test and as samples become saturated in water the velocity of capillary rise decreases and stabilizes reaching an equilibrium value (
Figure 6b), following the most common capillary rise trend found for lime mortars [
5]. The nonlineal curves showing two sections with different slopes are due to the presence of two main families of pores in the mortars [
48] as MIP analysis revealed (0.01 μm < r < 1 μm and 1 μm < r < 10 μm). Samples CI-T-10 and CI-TE-8 have high capillarity coefficient (C
C) values because they absorb water faster than samples CI-M-3 and CI-TE-9, which indeed show lower C
C values (
Table 4). The capillary front reached the top of all samples after 48 h except in Sample CI-TE-9 where water did not reach the top until 216 h (nine days) after the beginning of the test (
Figure 6c). However, this visual saturation does not coincide in time with the real saturation that occurs after 400 h (~16 days) (
Figure 6b,c). This delay confirms the presence of two families of pores, which are filled at different velocities by water (smaller pores are filled first). Saturation is achieved when all connected pores are filled.
Samples CI-M-3 and CI-T-11 show the highest values of both bulk (ρ
Hb) and skeletal (ρ
Hsk) density (
Table 4). Differences between skeletal and bulk densities are related to the porosity of mortars. This difference is greater in the more porous samples (CI-T-9, CI-T-10, CI-TE-8 and CI-TE-9).
4.3. Nondestructive Tests
Table 5 summarizes the ultrasound measurements in mortar samples. Considering lime mortar as an ideal two-phase media of aggregate embedded in a calcitic matrix, V
p values depend on the wave velocity both in the matrix and the aggregates, since ultrasonic wave propagation is different in each phase. The V
p decreases considerably when the wave propagates from an aggregate to the matrix [
49]. No relationship between the V
p and aggregate size has not been found probably because aggregates act as a homogeneous structure considering size a constant parameter [
50]. However, aggregate mineralogy is important in ultrasonic wave propagation velocity [
51]. In fact, waves propagate more quickly through calcite (approximately 6660 m/s) than through quartz (approximately 5800 m/s) [
52]. Therefore, P-wave velocity is directly related to the petrographic characteristic of the mortar. V
p values decrease in all mortar samples due to the presence of a large amount of siliceous aggregates, except in Sample CI-M-3, which contains the lowest amount of aggregates. Porosity also affects the ultrasonic wave propagation velocity since when the wave propagates from a solid (aggregates or matrix) through a gaseous medium (pores) the ultrasonic wave propagation velocity decreases [
15]. Ultrasound data, indeed, are in agreement with the above-mentioned porosity results (
Table 4 and
Table 5). The presence of small cracks also affects V
p, causing a fall in velocity [
53], as in samples CI-T-11, CI-T-12, CI-TE-8 and CI-TE-9.
The total anisotropy coefficient of P-waves (ΔM
p) confirms the textural homogeneity of CI-M-3 sample and the textural heterogeneity of the rest of the samples. Sample CI-M-3 gave the lowest ΔM
p value and sample CI-T-9 the highest (
Table 5).
The chromatic parameters of each mortar are summarised in
Table 6. Colorimetric analyses showed that the lightness value (L*) was lower for samples CI-M-3, CI-T-9, CI-T-10 and CI-T-11, while samples CI-T-12, CI-TE-8 and CI-TE-9 show the higher L* values. The chromatic axes (a* and b*) values tend towards to the light grey field due to a luminosity value close to 80. The a* values are very similar in all samples except for Sample CI-M-3 which presents the highest values. Samples CI-T-12 and CI-TE-9 have the lowest b* values. Lower L* is due to the presence of aggregates, phyllosilicate phases and iron oxides, as petrographic and XRD analyses indicate.
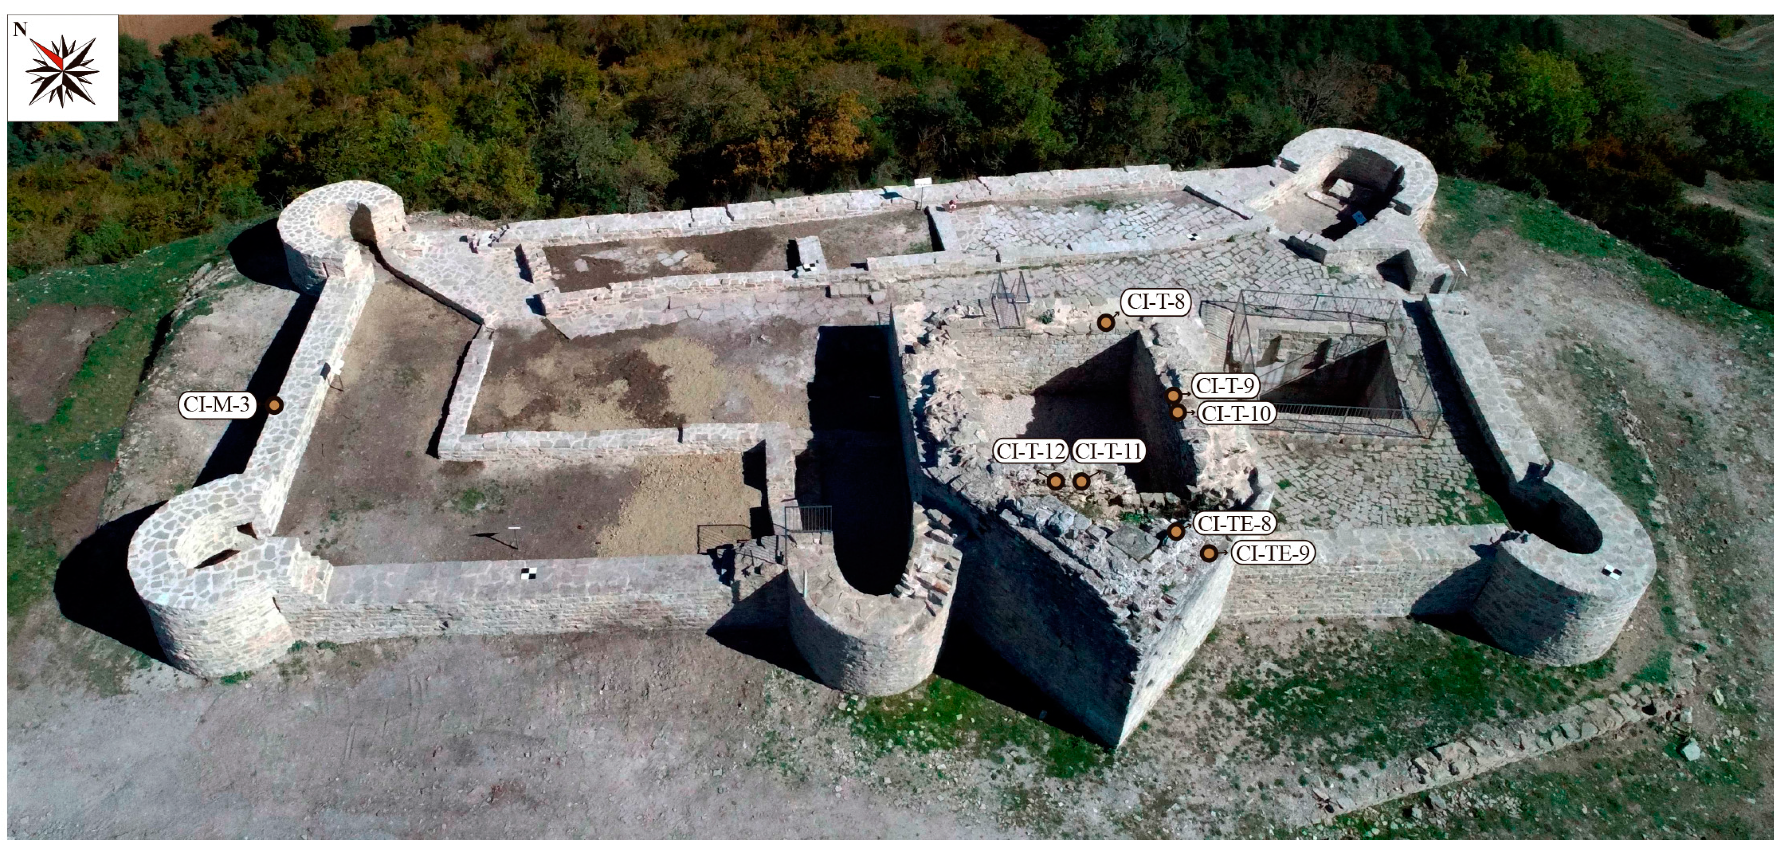
According to the measured parameters, samples CI-T-9, CI-T-10, CI-TE-8 and CI-TE-9 (South-Southeast face of the Tower Keep) present the highest free water absorption values (Ab > 25%), high porosity values (PHT and PMIP > 40%) with good pore interconnection (lowest Ax values), favouring the incorporation of dissolved salts and gaseous species such as CO2 into the material that could deteriorate the mortar. Samples CI-T-11 and CI-T-12 (Southwest wall of the Tower Keep) display the worst pore interconnection (higher Ax values) and dry more slowly (higher Di values), indicating a longer water retention also affecting mortar durability. Only sample CI-M-3 from the West perimeter wall shows less potential of deterioration due to the low free water absorption values (Ab < 19%), fast drying and lower porosity (PHT and PMIP ~32%).
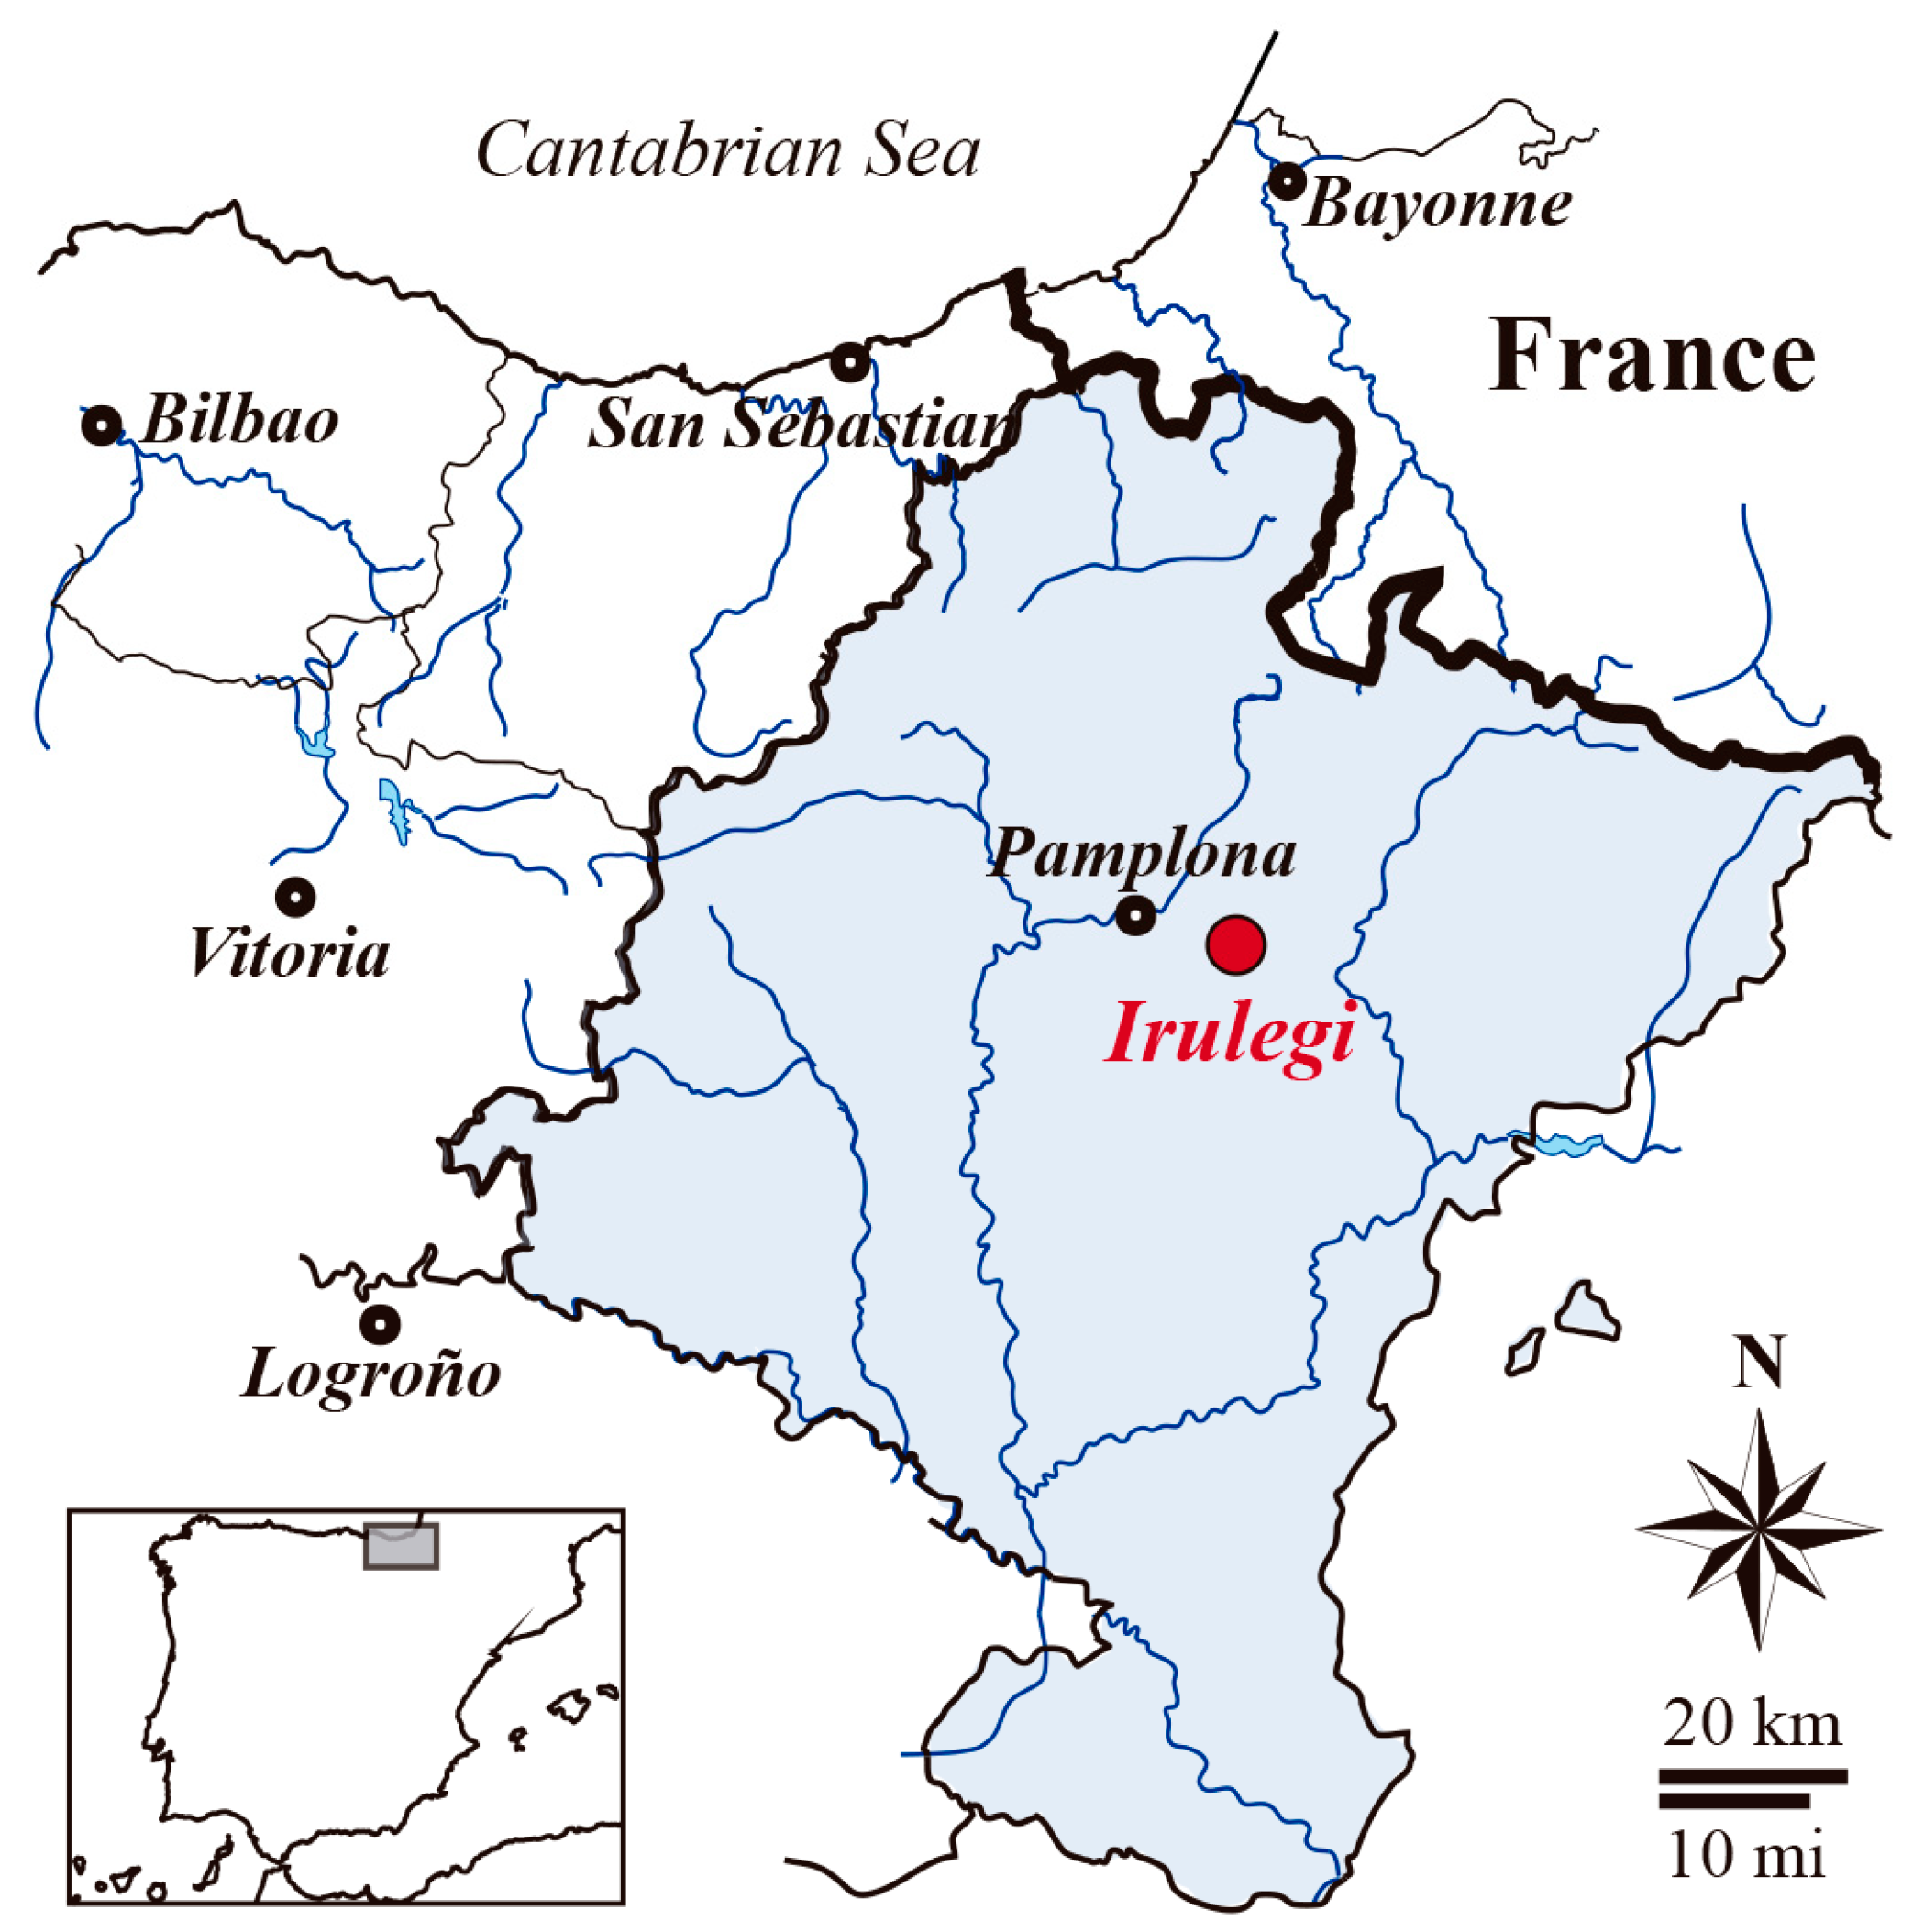
Additionally, environmental factors condition mortar durability due to the presence of water both as humidity (water vapour) and as rainfall (liquid water). The climatic conditions at Irulegi Castle favour mortar deterioration since the average annual precipitation is around 858 mm and in 10 months rainfall is above 50 mm. The annual average humidity is ~76% but in summer periods the humidity is higher than the average values. Moreover, the average temperature is 11.8 °C but the absolute average minimum and maximum temperatures are −12.4 °C and 39.9 °C, respectively [
54]. The wide variation between absolute maximum and minimum temperature together with the high humidity favour the physical weathering of mortars. Material exposure to temperature variations leads to thermal expansion and temperatures below freezing result in frost wedging causing cracking of mortars. Additionally, the persistent rainfall favours dissolved salts and CO
2 incorporation into the mortars producing crystal growth and carbonate species dissolution, respectively.

 ,
, 


