A Comparative Study of Experimental Configurations in Synchrotron Pair Distribution Function


Abstract
:1. Introduction
2. Materials and Methods
2.1. Samples Preparation
- (a)
- Crystalline nickel was used as a standard. This was a commercial powder sample (99.9%, 3–7 μm of average particle size) purchased from Strem Chemical INC.
- (b)
- Stoichiometric triclinic tricalcium silicate, Ca3SiO5, was purchased from Mineral Research Processing (M.R.PRO) and it was a single crystalline complex phase.
- (c)
- Doped dicalcium silicate, Ca2Si0.972Al0.028O3.986□0.014, was synthesized as described in Reference [30] to stabilized the monoclinic structure at room temperature. This sample, labeled hereafter as Ca2SiO4, was composed mainly by β-Ca2SiO4 but it contains about 10 wt.% of γ-Ca2SiO4, see below.
- (d)
- Stoichiometric ye’elimite, Ca4Al6O12SO4, mixed with bassanite, CaSO4·0.5H2O, was hydrated at a water-to-solid (w/s) mass ratio of 1.2 for 14 days. The resulting sample was already reported in a previous publication [13]. The sample is a mixture of crystalline ettringite and a nanocrystalline gibbsite.
- (e)
- Monoclinic tricalcium silicate was purchased from Mineral Research Processing (M.R.PRO). This commercial sample was already described in Reference [13]. As reported, the sample was hydrated with w/c ratio of 0.8 for 34 days. The sample was a mixture of crystalline portlandite and a nanocrystalline C–S–H gel containing a small fraction of unreacted tricalcium silicate.
2.2. Total Scattering Synchrotron X-ray Powder Diffraction (SXRPD)
- (a)
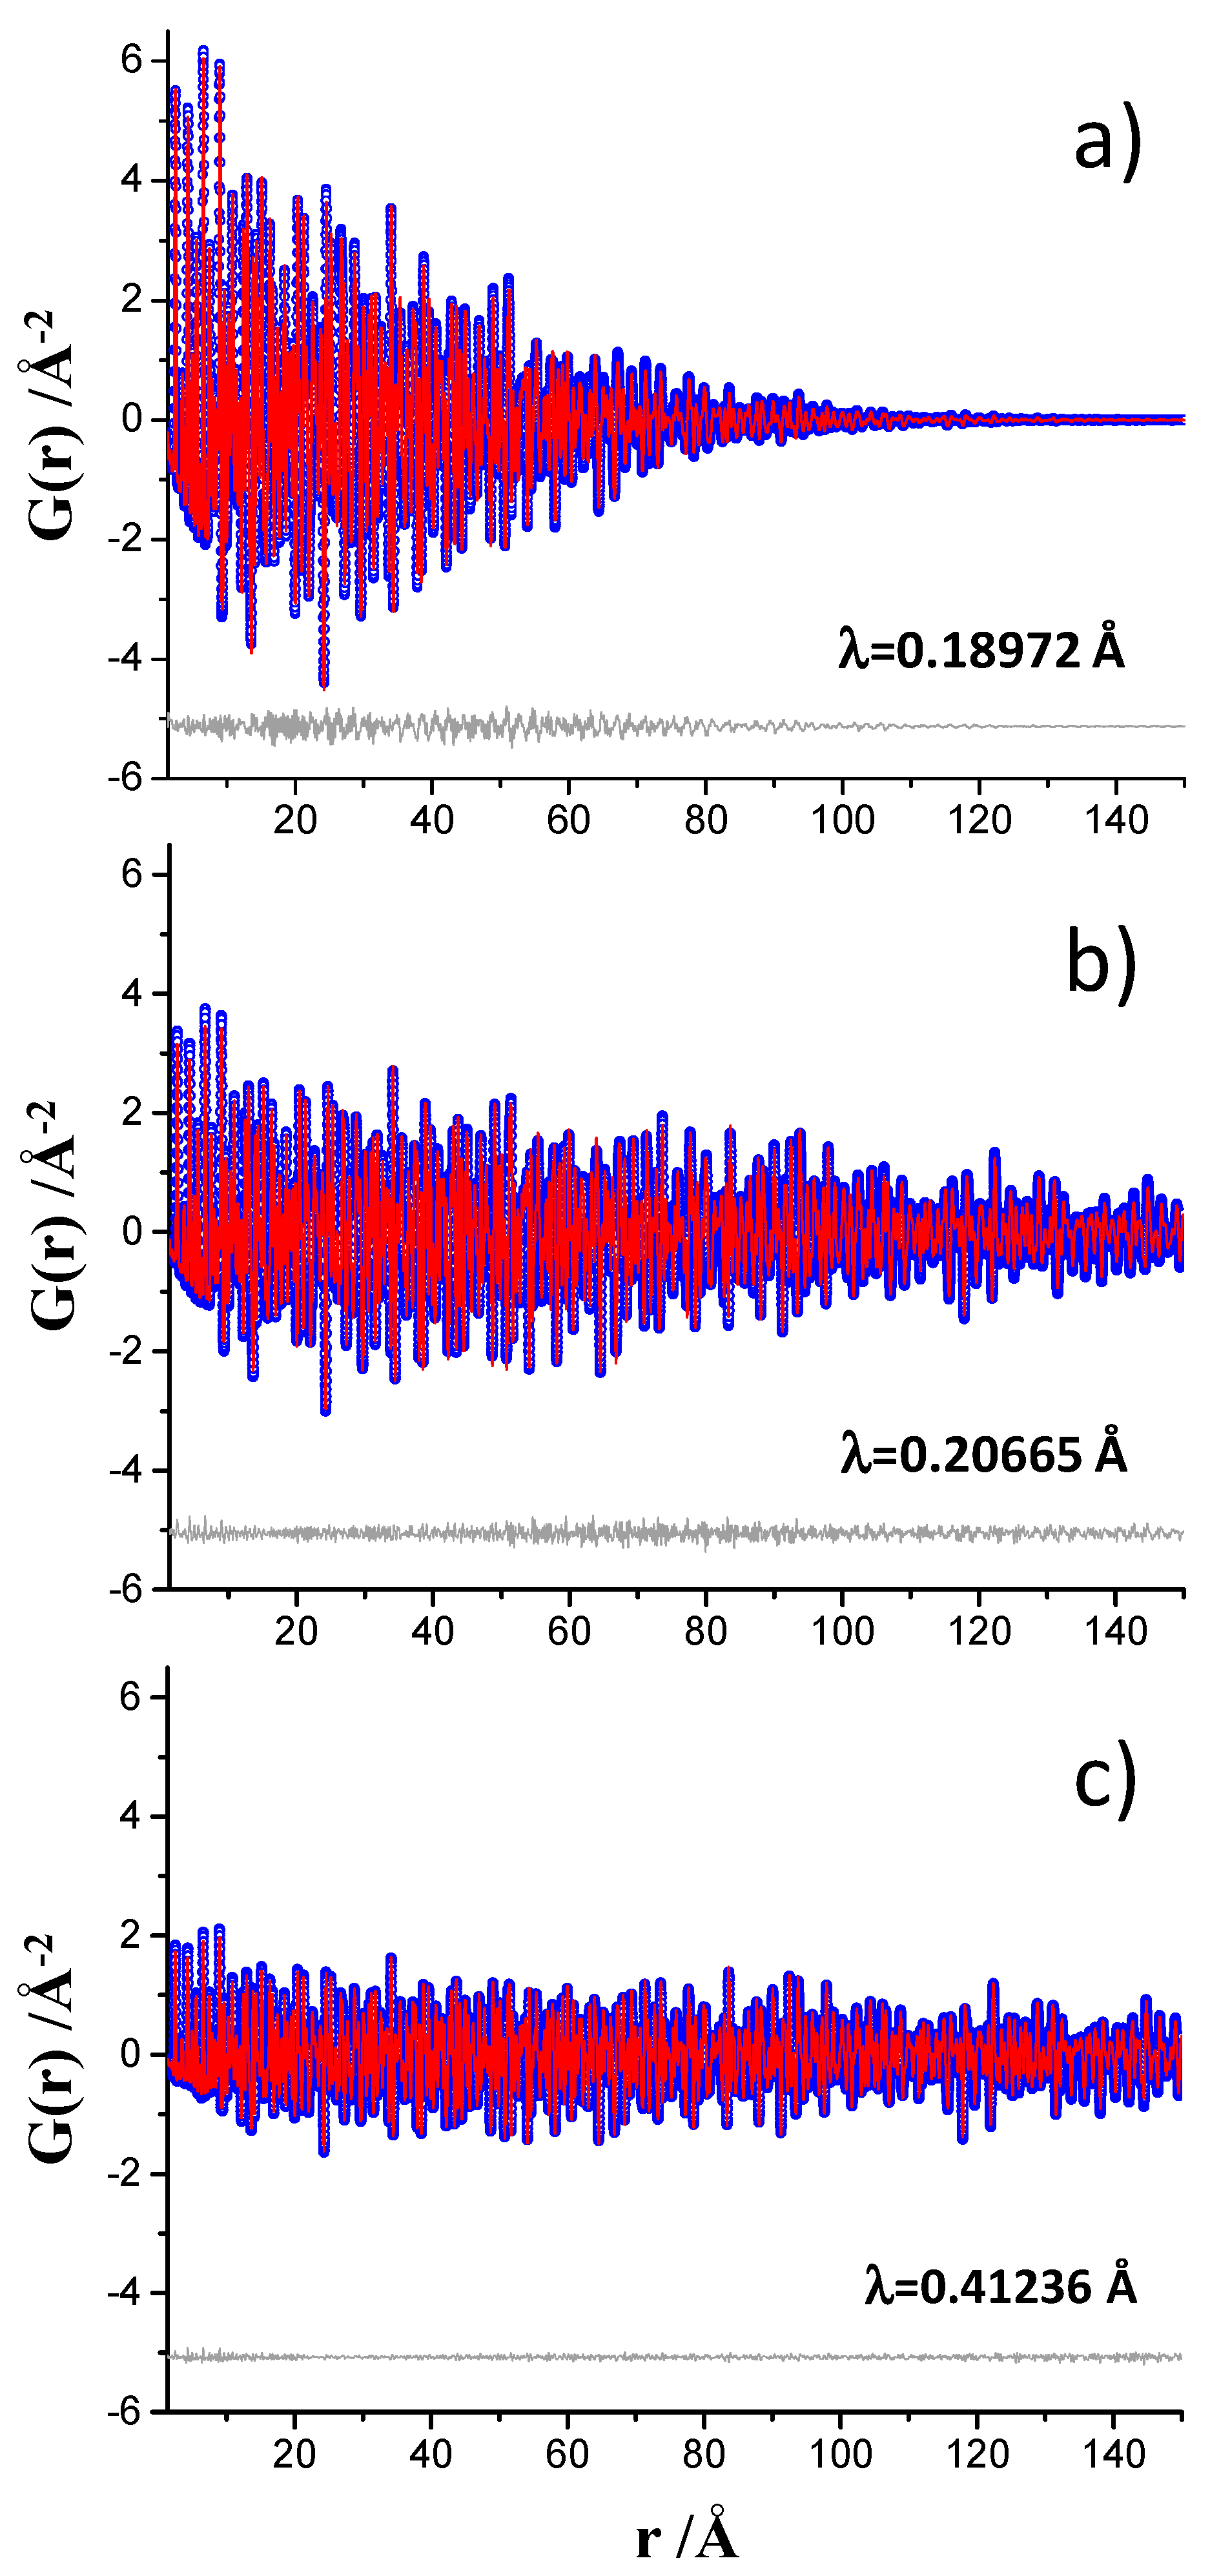
- Beamline ID15A at ESRF, European Synchrotron Radiation Facility, (Grenoble, France): The white beam was monochromatized by a liquid nitrogen cooled double Laue Si monochromator and the wavelength was 0.18972 Å (65.35 KeV). The beam size was 100 μm horizontal and 100 μm vertical to avoid beam size-dependent Q-broadening. The SXRPD data were collected in transmission geometry using a Pilatus3 X CdTe 2M hybrid photon counting 2D detector with 172 μm of pixel size located in a motorized stage. The detector was off-centered with respect to the incident beam and located close to the sample in order to acquire the largest possible range of the pair distribution function G(r). The detector distance was calibrated with CeO2 and it was found to be 181.592 mm which allows reaching a Qmax ins close to 30 Å−1. The data acquisition time was 8 s per individual image. For the hydrated pastes, and in order to increase the statistics of the final data sets, eight images of 8 s were collected and merged with local software.
- (b)
- Beamline ID22 at ESRF: The white beam was monochromatized by a channel cut Si 111 monochromator and the wavelength was 0.20665 Å (60 KeV) [31]. The data were collected in transmission geometry using a Perkin Elmer XRD 1611CP3 2D detector with a 100 μm of pixel size. The beam arriving at the entrance to the refracting lenses was 0.5 × 0.5 mm2 and the focused beamsize at the 2D detector was 150 μm horizontal and 50 μm vertical. This detector was installed on a motorized linear translation stage that allows for variation of the sample-detector distance between 2500 and 380 mm. By using this configuration, it was possible to reach a maximum momentum transfer, Qmax ins, of 27 Å−1. The total acquisition time per single pattern was 27 s. Moreover, other total acquisitions times were also tested, 67, 400, and 1004 s.
- (c)
- Beamline MSPD at ALBA synchrotron (Barcelona, Spain): The white beam was monochromatized by a double-crystal Si (111) monochromator and the wavelength was 0.41236(1) Å (30.067 keV) [32]. The data were collected in transmission geometry using a six modules MYTHEN 1D detector (strip-pitch: 50 µm, radius: 550 mm, covered angular range: 40°). The shortest usable wavelength was dictated by the efficiency of the Si-detector as higher energy X-ray, which would allow a larger Q-range to be probed, would yield poorer signal at a fraction of the scattered photons would not be measured by this detector. The beamsize was 3 mm horizontal and 1 mm vertical and it was focused vertically onto the detector. The data acquisition time was 37 min per each individual pattern. Three patterns were collected for the anhydrous samples and five for the hydrated pastes in order to improve the signal-to-noise ratio in the large recorded angular range, 1° to 120° (2θ). The maximum momentum transfer obtained was Qmax ins of 25 Å−1.
2.3. PDF Data Analysis
2.4. Laboratory X-ray Powder Diffraction (LXRPD) and Rietveld Analysis
3. Results and Discussion
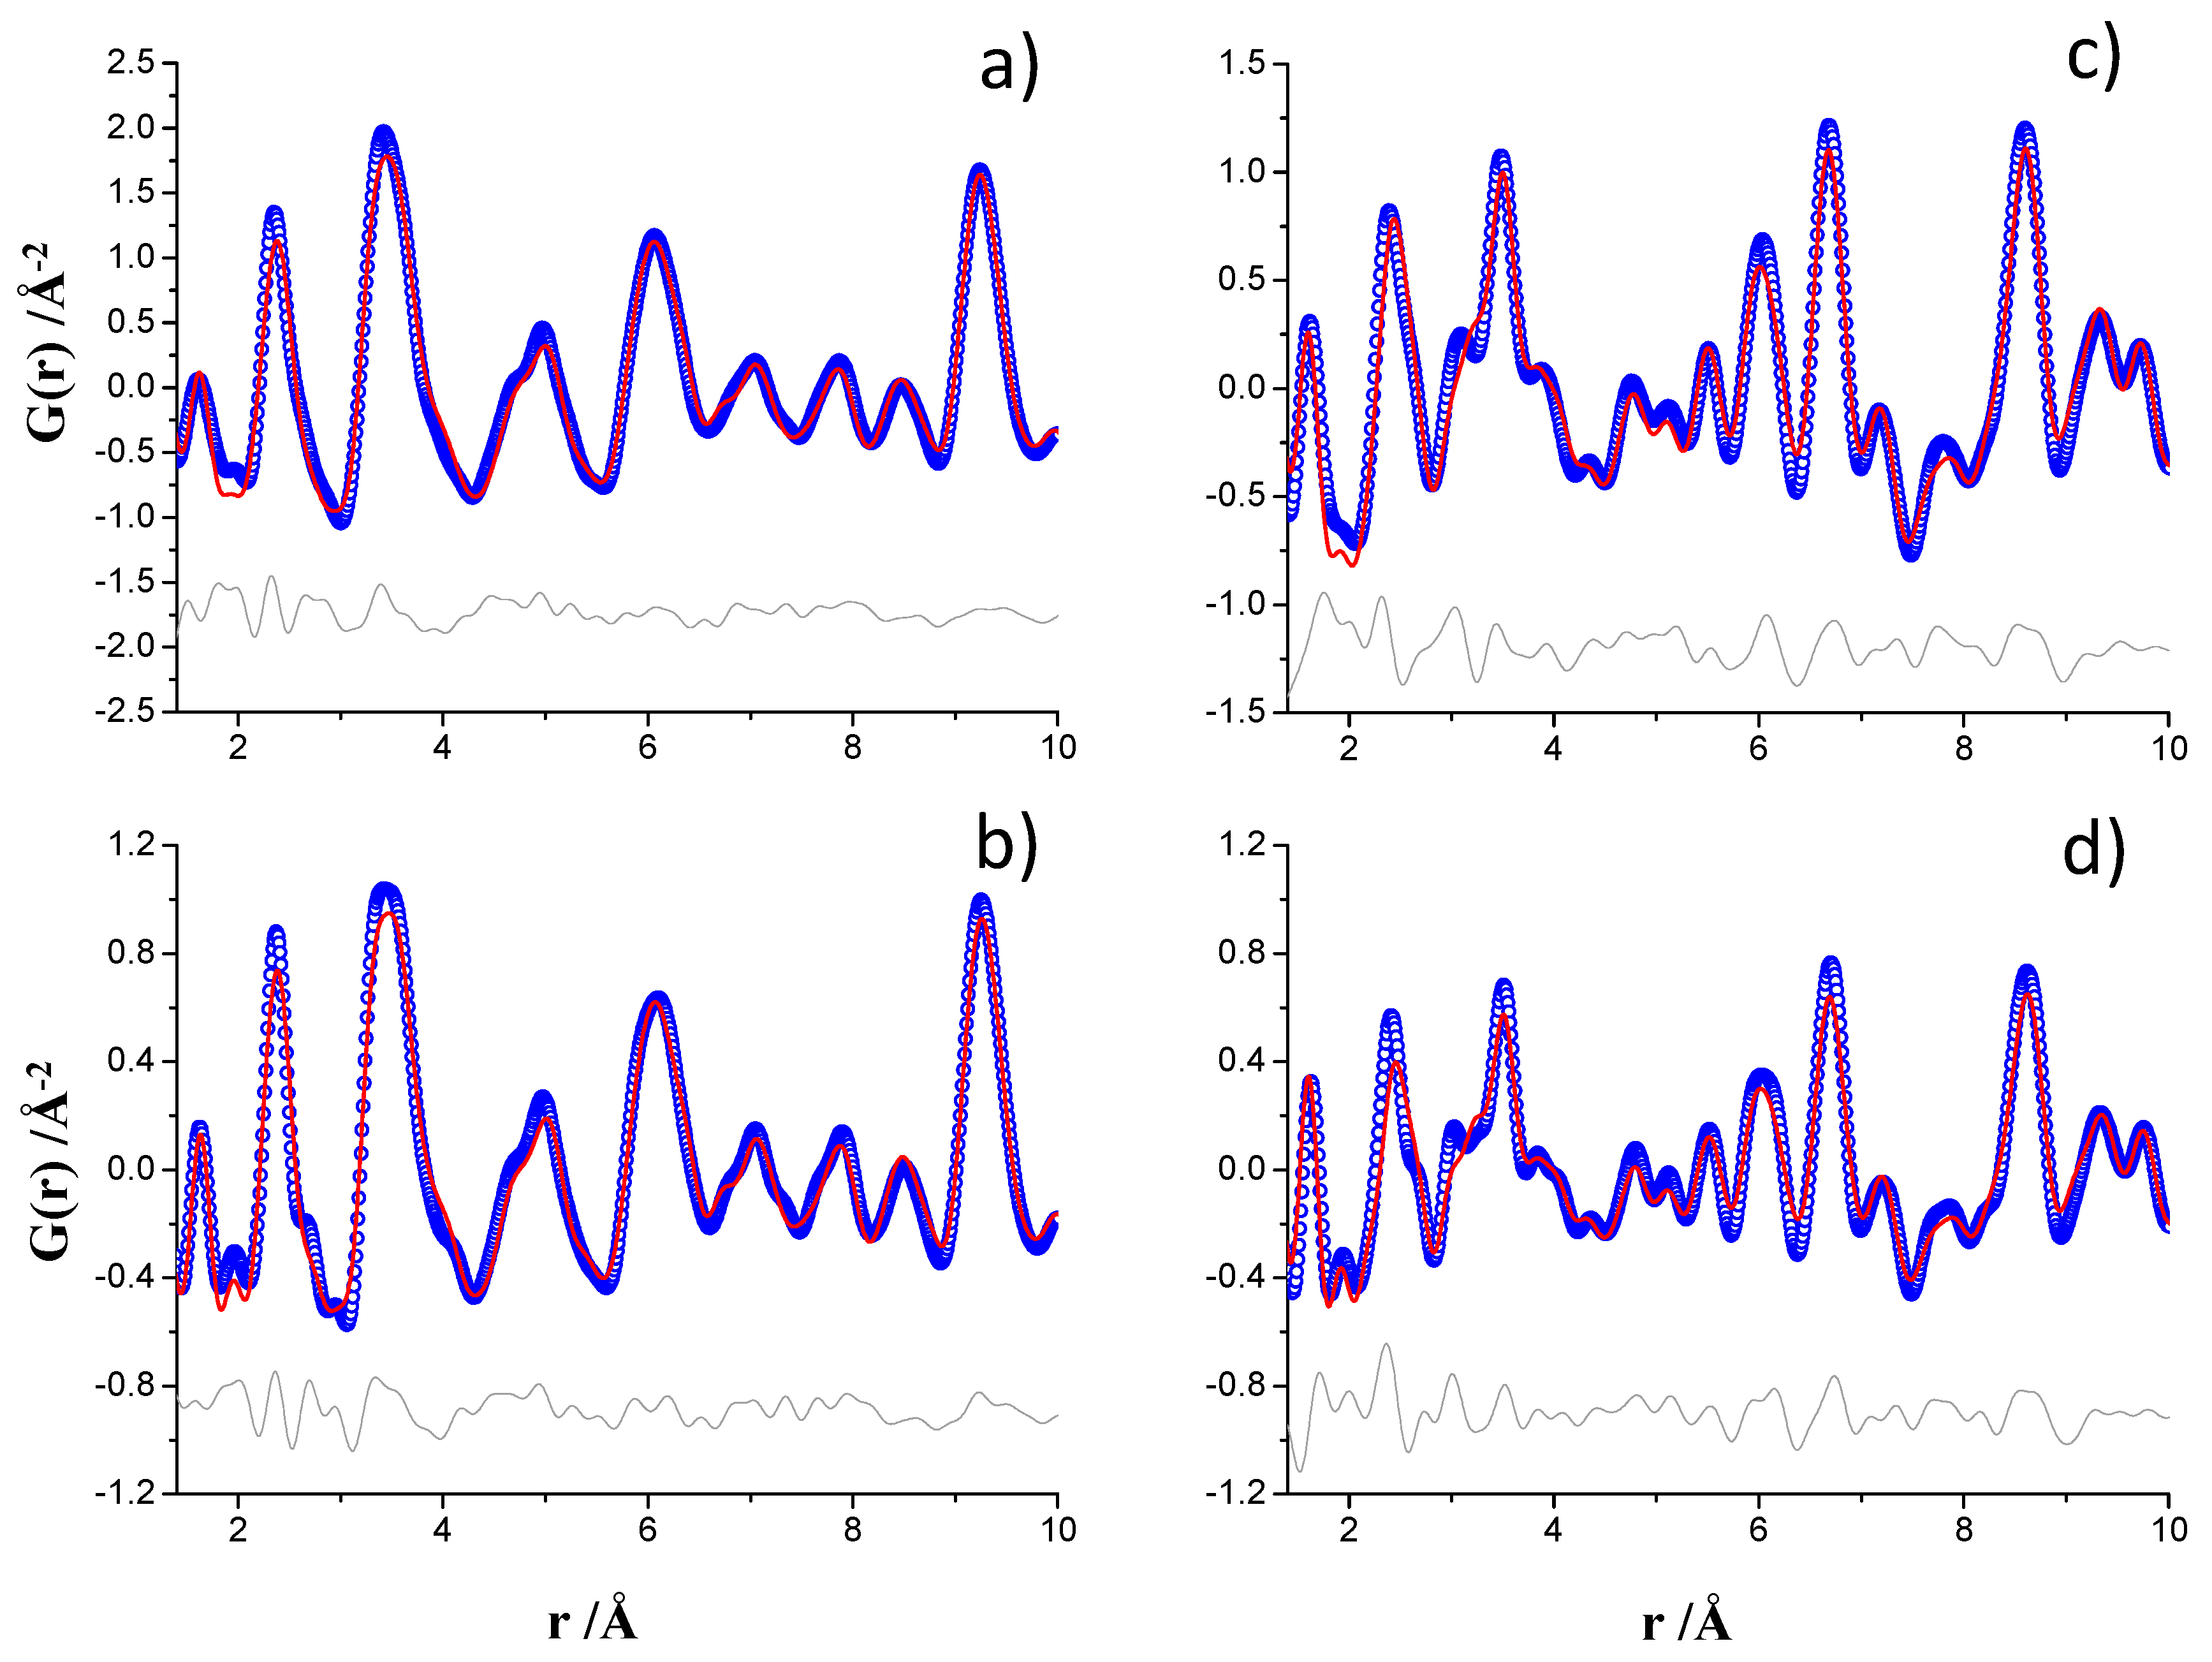
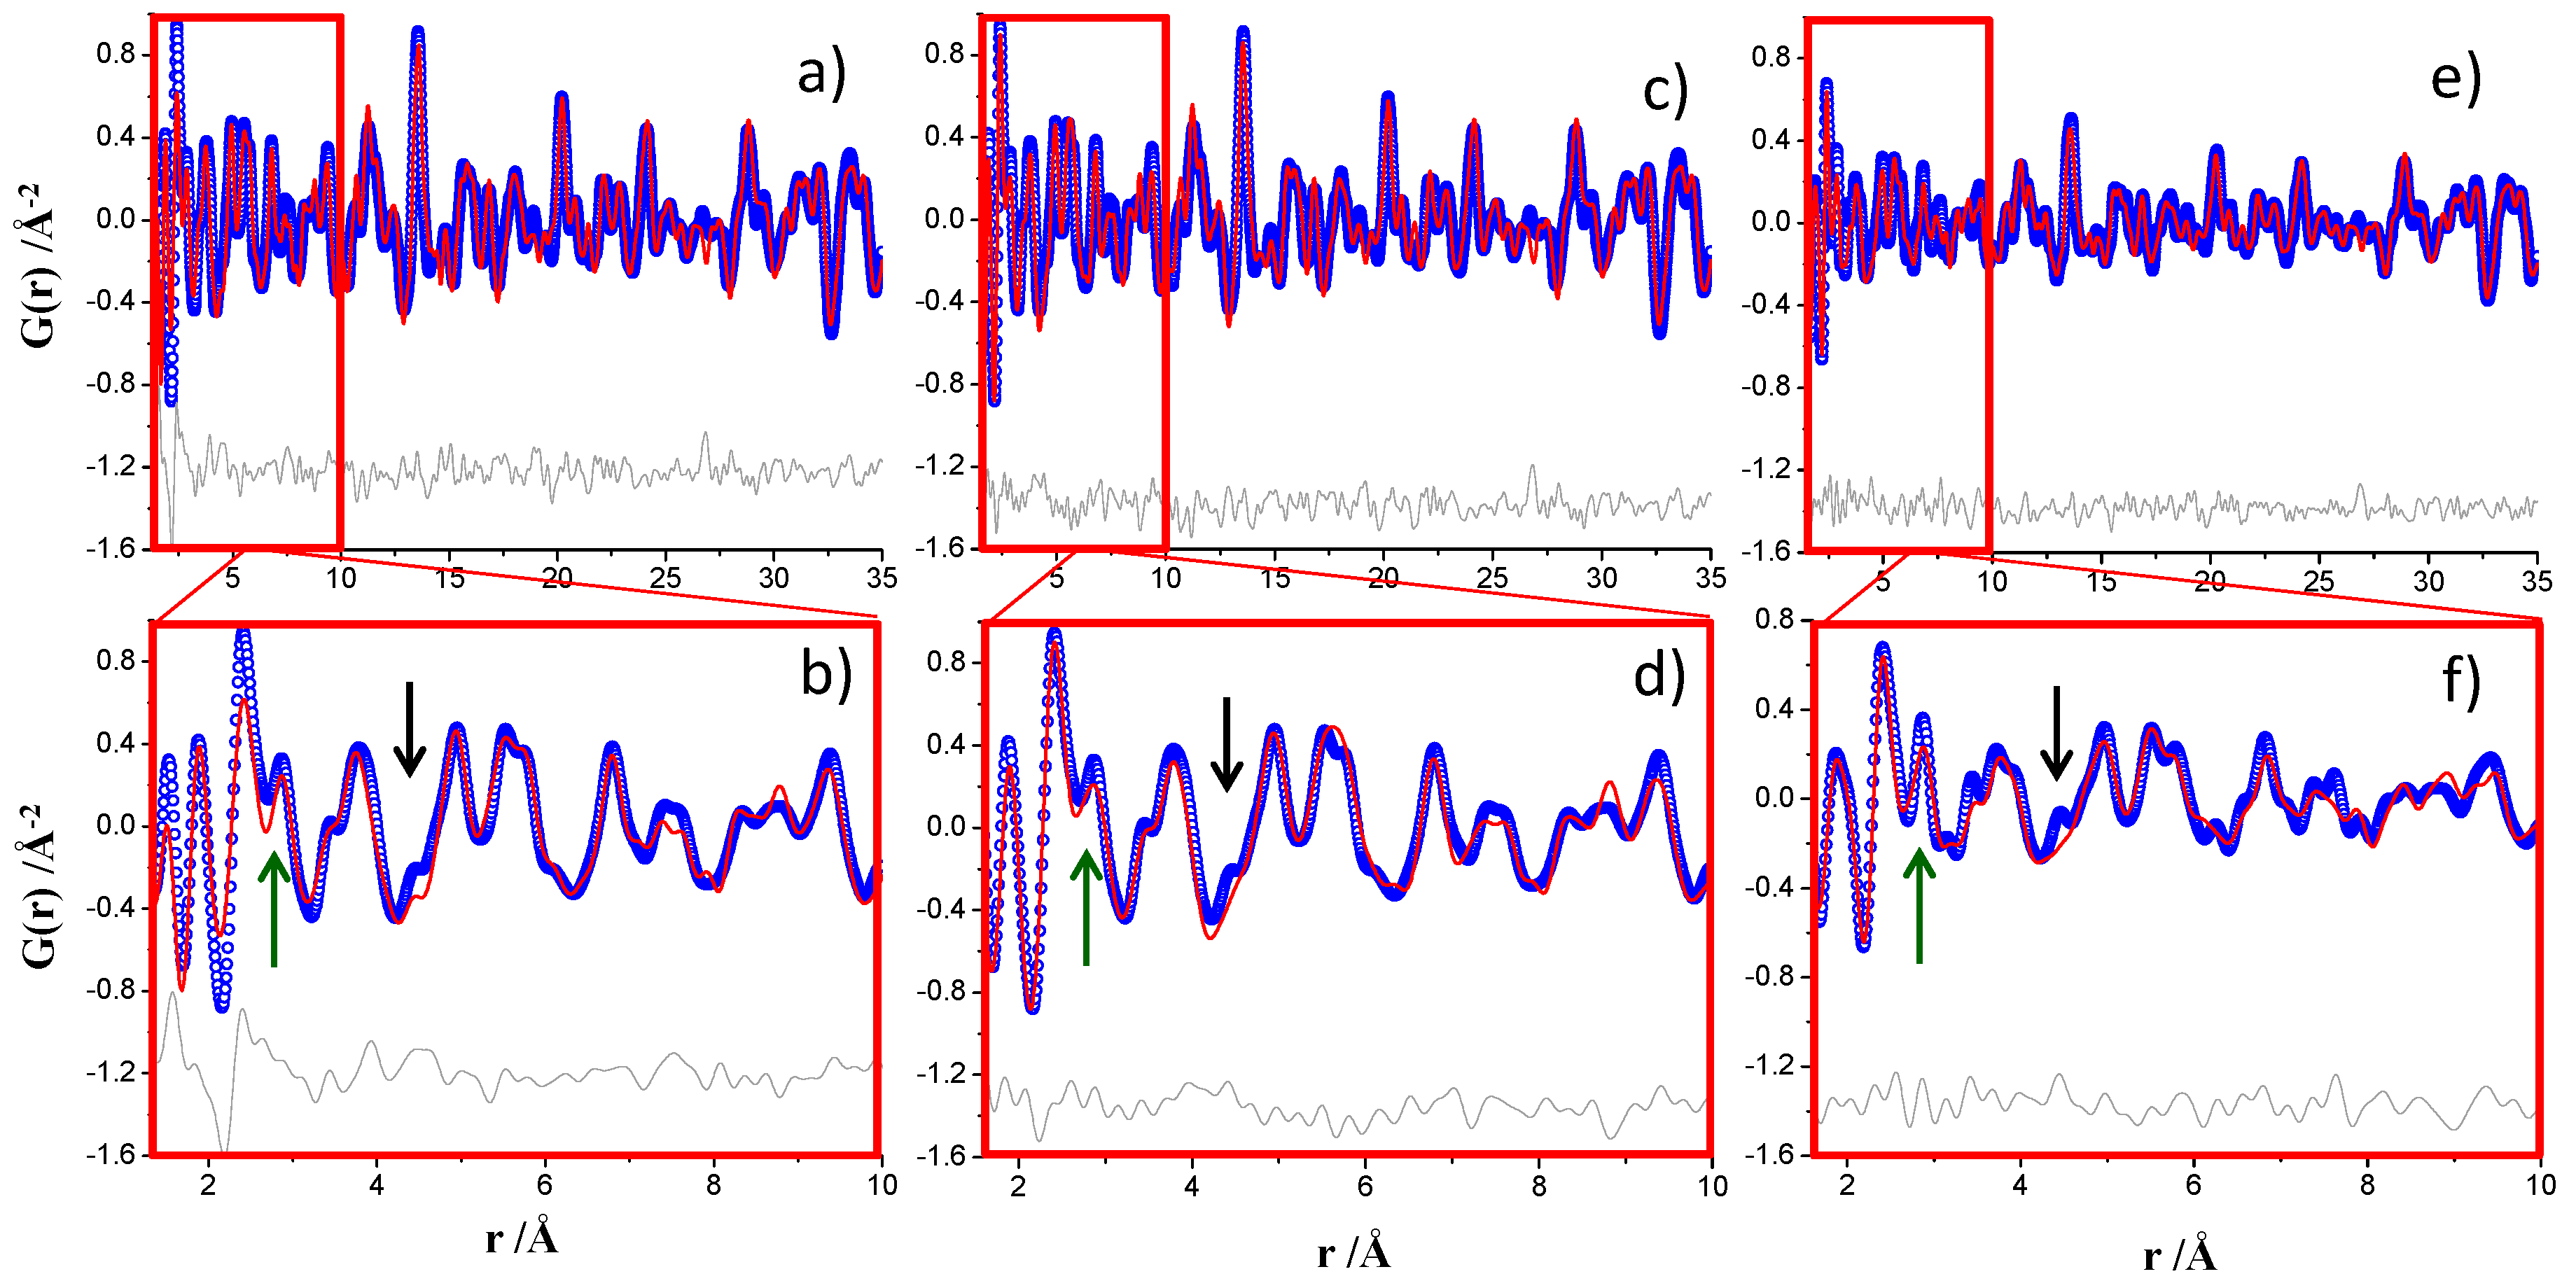
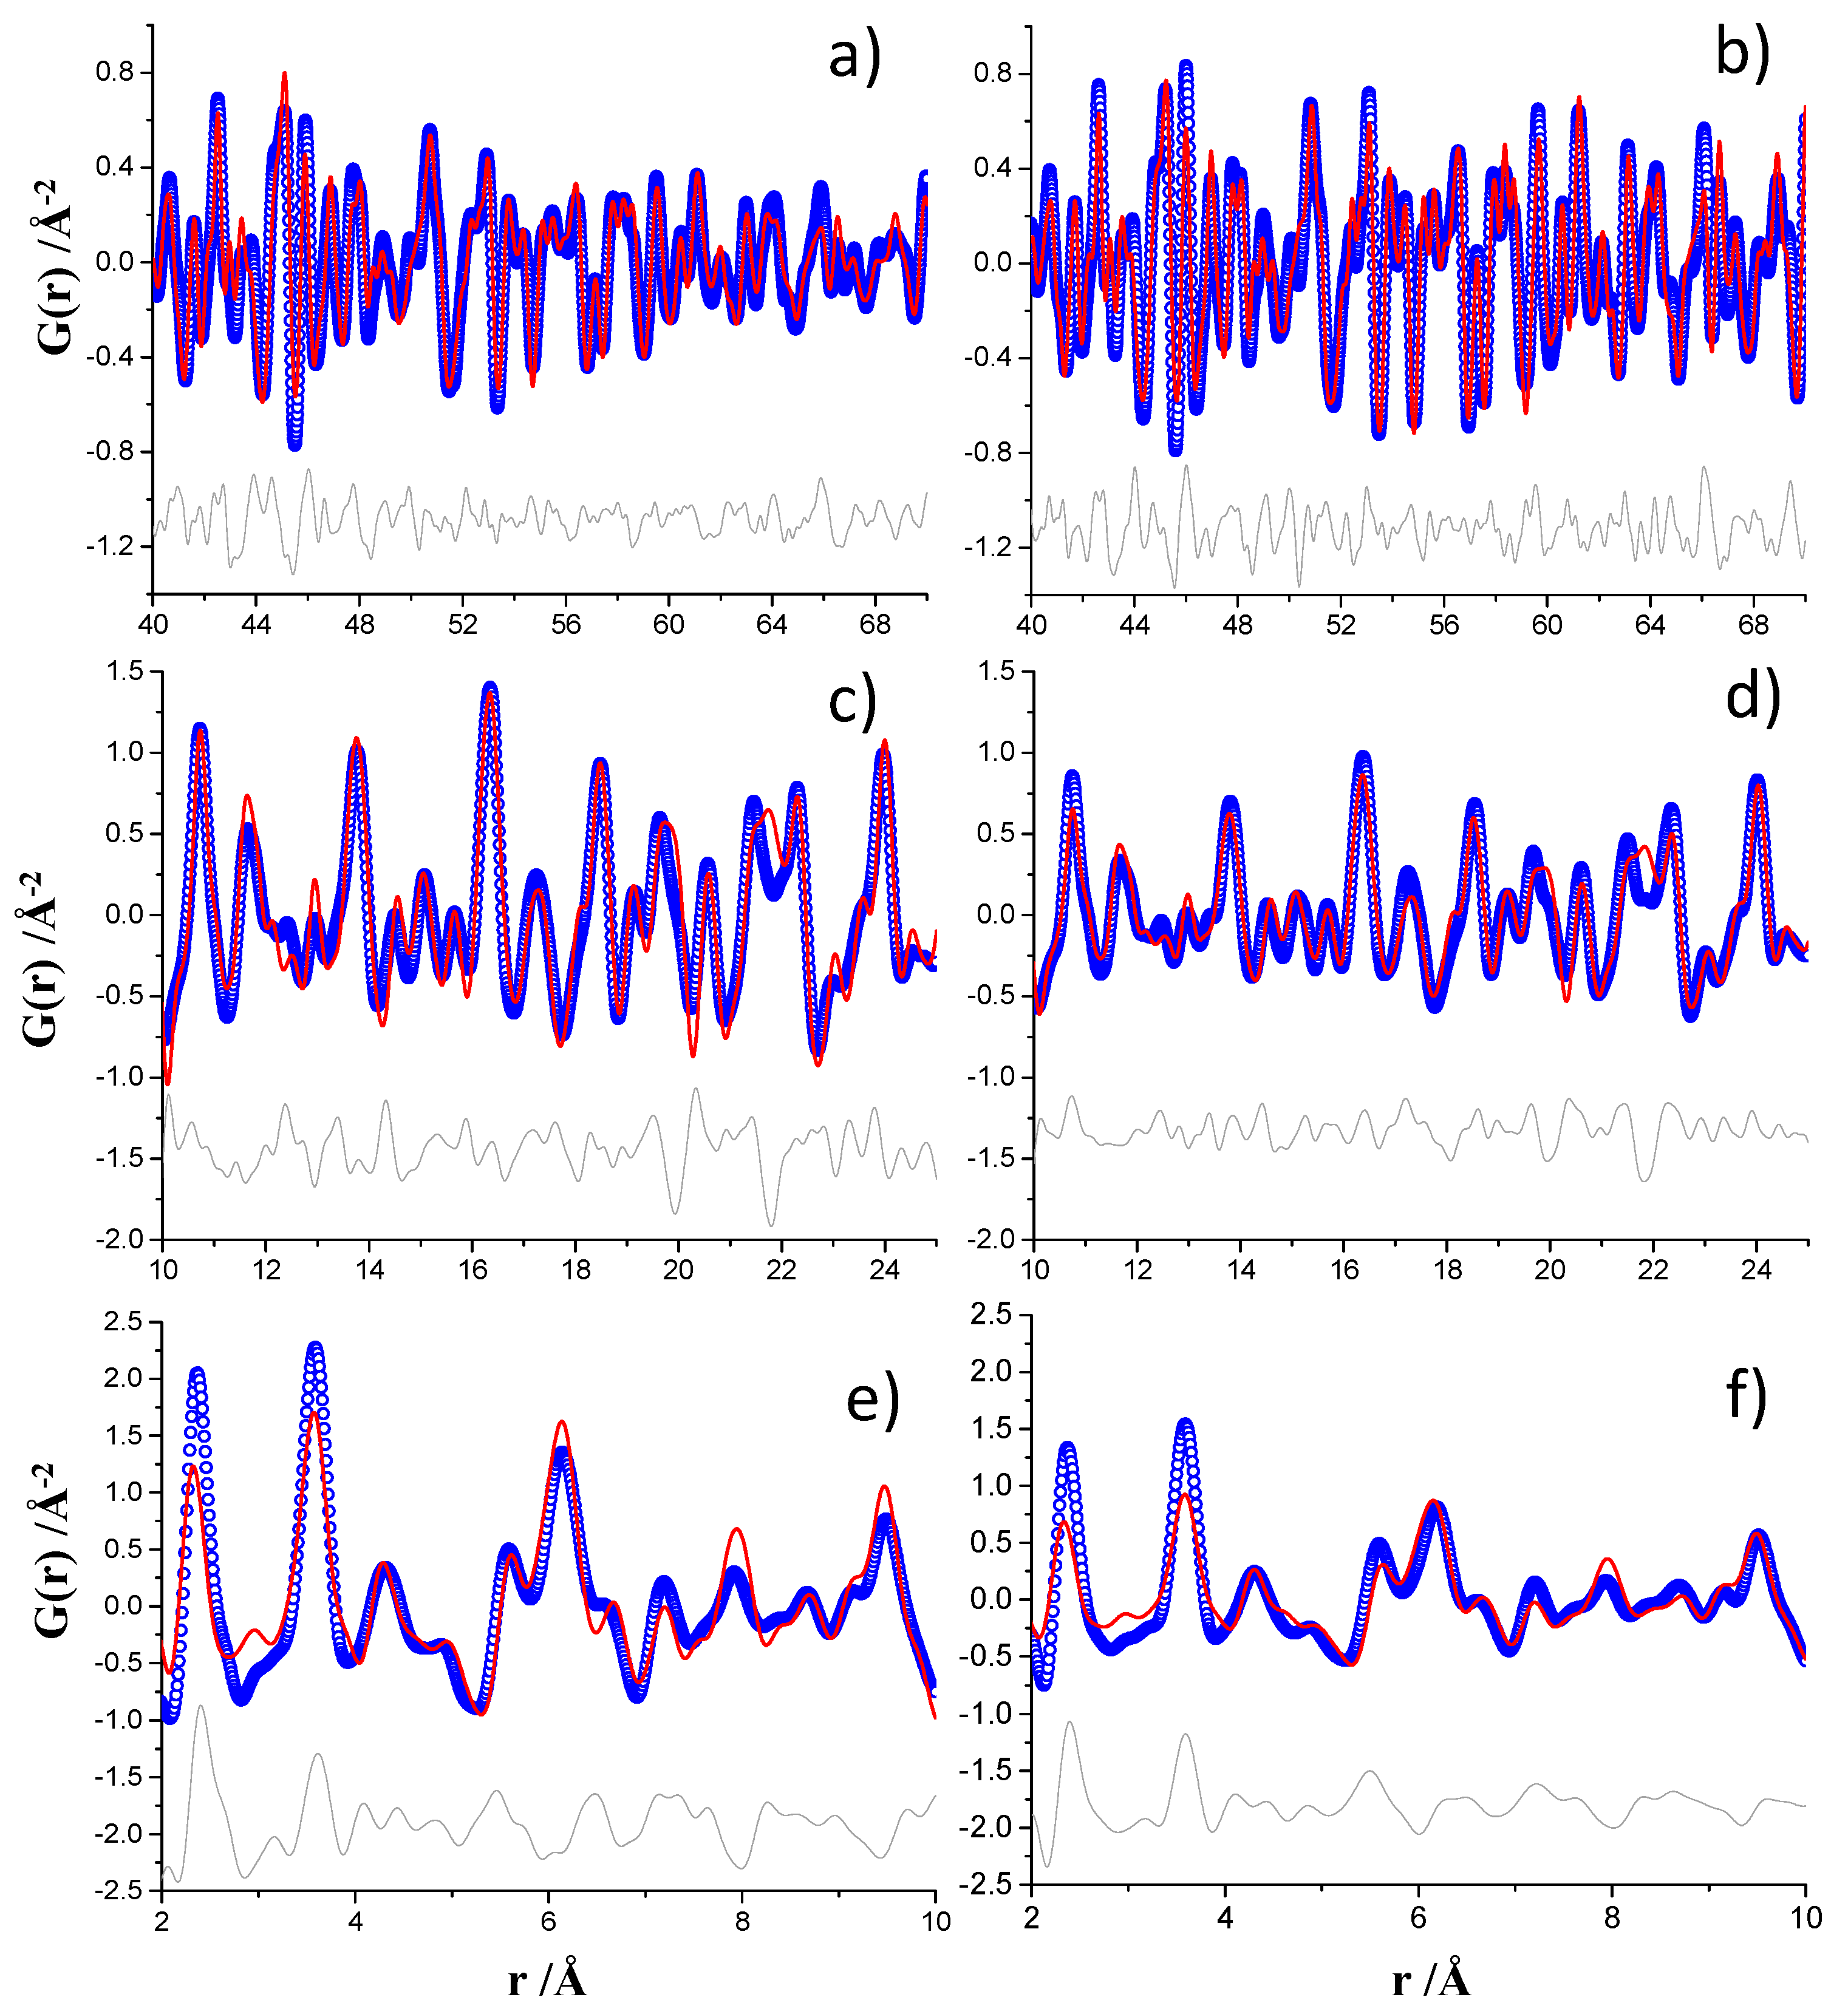
3.1. Nickel-Standard
3.2. Cement Samples
3.2.1. Anhydrous Triclinic Tricalcium Silicate and Dicalcium Silicate Samples
3.2.2. Ye’elimite with Bassanite Hydrated Paste
3.2.3. Monoclinic Tricalcium Silicate Hydrated Paste
4. Conclusions
Supplementary Materials
Additional Information
Author Contributions
Funding
Acknowledgments
Conflicts of Interest
References
- McCusker, L.B.; Von Dreele, R.B.; Cox, D.E.; Louër, D.; Scardi, P. Rietveld refinement guidelines. J. Appl. Crystallogr. 1999, 32, 36–50. [Google Scholar] [CrossRef] [Green Version]
- Clearfield, A.; Reibenspies, J.; Bhuvanesh, N. Principles and Applications of Powder Diffraction; Wiley: Hoboken, NJ, USA, 2008. [Google Scholar]
- Bragg, W.H.; Bragg, W.L. The Reflection of X-rays by Crystals References. Proc. R. Soc. London Ser. A 1913, 88, 428–438. [Google Scholar] [CrossRef]
- Egami, T.; Billinge, S.J.L. Underneath the Bragg Peaks: Structural Analysis of Complex Materials; Newnes: San Diego, CA, USA, 2012. [Google Scholar]
- Billinge, S.J.L.; Thorpe, M.F. Local Structure from Diffraction; Springer Science & Business Media: Berlin, Germany, 1998. [Google Scholar]
- Mittemeijer, E.J.; Welzel, U. Modern Diffraction Methods; John Wiley & Sons, Ltd.: New York, NY, USA, 2013. [Google Scholar]
- Welberry, T.R. Diffuse X-ray scattering and models of disorder. Reports Prog. Phys. 1985, 48, 1543–1594. [Google Scholar] [CrossRef]
- Proffen, T.; Kim, H. Advances in total scattering analysis. J. Mater. Chem. 2009, 19, 5078–5088. [Google Scholar] [CrossRef]
- Young, C.A.; Goodwin, A.L. Applications of pair distribution function methods to contemporary problems in materials chemistry. J. Mater. Chem. 2011, 21, 6464–6476. [Google Scholar] [CrossRef]
- Farrow, C.L.; Billinge, S.J.L. Relationship between the atomic pair distribution function and small-angle scattering: implications for modeling of nanoparticles. Acta Crystallogr. Sect. A Found. Crystallogr. 2009, 65, 232–239. [Google Scholar] [CrossRef] [Green Version]
- Davis, T.; Johnson, M.; Billinge, S.J.L. Toward Phase Quantification at the Nanoscale Using the Total Scattering Pair Distribution Function (TSPDF) Method: Recrystallization of Cryomilled Sulfamerazine. Cryst. Growth Des. 2013, 13, 4239–4244. [Google Scholar] [CrossRef]
- Yavuz, M. Investigation of Local and Average Structure in Li-ion Battery Electrode Materials by X-ray Diffraction. PhD Thesis, Technische Universität Darmstadt, Darmstadt, Germany, 2016. [Google Scholar]
- Cuesta, A.; Zea-Garcia, J.D.; Londono-Zuluaga, D.; De La Torre, A.G.; Santacruz, I.; Vallcorba, O.; Aranda, M.A.G. Synchrotron radiation pair distribution function analysis of gels in cements. Crystals 2017, 7, 317. [Google Scholar] [CrossRef]
- Peterson, J.; TenCate, J.; Proffen, T.; Darling, T.; Nakotte, H.; Page, K. Quantifying amorphous and crystalline phase content with the atomic pair distribution function. J. Appl. Crystallogr. 2013, 46, 332–336. [Google Scholar] [CrossRef]
- Sławiński, W.A. Calculation of pair distribution functions for multiphase systems. J. Appl. Crystallogr. 2018, 51, 919–923. [Google Scholar]
- Toby, B.H.; Egami, T. Accuracy of pair distribution function analysis applied to crystalline and non-crystalline materials. Acta Crystallogr. Sect. A Found. Crystallogr. 1992, 48, 336–346. [Google Scholar] [CrossRef] [Green Version]
- Olds, D.; Saunders, C.N.; Peters, M.; Proffen, T.; Neuefeind, J.; Page, K. IUCr Precise implications for real-space pair distribution function modeling of effects intrinsic to modern time-of-flight neutron diffractometers. Acta Crystallogr. Sect. A Found. Adv. 2018, 74, 293–307. [Google Scholar] [CrossRef]
- Ludwig, H.-M.; Zhang, W. Research review of cement clinker chemistry. Cem. Concr. Res. 2015, 78, 24–37. [Google Scholar] [CrossRef]
- Nicoleau, L.; Nonat, A.; Daval, D. Rate-limiting reaction of C3S hydration —A reply to the discussion “A new view on the kinetics of tricalcium silicate hydration” by E. Gartner. Cem. Concr. Res. 2018, 104, 118–122. [Google Scholar]
- Gartner, E. Discussion of the paper “A new view on the kinetics of tricalcium silicate hydration,” by Nicoleau, L. and Nonat, A. Cem. Concr. Res. 86 (2016) 1–11. Cem. Concr. Res. 2018, 104, 114–117. [Google Scholar] [CrossRef]
- Cuesta, A.; Zea-Garcia, J.D.; Londono-Zuluaga, D.; De la Torre, A.G.; Santacruz, I.; Vallcorba, O.; Dapiaggi, M.; Sanfélix, S.G.; Aranda, M.A.G. Multiscale understanding of tricalcium silicate hydration reactions. Sci. Rep. 2018, 8, 8544. [Google Scholar] [CrossRef]
- Aranda, M.A.G.; De la Torre, A.G. Sulfoaluminate Cement. In Eco-Efficient Concrete; Woodhead Publishing: Cambridge, UK, 2013; pp. 488–522. [Google Scholar]
- Cuesta, A.; Álvarez-Pinazo, G.; Sanfélix, S.G.; Peral, I.; Aranda, M.A.G.; De la Torre, A.G. Hydration mechanisms of two polymorphs of synthetic ye’elimite. Cem. Concr. Res. 2014, 63, 127–136. [Google Scholar] [CrossRef]
- Aranda, M.A.G. Recent studies of cements and concretes by synchrotron radiation crystallographic and cognate methods. Crystallogr. Rev. 2016, 22, 150–196. [Google Scholar] [CrossRef]
- Meral, C.; Benmore, C.J.; Monteiro, P.J.M. The study of disorder and nanocrystallinity in C–S–H, supplementary cementitious materials and geopolymers using pair distribution function analysis. Cem. Concr. Res. 2011, 41, 696–710. [Google Scholar] [CrossRef]
- Skinner, L.B.; Chae, S.R.; Benmore, C.J.; Wenk, H.R.; Monteiro, P.J.M. Nanostructure of Calcium Silicate Hydrates in Cements. Phys. Rev. Lett. 2010, 104, 195502. [Google Scholar] [CrossRef]
- White, C.E. Effects of temperature on the atomic structure of synthetic calcium–silicate–deuterate gels: A neutron pair distribution function investigation. Cem. Concr. Res. 2016, 79, 93–100. [Google Scholar] [CrossRef]
- White, C.E.; Daemen, L.L.; Hartl, M.; Page, K. Intrinsic differences in atomic ordering of calcium (alumino)silicate hydrates in conventional and alkali-activated cements. Cem. Concr. Res. 2015, 67, 66–73. [Google Scholar] [CrossRef] [Green Version]
- Grangeon, S.; Fernandez-Martinez, A.; Baronnet, A.; Marty, N.; Poulain, A.; Elkaïm, E.; Roosz, C.; Gaboreau, S.; Henocq, P.; Claret, F. Quantitative X-ray pair distribution function analysis of nanocrystalline calcium silicate hydrates: a contribution to the understanding of cement chemistry. J. Appl. Crystallogr. 2017, 50, 14–21. [Google Scholar] [CrossRef]
- Cuesta, A.; Aranda, M.A.G.; Sanz, J.; De La Torre, Á.G.; Losilla, E.R. Mechanism of stabilization of dicalcium silicate solid solution with aluminium. Dalt. Trans. 2014, 43, 2176–2182. [Google Scholar] [CrossRef] [Green Version]
- Wright, J.P.; Vaughan, G.B.M.; Fitch, A.N. Merging data from a multi-detector continuous scanning powder diffraction system. Comput. Comm. Newsl. 2003, 1, 92. [Google Scholar]
- Fauth, F.; Peral, I.; Popescu, C.; Knapp, M. The new Material Science Powder Diffraction beamline at ALBA Synchrotron. Powder Diffr. 2013, 28, S360–S370. [Google Scholar] [CrossRef]
- Juhas, P.; Davis, T.; Farrow, C.L.; Billinge, S.J.L. PDFgetX3: A rapid and highly automatable program for processing powder diffraction data into total scattering pair distribution functions. J. Appl. Crystallogr. 2013, 46, 560–566. [Google Scholar] [CrossRef]
- Farrow, C.L.; Juhas, P.; Liu, J.W.; Bryndin, D.; Božin, E.S.; Bloch, J.; Proffen, T.; Billinge, S.J.L. PDFfit2 and PDFgui: computer programs for studying nanostructure in crystals. J. Phys. Condens. Matter 2007, 19, 335219. [Google Scholar] [CrossRef] [Green Version]
- Jeong, I.K.; Proffen, T.; Mohiuddin-Jacobs, F.; Billinge, S.J.L. Measuring Correlated Atomic Motion Using X-ray Diffraction. J. Phys. Chem. C 1999, 103, 921–924. [Google Scholar] [CrossRef]
- Jeong, I.K.; Heffner, R.H.; Graf, M.J.; Billinge, S.J.L. Lattice dynamics and correlated atomic motion from the atomic pair distribution function. Phys. Rev. B Condens. Matter Mater. Phys. 2003, 67, 104301. [Google Scholar] [CrossRef]
- Von Dreele, R.B.; Larson, A.C. General structure analysis system (GSAS). Los Alamos Natl. Lab. Rep. LAUR 2004, 748, 86–748. [Google Scholar]
- Bernasconi, A.; Wright, J.; Harker, N. Total scattering experiments on glass and crystalline materials at the ESRF on the ID11 Beamline. Powder Diffr. 2015, 30, S2–S8. [Google Scholar] [CrossRef]
- Winnefeld, F.; Barlag, S. Calorimetric and thermogravimetric study on the influence of calcium sulfate on the hydration of ye’elimite. J. Therm. Anal. Calorim. 2010, 101, 949–957. [Google Scholar] [CrossRef]


| Beamline | ID15A | ID22 | MSPD (Materials Science and Powder Diffraction) | ||
|---|---|---|---|---|---|
| λ (Å) | 0.1897 | 0.2067 | 0.4124 | ||
| Qmax ins (Å−1) | 30 | 27 | 25 | ||
| Detector | Pilatus3 X CdTe 2M 2D | Perkin Elmer XRD 1611CP3 2D | 6 modules MYTHEN 1D | ||
| Acq. time (s) | 8 | 27 | 2220 | ||
| Qmax (Å−1) | 24 | 29 | 24 | 26 | 24 |
| Qdamp (Å−1) | 0.0221 | 0.0221 | 0.0094 | 0.0094 | 0.0039 |
| Qbroad (Å−1) | 0.0143 | 0.0142 | 0.0084 | 0.0084 | 0.0085 |
| Unit cell (Å)# | 3.5178 | 3.5178 | 3.5245 | 3.5245 | 3.5263 |
| ADP (Å2)# | 0.0059 | 0.0060 | 0.0061 | 0.0061 | 0.0042 |
| delta2 (Å2) | 1.81 | 1.79 | 1.84 | 1.90 | 2.62 |
| RW (%) | 9.0 | 9.0 | 9.5 | 9.6 | 5.8 |
| Beamline | ID15A | ID22 | MSPD |
|---|---|---|---|
| FWHM (Å) | |||
| Ni–Ni at 2.49 Å | 0.237 | 0.236 | 0.208 |
| Ni–Ni at 3.63 Å | 0.279 | 0.308 | 0.240 |
| Ni–Ni at 6.58 Å | 0.253 | 0.254 | 0.222 |
| Beamline | ID15A | ID22 | MSPD | |
|---|---|---|---|---|
| 1.35–30 Å | Qbroad (Å−1) | 0.0153 | 0.0065 | 0.0003 |
| RW (%) | 6.5 | 6.1 | 5.2 | |
| 30–50 Å | Qbroad (Å−1) | 0.0146 | 0.0094 | 0.0097 |
| RW (%) | 10.5 | 6.9 | 3.6 | |
| 50–100 Å | Qbroad (Å−1) | 0.0138 | 0.0089 | 0.0091 |
| RW (%) | 18.3 | 11.7 | 4.5 | |
| Beamline | ID15A 1.35–35 Å | ID15A 1.6–35 Å | MSPD [13] 1.6–35 Å | Expected According to (3) * |
|---|---|---|---|---|
| Ettringite (wt.%) | 74.8 | 61.9 | 59.9 | 80.1 |
| Nanocrystalline Al(OH)3 (wt.%) | 25.2 | 38.1 | 40.1 | 19.9 |
| Spdiameter (Å) | 33 | 27 | 26 | - |
| RW (%) | 29.1 | 23.7 | 28.4 | - |
© 2019 by the authors. Licensee MDPI, Basel, Switzerland. This article is an open access article distributed under the terms and conditions of the Creative Commons Attribution (CC BY) license (http://creativecommons.org/licenses/by/4.0/).
Share and Cite
Zea-Garcia, J.D.; De la Torre, A.G.; Aranda, M.A.G.; Cuesta, A. A Comparative Study of Experimental Configurations in Synchrotron Pair Distribution Function. Materials 2019, 12, 1347. https://doi.org/10.3390/ma12081347
Zea-Garcia JD, De la Torre AG, Aranda MAG, Cuesta A. A Comparative Study of Experimental Configurations in Synchrotron Pair Distribution Function. Materials. 2019; 12(8):1347. https://doi.org/10.3390/ma12081347
Chicago/Turabian StyleZea-Garcia, Jesus D., Angeles G. De la Torre, Miguel A. G. Aranda, and Ana Cuesta. 2019. "A Comparative Study of Experimental Configurations in Synchrotron Pair Distribution Function" Materials 12, no. 8: 1347. https://doi.org/10.3390/ma12081347
APA StyleZea-Garcia, J. D., De la Torre, A. G., Aranda, M. A. G., & Cuesta, A. (2019). A Comparative Study of Experimental Configurations in Synchrotron Pair Distribution Function. Materials, 12(8), 1347. https://doi.org/10.3390/ma12081347