3.1. Elemental and Mineralogical Analysis of Copper Anode Slime (CAS) and Polyvinyl Chloride (PVC) Samples
As noted in Part I [
1], several research reports [
12,
13,
14,
15,
16,
35,
36,
37,
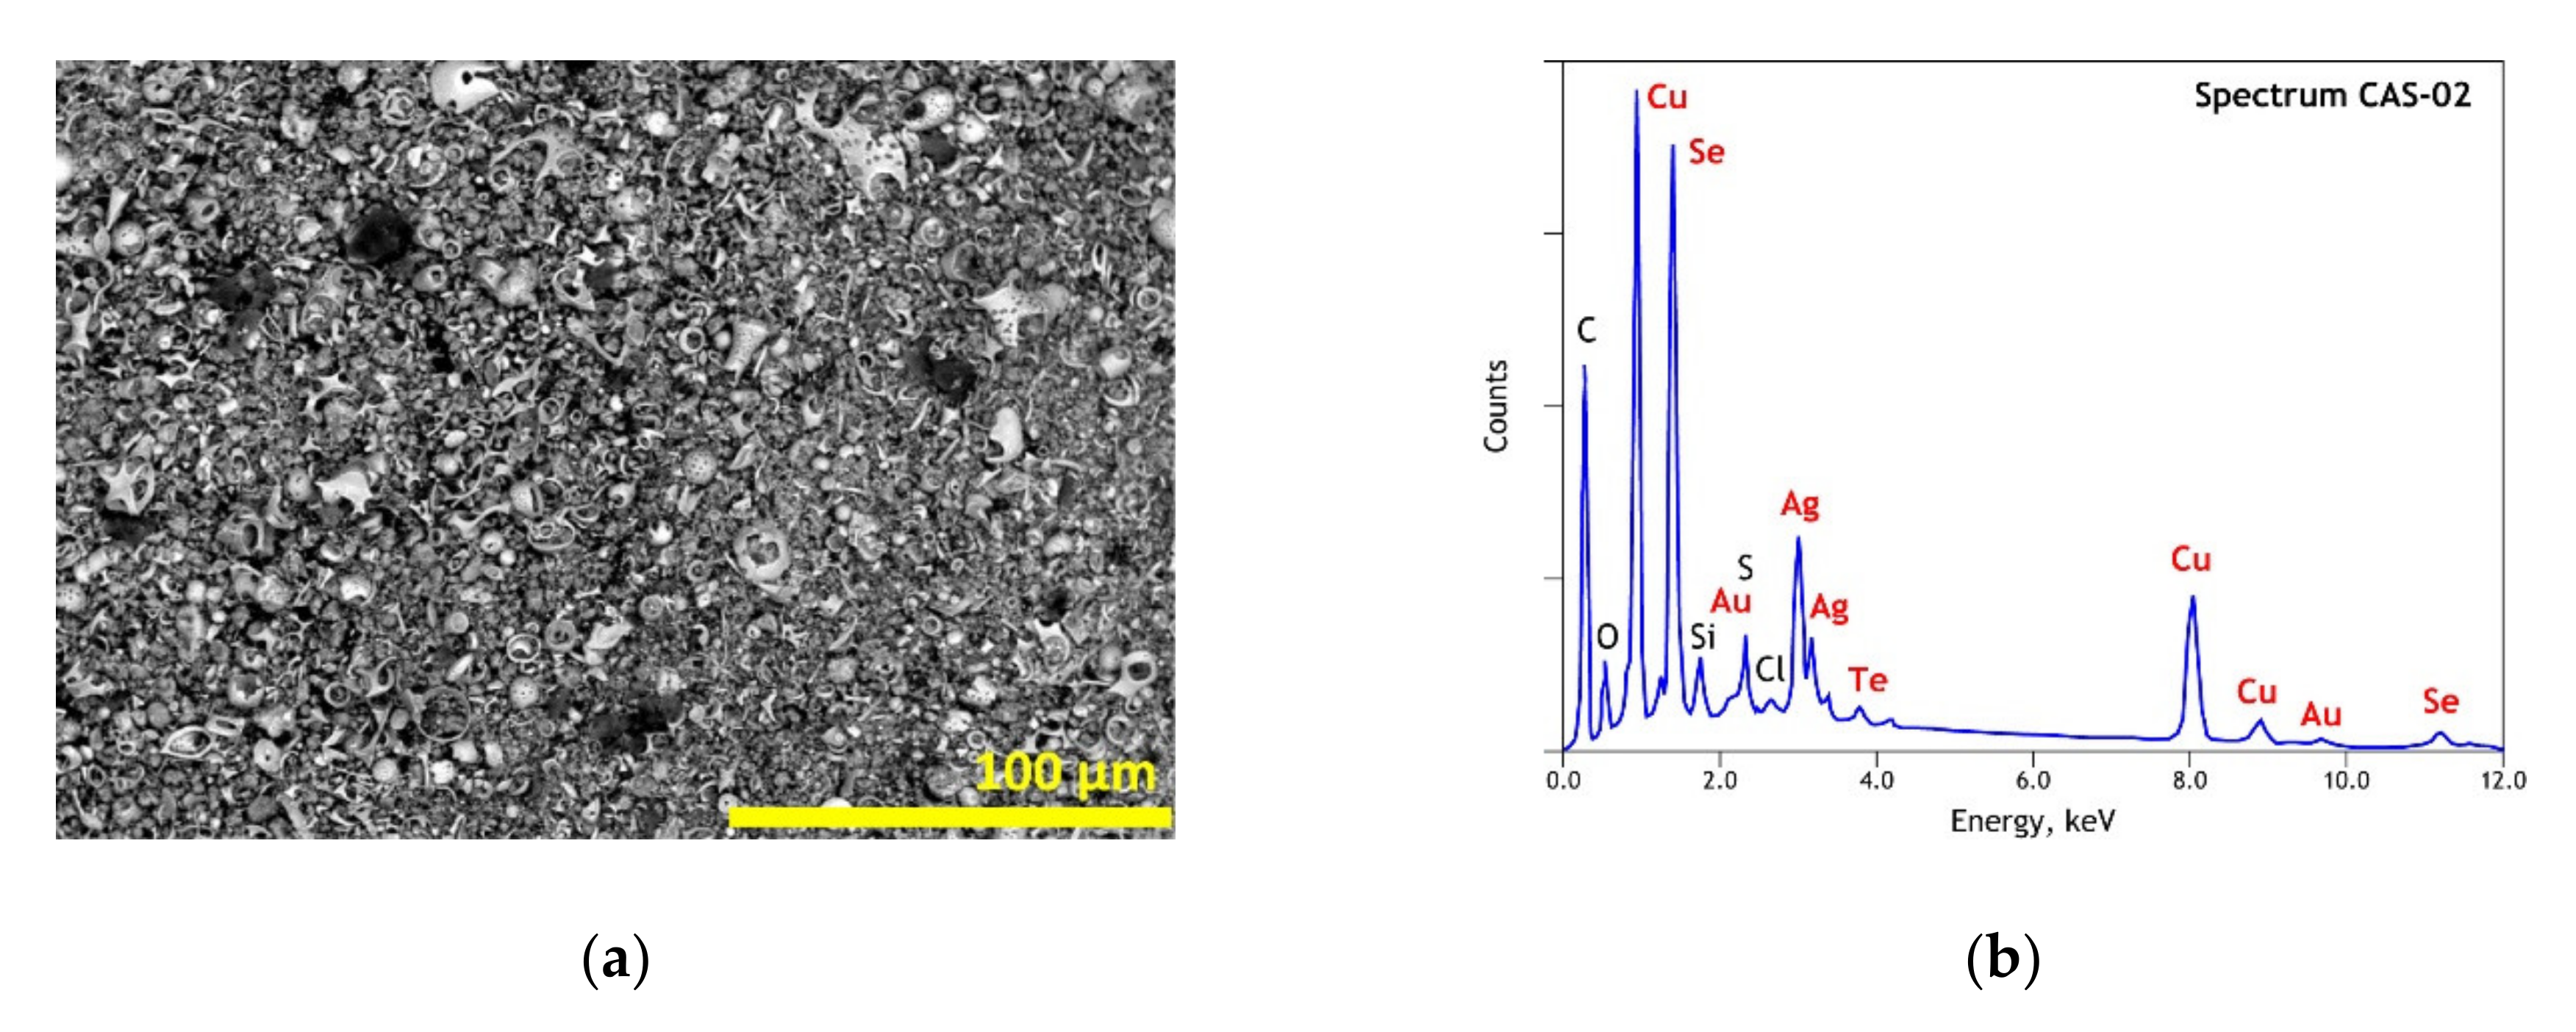
38] emphasized the complex nature of the CAS based on their elemental, mineralogical and morphological analysis. The particular morphology of the studied CAS sample is also exhibited by an SEM image as illustrated in
Figure 2a, meanwhile the multi-elemental composition (Cu, Se, Ag, S, O, Au, Si, Te, Cl) is clear in the general EDS spectrum of the CAS (
Figure 2b). The presence of carbon in the EDS spectrum is probably resulting from the carbonaceous matter in the CAS sample and the carbon coating used to make the sample conductive for the SEM-EDS analysis.
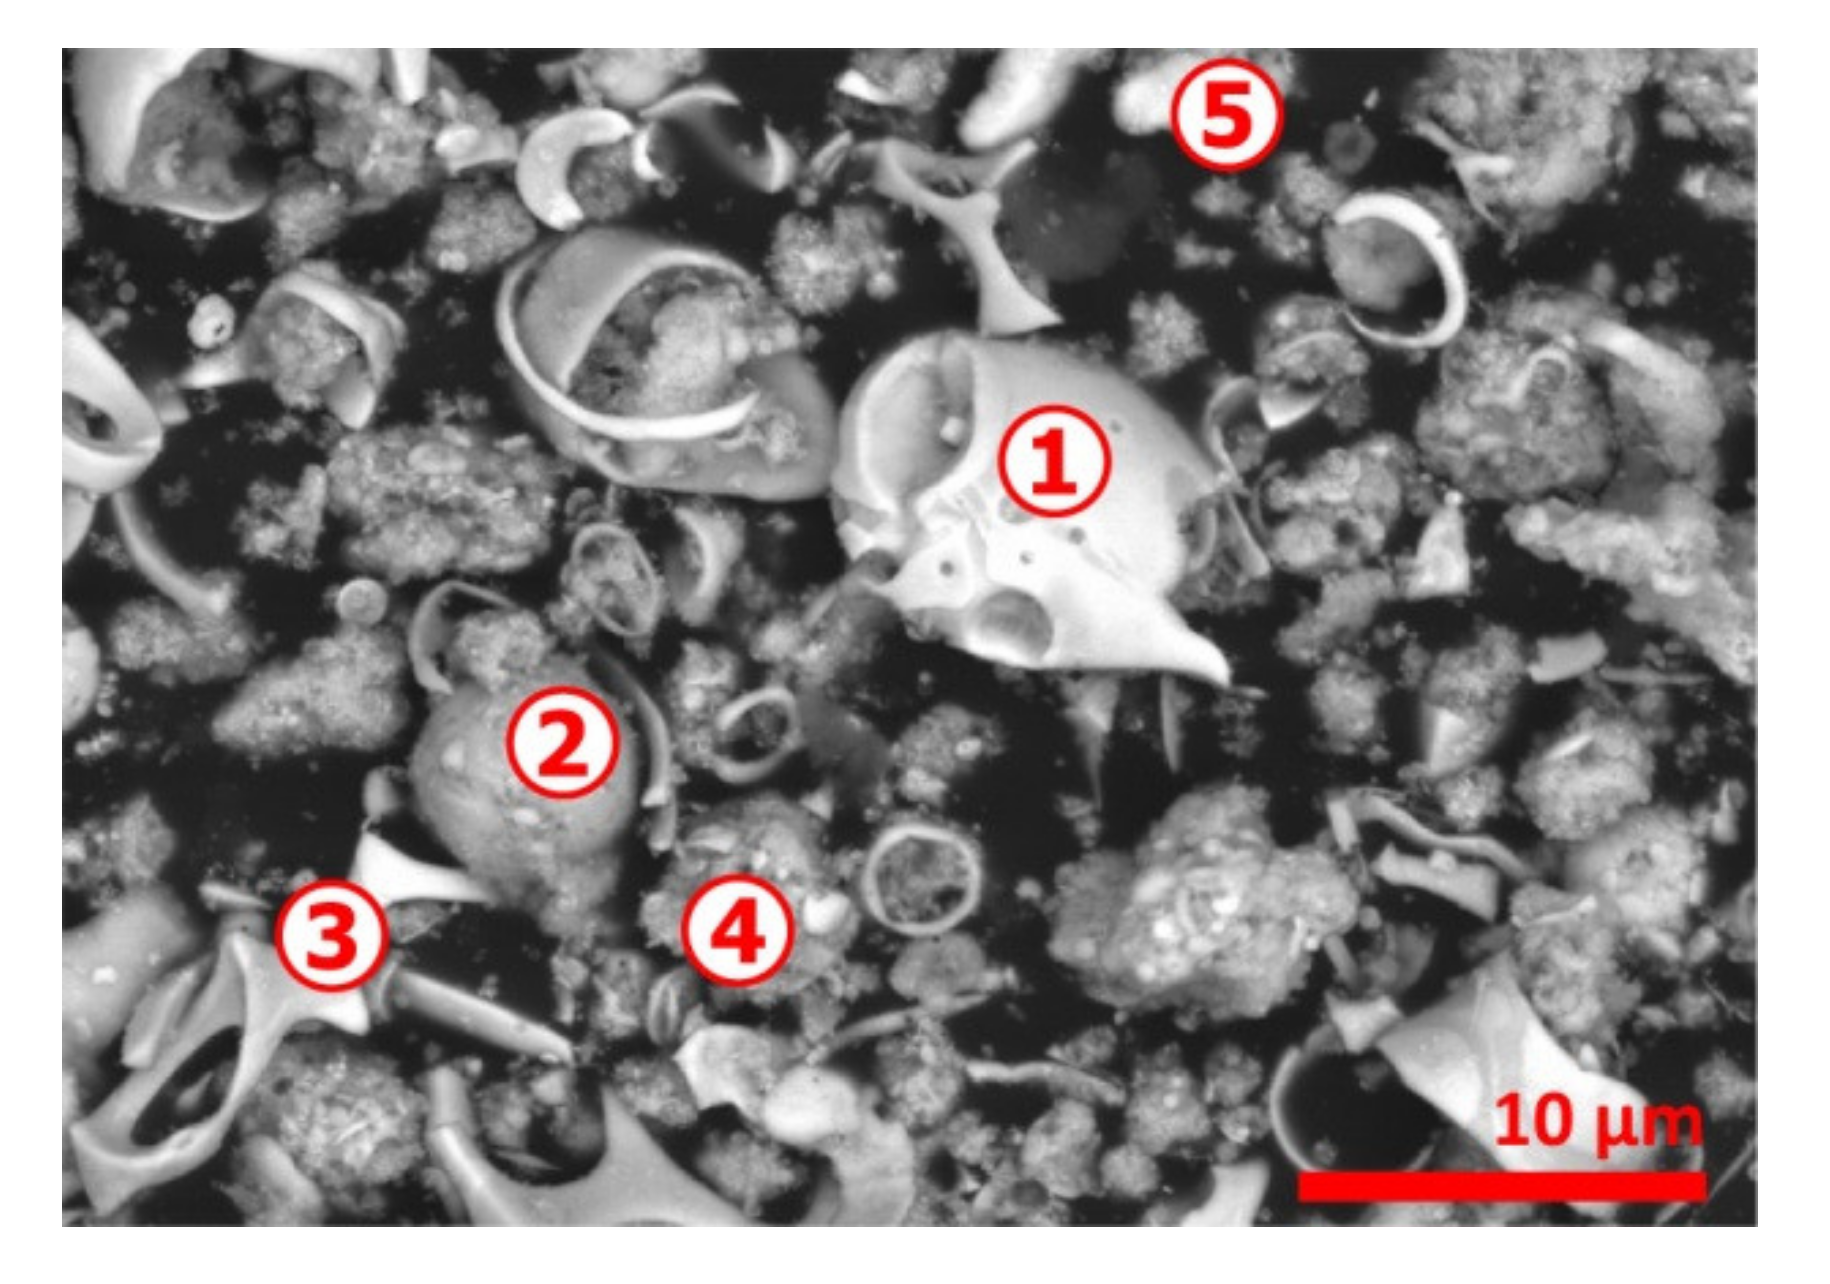
A clearer view revealing the atypical morphology of the CAS sample is shown in
Figure 3 and, as depicted previously [
1], there are multiple particles that are irregularly and shell shaped. The SEM-EDS microanalysis data given in
Table 1 indicates Cu, Se and Ag (spot n° 1, 4 and 5) are frequently associated. Sulfur and to some level tellurium are also found in the spots probed; finally, gold is identified frequently in the finest particles (spot n° 4 and 5). Several explanations for the particular state of CAS particles and their composition are provided in Part I [I] of this investigation and there are related mostly with the thermochemical reactions developing during smelting and refinery of copper.
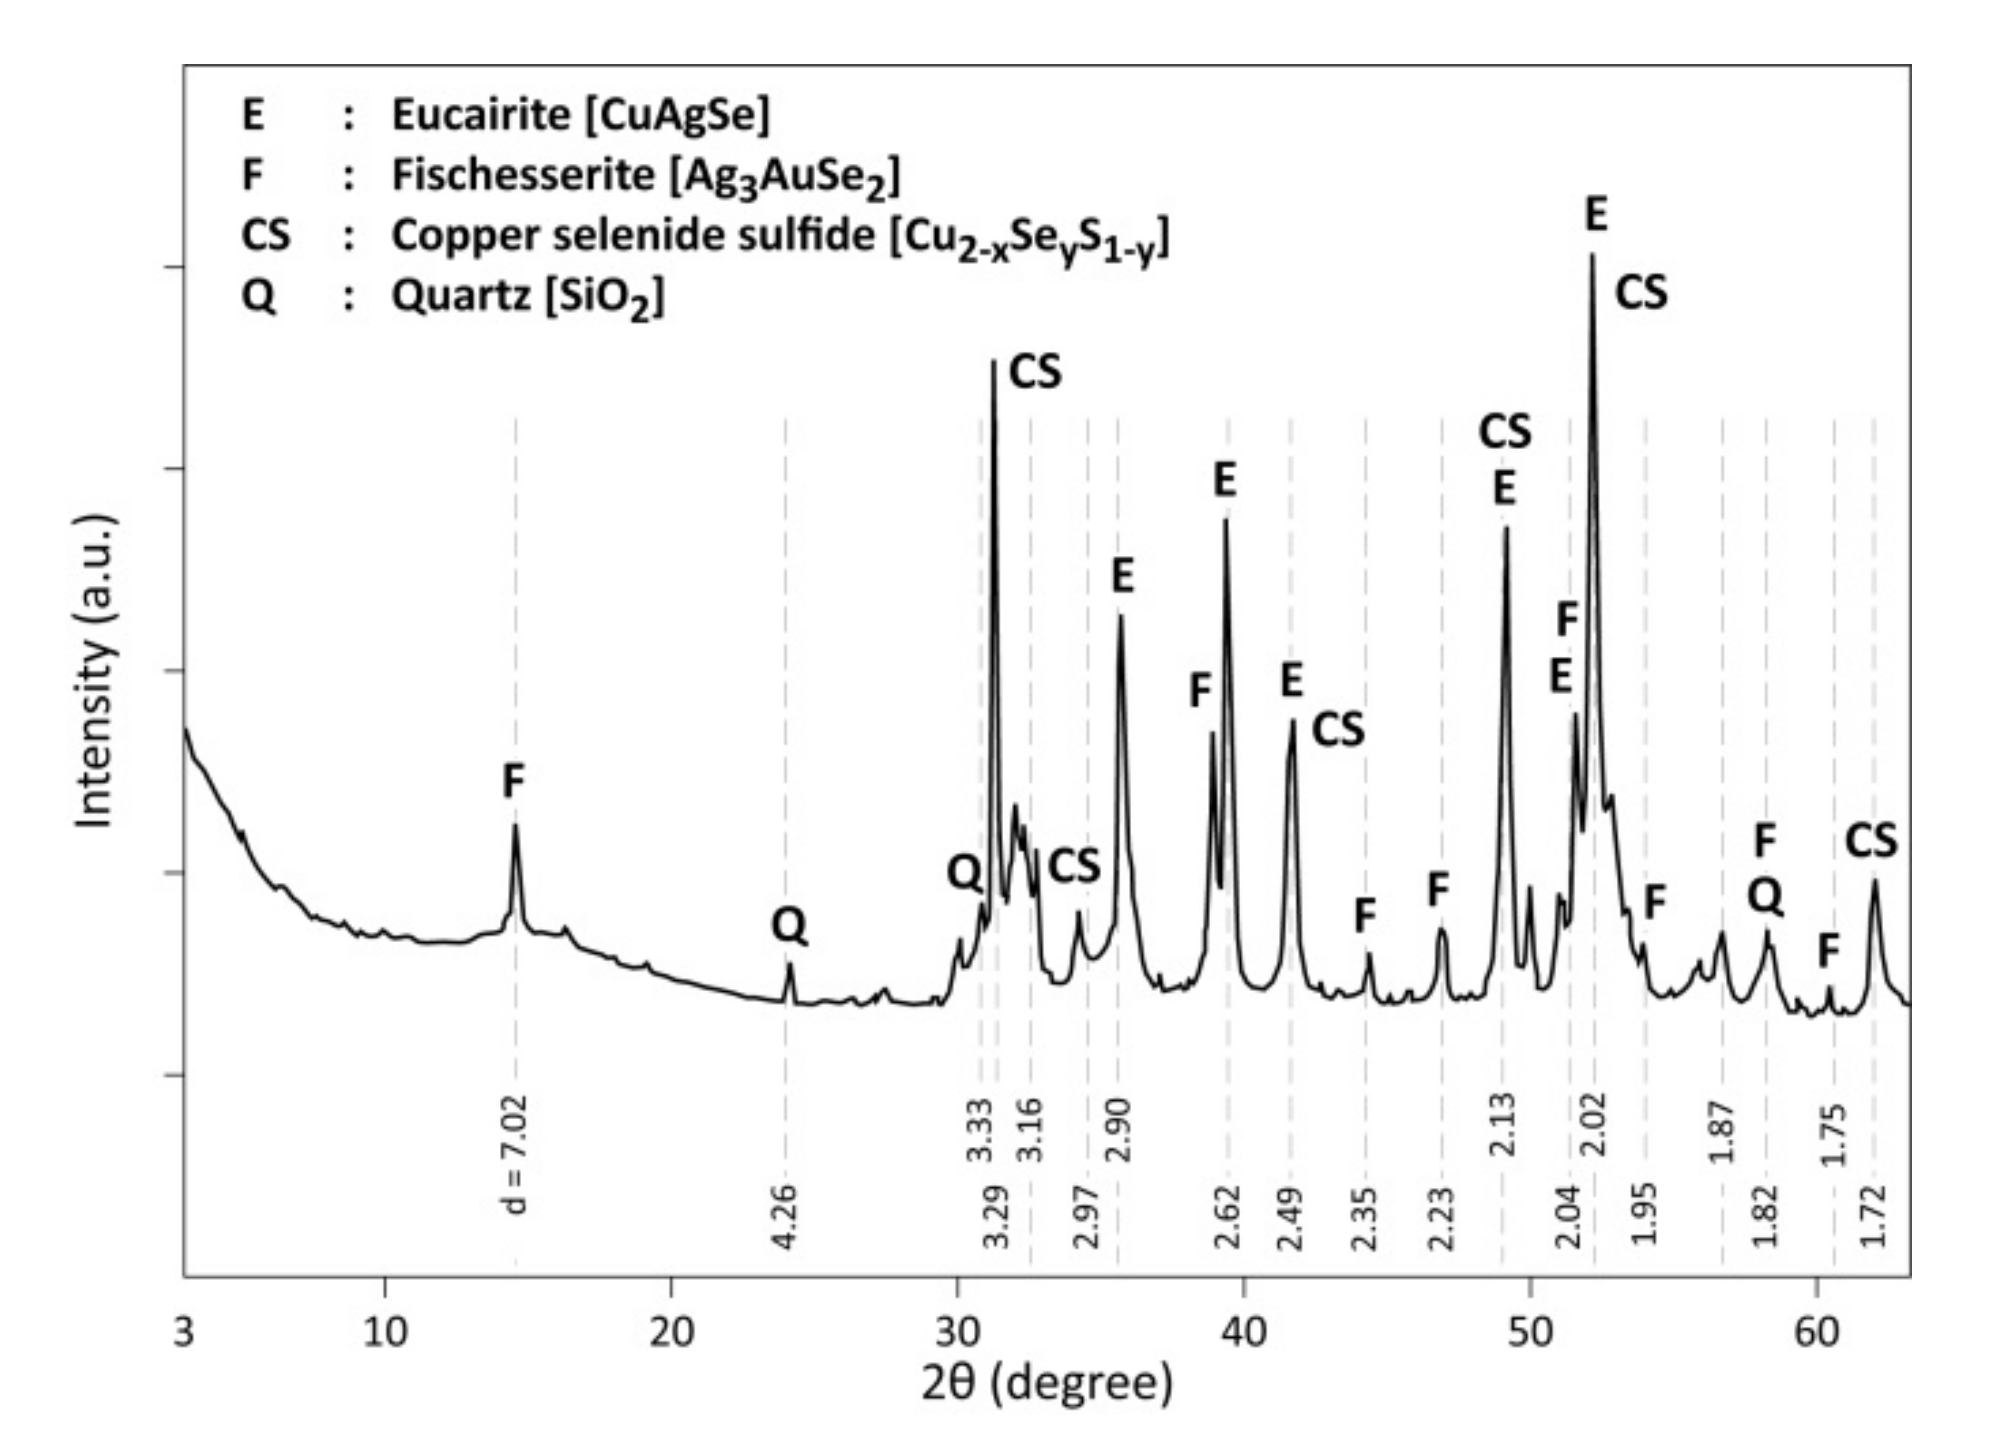
The XRD diffractogram of CAS is drawn in
Figure 4. It detects the presence of eucairite (CuAgSe), confirming the microanalysis performed by SEM-EDS. Furthermore, there are, in the diffractogram of CAS, some peaks corresponding to Cu
2Se, Cu
2S, CuSeS, as well as to non-stoichiometric compounds with an absence of certain peaks probably due to crystallite orientation and these phases are defined as copper selenide sulfide (Cu
2−xSe
yS
1−y). The XRD peaks for the Au-bearing phase match mostly with fischesserite (Ag
3AuSe
2). This phase composition (with substitution of Ag by Cu) is also revealed by SEM-EDS analysis (spot n° 4 and 5 in
Table 1). Finally, Quartz (SiO
2) completes the list of crystallized phases identified by XRD in the CAS sample.
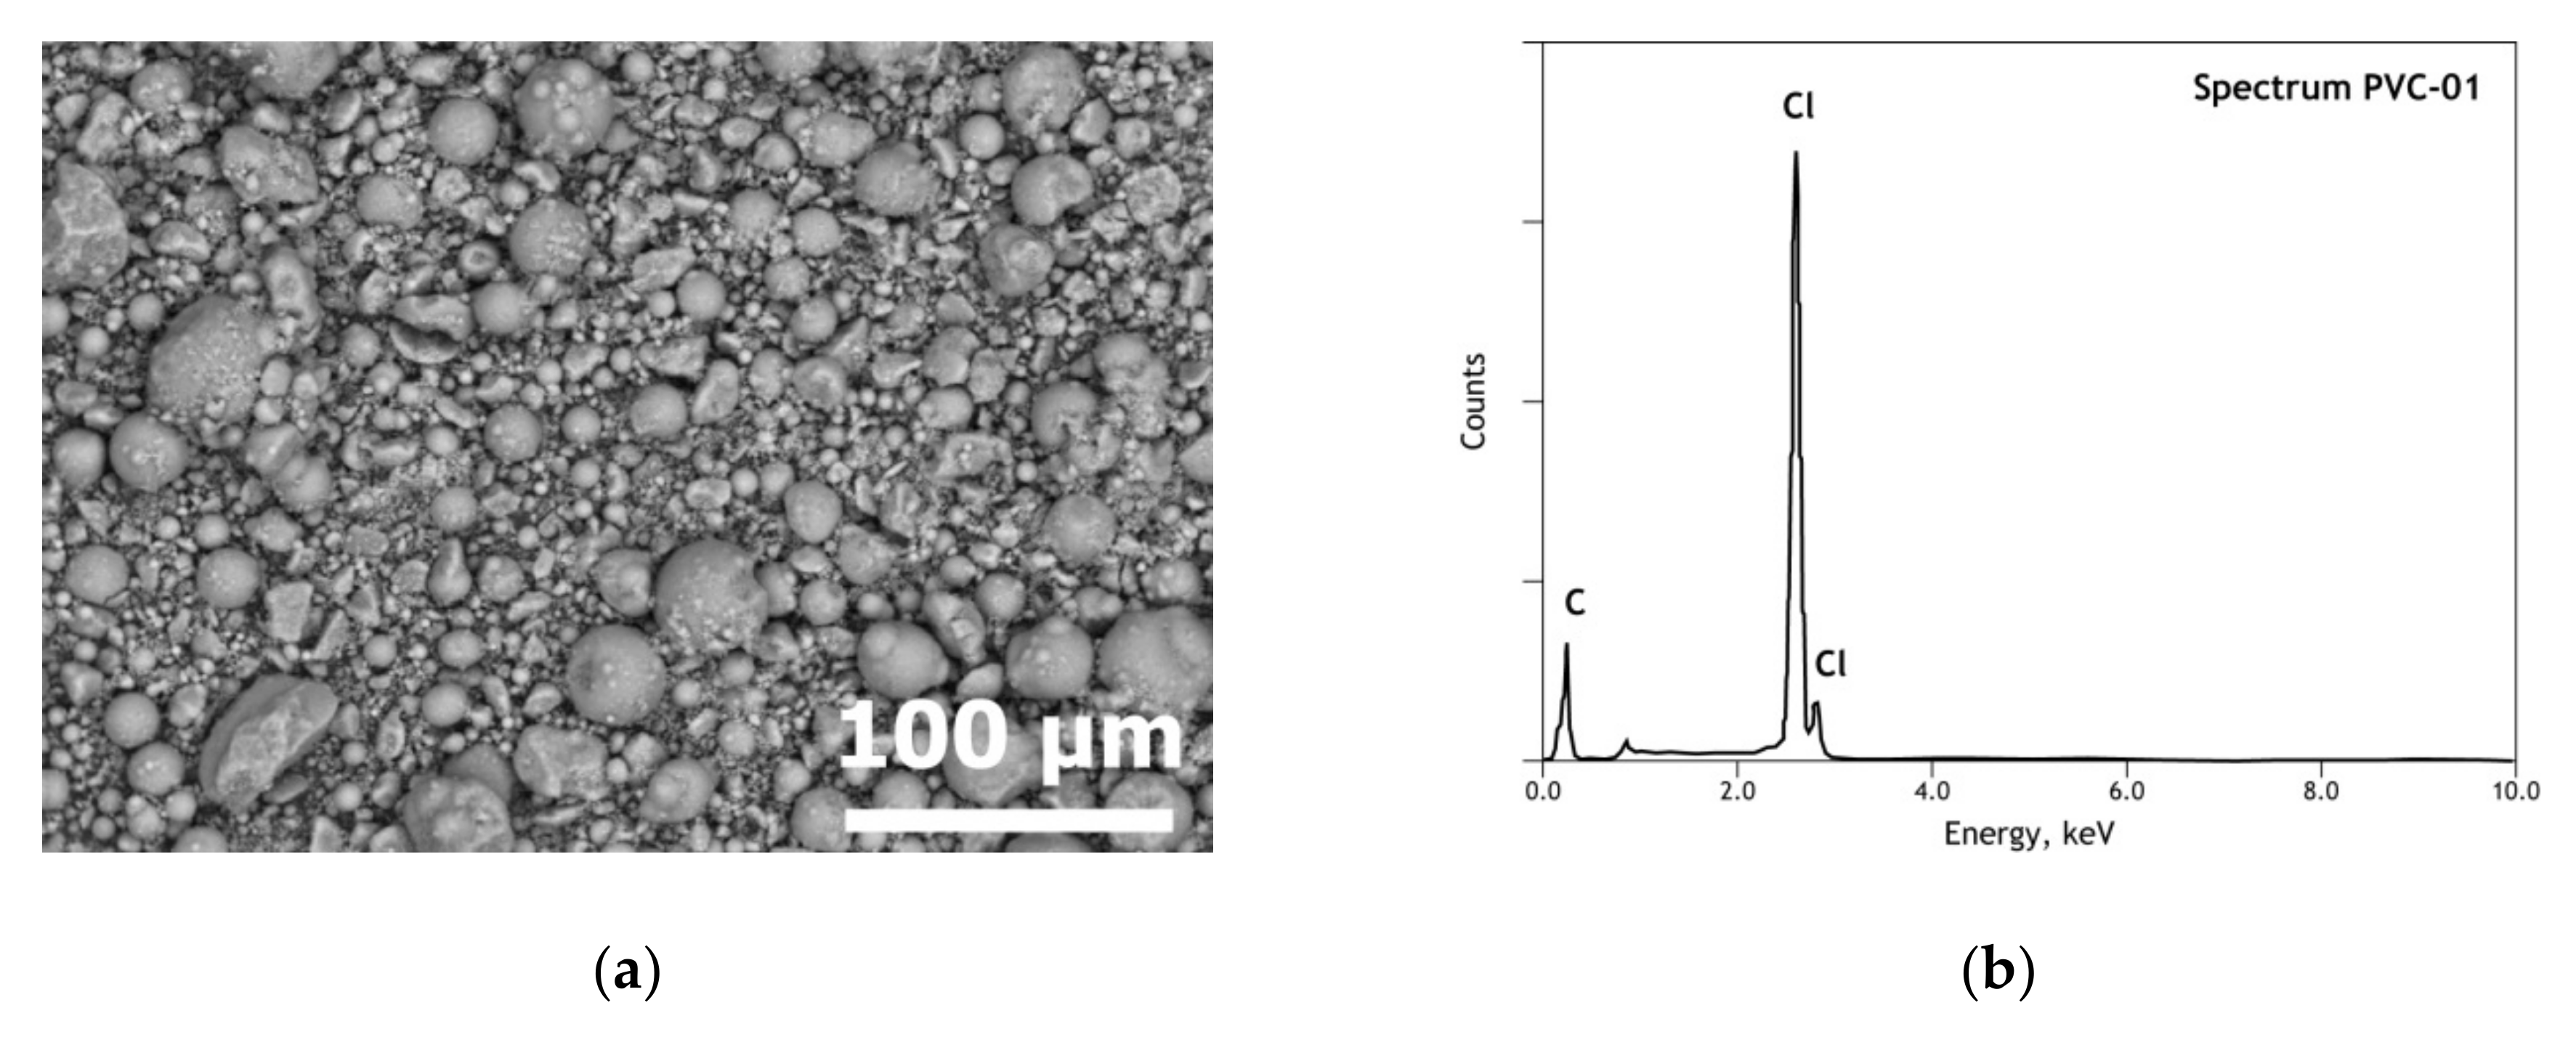
The pure PVC sample is constituted of near-spherical particles shapes of size less than 100 μm (
Figure 5a). As expected, chlorine and carbon are the only elements revealed (
Figure 5b) within the element detection threshold of the SEM-EDS instrument. The XRD pattern of the used PVC sample, exhibited several diffuse halos indicating the amorphous nature of PVC.
3.3. Analysis of the Reaction Products
Residues produced from isothermal processing of CAS + PVC under air atmosphere were evaluated by XRD and SEM-EDS techniques and results were compared with those obtained during the treatment of only CAS in air atmosphere.
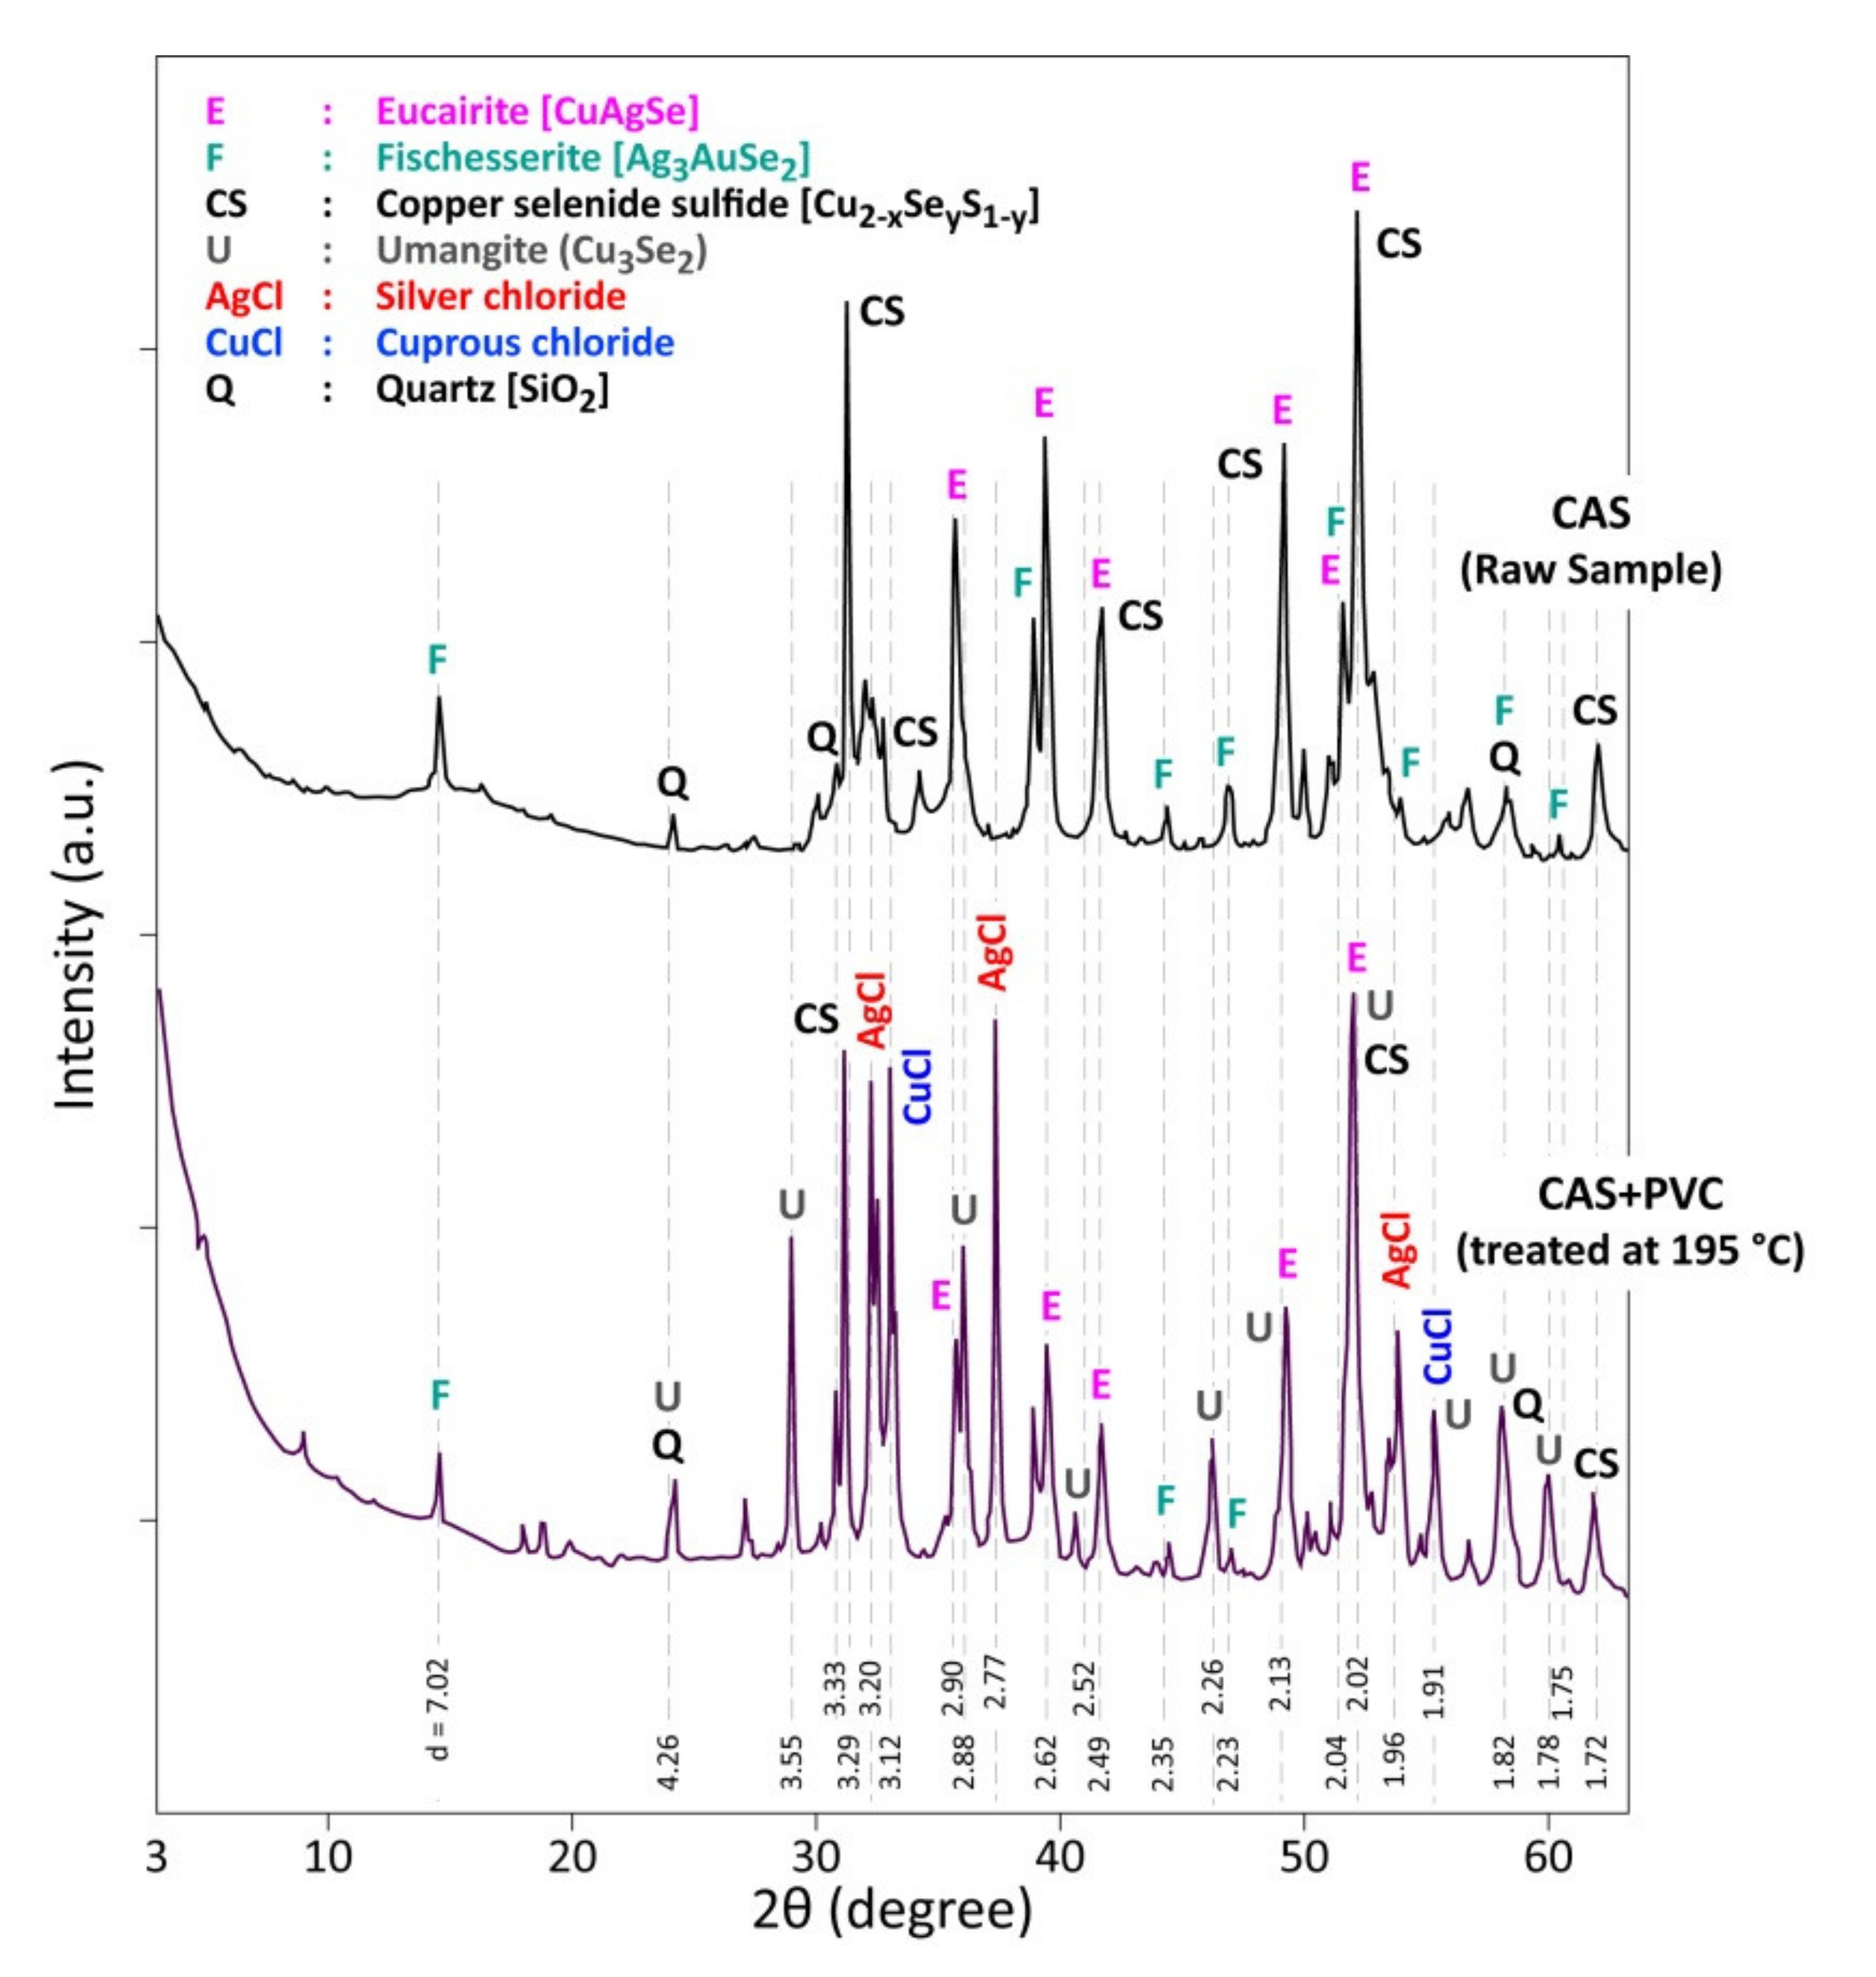
Figure 9 displays the XRD patterns of the residue of CAS+PVC treated at 195 °C. Besides the characteristic peaks of the initial CAS phases (CuAgSe, Ag
3AuSe
2, Cu
2−xSe
yS
1−y and SiO
2), there are new crystallized phases, namely cuprous chloride (CuCl), silver chloride (AgCl), and umangite (Cu
3Se
2). With this phase identification and based on thermodynamic calculations [
39], one can deduce that the following overall reactions may have occurred:
The standard Gibbs energy changes (Δ
rG°) at 100 °C [
39] for the reaction (1), (2) and (3) are −76.41, −116.19 and −68.84 kJ/mol HCl, respectively showing the thermodynamic reactivity of the targeted phases with respect to HCl in presence of oxygen. The selenium dichloride (SeCl
2) is considered for the thermodynamic calculation among the selenium chlorides (Se
2Cl
2, SeCl
2, SeCl
4, SeOCl
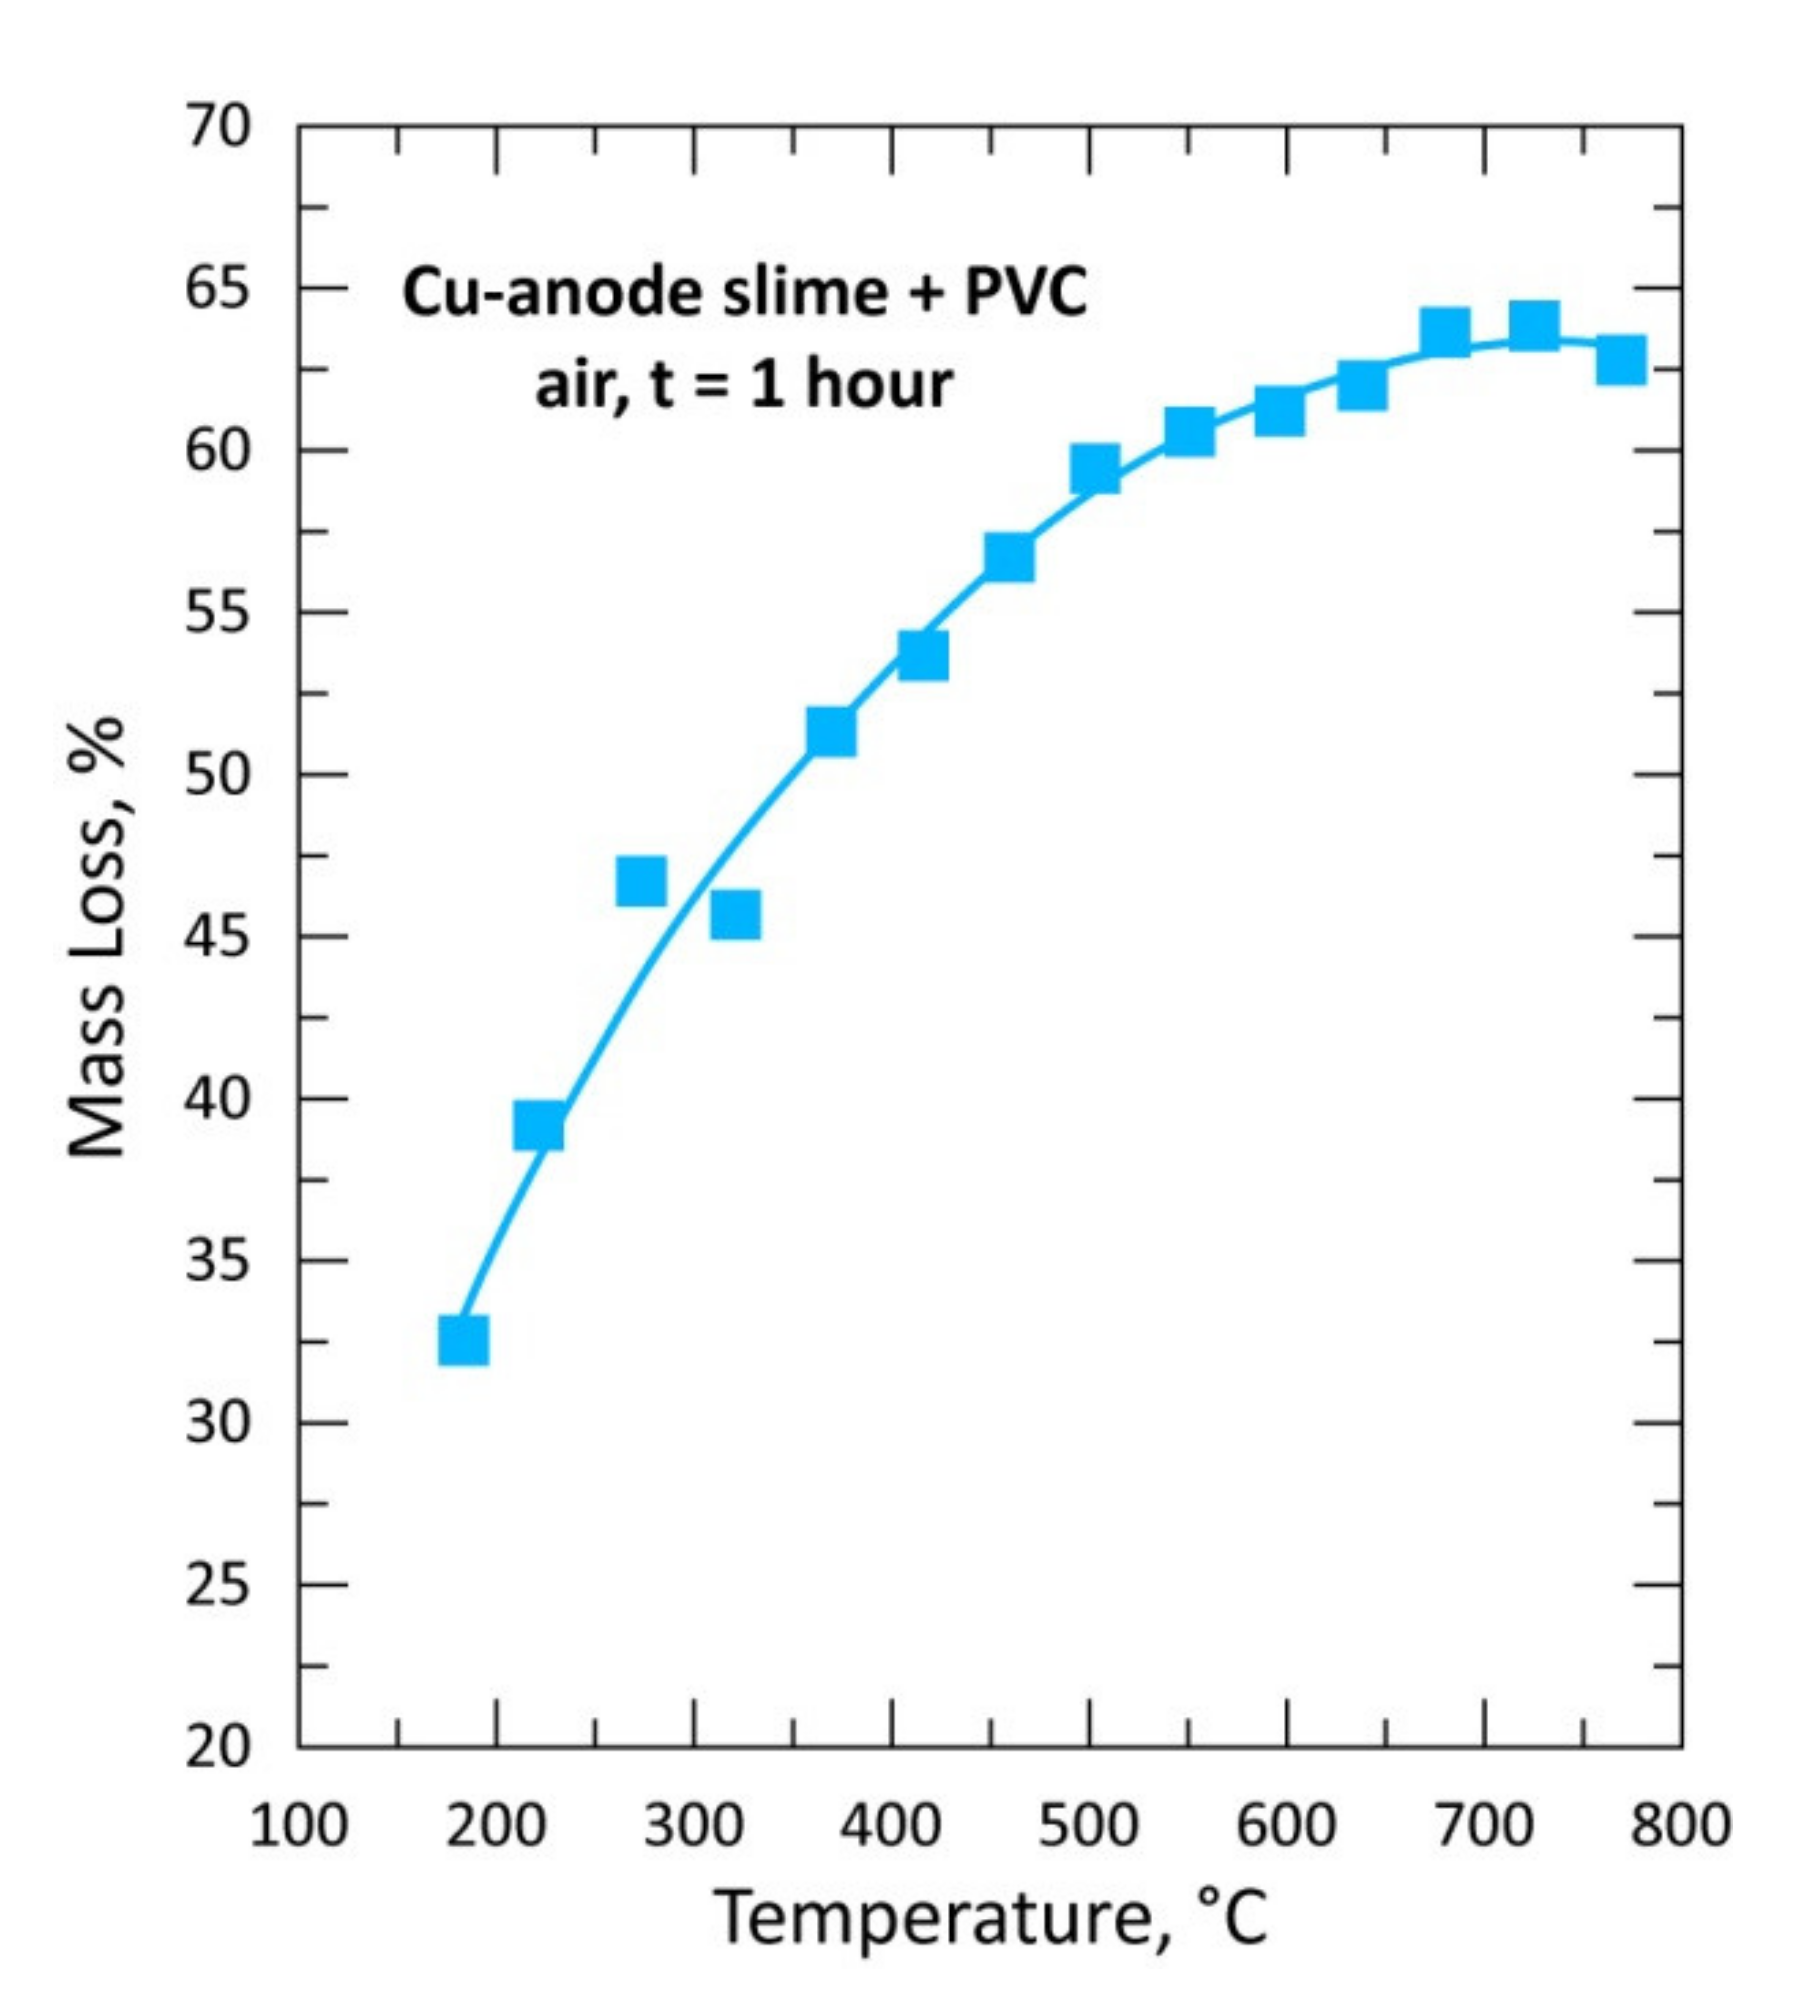
2), although it is difficult to give an exact reactional scheme of selenium chloride formation. However, the formation of CuCl (chlorine being in the PVC) instead of CuO and the volatilization of selenium chloride (s) explain the mass loss of sample (CAS + PVC) treated at low temperature (see
Figure 6). The characteristic XRD peaks of Cu
3Se
2 is observed in the XRD patterns of (CAS + PVC) treated at 195 °C (
Figure 9). The phase diagram of the system Cu-Se [
40] indicates the presence of Cu
3Se
2 which melted incongruently over 112 °C. One may assume that the Cu
3Se
2 appeared (Equation (2)) as a stable phase, perhaps during the sample cooling.
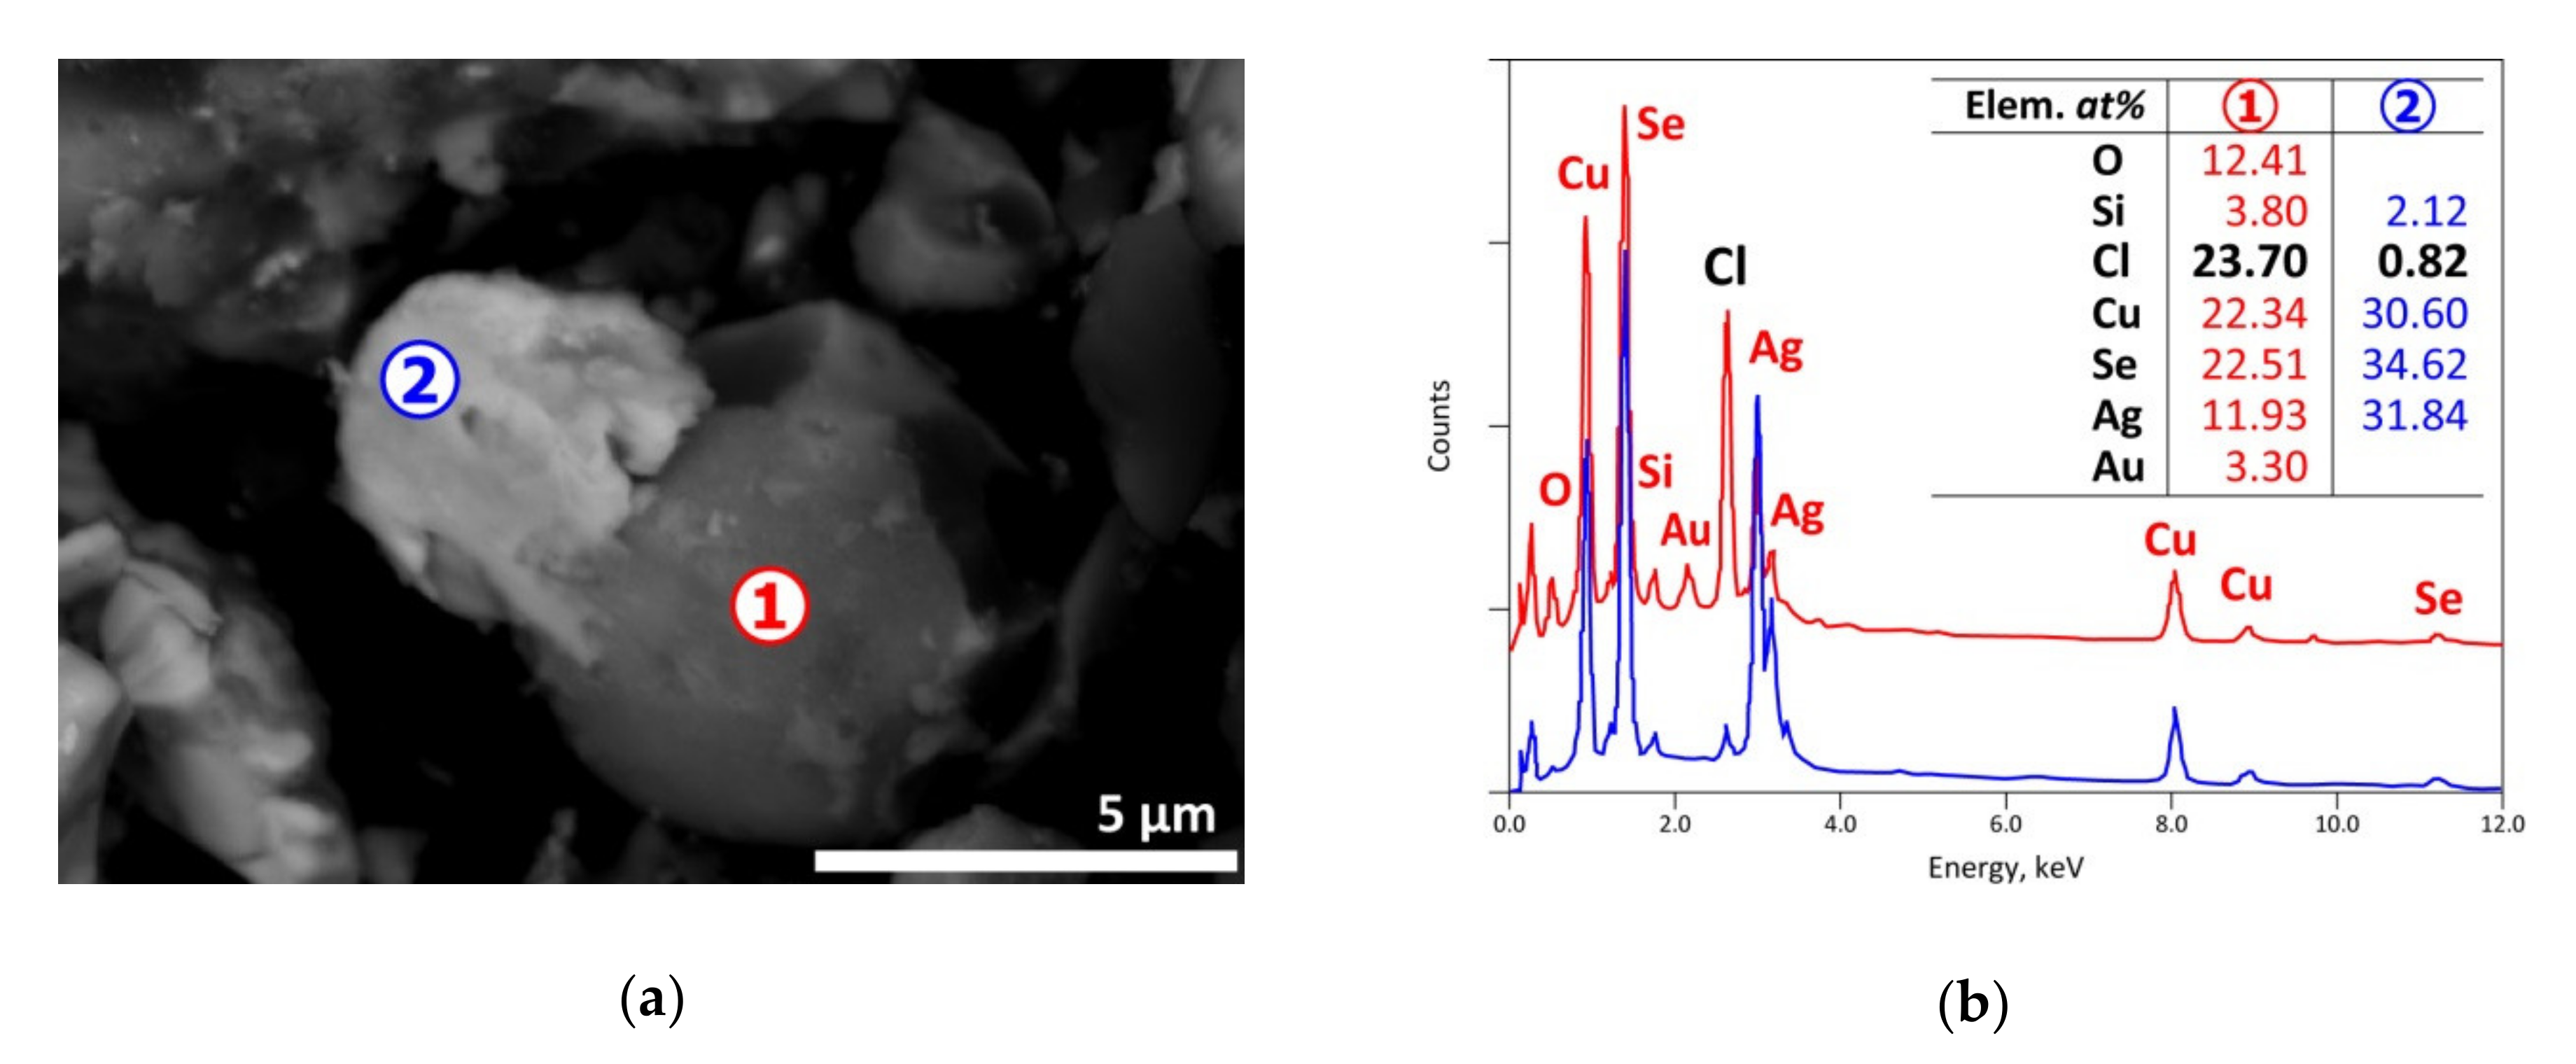
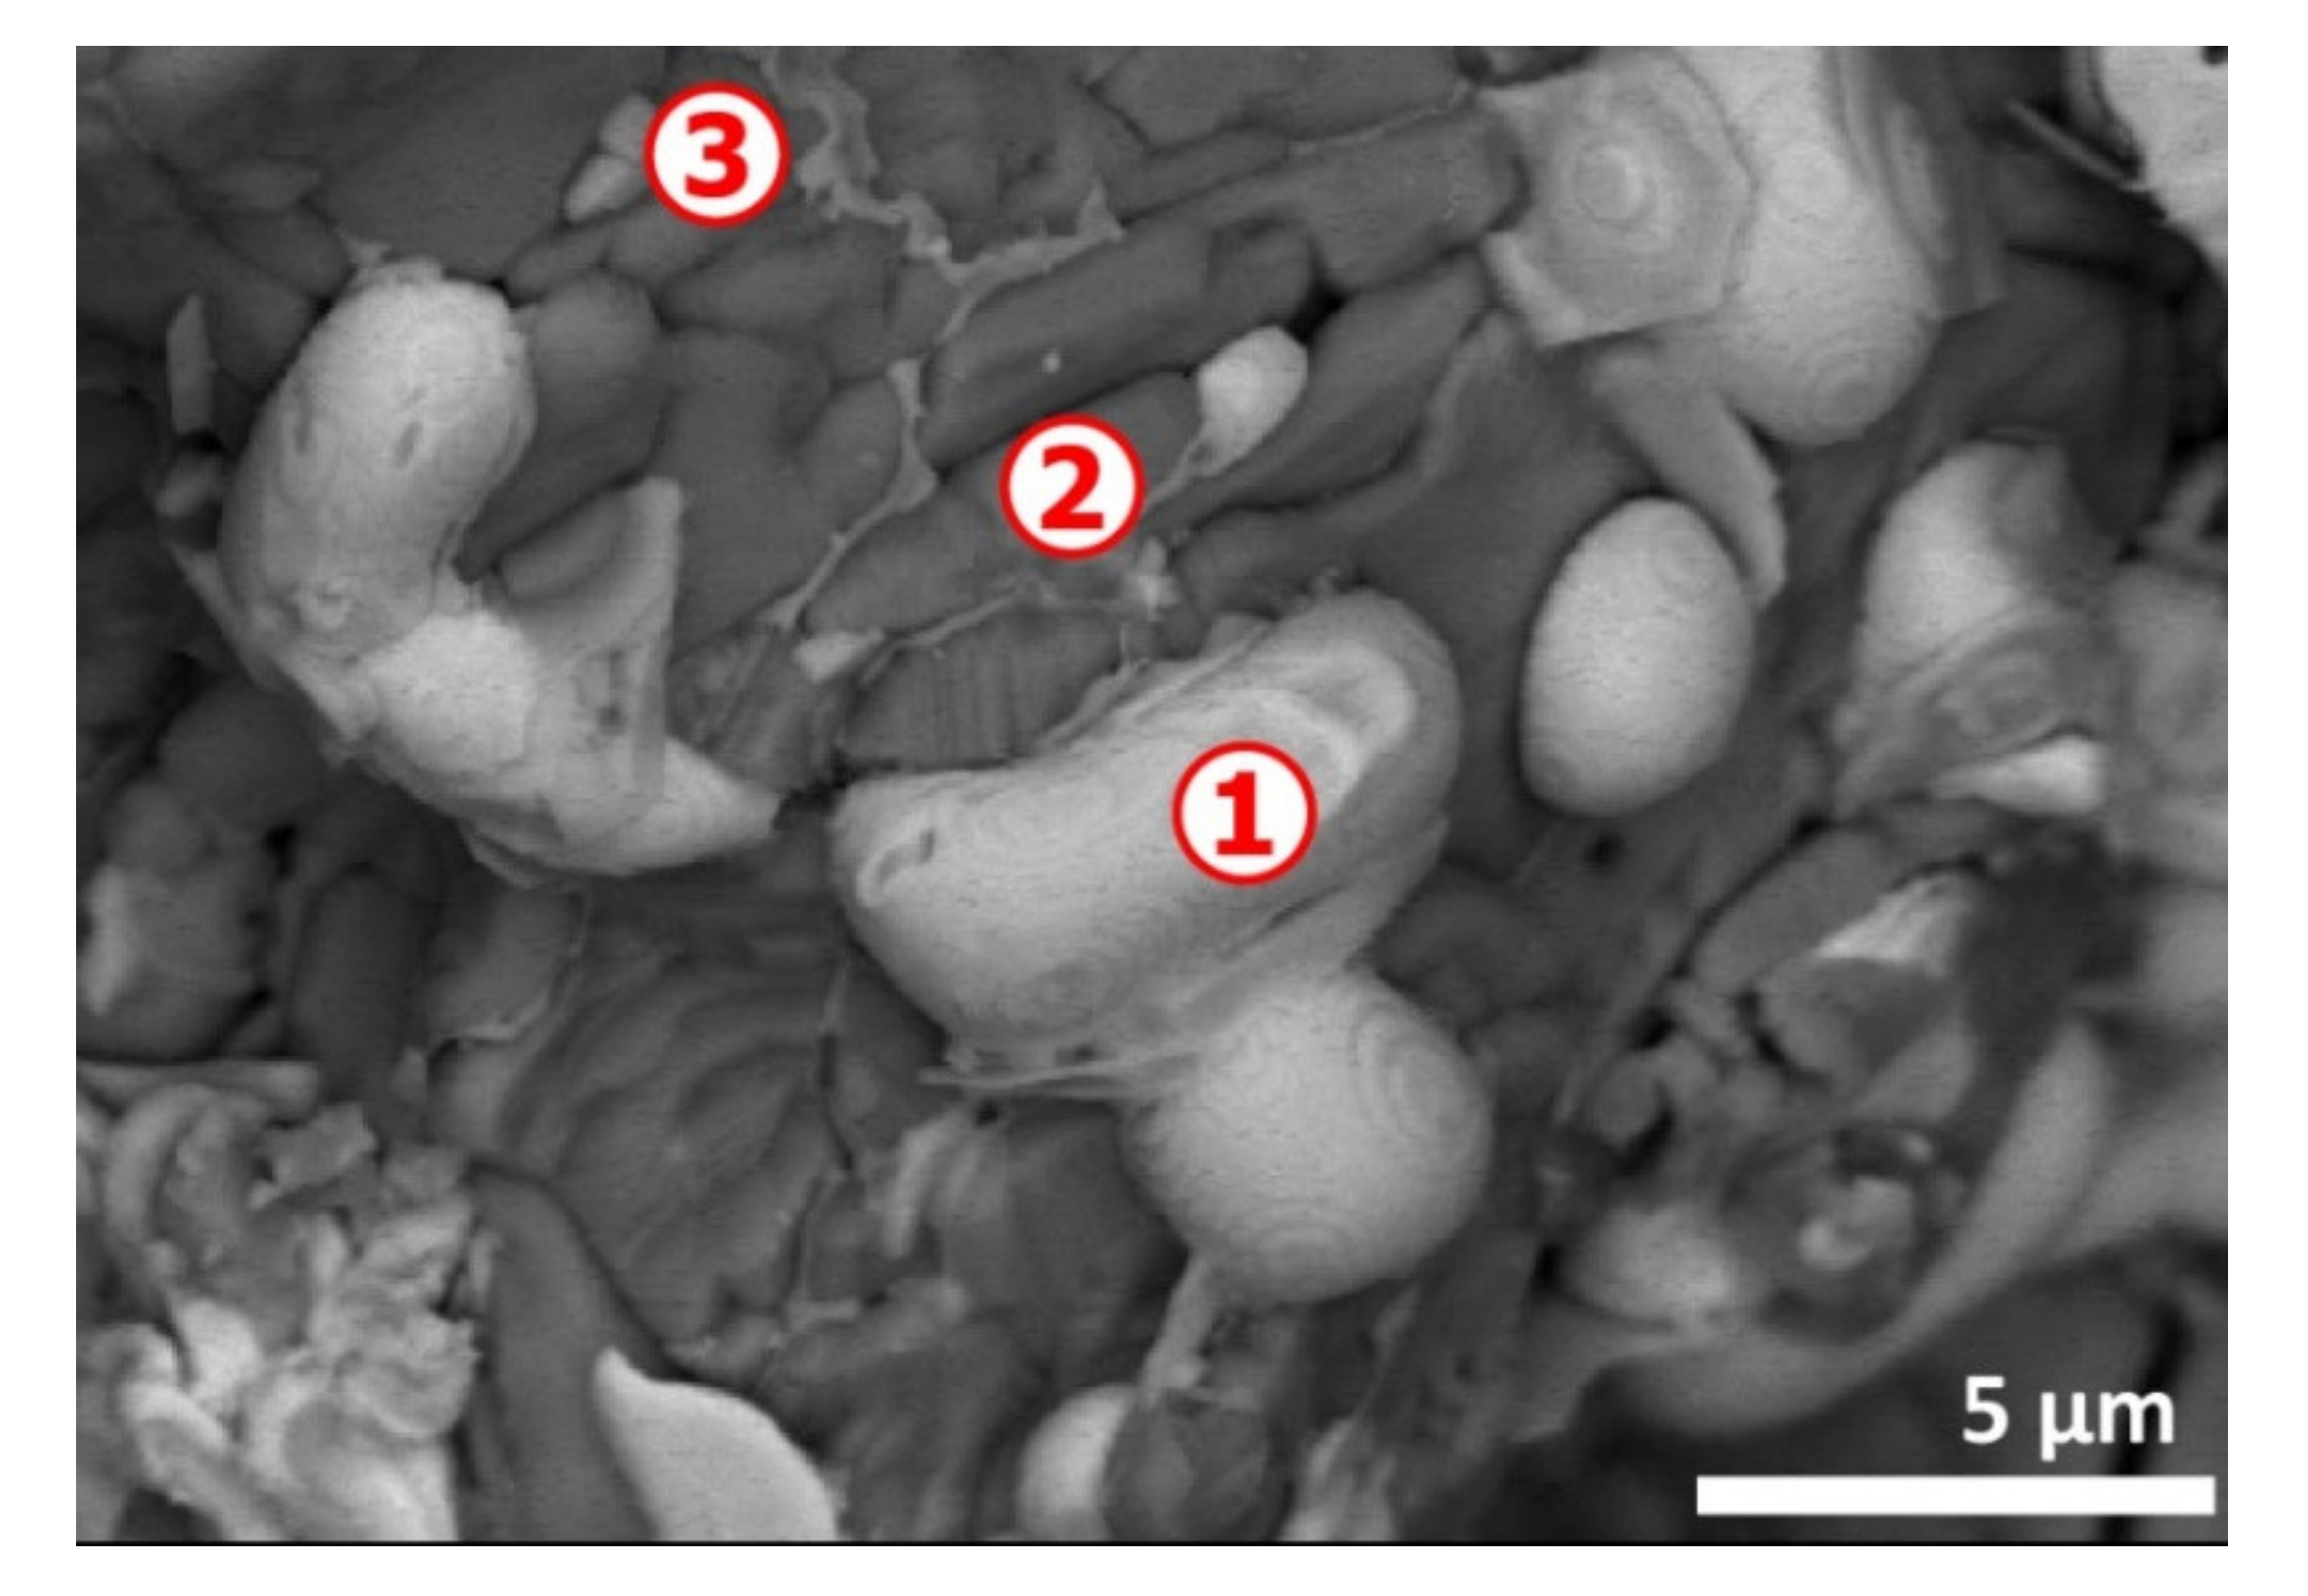
The presence of the partially chlorinated CuAgSe phase is observed by SEM-EDS examination for a residue obtained at 225 °C. The spot n° 2 of
Figure 10 seems to indicate a small particle likely to be the CuAgSe phase. Its neighbor (spot n° 1) should be a mixture between the CuAgSe phase and Cu-Ag chlorides that are in solid state at this temperature.
The XRD results of the residues (CAS+PVC) obtained at temperatures higher than 320 °C show a good similarity with those obtained during the treatment of CAS in the absence of PVC. However, as shown in
Figure 11, the decomposition of neo-formed combined oxides [e.g., Cu
4O(SeO
3)
3] and the appearance of new phases [e.g., CuO], occurred apparently, at lower temperatures in the case of CAS treatment in presence of PVC. One of the plausible hypotheses is that the temperature in the reaction zone can be significantly higher than the fixed furnace temperature due to the highly exothermic nature of the reactions of the PVC degradation under oxygen. Such exothermic phenomena were also observed previously during the treatment of only 2 g of sulfides with chlorine at 300 °C resulting in a temperature increase in the reaction zone of about 30 °C [
41,
42].
A summary of the crystalline phases identified by XRD in the treatment residues obtained during the treatment of CAS and that of the mixture (CAS + PVC) in air for 1 h is given in
Table 2 and
Table 3, respectively. As shown in
Table 2, the phases of the residue obtained at 225 °C are those revealed in the CAS raw sample. Eucairite (CuAgSe) is still stable at 320 °C, while the characteristic peaks of Cu
2-xSe
yS
1-y and Ag
3AuSe
2 phases disappeared at this temperature. The XRD of residue produced at 320 °C indicated the formation of new phases such as: [Cu
4O(SeO
3)
3], [Cu
2O(SeO
3)]. Metallic silver is also identified in this treatment residue; note that the main XRD peaks of Ag° and Au° are overlapped. The panorama of the residues phases at 415 °C is identical of that of 320 °C, though the intensities proportion of phases changed suggesting the appearance of new phases.
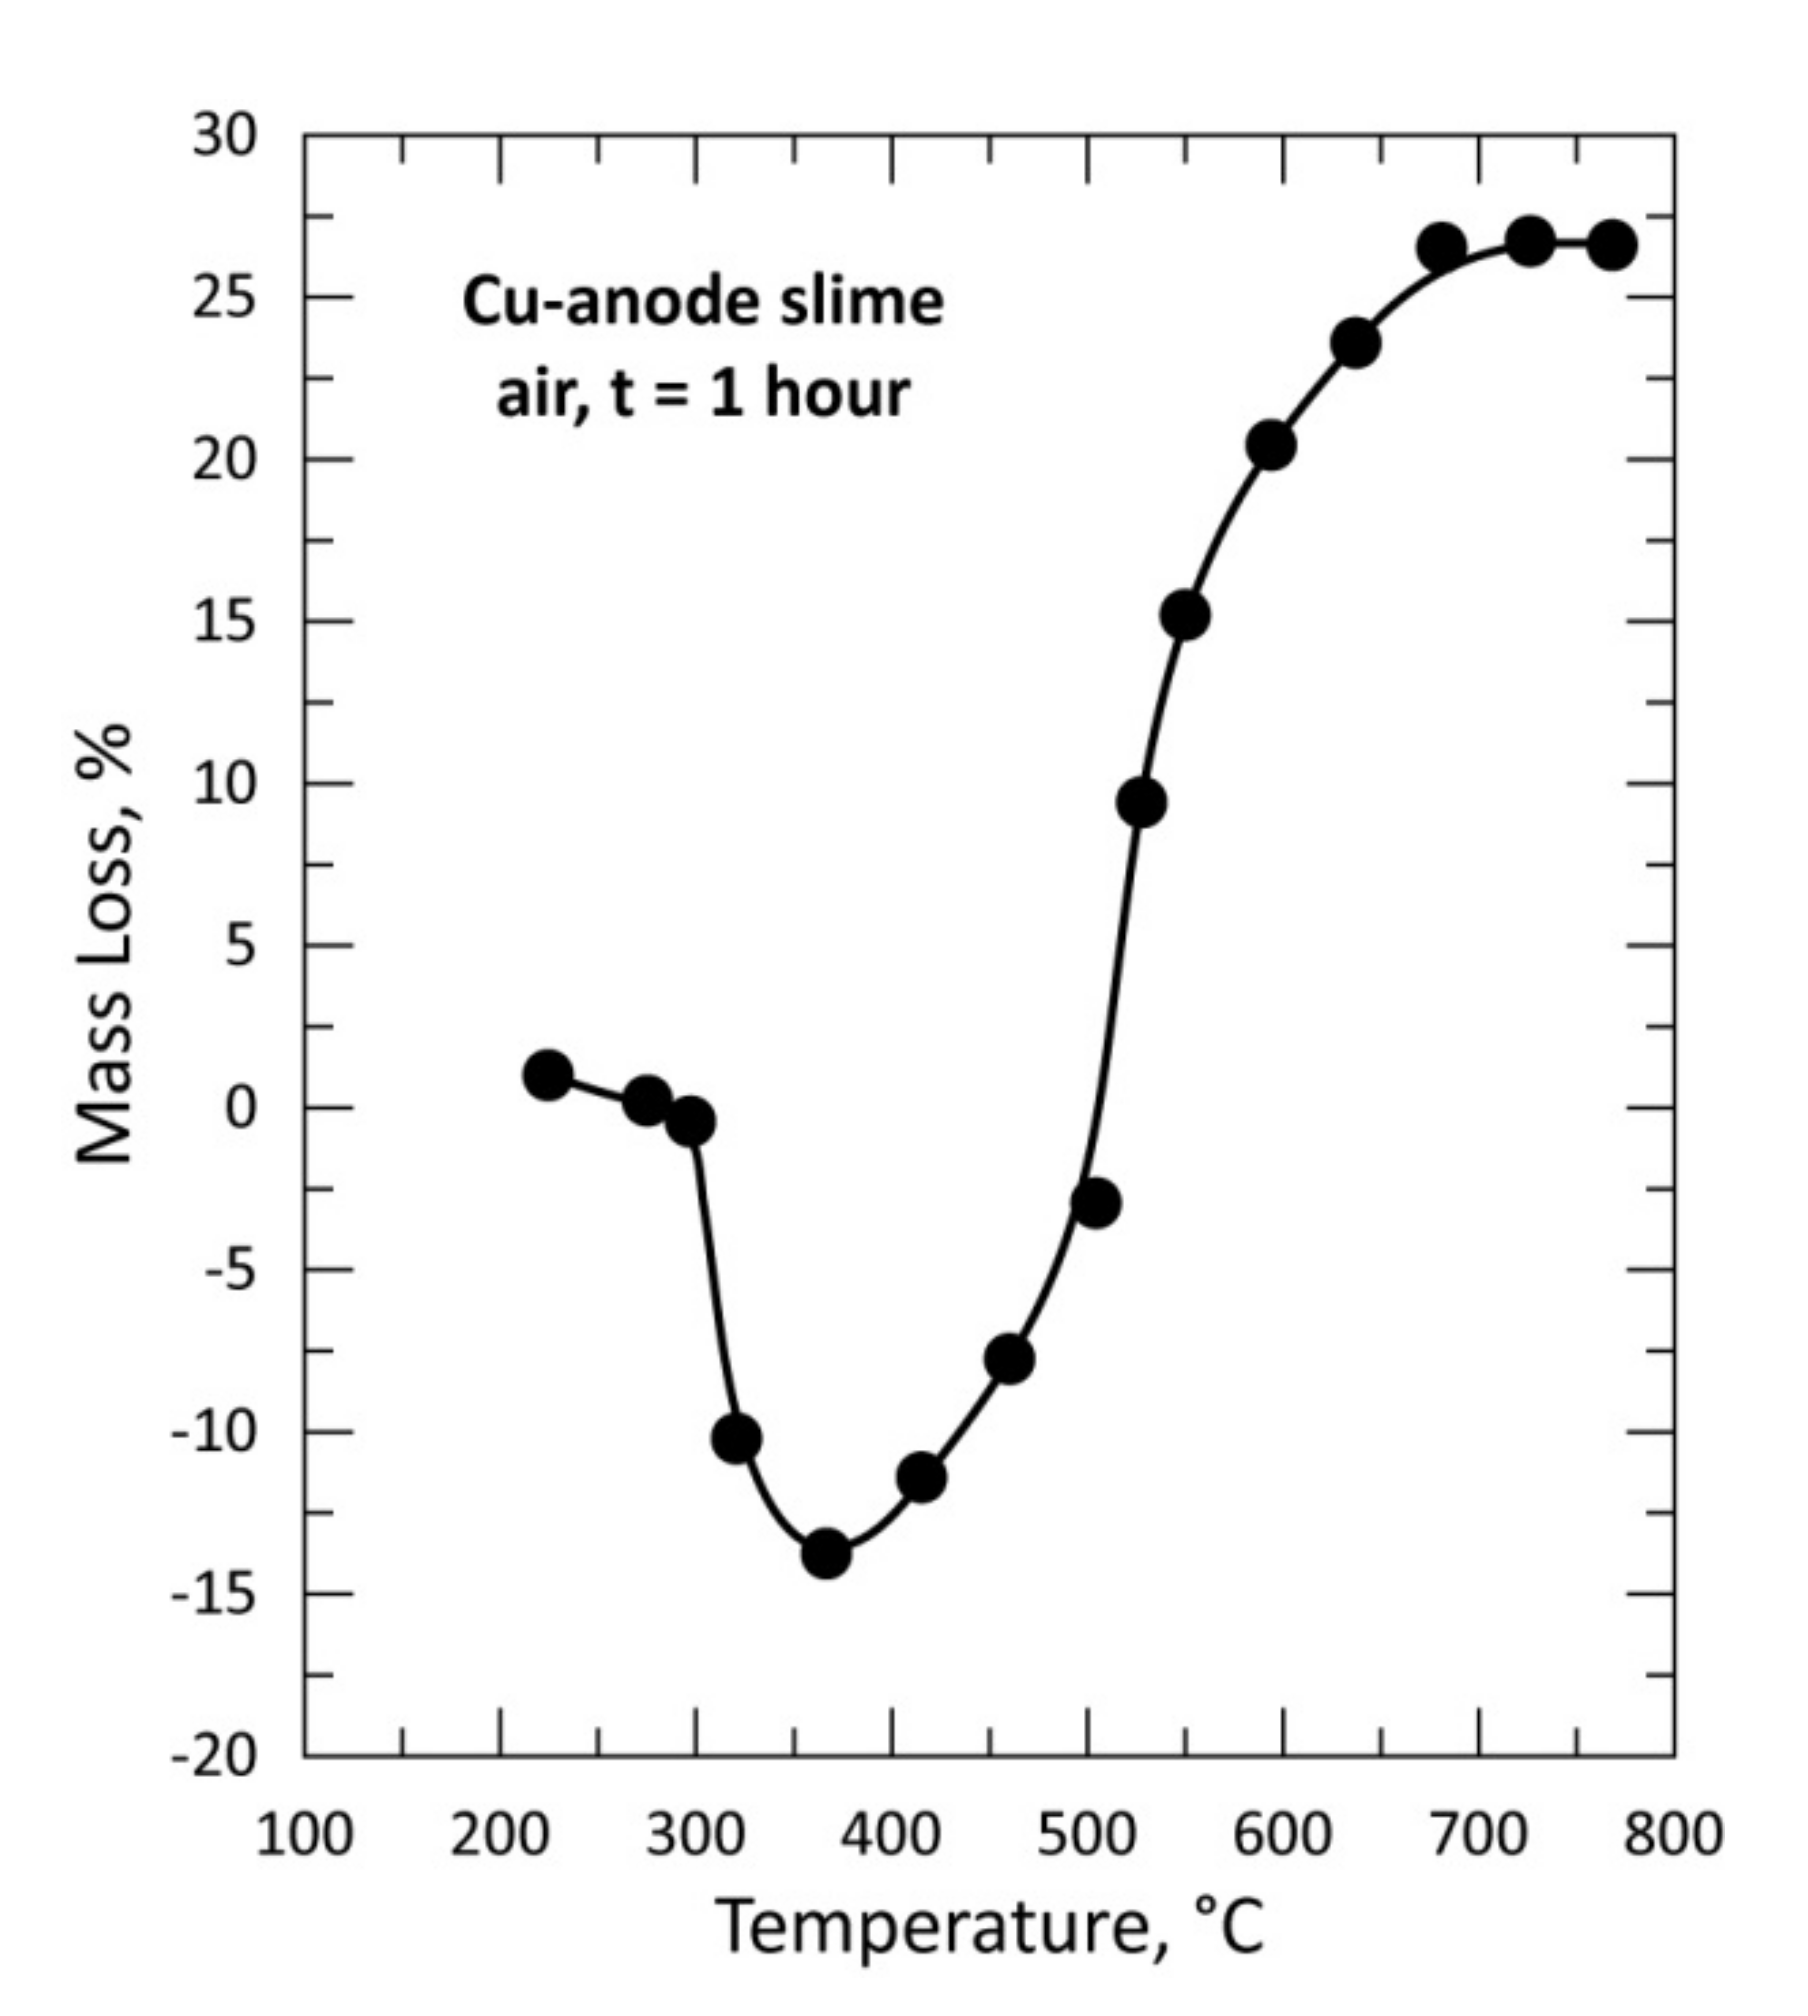
At 505 °C [Cu
2O(SeO
3)] is still the main crystallized phase, but tenorite (CuO) is also identified and becomes the main phase at higher temperature. According to the data reported in Part I [
1] and those given by Fokina et al. [
43], the two steps of Cu
4O(SeO
3)
3 conversion into CuO and SeO
2 as final products can be described by Equations (4) and (5):
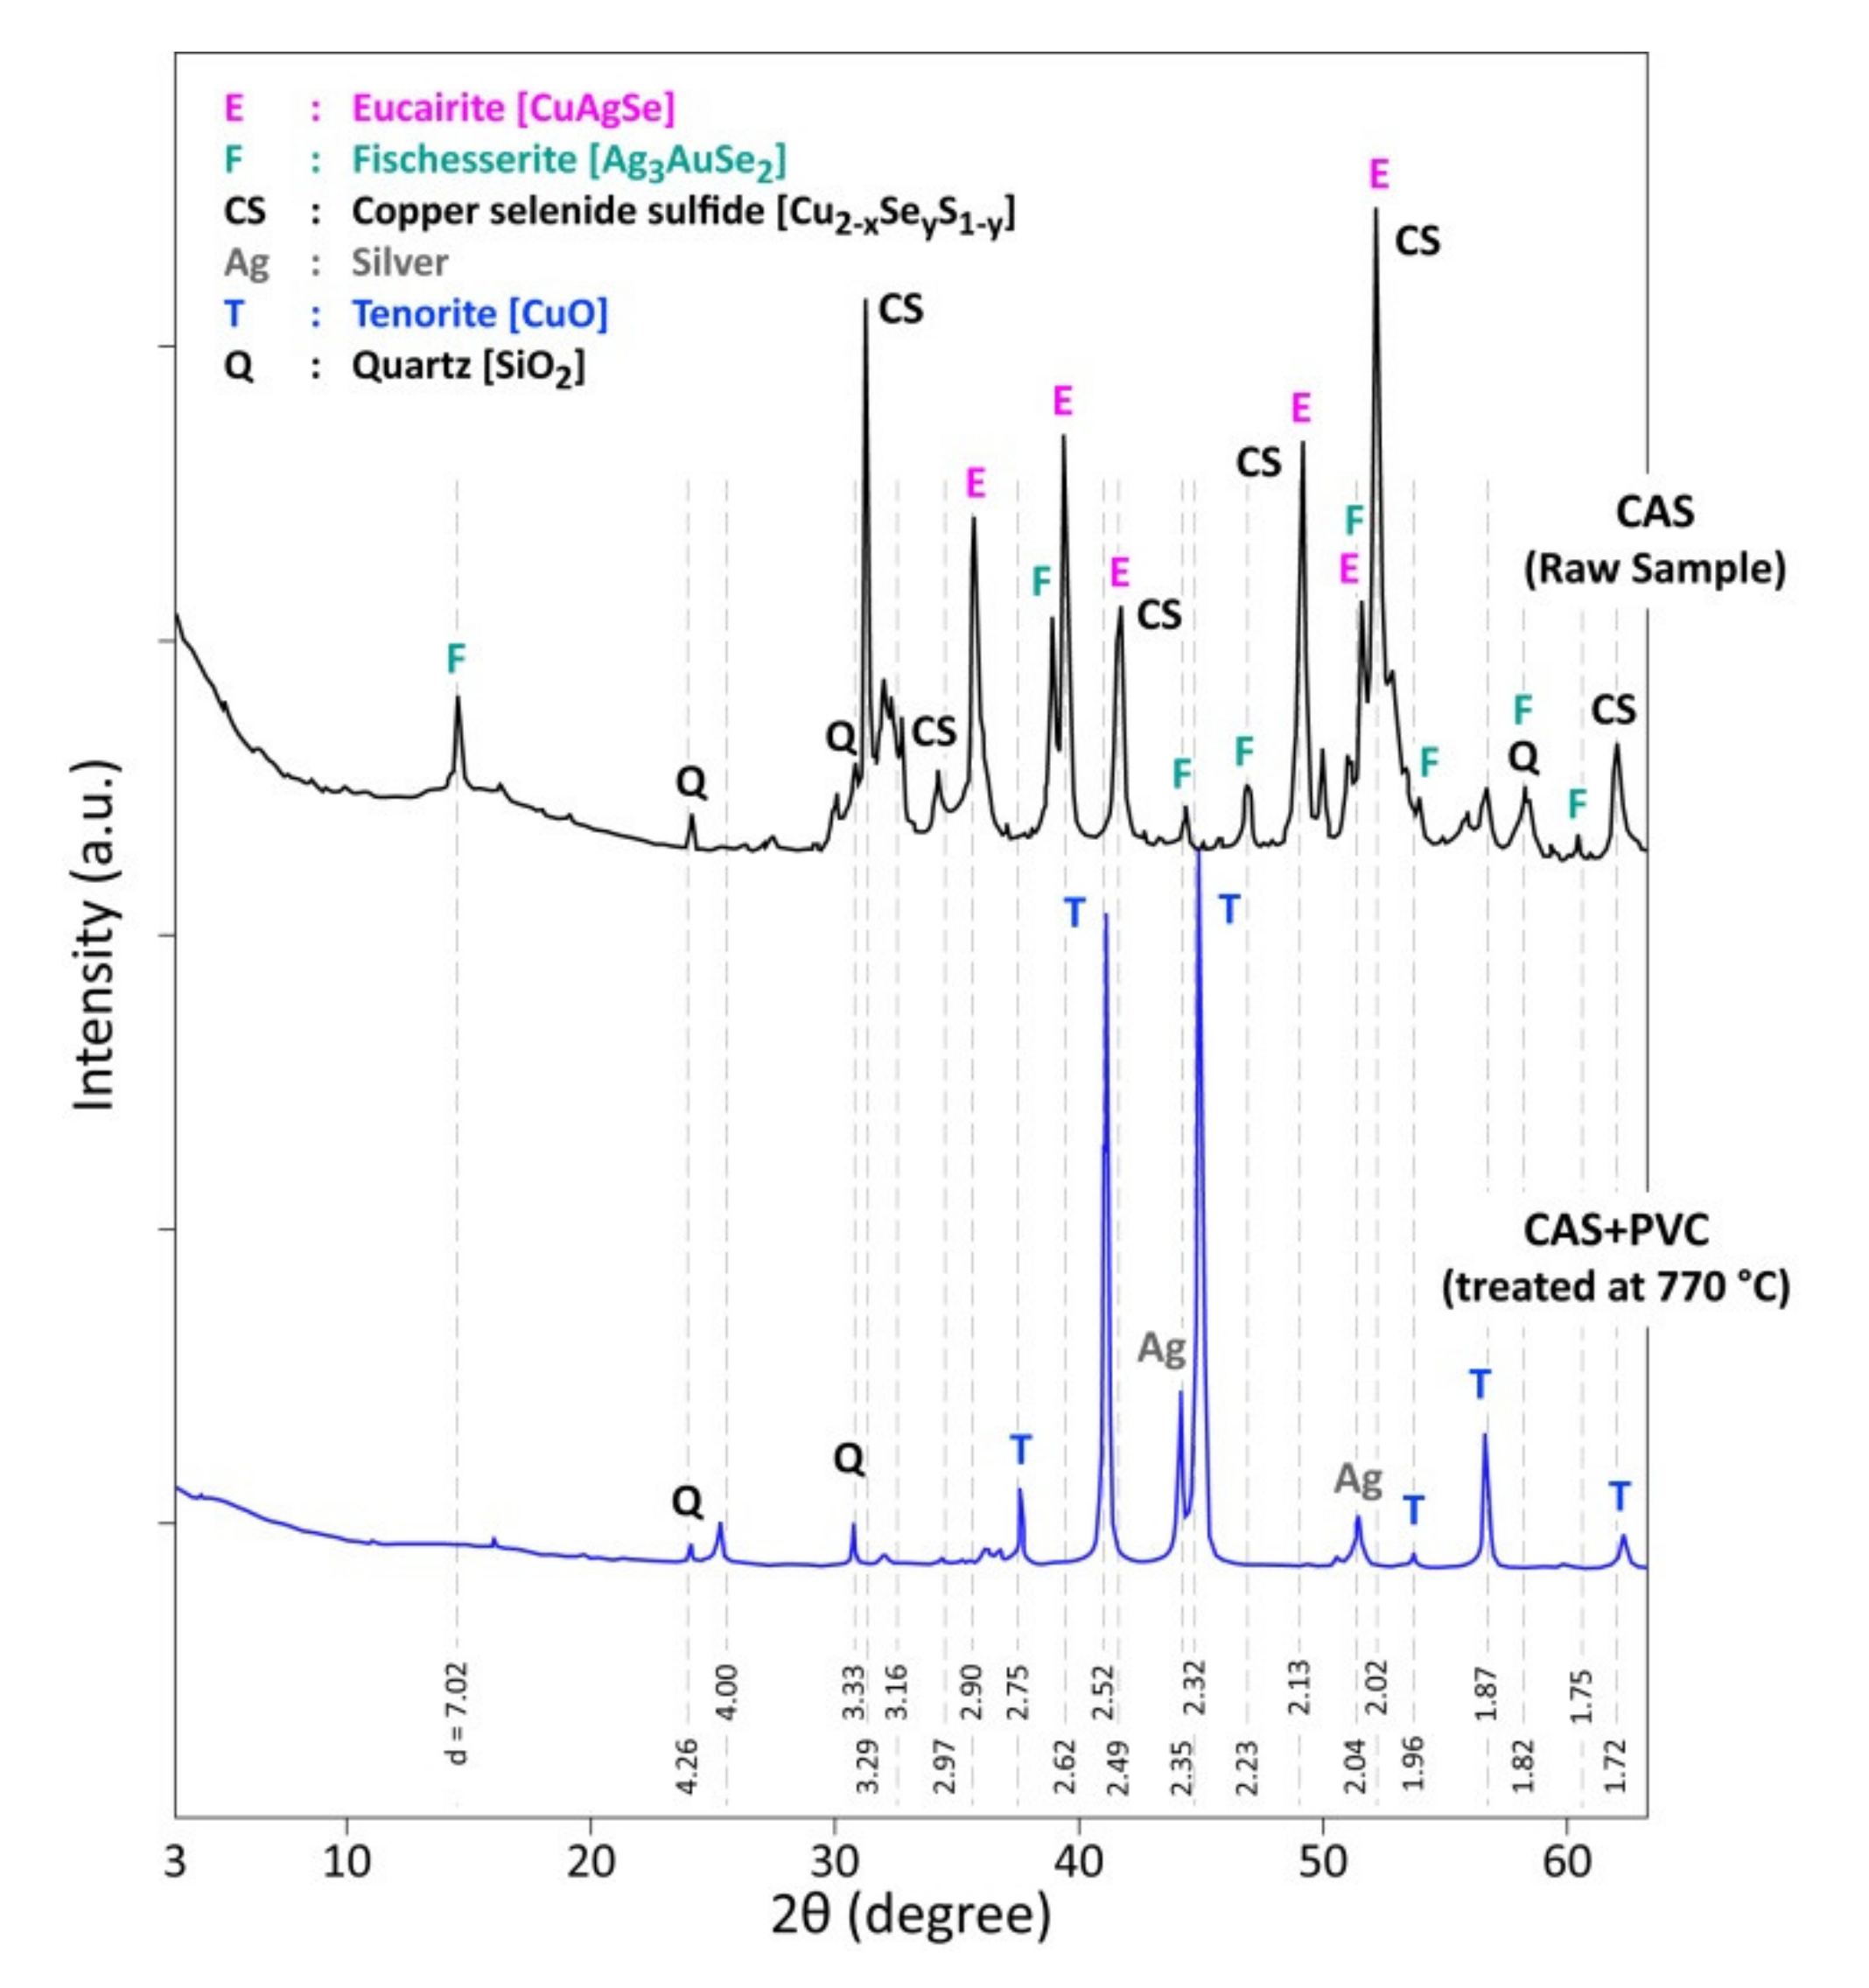
Analysis of the XRD diffractograms for the residues obtained at 685 °C and 770 °C confirms the presence of well-crystallized phases of silver (Ag°), tenorite (CuO) and quartz (SiO2), which was present in all analyzed residues.
The reaction of HCl released during the partial degradation of the PVC with CAS at 195 °C (
Table 3) led to the synthesis of new crystallized phases such as: CuCl, Cu
3Se
2 and AgCl which are still identified in the treatment residue obtained at 225 °C because at this temperature the rate of de-chlorination of PVC is slow and continuously producing the necessary HCl for 1 h of the experimental test (see
Figure 8). At 320 °C, the phases identified in the treatment residues of CAS in the absence (
Table 2) or in the presence of PVC (
Table 3) are similar. One may hypothesize that starting from this temperature treatment, the kinetic of chlorine production (as HCl) from PVC accelerates, hence the contact time between CAS constituents and HCl gas is quite short. Furthermore, the used PVC is in powder form, which means that the temperature is almost uniform across the particles leading undoubtedly to the simultaneous and instantaneous de-chlorination of the PVC.
As mentioned above, a neo-formed phase such as CuO produced from thermal decomposition [Cu2O(SeO3)] via Equation (5) occurred at apparent lower temperature (at 415 °C) attributed to the heat release from constituents’ interaction in the sample mixture (CAS + PVC). Besides, the characteristic peaks of Cu2O (d = 2.46 Å and d = 2.13 Å) appeared also in the XRD patterns of residues obtained at 415 °C and 505 °C exhibiting the effect of the carbon on the oxidation state of copper. These diffraction peaks are of low intensity for a temperature higher than 550 °C.
The XRD diffraction patterns of products for both CAS treatments are similar for the temperature higher than 505 °C (
Table 2 and
Table 3). The XRD patterns of a CAS raw sample and its reaction product issued from the thermal treatment of CAS + PVC at 770 °C are compared in
Figure 12. With a complex phase composition of a raw CAS sample (CuAgSe, Cu
2−xSe
yS
1−y, Ag
3AuSe
2 and SiO
2), the treatment residue at 770 °C is free of the selenium-bearing phase and it is composed of CuO, SiO
2 and Ag° (and Au°).
The EDS analysis of spot n° 1 (
Figure 13) showed that Ag° (84.4 wt%) was the major constituent with some Au° (13.4 wt%) and Cu° (2.2 wt%). All smoothed particles had similar composition. The area noted by spot n° 2 was essentially composed of copper and oxygen with oxygen deficit to be CuO. The small area noted as n° 3 seemed to be composed of copper, silver and tellurium oxide (TeO
2).
Likewise, the thermal treatment residues were examined by SEM-EDS.
Figure 13 illustrates a typical morphology with a strong contrast indicating areas of distinct compositions. Data of SEM-EDX analysis of spots n° 1, 2 and 3 are reported in
Table 4. The presence of well smoothed particles (image in
Figure 13) indicates that the smelting of the metallic phase had been occurring during the treatment. Although the melting points of pure metals (Cu, Ag, Au) are higher than the temperature of the experimental tests, according to phase stability diagrams [
40], the liquid phase appeared at temperatures lower than those of the fusion point of these metals. Furthermore, the heat release from the exothermic reactions can increase the sample temperature leading to local fusion of the treatment residue.
The chosen copper anode slime sample contained a significant amount of selenium and tellurium, which belong to the scattered elements category [
44]. As reported previously [
45,
46,
47], these elements are used in thin films (CIGS—copper indium gallium selenide, and CdTe—cadmium telluride) and used in second-generation modules of photovoltaic panels. Recovery of these elements from by-products, end-of-life solar photovoltaics and other wasted materials will be a challenge of future research works to meet the volume of industrial demand.
These results encompassed some characteristics for the thermal treatment of a copper by-product in the presence of PVC and allowed us to understand the behavior of selected element compounds during the process. However, end-of-life materials (especially electric and electronic devices) are generally more complex in elemental, chemical and mineralogical composition of inorganics, with the presence of various organic matters and additives incorporated for enhancing the functional and commodity properties of the designed appliances.
The following section gives an idea about the interaction of bromine-bearing substances with valuable metals of an e-waste (printed circuit boards—PCBs).
3.4. Preliminary Results for Treatment of E-Waste in Air
Several selected research works [
10,
11,
48,
49,
50,
51,
52] were devoted to the recovery of high value added metals and other components from e-waste by using various methods. A weak point for the metal recycling from e-waste is the high amounts of halogenated substances disturbing the thermal extraction process. Of particular interest are the data reported by Hino et al. [
48] and Szałatkiewicz [
51] with respect to the elemental and material compositions of the PCBs originating from discarded computers. The organic epoxy resin, inorganic glass fiber and metal elements represented 31.8 wt%, 37.6 wt% and 30.1 wt% of the PCBs, respectively. The bromine content in the organic substances was 5.07 wt%.
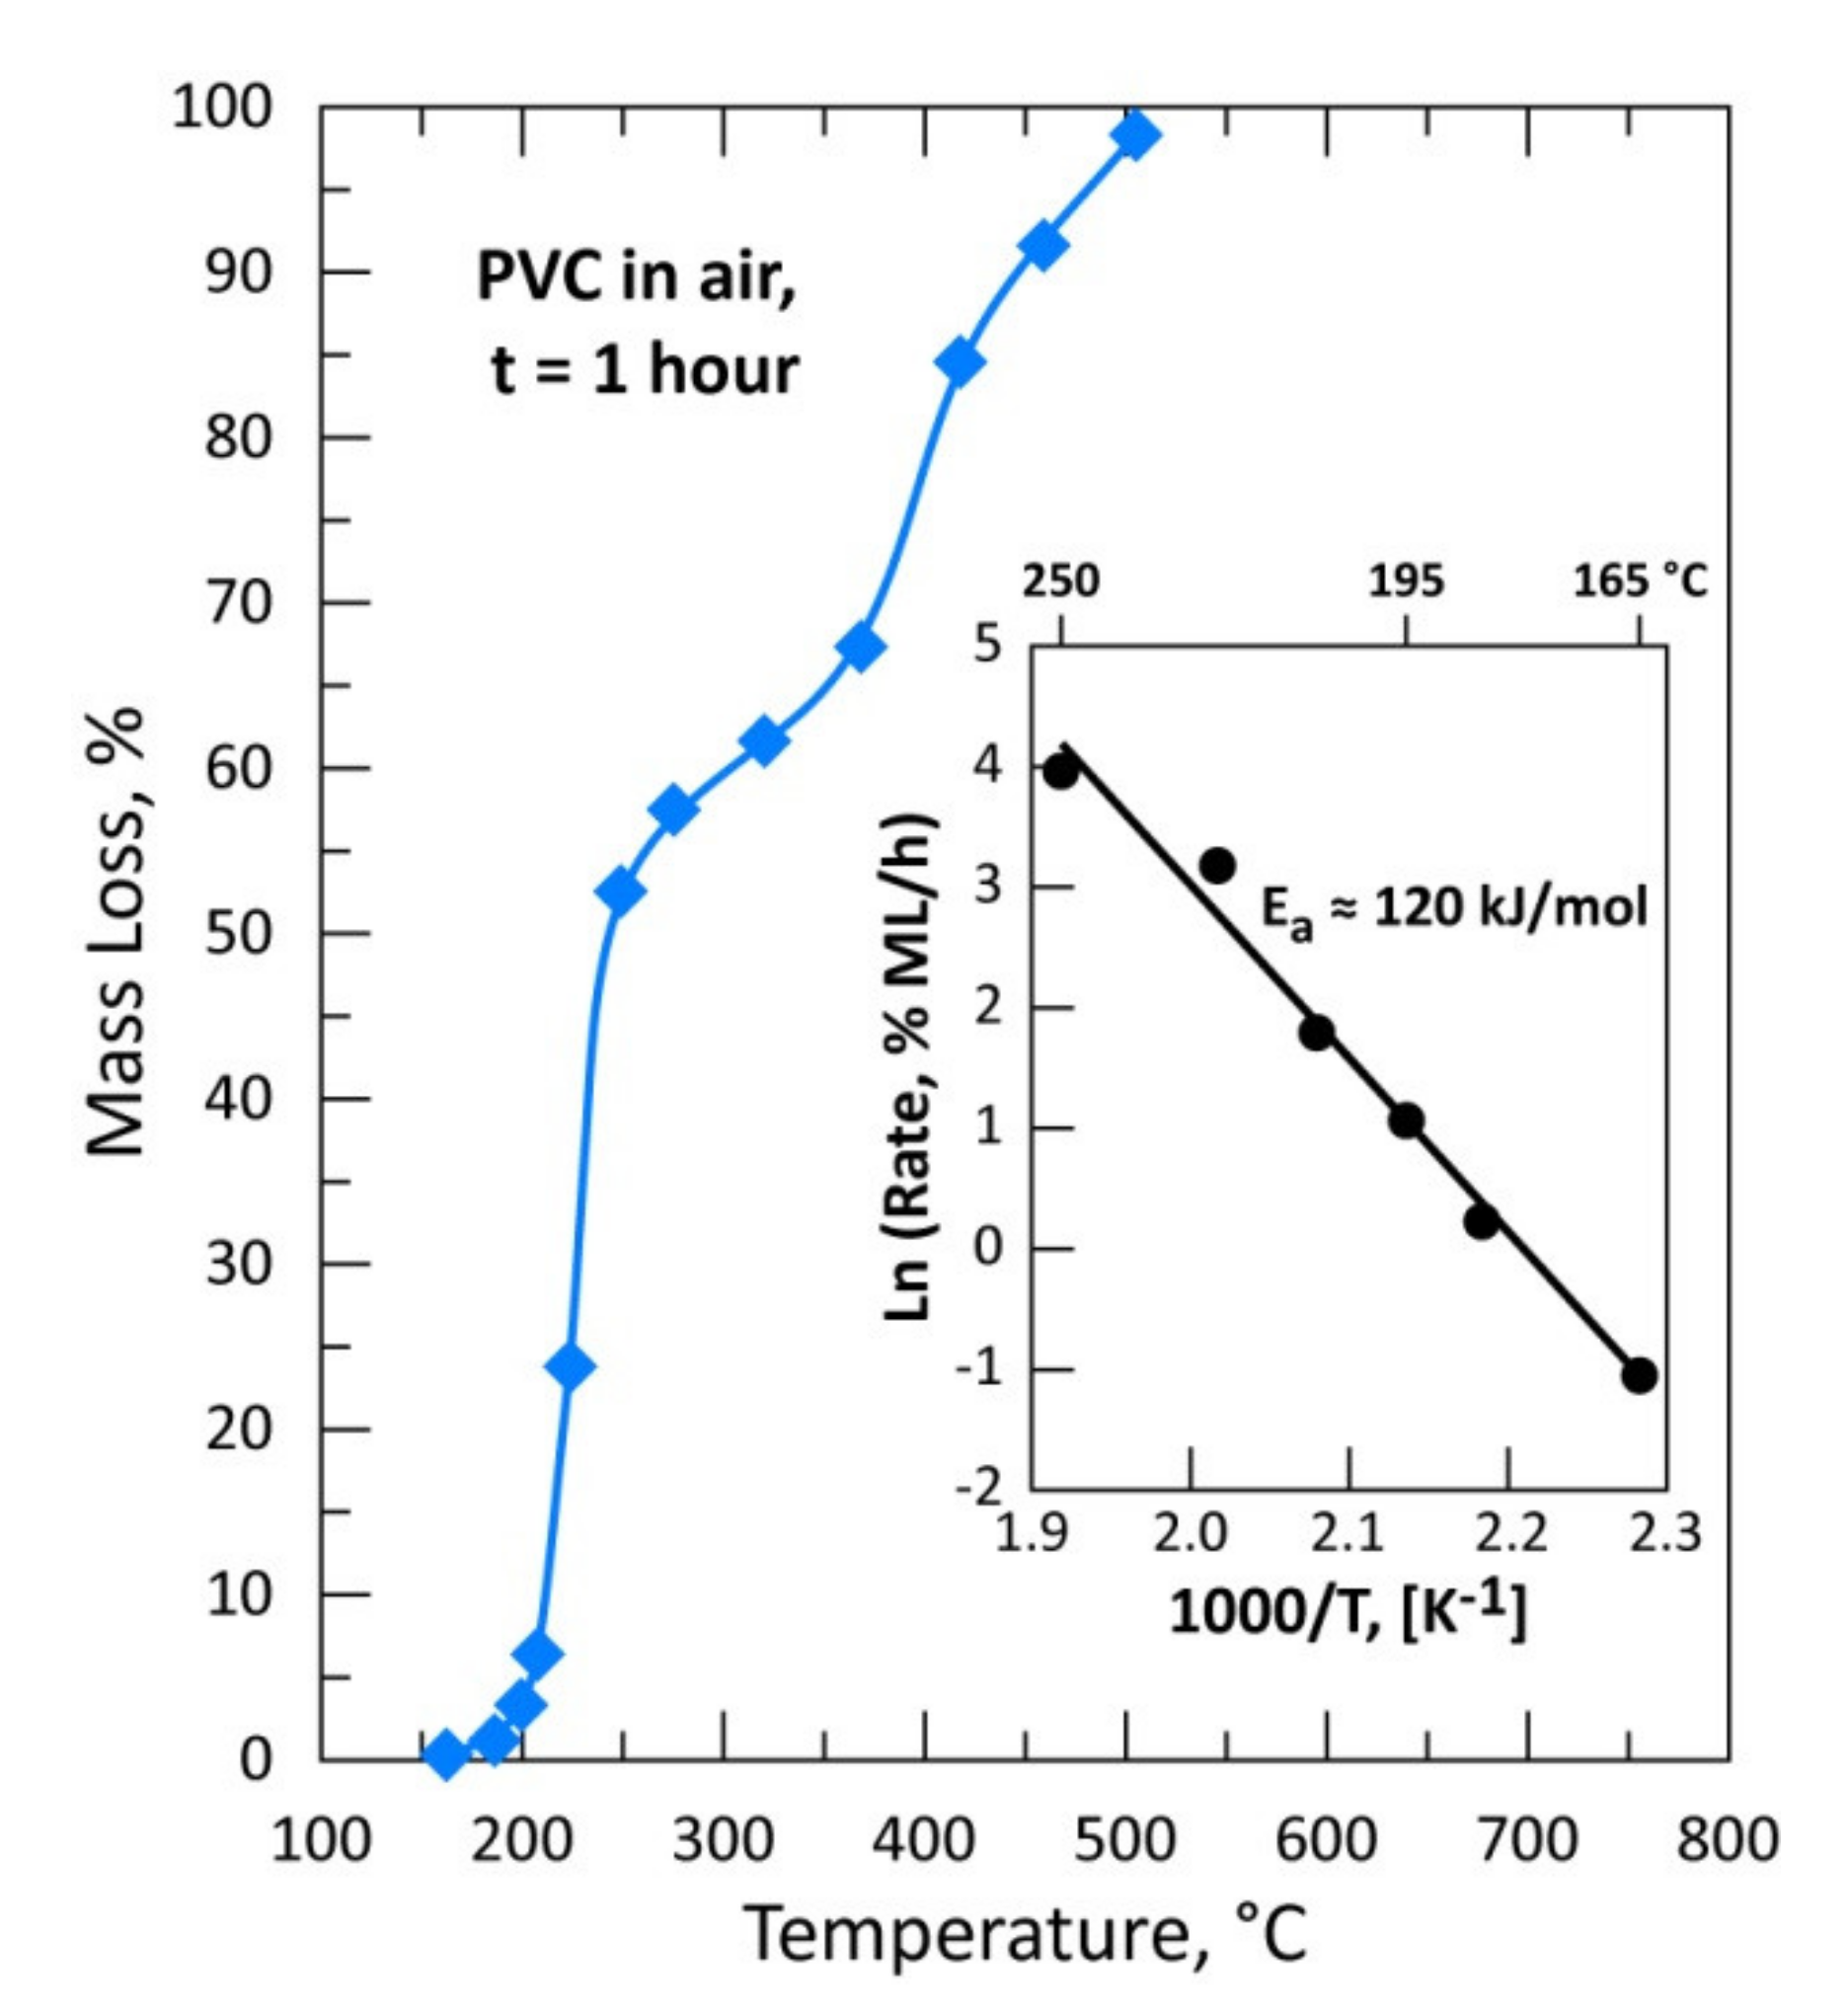
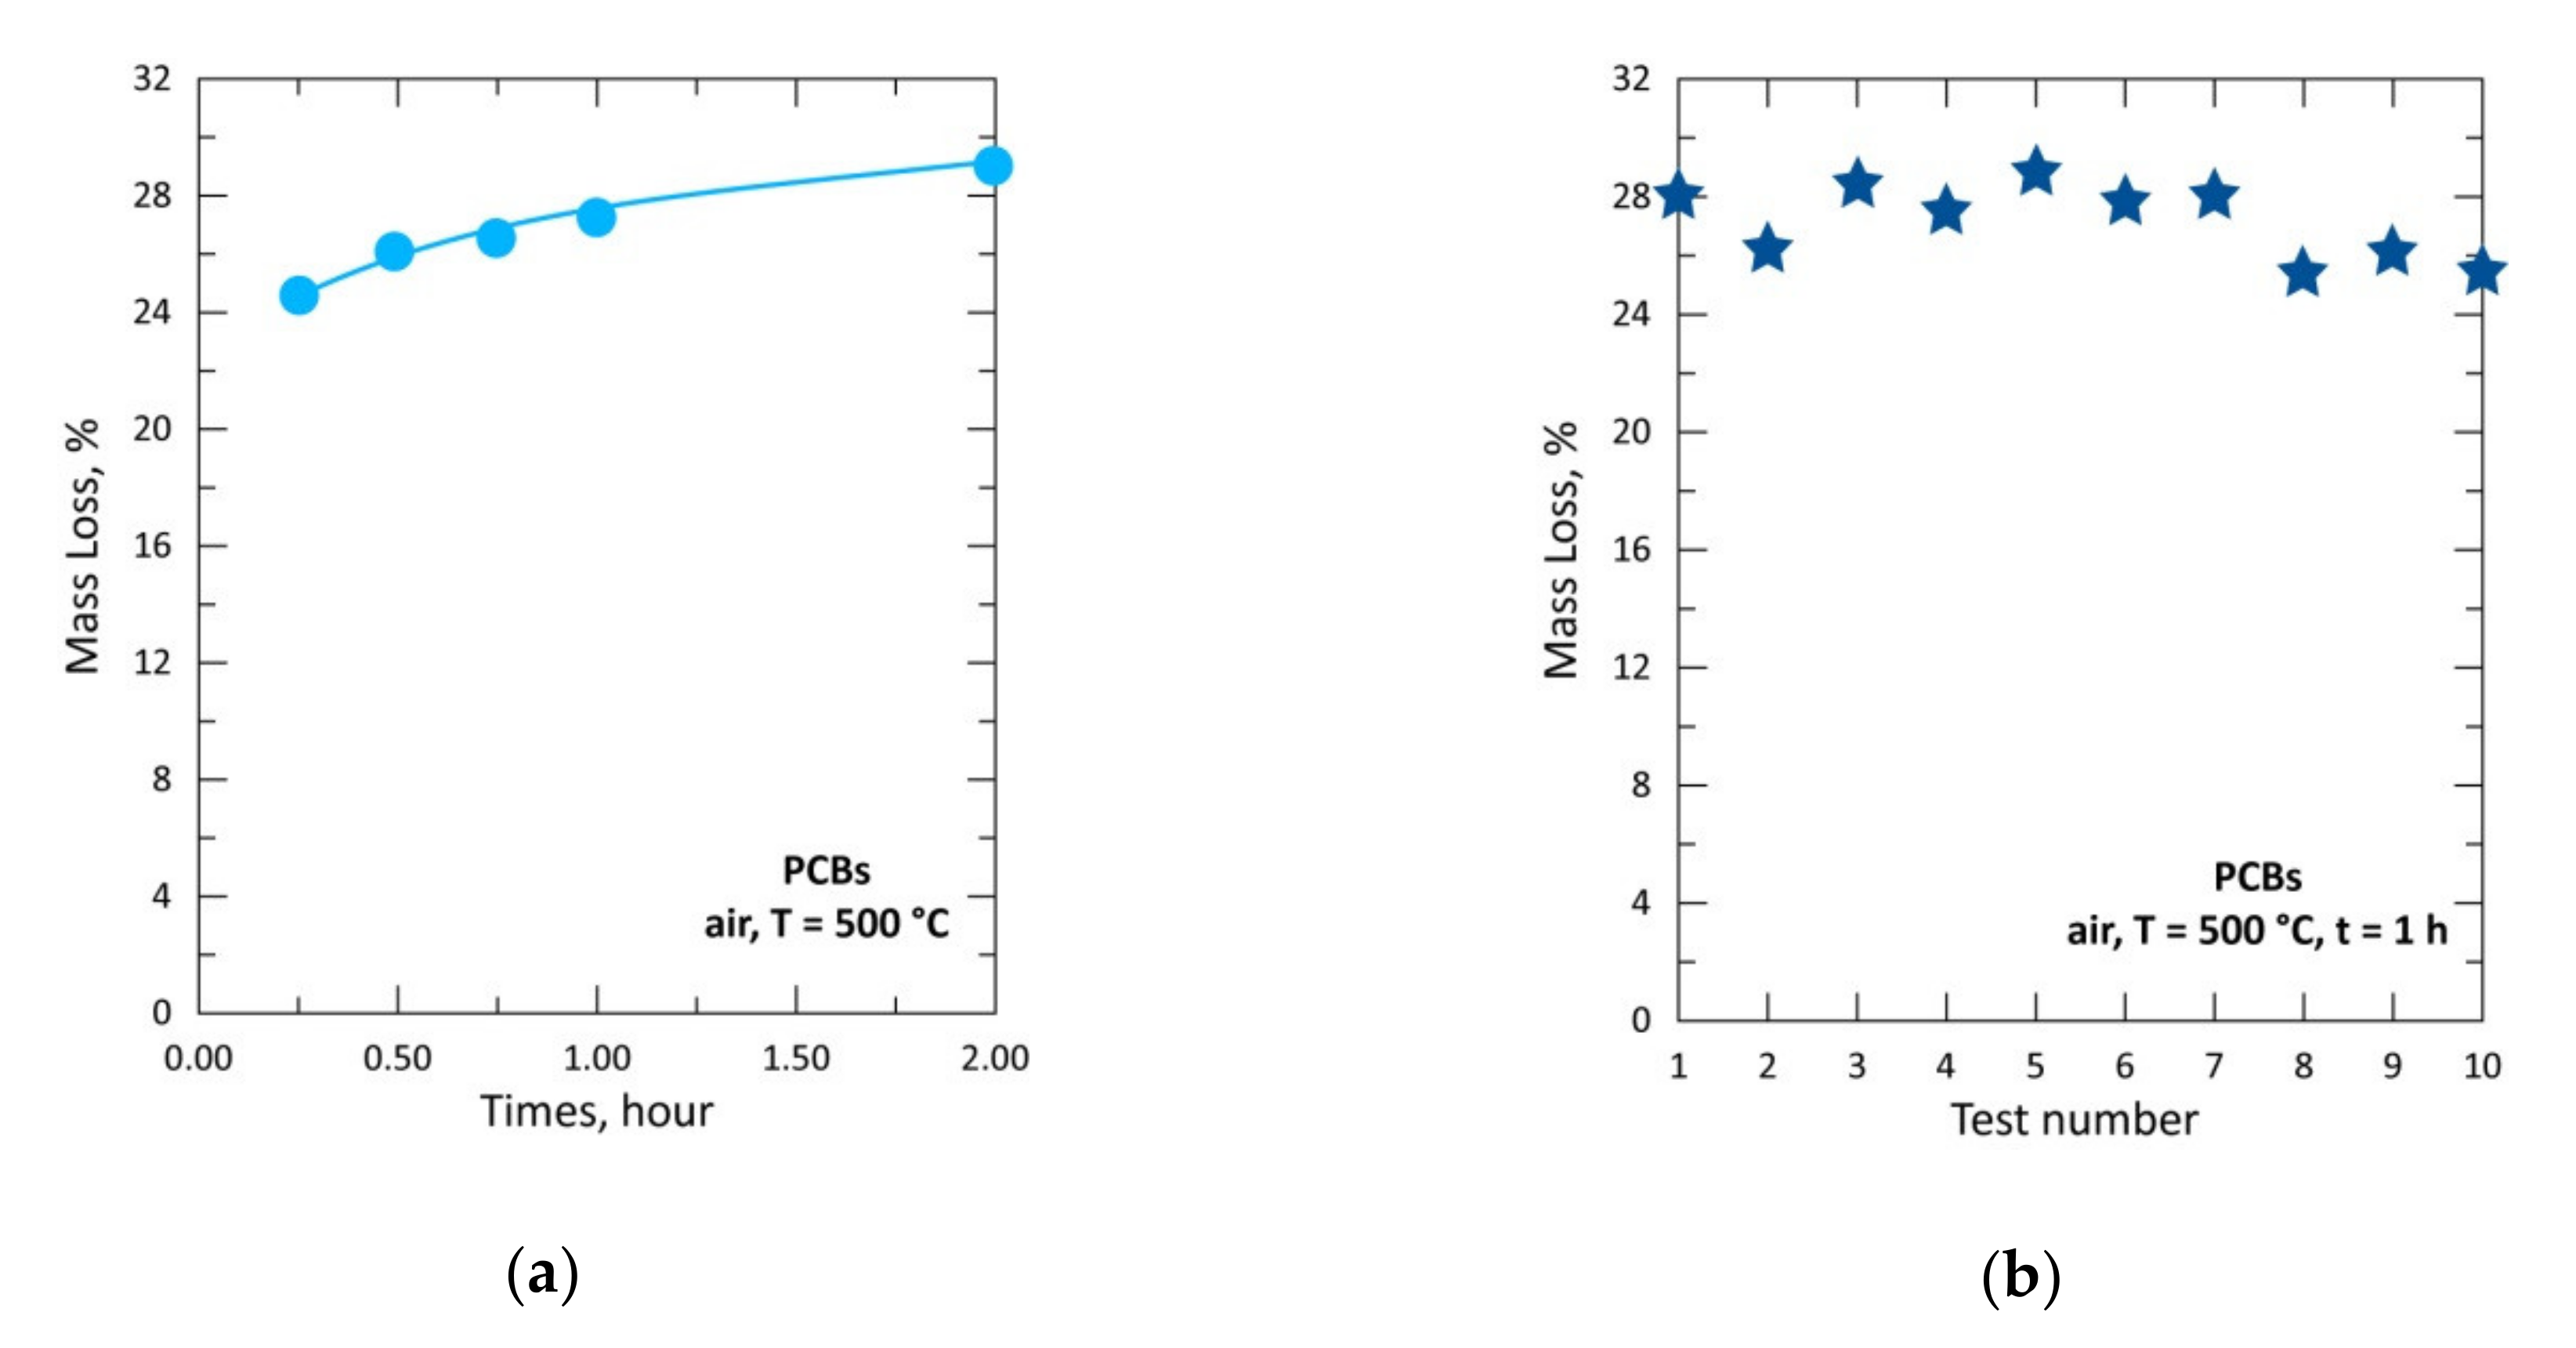
In the previous sections, it has been demonstrated that hydrogen chloride issued from PVC decomposition can react with several metal compounds generating their respective chlorides. Chlorine and bromine substances are often embedded in the plastic as flame retardants and they are still widely used despite environmental concerns. To gain an insight into the thermal behavior of the e-waste (PCBs of the obsolete end-of-life computers), isothermal tests under an air atmosphere were performed at 500 °C for reaction times of 0.25, 0.50, 0.75, 1.0 and 2.0 h. As the physical sample is composed of plate strips cut at about (10 × 2) cm, it was useful to repeat the experimental tests (3 times) at a given reaction time in order to have a reliable correlation between % ML of sample and the reaction time. This allowed us to overcome the impact of macroscopic heterogeneity with respect, at least, to plastic content. Additionally, for the reaction time of 1 h, 10 experimental tests of PBCs treatment in air atmosphere were performed to carefully check the reproducibility of experimental tests and to attain a better sampling of the obtained products. All the results are displayed in
Figure 14.
About 24.5% ML were obtained during the treatment of PCBs sample for 0.25 h in air atmosphere (
Figure 14a). The % ML of the sample increased slightly with reaction time to reach 29.0% during the treatment at 2.0 h. The experimental tests for 1 h gave mass losses oscillating between 25.5% and 29.0% with a mean value of 27.2% (
Figure 14b). The small influence the treatment time had on the sample loss is probably due to the high reactivity of the organic matter towards air (O
2), therefore likely leading to a temperature increase in the reaction zone. The organic matter content (31.8%) of the PCBs from discarded computers previously reported [
48,
51] seems to be in good agreement with the results shown in
Figure 14. The bromine content of the PCBs organic substances reported to be around 5 wt% in references [
48,
51] is assumed to apply to the similar e-waste used in the present study.
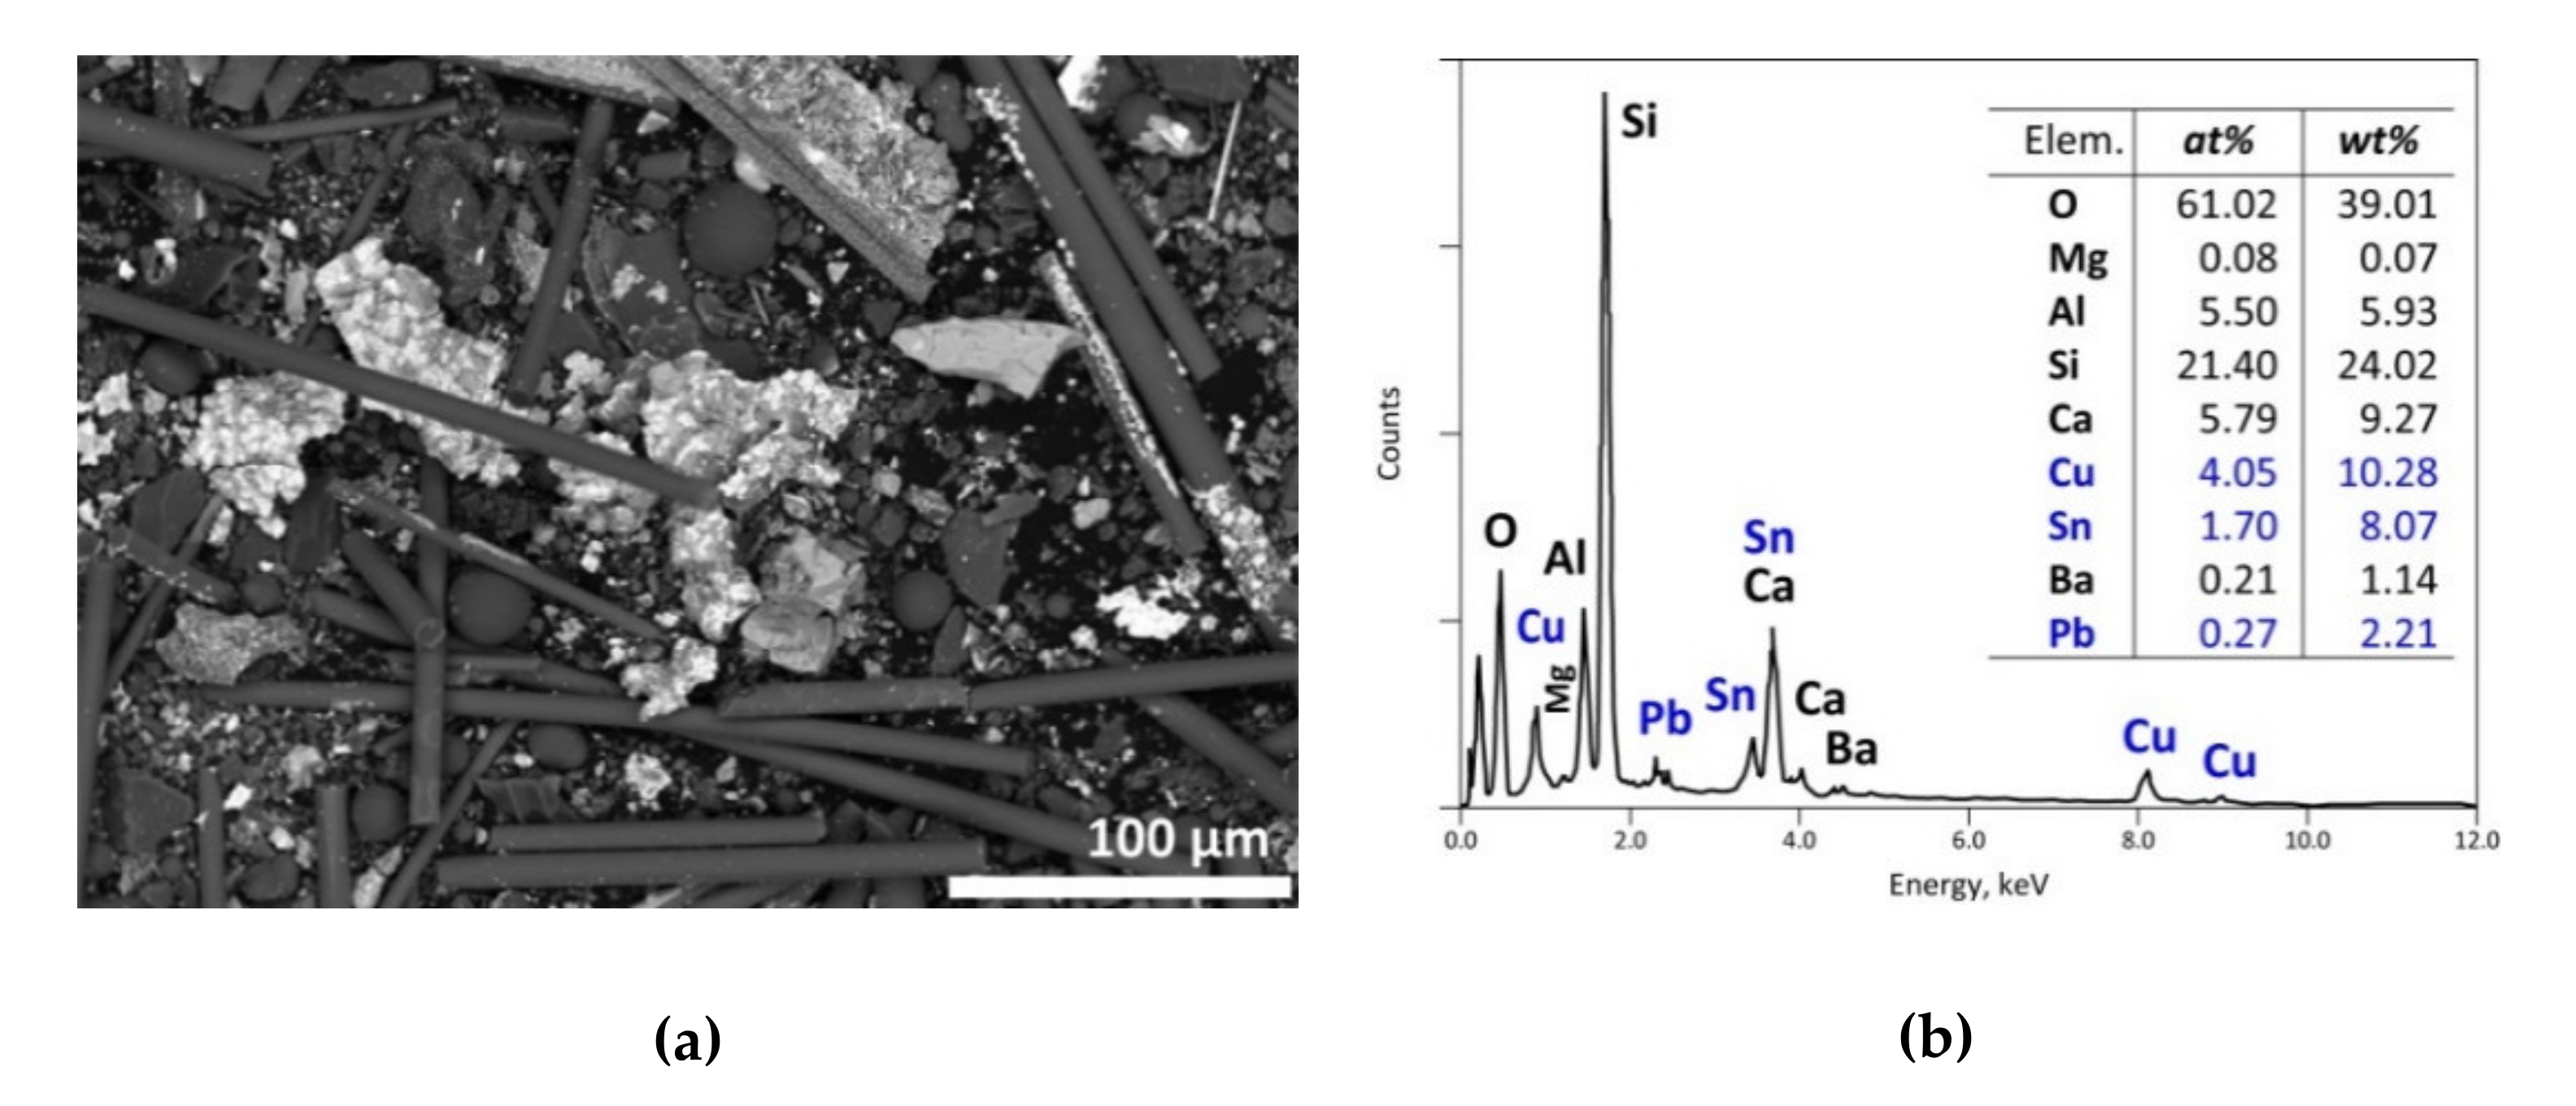
The treatment residue obtained for 1 h of treatment was sieved and the fine fraction (less than 210 μm) was analyzed by SEM-EDS technique. Likewise, the solid condensate was examined by the same technique.
A general SEM image of the treatment product is displayed in
Figure 15a. Although most metals (especially Cu) are found in the coarse fraction of centimetric size, this fine fraction of the treatment product still contains Sn, Cu and Pb compounds (spectrum in
Figure 15b). Si, Ca, Al and Mg are often found in the sticks (see SEM image of
Figure 15a) being used as reinforced fibbers and/or glass weaves for the plastics.
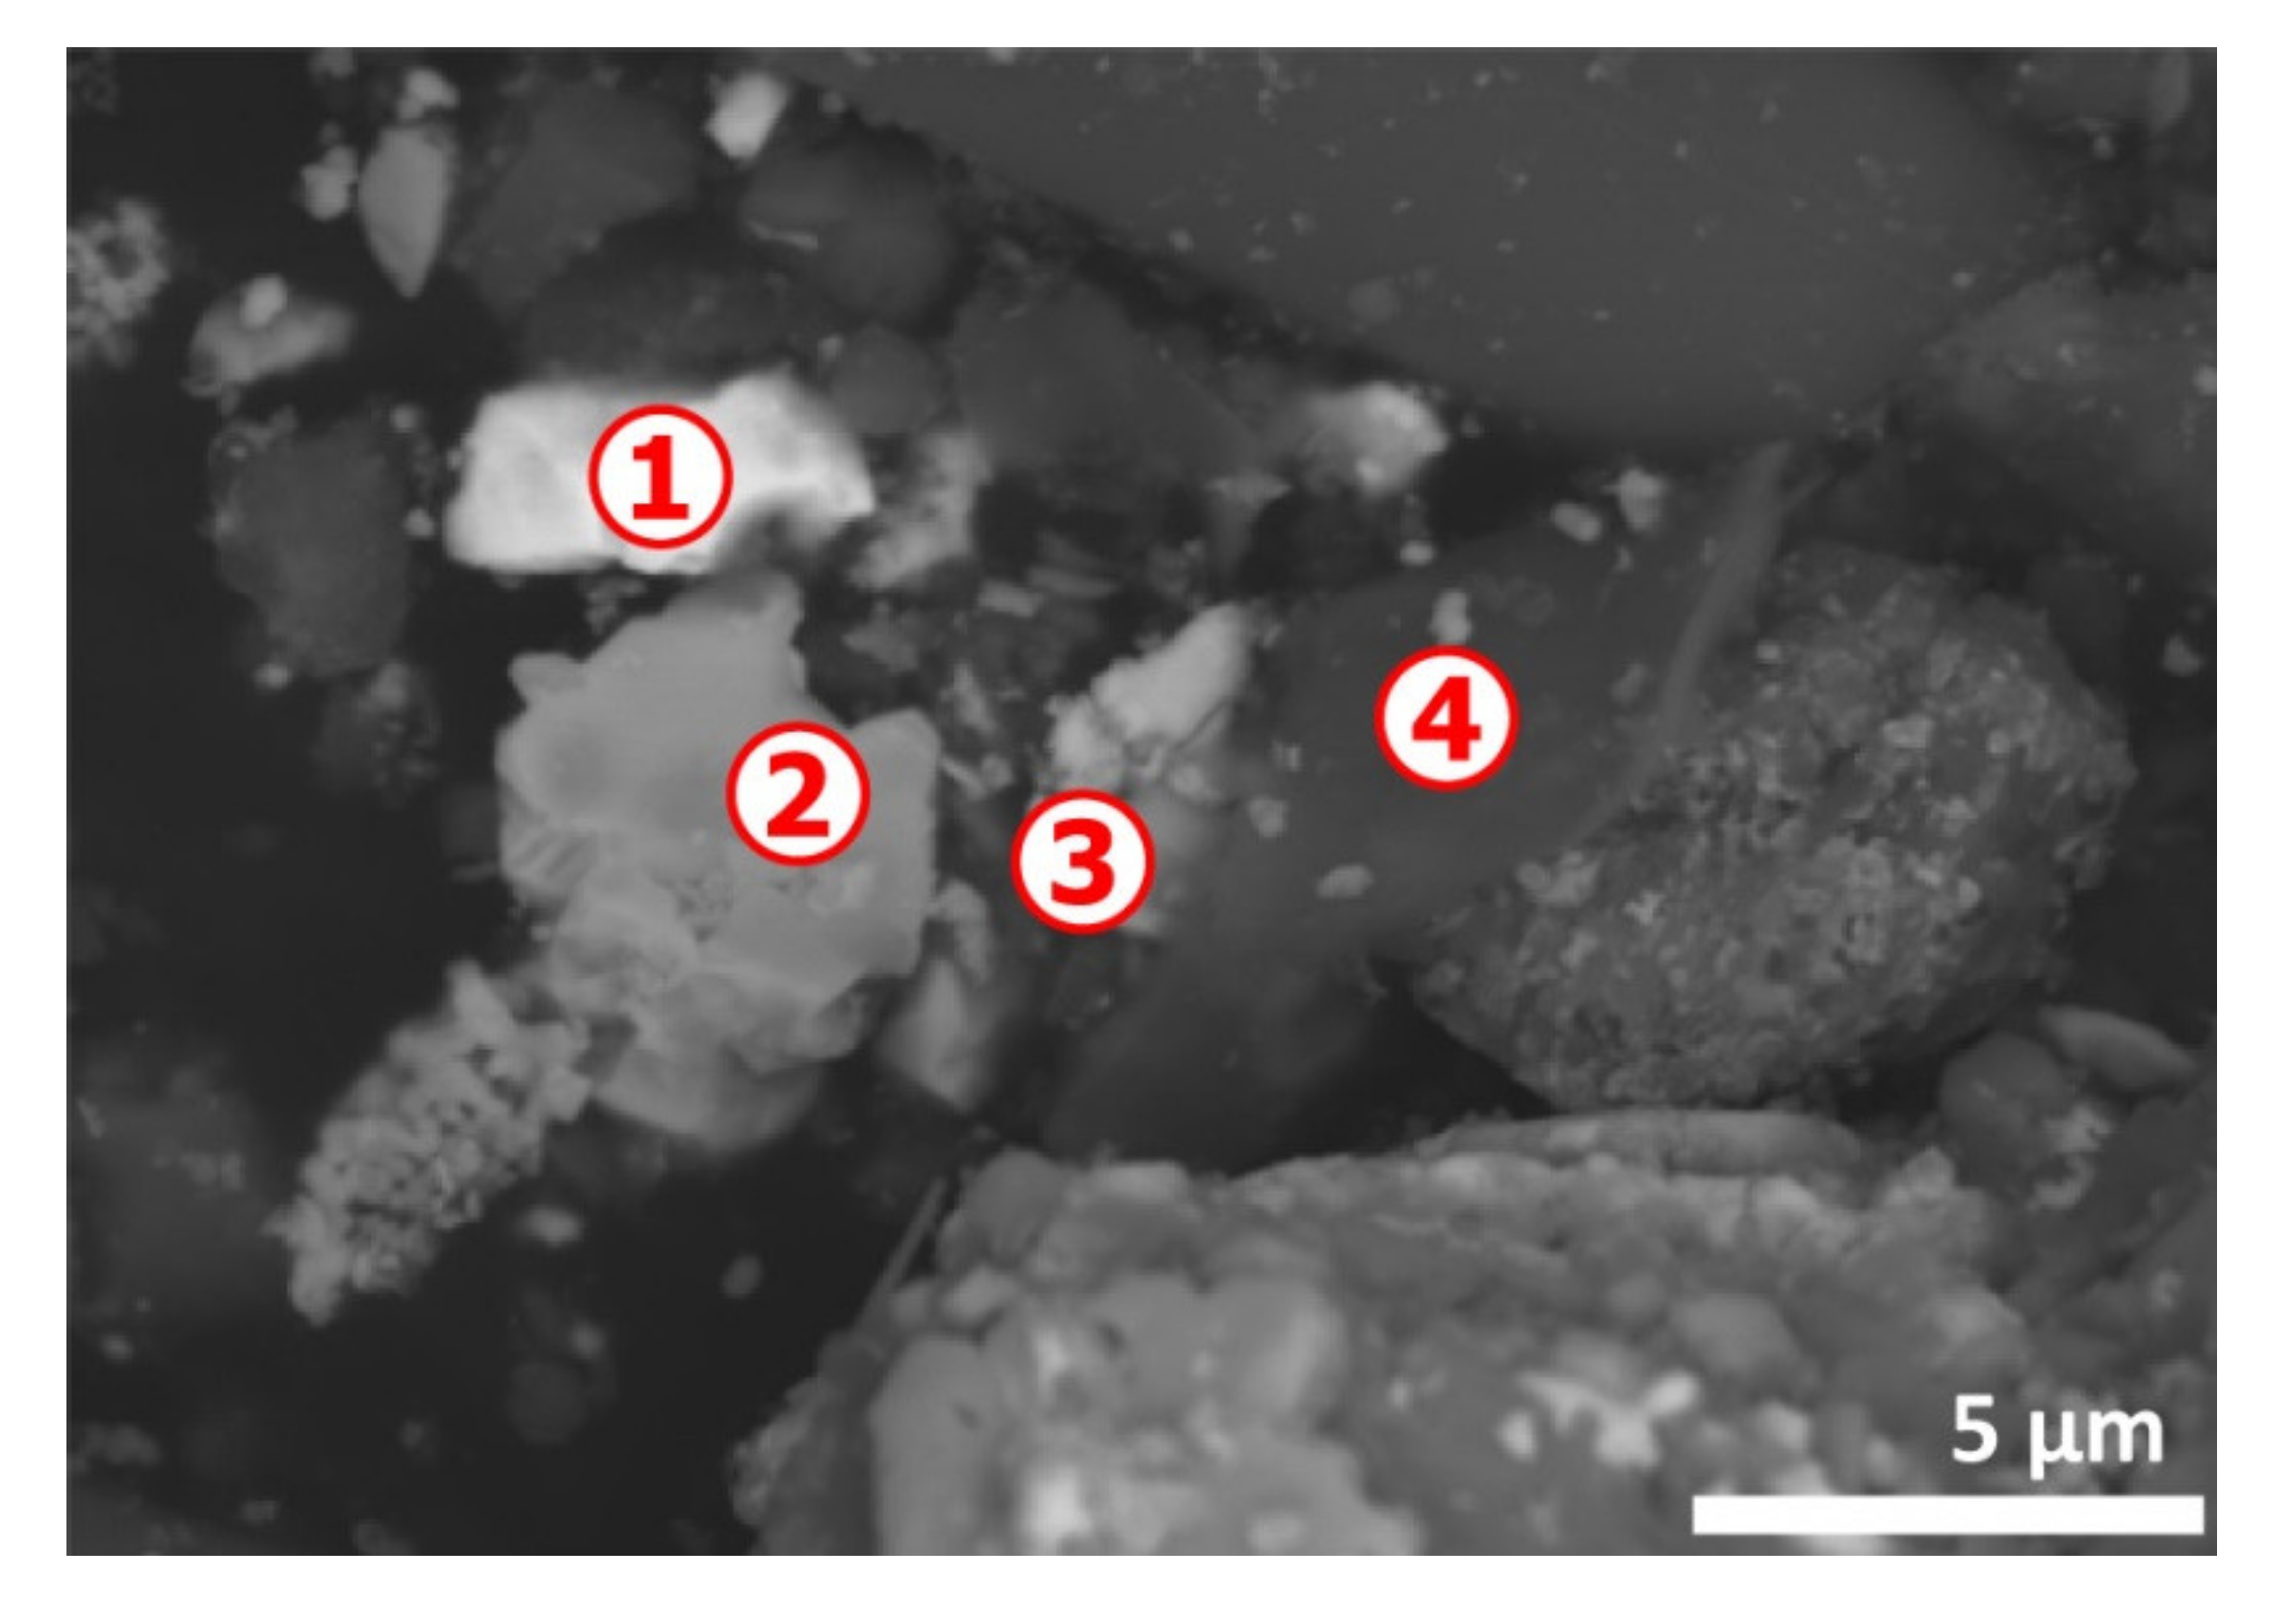
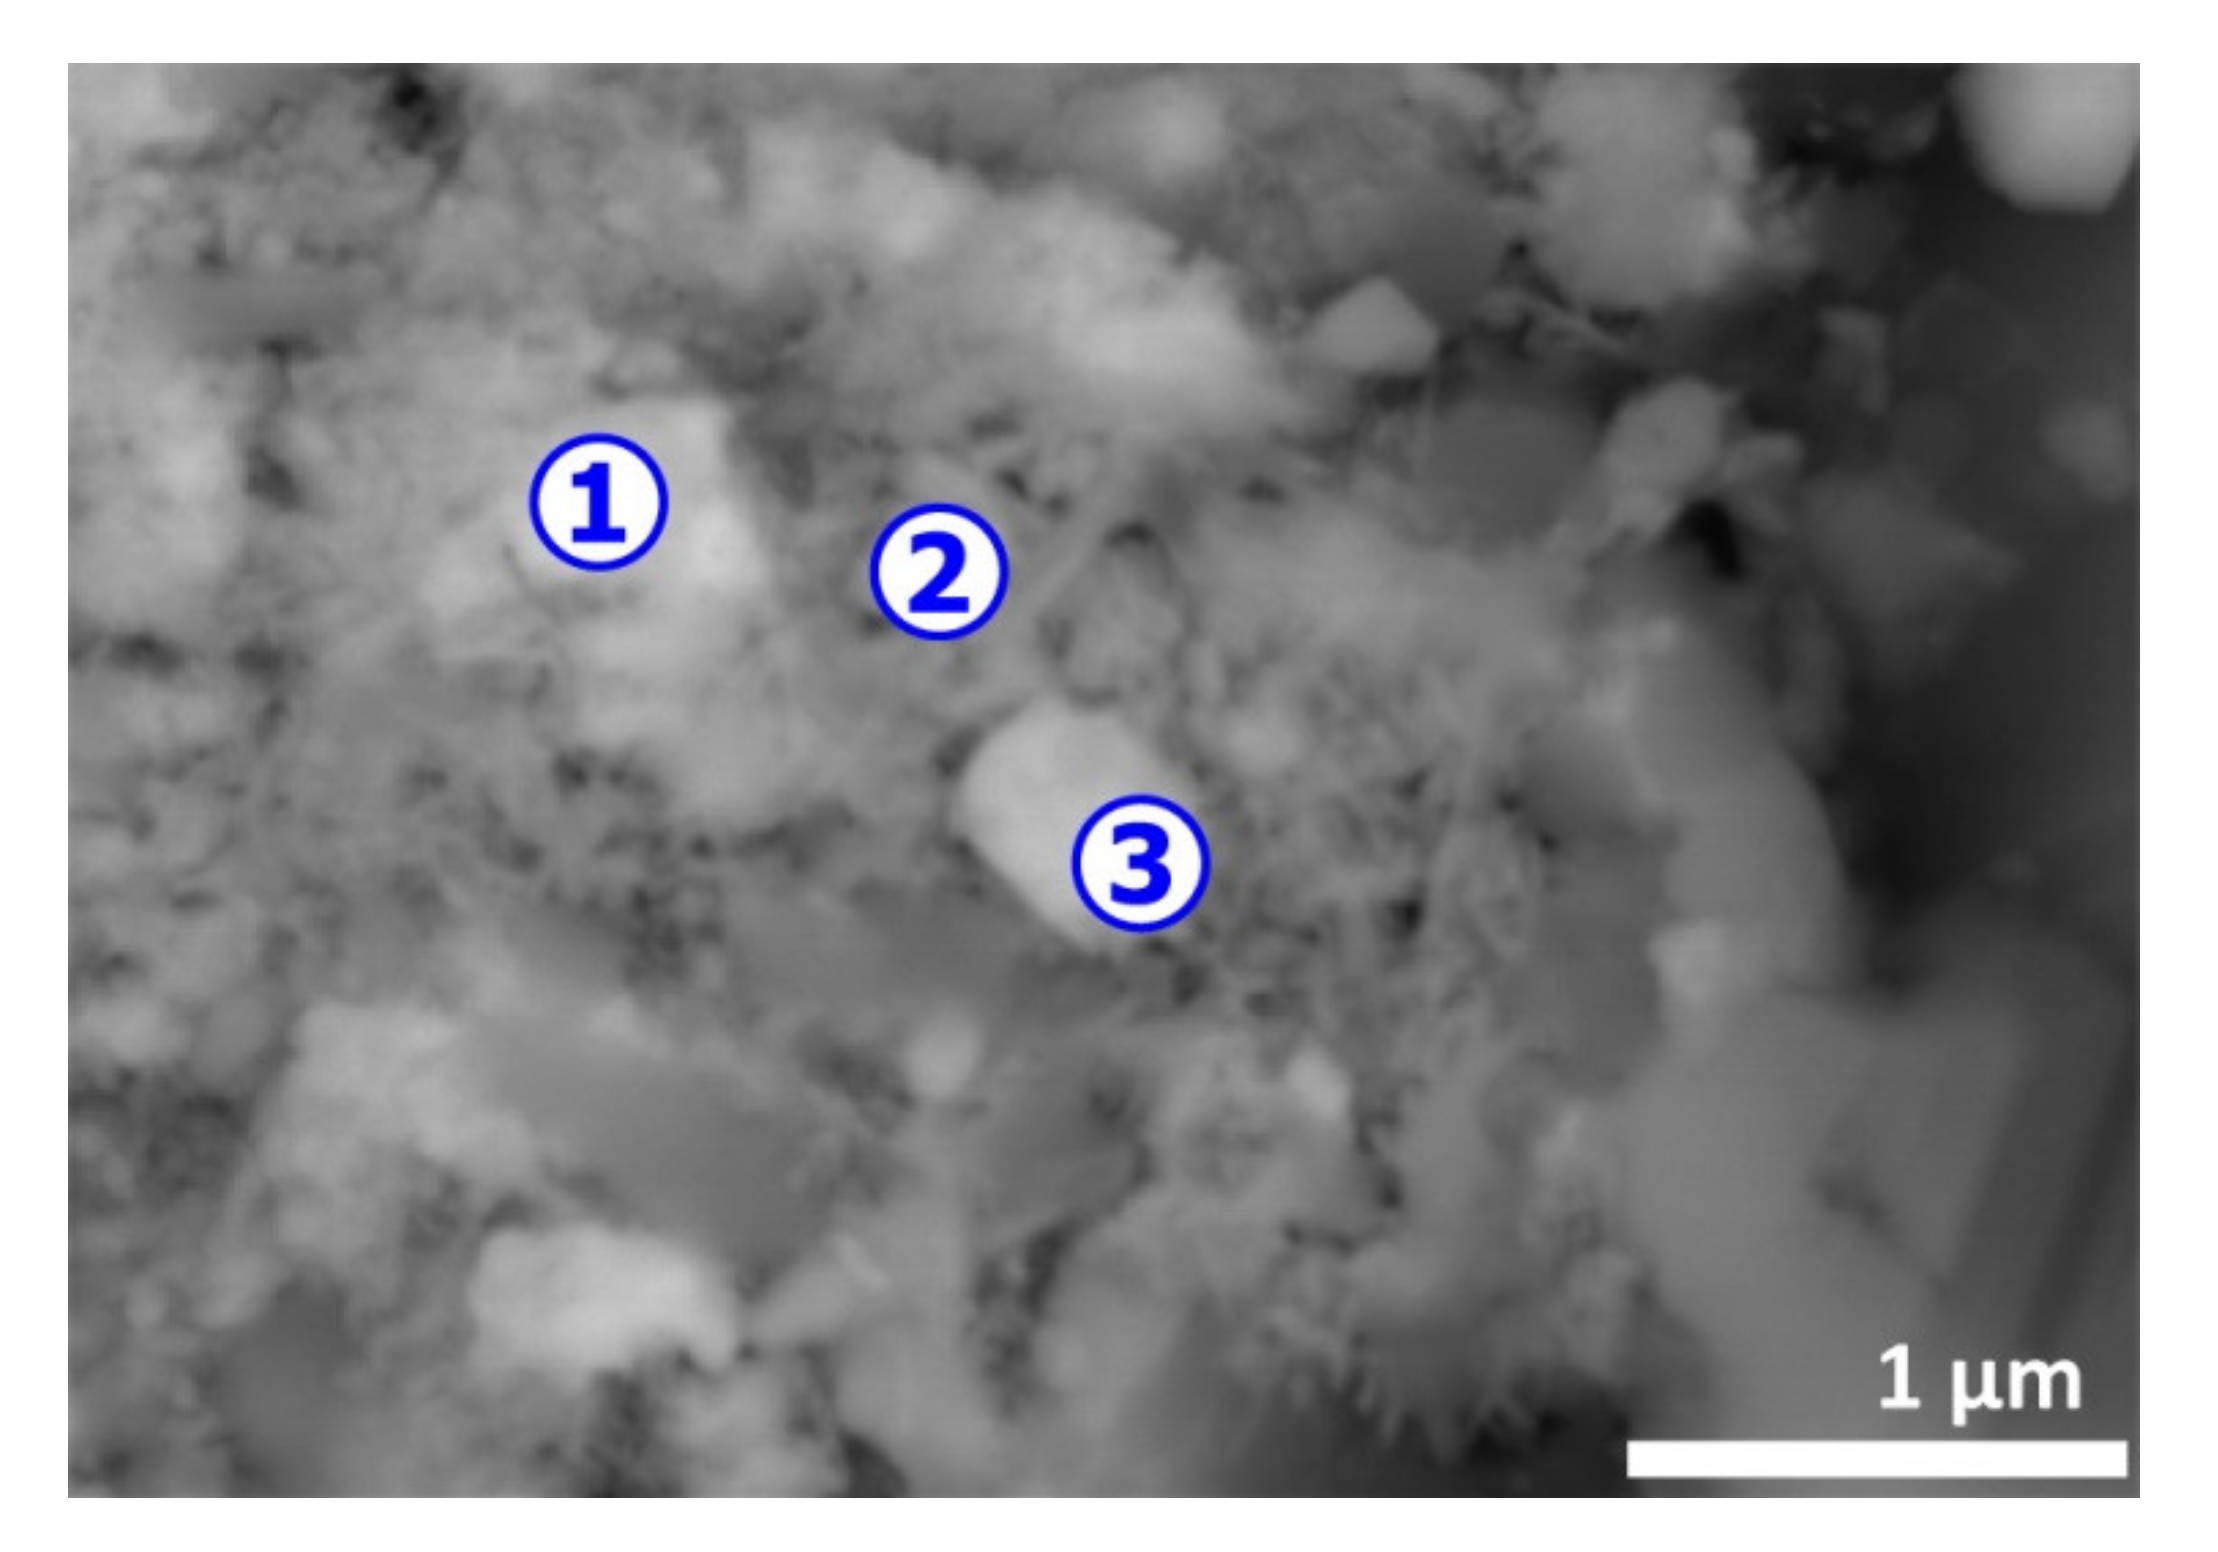
Punctual analyses by EDS of various areas of SEM image of
Figure 16 give different compositions as reported in
Table 5. There are areas rich in lead (spot n° 1) and in tin (spot n° 2). Tantalum (spot n° 3) is almost certainly derived from tantalum capacitors. The EDS analyses of spot n° 4 represents mostly the elemental composition of an inorganic filler particle.
The attractive result of the SEM-EDS analysis is given in
Figure 17 and
Table 6. Besides metals (Ag, Cu, Pb, Sn…), at various proportions, there is an appreciable amount of bromine (spots n° 1 to 3) indicating that bromine is bonded with part of the metals as bromides.
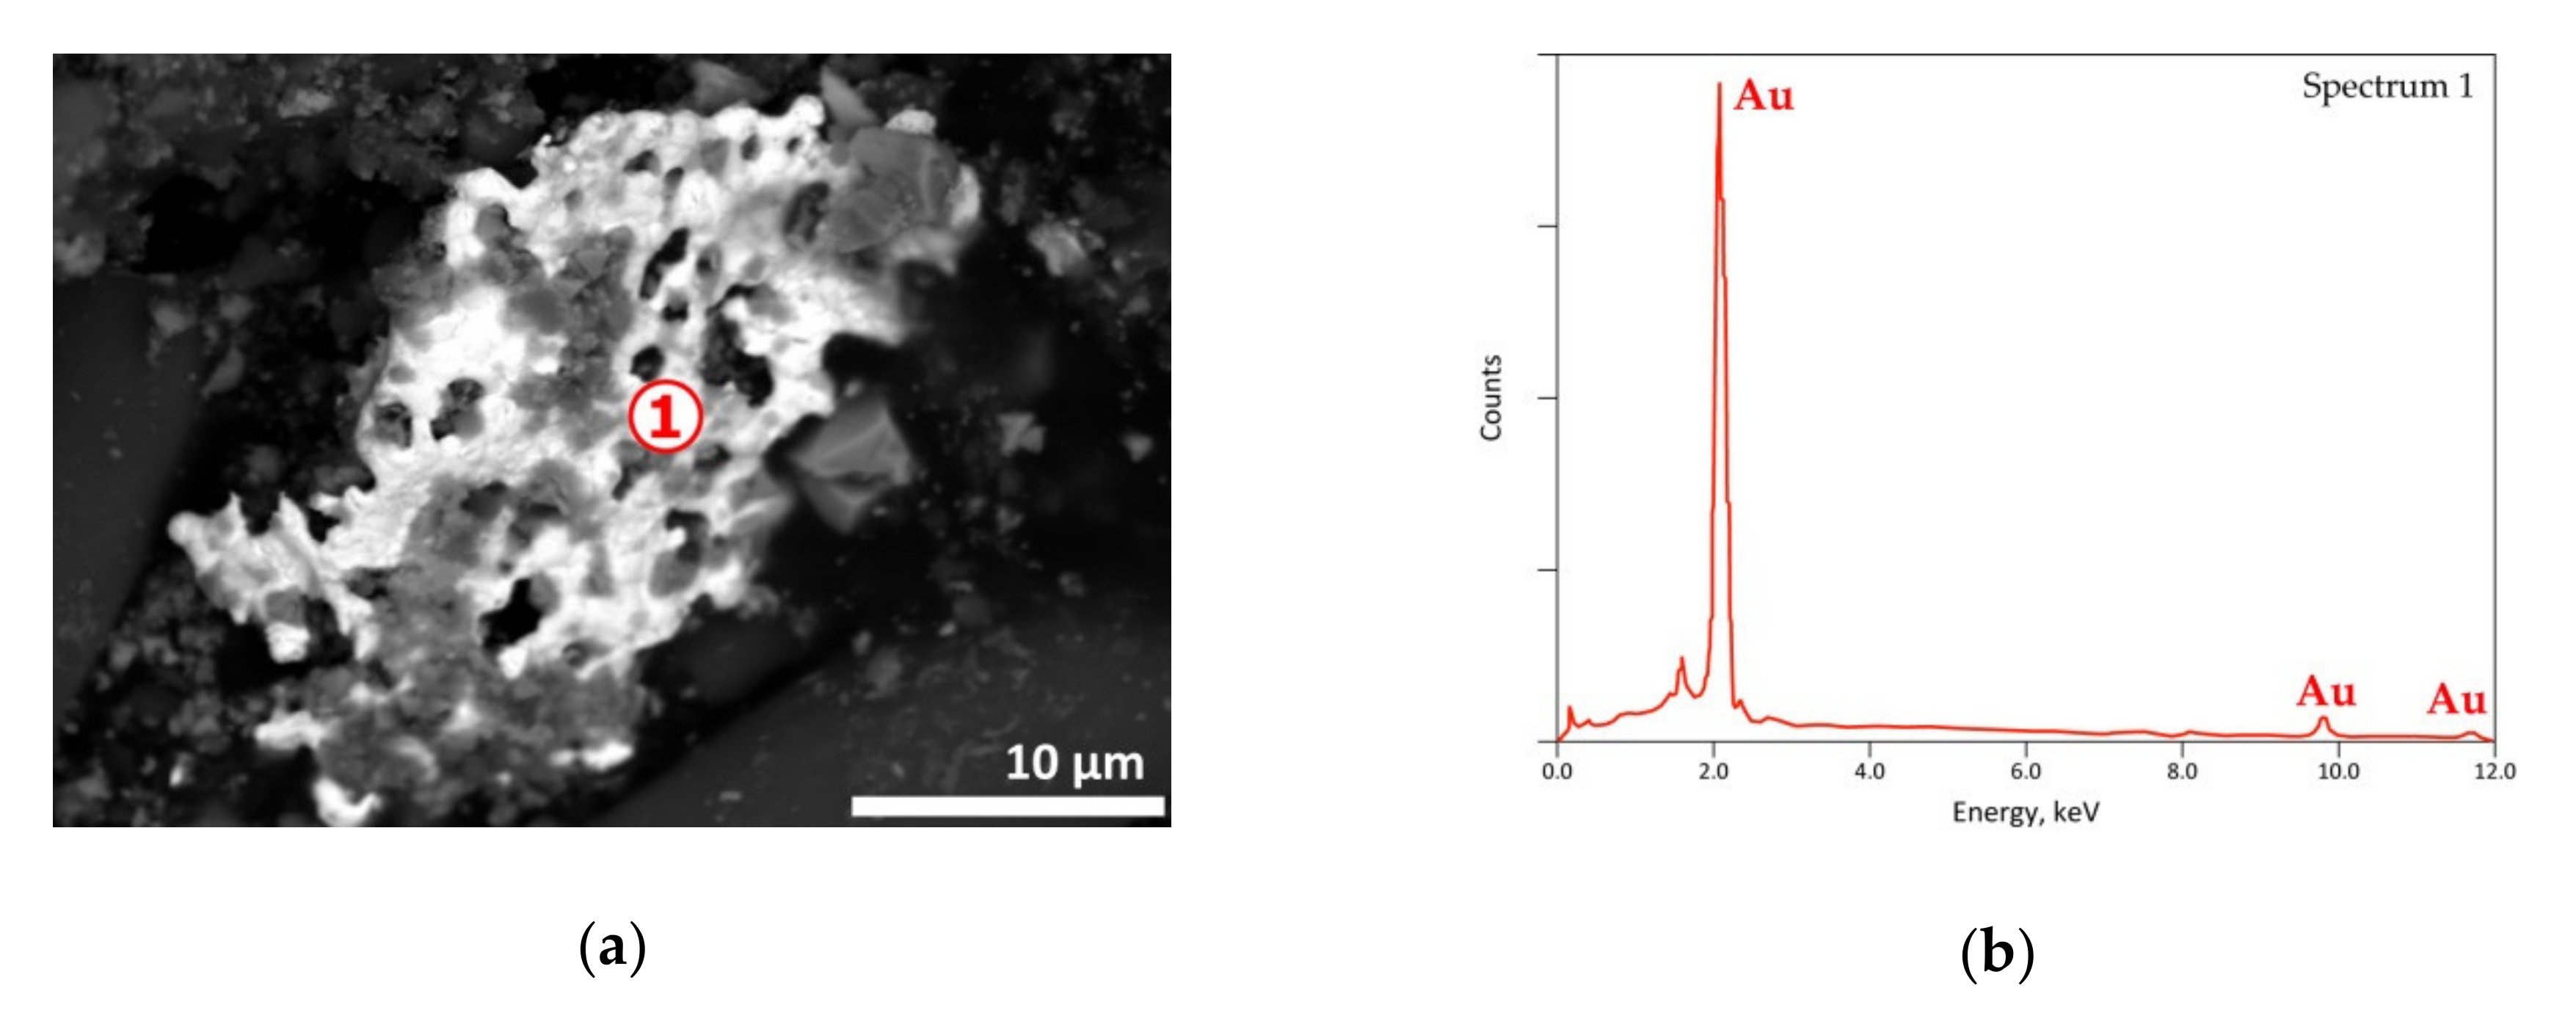
As shown in
Figure 18, gold, which is used in PCBs to assure circuit board contacts, seems to be inert to the treatment at this temperature.
A thermodynamic calculation [
39] showed that the values of the Δ
rG° for the reaction (6), (7), (8) and (9) at 500 °C are −119.80, −124.11, −143.22 and –119.97 kJ/mol HBr, respectively. Such negative values suggest that the envisaged reactions are favorable from the thermodynamic point of view. The species AgBr, CuBr, PbBr
2 and SnBr
4 are chosen for their predominant thermodynamic stability in the studied system (Metal-O-Br) and based on the thermochemical data availability.
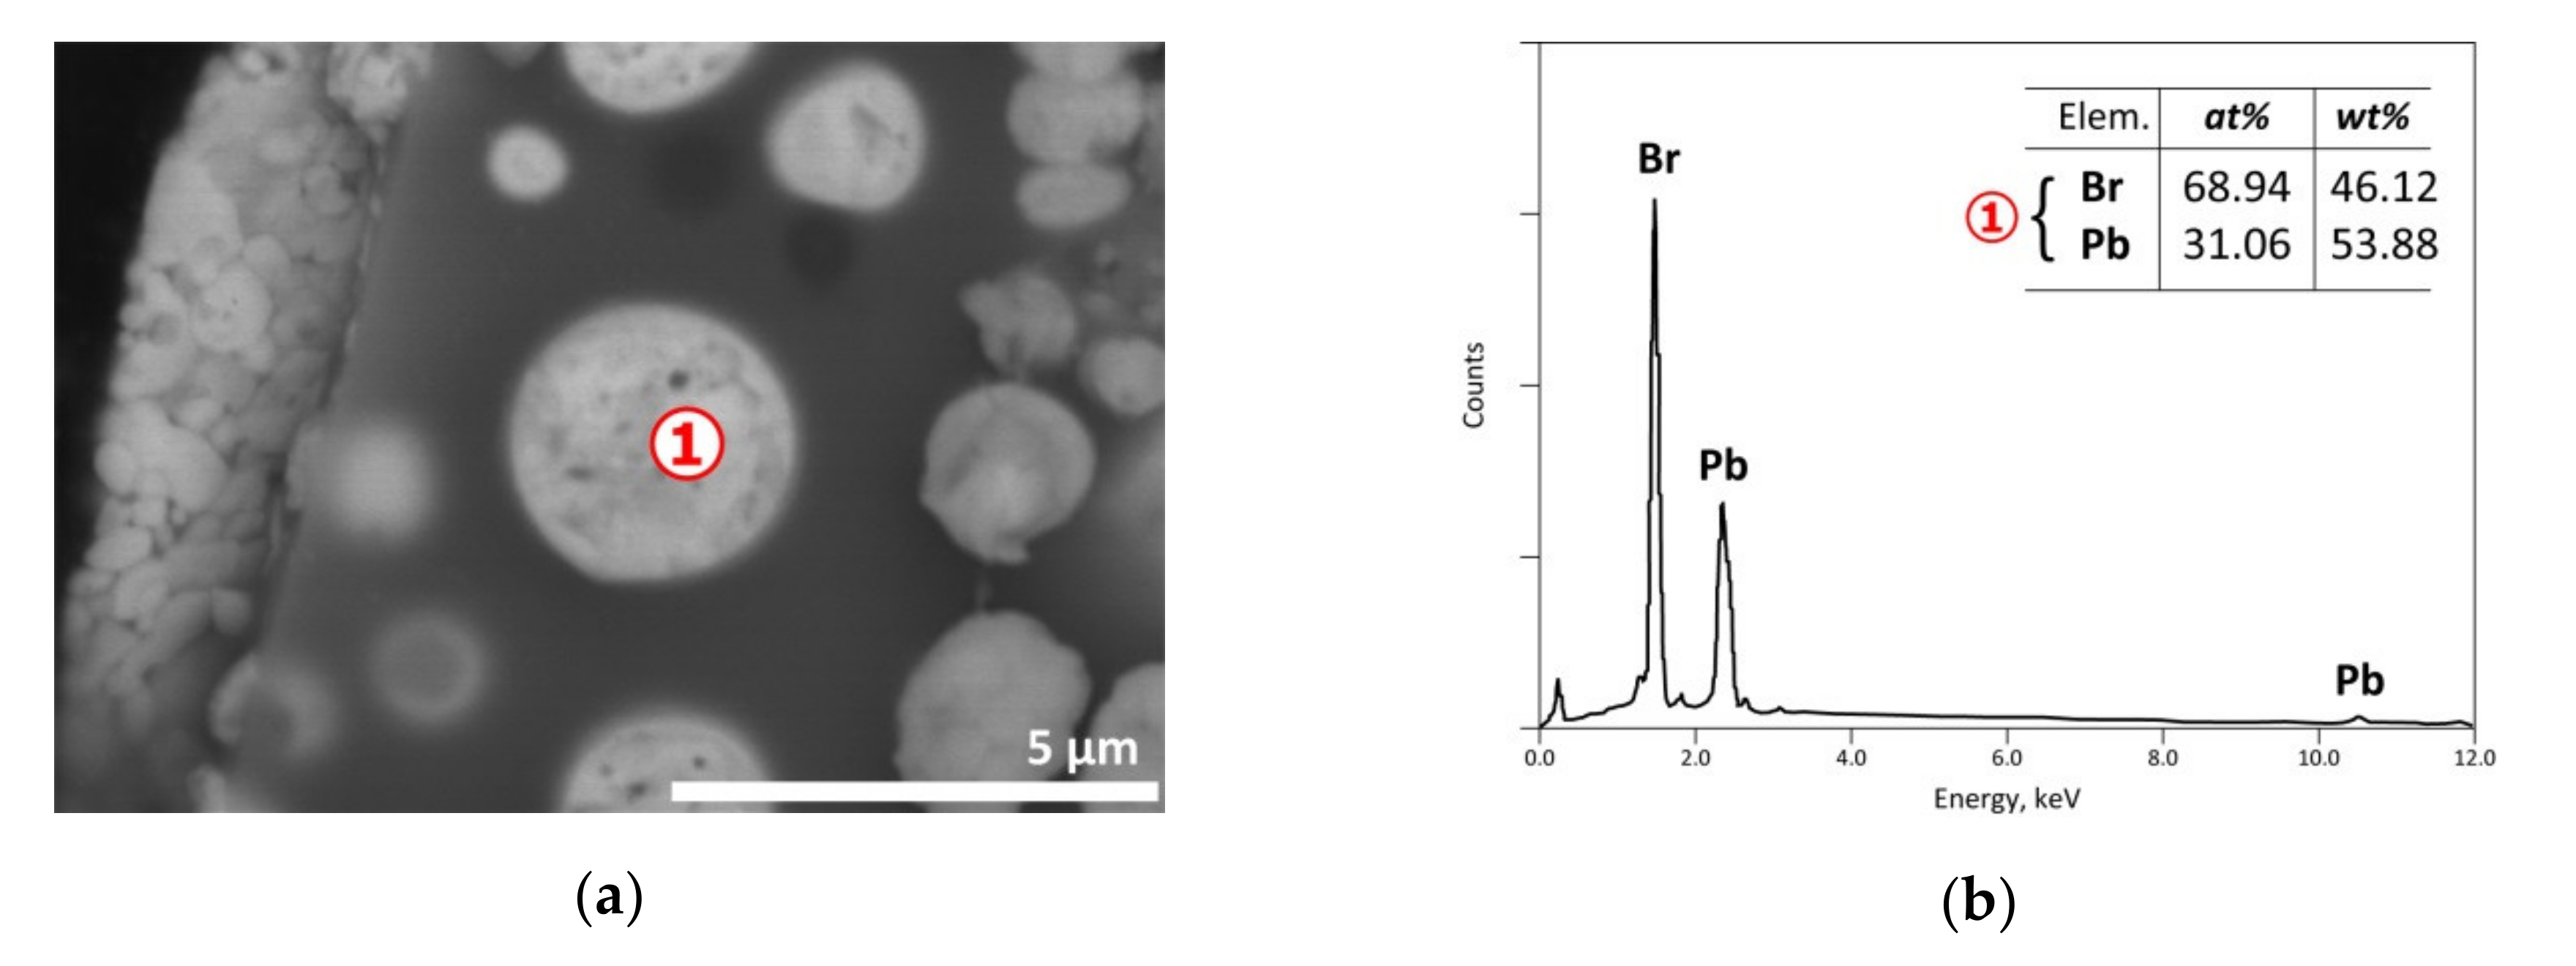
As indicated in
Section 2, the exit gases were cooled resulting in the condensation of the vapor phase and the recovery of a solid condensate mixed often with unburnt carbonaceous matter, soot and liquid giving the visual appearance of a pasty mass. SEM-EDS results of a condensate are shown in
Figure 19 with an EDS analysis of spot n° 1 corresponding roughly to PbBr
2. As the vapor pressure of PbBr
2 is near to 0.1 kPa [
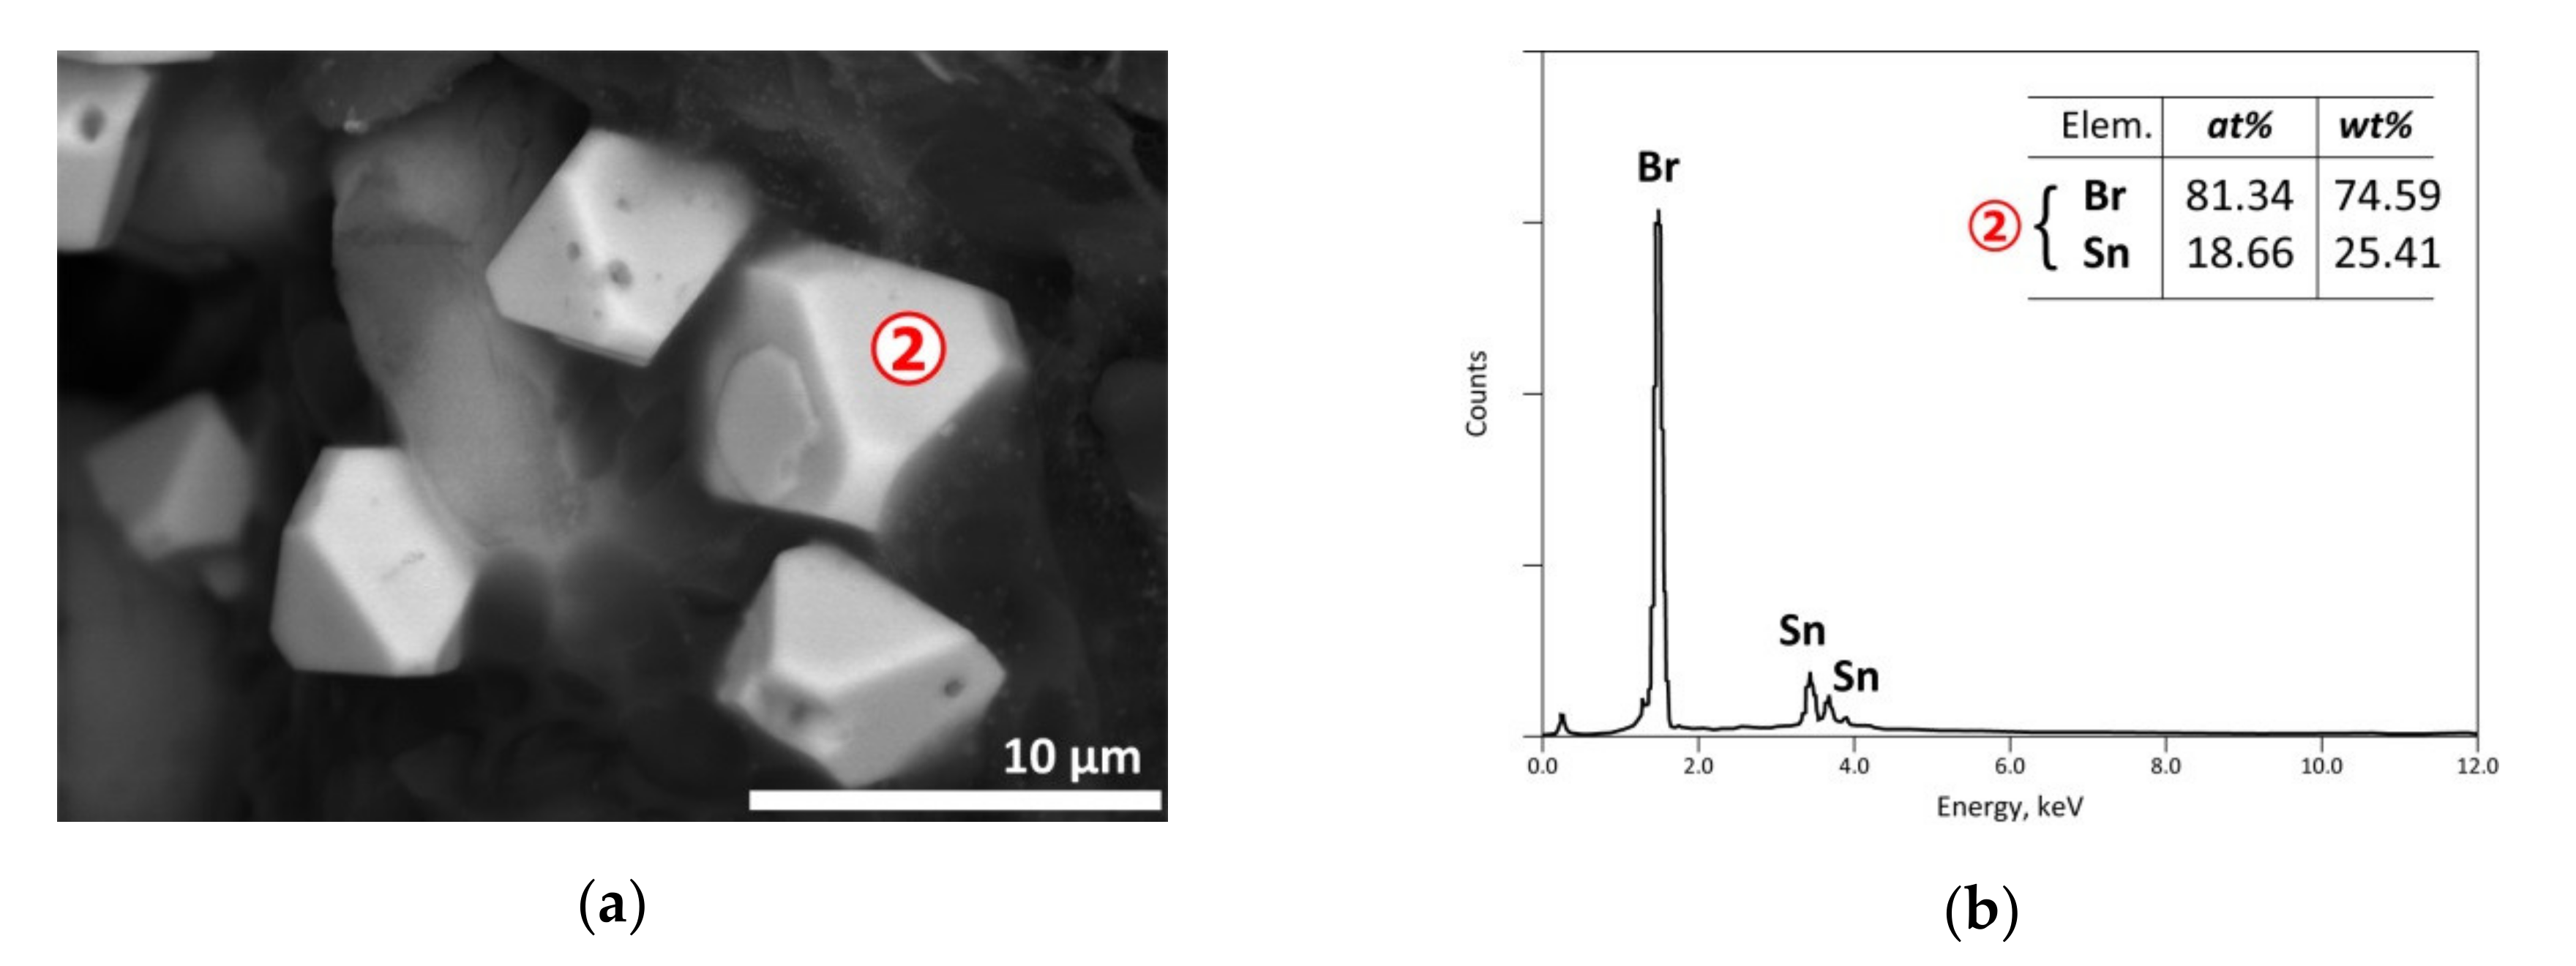
39], its presence in the condensate is probably due to it being brought back by the carrier gas and/or thanks to temperature increase enhancing its volatilization. Another EDS punctual analysis displayed in
Figure 20b, noted as spot n° 2 of SEM image, suggested most likely the stannic bromide (SnBr
4) generated from the condensation of gaseous tin bromide [SnBr
4(g)] in the cooled part of the reactor. The obtained results showed that several metals could be concentrated in the vapor phase via volatilization of the neo-formed halides during the thermal process.
As revealed during this study, the extraction of the critical and high-value elements from the chosen by-product and end-of-life materials represents a challenge due to the chemical and mineralogical complexity of their components as well as to the selectivity of the extractive chemistry of different metals for an efficient separation. Moreover, fair thermodynamic data, the ability to gather phases differentiation, punctual information about elemental content, in addition to monitoring the morphological and textural evolution of the thermally treated samples, are all contributing to a better understanding of the reaction mechanism involved and processing steps for the studied cases. Other aspects of this investigation, dealing with mass balance of the processes and assessment of technical and economical evaluation, should be carried out in future studies.

 ,
, 


