Elucidation of the Hydration Reaction of UHPC Using the PONKCS Method


Abstract
:1. Introduction
2. Materials and Experimental Details
2.1. Sample Preparation
2.2. Experimental Details
3. Experimental Results
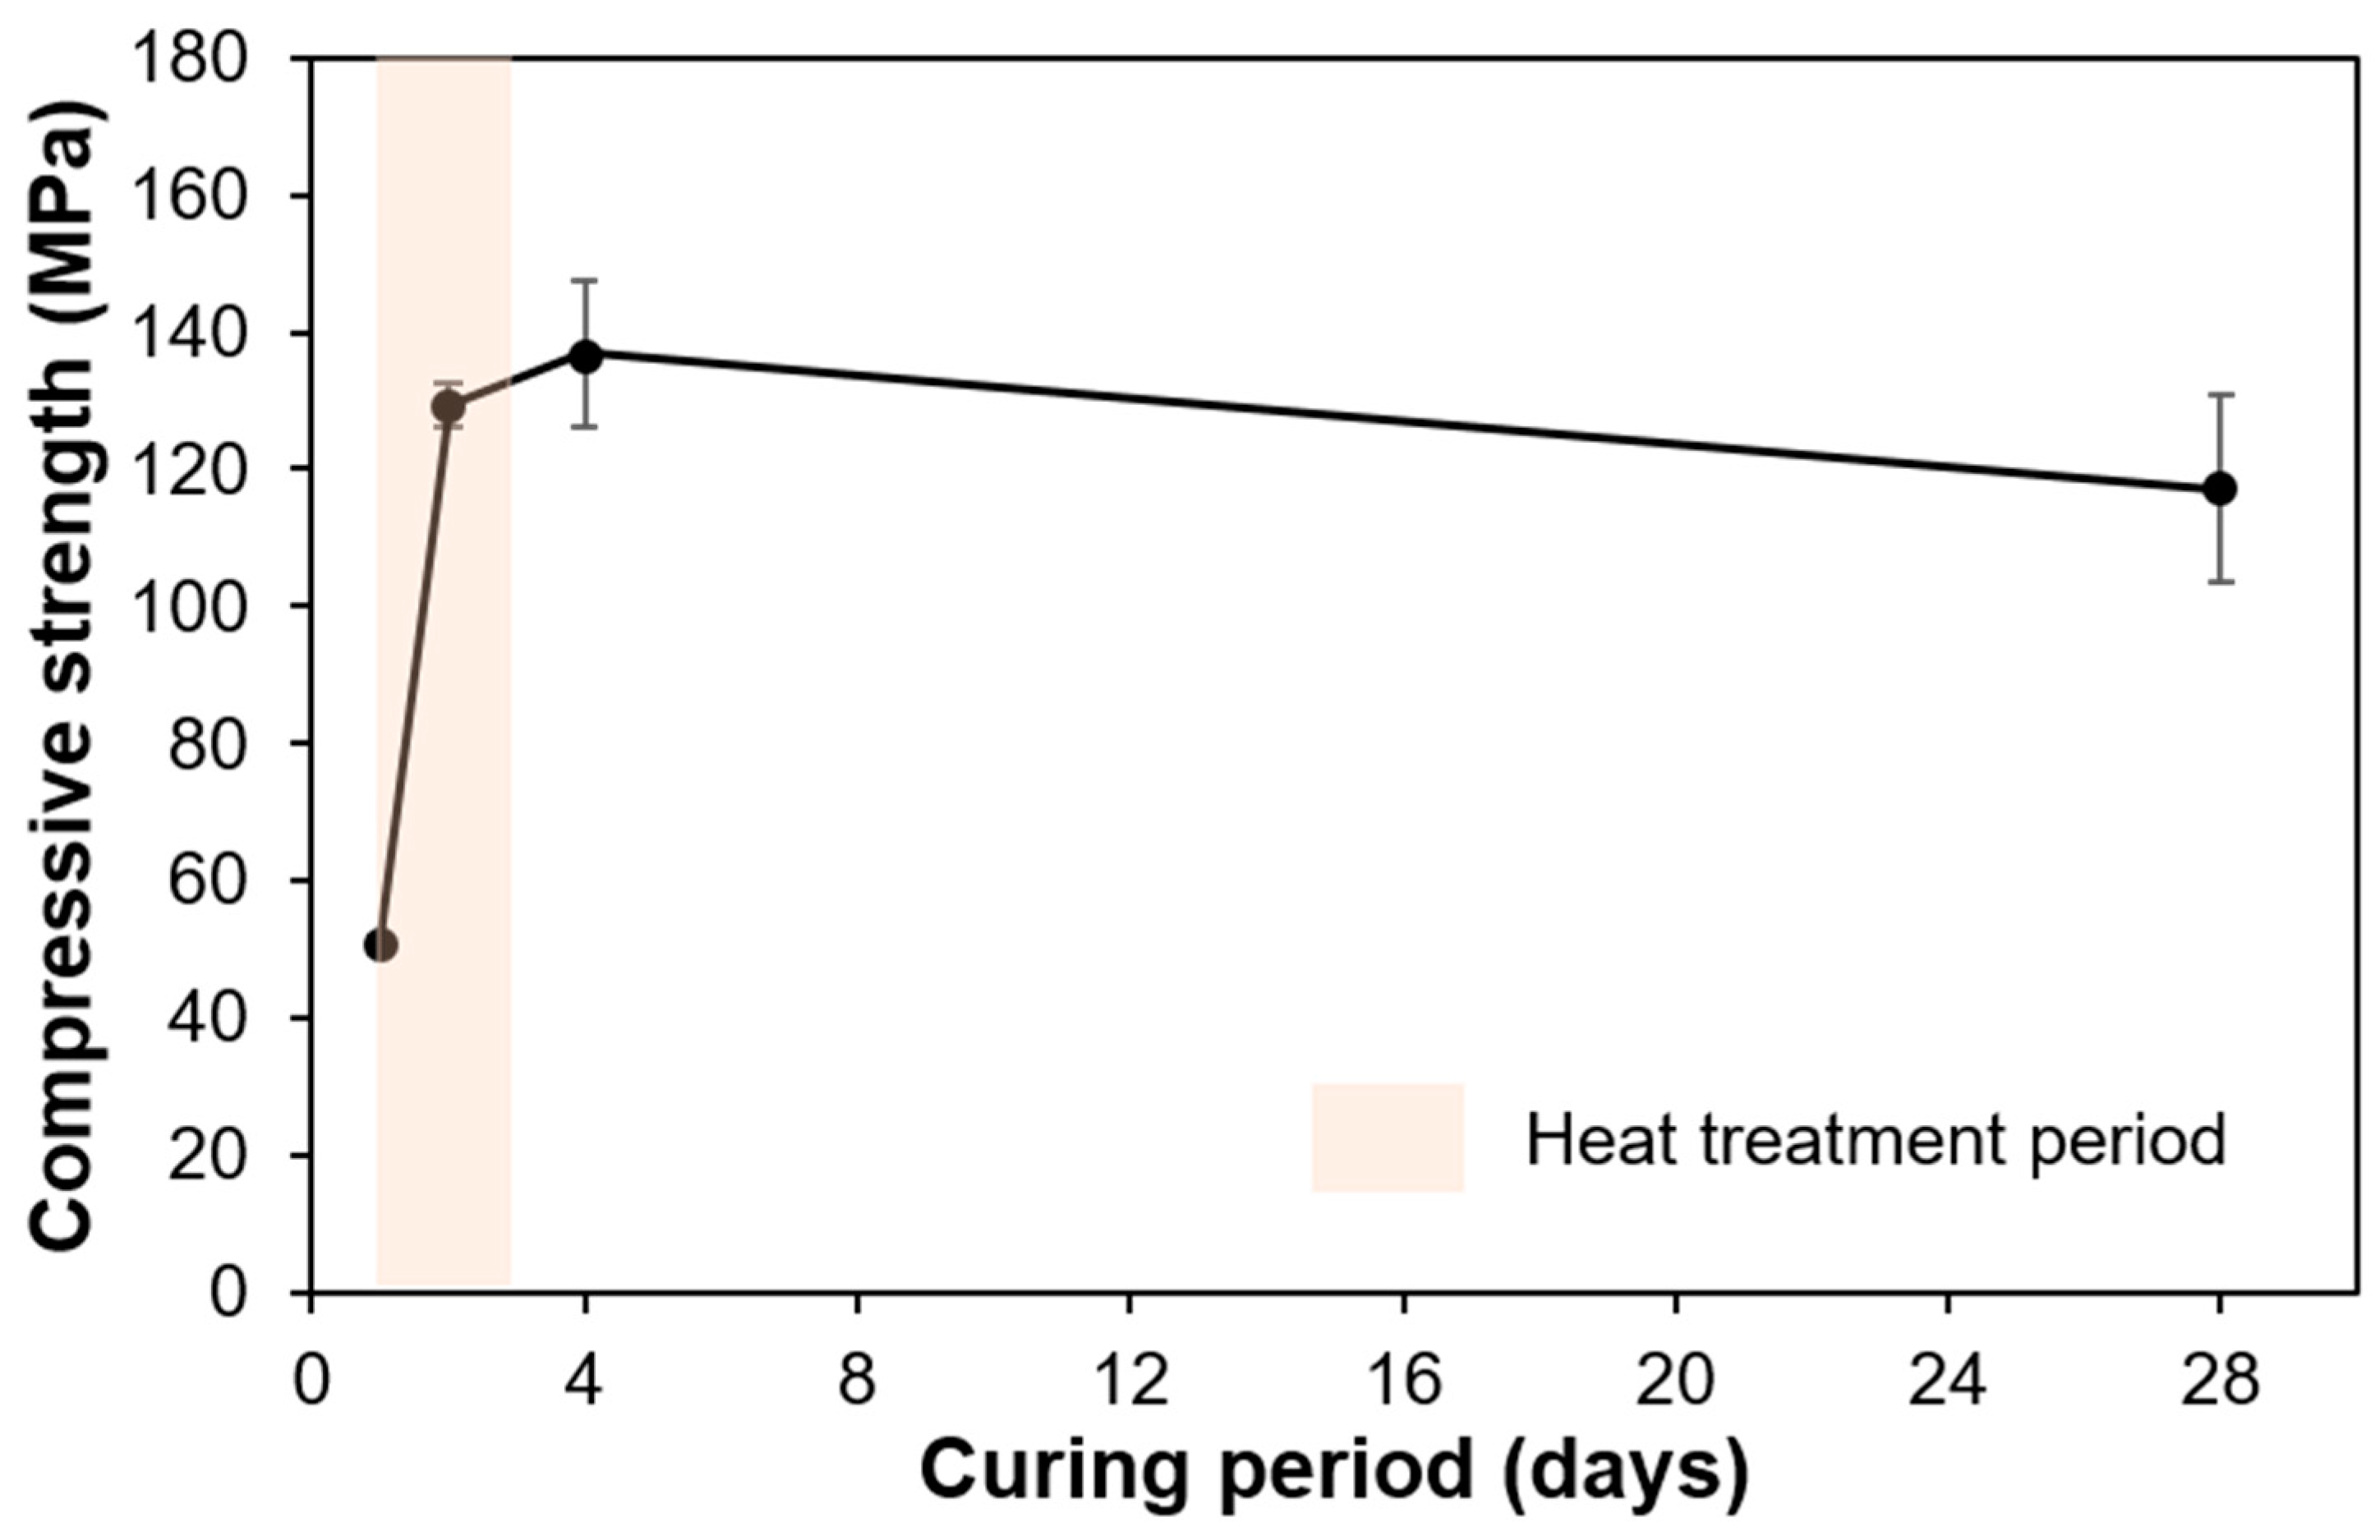
3.1. Compressive Strength Results
3.2. TGA Results
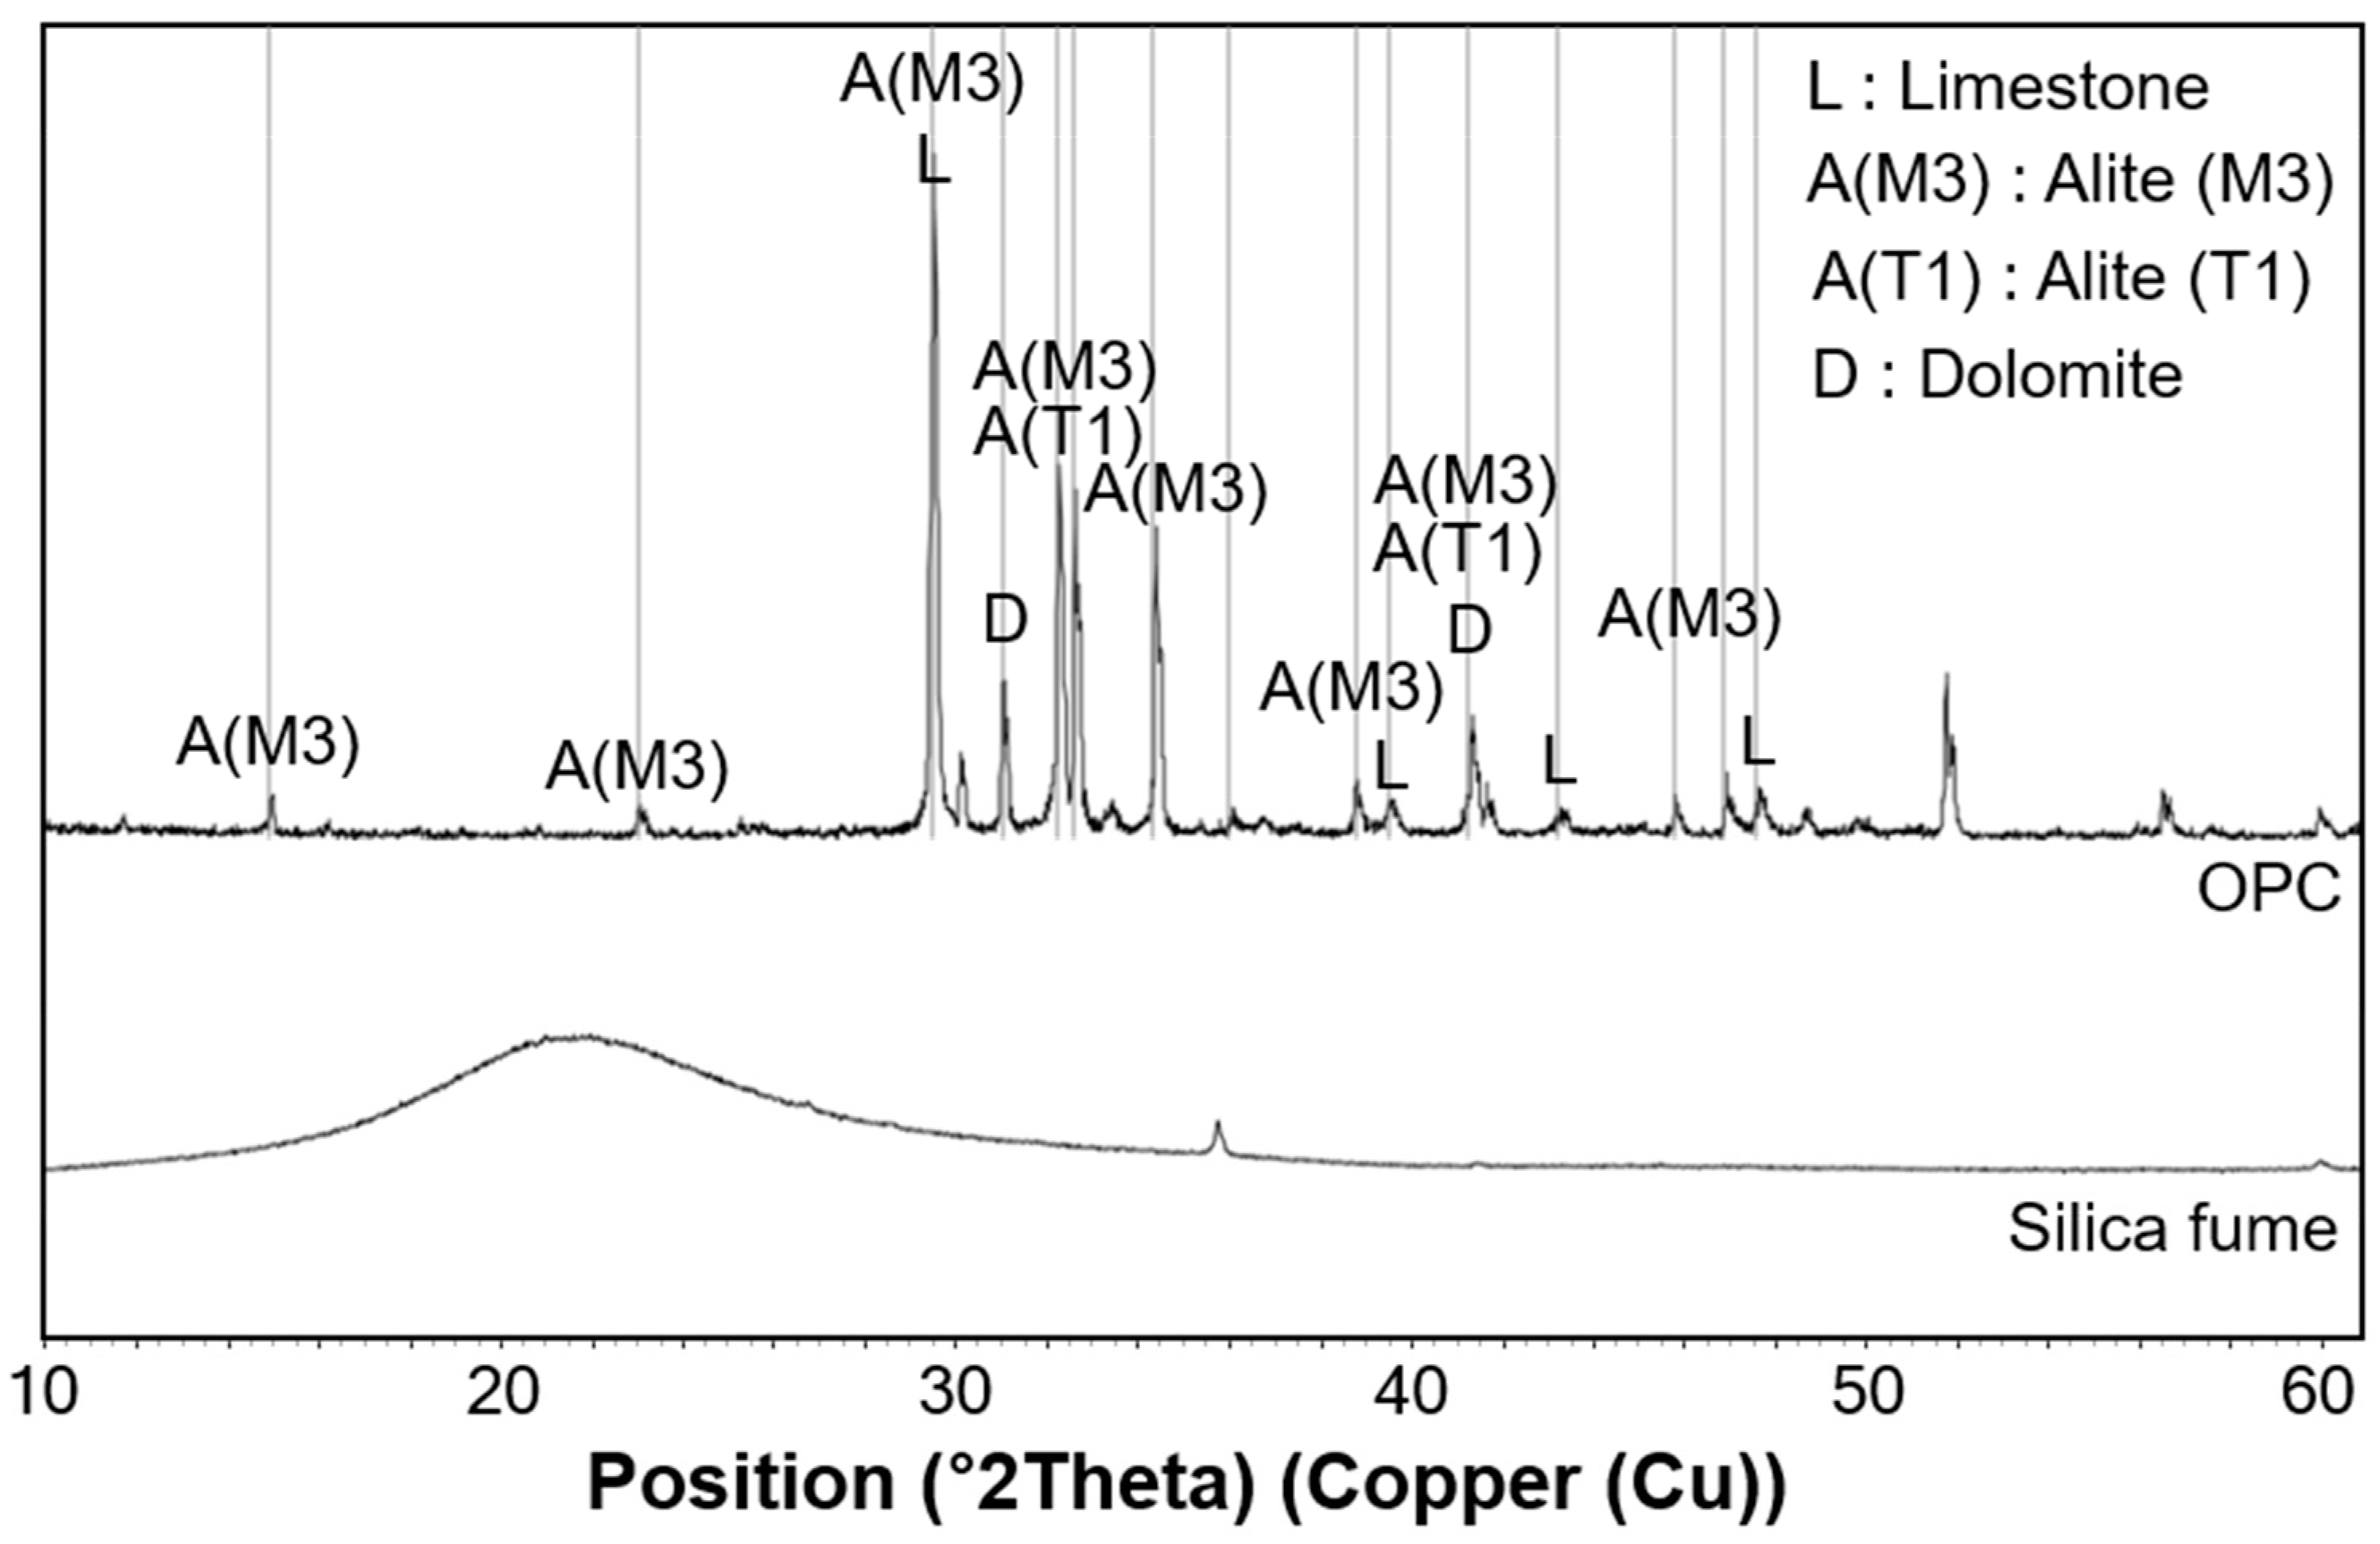
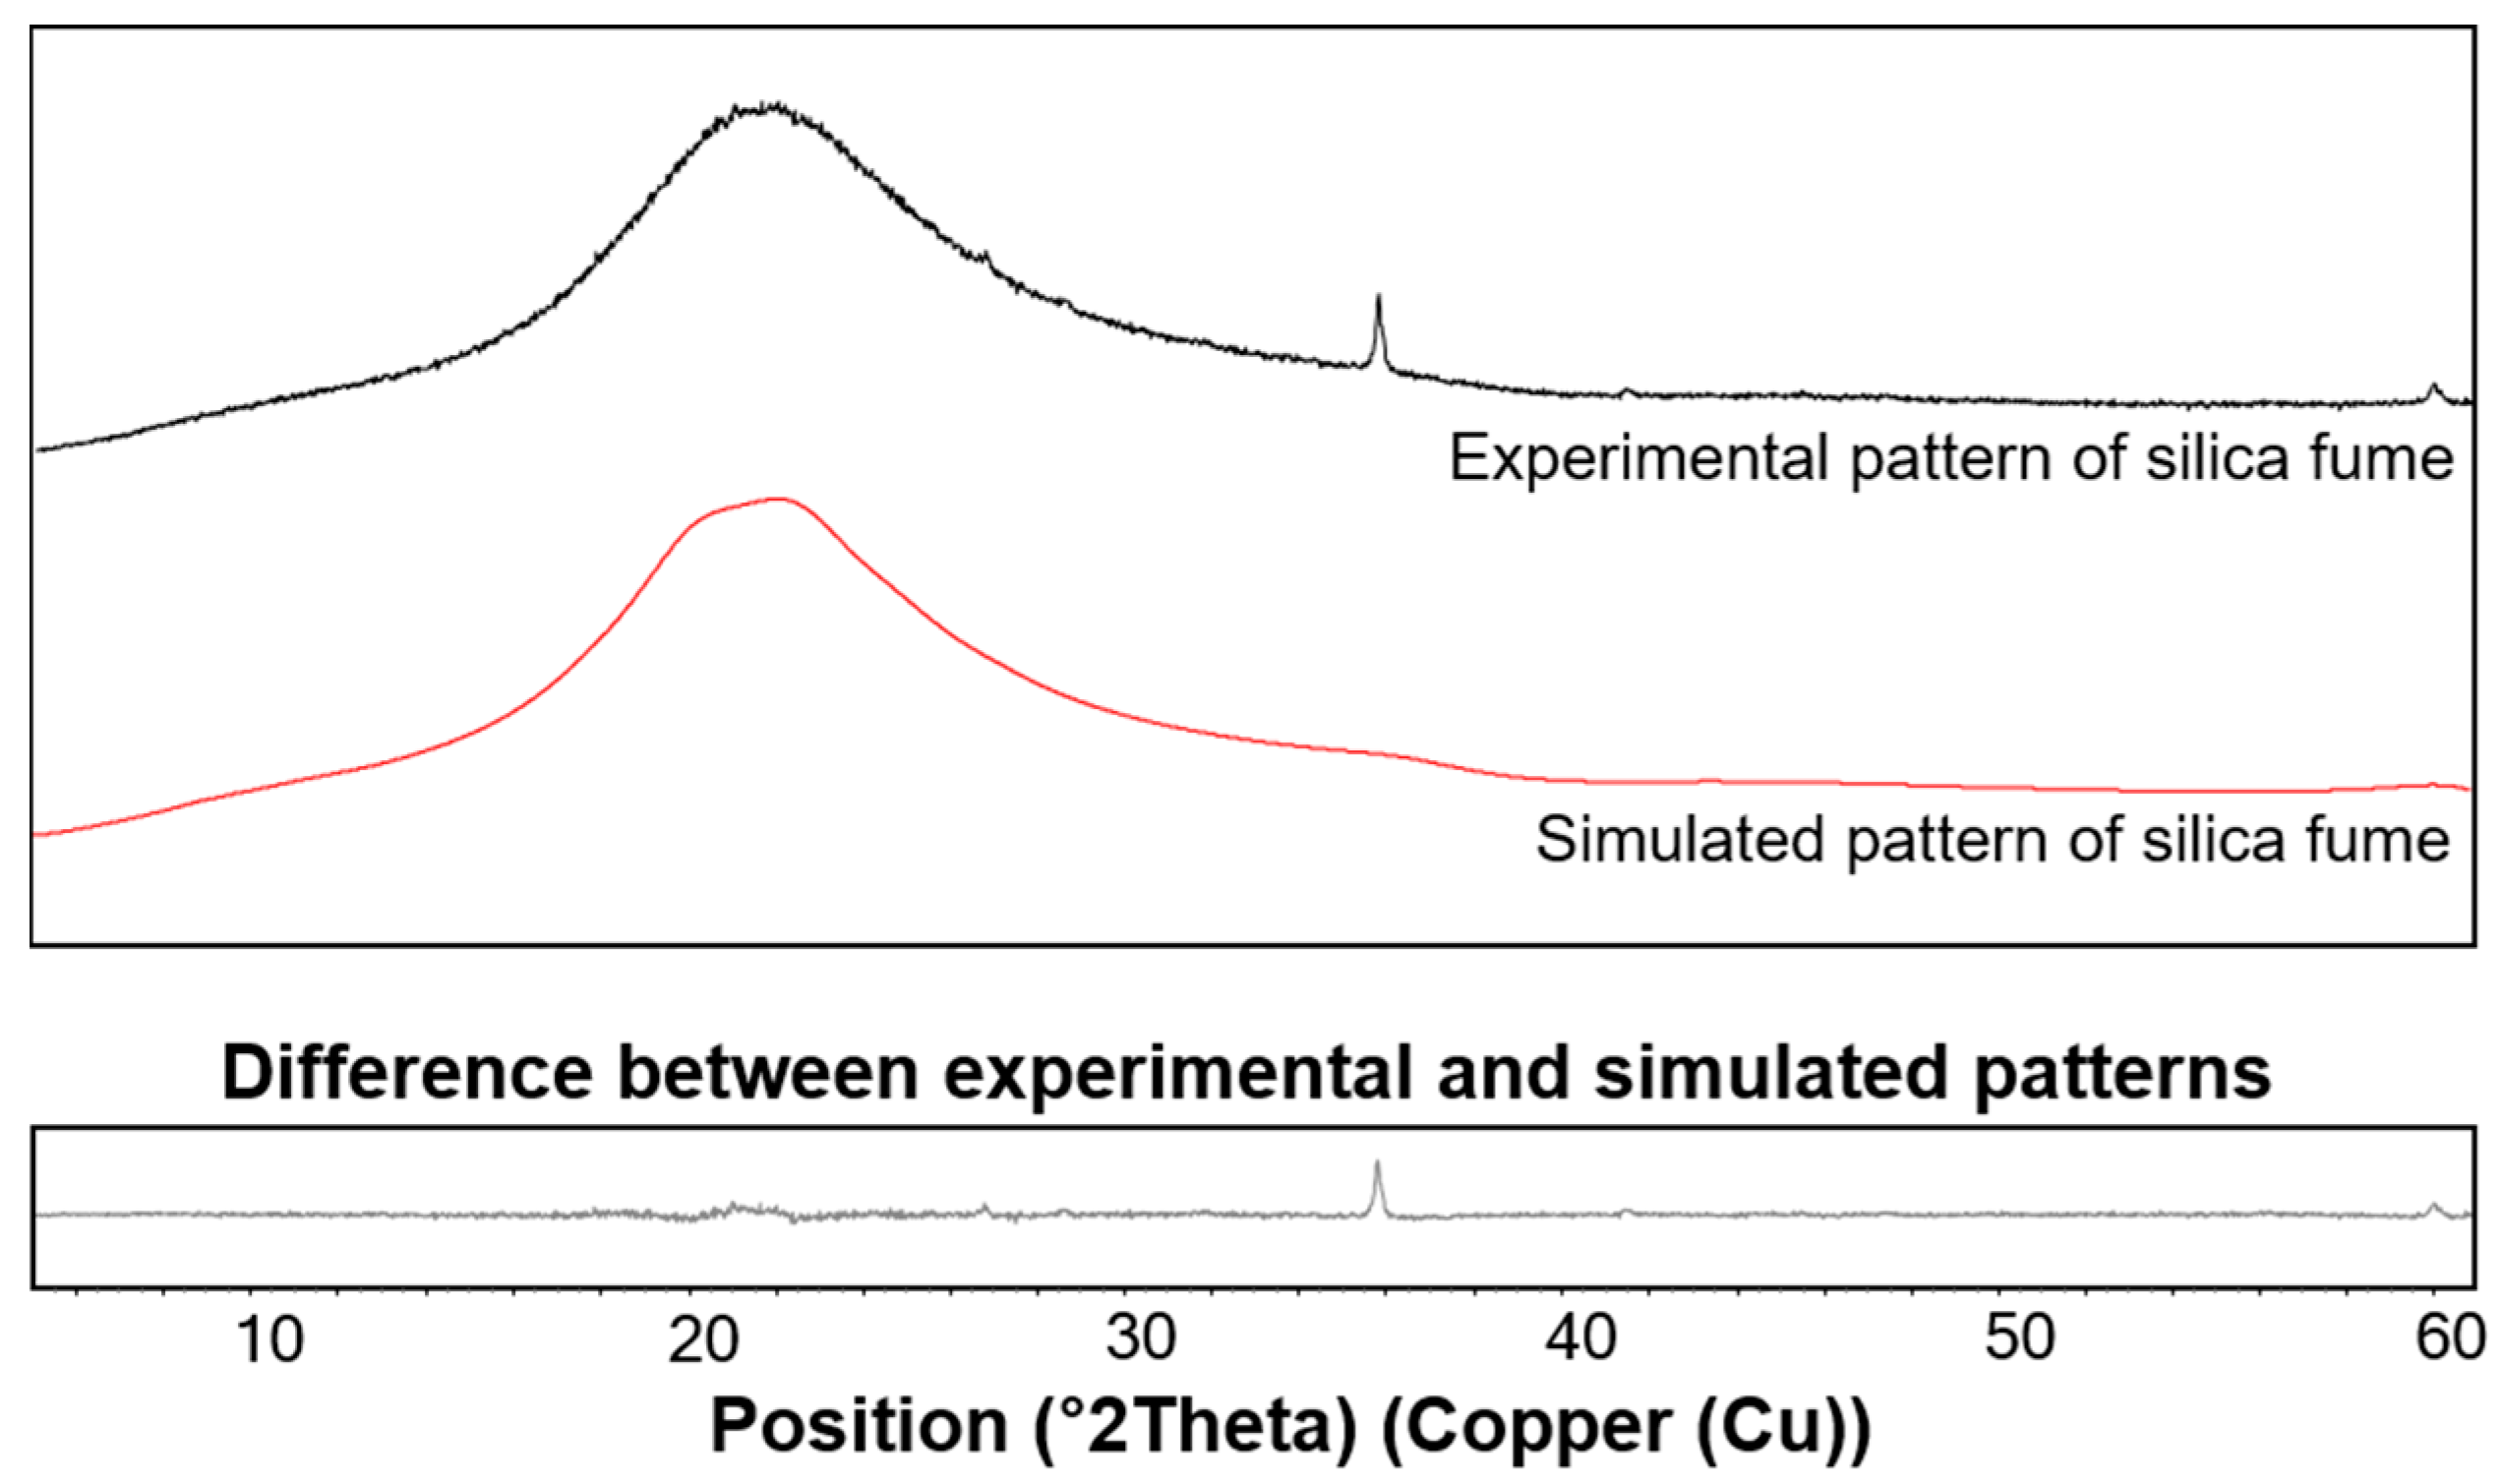
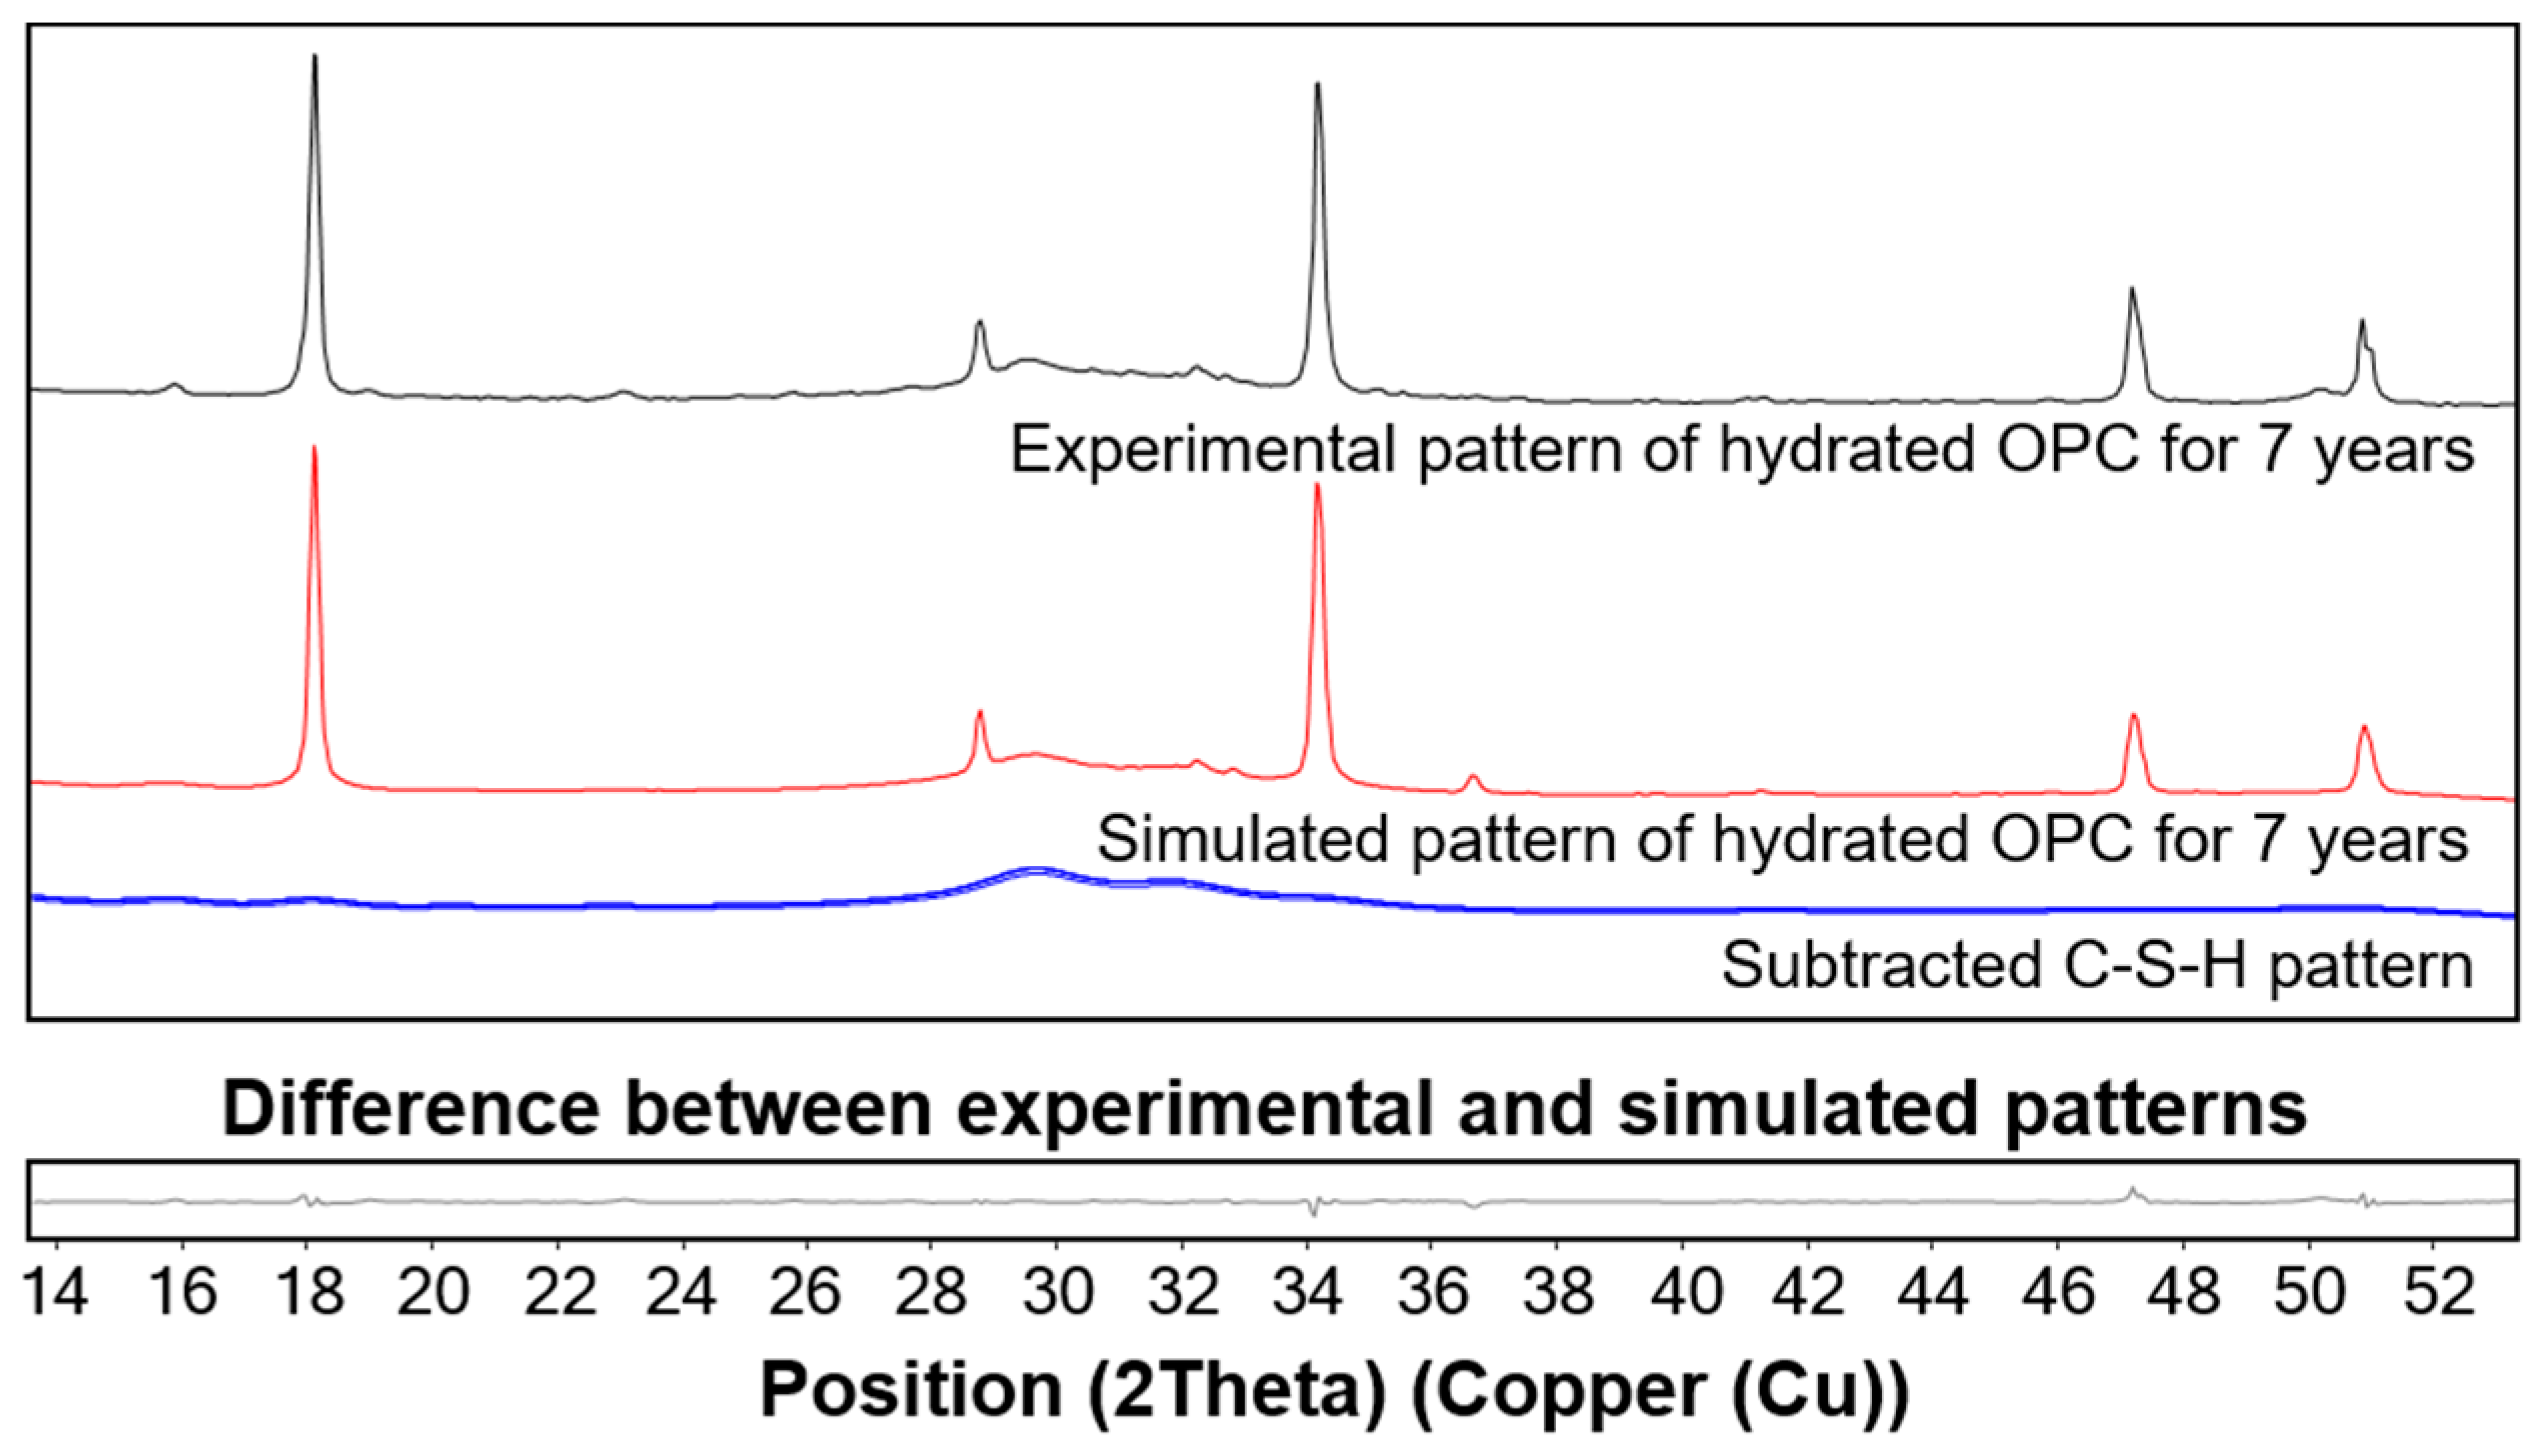
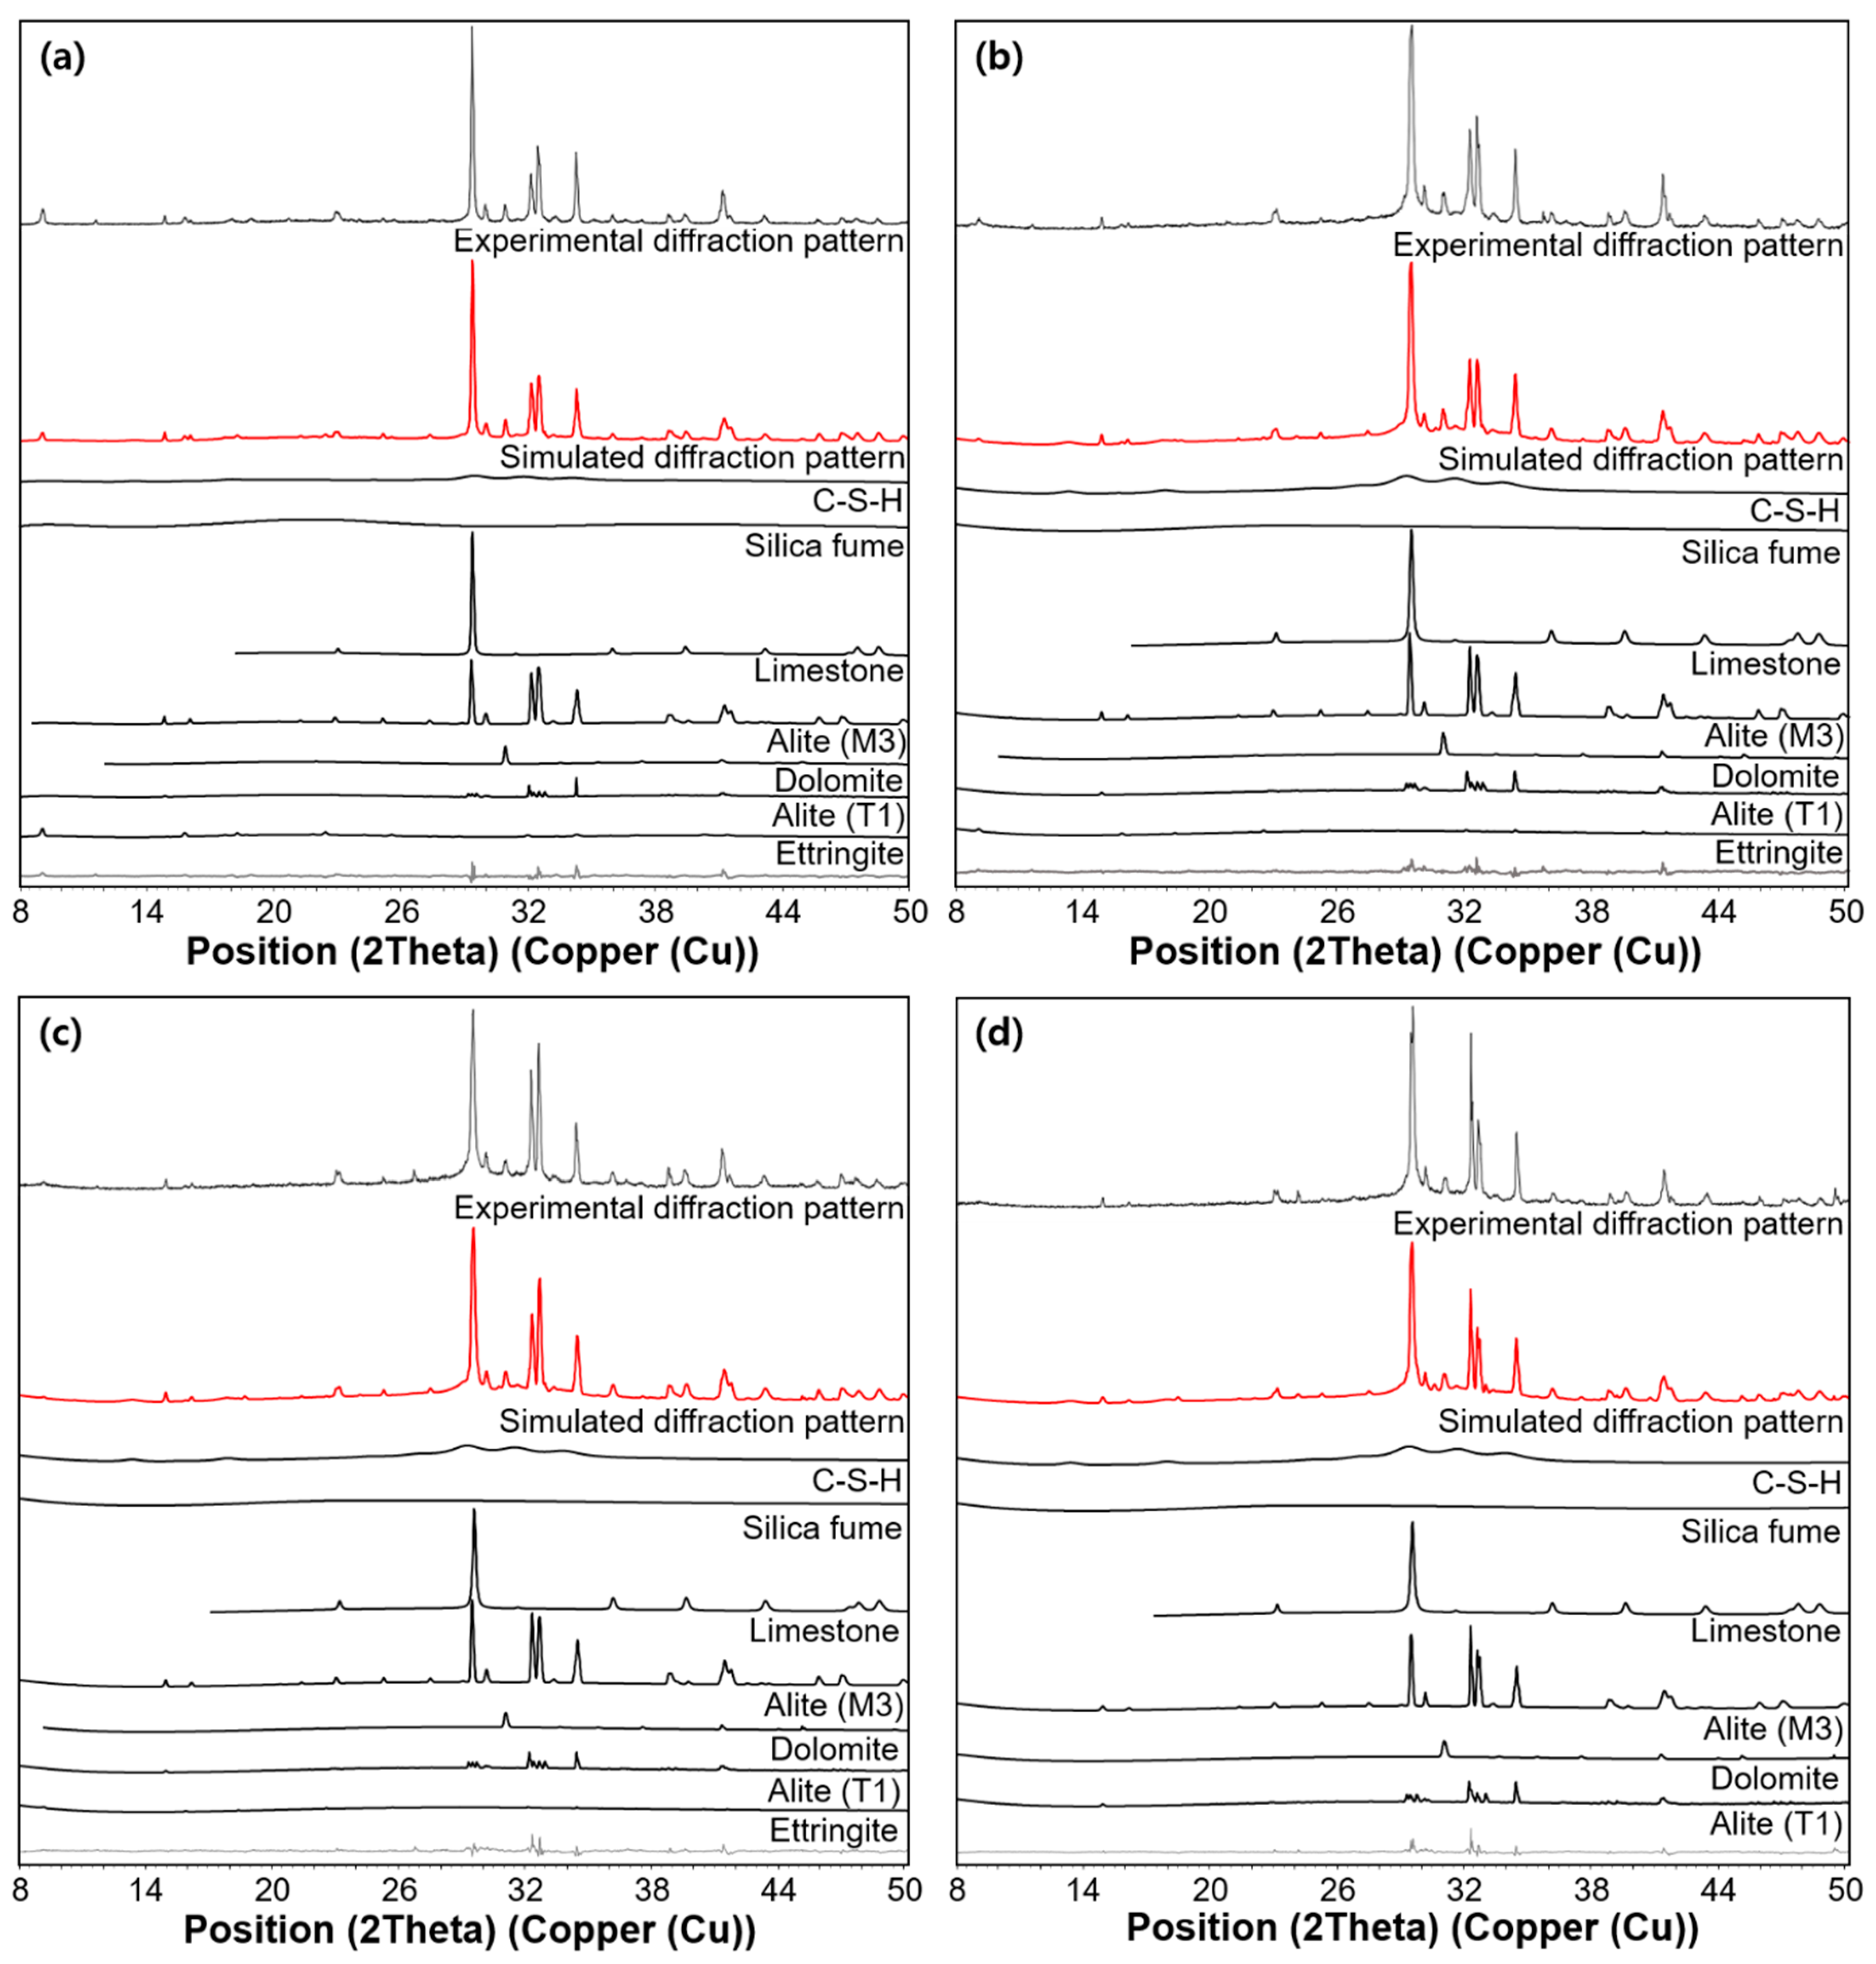
3.3. XRD Results
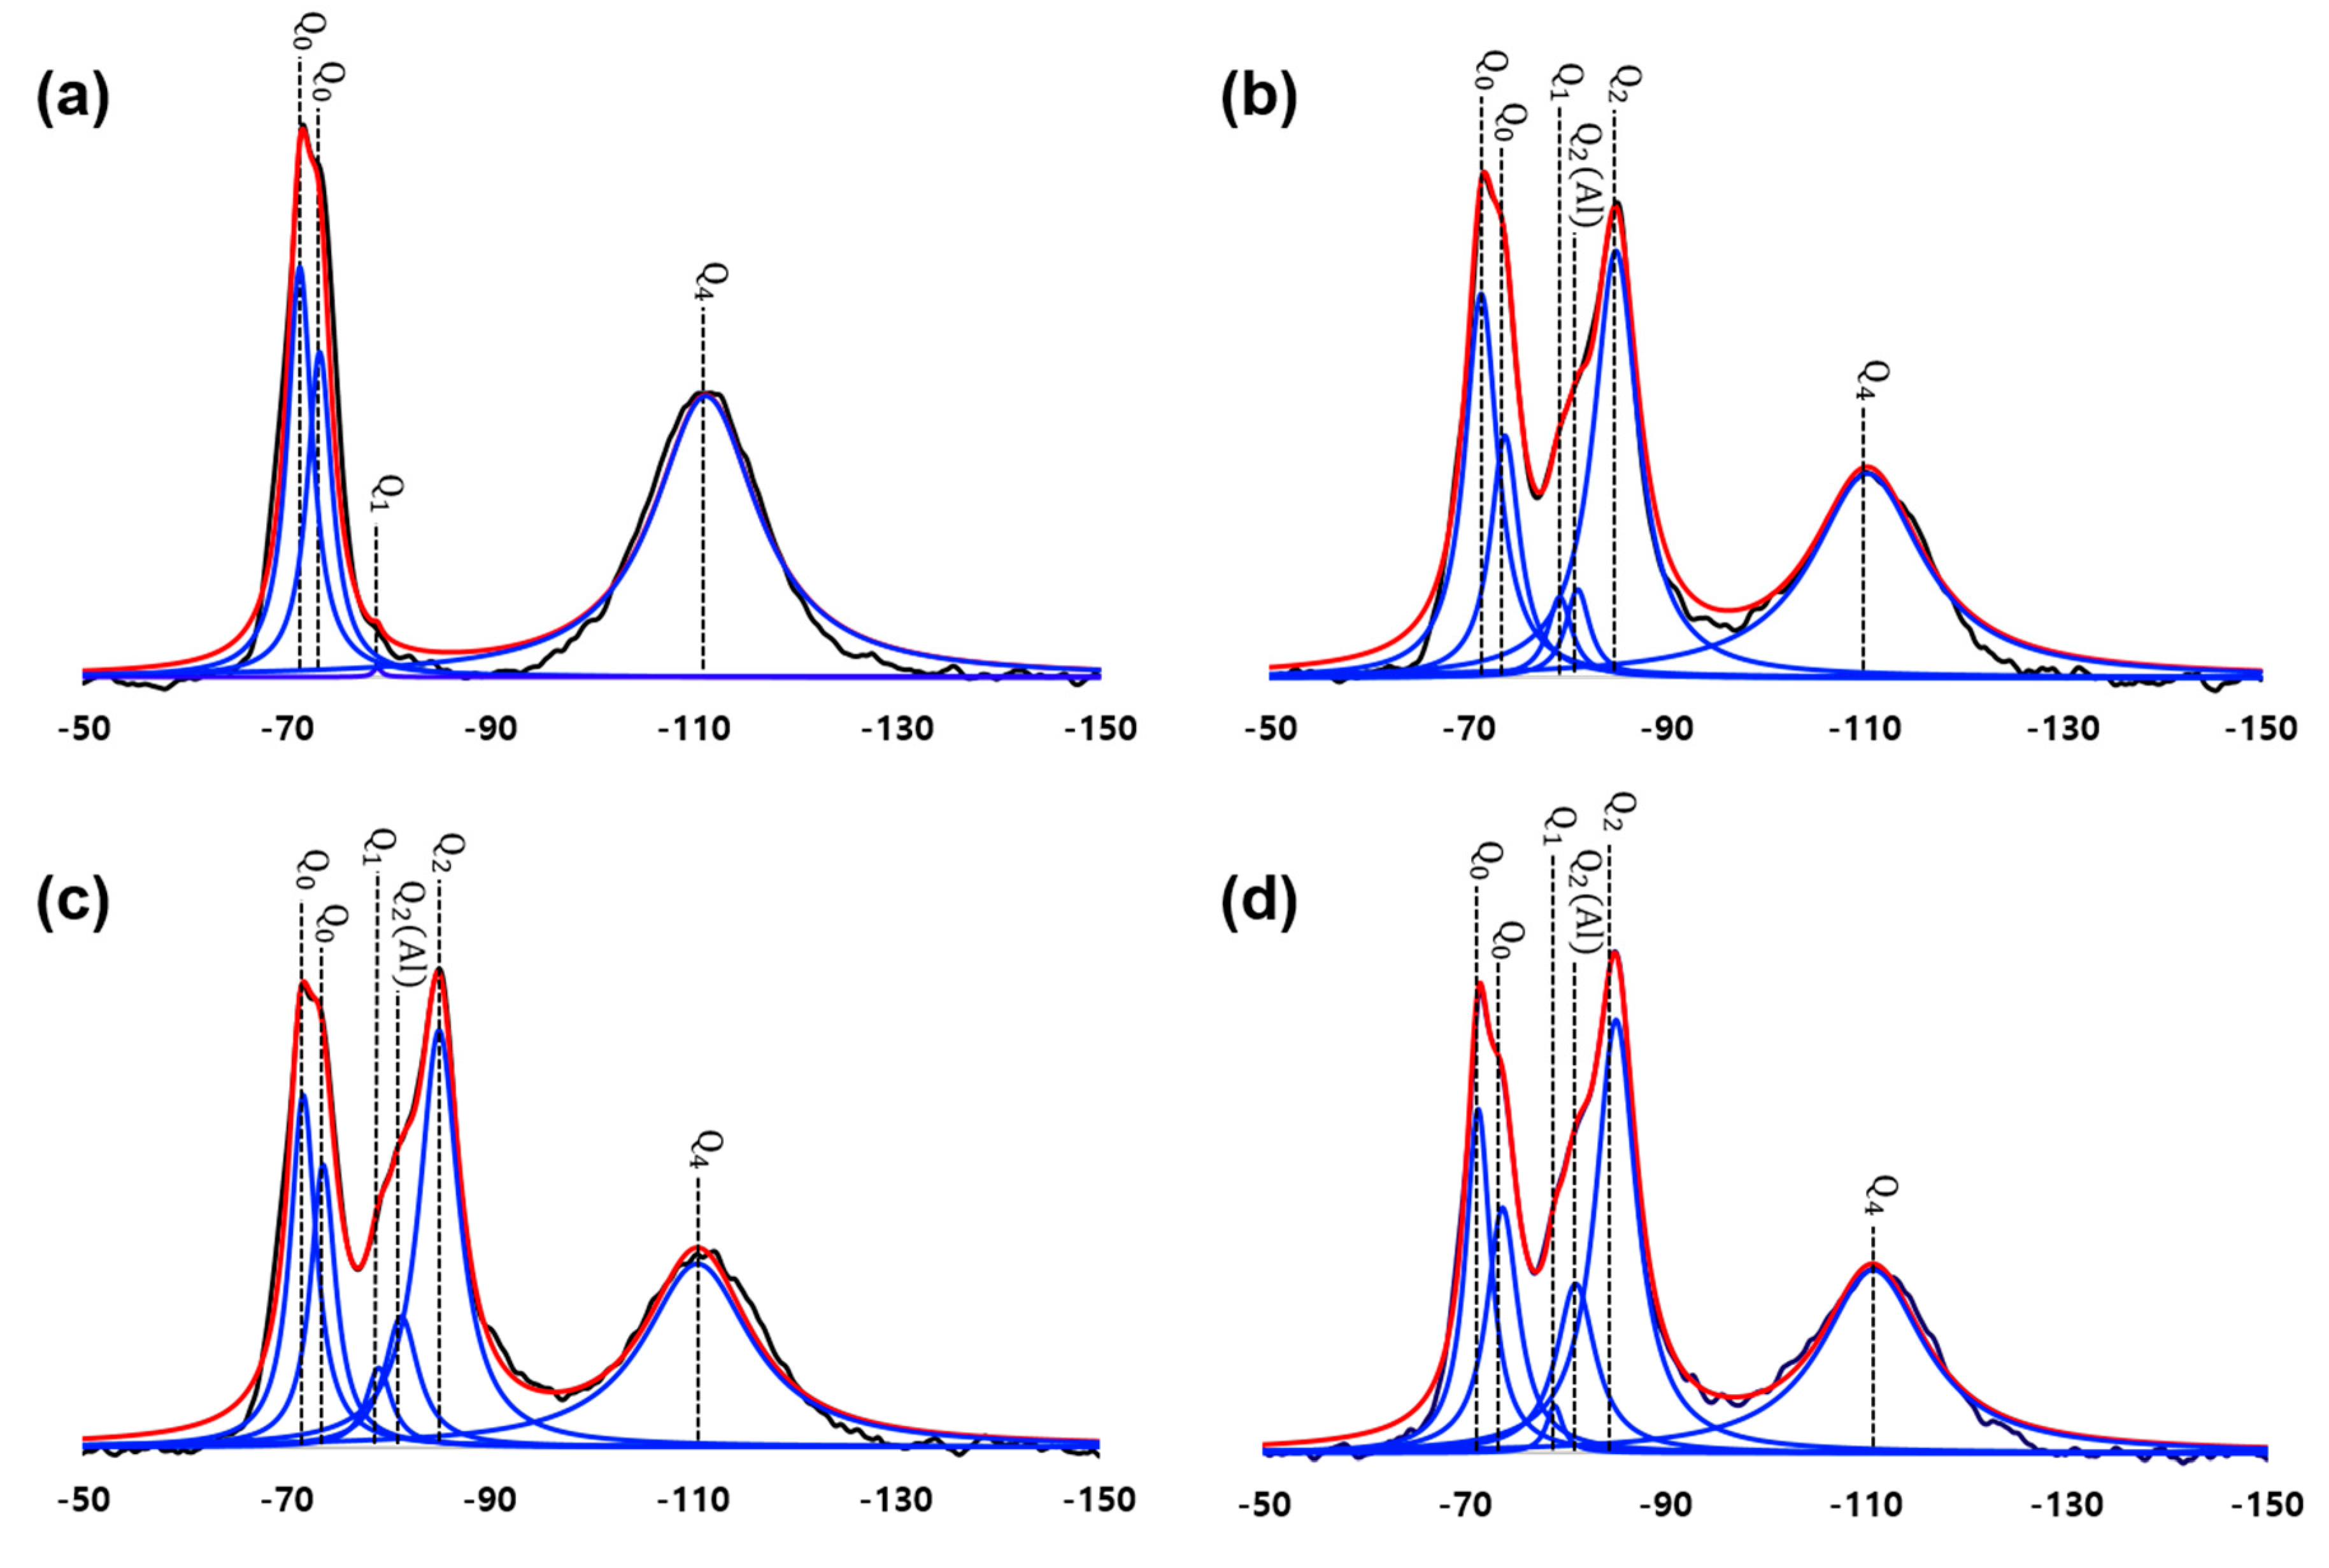
3.4. NMR Results
4. Discussion
4.1. C-S-H Formation Confirmed by XRD and TGA
4.2. Relationship between Compressive Strength and C-S-H Formation
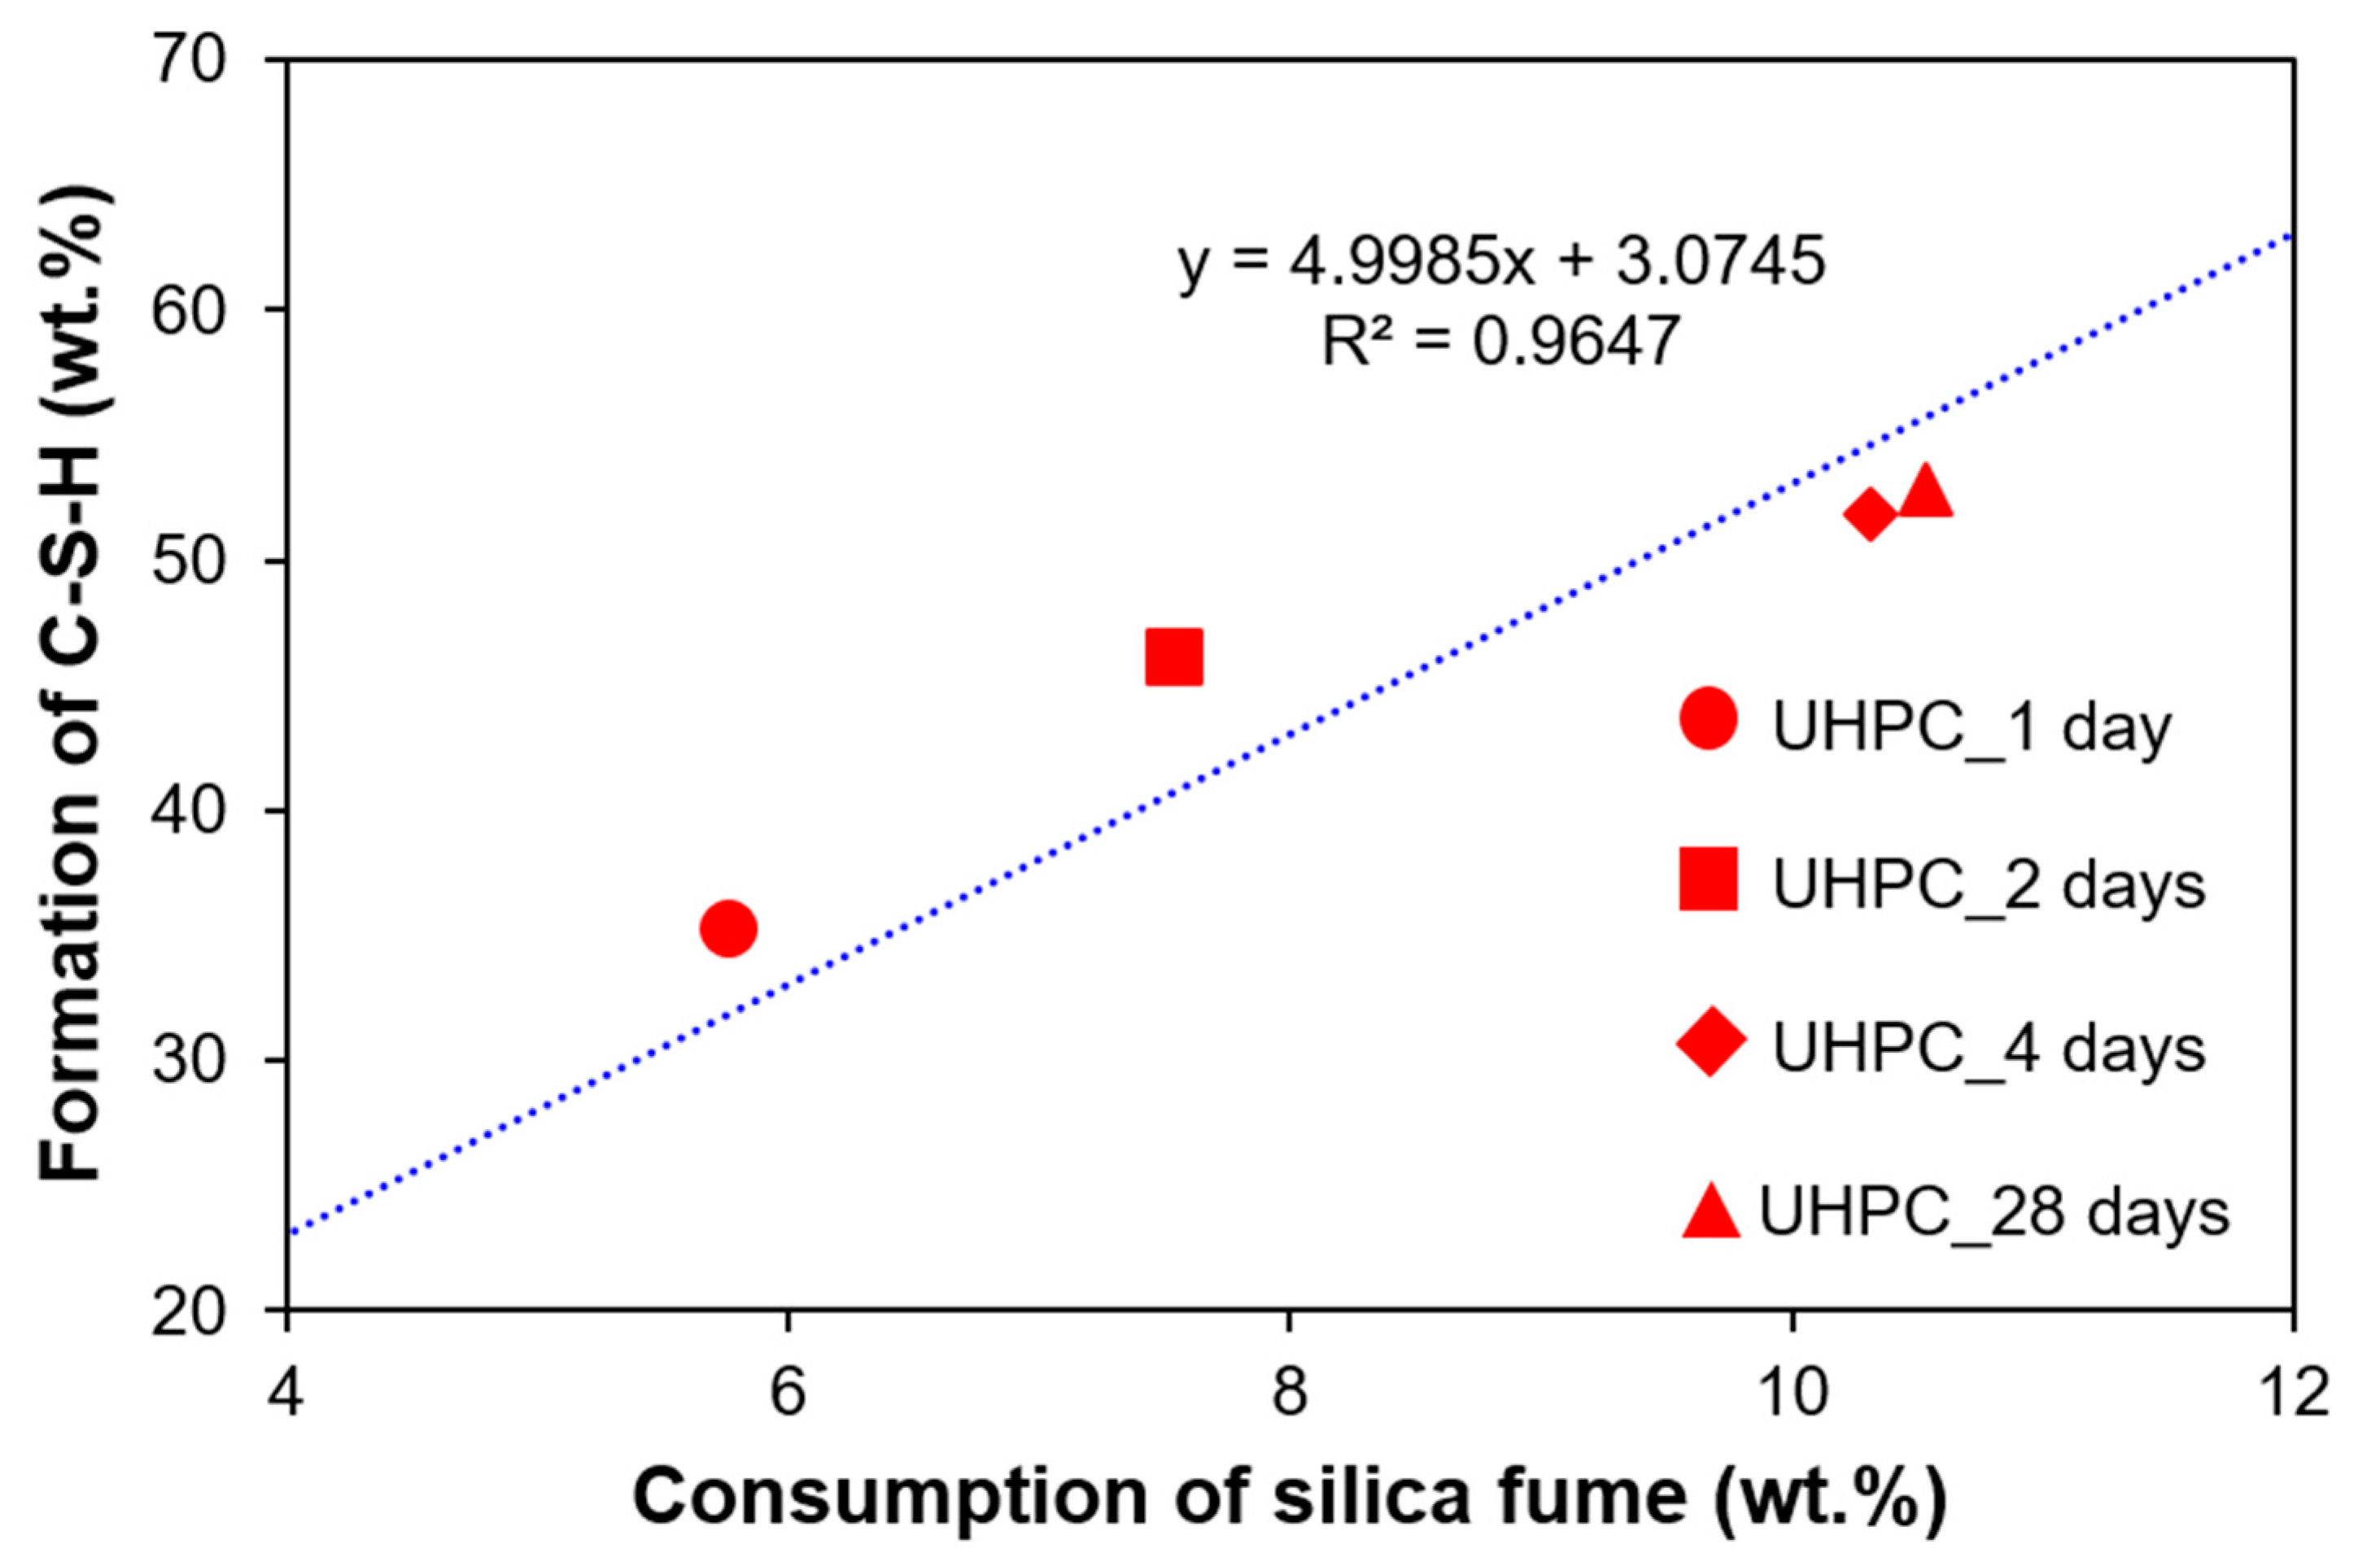
4.3. Relationship between Consumption of Silica Fume and Formation of C-S-H
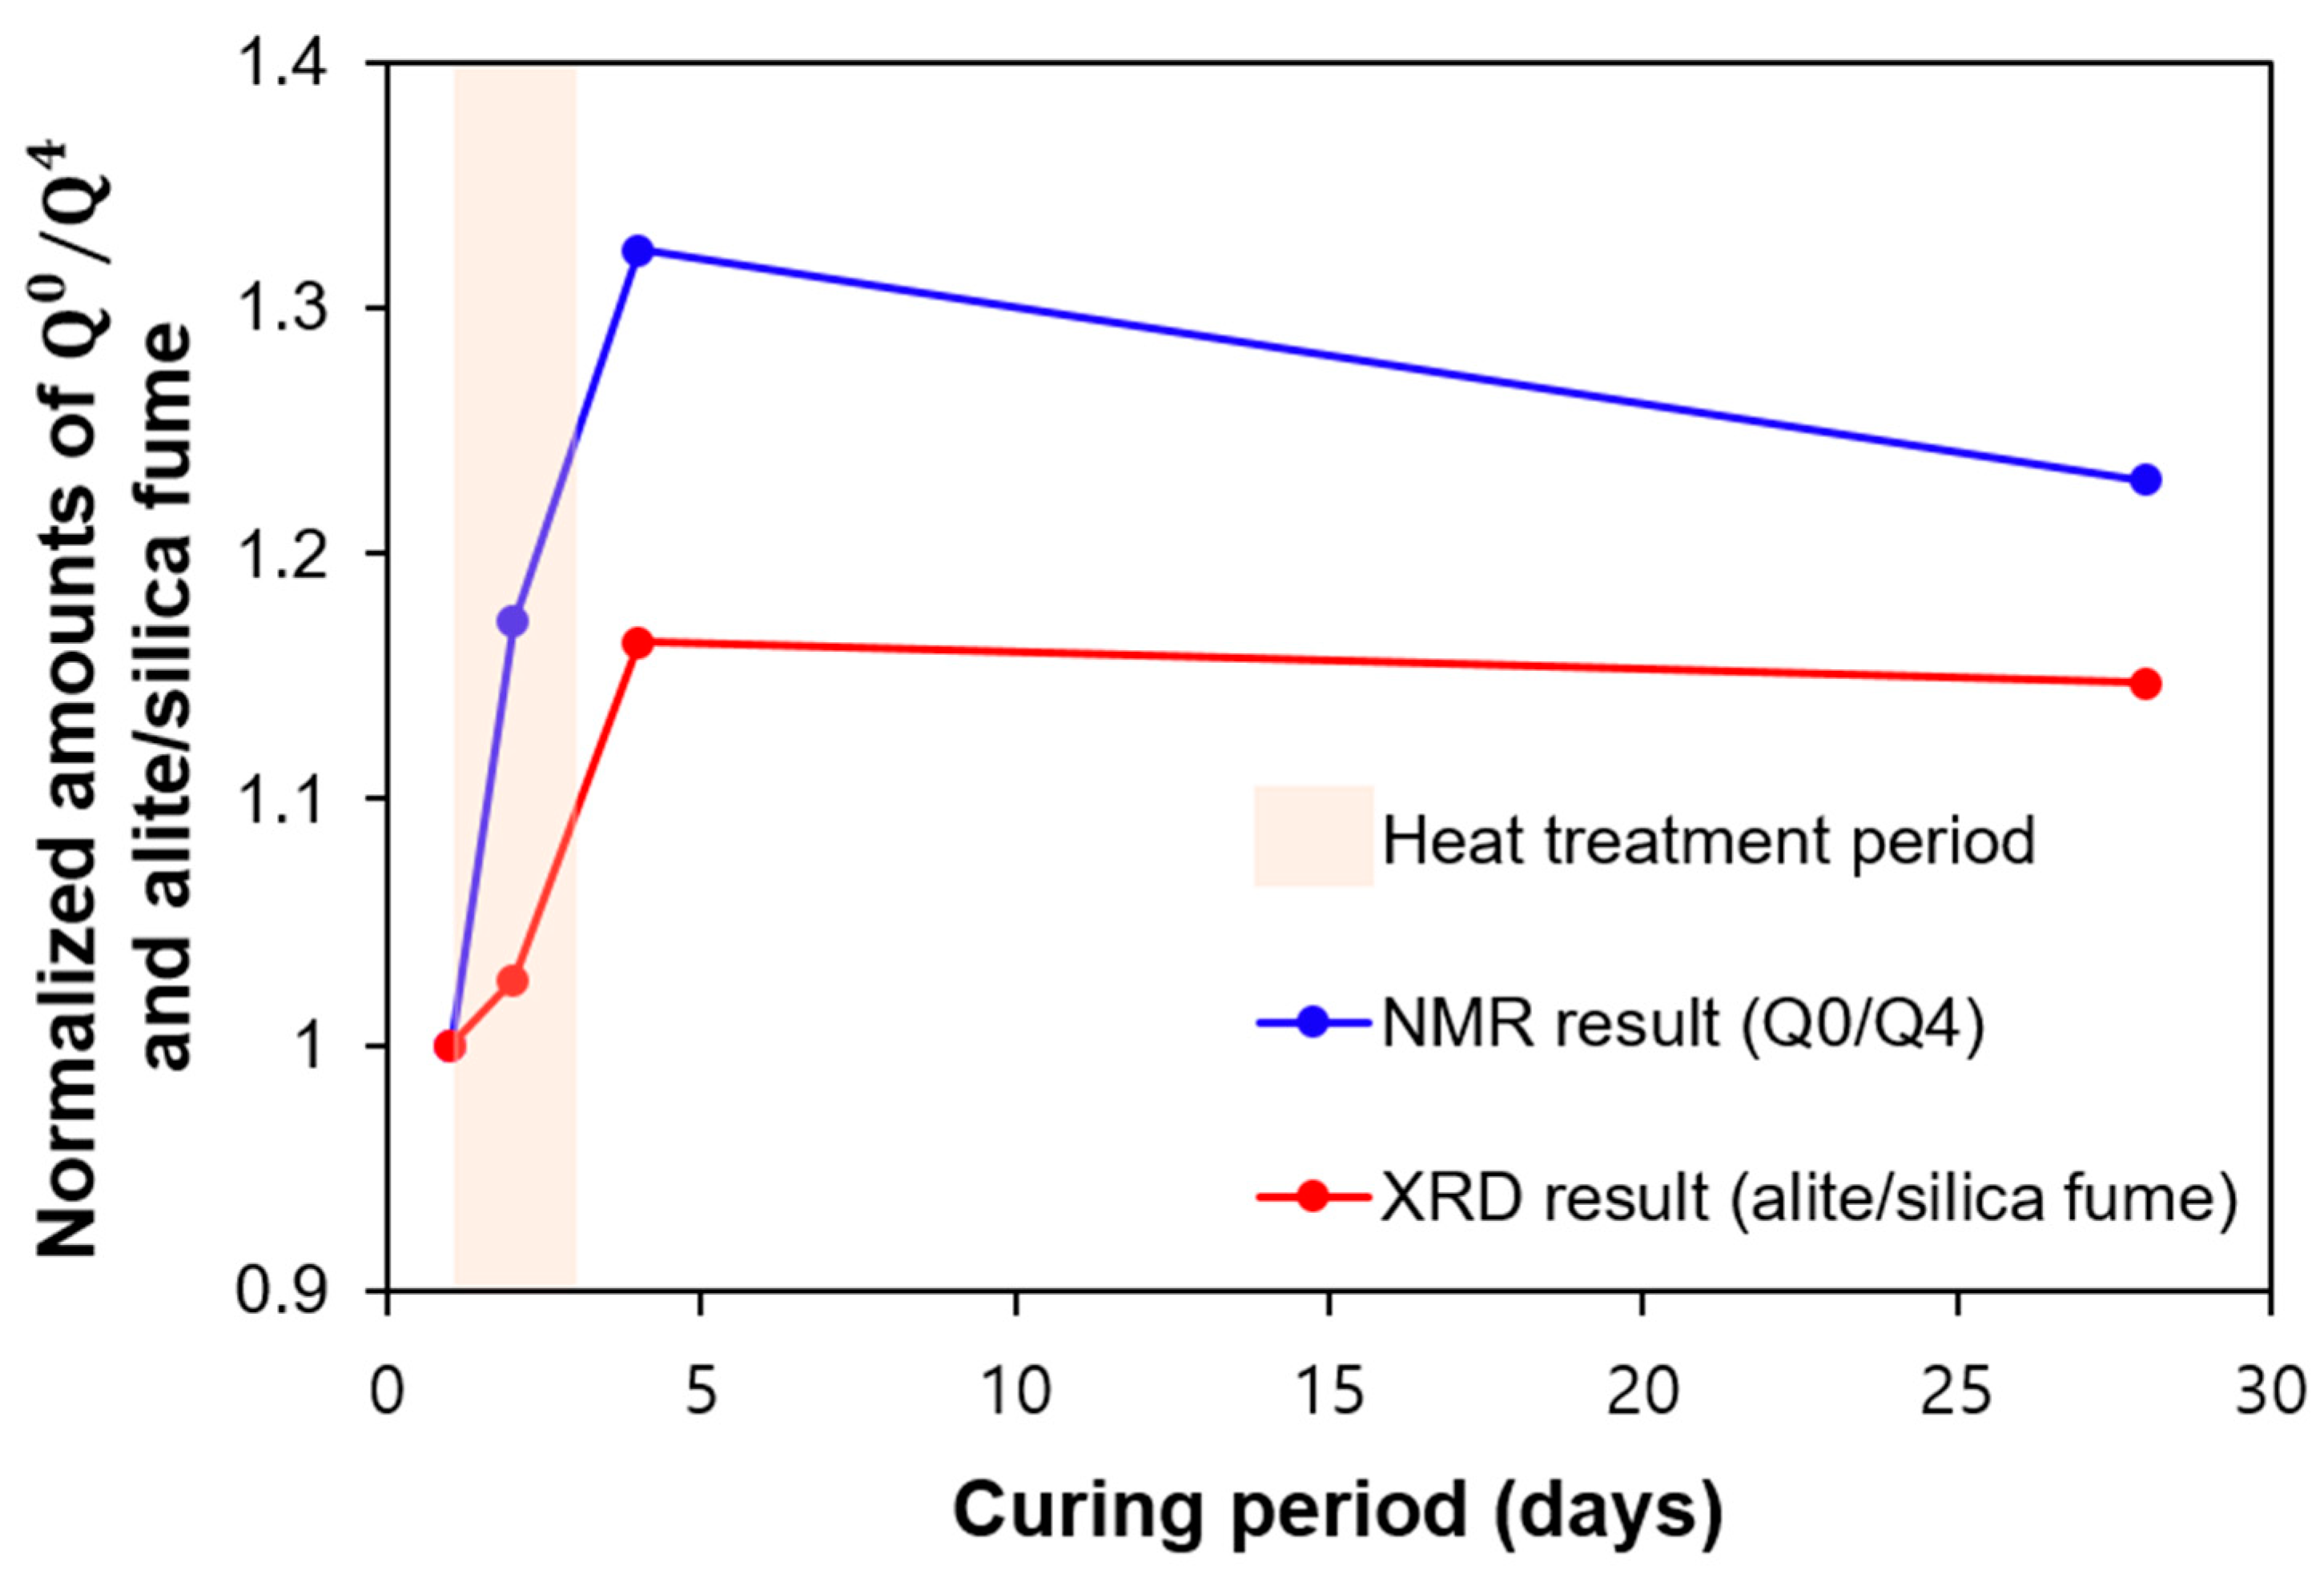
4.4. Comparison of the Reactivity of Silica Fume and Clinker Materials from XRD and NMR
5. Conclusions
- The compressive strength of UHPC cured for 1, 2, 4, and 28 days was 50.7, 129.3, 136.9, and 117.2 MPa, respectively. The 2 days of heat treatment significantly enhanced the pozzolanic reaction, effectively increasing the compressive strength. However, it showed a slight decrease at later ages, which was explained by the micro-cracking that may have been caused by the steady formation of C-S-H on the pre-formed dense microstructure of UHPC. This is plausible, since the formation was dominated by OPC hydration (rather than pozzolanic reaction) at later ages. which should involve the micro-expansion of existing hydration products to secure space for subsequent hydration;
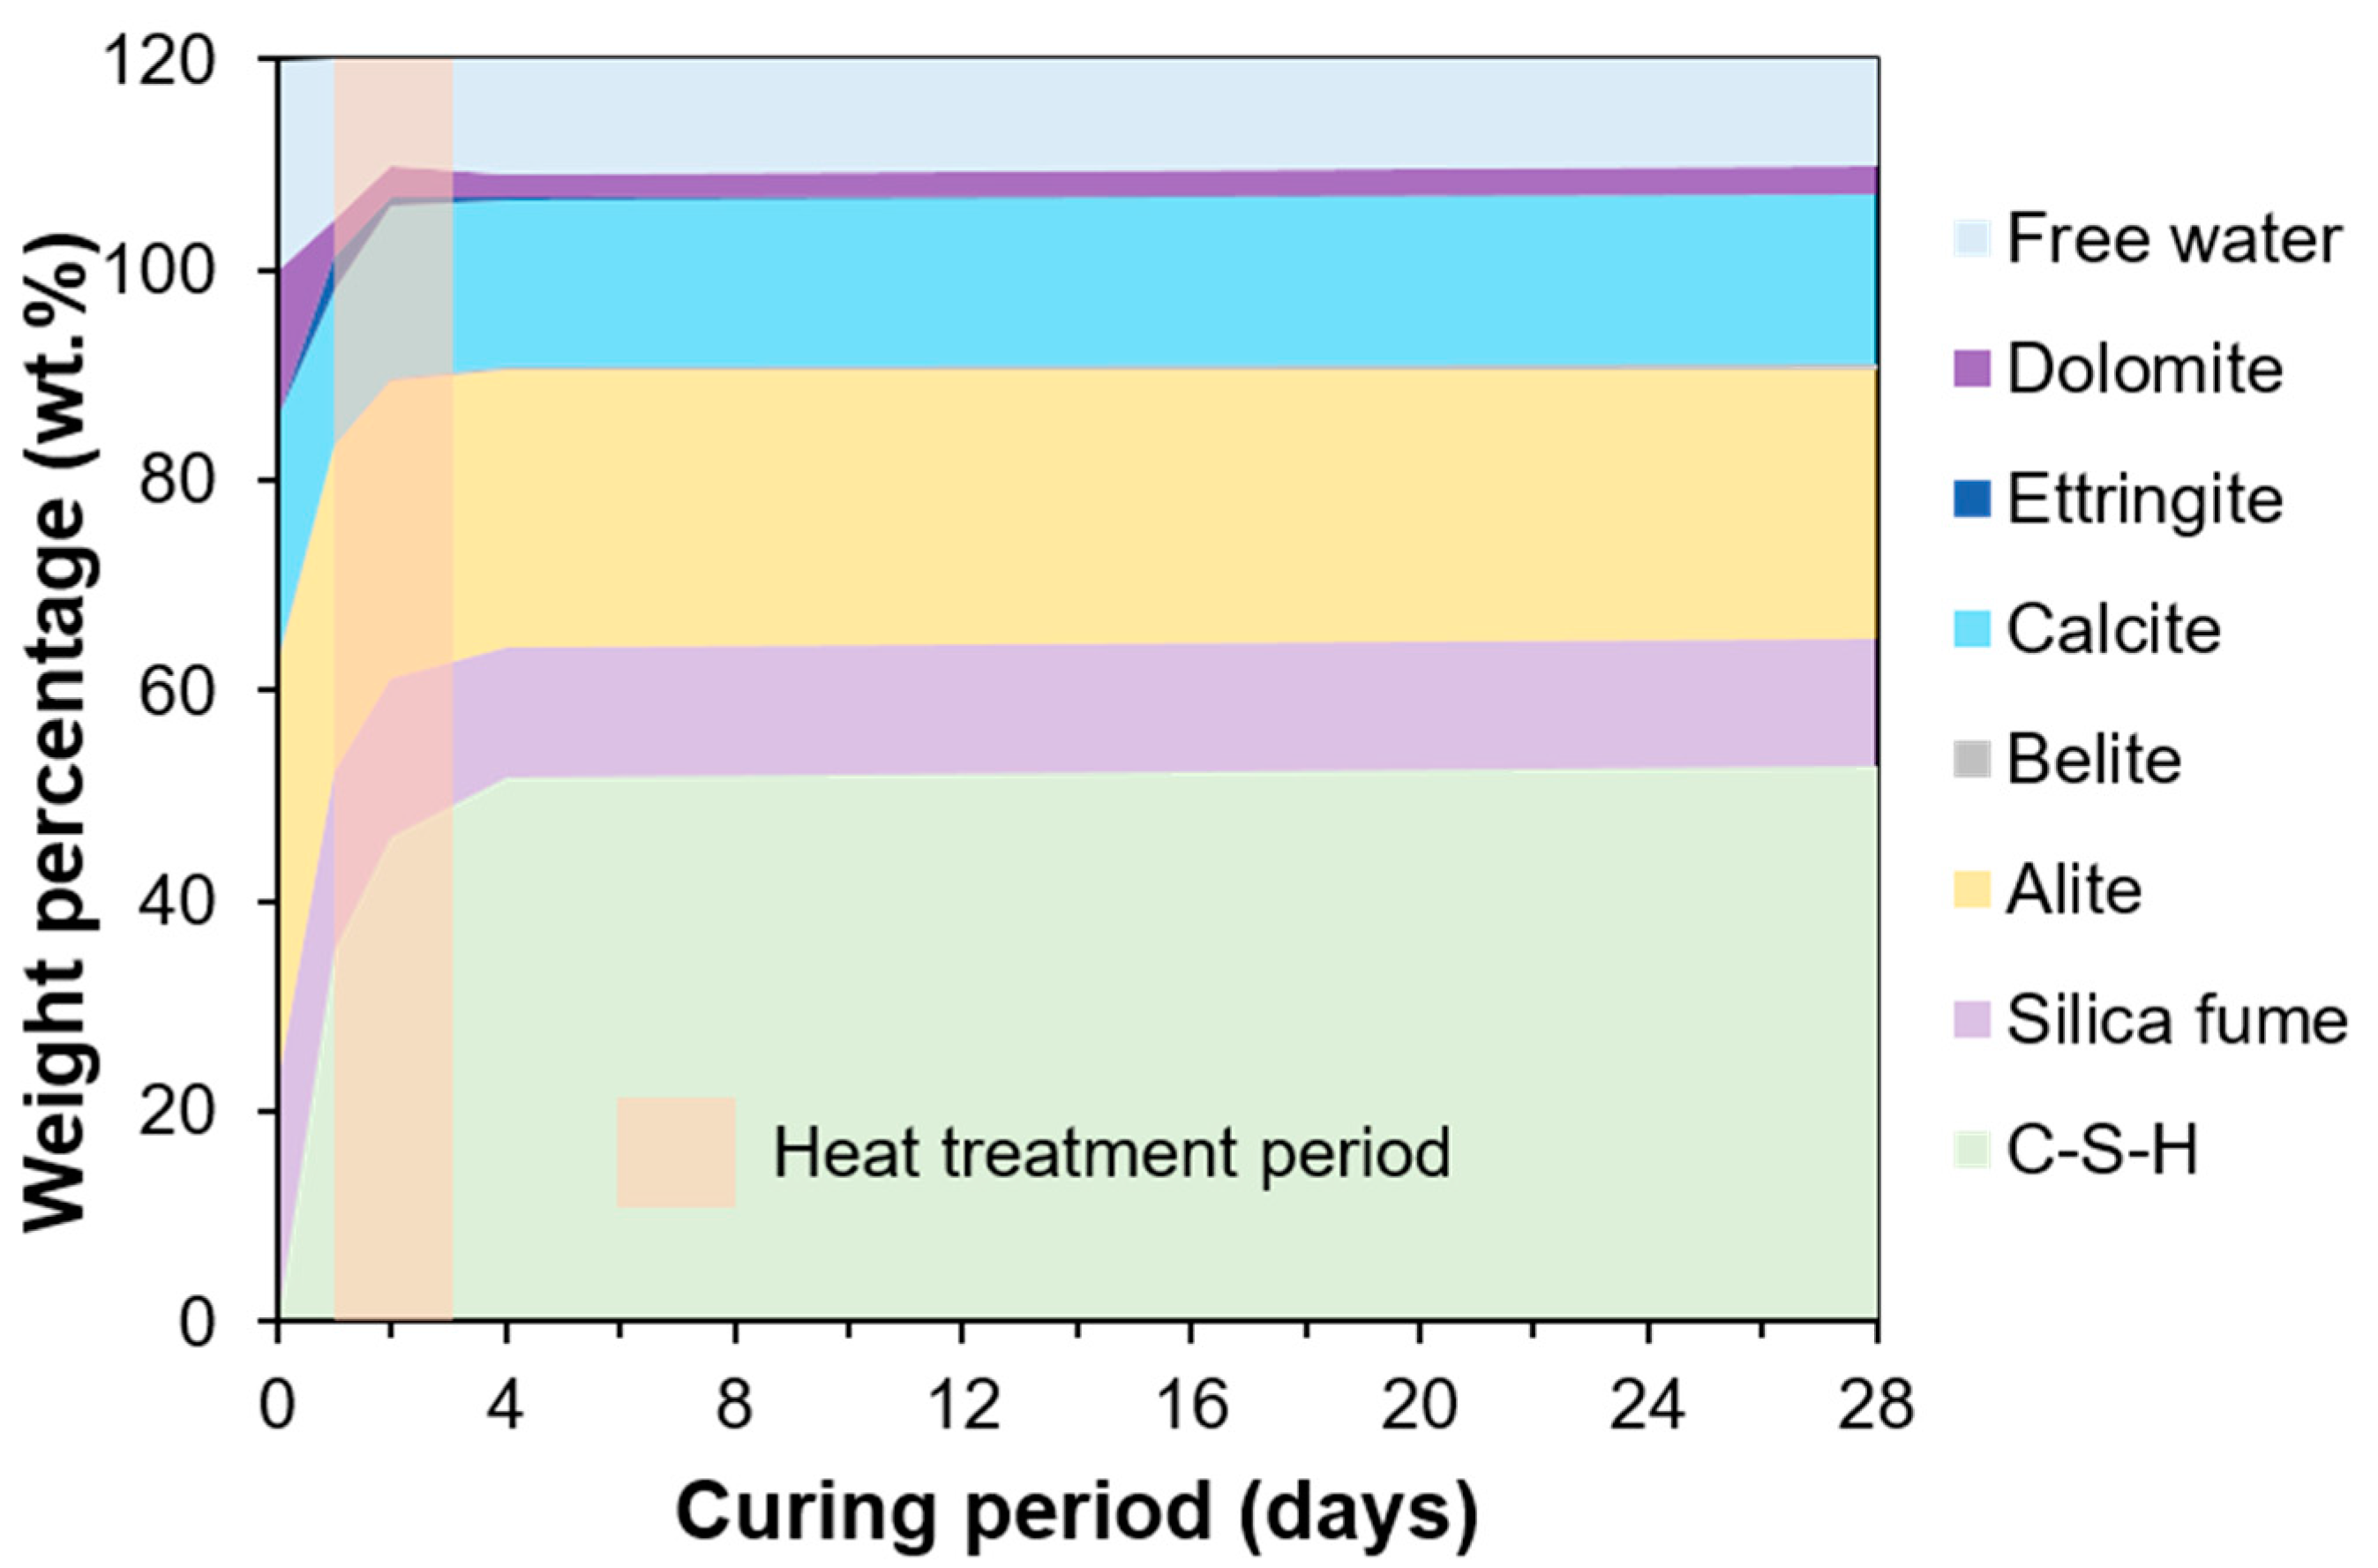
- In terms of the degree of hydration of UHPC, the QXRD and TGA showed similar results. At 28 days, both QXRD and NMR indicated that a significant amount of silica fume was left, which would produce a physical filling effect on the UHPC. The NMR also showed the evolution of the nanostructure of C-S-H, as the MCL of C-S-H increased over time. This structural change was not considered in the C-S-H model adopted in the PONKCS method. Therefore, the variation of crystallinity of C-S-H or the structural difference of C-S-H in regular OPC hydration and UHPC can produce an error when quantifying C-S-H using the PONKCS method;
- This study was able to quantify the two main amorphous phases (i.e., silica fume and C-S-H) in UHPC. During the heat treatment of UHPC, the consumption of silica fume was dominant, as shown by the more active pozzolanic reaction. The evolution of the quantitative content of C-S-H was well correlated with the development of strength. At a very early stage of heat treatment, QXRD underestimated the content of silica fume; the dispersed silica fume with a small contribution of XRD peak intensity was consumed first during the heat treatment.
Author Contributions
Funding
Acknowledgments
Conflicts of Interest
References
- Jeon, D.; Jun, Y.; Jeong, Y.; Oh, J.E. Microstructural and strength improvements through the use of Na2CO3 in a cementless Ca (OH) 2-activated class F fly ash system. Cem. Concr. Res. 2015, 67, 215–225. [Google Scholar] [CrossRef]
- Jeong, Y.; Hargis, C.W.; Chun, S.-C.; Moon, J. The effect of water and gypsum content on strätlingite formation in calcium sulfoaluminate-belite cement pastes. Constr. Build. Mater. 2018, 166, 712–722. [Google Scholar] [CrossRef]
- Mehta, P.K.; Monteiro, P.J. Concrete Microstructure, Properties and Materials; McGraw-Hill: New York, NY, USA, 2017; pp. 23–32. [Google Scholar]
- Schöler, A.; Lothenbach, B.; Winnefeld, F.; Zajac, M. Hydration of quaternary Portland cement blends containing blast-furnace slag, siliceous fly ash and limestone powder. Cem. Concr. Compos. 2015, 55, 374–382. [Google Scholar] [CrossRef]
- Scrivener, K.; Füllmann, T.; Gallucci, E.; Walenta, G.; Bermejo, E. Quantitative study of Portland cement hydration by X-ray diffraction/Rietveld analysis and independent methods. Cem. Concr. Res. 2004, 34, 1541–1547. [Google Scholar] [CrossRef]
- Alahrache, S.; Winnefeld, F.; Champenois, J.-B.; Hesselbarth, F.; Lothenbach, B. Chemical activation of hybrid binders based on siliceous fly ash and Portland cement. Cem. Concr. Compos. 2016, 66, 10–23. [Google Scholar] [CrossRef]
- Carmona-Quiroga, P.; Blanco-Varela, M. Ettringite decomposition in the presence of barium carbonate. Cem. Concr. Res. 2013, 52, 140–148. [Google Scholar] [CrossRef]
- Haha, M.B.; Le Saout, G.; Winnefeld, F.; Lothenbach, B. Influence of activator type on hydration kinetics, hydrate assemblage and microstructural development of alkali-activated blast-furnace slags. Cem. Concr. Res. 2011, 41, 301–310. [Google Scholar] [CrossRef]
- Rietveld, H. A profile refinement method for nuclear and magnetic structures. J. Appl. Crystallogr. 1969, 2, 65–71. [Google Scholar] [CrossRef]
- Jansen, D.; Stabler, C.; Goetz-Neunhoeffer, F.; Dittrich, S.; Neubauer, J. Does Ordinary Portland Cement Contain Amorphous Phase? A Quantitative Study Using an External Standard Method. Powder Diffr. J. 2011, 26, 31–38. [Google Scholar] [CrossRef] [Green Version]
- Naber, C.; Stegmeyer, S.; Jansen, D.; Goetz-Neunhoeffer, F.; Neubauer, J. The PONKCS method applied for time-resolved XRD quantification of supplementary cementitious material reactivity in hydrating mixtures with ordinary Portland cement. Constr. Build. Mater. 2019, 214, 449–457. [Google Scholar] [CrossRef]
- Jeong, Y.; Hargis, C.W.; Kang, H.; Chun, S.-C.; Moon, J. The effect of elevated curing temperatures on high ye’elimite calcium sulfoaluminate cement mortars. Materials 2019, 12, 1072. [Google Scholar] [CrossRef] [PubMed] [Green Version]
- Lee, N.; Jeong, Y.; Kang, H.; Moon, J. Heat-induced acceleration of pozzolanic reaction under restrained conditions and consequent structural modification. Materials 2020, 13, 2950. [Google Scholar] [CrossRef] [PubMed]
- Bruce, P.G.; Le Bail, A.; Madsen, I.; Cranswick, L.M.; Cockcroft, J.K.; Norby, P.; Zuev, A.; Fitch, A.; Rodriguez-Carvajal, J.; Giacovazzo, C. Powder Diffraction: Theory and Practice. R. Soc. Chem. 2015, 541–548. [Google Scholar]
- Madsen, I.; Scarlett, N.; Kleeberg, R.; Knorr, K. Quantification of Phases with Partial or No Known Crystal Structures. Int. Tables Crystallogr. 2019, 356–360. [Google Scholar]
- Kang, H.; Kang, S.-H.; Jeong, Y.; Moon, J. Quantitative analysis of hydration reaction of GGBFS using X-ray diffraction method. J. Korea Concr. Inst. 2020, 32, 241–250. [Google Scholar] [CrossRef]
- Zhou, M.; Lu, W.; Song, J.; Lee, G.C. Application of ultra-high performance concrete in bridge engineering. Constr. Build. Mater. 2018, 186, 1256–1267. [Google Scholar] [CrossRef]
- Klemens, T. Flexible concrete offers new solutions. Concr. Constr. 2004, 49, 72. [Google Scholar]
- Tu’ma, N.H.; Aziz, M.R. Flexural performance of composite ultra-high performance concrete-encased steel hollow beams. Civ. Eng. J. 2019, 5, 1289–1304. [Google Scholar] [CrossRef]
- Yang, R.; Yu, R.; Shui, Z.; Gao, X.; Xiao, X.; Fan, D.; Chen, Z.; Cai, J.; Li, X.; He, Y. Feasibility analysis of treating recycled rock dust as an environmentally friendly alternative material in ultra-high performance concrete (UHPC). J. Clean. Prod. 2020, 258, 120673. [Google Scholar] [CrossRef]
- Ghasemi, S.; Zohrevand, P.; Mirmiran, A.; Xiao, Y.; Mackie, K. A super lightweight UHPC–HSS deck panel for movable bridges. Eng. Struct. 2016, 113, 186–193. [Google Scholar] [CrossRef]
- Luo, J.; Shao, X.; Fan, W.; Cao, J.; Deng, S. Flexural cracking behavior and crack width predictions of composite (steel+ UHPC) lightweight deck system. Eng. Struct. 2019, 194, 120–137. [Google Scholar] [CrossRef]
- Snellings, R.; Salze, A.; Scrivener, K. Use of X-ray diffraction to quantify amorphous supplementary cementitious materials in anhydrous and hydrated blended cements. Cem. Concr. Res. 2014, 64, 89–98. [Google Scholar] [CrossRef]
- Huang, W.; Kazemi-Kamyab, H.; Sun, W.; Scrivener, K. Effect of cement substitution by limestone on the hydration and microstructural development of ultra-high performance concrete (UHPC). Cem. Concr. Compos. 2017, 77, 86–101. [Google Scholar] [CrossRef]
- Lee, N.K.; Koh, K.; Kim, M.O.; Ryu, G. Uncovering the role of micro silica in hydration of ultra-high performance concrete (UHPC). Cem. Concr. Res. 2018, 104, 68–79. [Google Scholar] [CrossRef]
- ISO, I. Cement-Test Methods-Determination of Strength; ISO: Geneva, Switzerland, 2009. [Google Scholar]
- Kang, S.-H.; Hong, S.-G.; Moon, J. Performance comparison between densified and undensified silica fume in ultra-High performance fiber-reinforced concrete. Materials 2020, 13, 3901. [Google Scholar] [CrossRef] [PubMed]
- Kang, S.-H.; Jeong, Y.; Tan, K.H.; Moon, J. High-volume use of limestone in ultra-high performance fiber-reinforced concrete for reducing cement content and autogenous shrinkage. Constr. Build. Mater. 2019, 213, 292–305. [Google Scholar] [CrossRef]
- Kang, S.-H.; Hong, S.-G.; Moon, J. The use of rice husk ash as reactive filler in ultra-high performance concrete. Cem. Concr. Res. 2019, 115, 389–400. [Google Scholar] [CrossRef]
- Mills, K. The Estimation of Slag Properties. Short Course Presented as Part of Southern African Pyrometallurgy. 2011, pp. 35–36. Available online: https://www.pyro.co.za/KenMills/KenMills.pdf (accessed on 19 October 2020).
- Kang, S.-H.; Lee, J.-H.; Hong, S.-G.; Moon, J. Microstructural investigation of heat-treated ultra-high performance concrete for optimum production. Materials 2017, 10, 1106. [Google Scholar] [CrossRef] [Green Version]
- Lee, N.; Koh, K.; Park, S.; Ryu, G. Microstructural investigation of calcium aluminate cement-based ultra-high performance concrete (UHPC) exposed to high temperatures. Cem. Concr. Res. 2017, 102, 109–118. [Google Scholar] [CrossRef]
- Jeong, Y.; Park, H.; Jun, Y.; Jeong, J.-H.; Oh, J.E. Microstructural verification of the strength performance of ternary blended cement systems with high volumes of fly ash and GGBFS. Constr. Build. Mater. 2015, 95, 96–107. [Google Scholar] [CrossRef]
- Abdulkareem, O.M.; Fraj, A.B.; Bouasker, M.; Khelidj, A. Effect of chemical and thermal activation on the microstructural and mechanical properties of more sustainable UHPC. Constr. Build. Mater. 2018, 169, 567–577. [Google Scholar] [CrossRef] [Green Version]
- Ferg, E.; Simpson, B. Using PXRD and PONKCS to determine the kinetics of crystallisation of highly concentrated NH 4 NO 3 emulsions. J. Chem. Crystallogr. 2013, 43, 197–206. [Google Scholar] [CrossRef]
- Li, X.; Snellings, R.; Scrivener, K.L. Quantification of amorphous siliceous fly ash in hydrated blended cement pastes by X-ray powder diffraction. J. Appl. Crystallogr. 2019, 52, 1358–1370. [Google Scholar] [CrossRef]
- Zhou, Q.; Glasser, F.P. Thermal stability and decomposition mechanisms of ettringite at < 120 C. Cem. Concr. Res. 2001, 31, 1333–1339. [Google Scholar]
- Metz, K.; Lam, M.; Webb, A. Reference deconvolution: A simple and effective method for resolution enhancement in nuclear magnetic resonance spectroscopy. Concepts Magn. Reson. 2000, 12, 21–42. [Google Scholar] [CrossRef]
- Pena, P.; Mercury, J.R.; De Aza, A.; Turrillas, X.; Sobrados, I.; Sanz, J. Solid-state 27Al and 29Si NMR characterization of hydrates formed in calcium aluminate–silica fume mixtures. J. Solid State Chem. 2008, 181, 1744–1752. [Google Scholar] [CrossRef]
- Andersen, M.D.; Jakobsen, H.J.; Skibsted, J. Characterization of white Portland cement hydration and the CSH structure in the presence of sodium aluminate by 27Al and 29Si MAS NMR spectroscopy. Cem. Concr. Res. 2004, 34, 857–868. [Google Scholar] [CrossRef]
- Odelson, J.B.; Kerr, E.A.; Vichit-Vadakan, W. Young’s modulus of cement paste at elevated temperatures. Cem. Concr. Res. 2007, 37, 258–263. [Google Scholar] [CrossRef]
- Taylor, H.F. Cement Chemistry; Thomas Telford London: London, UK, 1997; Volume 2. [Google Scholar]
Publisher’s Note: MDPI stays neutral with regard to jurisdictional claims in published maps and institutional affiliations. |


| Mixture | OPC | Silica Fume | Quartz Powder | Silica Sand | Water | Superplasticizer |
|---|---|---|---|---|---|---|
| UHPC | 1000 | 250 | 350 | 1100 | 225 | 40 |
| Specimen | Q0 −71 ppm | Q0 −74 ppm | Q1 −79 ppm | Q2(1Al) −81 ppm | Q2 −85 ppm | Q4 −110 ppm | Al/Si | MCL |
|---|---|---|---|---|---|---|---|---|
| UHPC_1day | 40.00 | 31.70 | 0.90 | 0 | 0 | 27.40 | 0 | 2.00 |
| UHPC_2days | 26.93 | 16.97 | 5.66 | 6.18 | 29.95 | 14.31 | 0.074 | 15.86 |
| UHPC_4days | 24.38 | 19.56 | 5.47 | 9.04 | 28.87 | 12.68 | 0.10 | 17.51 |
| UHPC_28days | 24.19 | 17.25 | 3.33 | 11.90 | 30.47 | 12.88 | 0.13 | 31.02 |
© 2020 by the authors. Licensee MDPI, Basel, Switzerland. This article is an open access article distributed under the terms and conditions of the Creative Commons Attribution (CC BY) license (http://creativecommons.org/licenses/by/4.0/).
Share and Cite
Kang, H.; Lee, N.; Moon, J. Elucidation of the Hydration Reaction of UHPC Using the PONKCS Method. Materials 2020, 13, 4661. https://doi.org/10.3390/ma13204661
Kang H, Lee N, Moon J. Elucidation of the Hydration Reaction of UHPC Using the PONKCS Method. Materials. 2020; 13(20):4661. https://doi.org/10.3390/ma13204661
Chicago/Turabian StyleKang, Hyunuk, Nankyoung Lee, and Juhyuk Moon. 2020. "Elucidation of the Hydration Reaction of UHPC Using the PONKCS Method" Materials 13, no. 20: 4661. https://doi.org/10.3390/ma13204661