Chloride-Induced Corrosion of Steel in Alkali-Activated Mortars Based on Different Precursors


Abstract
:1. Introduction
2. Materials and Methods
2.1. Raw Materials
2.2. Mix Designs
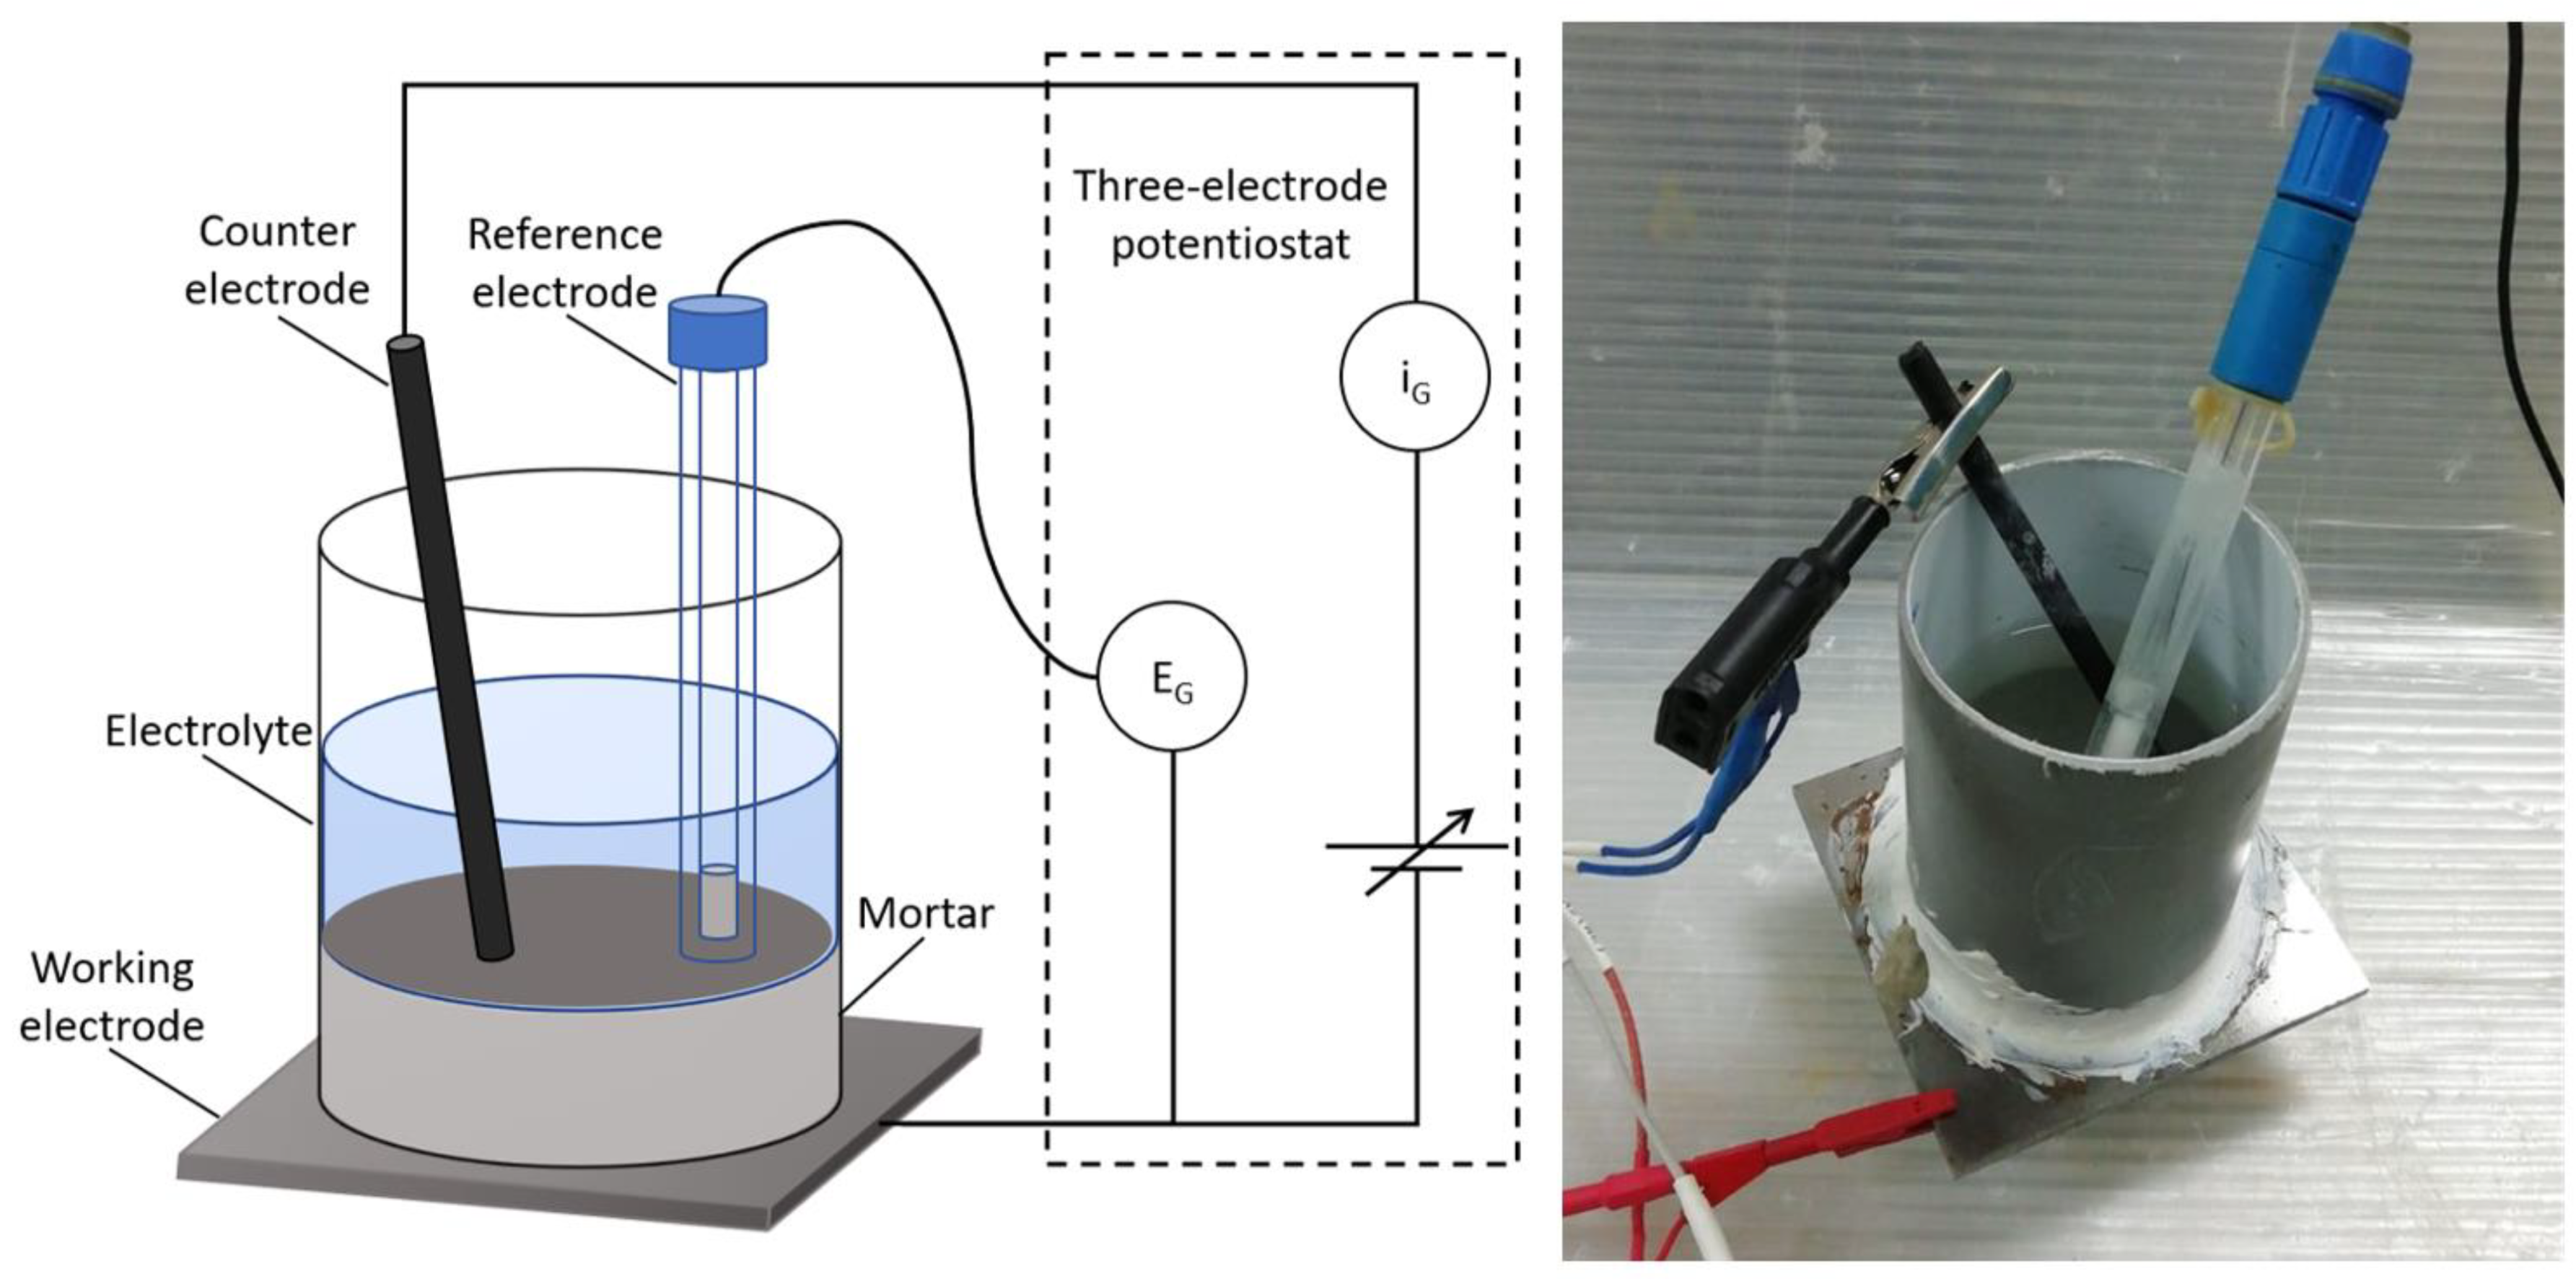
2.3. Methods
3. Results
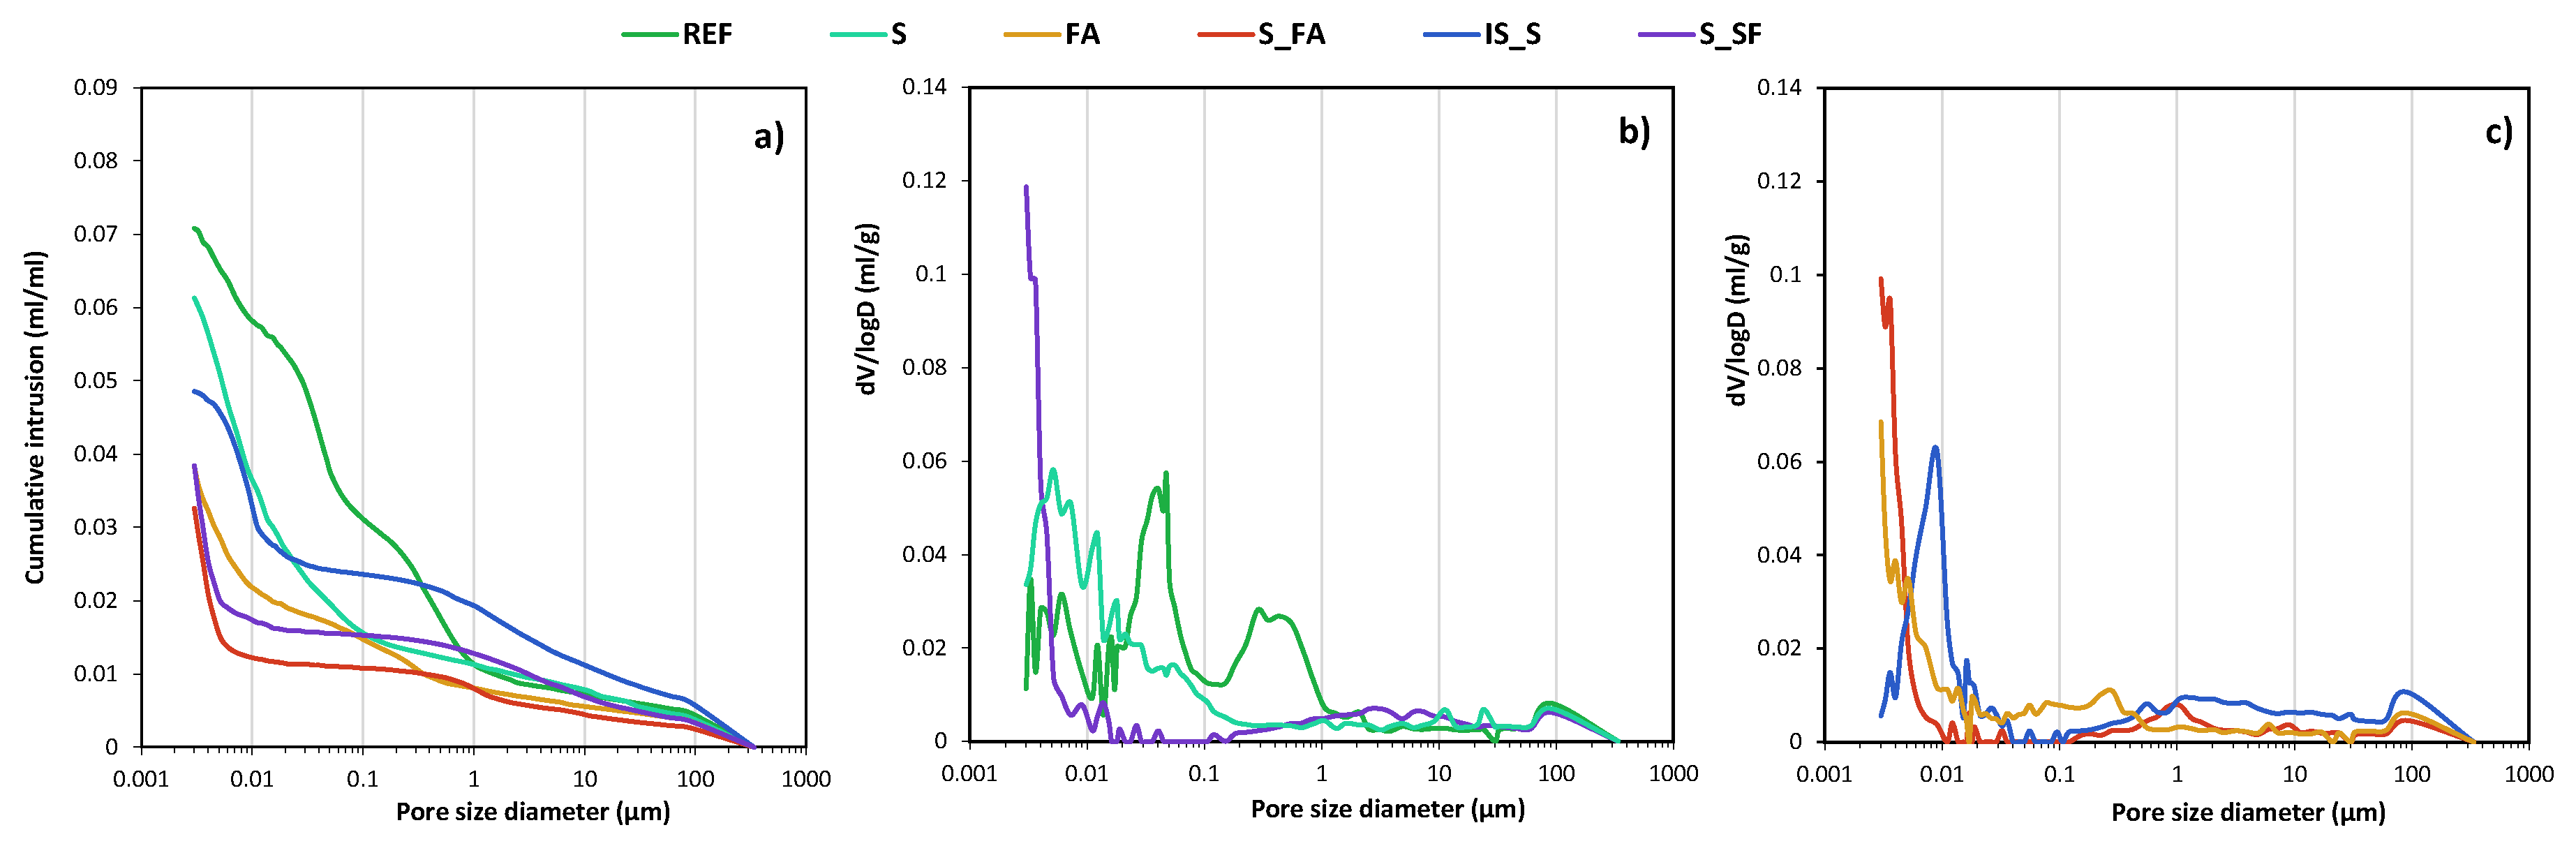
3.1. Mortar Characterisation
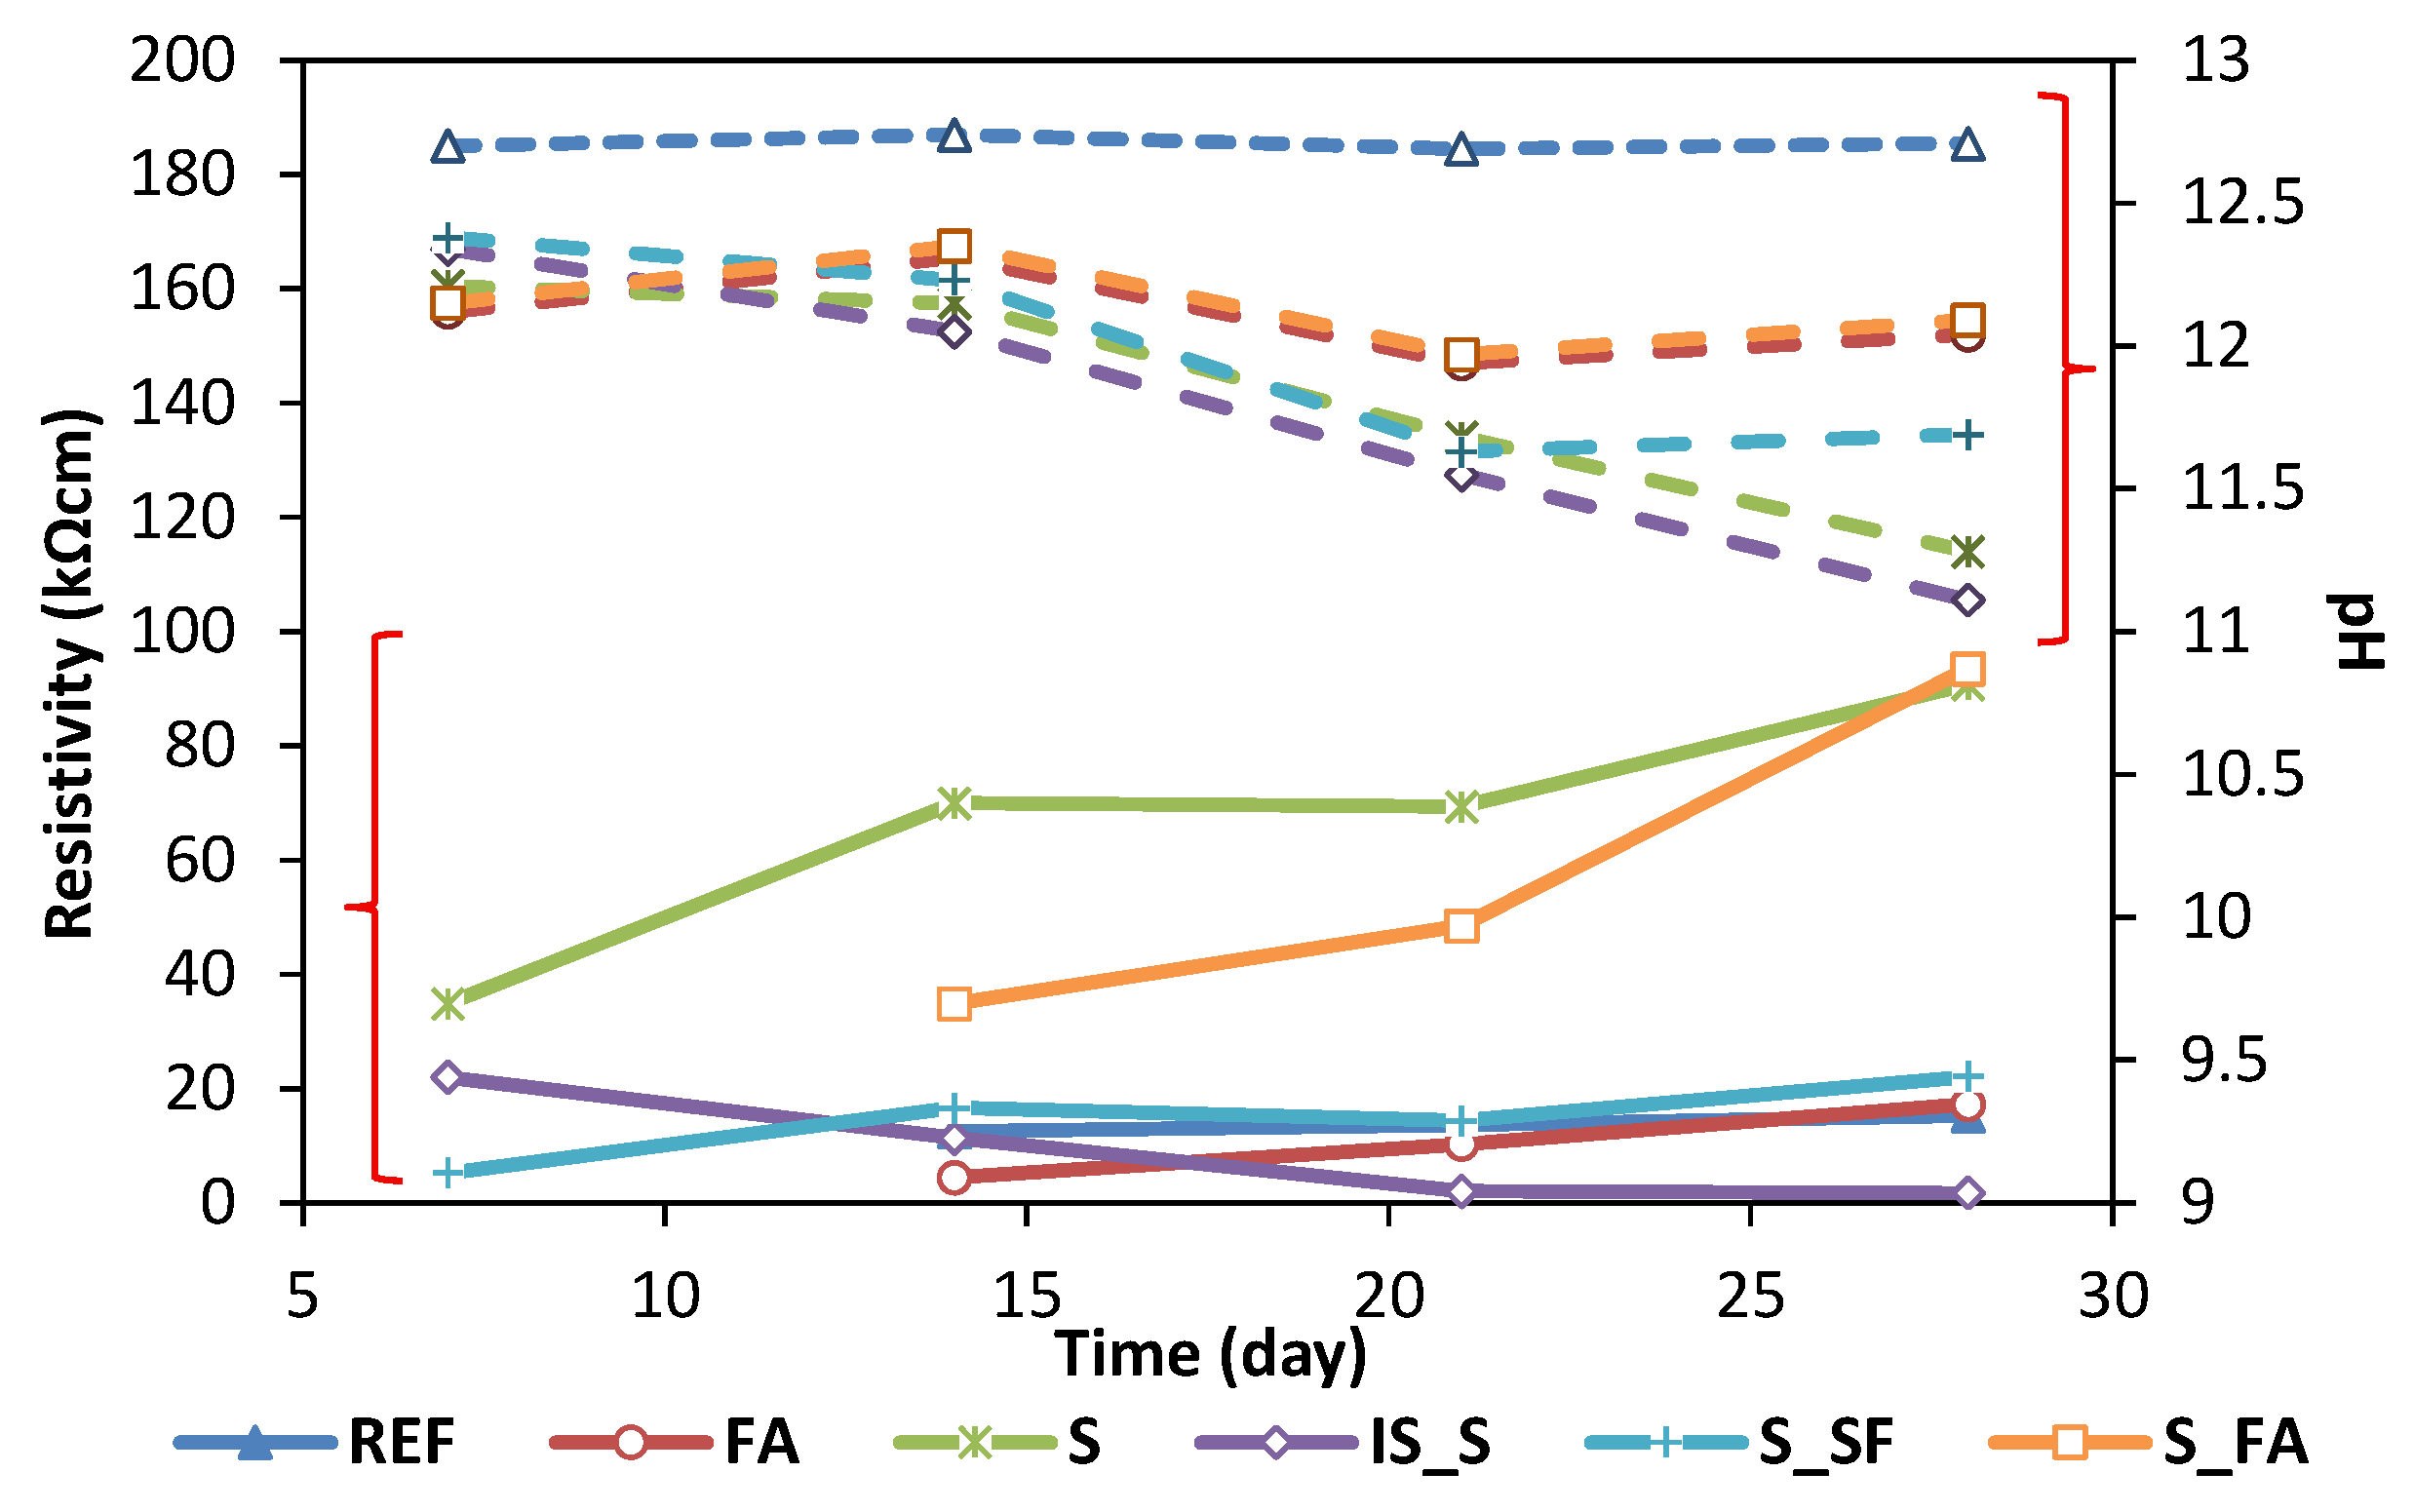
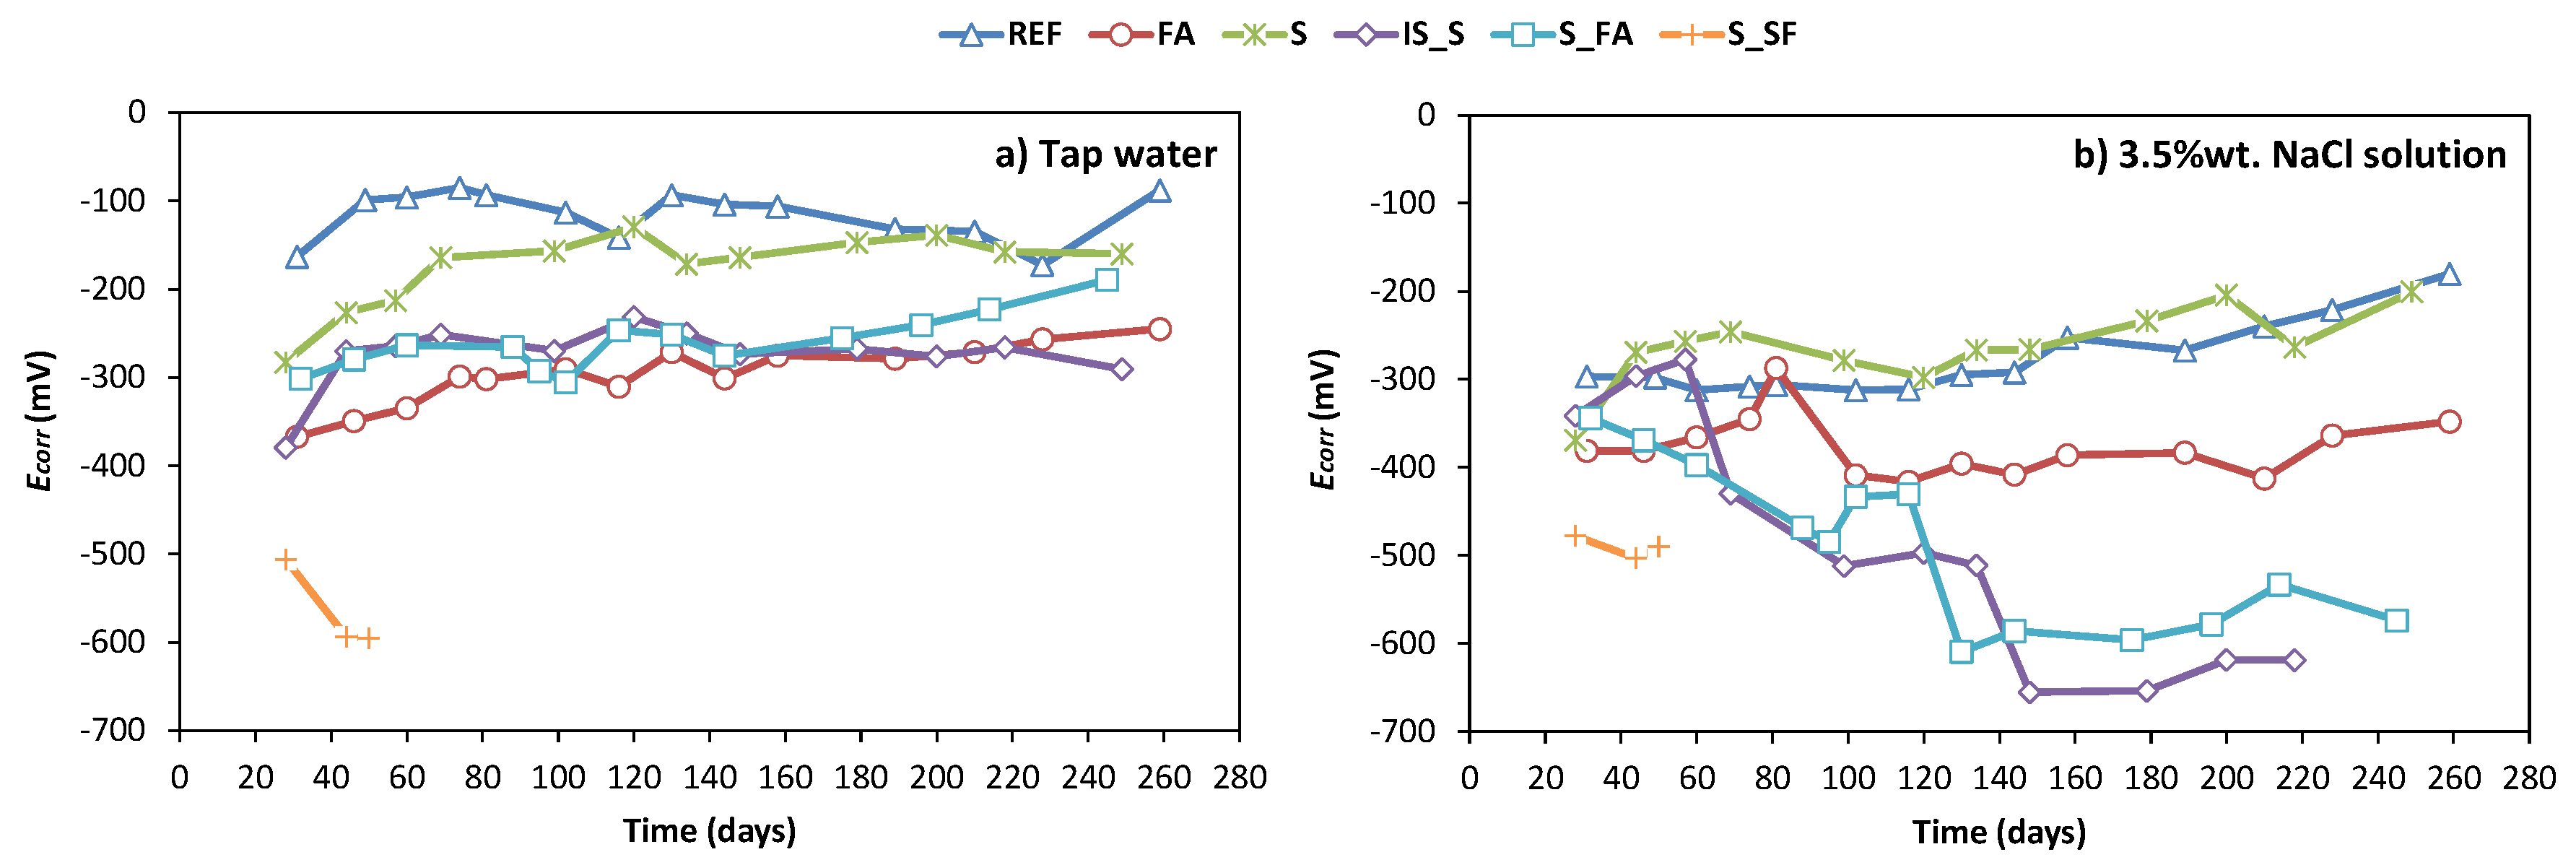
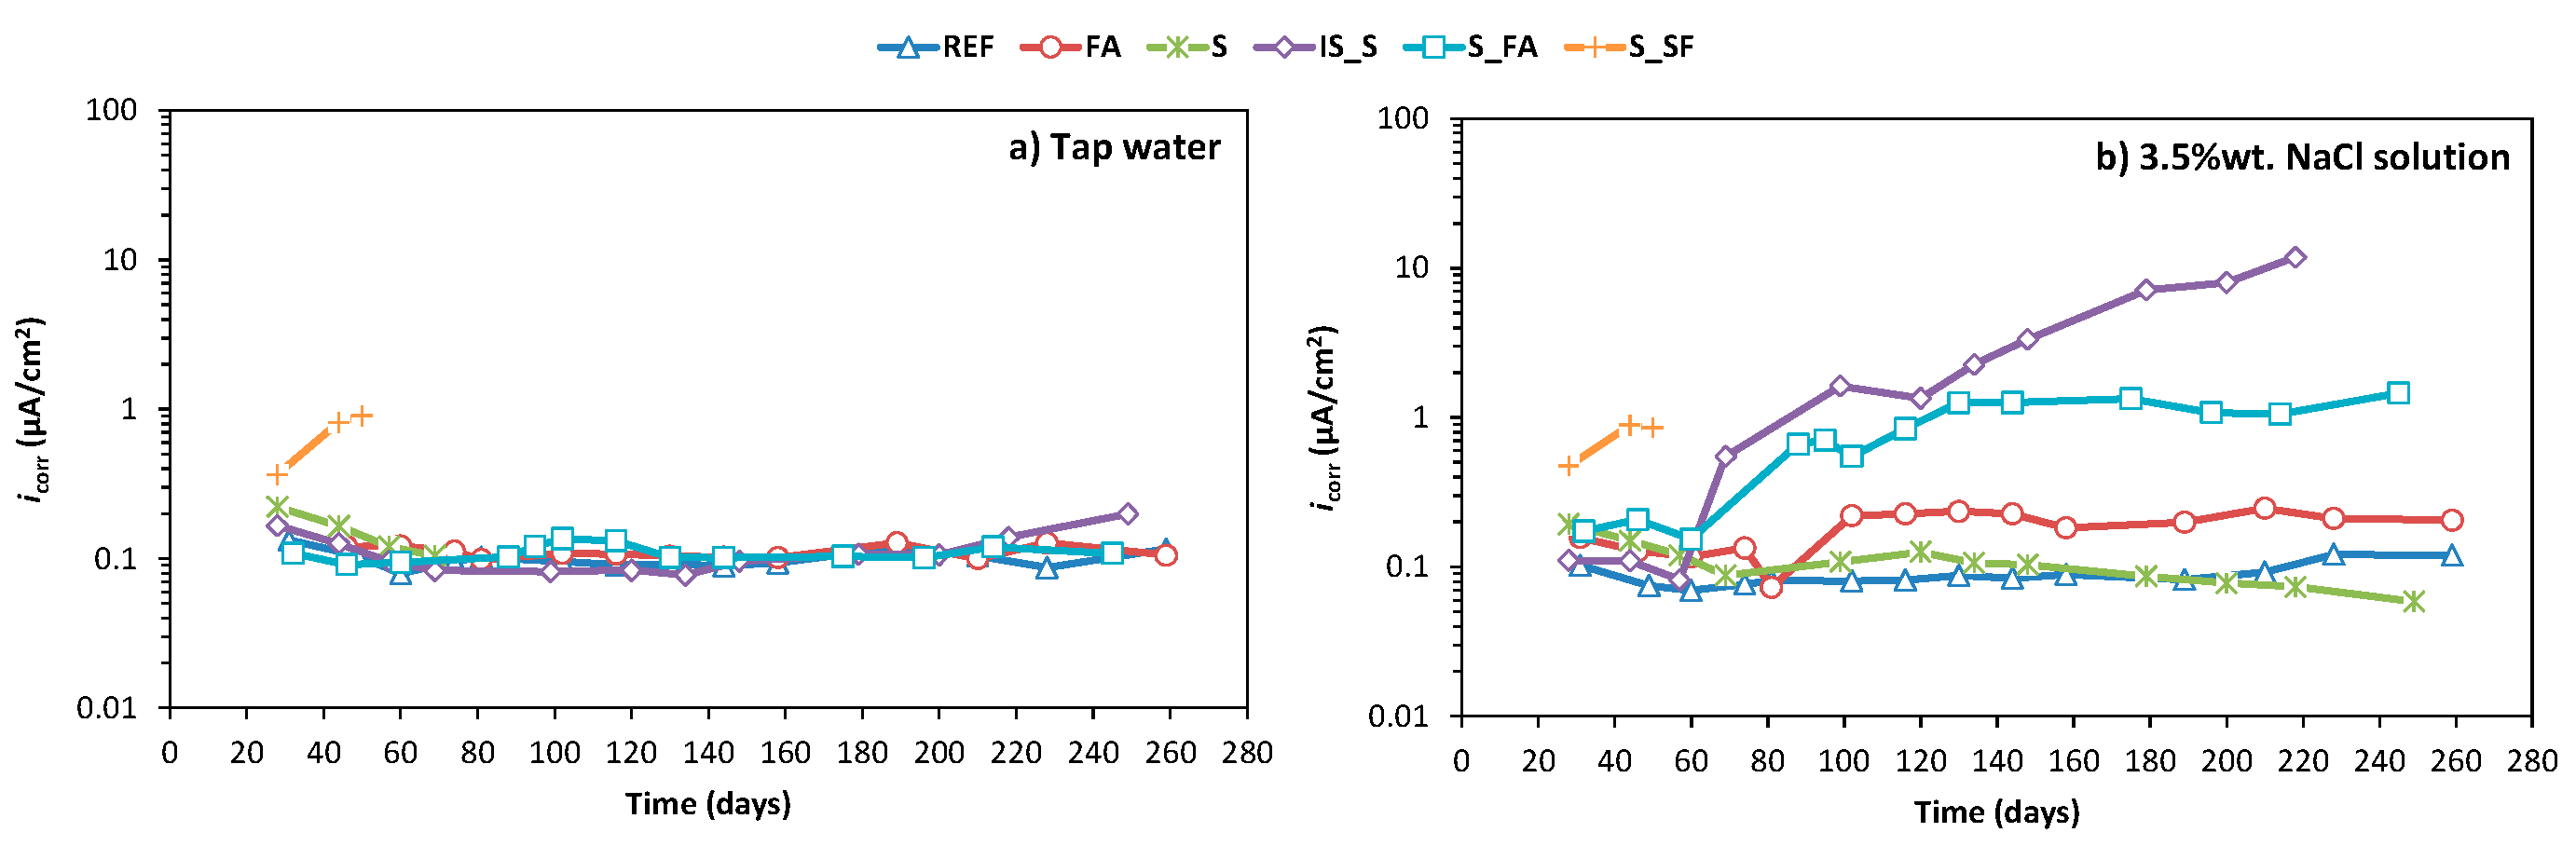
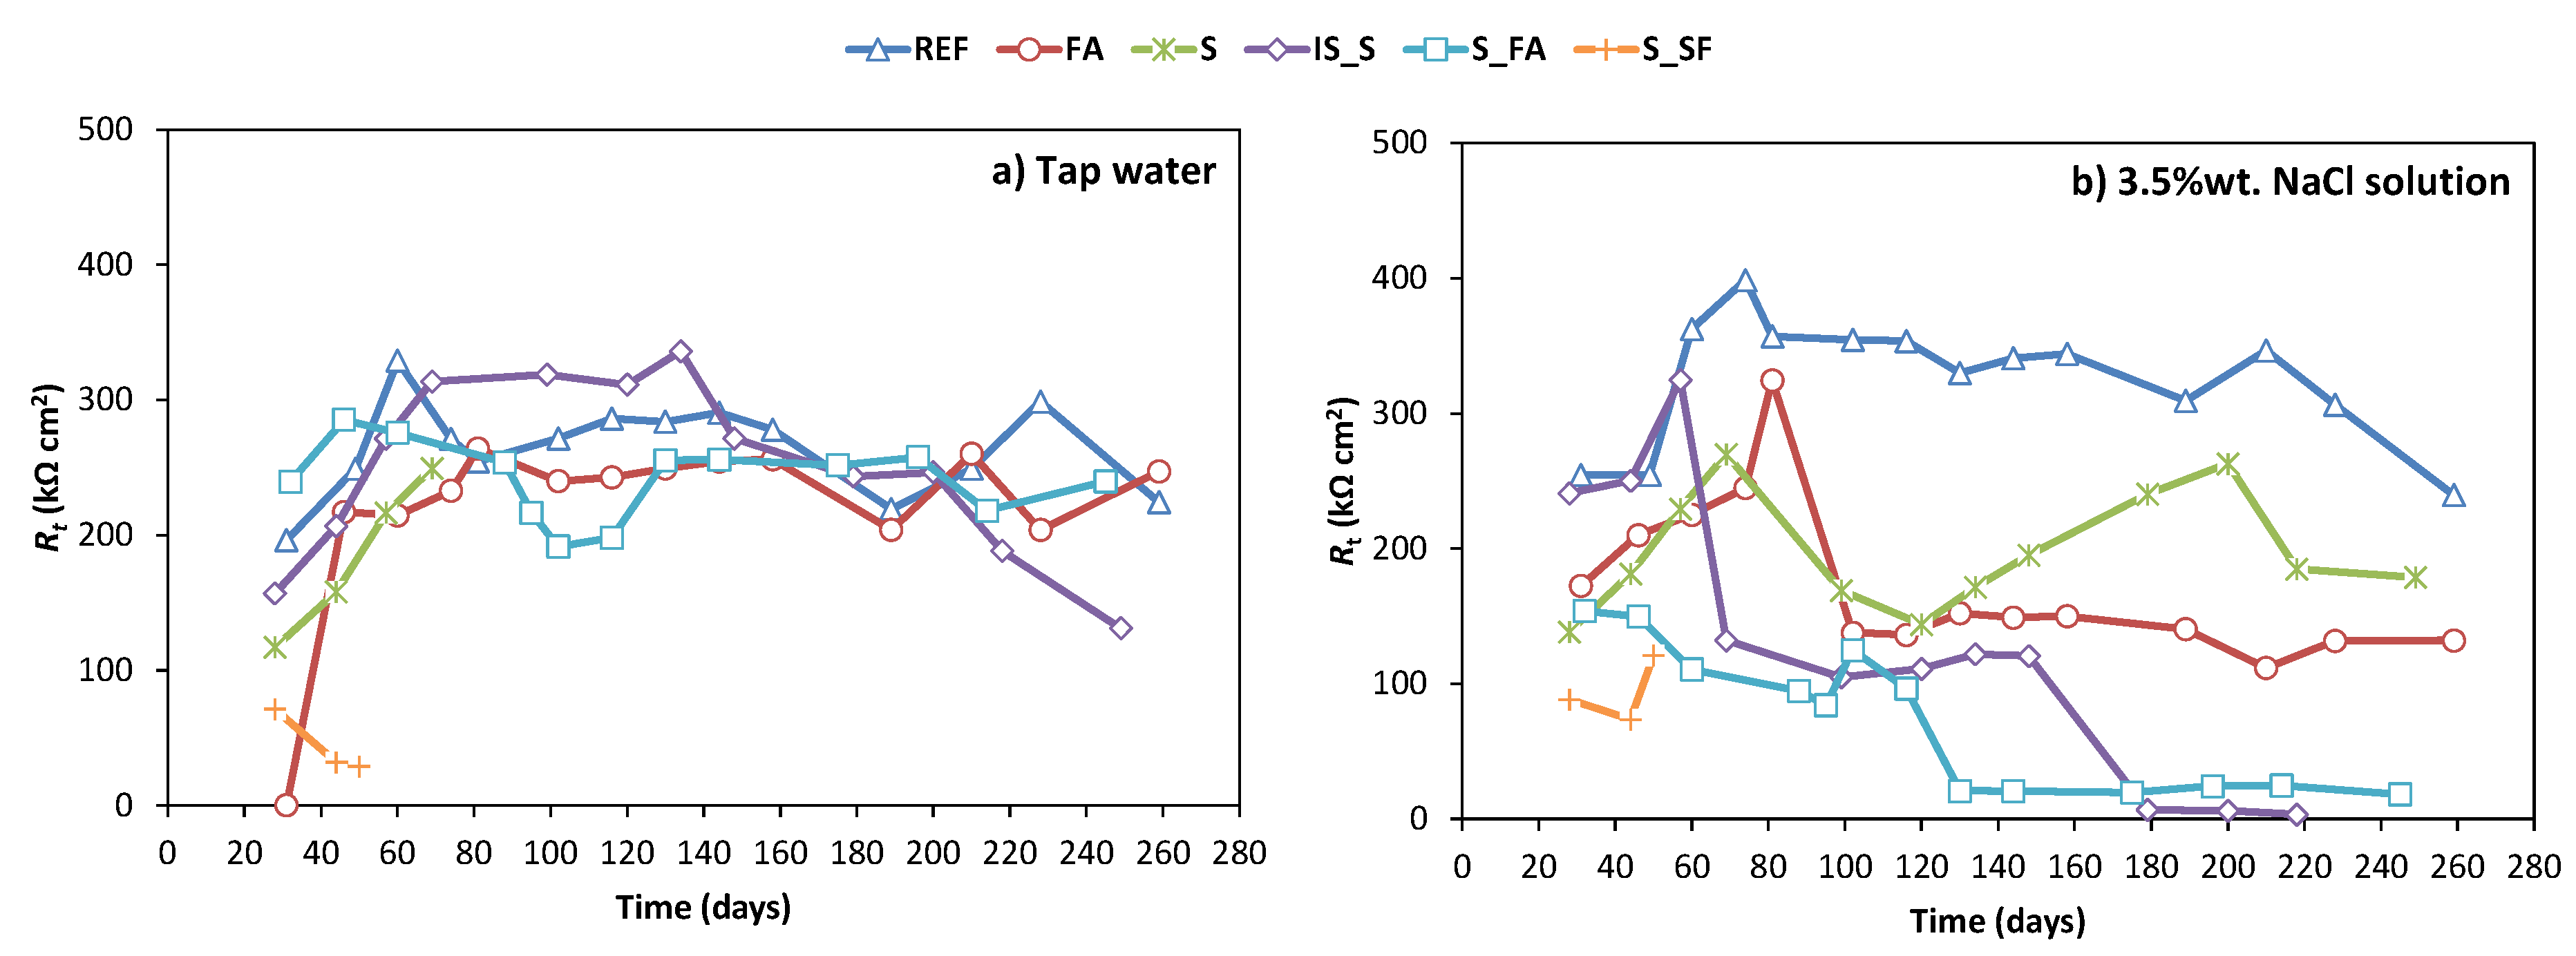
3.2. Corrosion Monitoring
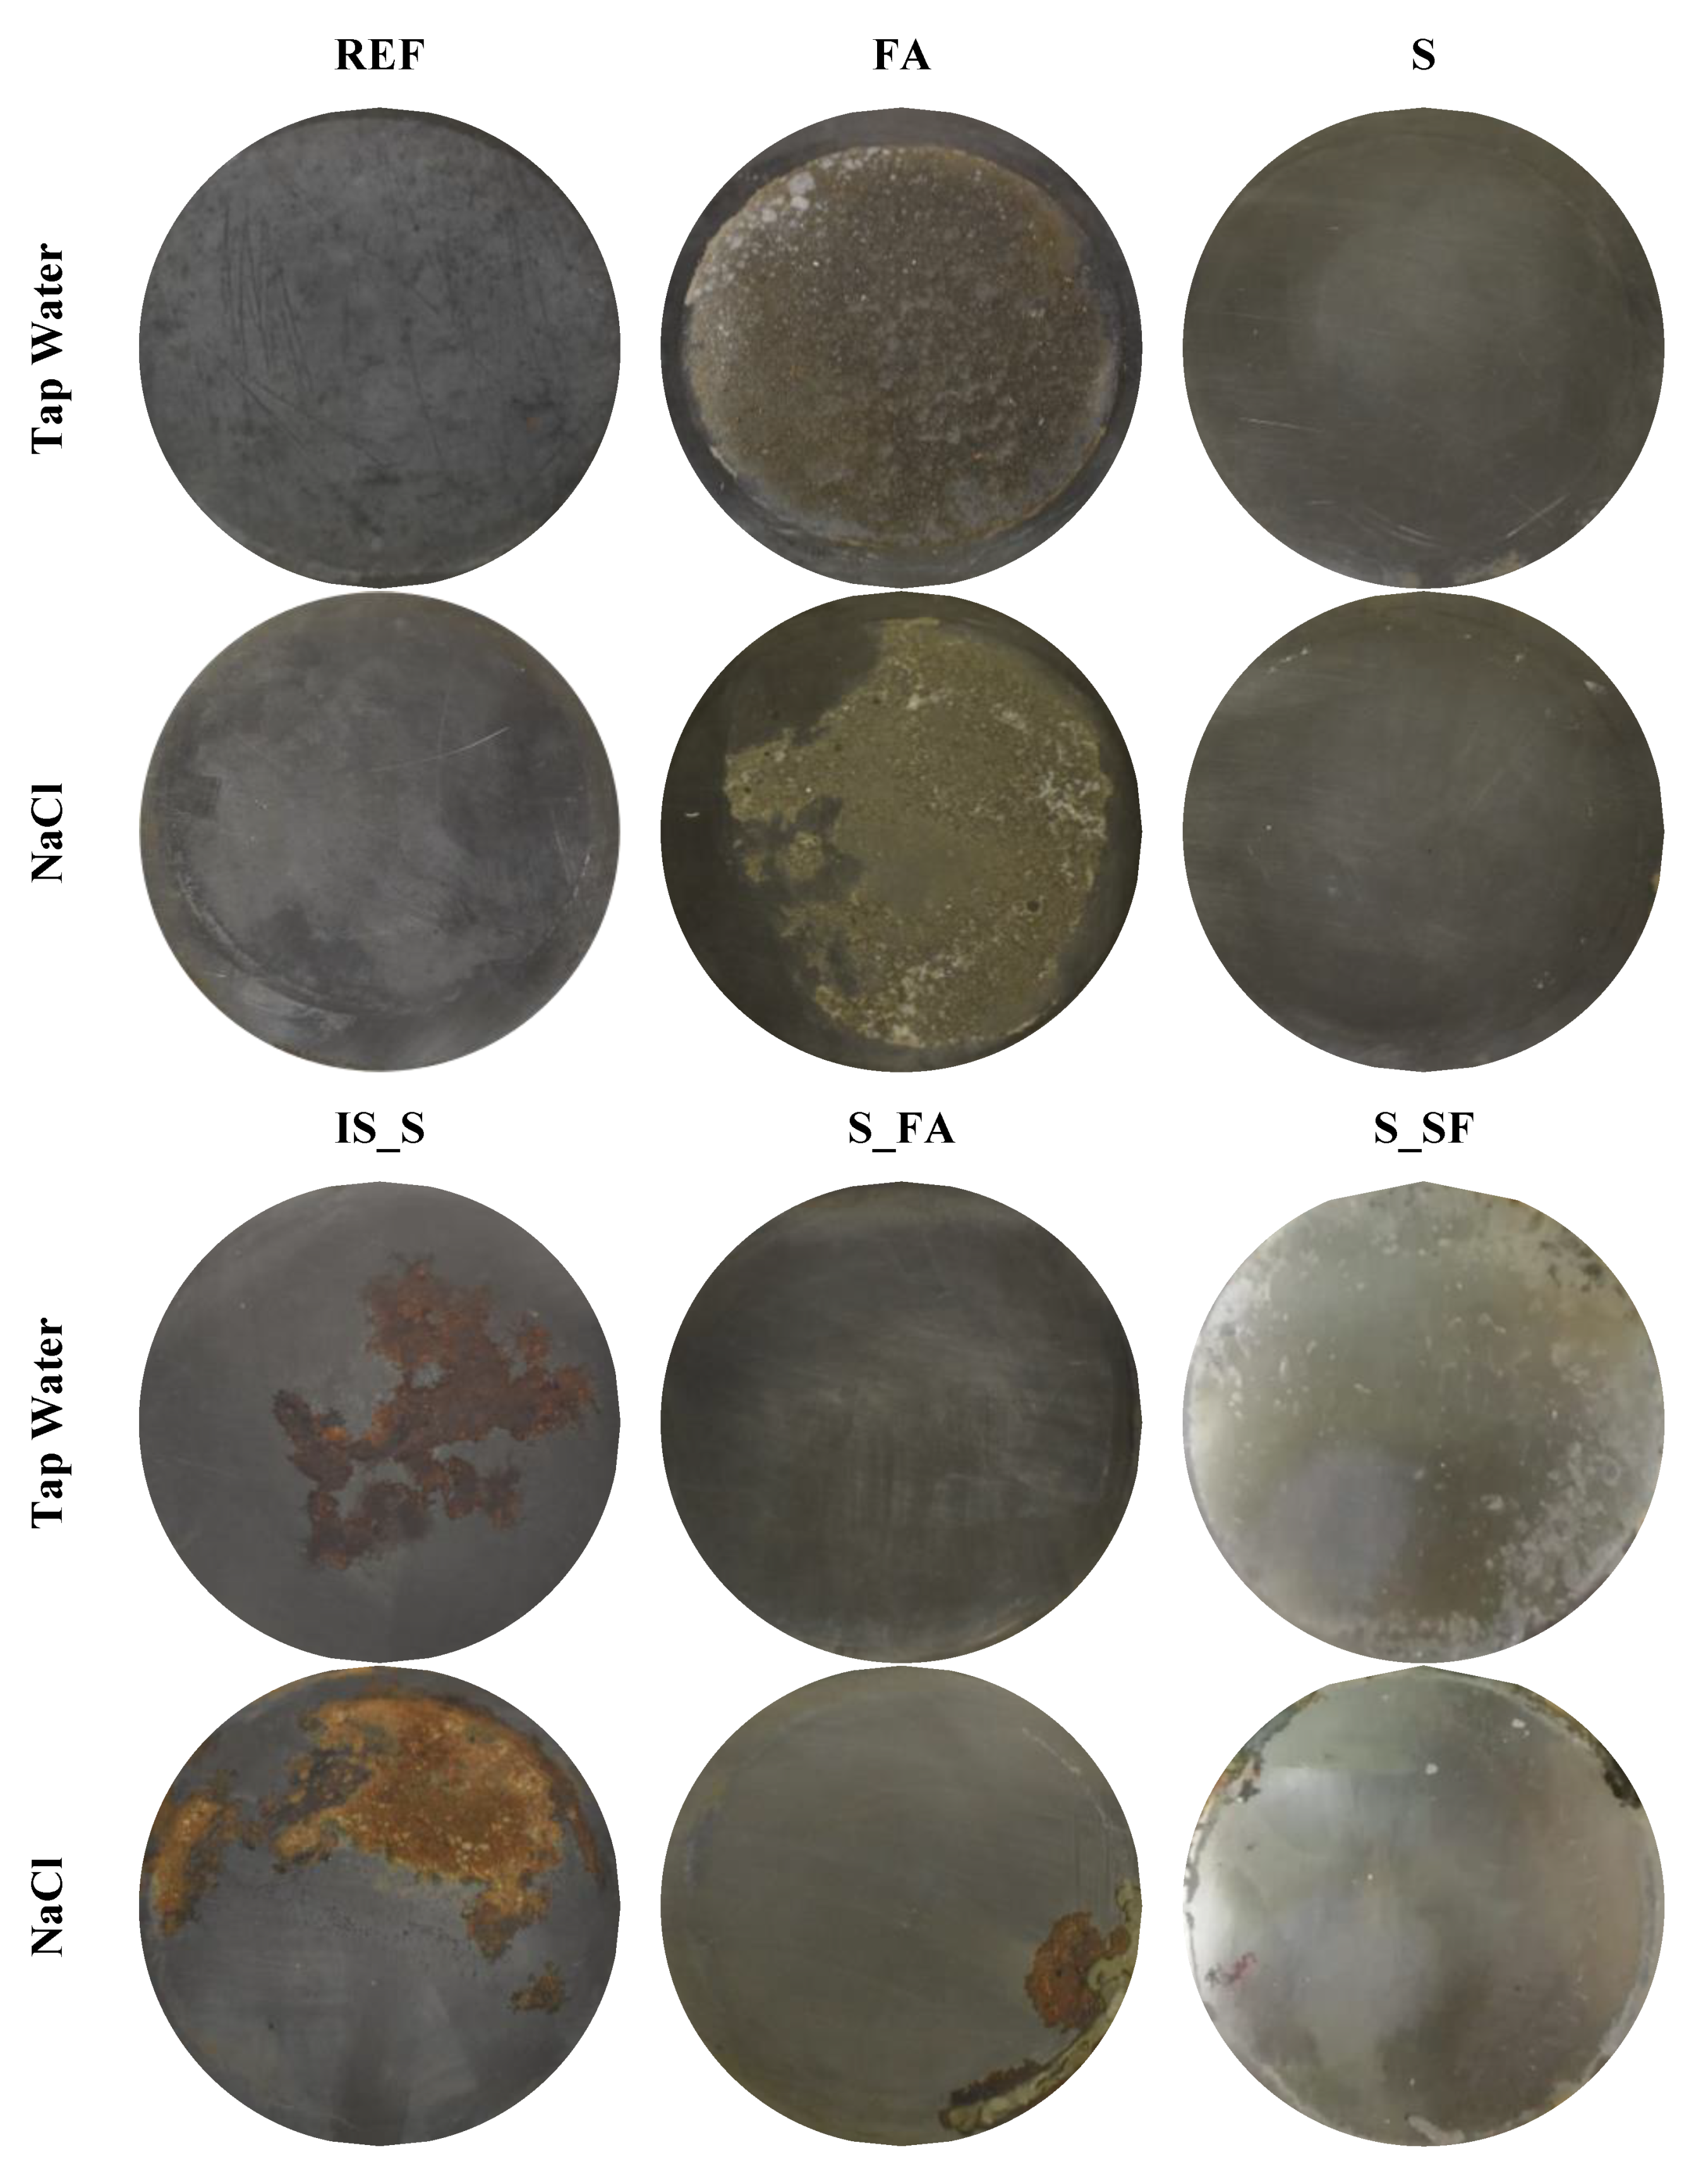
3.3. Steel Surface Analyses
4. Discussion
5. Conclusions
- −
- The high compressive strength of an alkali-activated mortar cannot be the assurance of its ability to protect steel from corrosion in aggressive environments, which underlines the importance of conducting corrosion studies to evaluate the validity of a system.
- −
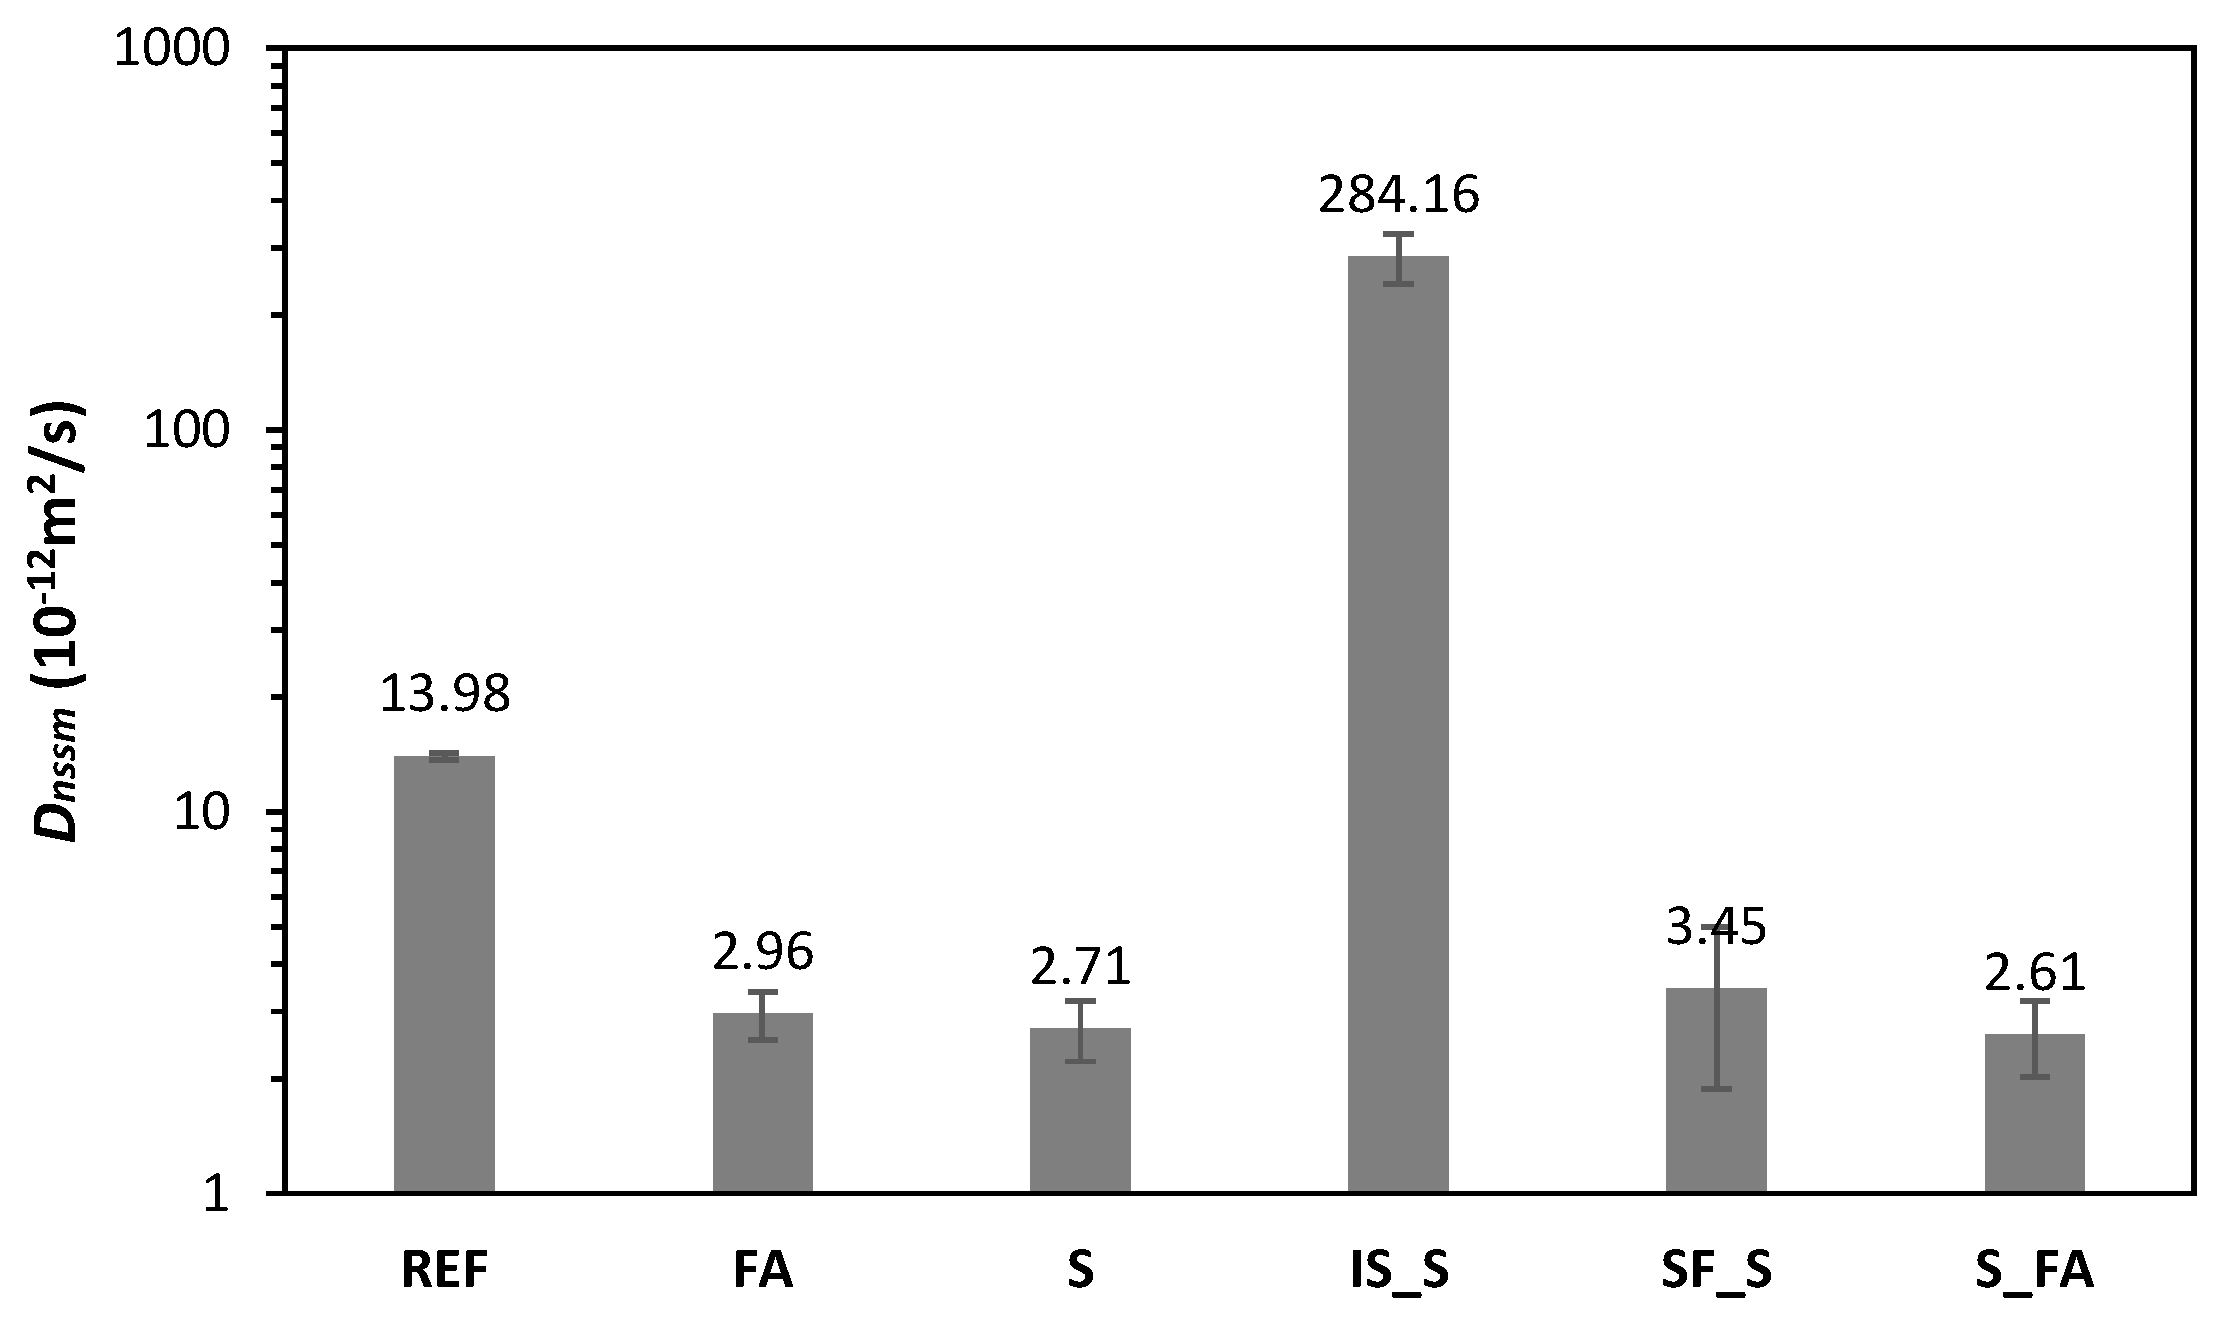
- In general, alkali-activated mortars showed a lower chloride diffusion coefficient compared to OPC due to the higher mortar electrical resistivity and lower capillary porosity.
- −
- The high degree of gel porosity indicates the increased degree of reaction of the mortar matrix, which leads to C-A-S-H and N-A-S-H gel precipitation, which could possibly be a reason for the lower chloride diffusion and higher chloride binding capacity.
- −
- For certain mixes developed in this study, further optimisation of the mix design is required, focusing on the alkali activator and blast furnace slag content and assuring the volume stability of the matrix.
- −
- The high electrochemical stability of most developed systems under tap water during the test period demonstrates the ability of AAMs to provide a stable passive environment for steel in a non-aggressive environment.
- −
- The equal corrosion performance and better chloride penetration resistance of alkali-activated fly ash and alkali-activated slag mixture, compared to OPC, shows the applicability of these systems for concrete structures exposed to aggressive chloride-rich environments.
Author Contributions
Funding
Acknowledgments
Conflicts of Interest
References
- Provis, J.L. Green concrete or red herring?—Future of alkali-activated materials. Adv. Appl. Ceram. 2014, 113, 472–477. [Google Scholar] [CrossRef]
- World Business Council for Sustainable Development, International Energy Agency. Cement Technology Roadmap 2009: Carbon Emissions Reductions up to 2050; WBCSD: Geneva, Paris, 2009; Available online: https://www.wbcsd.org/Sector-Projects/Cement-Sustainability-Initiative/News/Cement-technology-roadmap-shows-how-the-path-to-achieve-CO2-reductions-up-to-24-by-2050# (accessed on 13 August 2020).
- McLellan, B.C.; Williams, R.P.; Lay, J.; Van Riessen, A.; Corder, G.D. Costs and carbon emissions for geopolymer pastes in comparison to ordinary portland cement. J. Clean. Prod. 2011, 19, 1080–1090. [Google Scholar] [CrossRef] [Green Version]
- Habert, G.; De Lacaillerie, J.D.; Roussel, N. An environmental evaluation of geopolymer based concrete production: Reviewing current research trends. J. Clean. Prod. 2011, 19, 1229–1238. [Google Scholar] [CrossRef]
- Bernal, S.A.; Provis, J.L.; Fernández-Jiménez, A.; Krivenko, P.V.; Kavalerova, E.; Palacios, M.; Shi, C. Binder Chemistry—High-Calcium Alkali-Activated Materials. In Alkali Activated Materials, RILEM State-of-the-Art Reports; Provis, J., van Deventer, J., Eds.; Springer: Dordrecht, Germany, 2014; Volume 13. [Google Scholar] [CrossRef]
- Mechanical properties of class C and F fly ash geopolymer mortars. J. Croat. Assoc. Civ. Eng. 2020, 72, 297–309. [CrossRef]
- Kupwade-Patil, K.; Soto, F.; Kunjumon, A.; Allouche, E.N.; Mainardi, D.S. Multi-scale modeling and experimental investigations of geopolymeric gels at elevated temperatures. Comput. Struct. 2013, 122, 164–177. [Google Scholar] [CrossRef]
- Fernández-Jiménez, A.; García-Lodeiro, I.; Palomo, Á. Durability of alkali-activated fly ash cementitious materials. J. Mater. Sci. 2007, 42, 3055–3065. [Google Scholar] [CrossRef]
- Cristelo, N.; Segadães, L.; Coelho, J.; Chaves, B.; Sousa, N.R.; Lopes, M. Recycling municipal solid waste incineration slag and fly ash as precursors in low-range alkaline cements. Waste Manag. 2020, 104, 60–73. [Google Scholar] [CrossRef]
- Angst, U.M. Challenges and opportunities in corrosion of steel in concrete. Mater. Struct. 2018, 51, 4. [Google Scholar] [CrossRef] [Green Version]
- Babaee, M.; Castel, A. Chloride diffusivity, chloride threshold, and corrosion initiation in reinforced alkali-activated mortars: Role of calcium, alkali, and silicate content. Cem. Concr. Res. 2018, 111, 56–71. [Google Scholar] [CrossRef]
- Ma, Q.; Nanukuttan, S.; Basheer, P.A.M.; Bai, Y.; Yang, C. Chloride transport and the resulting corrosion of steel bars in alkali activated slag concretes. Mater. Struct. 2015, 49, 3663–3677. [Google Scholar] [CrossRef] [Green Version]
- Criado, M.; Bernal, S.A.; Garcia-Triñanes, P.; Provis, J.L. Influence of slag composition on the stability of steel in alkali-activated cementitious materials. J. Mater. Sci. 2018, 53, 5016–5035. [Google Scholar] [CrossRef] [Green Version]
- Criado, M.; Provis, J.L. Alkali Activated Slag Mortars Provide High Resistance to Chloride-Induced Corrosion of Steel. Front. Mater. 2018, 5. [Google Scholar] [CrossRef]
- Provis, J.L.; Arbi, K.; Bernal, S.A.; Bondar, D.; Buchwald, A.; Castel, A.; Chithiraputhiran, S.; Cyr, M.; Dehghan, A.; Dombrowski-Daube, K.; et al. RILEM TC 247-DTA round robin test: Mix design and reproducibility of compressive strength of alkali-activated concretes. Mater. Struct. 2019, 52, 99. [Google Scholar] [CrossRef]
- Provis, J.; Muñoz, G.A.; Hussein, O.; Koma, G.; Manolova, E.; Petrov, V. Production of alkali-activated binders from iron silicates fines. In Proceedings of the International Conference on Sustainable Materials, Systems and Structures (SMSS 2019) New Generation of Construction Materials, Rovinj, Croatia, 20–22 March 2019; pp. 353–360. [Google Scholar]
- Rostami, M.; Behfarnia, K. The effect of silica fume on durability of alkali activated slag concrete. Constr. Build. Mater. 2017, 134, 262–268. [Google Scholar] [CrossRef]
- NT Build 492. Concrete, Mortar and Cement-Based Repair Materials: Chloride Migration Coefficient from Non-Steady-State Migration Experiments; NT Build 492: Nordtest, Espoo, Finland, 1999. [Google Scholar]
- Noushini, A.; Castel, A.; Aldred, J.; Rawal, A. Chloride diffusion resistance and chloride binding capacity of fly ash-based geopolymer concrete. Cem. Concr. Compos. 2020, 105, 103290. [Google Scholar] [CrossRef]
- Ismail, I.; Bernal, S.A.; Provis, J.L.; Nicolas, R.S.; Brice, D.G.; Kilcullen, A.R.; Hamdan, S.; Van Deventer, J.S. Influence of fly ash on the water and chloride permeability of alkali-activated slag mortars and concretes. Constr. Build. Mater. 2013, 48, 1187–1201. [Google Scholar] [CrossRef]
- Scrivener, K.; Snellings, R.; Lothenbach, B. A Practical Guide to Microstructural Analysis of Cementitious Materials; Taylor and Francis: New York, NY, USA, 2015. [Google Scholar] [CrossRef]
- Räsänen, V.; Penttala, V. The pH measurement of concrete and smoothing mortar using a concrete powder suspension. Cem. Concr. Res. 2004, 34, 813–820. [Google Scholar] [CrossRef]
- Šoić, I.; Martinez, S.; Lipošćak, I.; Mikšić, B. Development of method for assessing efficiency of organic corrosion inhibitors in concrete reinforcement. J. Croat. Assoc. Civ. Eng. 2018, 70, 369–375. [Google Scholar] [CrossRef]
- Kumar, R.; Bhattacharjee, B. Porosity, pore size distribution and in situ strength of concrete. Cem. Concr. Res. 2003, 33, 155–164. [Google Scholar] [CrossRef]
- Monticelli, C.; Natali, M.; Balbo, A.; Chiavari, C.; Zanotto, F.; Manzi, S.; Bignozzi, M.C. A study on the corrosion of reinforcing bars in alkali-activated fly ash mortars under wet and dry exposures to chloride solutions. Cem. Concr. Res. 2016, 87, 53–63. [Google Scholar] [CrossRef]
- Angst, U.; Elsener, B.; Larsen, C.K.; Vennesland, Ø. Critical chloride content in reinforced concrete—A review. Cem. Concr. Res. 2009, 39, 1122–1138. [Google Scholar] [CrossRef]
- Gluth, G.J.G.; Arbi, K.; Bernal, S.A.; Bondar, D.; Castel, A.; Chithiraputhiran, S.; Dehghan, A.; Dombrowski-Daube, K.; Dubey, A.; Ducman, V.; et al. RILEM TC 247-DTA round robin test: Carbonation and chloride penetration testing of alkali-activated concretes. Mater. Struct. 2020, 53, 21. [Google Scholar] [CrossRef]
- Provis, J.L.; Myers, R.J.; White, C.E.; Rose, V.; Van Deventer, J.S.J. X-ray microtomography shows pore structure and tortuosity in alkali-activated binders. Cem. Concr. Res. 2012, 42, 855–864. [Google Scholar] [CrossRef]
- Lee, N.; Lee, H.K. Influence of the slag content on the chloride and sulfuric acid resistances of alkali-activated fly ash/slag paste. Cem. Concr. Compos. 2016, 72, 168–179. [Google Scholar] [CrossRef]
- Bernal, S.A.; Provis, J.L.; Walkley, B.; Nicolas, R.S.; Gehman, J.D.; Brice, D.G.; Kilcullen, A.R.; Duxson, P.; Van Deventer, J.S. Gel nanostructure in alkali-activated binders based on slag and fly ash, and effects of accelerated carbonation. Cem. Concr. Res. 2013, 53, 127–144. [Google Scholar] [CrossRef]
- Myers, R.J.; Bernal, S.A.; Provis, J.L. A thermodynamic model for C-(N-)A-S-H gel: CNASH_ss. Derivation and validation. Cem. Concr. Res. 2014, 66, 27–47. [Google Scholar] [CrossRef]
- Ganeshan, M.; Venkataraman, S. Durability and microstructural studies on fly ash blended self-compacting geopolymer concrete. Eur. J. Environ. Civ. Eng. 2019, 1–15. [Google Scholar] [CrossRef]
- Behfarnia, K.; Rostami, M. Effects of micro and nanoparticles of SiO 2 on the permeability of alkali activated slag concrete. Constr. Build. Mater. 2017, 131, 205–213. [Google Scholar] [CrossRef]
- Zhang, J.; Ma, Y.; Zheng, J.; Hu, J.; Fu, J.; Zhang, Z.; Hao, W. Chloride diffusion in alkali-activated fly ash/slag concretes: Role of slag content, water/binder ratio, alkali content and sand-aggregate ratio. Constr. Build. Mater. 2020, 261, 119940. [Google Scholar] [CrossRef]
- Andrade, C. Design and evaluation of service life through concrete electrical resistivity. Rev. ALCONPAT 2018, 8, 264–279. [Google Scholar] [CrossRef] [Green Version]
- Lee, N.; Jang, J.; Lee, H. Shrinkage characteristics of alkali-activated fly ash/slag paste and mortar at early ages. Cem. Concr. Compos. 2014, 53, 239–248. [Google Scholar] [CrossRef]
- Neto, A.A.M.; Cincotto, M.A.; Repette, W. Drying and autogenous shrinkage of pastes and mortars with activated slag cement. Cem. Concr. Res. 2008, 38, 565–574. [Google Scholar] [CrossRef]
- Shi, J.; Ming, J.; Sun, W. Electrochemical performance of reinforcing steel in alkali-activated slag extract in the presence of chlorides. Corros. Sci. 2018, 133, 288–299. [Google Scholar] [CrossRef]
- Lloyd, R.R.; Provis, J.L.; Van Deventer, J.S. Pore solution composition and alkali diffusion in inorganic polymer cement. Cem. Concr. Res. 2010, 40, 1386–1392. [Google Scholar] [CrossRef]
- Babaee, M.; Castel, A. Chloride-induced corrosion of reinforcement in low-calcium fly ash-based geopolymer concrete. Cem. Concr. Res. 2016, 88, 96–107. [Google Scholar] [CrossRef]
- ASTM International. C 876/09 Standard Test Method for Half-Cell Potentials of Uncoated Reinforcing Steel in Concrete; ASTM International: West Conshohocken, PA, USA, 2009. [Google Scholar] [CrossRef]
- Chaouche, M.; Gao, X.X.; Cyr, M.; Cotte, M.; Frouin, L. On the origin of the blue/green color of blast-furnace slag-based materials: Sulfur K-edge XANES investigation. J. Am. Ceram. Soc. 2017, 100, 1707–1716. [Google Scholar] [CrossRef]
- Roy, A. Sulfur speciation in granulated blast furnace slag: An X-ray absorption spectroscopic investigation. Cem. Concr. Res. 2009, 39, 659–663. [Google Scholar] [CrossRef]
- Glasser, F.P. Mineralogical aspects of cement in radioactive waste disposal. Miner. Mag. 2001, 65, 621–633. [Google Scholar] [CrossRef]
- Mundra, S.; Criado, M.; Bernal, S.A.; Provis, J.L. Chloride-induced corrosion of steel rebars in simulated pore solutions of alkali-activated concretes. Cem. Concr. Res. 2017, 100, 385–397. [Google Scholar] [CrossRef]
- Scott, A.; Alexander, M. Effect of supplementary cementitious materials (binder type) on the pore solution chemistry and the corrosion of steel in alkaline environments. Cem. Concr. Res. 2016, 89, 45–55. [Google Scholar] [CrossRef]


| BFS | FA | SF | IS | OPC | |
|---|---|---|---|---|---|
| CaO | 33.46 | 13.04 | 3.06 | 2.7 | 64.04 |
| SiO2 | 41.59 | 51.1 | 92.02 | 27.5 | 19.32 |
| Al2O3 | 12.84 | 20.58 | 1.68 | 3.5 | 4.86 |
| Fe2O3 | 0.73 | 7.42 | 0.45 | 66.5 | 2.94 |
| Na2O | 1.39 | 0.89 | 0.21 | 0.4 | 0.23 |
| K2O | 0.57 | 1.99 | 1.11 | 0.9 | 0.82 |
| MgO | 5.97 | 2.15 | 0.77 | 0.7 | 1.83 |
| TiO2 | 1.73 | 0.53 | 0.04 | 0 | 0 |
| MnO | 0.08 | 0.04 | 0.03 | 0 | 0 |
| SO3 | 1.65 | 1.72 | 0.27 | 0.7 | 2.75 |
| P2O5 | 0.01 | 0.54 | 0.36 | 0 | 0 |
| Mix Label | Blast Furnace Slag | Fly Ash | Iron-Silicate Fine | Silica Fume | NaOH | Waterglass | Water | |
|---|---|---|---|---|---|---|---|---|
| KSi | NaSi | |||||||
| S | 100 | 0 | 0 | 0 | 8 | 0 | 6.2 | 33.6 |
| FA | 0 | 100 | 0 | 0 | 14 | 0 | 36.9 | 0 |
| S_FA | 75 | 25 | 0 | 0 | 9.5 | 0 | 13.8 | 8.8 |
| IS_S | 20 | 0 | 80 | 0 | 0 | 20 | 0 | 24 |
| S_SF | 85 | 0 | 0 | 15 | 15 | 0 | 24 | 21 |
| Mortar Property | REF | S | FA | S_FA | IS_S | S_SF |
|---|---|---|---|---|---|---|
| Slump (mm) | 160 | 120 | 175 | 110 | 122.5 | 167.5 |
| Compressive strength (MPa) | 59.5 | 44.3 | 77.4 | 77.2 | 29.4 | 94.7 |
| Total porosity (%) | 21.0 | 18.4 | 11.5 | 9.6 | 14.3 | 8.7 |
Publisher’s Note: MDPI stays neutral with regard to jurisdictional claims in published maps and institutional affiliations. |
© 2020 by the authors. Licensee MDPI, Basel, Switzerland. This article is an open access article distributed under the terms and conditions of the Creative Commons Attribution (CC BY) license (http://creativecommons.org/licenses/by/4.0/).
Share and Cite
Runci, A.; Serdar, M. Chloride-Induced Corrosion of Steel in Alkali-Activated Mortars Based on Different Precursors. Materials 2020, 13, 5244. https://doi.org/10.3390/ma13225244
Runci A, Serdar M. Chloride-Induced Corrosion of Steel in Alkali-Activated Mortars Based on Different Precursors. Materials. 2020; 13(22):5244. https://doi.org/10.3390/ma13225244
Chicago/Turabian StyleRunci, Antonino, and Marijana Serdar. 2020. "Chloride-Induced Corrosion of Steel in Alkali-Activated Mortars Based on Different Precursors" Materials 13, no. 22: 5244. https://doi.org/10.3390/ma13225244