Article

Quantitatively Analyzing Pressure Induced Phase Transformation by Photoluminescence Spectra in Eu3+-doped Sodium Potassium Bismuth Titanate

State Key Laboratory of New Ceramics and Fine Processing, School of Materials Science and Engineering, Tsinghua University, Beijing 100084, China
*
Author to whom correspondence should be addressed.
Materials 2020, 13(4), 881; https://doi.org/10.3390/ma13040881
Submission received: 21 January 2020 / Revised: 7 February 2020 / Accepted: 12 February 2020 / Published: 16 February 2020
(This article belongs to the Section Electronic Materials)

Abstract

:
(Na0.8,K0.2)0.5Bi0.497Eu0.003TiO3 (NKBET20) piezoelectric ceramic powders were prepared by the solid-reaction method. The phase structures of the NKBET20 powders under various pressures were investigated by photoluminescence (PL) spectra and X-ray diffraction (XRD). The PL spectra of the doped Eu3+ ions suggest a pressure induced transformation from the tetragonal to rhombohedral phase (R phase), and the phase transformations were confirmed by XRD analyses. Furthermore, the fluorescence intensity ratio of the D 0 5 F 2 7 transition to the D 0 5 F 1 7 transition (FIR21) could be utilized for the quantitative analyses of the phase transformation. The results from the PL method show that as the pressure increases from 0 to 500 MPa, the fractions of the R phase of the NKBET20 powders increase from about 11% to 58%, while the fractions of the tetragonal phase (T phase) decrease from about 89% to 42%, which are consistent with the XRD Rietveld refinement. Unlike the ceramic bulks, the pressure induced phase transformation in the ceramic powders shows no obvious trigger point and is much gentler. This work suggests a different viewpoint to study the pressure induced phase transformation qualitatively and quantitatively, which can be used for more phase analyses.

1. Introduction

Piezoelectric material has been widely applied in numerous electromechanical devices. In fact, piezoelectric material usually works under mechanical pressures [1], thus, some researchers concentrate on the effects of mechanical pressures on piezoelectric material [2,3,4,5,6,7]. For example, Yao et al. reported that the piezoelectric coefficient decreases with increasing the mechanical pressures in the PbTiO3-based piezoelectric ceramic, which was further explained by the pressure-induced depolarization [4]. Pressure induced phase transformations are also reported widely [5,6,7,8,9]. Hall et al. suggested a phase transformation from the rhombohedral to the orthorhombic phase within the PbZrO3-PbTiO3 piezoelectric ceramic, induced by pressure [3]. Dong et al. found that pressure could drive (Na1/2Bi1/2)TiO3-based ceramics from the ferroelectric to the relaxor phase [7]. Pressure induced phase transformations in piezoelectric ceramic bulks have been studied extensively, however, the effects of pressures on piezoelectric ceramic powders are seldom considered, which are also of important scientific significance and practical applications. For instance, when grinding, the influence of the mechanical pressure upon piezoelectric ceramic powders is vital in the X-ray diffraction analyses, as pressure induced phase transformation often occurs in the piezoelectric material. Moreover, the properties of the ceramic bulks and powders with the same compositions may differ, so, in this present work, we focus on the effects of pressures on piezoelectric ceramic powders, which are seldom considered.
As a Pb-free piezoelectric material, the (Na1−x,Kx)0.5Bi0.5TiO3 (NKBT100x) ceramic has been extensively investigated for its superior electrical properties [10,11,12]. The NKBT100x ceramic crystallizes the R phasein the Na0.5Bi0.5TiO3-rich compositions, and crystallizes the T phase in the K0.5Bi0.5TiO3-rich compositions [13]. While in compositions with x located at 0.16–0.2, the NKBT100x ceramic forms a morphotropic phase boundary (MPB) [14,15]. In these critical compositions, the R and T phases coexist, and NKBT100x ceramic exhibits optimal piezoelectric properties [13,15]. Furthermore, the Gibbs free energy gap between the two phases is small [16], therefore, phase transformation often occurs. For example, it is reported that phase transformation induced by electric fields occurs within the NKBT20 ceramic [17]. In addition, as described above, mechanical pressures could also induce phase transformations in piezoelectric materials. Thus, it seems that pressures could induce a phase transformation within NKBT100x materials.
On the other hand, piezoelectric materials doped with rare-earth (RE) ions have received significant consideration [18,19,20,21,22]. The crystallographic symmetry of the host material is one of the most important factors affecting the photoluminescence (PL) property of RE ions. Even if RE ions are doped in a dilute concentration, enough PL signals can be obtained because of their efficient emission. In such concentrations, RE ions hardly influence the initial structures of the host material, while their PL signals could reflect the structural information of the host material; thus, RE ions can be used as probes [23,24]. Pr3+ ions were used to detect the phase transformation of (Ba0.77Ca0.23)TiO3 materials [25]. Er3+ ions were used to probe the phase structures in Pb-based piezoelectric materials [26]. Furthermore, the PL spectra of Eu3+ ions were utilized for quantitative analyses of the phase structures of the (Na,K)0.5Bi0.5TiO3:Eu piezoelectric materials in our earlier work [27]. Here, we try to use the PL method for phase analyses in the pressure induced phase transformation.
In this contribution, we fabricated (Na0.8,K0.2)0.5Bi0.497Eu0.003TiO3 (NKBET20) piezoelectric ceramic powders by a solid reaction method, and investigated their phase structures under various pressures by PL spectra and XRD. The PL spectra of doped Eu3+ ions suggest that pressures induced the increase of the fraction of the R phase, and the decrease of the fraction of the T phase. Unlike the ceramic bulks, the pressure induced phase transformation in ceramic powders shows no obvious trigger point and is much gentler. Furthermore, FIR21 were shown to quantitatively analyze the phase transformation. These analyses were further confirmed by the XRD results.

2. Materials and Methods

(Na1−x,Kx)0.5Bi0.497Eu0.003TiO3 (NKBET100x; x = 0.1, 0.2, and 0.3) ceramic pellets were fabricated by the solid-reaction method, as described elsewhere [27]. Next, ceramic pellets were ground to a powder and annealed at 600 °C for 2 h. Then, the ceramic powder of NKBET20 was pressed into a stainless-steel die for 30 min under various pressures, ranging from 0 to 500 MPa, which was loaded by a tablet machine (DY-30, Keqi Ltd., Tianjin, China). The XRD measurements were executed using the Rigaku D/max-2500H X-ray diffractometer, which works under 40 kV and 150 mA. The scan angle ranged from 20° to 120°, with an interval of 0.01°. A spectrophotometer (FLSP920, Edinburgh Instruments, Livingston, UK) was used to record the PL properties. The excitation wavelength was set at 525 nm. For the PL spectra, the monitored luminescence range was from 570 to 645 nm with a bandwidth of 0.2 nm, and for the decay curves, the monitored wavelength was 592 nm.

3. Results and Discussions

Figure 1 depicts the PL spectra of the NKBET20 ceramic powders excited at 525 nm under various pressures. The magnetic dipole transition (MD) D 0 5 F 1 7 (585–600 nm) is independent of the local environments [28], while the so-called “hypersensitive transition” D 0 5 F 2 7 (600–630 nm) is sensitive to the local environments [29]. Figure 1 shows that as the pressures increase, the fluorescence intensity of the D 0 5 F 2 7 transition (I2) increases. As Eu3+ ions present the same PL spectra when distributed in NKBET100x materials with the same phase [27], utilizing the NKBET10 and NKBET30 ceramic powders as the reference of the R and T phases, the variations of I2 suggest a transformation from the T to R phase.
Considering the sensitivity of the hypersensitive transition of D 0 5 F 2 7 , and the independence of the MD transition of D 0 5 F 1 7 , FIR21 is a good measure of the Eu3+ ions’ local environments. As the discussed intensity of the transition is the integral intensity, Lorentz profiles were used to fit the spectra so as to obtain accurate values [24,30]. As the pressures increases, the FIR21 of the NKBET20 ceramic powders increase from about 1.75 to 1.99, as shown in Figure 2. Using NKBET10 and NKBET30 ceramic powders as references, the increase of FIR21 also indicates a transformation from the T to R phase. In an earlier study [27], we utilized FIR21 to quantitatively analyze the phase structures of the NKBET100x with compositions at the MPB by Equations (1) and (2):
K M = τ R α R τ R α R + τ T α T K R + τ T α T τ R α R + τ T α T K T
α R + α T = 1
Here, K is FIR21; α is the volume phase fraction; τ is the decay time; and superscripts M, R, and T represent the MPB, R, and T phase, respectively. K R ,   K T ,   τ R , and τ T are calculated from the PL properties of the NKBET10 and NKBET30 compositions. K M is calculated from the PL spectra of the NKBET100x with compositions near the MPB, then the phase fractions of α R and α T can be quantitatively calculated via Equations (1) and (2). Similarly, this PL method could be applied in pressure induced phase transformations. The FIR21 of the NKBET20 ceramic powders under various pressures are shown in Figure 2. The decay time of the R and T phases (using NKBET10 and NKBET30 compositions as references) are used to correct the phase fractions according to the analyses of the previous work [27], obtained from the decay curves of the NKBET10 and NKBET30 ceramic powders, as shown in Figure 3. Using NKBET10 and NKBET30 ceramic powders as references, K R ,   K T , (2.227 and 1.701, Figure 2), τ R ,   and   τ T (684.19 μs, 751.09 μs, Figure 3) in the above equations are identified. Then, the phase fractions of the NKBET20 powders under various pressures can be calculated by inputting K, thus solving Equations (1) and (2).
XRD patterns are also utilized to analyze the phase structures of the NKBET20 ceramic powders under various pressures, as shown in Figure 4. Variations in the XRD patterns in Figure 4A suggest a phase transformation. Figure 4B shows the super-lattice reflection 1/2(311), which is related to the aaa tilting system of the space group R3c of TiO6 octahedral, with respect to other adjacent unit cells, giving rise to the super-lattice reflection [31,32,33]. The super-lattice reflection 1/2(311) could be used to confirm the R phase, as has been widely reported [34,35]. As the pressures increase, the intensity of the 1/2(311) reflection increases, suggesting that pressures induce the increase of the fraction of R phase (R3c). In addition, XRD Rietveld refinement was executed by the general structure analysis system (GSAS) for quantitative phase analyses [36,37], as shown in Figure 5, in which R3c (R phase) and P4mm (T phase) were utilized in the meanwhile [33,38]. The fitted parameters are summarized in Table 1. From Figure 5 and Table 1, it can be seen that all of the patterns are fitted well.
Figure 6 depicts the variations of the phase fraction of the NKBET20 ceramic powders as the pressures increase. It can be seen from the results of the PL method that as the pressure increases from 0 to 500 MPa, the fractions of R phase of the NKBET20 powders increase from about 11% to 58%, while the fractions of the T phase decrease from about 89% to 42%. The phase analyses from PL method were consistent with the XRD Rietveld refinements. The phase transformation induced by the pressures within the piezoelectric ceramic bulks usually presents a trigger point and sharp variation [39,40]; however, the piezoelectric ceramic powders show no obvious trigger point and the phase transformation is much gentler. This finding indicates that the grind of the piezoelectric ceramic powders may induce a phase transformation, which needs additional care when doing the XRD measurements. In addition, the pressure induced phase transformation could be detected by the PL method, indicating the potential for Eu3+ ions to be used as in site probes for phase transformations. The experiments set up for PL detection are easy to build, which can be home-made to satisfy various demands, like electric field module, pressure module, and temperature module. Compared with the XRD Rietveld refinements, which need demanding devices and precise patterns, the PL method is a simple and fast procedure. We show that the PL method could be applied in pressure induced phase transformation in this work, yet it has much potential in fields of other phase analyses.

4. Conclusions

In summary, pressures induce a phase transformation within the NKBET20 ceramic powders, and the PL properties of Eu3+ ions can be utilized to analyze the transformation qualitatively and quantitatively. Utilizing NKBET10 and NKBET30 ceramic powders as references, the increase of I2 suggests a pressure induced transformation from the T to R phase. Furthermore, FIR21 were shown to quantitatively analyze the phase transformation. The results from the PL method show that as the pressure increases from 0 to 500 MPa, the fractions of the R phase of NKBET20 powders increase from about 11% to 58%, while the fractions of the T phase decrease from about 89% to 42%. Both the qualitative and quantitative phase analyses were further confirmed by the XRD results. Unlike the ceramic bulks, the pressure induced phase transformation in the ceramic powders shows no obvious trigger point and is much gentler. This work suggests a different viewpoint to study the pressure induced phase transformation, both qualitatively and quantitatively, which can be used for more phase analyses.

Author Contributions

L.Z. conceived and performed the experiments; L.Z. analyzed the data; L.Z. wrote the original draft; L.Z. and J.Z. revised the manuscript; J.Z. supervised the project. All authors have read and agreed to the published version of the manuscript.

Funding

This research was funded by the Basic Science Center Project of NSFC, under grant no. 51788104, as well as the National Natural Science Foundation of China, under grant no.’s 51532004 and 11704216.

Conflicts of Interest

The authors declare no conflict of interest.

References

  1. Chen, C.; Liang, R.; Zhou, Z.; Nie, X.; Zhang, W.; Cao, F.; Dong, X. Evaluation of Domain Wall Motion in Mn-Doped PMS-PZT Ceramics under Various Hydrostatic Pressures by Nonlinear Response Measurements. Ceram. Int. 2018, 44, 10215–10219. [Google Scholar] [CrossRef]
  2. Liu, Z.; Ren, W.; Nie, H.; Peng, P.; Liu, Y.; Dong, X.; Cao, F.; Wang, G. Pressure Driven Depolarization Behavior of Bi0.5Na0.5TiO3 Based Lead-Free Ceramics. Appl. Phys. Lett. 2017, 110, 212901. [Google Scholar] [CrossRef]
  3. Hall, D.; Evans, J.; Covey-Crump, S.; Holloway, R.; Oliver, E.; Mori, T.; Withers, P. Effects of Superimposed Electric Field and Porosity on the Hydrostatic Pressure-Induced Rhombohedral to Orthorhombic Martensitic Phase Transformation in PZT 95/5 Ceramics. Acta Mater. 2010, 58, 6584–6591. [Google Scholar] [CrossRef]
  4. Gao, J.; Xu, Z.; Zhang, C.; Wei, X.; Yao, X.; Li, F. Hydrostatic Pressure Dependence of Dielectric, Elastic, and Piezoelectric Properties of Pb(Mg1/3Nb2/3)O3-0.33PbTiO3 Ceramic. J. Am. Ceram. Soc. 2011, 94, 2946–2950. [Google Scholar] [CrossRef]
  5. Basu, A.; Jana, R.; Mandal, G.; Chandra, A.; Mukherjee, G.D. Pressure Driven Ferroelectric to Paraelectric Transition in Sr Doped BaTiO3. J. Appl. Phys. 2015, 117, 054102. [Google Scholar] [CrossRef]
  6. Nie, H.; Su, R.; Peng, P.; Cao, F.; Liu, Y.; He, H.; Wang, G.; Dong, X.; Fei, C.; Hongliang, H. Pressure-induced Phase Transitions in PZ-X BMN Binary Solid Solutions. J. Am. Ceram. Soc. 2019, 102, 4021–4028. [Google Scholar] [CrossRef]
  7. Peng, P.; Nie, H.; Guo, W.; Cao, F.; Wang, G.; Dong, X. Pressur-induced ferroelectri-relaxor phase transition in (Bi0.5Na0.5)TiO3-based ceramics. J. Am. Ceram. Soc. 2019, 102, 2569–2577. [Google Scholar]
  8. Hagiwara, M.; Ehara, Y.; Novak, N.; Khansur, N.H.; Ayrikyan, A.; Webber, K.G.; Fujihara, S. Relaxor-Ferroelectric Crossover in (Bi1/2K1/2)TiO3: Origin of the Spontaneous Phase Transition and the Effect of an Applied External Field. Phys. Rev. B 2017, 96, 014103. [Google Scholar] [CrossRef]
  9. Schader, F.H.; Wang, Z.; Hinterstein, M.; Daniels, J.E.; Webber, K.G. Stress-modulated relaxor-to-ferroelectric transition in lead-free (Na1/2Bi1/2)TiO3-BaTiO3 ferroelectrics. Phys. Rev. B 2016, 93, 134111. [Google Scholar] [CrossRef] [Green Version]
  10. Lee, G.; Shin, D.-J.; Kwon, Y.-H.; Jeong, S.-J.; Koh, J.-H. Optimized Piezoelectric and Structural Properties of (Bi,Na)TiO3–(Bi,K)TiO3 Ceramics for Energy Harvester Applications. Ceram. Int. 2016, 42, 14355–14363. [Google Scholar] [CrossRef]
  11. Khansur, N.H.; Benton, R.; Dinh, T.H.; Lee, J.-S.; Jones, J.L.; Daniels, J.E. Composition Dependence of Electric-Field-Induced Structure of Bi1/2(Na1−xKx)1/2TiO3 Lead-Free Piezoelectric Ceramics. J. Appl. Phys. 2016, 119, 234101. [Google Scholar] [CrossRef]
  12. Butnoi, P.; Manotham, S.; Jaita, P.; Pengpat, K.; Eitssayeam, S.; Tunkasiri, T.; Rujijanagul, G. Effects of Processing Parameter on Phase Transition and Electrical Properties of Lead-Free BNKT Piezoelectric Ceramics. Ferroelectr. 2017, 511, 42–51. [Google Scholar] [CrossRef]
  13. Otoničar, M.; Škapin, S.; Spreitzer, M.; Suvorov, D. Compositional Range and Electrical Properties of the Morphotropic Phase Boundary in the Na0.5Bi0.5TiO3–K0.5Bi0.5TiO3 System. J. Eur. Ceram. Soc. 2010, 30, 971–979. [Google Scholar] [CrossRef]
  14. Yang, Z.; Liu, B.; Wei, L.; Hou, Y. Structure and Electrical Properties of (1−x)Bi0.5Na0.5TiO3–xBi0.5K0.5TiO3 Ceramics Near Morphotropic Phase Boundary. Mater. Res. Bull. 2008, 43, 81–89. [Google Scholar] [CrossRef]
  15. Sasaki, A.; Chiba, T.; Mamiya, Y.; Otsuki, E. Dielectric and Piezoelectric Properties of (Bi0.5Na0.5)TiO3–(Bi0.5K0.5)TiO3 Systems. Jpn. J. Appl. Phys. 1999, 38, 5564–5567. [Google Scholar] [CrossRef]
  16. Hao, X.; Zhai, J.; Kong, L.B.; Xu, Z. A comprehensive review on the progress of lead zirconate-based antiferroelectric materials. Prog. Mater. Sci. 2014, 63, 1–57. [Google Scholar] [CrossRef]
  17. Royles, A.J.; Bell, A.; Jephcoat, A.P.; Kleppe, A.K.; Milne, S.J.; Comyn, T.P. Electric-Field-Induced Phase Switching in the Lead Free Piezoelectric Potassium Sodium Bismuth Titanate. Appl. Phys. Lett. 2010, 97, 132909. [Google Scholar] [CrossRef]
  18. He, J.; Zhang, J.; Xing, H.; Pan, H.; Jia, X.; Wang, J.; Zheng, P. Thermally Stable Ferroelectricity and Photoluminescence in Sm-Doped 0.8(Bi0.5Na0.5)TiO3-0.2SrTiO3 Ferroelectric Ceramics. Ceram. Int. 2017, 43, 250–255. [Google Scholar] [CrossRef]
  19. Wu, X.; Lin, J.; Chen, P.; Liu, C.; Lin, M.; Lin, C.; Luo, L.; Zheng, X. Ho3+-doped (K,Na)NbO3-based multifunctional transparent ceramics with superior optical temperature sensing performance. J. Am. Ceram. Soc. 2019, 102, 1249–1258. [Google Scholar] [CrossRef]
  20. Sukul, P.P.; Kumar, K.; Swart, H.C. Photoluminescence spectroscopy of Eu3+: An economical technique for the detection of crystal phase transformation in PbZr0.53Ti0.47O3 ceramics. OSA Continuum. 2018, 1, 971. [Google Scholar] [CrossRef]
  21. Xiang, X.J.X.; Chen, C.; Tu, N.; Chen, Y.; Li, X.; Wang, P.; Fan, G. Composition and poling-induced modulation on photoluminescence properties for NBT-xBT: Pr3+ ceramics. J. Eur. Ceram. Soc. 2018, 38, 1498–1507. [Google Scholar]
  22. Du, P.; Luo, L.; Li, W.; Yue, Q. Upconversion Emission in Er-Doped and Er/Yb-Codoped Ferroelectric Na0.5Bi0.5TiO3 and Its Temperature Sensing Application. J. Appl. Phys. 2014, 116, 14102. [Google Scholar] [CrossRef]
  23. Du, P.; Luo, L.; Li, W.; Zhang, Y.; Chen, H. Photoluminescence and Piezoelectric Properties of Pr-Doped NBT–xBZT Ceramics: Sensitive to Structure Transition. J. Alloy. Compd. 2013, 559, 92–96. [Google Scholar] [CrossRef]
  24. Khatua, D.K.; Agarwal, A.; Kumar, N.; Ranjan, R. Probing Local Structure of the Morphotropic Phase Boundary Composition of Na0.5Bi0.5TiO3–BaTiO3 Using Rare-Earth Photoluminescence as a Technique. Acta Mater. 2018, 145, 429–436. [Google Scholar] [CrossRef]
  25. Zhang, P.; Shen, M.; Fang, L.; Zheng, F.; Wu, X.; Shen, J.; Chen, H. Pr3+ photoluminescence in ferroelectric (Ba0.77Ca0.23)TiO3 ceramics: Sensitive to polarization and phase transitions. Appl. Phys. Lett. 2008, 92, 222908. [Google Scholar] [CrossRef]
  26. Yao, Y.; Luo, L.; Li, W.; Zhou, J.; Wang, F. An intuitive method to probe phase structure by upconversion photoluminescence of Er3+ doped in ferroelectric Pb(Mg1/3Nb2/3)O3-PbTiO3. Appl. Phys. Lett. 2015, 106, 082906. [Google Scholar] [CrossRef]
  27. Zeng, L.; Zhou, J. Quantitative phase analyses of Eu3+-doped (Na1−x,Kx)0.5Bi0.5TiO3 ferroelectric ceramics near morphotropic phase boundary by photoluminescence spectra. Ceram. Int. 2019, 45, 15913–15919. [Google Scholar] [CrossRef]
  28. Görller-Walrand, C.; Fluyt, L.; Ceulemans, A.; Carnall, W.T. Magnetic Dipole Transitions as Standards for Judd–Ofelt Parametrization in Lanthanide Spectra. J. Chem. Phys. 1991, 95, 3099–3106. [Google Scholar] [CrossRef]
  29. Binnemans, K. Interpretation of europium (III) Spectra. Co-ord. Chem. Rev. 2015, 295, 1–45. [Google Scholar] [CrossRef] [Green Version]
  30. Abhijeet, B.N.R.K.; Thomas, T.; Ranjan, R. Electric field induced short range to long range structural ordering and its influence on the Eu+3 photoluminescence in the lead-free ferroelectric Na1/2Bi1/2TiO3. J. Appl. Phys. 2015, 117, 244106. [Google Scholar]
  31. Glazer, A.M. Simple ways of determining perovskite structures. Acta Cryst. A 1975, 31, 756–762. [Google Scholar] [CrossRef] [Green Version]
  32. Glazer, A.M. The classification of tilted octahedra in perovskites. Acta Cryst. B 1972, 28, 3384–3392. [Google Scholar] [CrossRef]
  33. Jones, G.O.; Thomas, P.A. Investigation of the structure and phase transitions in the novel A-site substituted distorted perovskite compound Na0.5Bi0.5TiO3. Acta Cryst. B 2002, 58, 168–178. [Google Scholar] [CrossRef] [PubMed] [Green Version]
  34. Adhikary, G.D.; Khatua, D.K.; Senyshyn, A.; Ranjan, R. Long-Period Structural Modulation on the Global Length Scale As the Characteristic Feature of the Morphotropic Phase Boundaries in the Na0.5Bi0.5TiO3 Based Lead-Free Piezoelectrics. Acta Mater. 2019, 164, 749–760. [Google Scholar] [CrossRef]
  35. Ranjan, R.; Dviwedi, A. Structure and Dielectric Properties of (Na0.50Bi0.50)1−xBaxTiO3: 0 ≤ x ≤ 0.10. Solid State Commun. 2005, 135, 394–399. [Google Scholar] [CrossRef]
  36. Toby, B.H. EXPGUI, a Graphical User Interface for GSAS. J. Appl. Crystallogr. 2001, 34, 210–213. [Google Scholar] [CrossRef] [Green Version]
  37. Larson, A.C.; Dreele, R.B.V. General Structure Analysis System (GSAS); Los Alamos National Laboratory Report LAUR; Los Alamos National Laboratory: Los Alamos, NM, USA, 2000; pp. 86–748. [Google Scholar]
  38. Jones, G.O.; Kreisel, J.; Thomas, P.A. A Structural Study of the (Na1−xKx)0.5Bi0.5TiO3 Perovskite Series as a Function of Substitution (x) and Temperature. Powder Diffr. 2002, 17, 301–319. [Google Scholar] [CrossRef]
  39. Avdeev, M.; Jorgensen, J.D.; Short, S.; Samara, G.A.; Venturini, E.L.; Yang, P.; Morosin, B. Pressure-induced ferroelectric to antiferroelectric phase transition in Pb0.99(Zr0.95Ti0.05)0.98Nb0.02O3. Phys. Rev. B 2006, 73, 064105. [Google Scholar] [CrossRef]
  40. Comyn, T.P.; Stevenson, T.; Al-Jawad, M.; Marshall, W.G.; Smith, R.I.; Herrero-Albillos, J.; Cywinski, R.; Bell, A.J. Pressure Induced Para-Antiferromagnetic Switching in BiFeO3–PbTiO3 As Determined Using in-Situ Neutron Diffraction. J. Appl. Phys. 2013, 113, 183910. [Google Scholar] [CrossRef] [Green Version]
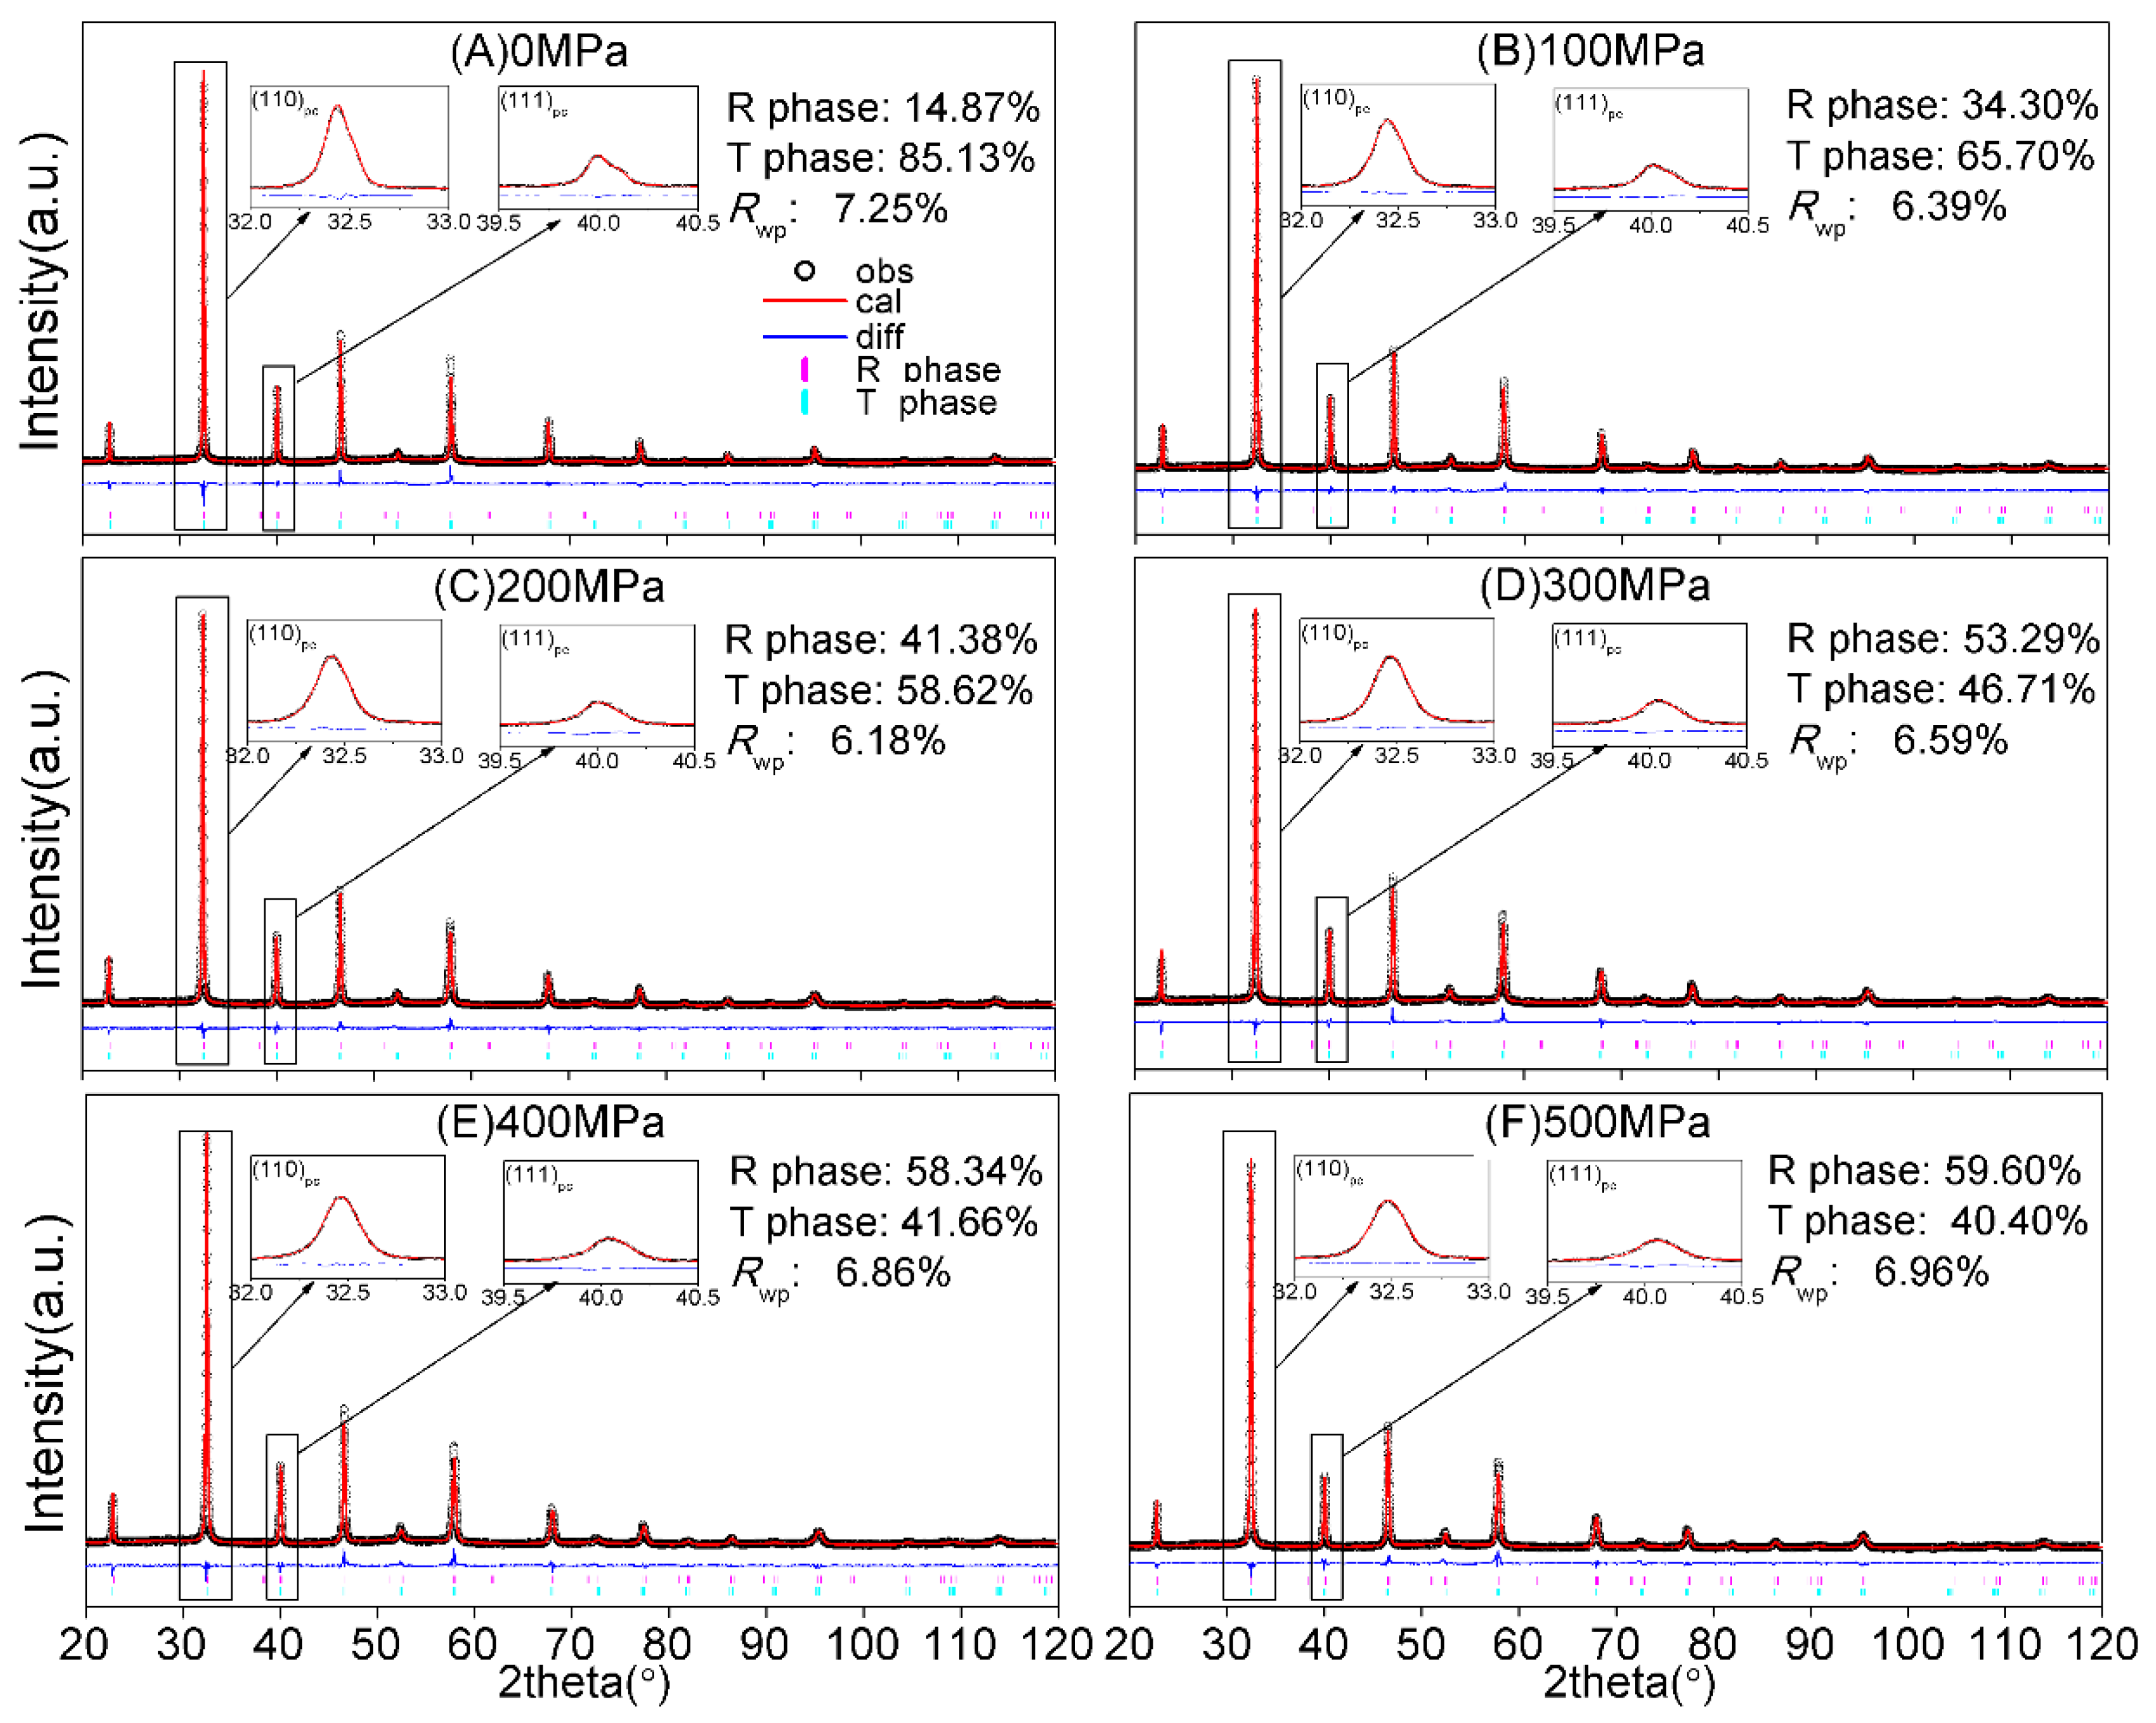
Figure 1. Photoluminescence (PL) spectra of the (Na0.8,K0.2)0.5Bi0.497Eu0.003TiO3 (NKBET20) ceramic powders under various pressures. The peak intensity of the magnetic dipole (MD) transition D 0 5 F 1 7 is normalized to 1; the dashed lines represent the PL spectra of the NKBET10 and NKBET30 ceramic powders; the black arrow represents the variations of the PL spectra.
Materials 13 00881 g001
Figure 2. The fluorescence intensity ratios of the D 0 5 F 2 7 transition to the D 0 5 F 1 7 transition of the NKBET20 ceramic powders under various pressures, denoted as K. The two black dots represent the NKBET10 and NKBET30 ceramic powders as references.
Materials 13 00881 g002
Figure 3. The decay curve of the ceramic powders of (A) NKBET10 and (B) NKBET30. The excitation wavelength is 525 nm and the monitored luminescence wavelength is 592 nm. The monoexponential function, I ( t ) = I ( 0 ) exp ( t / τ ) , was used to fit the decay curve in order to obtain the decay time.
Materials 13 00881 g003
Figure 4. XRD patterns of NKBET20 ceramic powders under various pressures. (A) Ranges from 20° to 120°. (B) The superlattice reflection 1/2(311) corresponding to the space group R3c.
Materials 13 00881 g004
Figure 5. XRD Rietveld refinements of the NKBET20 ceramic powders under various pressures: (A) 0, (B) 100, (C) 200, (D) 300, (E) 400, and (F) 500 MPa.
Materials 13 00881 g005
Figure 6. Variations of the fraction of the R phase of the NKBET20 ceramic powders under various pressures.
Materials 13 00881 g006
Table 1. The parameter of XRD Rietveld refinement.
P (MPa)R3cP4mm R Factors
a (Å)c (Å)V3)vol%a (Å)c (Å)V3)vol%Rwp%Rp%
0 5.5170 13.5200 356.37714.87 3.9032 3.9111 59.586 85.13 7.255.73
100 5.5167 13.5171 356.26334.30 3.9031 3.9100 59.566 65.70 6.394.95
2005.5162 13.5137 356.11641.38 3.9029 3.9096 59.555 58.62 6.184.79
300 5.5150 13.5133 355.94653.29 3.9029 3.9092 59.548 46.71 6.595.06
400 5.5145 13.5135 355.89258.34 3.9023 3.9079 59.514 41.66 6.865.28
500 5.5139 13.5129 355.79859.60 3.9021 3.9071 59.490 40.40 6.965.26

