Article

Investigation of Changes in Fatigue Damage Caused by Mean Load under Block Loading Conditions

Department of Mechanics and Machine Design, Opole University of Technology, 45-271 Opole, Poland
*
Author to whom correspondence should be addressed.
Materials 2021, 14(11), 2738; https://doi.org/10.3390/ma14112738
Submission received: 12 April 2021 / Revised: 14 May 2021 / Accepted: 20 May 2021 / Published: 22 May 2021
(This article belongs to the Special Issue Fatigue and Fracture of Materials)

Abstract

:
The literature in the area of material fatigue indicates that the fatigue properties may change with the number of cycles. Researchers recommend taking this into account in fatigue life calculation algorithms. The results of simulation research presented in this paper relate to an algorithm for estimating the fatigue life of specimens subjected to block loading with a nonzero mean value. The problem of block loads using a novel calculation model is presented in this paper. The model takes into account the change in stress–strain curve parameters caused by mean strain. Simulation tests were performed for generated triangular waveforms of strains, where load blocks with changed mean strain values were applied. During the analysis, the degree of fatigue damage was compared. The results of calculations obtained for standard values of stress–strain parameters (for symmetric loads) and those determined, taking into account changes in the curve parameters, are compared and presented in this paper. It is shown that by neglecting the effect of the mean strain value on the K′ and n′ parameters and by considering only the parameters of the cyclic deformation curve for εm = 0 (symmetric loads), the ratio of the total degree of fatigue damage varies from 10% for εa = 0.2% to 3.5% for εa = 0.6%. The largest differences in the calculation for ratios of the partial degrees of fatigue damage were observed in relation to the reference case for the sequence of block n3, where εm = 0.4%. The simulation results show that higher mean strains change the properties of the material, and in such cases, it is necessary to take into account the influence of the mean value on the material response under block loads.

1. Introduction

Material fatigue properties are described by means of standard characteristics (e.g., S–N curve or ε–N curve and cyclic stress–strain curve). They are usually obtained under laboratory testing conditions for constant-amplitude loads. Other factors affecting fatigue life, such as mean load value, notch performance, complex load conditions, and others, also require separate testing and mathematical modeling. In engineering practice, it is assumed that such factors are treated as material properties with fixed values. Studies proving the variability of these factors with the number of fatigue cycles are also available in the literature [1,2]. This effect is characteristic for cyclically unstable materials, and the literature indicates that the calculation algorithms, e.g., for fatigue life estimation, should take into account the phenomena related to the strengthening or weakening of such materials [3,4,5,6].
Block loads are a special case of operational loads. During the operation of a structure or machine, it is possible to clearly distinguish fragments with significantly different levels of repeated cyclic load. As an example, we can indicate the diametrically different loads on the wings of aircraft during flight, where several phases (stop–takeoff–cruise–landing) can be distinguished or, as another example, the diametrically different loads on large trucks when transporting minerals and aggregates. There are clearly phases of variable loads with different mean loads.
It becomes important to determine the impact of individual sequences on fatigue processes occurring in the material in terms of both load levels and their order. For example, the influence of Lo/Hi and Hi/Lo load sequences on material fatigue life is well known. This effect is most often studied using block loads, where the life cycle of the tested components is most often divided into two parts with significantly different levels of stress σ (Figure 1). The expression ni/Nf represents the proportion of cycles ni with respect to the life of the Nf sample. The index i (here, i = 1, 2) denotes the step in the load block.
Usually, two-state tests are carried out (Figure 1), where, for a certain number of cycles n1, the material is loaded with stress σ1 and, then, the second phase of the number of cycles n2 with stress σ2 is applied. Such tests are carried out in two ways:
  • After the first phase of loading, the second phase of testing is carried out to obtain the criterion of sample failure.
  • The sequence of cycles n1 and n2 is determined, and this load sequence is repeated until the criterion of sample failure is not reached.
The main purpose of the research is to determine the cumulative damages in the material in individual loading phases. The results of the durability tests are related to the standard fatigue characteristics of the materials obtained under constant load conditions.
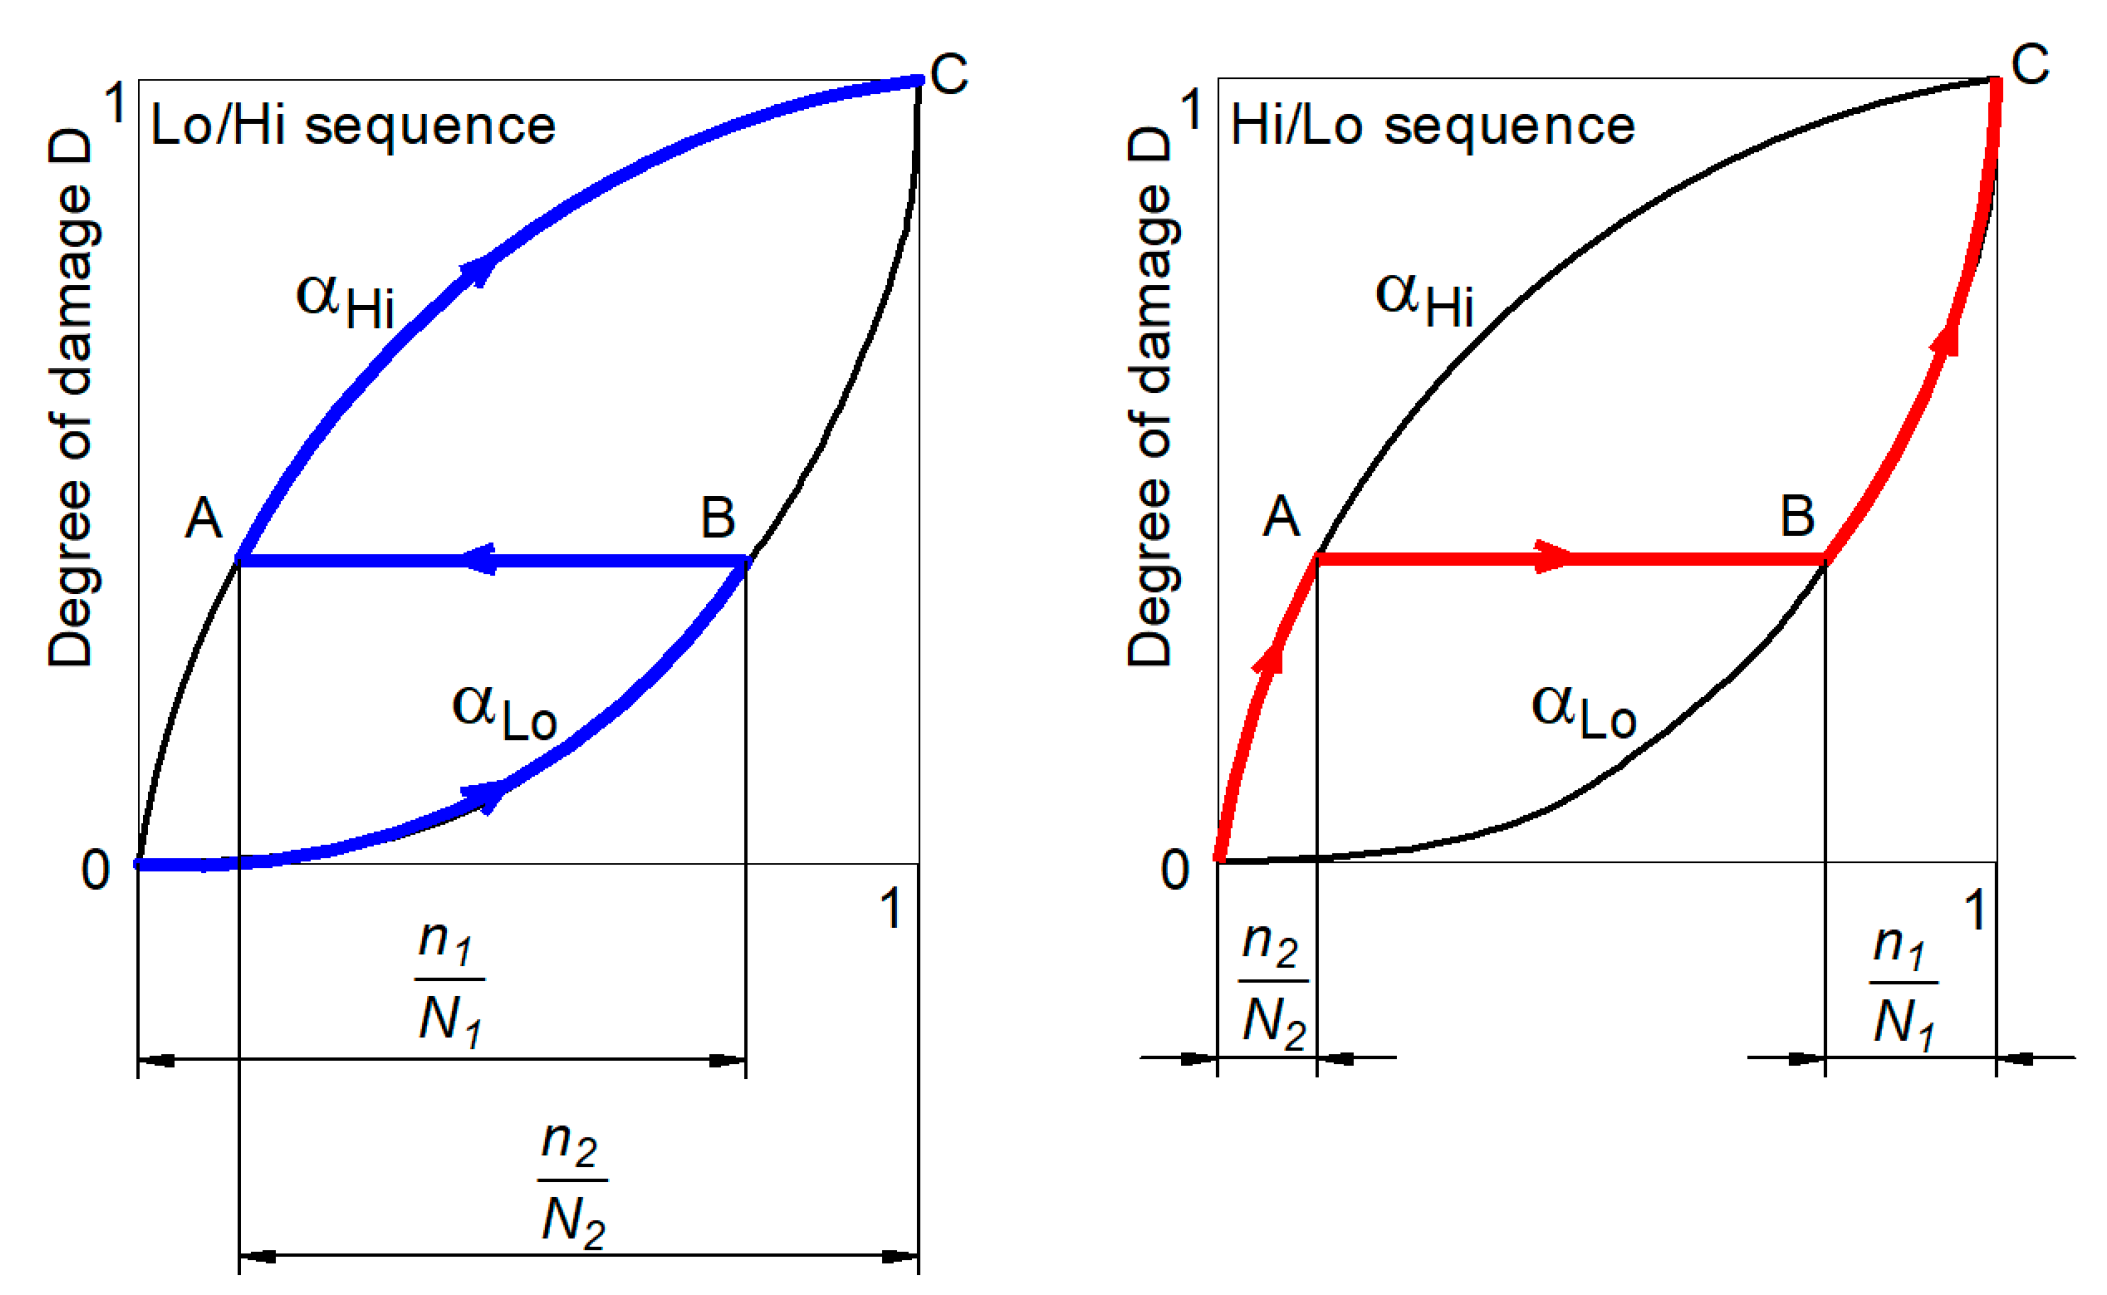
The use of nonlinear fatigue damage accumulation models is well described in the literature [7,8], and these results are very often the basis for more detailed analyses in the case of block loads, in which individual sequences are formed by symmetrical load cycles [9]. It is commonly recognized that the appearance of a high level of load in the first cycle increases the fatigue life as compared to the case where the stress increase occurs in the second load block. The different behaviors of the material are explained by the nonlinearity of the fatigue failure accumulation curves, where the change in the stress level is related to the change in the failure accumulation curve, as shown in Figure 2.
As shown in Figure 2, we can determine the following Equation (1):
D L o H i = n 1 N 1 + n 2 N 2 > 1 D H i L 0 = n 2 N 2 + n 1 N 1 < 1
Despite the fact that the load parameters in the Hi/Lo and Lo/Hi paths are the same, the sequence of load affects the value of accumulated damage. As a result, we obtain different fatigue lives. Without taking into account block loads in the design, we can affect the safety of the structure if the load path method causes greater damage than that determined from the models ignoring the influence of the load history.
Equation (2) presents a basic relationship for a nonlinear model of fatigue damage accumulation.
D = D i = ( n i N i ) a
where α is the exponent depending on the load level, ni is the number of cycles in a load block with stress σi, and Ni is the number of cycles to failure determined from the base fatigue characteristics under constant-amplitude loads.
It is worth pointing out that, for such loads, instability of the parameters of the cyclic strain curve was also observed [10].
Additionally, the basic research problems under fatigue conditions of block loads refer to symmetrical loads, where the mean value is zero. This allows, above all, for assessments of the impact of the load sequence on the course of fatigue phenomena and to verify the calculation models of fatigue life estimation. An interesting extension of research in block conditions was presented in [11,12], whereby load blocks create a complex state of alternating bending and torsion. The authors proposed the nonlinear damage accumulation aggregation hypothesis based on material memory.
There are few studies in the literature on block loads considering asymmetric cycles (mean load). In the case of block loads involving different mean values in each load sequence, different trends underlying the changes in fatigue life are observed. In a study by Memon et al. [13], the results of fatigue tests under two-stage block loads in Lo/Hi and Hi/Lo sequences were presented for different sequences of amplitude and mean load. The authors investigated the possibility of applying the Palmgreen–Miner hypothesis of accumulation of fatigue damage for such loads. The results of this research indicate that, while the differences in load amplitudes for subsequent blocks are large, a significant impact on the level of accumulated fatigue damage for Hi/Lo and Lo/Hi sequences can be observed and, thus, significant differences in fatigue life are obtained. Gołoś and Dębski [14] took into account the mean strain value using the total strain energy density parameter. It was observed that the mean strain values affect the energy fatigue characteristics of the material. The authors proposed a fatigue damage accumulation model using these modified characteristics. Test results on St5 steel samples showed that the additional mean strain reduces the fatigue life under block load conditions, and the authors proposed a fatigue damage accumulation model, which successfully described the test results. Some studies available in the literature [15,16,17,18] presented a wide range of fatigue tests on S355J0 steel under three-stage bending block loads. It is indicated that the effect of mean load depends on the load level and is more important for higher load amplitude values. When plastic deformation in the material is limited, the mean load value has little effect. It has also been observed that fatigue life in the case of block loads is greater compared to tests under constant-amplitude conditions.
The purpose of this work was to perform simulation tests and to assess the impact of changes in the parameters of the cyclic strain curve caused by mean strain on the degree of fatigue damage in relation to the strain amplitude.

2. Stress–Strain Analysis Model

For the analysis of the state of stress and strain, an algorithmic method is proposed, whereas a function of stress time histories, the calculation of the degree of fatigue damage, is based on standard fatigue characteristics.
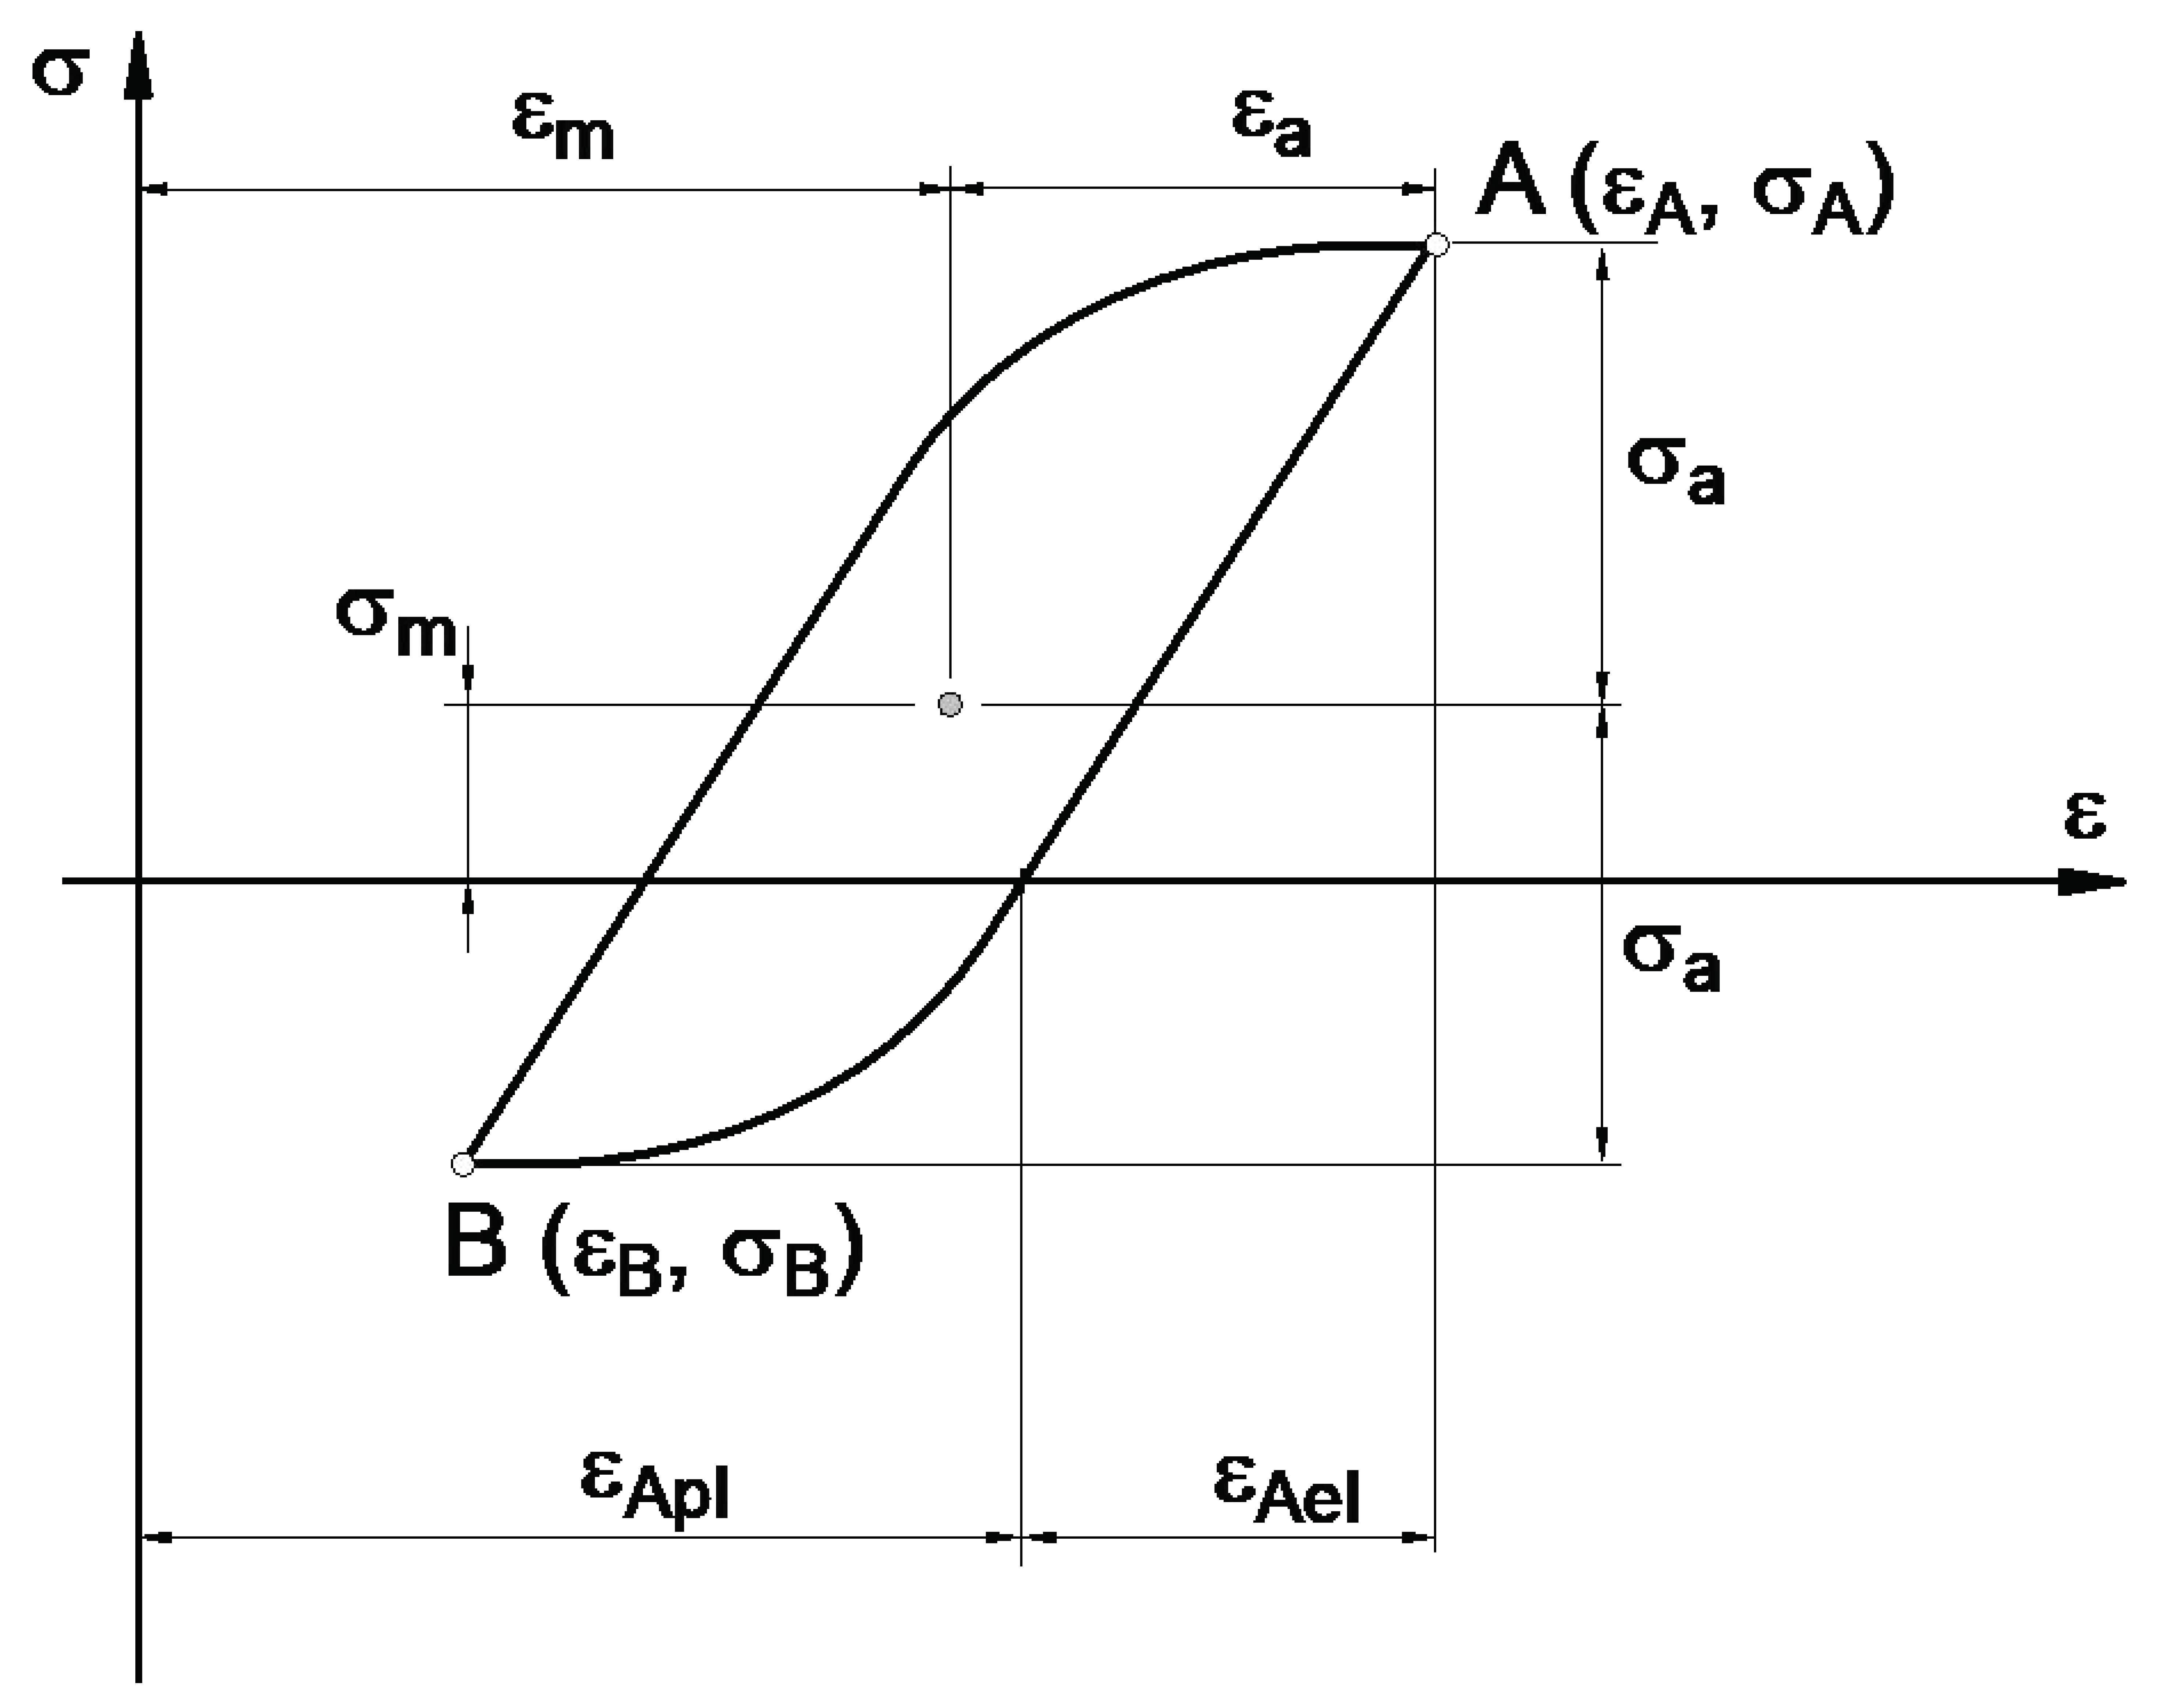
The stress–strain hysteresis loop model from the literature [19], described in Figure 3, was adopted. It was assumed that the shape of the stable hysteresis loop remains unchanged under the same strain amplitude instead of presenting different mean strain values. Additionally, the stable hysteresis loop shifts in accordance with the value of the mean strain. This results in symmetry of the hysteresis loop according to the point described by mean strain εm and mean stress σm (see Figure 3).
It was assumed that, after changing the load conditions in the block, the current state of the material is the starting point for further operation in the subsequent load sequence. This then causes additional material deformations as a result of the increase in mean value. A graph of hysteresis loop positions is presented in Figure 4 [17].
In the general case, when the actual loop changes position, εm2 represents the deformation related to the state of the material previously achieved. However, to take into account the previous load history, it was assumed that the starting point for the deformation analysis is the level of permanent deformation after the previous load blocks. Hence, for further analysis, the strain was marked as εm2z.
By taking into account the assumptions presented above (Figure 3 and Figure 4), an algorithm to compute the stress history was defined, where all steps must be repeated for each sequence in the block load for the entire recorded history of strains. The algorithm is presented in Table 1. The values of stress amplitude and mean value are taken as the input data to determine fatigue failure and to estimate fatigue life with the use of standard fatigue characteristics.

3. Analytical Simulation

Material data were taken from the literature. Chiou and Yip [19] presented the effect of mean strain level on the cyclic stress–strain behavior of AISI 316 stainless steel. Typical applications of 316 stainless steel include the design of exhaust manifolds, heat exchangers, valve and pump parts, chemical processing equipment, and parts exposed to the marine environment. Table 2 presents the parameters of cyclic strain curves obtained for different levels of mean strain.
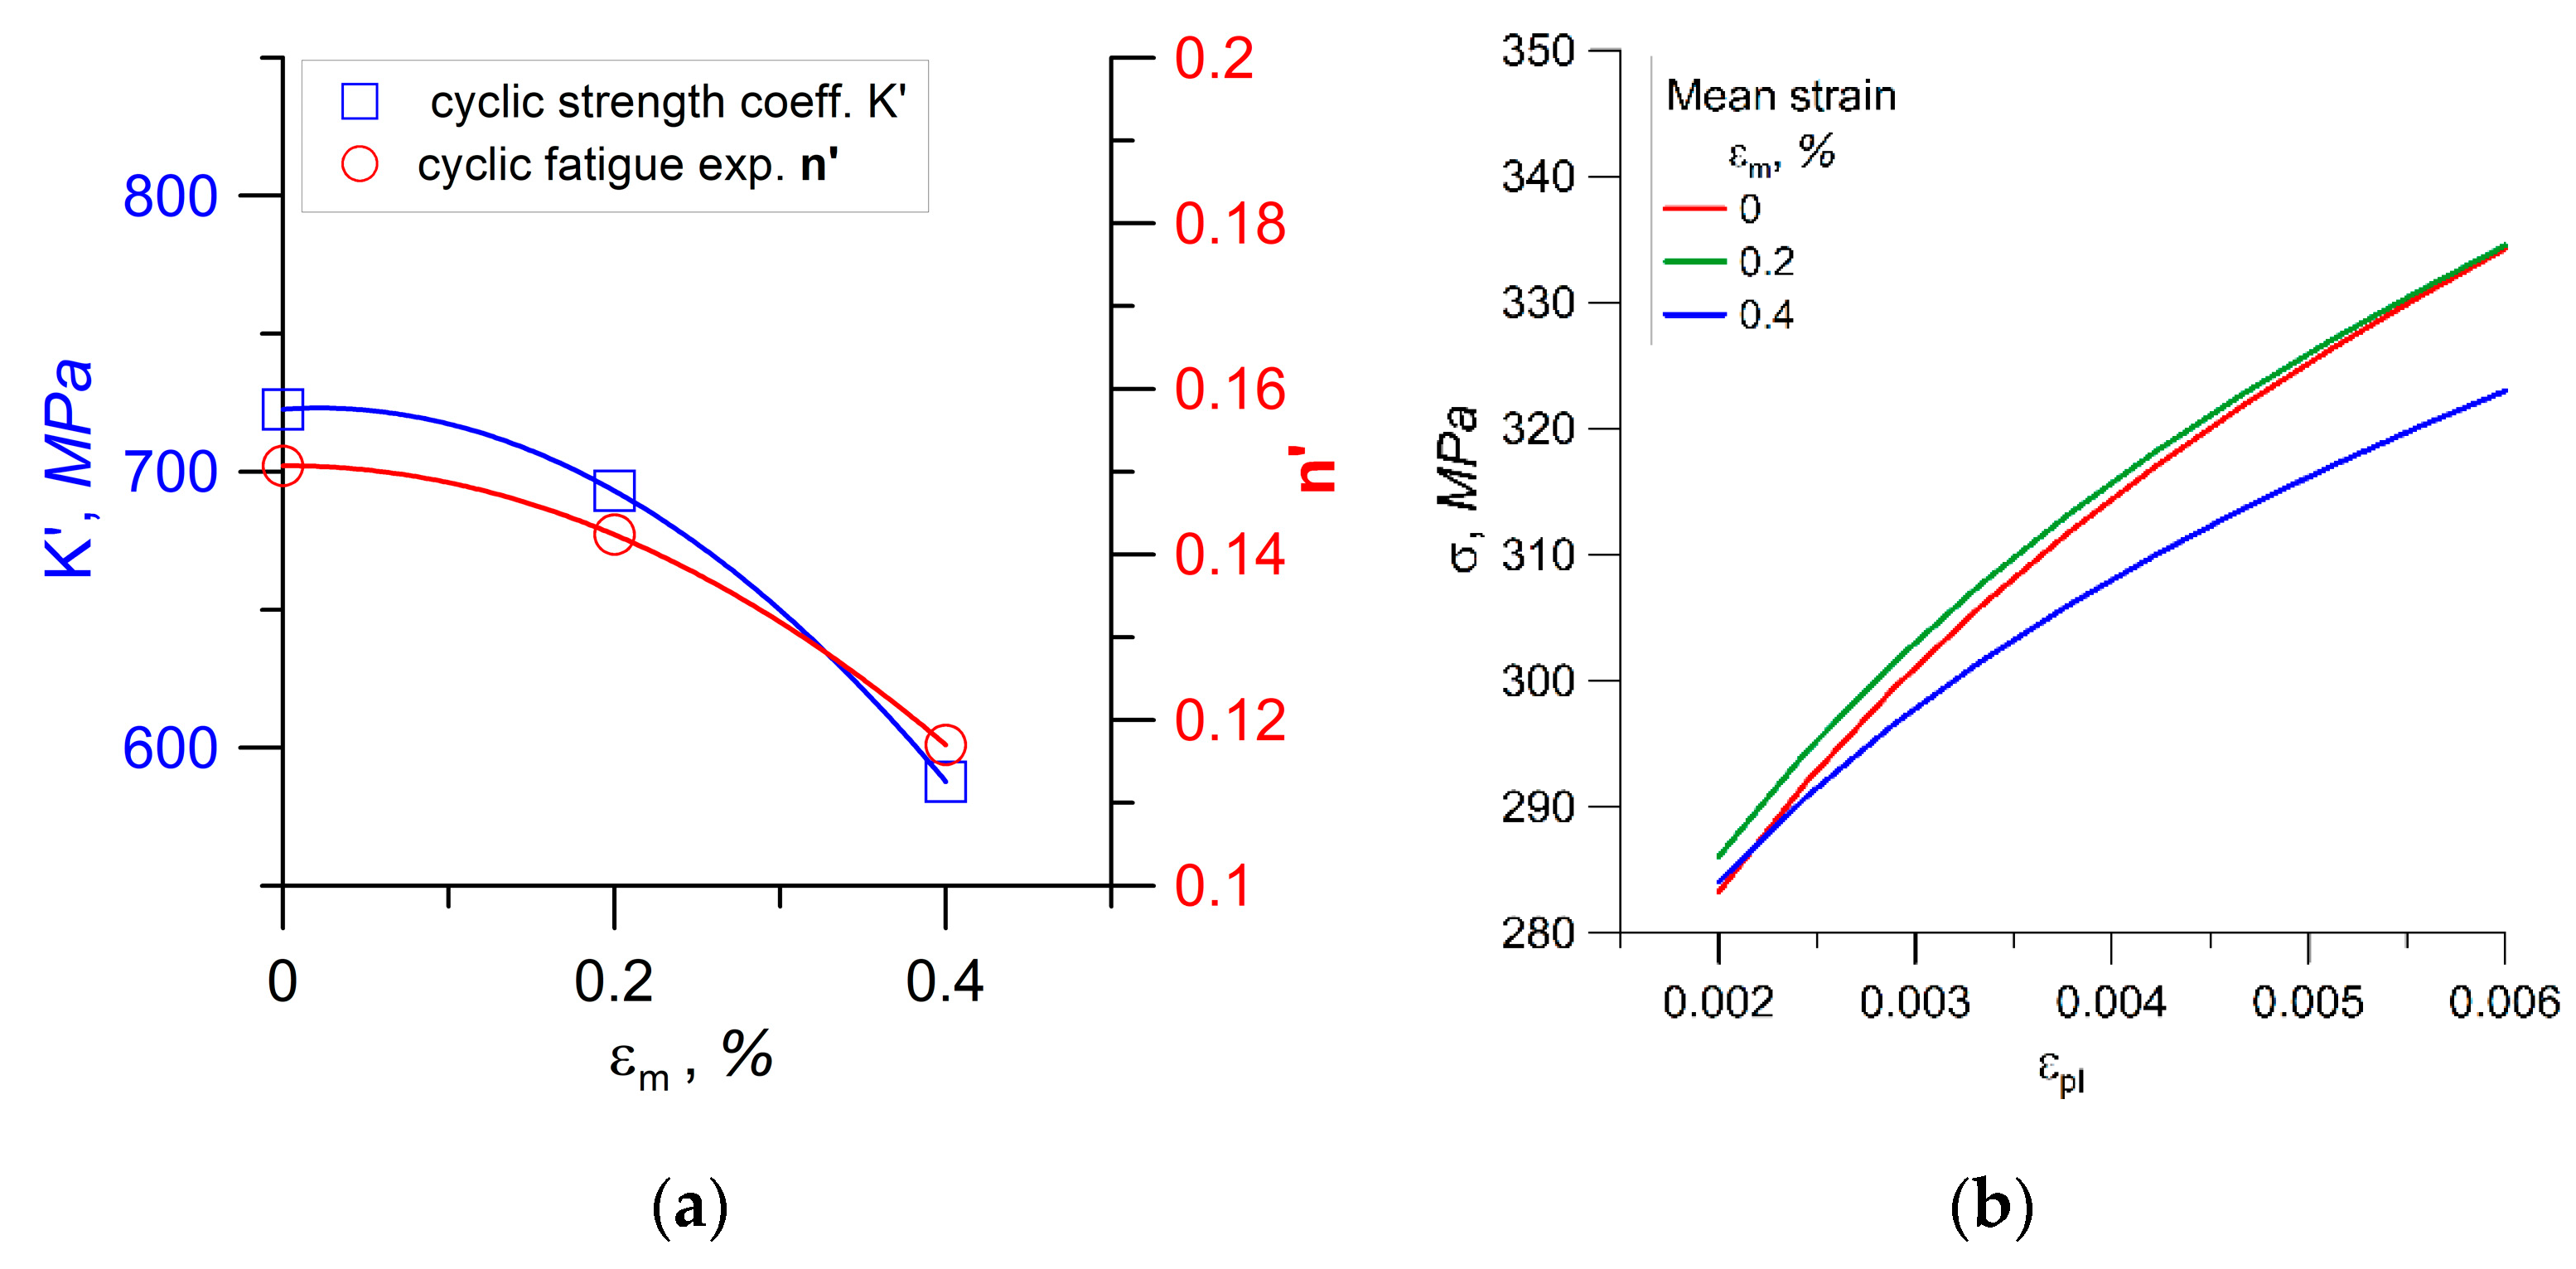
Figure 5a graphically depicts the results in Table 2. It is shown that, for a higher value of the mean strain, the effect is stronger. Stress–strain curves according to the data in Table 2 are presented in Figure 5b. For mean strains equal to 0% and 0.2%, there are no significant differences in the values of stress–strain curve parameters.
In the simulation tests, the degree of accumulated fatigue damage was calculated for block loads consisting of three sequences with different values of mean strain. As a baseline, a sawtooth strain waveform was used, as shown in Figure 6, where the strain amplitude has a fixed value.
The mean strain values were adopted according to Table 2, i.e., εm1 = 0, εm2 = 0.2%, and εm3 = 0.4%. Each load block consisted of n1 = n2 = n3 = 1000 cycles. The strain amplitude was made to vary in the range εa = 0.2–0.60%. The fatigue life N was estimated by using the approximate relationship log(N) = −12.88·log(σa) − 36.38 on the basis of the data presented by Lei et al. [20].
For each level of the strain amplitude, the amplitude and mean value of the stress were calculated. Then, the fractional damage accumulation degree Di = ni/Ni was computed (i = 1, 2, and 3 for each block load sequence), where Ni is the expected fatigue life for the obtained stress state, assuming a constant-amplitude load. Then, the total degree of the damage accumulation was calculated as a sum of the partial degrees.
The calculations were made according to the algorithm in Table 1 for two cases:
-
Case A, where the change in K′ and n′ parameters was taken into account for different values of the mean strain em,
-
Case B, where the influence of mean strain em on the values of the coefficients K ‘and n′ was omitted, assuming their values to be em = 0.
In Table 3, the results of calculations obtained for Case A and Case B are listed. In the tables, indices 1, 2, and 3 refer to n1, n2, and n3 in Figure 6, while letters A and B refer to Cases A and B.
In the second simulation, the influence of mean strain on the change in n′ and K′ values was omitted in the calculations. Table 4 presents the results of these simulations.
In Figure 7, a comparison of the calculated degrees of damage accumulation for both cases is shown. In this figure, the ratio DiB/DiA of the partial degrees of fatigue damage and the ratio DB/DA of the total degree of fatigue damage for both cases are shown.
The dotted line, at level 1.0, denotes that the degrees of fatigue damage are the same for both cases and that the mean strain value has no effect. The chart indicates that, upon increasing the mean strain value, the calculation inaccuracy also increases, up to ±20% for the third part of the load sequence, where εm = 0.4%. Meanwhile, the ratio DB/DA of the total degree of fatigue damage varied from −10% to 3.5%. The biggest inaccuracies in fatigue life estimations were expected for stress states approaching the fatigue limit. Thus, under these conditions, the influence of mean strain value cannot be neglected.
Not much data exist for the problem analyzed above. Thus, it was necessary to perform an experiment to obtain Ramberg–Osgood curve parameters for different mean strains or stresses, thereby allowing the identification and evaluation of possible alternative combinations of these parameters. Taking into account the data for the analyzed material, an array of the coefficients is presented in Figure 8. It was also assumed that the cases in which the parameters K′ and n′ change according to the paths specified as Case S1 to Case S6 in Figure 8 would be analyzed. The line ABC in Figure 8, marked Study Case A, presents the previously analyzed Case A. For further simulations, this case was used as a reference.
The simulated Ramberg–Osgood graphs for Cases S1–S6 defined above are shown in Figure 9. The results of the simulations are presented in Figure 10. The graphs in Figure 10a–c shows cases where the cyclic strength coefficient K′ is independent of the mean strain, and the cyclic fatigue exponent n′ changes for each block sequence n1, n2, and n3 (see Figure 6) depending on the mean strain. By increasing the value of the K′ coefficient, it can be noted that the largest changes in relation to the reference case (Case A, Table 3) were observed for the third load sequence n3, where the mean strain value was the largest (εm = 0.4%). For K′ = 722.6 MPa, the ratio of the total degree of fatigue damage was D/DA = 1.5–17, which gives a good approximation to the reference case. In the case of K′ = 587.7 MPa, the accumulated fatigue damage was four times smaller than the reference value.
The graphs in Figure 10d–f show the opposite situation. Here, it was assumed that the coefficient n′ is independent of the mean strain, while K′ decreases with increasing mean strain values in sequences n1, n2, and n3.
It can be seen that the best results of calculations in relation to the reference Case A were obtained when n′ = 0.1507 for ratios of both the total degree of fatigue damage (D/DA = 0.9–1.04) and the partial degrees of fatigue damage. Decreasing the value of n′ for cases S5 and S6 caused a decrease in the effect on the accumulation of fatigue damage for the n3 block sequence (εm = 0.4%). For the S5 sequence, the total damage ratio was determined to be D/DA = 1.1–1.3, whereas, for Case S6, this ratio was D/DA = 7.5–8.0.

4. Summary and Conclusions

This paper presented the results of simulation tests of block loads with a nonzero mean strain value. The calculations were made using an algorithmic method, which took into account the changes in the cyclic strain curve parameters depending on the mean strain value. The calculations were made on the basis of research available in the literature on AISI 316 steel. The material response for various combinations of cyclic strength coefficient K′ and cyclic fatigue exponent n′ was analyzed. According to the results, the following conclusions can be drawn:
-
When neglecting the effect of the mean strain value on the K′ and n′ parameters and considering only the parameters of the cyclic deformation curve for εm = 0 (symmetric loads), the ratio of the total degree of fatigue damage varied from 10% for εa = 0.2% to 3.5% for εa = 0.6%. The largest differences in the calculation of the ratio of the partial degrees of fatigue damage in relation to the reference case were observed for sequence block n3, where εm = 0.4%.
-
When assuming the independence of parameter K′ from the mean strain value, the worst calculation results in relation to the reference Case A were obtained for K′ = 587.7 MPa, where the total degree of fatigue damage was, on average, four times lower than the reference case. For these simulations, the largest calculation inaccuracy was also related to the n3 block load sequence, where the mean strain value was the largest (0.4%).
-
When considering the independence of parameter n′ from the mean strain value, the best results in terms of the degree of fatigue damage calculation were achieved for n′ = 0.1507 (obtained for a symmetric load, εm = 0). The differences in the ratios of partial and total degrees of fatigue damage compared to the reference case were in the range of −20% to 4%. Similar results were obtained for Case B, where parameters K′ and n′ characterized the cyclic strain curve for symmetric loads.
-
It can be concluded that the third sequence n3, where the biggest mean strain value was applied (εm = 0.4%), led to the largest inaccuracy. A higher value of mean strains, thus, increases the sensitivity of the algorithm toward applied parameters K′ and n′.

Author Contributions

Conceptualization, R.P.; methodology, R.P. and T.L.; formal analysis, R.P. and T.L.; investigation, R.P.; writing—original draft preparation, R.P. All authors have read and agreed to the published version of the manuscript.

Funding

This research received no external funding.

Institutional Review Board Statement

Not applicable.

Informed Consent Statement

Not applicable.

Data Availability Statement

Data sharing is not applicable to this article.

Conflicts of Interest

The authors declare no conflict of interest.

References

  1. Mrozinski, S.; Piotrowski, M. Effect of strain level on cyclic properties of S355 steel. AIP Conf. Proc. 2016, 1780, 020005. [Google Scholar]
  2. Golanski, G.; Mrozinski, S. Low cycle fatigue and cyclic softening behaviour of martensitic cast steel. Eng. Fail. Anal. 2013, 35, 692–702. [Google Scholar] [CrossRef]
  3. Jiang, Y.; Kurath, P. Characteristics of the Armstrong-Frederick type plasticity models. Int. J. Plast. 1996, 12, 387–415. [Google Scholar] [CrossRef]
  4. Jiang, Y.; Sehitoglu, H. Comments on the Mróz multiple surface type plasticity models. Int. J. Solids Struct. 1996, 33, 1053–1068. [Google Scholar] [CrossRef]
  5. Meggiolaro, M.; Castro, J.; Wu, H. On the applicability of multi-surface, two-surface and non-linear kinematic hardening models in multiaxial fatigue. Fract. Struct. Integr. 2015, 33, 357–367. [Google Scholar]
  6. Garud, Y. A new approach to the evaluation of fatigue under multiaxial loadings. J. Press. Vessel Technol. 1981, 103, 118–125. [Google Scholar] [CrossRef]
  7. Manson, S.; Halford, G. Practical implementation of the double linear damage rule and damage curve approach for treating cumulative fatigue damage. Int. J. Fract. 1981, 17, 169–192. [Google Scholar] [CrossRef] [Green Version]
  8. Fatemi, A.; Yang, L. Cumulative fatigue damage and life prediction theories: A survey of the state of the art for homogeneous materials. Int. J. Fatigue. 1998, 20, 9–34. [Google Scholar] [CrossRef]
  9. Zhiqiang, L. A modified nonlinear fatigue damage accumulation model. Int. J. Damage Mech. 2015, 24, 168–181. [Google Scholar]
  10. Mrozinski, S. Energy-based method of fatigue damage cumulation. Int. J. Fatigue 2019, 121, 73–83. [Google Scholar] [CrossRef]
  11. Bohm, E.; Kurek, M.; Łagoda, T.; Łagoda, K. The use a power law function for fatigue life estimation for block loads. Solid State Phenom. 2016, 250, 1–9. [Google Scholar] [CrossRef]
  12. Bohm, E.; Kurek, M.; Łagoda, T. Fatigue Damage Accumulation Model of 6082-T6 Aluminum Alloy in Conditions of Block Bending and Torsion. J. Test. Eval. 2019, 48, 4416–4434. [Google Scholar] [CrossRef]
  13. Memon, I.; Zhang, X.; Cui, D. Fatigue life prediction of 3-D problems by damage mechanics with two-block loading. Int. J. Fatigue 2002, 24, 9–37. [Google Scholar]
  14. Gołos, K.; Debski, D. The influence of mean strain under two-step High-Low loading on cumulative fatigue damage in St5 steel. Mach. Dyn. Res. 2013, 37, 35-41. [Google Scholar]
  15. Pawliczek, R. Influence of the mean load value in fatigue block loading on strains. Key Eng. Mater. 2014, 598, 195–200. [Google Scholar] [CrossRef]
  16. Pawliczek, R.; Prazmowski, M. Study on material property changes of mild steel S355 caused by block loads with varying mean stress. Int. J. Fatigue 2015, 80, 171–177. [Google Scholar] [CrossRef]
  17. Pawliczek, R.; Lachowicz, C. Modelling of the stress-strain relationship for specimens made of S355J0 steel subjected to bending block loading with mean load. Fract. Struct. Integr. 2017, 42, 30–39. [Google Scholar]
  18. Pawliczek, R. Evaluation of fatigue damage degree for specimens made of S355J0 steel subjected to bending block loads with mean load value. AIP Conf. Proc. 2018, 2028, 020015. [Google Scholar]
  19. Chiou, Y.; Yip, M. Effect of mean strain level on the cyclic stress-strain behaviour of AISI 316 stainless steel. Mater. Sci. Eng. 2003, A354, 270–278. [Google Scholar] [CrossRef]
  20. Lei, H.; Akebono, H.; Kato, M.; Sugeta, A. Fatigue life prediction method for AISI 316 stainless steel under variable-amplitude loading considering low-amplitude loading below the endurance limit in the ultrahigh cycle regime. Int. J. Fatigue 2017, 101, 18–26. [Google Scholar]
Figure 1. The scheme of block loads.
Materials 14 02738 g001
Figure 2. Nonlinear model of fatigue failure accumulation for Lo/Hi sequence and Hi/Lo sequence.
Materials 14 02738 g002
Figure 3. Hysteresis loop model with mean load.
Materials 14 02738 g003
Figure 4. Interpretation of mean strain due to new load sequence.
Materials 14 02738 g004
Figure 5. Mean strain effect on cyclic stress–strain curves: (a) Changes in the coefficients K′ and n′; (b) plastic region of stress–strain curves.
Materials 14 02738 g005
Figure 6. Time sequence of the simulated strains.
Materials 14 02738 g006
Figure 7. The ratio DiB/DiA of the partial degrees of fatigue damage and the ratio DB/DA of the total degree of fatigue damage.
Materials 14 02738 g007
Figure 8. Graph of parameters for simulation cases.
Materials 14 02738 g008
Figure 9. Simulated Ramberg–Osgood graphs.
Materials 14 02738 g009
Figure 10. Simulation results for Cases S1–S6. (a) Results for Case S1, K′ = 722.6 MPa; (b) Results for Case S2, K′ = 693.1 MPa; (c) Results for Case S3, K′ = 587.7 MPa; (d) Results for Case S4, n′ = 0.1507; (e) Results for Case S5, n′ = 0.1424; (f) Results for Case S6, n′ = 0.1170.
Materials 14 02738 g010
Table 1. Algorithm to calculate the stress history.
Step No.Description of OperationEquation
1.Material properties:
E, Young’s modulus; K′, cyclic strength coefficient; n′, cyclic strain-hardening exponent.
2.Input data: εA, εB, εa, and εm
3.alculation of σA for given K′ and n′ (*) ε a = σ A E + ( σ A K ) 1 n
(*) Values of the coefficients K′ and n′ depend on the current values of the average strain εm. However, this requires additional tests to determine the functions K′ = f (εm) and n′ = f (εm).
4.alculation of εApl ε A p l = ε A σ A E
5.alculation of σa for given K and n obtained for εm = 0 ε a = σ a E + ( σ a K ) 1 n
6.alculation of εapl ε a p l = ε a σ a E
7.Calculation of mean stress σm σ m = E ( ε m i z + ε a p   ε A p l )
i refers to the next load sequence
8.Resulting parameters (σa, σm)
Table 2. K′ and n′ factors for different mean strain levels.
εm (%)00.20.4
K′ (MPa)722.6693.1587.7
n0.15070.14240.117
Table 3. Case A: Result of simulation considering the effect of mean strain.
εaσa1
(MPa)
σa2
(MPa)
σm2
(MPa)
σa3
(MPa)
σm3
(MPa)
D1AD2AD3ADA
0.0020246249325370.00260.00280.00320.0086
0.0030275278327720.01090.01170.01150.0341
0.00402942962292−20.02580.02700.02480.0776
0.00503083091303−50.04700.04800.04260.1376
0.00603193201312−70.07390.07530.06500.2142
Table 4. Case B: Result of simulation with the effect of mean strain omitted.
εaσa1
(MPa)
σa2
(MPa)
σm2
(MPa)
σa3
(MPa)
σm3
(MPa)
D1BD2BD3BDB
0.0020246246024600.00260.00260.00260.0078
0.0030275275027500.01090.01090.01090.0328
0.0040294294029400.02580.02580.02580.0775
0.0050308308030800.04700.04700.04700.1411
0.0060319319031900.07390.07390.07390.2218
Publisher’s Note: MDPI stays neutral with regard to jurisdictional claims in published maps and institutional affiliations.