
Effect of Incorporating Polyvinyl Alcohol Fiber on the Mechanical Properties of EICP-Treated Sand

Abstract
:
1. Introduction
2. Materials and Methods
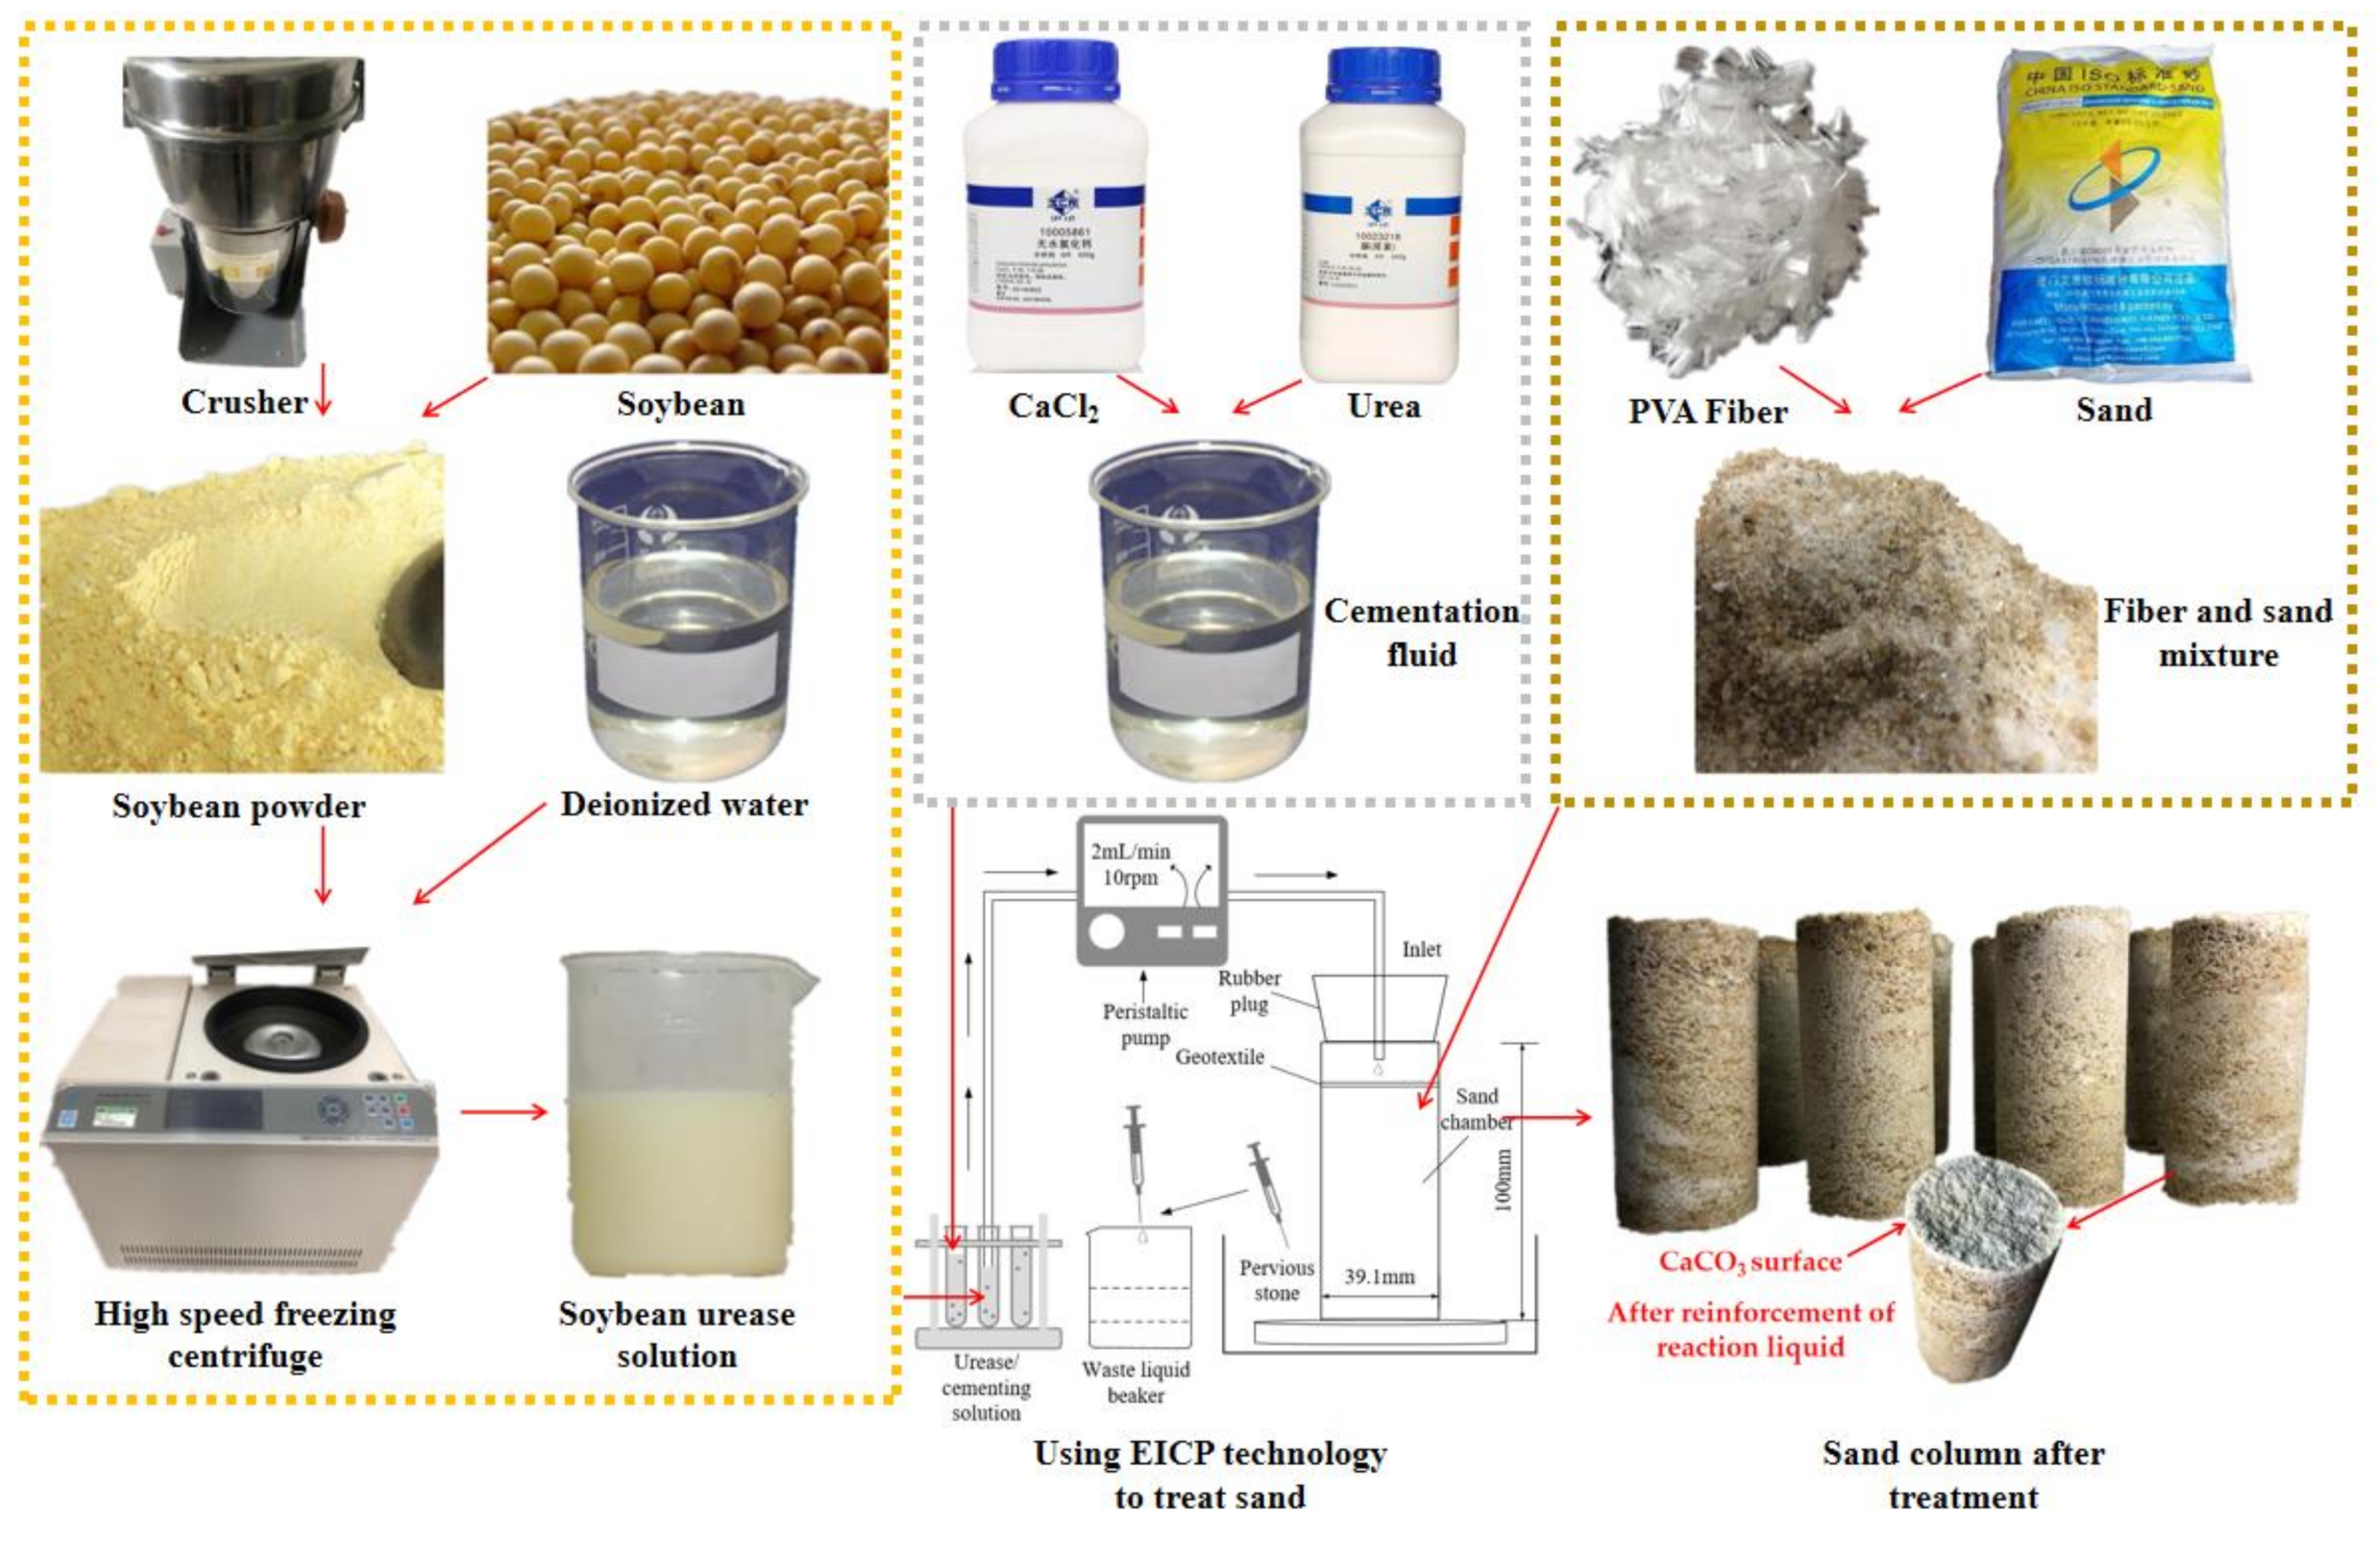
2.1. Materials
2.2. Specimen Preparation
2.3. Tests and Methods
2.3.1. UCS Test
2.3.2. CCC
2.3.3. Microscopic Test
3. Results
4. Discussion
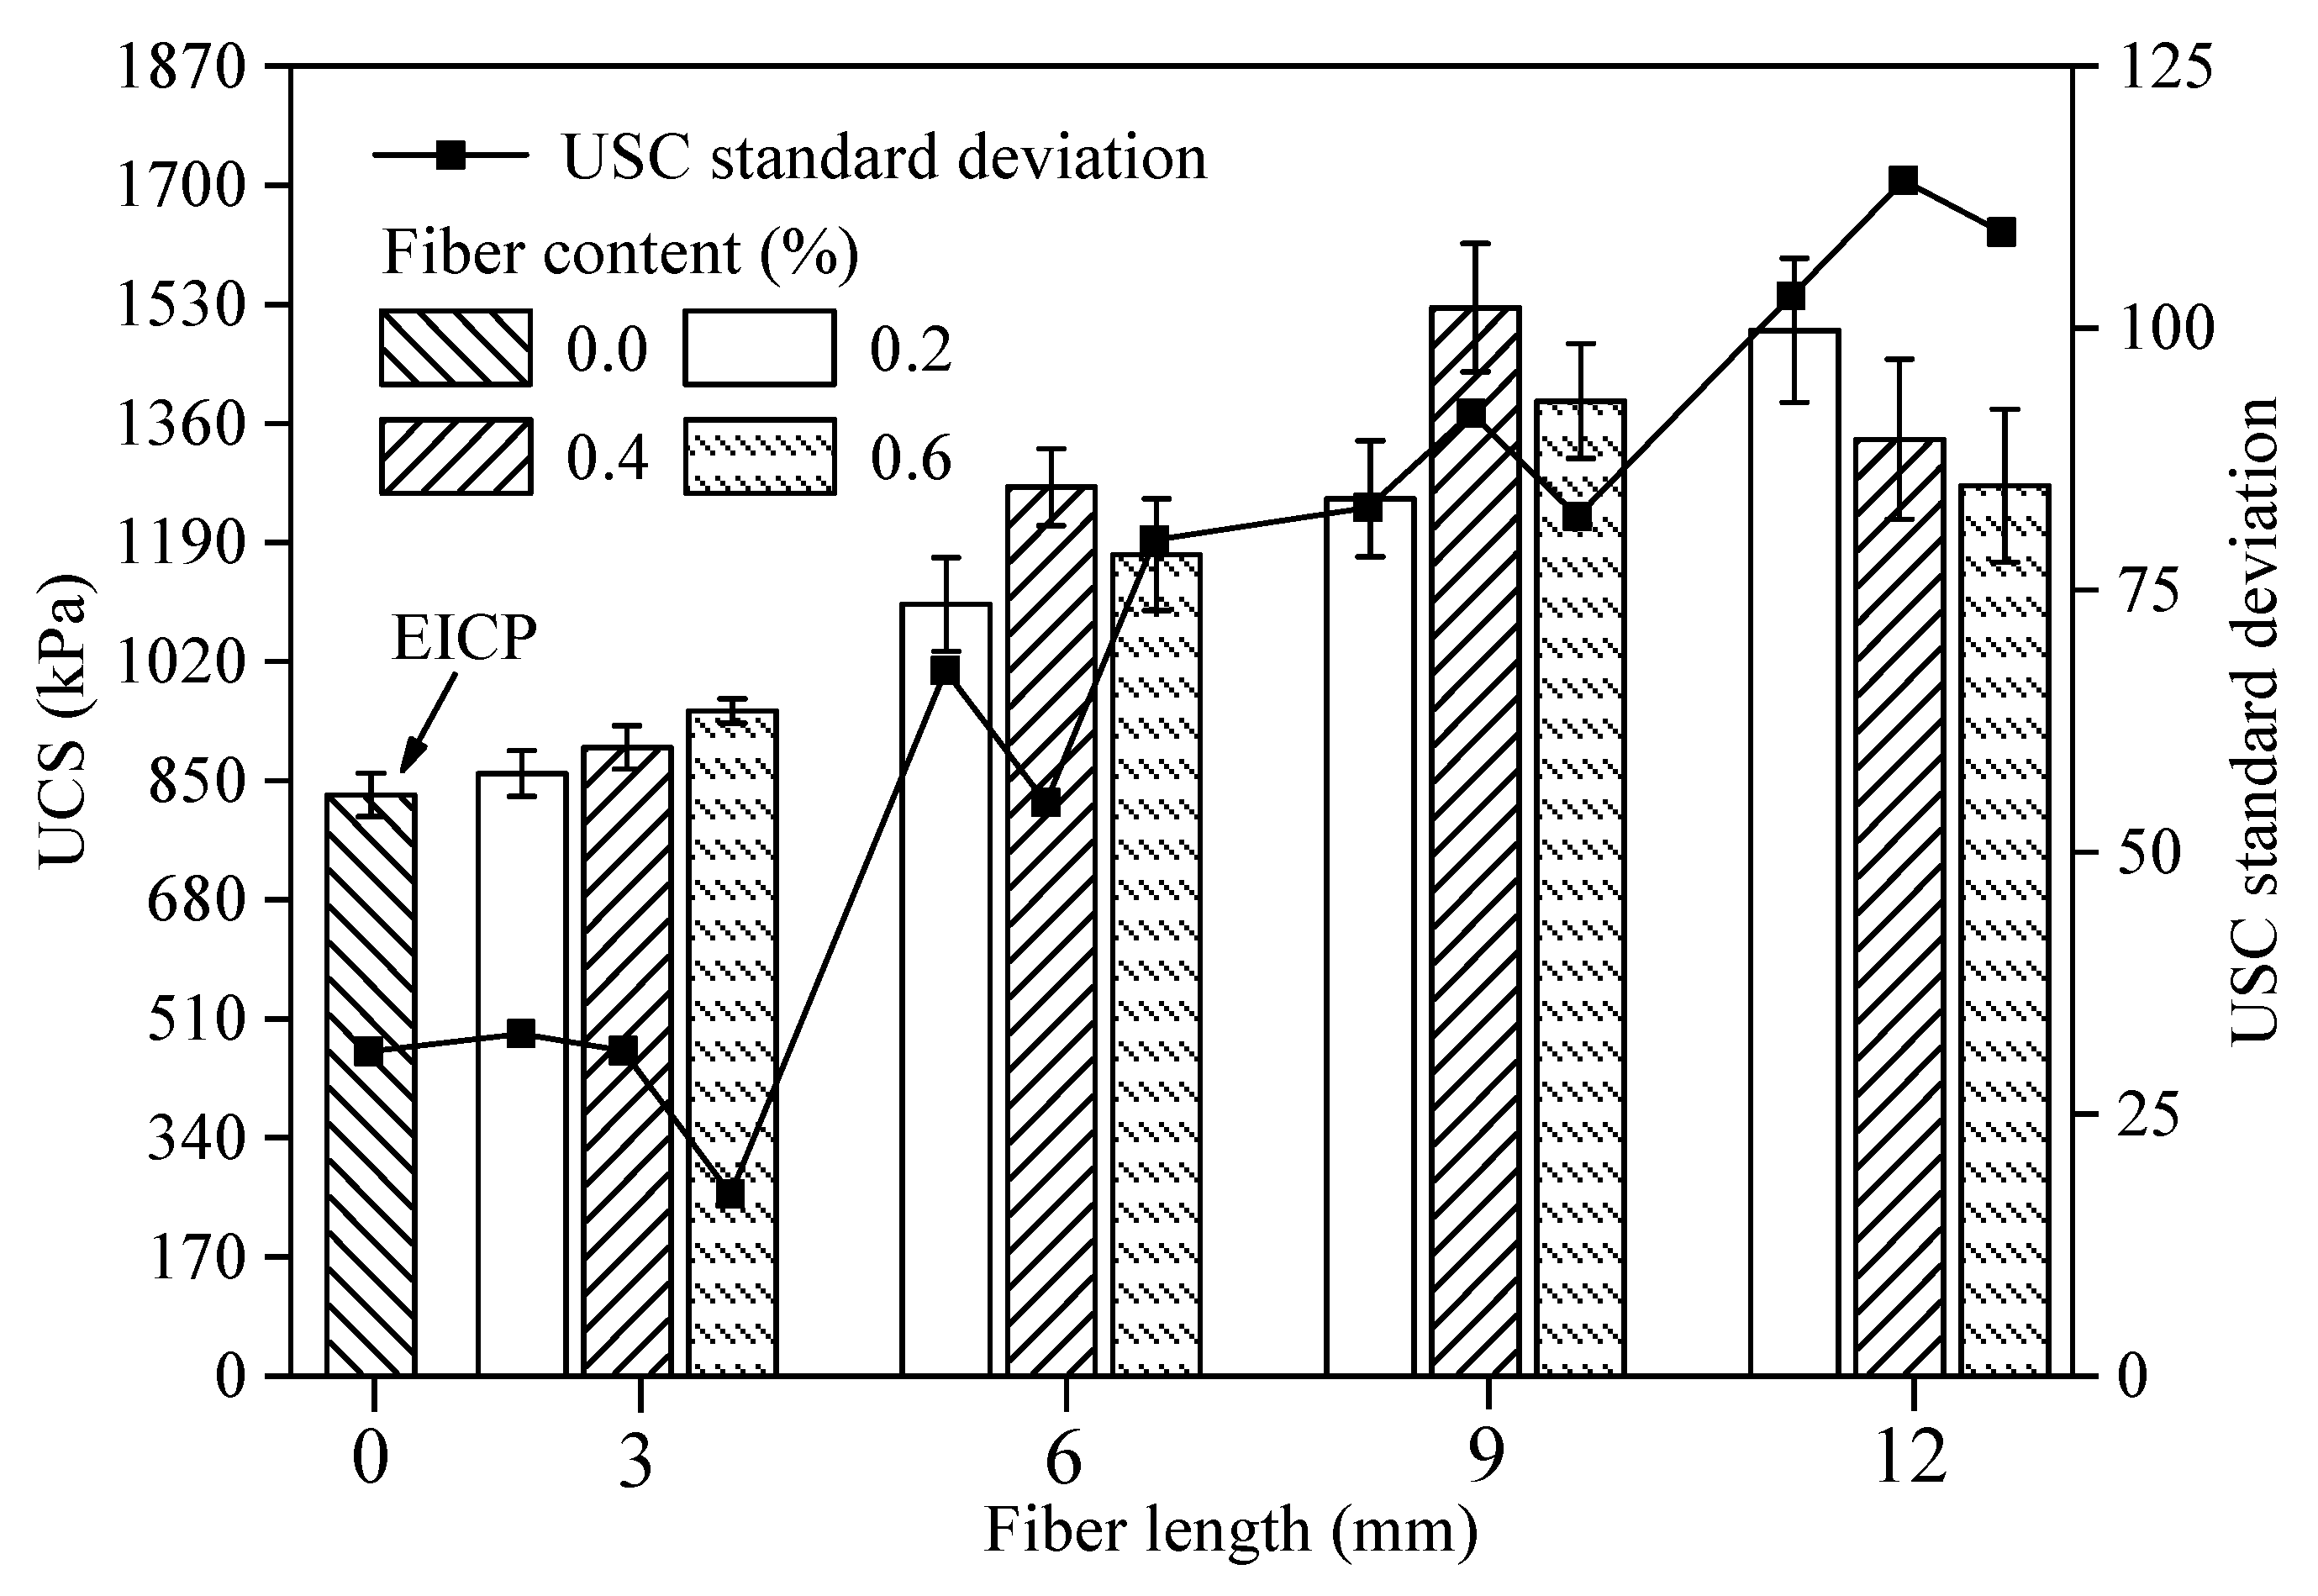
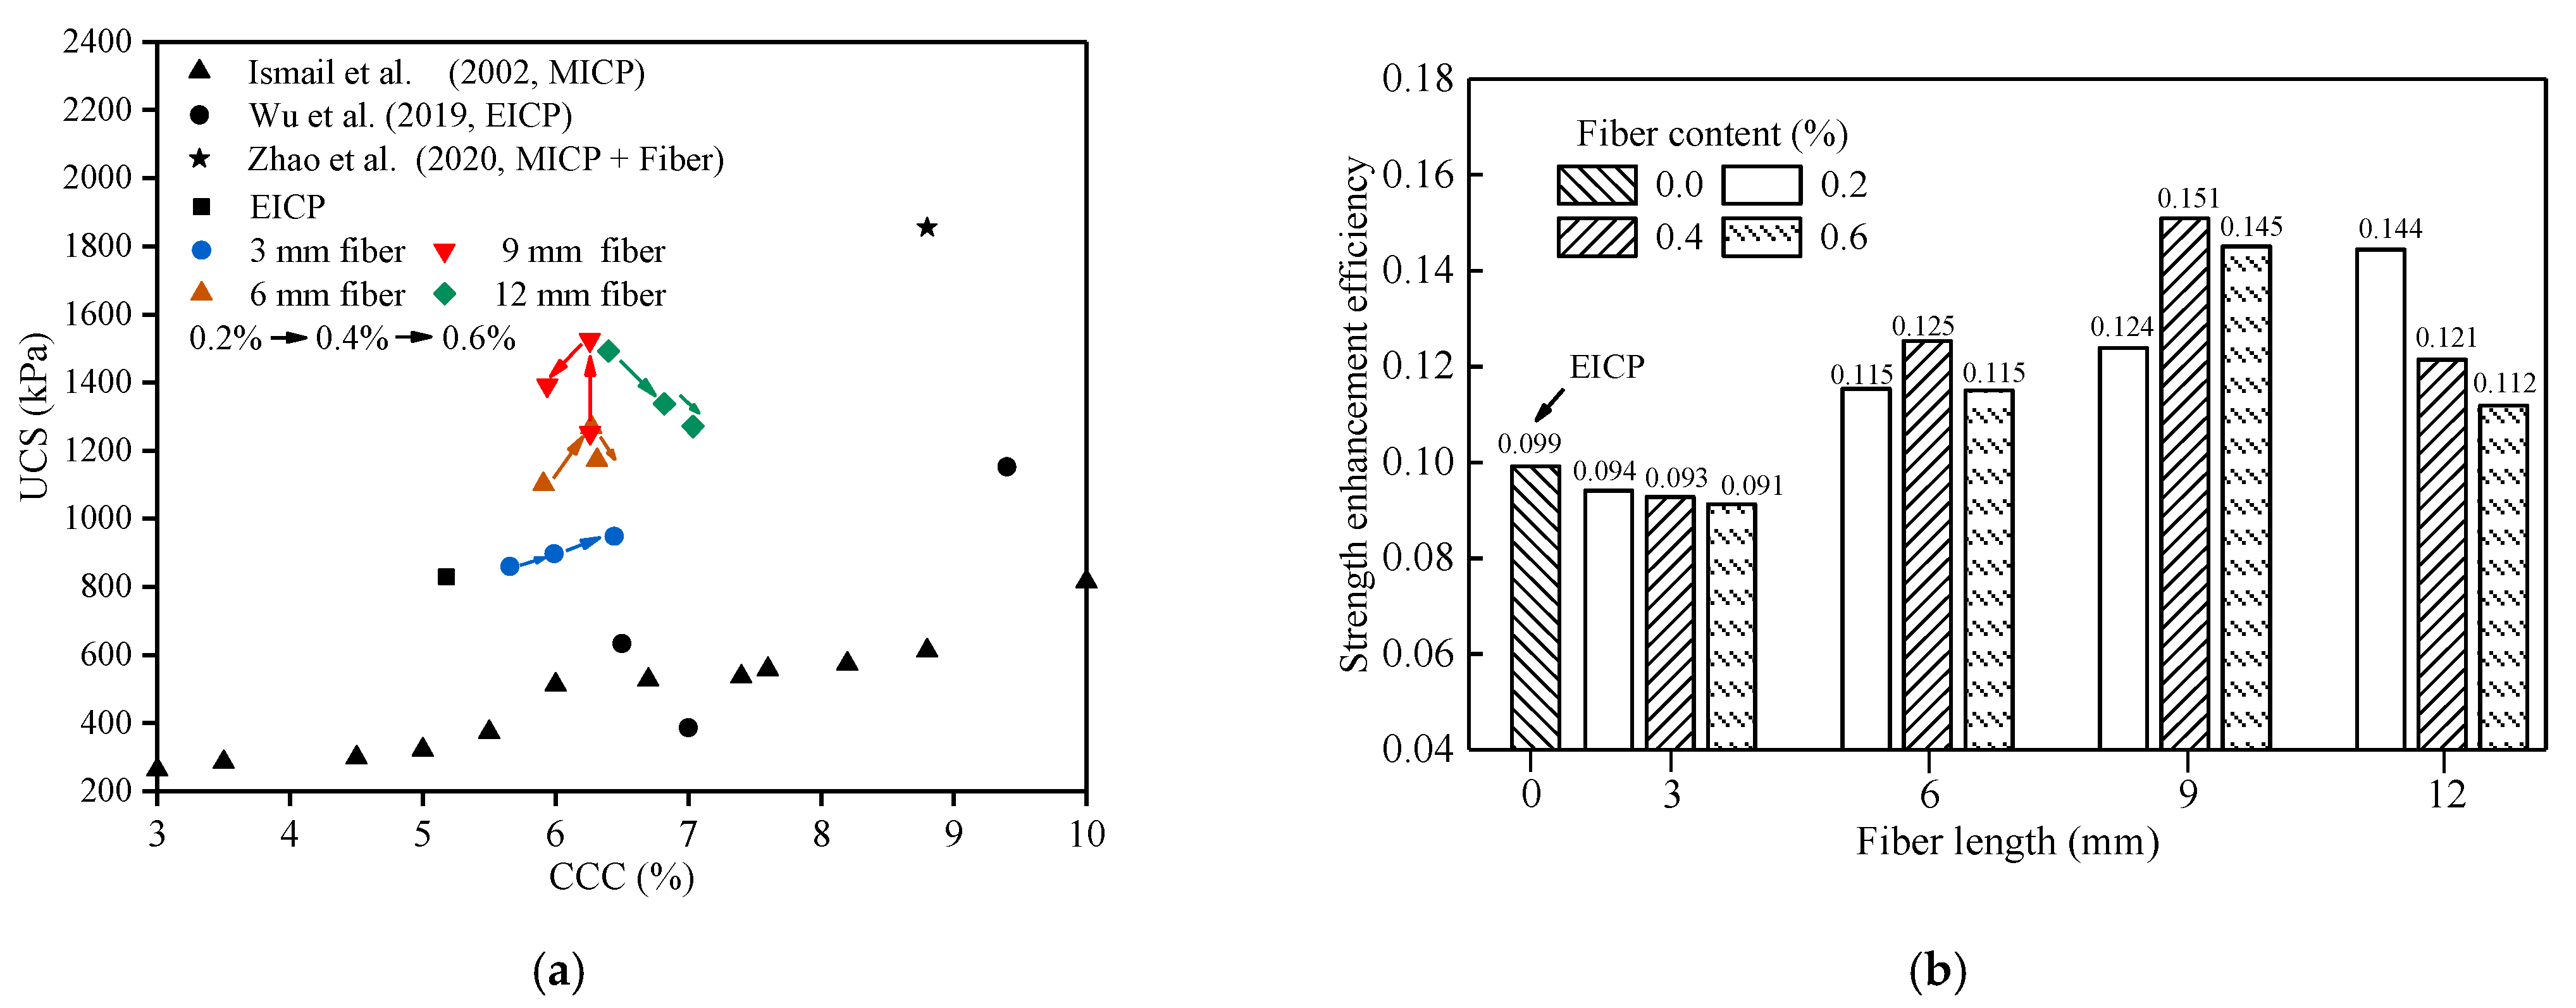
4.1. UCS
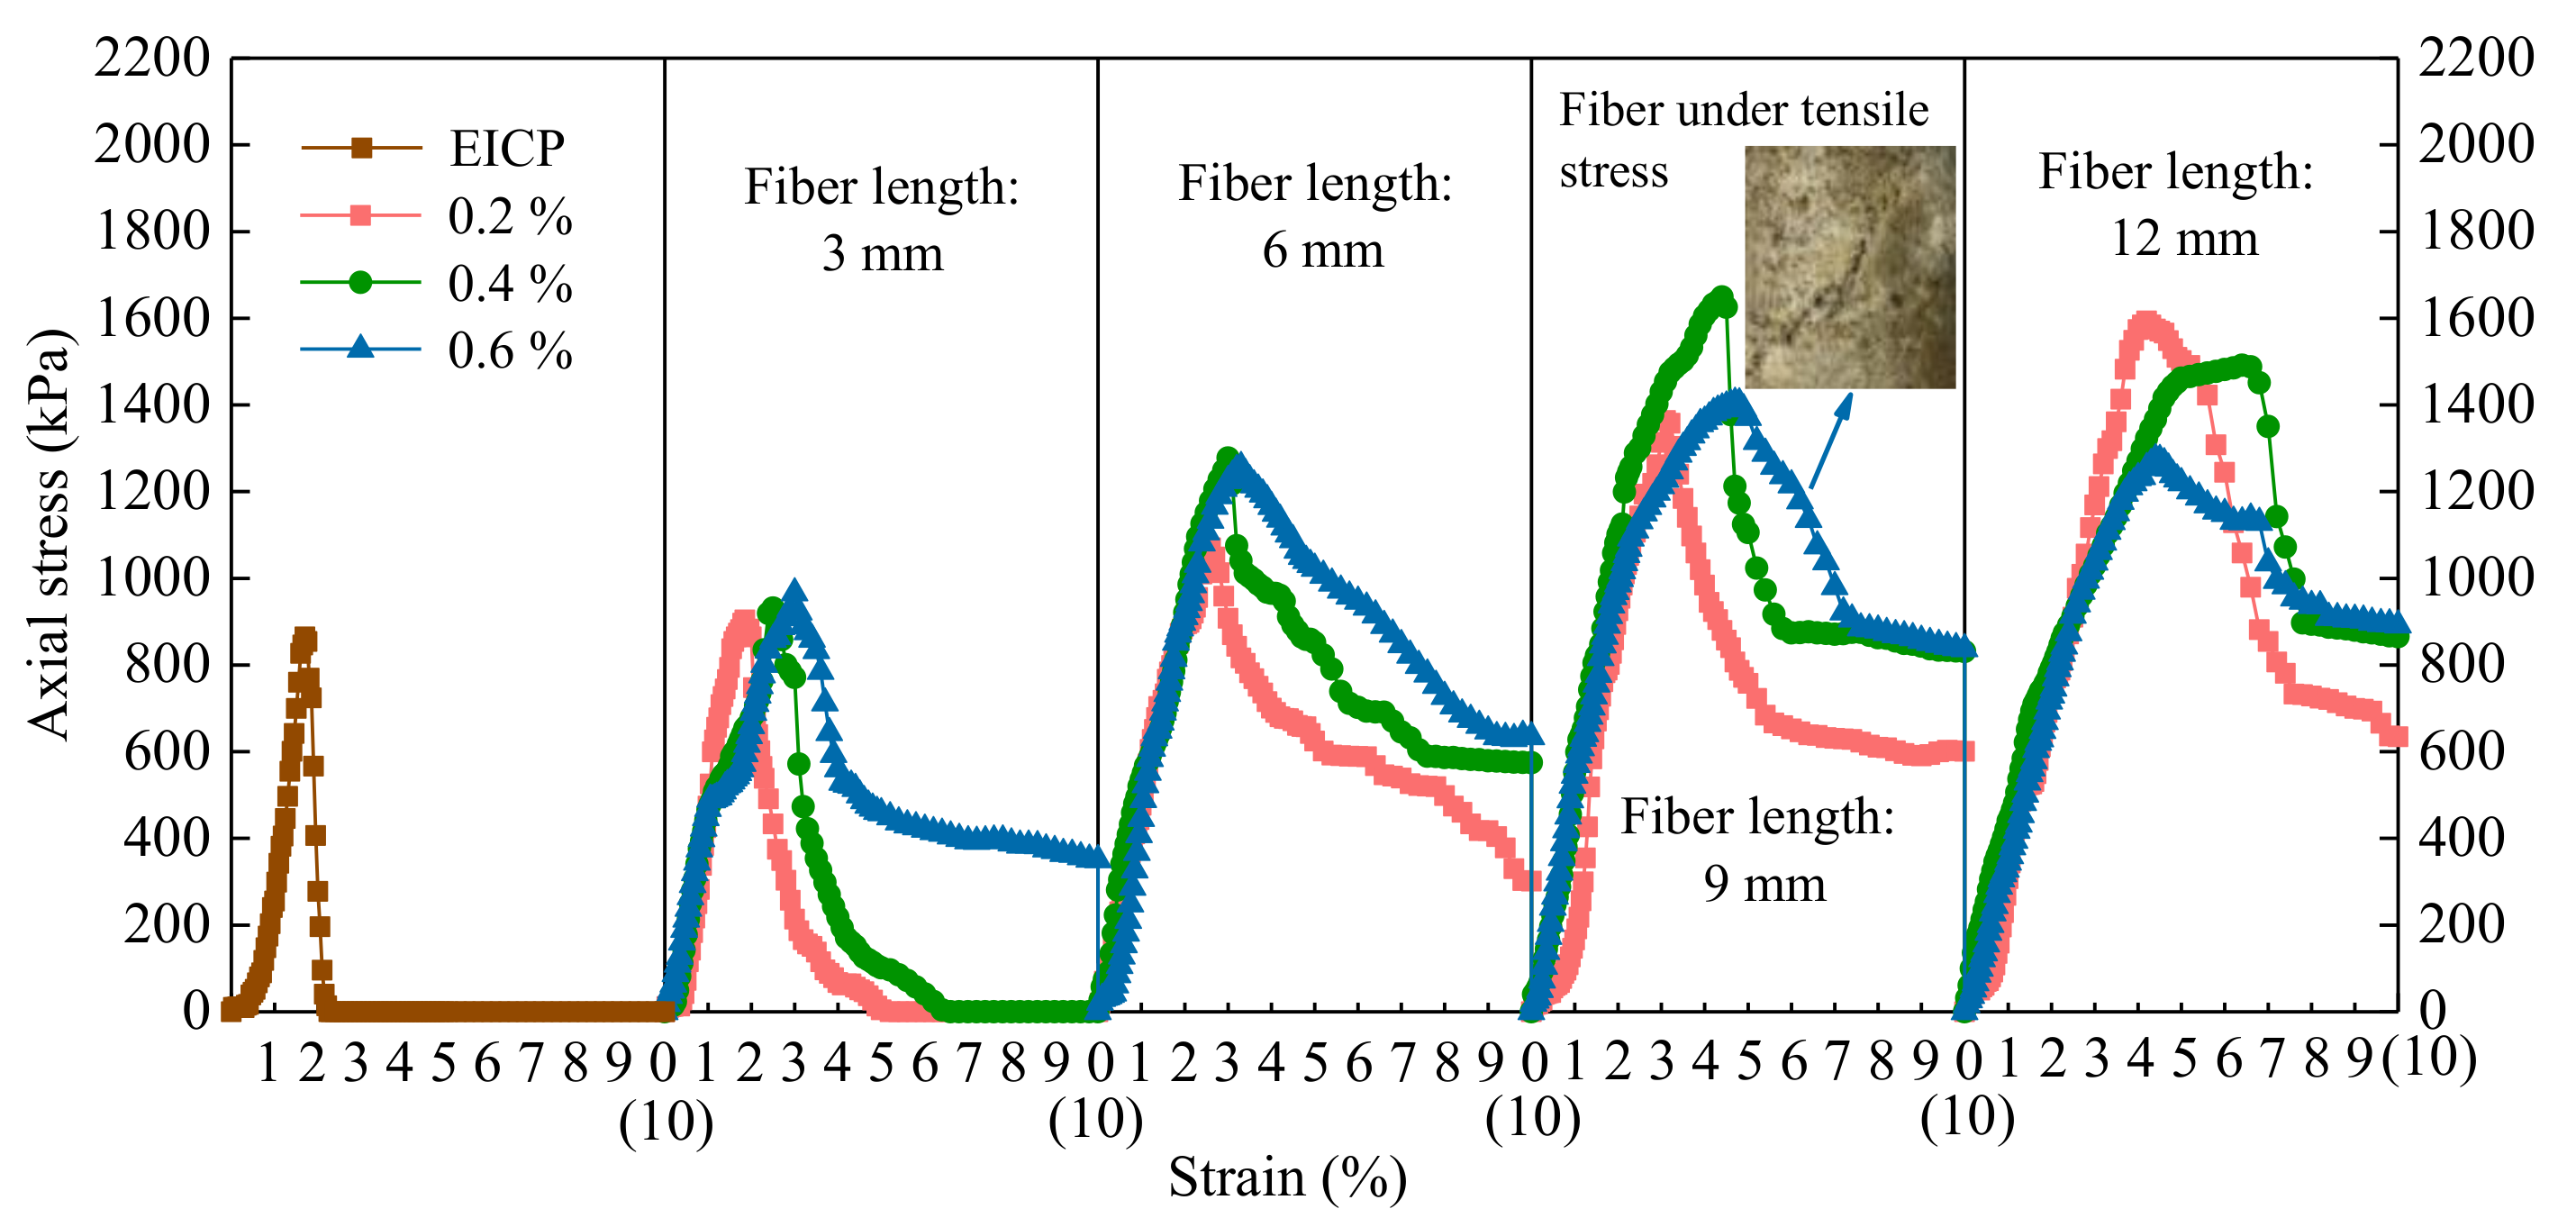
4.2. Stiffness
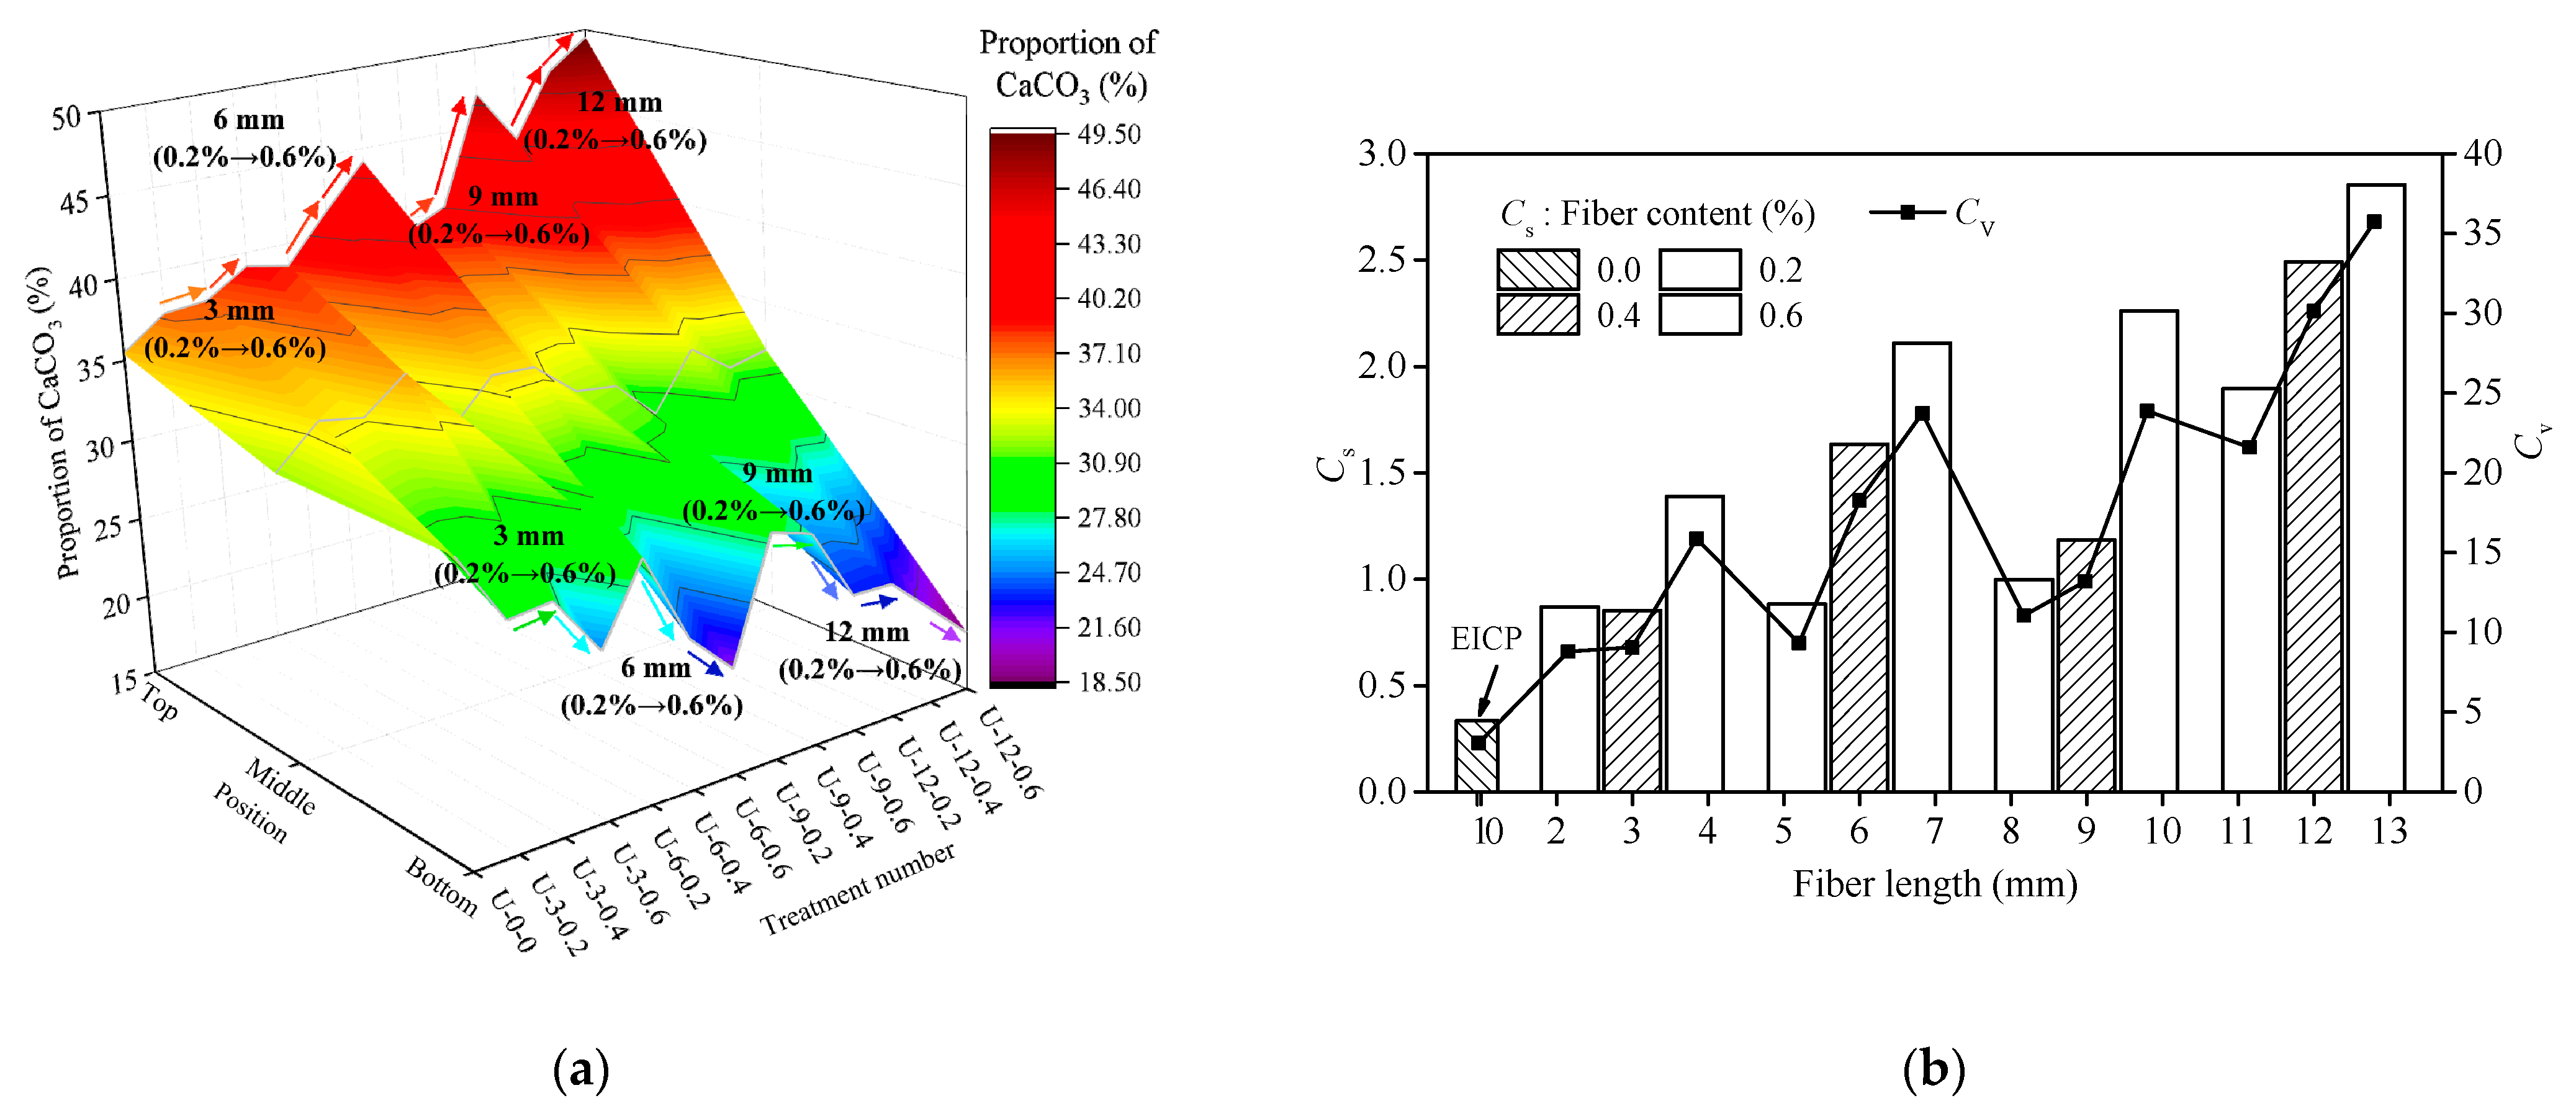
4.3. CCC and Its Spatial Distribution
4.4. Relationship between UCS and CCC
4.5. Microstructures
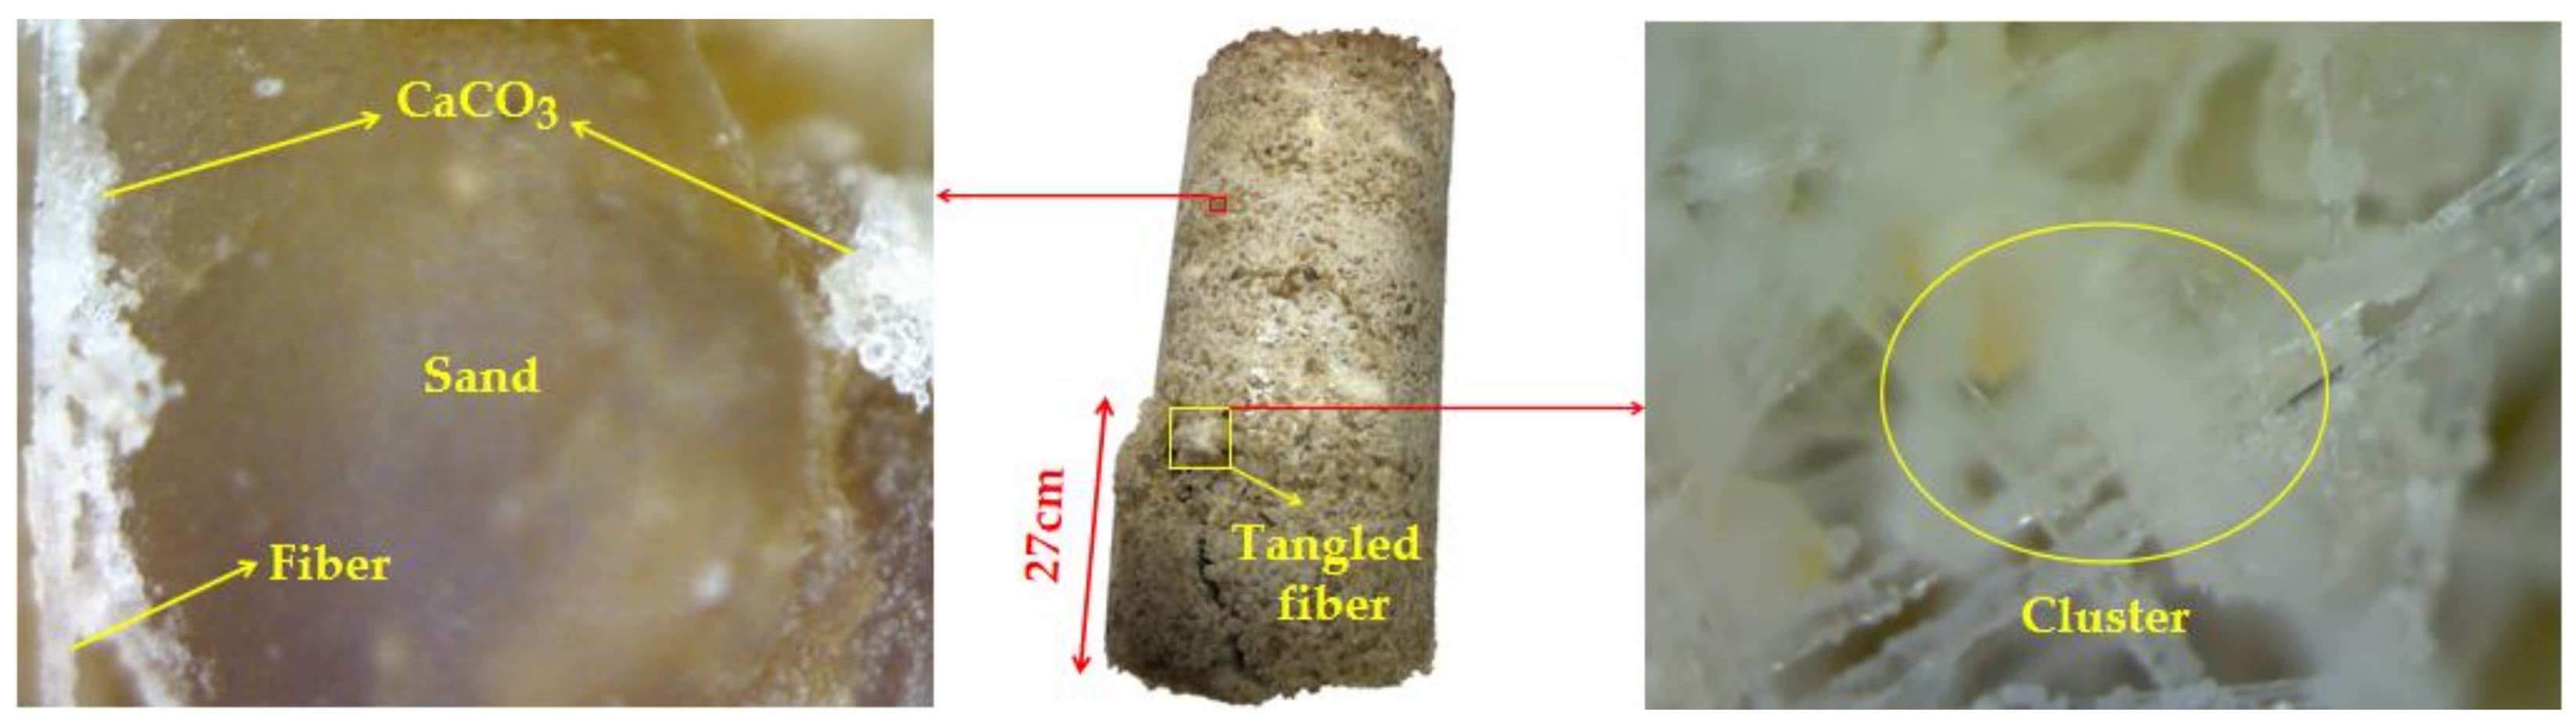
4.5.1. USB Handheld Microscope
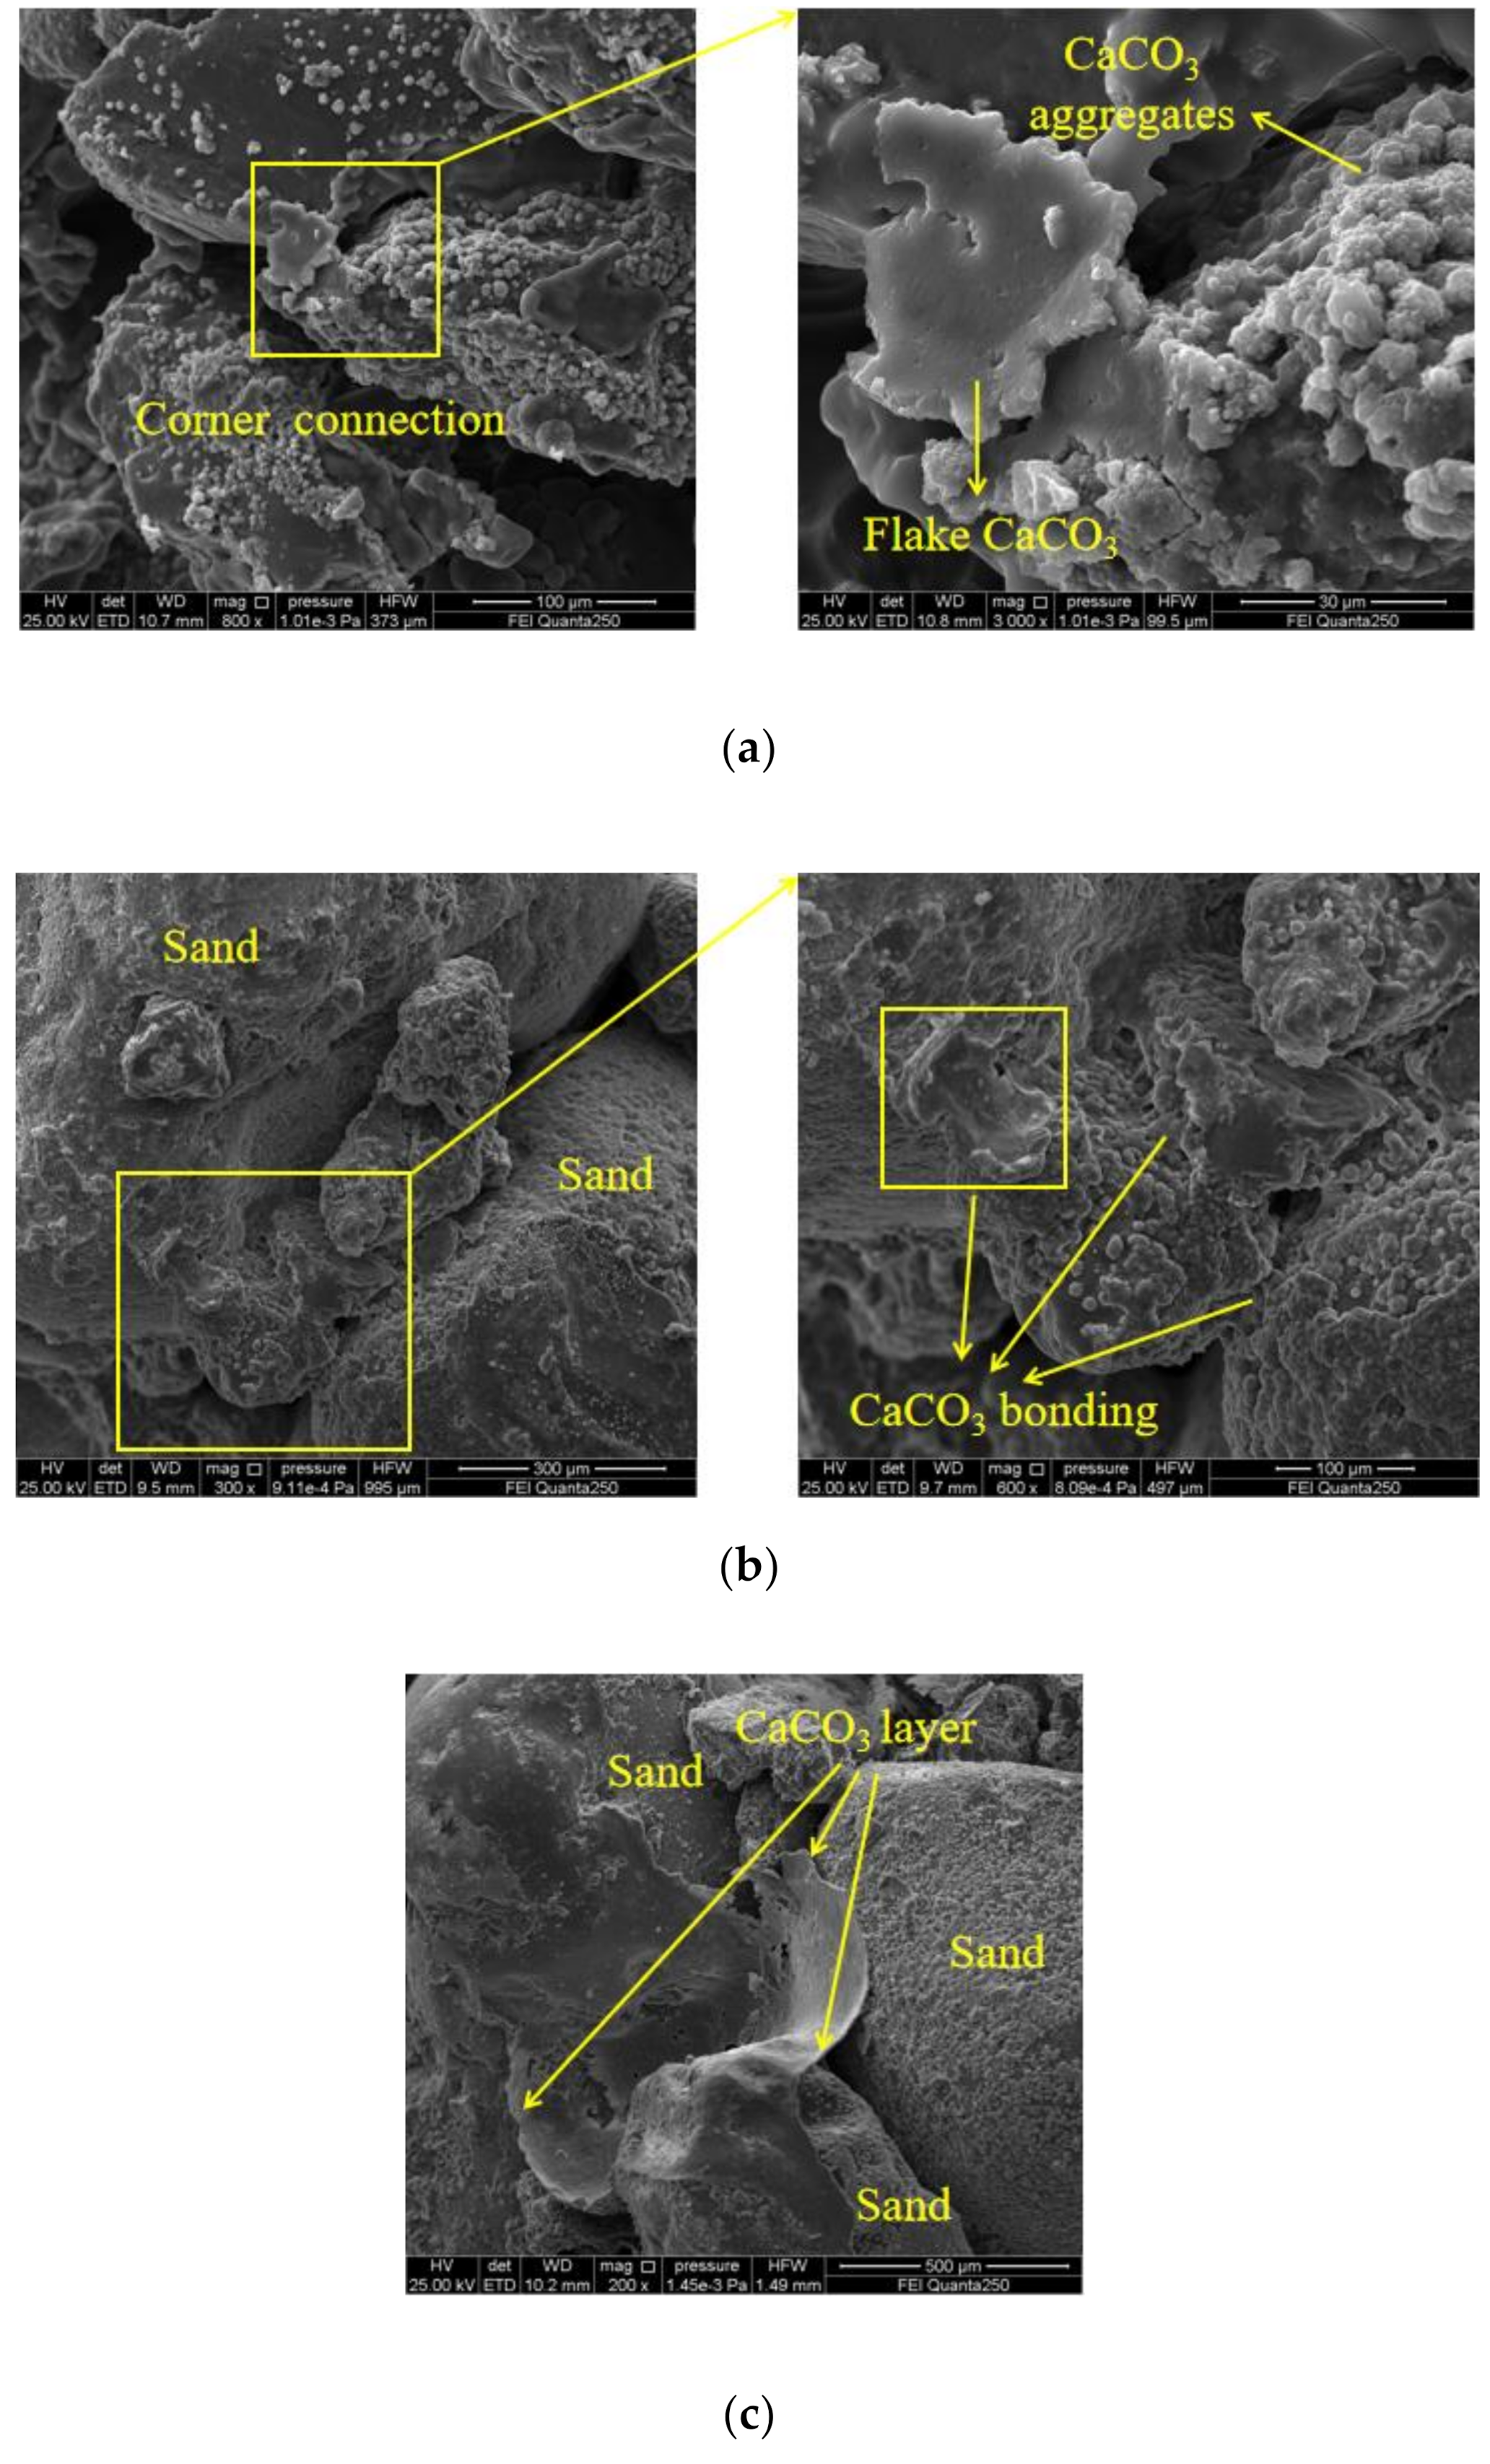
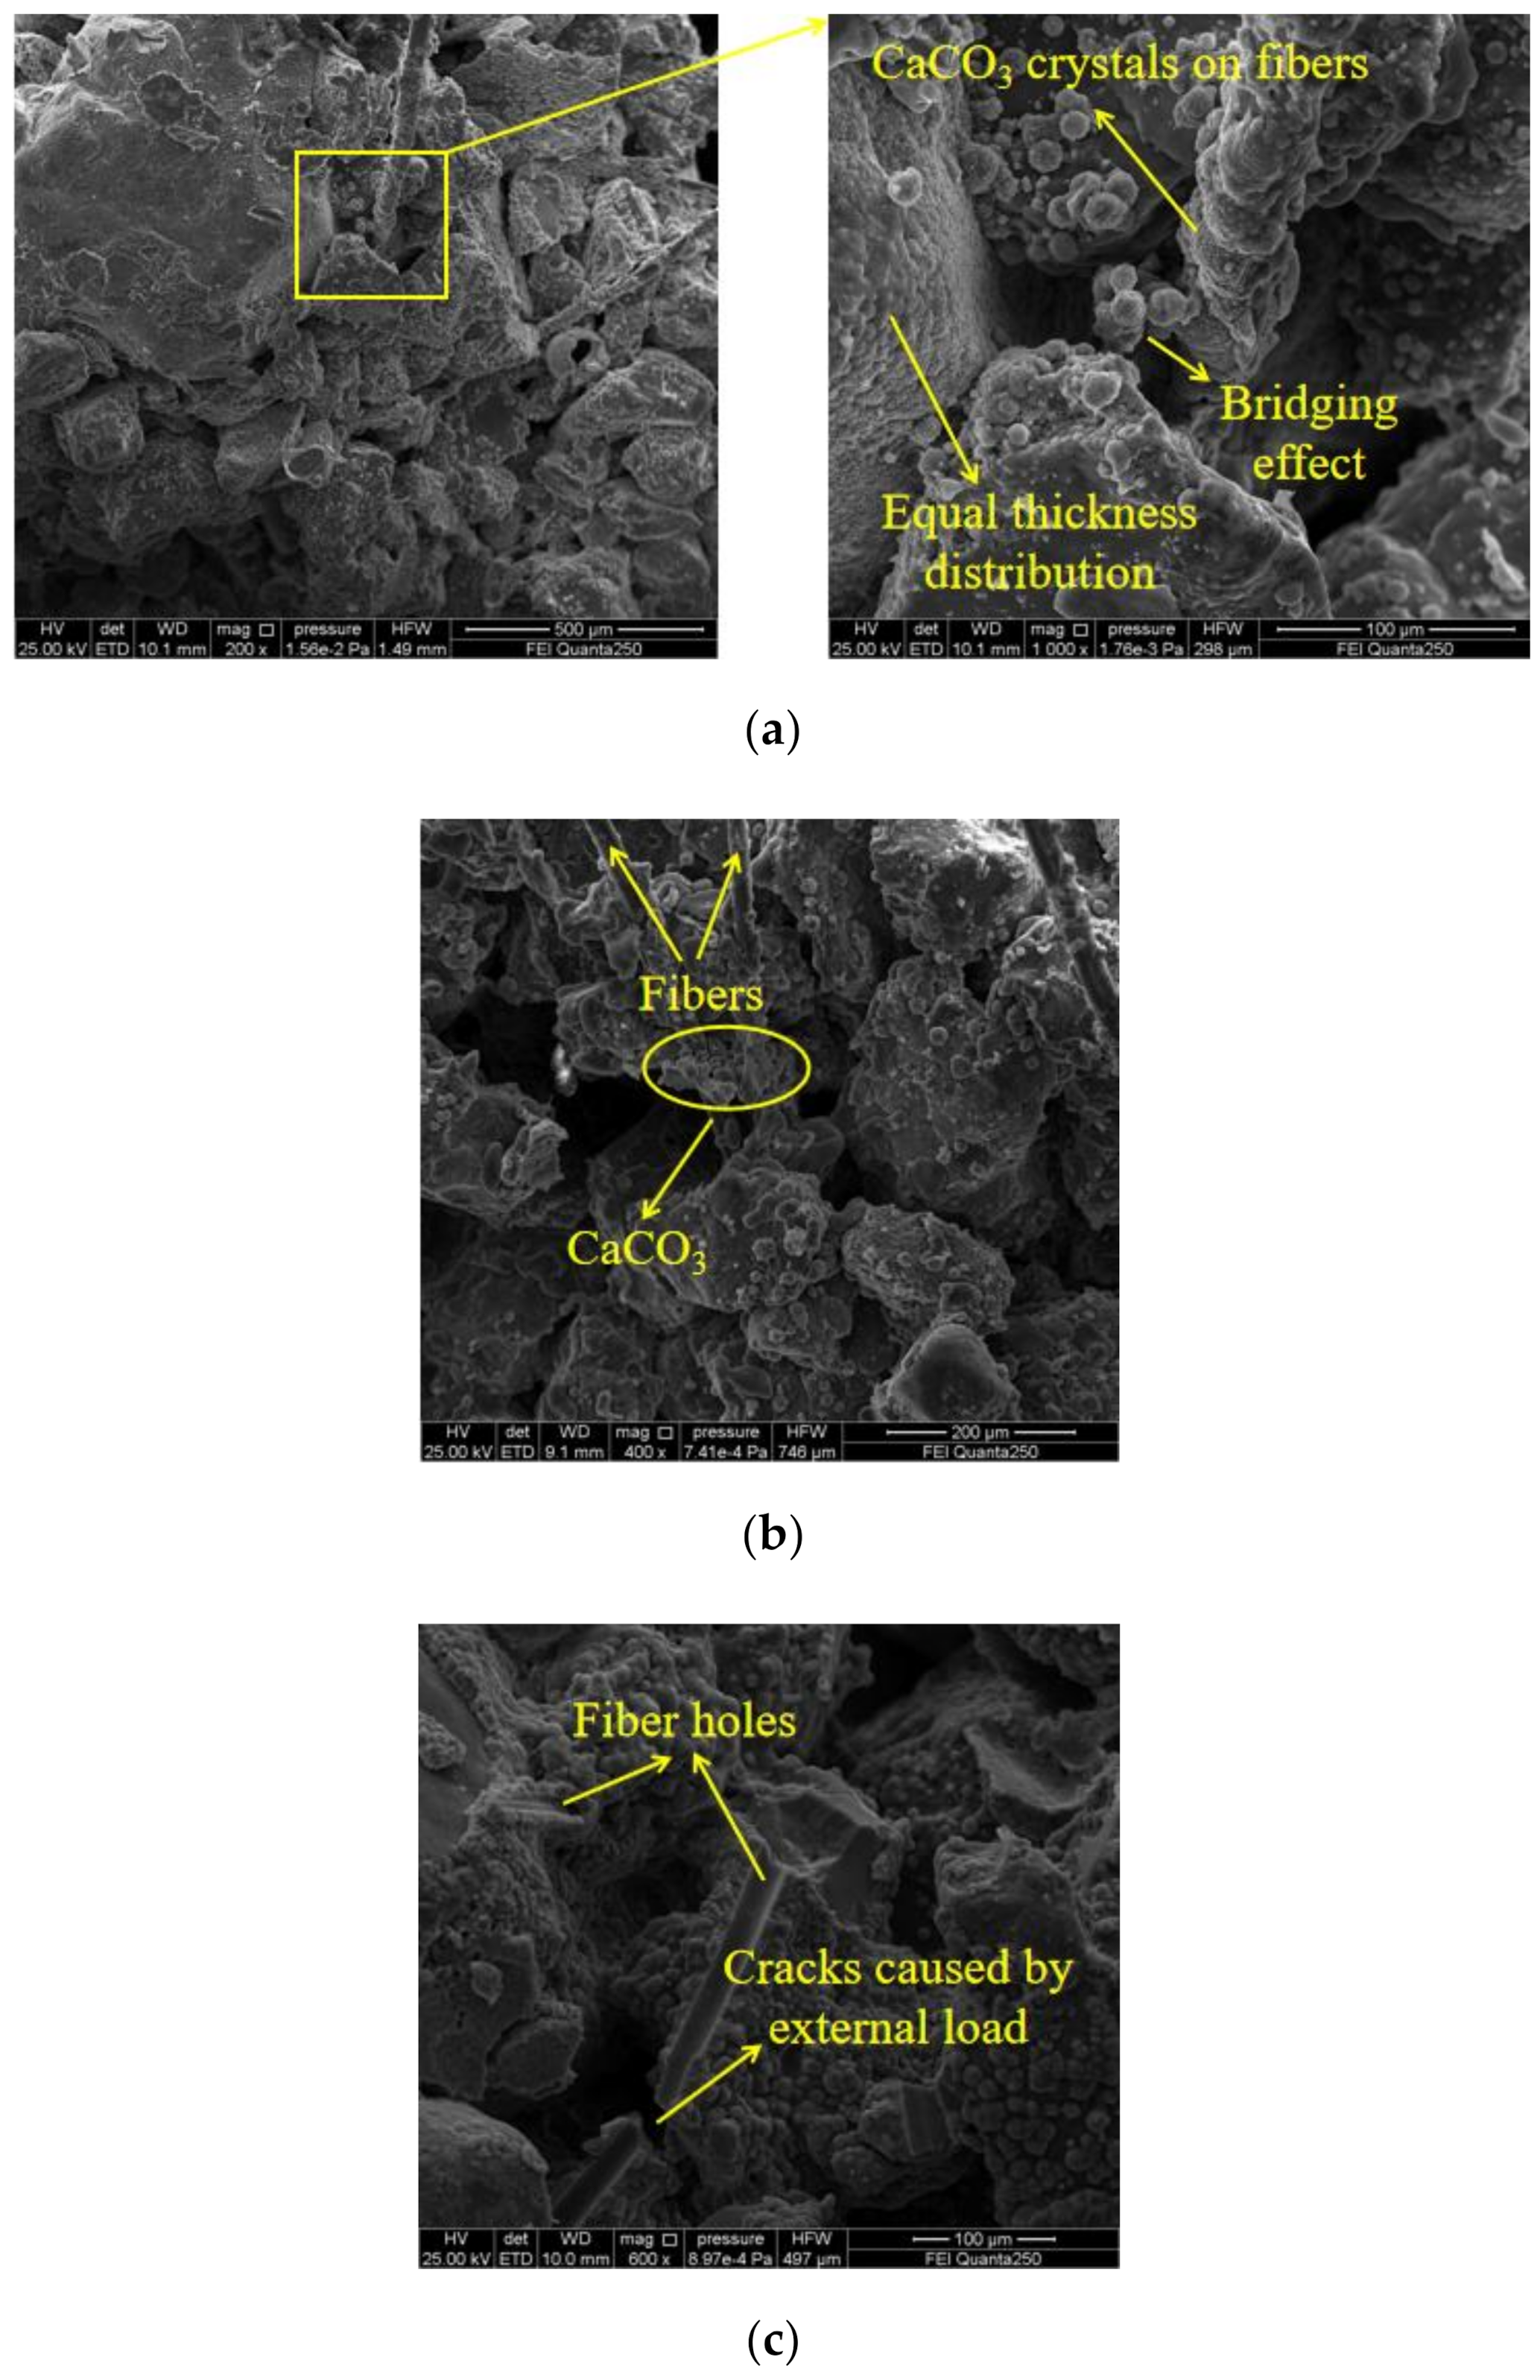
4.5.2. SEM
5. Conclusions
Author Contributions
Funding
Institutional Review Board Statement
Informed Consent Statement
Data Availability Statement
Acknowledgments
Conflicts of Interest
References
- Nafisi, A.; Safavizadeh, S.; Montoya, B.M. Influence of microbe and enzyme-induced treatments on cemented sand shear response. J. Geotech. Geoenviron. Eng. 2019, 145, 06019008. [Google Scholar] [CrossRef]
- Yin, L.Y.; Tang, C.S.; Xie, J.; Lu, C.; Jiang, N.J.; Shi, B. Factors affecting improvement in engineering properties of geomaterials by microbial-induced calcite precipitation. Chin. J. Rock Mech. 2019, 40, 2525–2546. [Google Scholar] [CrossRef]
- Dilrukshi, R.A.N.; Watanabe, J.; Kawasaki, S. Sand cementation test using plant-derived urease and calcium phosphate compound. Mater. Trans. 2015, 56, 1565–1572. [Google Scholar] [CrossRef] [Green Version]
- Hommel, J.; Akyel, A.; Frieling, Z.; Phillips, A.J.; Gerlach, R.; Cunningham, A.B.; Class, H. A numerical model for enzymatically induced calcium carbonate precipitation. Appl. Sci. 2020, 10, 4538. [Google Scholar] [CrossRef]
- Wu, M.Y.; Hu, X.M.; Zhang, Q.; Zhao, Y.Y.; Sun, J.H.; Cheng, W.M.; Fan, Y.J.; Zhu, S.C.; Lu, W.; Song, C.Y. Preparation and performance evaluation of environment-friendly biological dust suppressant. J. Clean. Prod. 2020, 273, 123162. [Google Scholar] [CrossRef]
- Almajed, A.; Abbas, H.; Arab, M.; Alsabhan, A.; Hamid, W.; Al-Salloum, Y. Enzyme-induced carbonate precipitation (EICP)-based methods for ecofriendly stabilization of different types of natural sands. J. Clean. Prod. 2020, 247, 122627. [Google Scholar] [CrossRef]
- Liu, K.W.; Jiang, N.J.; Qin, J.D.; Wang, Y.J.; Tang, C.S.; Han, X.L. An experimental study of mitigating coastal sand dune erosion by microbial- and enzymatic-induced carbonate precipitation. Acta Geotech. 2020. [Google Scholar] [CrossRef]
- Cui, M.J.; Lai, H.J.; Hoang, T.; Chu, J. One-phase-low-pH enzyme induced carbonate precipitation (EICP) method for soil improvement. Acta Geotech. 2020. [Google Scholar] [CrossRef]
- Li, L.; Li, M.D.; Ogbonnaya, U.; Wen, K.J.; Li, C.; Amini, F. Experimental investigation of the mechanical properties of MICP-treated sands reinforced with discrete randomly distributed fiber. Geo Chic. 2016, 52–61. [Google Scholar] [CrossRef]
- Xie, J.; Tang, C.S.; Yin, L.Y.; Lu, C.; Jiang, N.J.; Shi, B. Mechanical behavior of microbial-induced calcite precipitation (MICP)-treated soil with fiber reinforcement. Chin. J. Geotech. Eng. 2019, 41, 675–682. [Google Scholar] [CrossRef]
- Akay, O. Fiber reinforced sandy slopes groundwater return flow. J. Irrig. Drain. Eng. 2018, 144, 04018004. [Google Scholar] [CrossRef]
- Tang, C.S.; Shi, B.; Cai, Y.; Gao, W.; Chen, F.J. Experimental study on polypropylene fiber improving soft soils. Rock Soil Mech. 2007, 28, 1796–1800. [Google Scholar] [CrossRef]
- Tang, C.S.; Pei, X.J.; Wang, D.Y. Interfacial micro-mechanical behavior of discrete fiber-reinforced soil. Soil Behav. Geomech. 2014. [Google Scholar] [CrossRef]
- Li, J.; Tang, C.S.; Wang, D.Y.; Pei, X.J.; Shi, B. Effect of discrete fiber reinforcement on soil tensile strength. J. Rock Mech. Geotech. Eng. 2014, 6, 133–137. [Google Scholar] [CrossRef] [Green Version]
- Yu, J.; Zhang, M.; Li, G.Y.; Meng, J.; Leung, C.K.Y. Using nano-silica to improve mechanical and fracture properties of fiber-reinforced high-volume fly ash cement mortar. Constr. Build. Mater. 2020, 239, 117853. [Google Scholar] [CrossRef]
- Moghal, A.A.B.; Lateef, M.A.; Mohammed, S.A.S.; Lemboye, K.C.S.; Chittoori, B.; Almajed, A. Efficacy of enzymatically induced calcium carbonate precipitation in the retention of heavy metal ions. Sustainability 2020, 12, 7019. [Google Scholar] [CrossRef]
- Ling, Y.F.; Zhang, P.; Wang, J.; Shi, Y. Effect of sand size on mechanical performance of cement-based composite containing PVA fibers and nano-SiO2. Materials 2020, 13, 325. [Google Scholar] [CrossRef] [Green Version]
- Almajed, A.; Khodadadi Tirkolaei, H.; Kavazanjian, E. Baseline investigation on enzyme-induced calcium carbonate precipitation. J. Geotech. Geoenviron. Eng. 2018, 144, 04018081. [Google Scholar] [CrossRef]
- Wu, L.Y.; Miu, L.C.; Sun, X.H.; Chen, R.F.; Wang, C.C. Experimental study on sand solidification using plant-derived urease-induced calcium carbonate precipitation. Chin. J. Geotech. Eng. 2020, 42, 714–720. [Google Scholar]
- Fang, X.W.; Yang, Y.; Chen, Z.; Liu, H.L.; Xiao, Y.; Shen, C.N. Influence of fiber content and length on engineering properties of MICP-treated coral sand. Geomicrobiol. J. 2020, 37, 582–594. [Google Scholar] [CrossRef]
- Zhao, Y.; Xiao, Z.Y.; Fan, C.B.; Shen, W.Q.; Wang, Q.; Liu, P.H. Comparative mechanical behaviors of four fiber-reinforced sand cemented by microbially induced carbonate precipitation. Bull. Eng. Geol. Environ. 2020, 79, 3075–3086. [Google Scholar] [CrossRef]
- Almajed, A.; Khodadadi, H.; Kavazanjian, E. Sisal fiber reinforcement of EICP-treated soil. In Proceedings of the American Society of Civil Engineers IFCEE, Orlando, FL, USA, 5–10 March 2018. [Google Scholar] [CrossRef]
- Tang, C.S.; Shi, B.; Gao, W. Effects of polypropylene fiber and cement additives on strength behavior of clay soil and the mechanisms. J. Eng. Geol. 2007, 15, 108–113. [Google Scholar]
- Shao, W.; Cetin, B.; Li, Y.D.; Li, J.P.; Li, L. Experimental investigation of mechanical properties of sands reinforced with discrete randomly distributed fiber. Geotech. Geol. Eng. 2014, 32, 901–910. [Google Scholar] [CrossRef]
- Choi, S.G.; Hoang, T.; Park, S.S. Undrained behavior of microbially induced calcite precipitated sand with polyvinyl alcohol fiber. Appl. Sci. 2019, 9, 1214. [Google Scholar] [CrossRef] [Green Version]
- Li, M.; Li, L.; Ogbonnaya, U.; Wen, K.; Tian, A.; Amini, F. Influence of fiber addition on mechanical properties of MICP-treated sand. J. Mater. Civ. Eng. 2016, 28, 04015166. [Google Scholar] [CrossRef]
- Zheng, J.J.; Song, Y.; Wu, C.; Cui, M.J. Study on evaluation method of brittleness of bio-treated sand with low cementation level. J. Huazhong Univ. Sci. Techno. Nat. Sci. Ed. 2020, 48, 96–101. [Google Scholar] [CrossRef]
- Cheng, L.; Shahin, M.A.; Mujah, D. Influence of key environmental conditions on microbially induced cementation for soil stabilization. J. Geotech. Geoenviron. Eng. 2017, 143, 0001586. [Google Scholar] [CrossRef] [Green Version]
- Cui, M.J.; Zheng, J.J.; Zhang, R.J.; Lai, H.J.; Zhang, J. Influence of cementation level on the strength behaviour of bio-cemented sand. Acta Geotech. 2017, 12, 971–986. [Google Scholar] [CrossRef]
- Hoang, T.; Alleman, J.; Cetin, B.; Ikuma, K.; Choi, S.G. Sand and silty-sand soil stabilization using bacterial enzyme induced calcite precipitation (BEICP). Can. Geotech. J. 2018, 56, 808–822. [Google Scholar] [CrossRef]
- Terzis, D.; Laloui, L. 3-D micro-architecture and mechanical response of soil cemented via microbial-induced calcite precipitation. Sci. Rep. 2018, 8, 1416. [Google Scholar] [CrossRef] [Green Version]
- Shen, T.Y.; Wang, S.J.; Xue, L.; Li, X.; He, B.H. An experimental study of sandy clayey purple soil enhanced through microbial-induced calcite precipitation. Rock Soil Mech. 2019, 40, 3115–3124. [Google Scholar] [CrossRef]
- Ismail, M.A.; Joer, H.A.; Sim, W.H.; Randolf, M.F. Effect of cement type on the shear behavior of cemented calcareous soil. J. Geotech. Geoenviron. Eng. 2002, 128, 520–529. [Google Scholar] [CrossRef]
- Zhang, H.C.; Guo, H.X.; Li, M.; Cheng, X.H. Experimental research of microbial -induced clogging in sands. Ind. Const. 2015, 45, 139–142. [Google Scholar]
- Al Imran, M.D.; Gowthaman, S.; Nakashima, K.; Kawasaki, S. The influence of the addition of plant-based natural fibers (Jute) on biocemented sand using MICP method. Materials 2020, 13, 4198. [Google Scholar] [CrossRef]
- Consoli, N.C.; Vendruscolo, M.A.; Fonini, A.; Dalla Rosa, F. Fiber reinforcement effects on sand considering a wide cementation range. Geotext. Geomembr. 2009, 27, 196–203. [Google Scholar] [CrossRef]
- Munshi, T.K.; Chattoo, B.B. Bacterial population structure of the jute-retting environment. Microb. Ecol. 2008, 56, 270–282. [Google Scholar] [CrossRef]
- Yuan, H.; Ren, G.Z.; Liu, K.; Zheng, W.; Zhao, Z.L. Experimental study of EICP combined with organic materials for silt improvement in the yellow river flood area. Appl. Sci. 2020, 10, 7678. [Google Scholar] [CrossRef]
- Xiao, Y.; He, X.; Evans, T.M.; Stuedlein, A.W.; Liu, H. Unconfined compressive and splitting tensile strength of basalt fiber–reinforced biocemented sand. J. Geotech. Geoenviron. Eng. 2019, 145, 04019048. [Google Scholar] [CrossRef]


| Particle Size (mm) | <2 | <1 | <0.5 | <0.25 | <0075 |
| Content (%) | 100.00 | 89.16 | 47.57 | 18.00 | 10.97 |
| Property | Symbol | Value | Unit |
|---|---|---|---|
| Sand | |||
| Specific gravity | Gs | 2.637 | — |
| Mean particle diameter | d50 | 0.29 | mm |
| Uniformity coefficient | Cu | 9.62 | — |
| Curvature coefficient | Cc | 2.82 | — |
| PVA fiber | |||
| Diameter | d | 20 ± 2 | μm |
| Length | l | 3, 6, 9, 12 ± 0.5 | mm |
| Density | ρ | 1.3 | g cm−3 |
| Tensile strength | T | 1700 | MPa |
| Elastic modulus | E | 45 | GPa |
| Dry breaking elongation | δ | 6 | % |
| Test Number | Fiber Length (mm) | Fiber Content (%) | Number of Tests | |||
|---|---|---|---|---|---|---|
| UCS | CCC | SEM | USB Handheld Microscope | |||
| U-0-0 | 0 | 0 | 3 | 9 | 1 | 1 |
| U-3-0.2 | 3 | 0.2 | 3 | 9 | 1 | 1 |
| U-3-0.4 | 3 | 0.4 | 3 | 9 | 1 | 1 |
| U-3-0.6 | 3 | 0.6 | 3 | 9 | 1 | 1 |
| U-6-0.2 | 6 | 0.2 | 3 | 9 | 1 | 1 |
| U-6-0.4 | 6 | 0.4 | 3 | 9 | 1 | 1 |
| U-6-0.6 | 6 | 0.6 | 3 | 9 | 1 | 1 |
| U-9-0.2 | 9 | 0.2 | 3 | 9 | 1 | 1 |
| U-9-0.4 | 9 | 0.4 | 3 | 9 | 1 | 1 |
| U-9-0.6 | 9 | 0.6 | 3 | 9 | 1 | 1 |
| U-12-0.2 | 12 | 0.2 | 3 | 9 | 1 | 1 |
| U-12-0.4 | 12 | 0.4 | 3 | 9 | 1 | 1 |
| U-12-0.6 | 12 | 0.6 | 3 | 9 | 1 | 1 |
| Test Number | UCS (kPa) | CCC (%) | ||||||
|---|---|---|---|---|---|---|---|---|
| 1 | 2 | 3 | Ave | Ct 1 | Cm 2 | Cb 3 | Av | |
| U-0-0 | 789.36 | 864.81 | 833.793 | 829.32 | 5.505 | 5.011 | 5.017 | 5.178 |
| U-3-0.2 | 851.72 | 824.95 | 903.64 | 860.1 | 6.331 | 5.87 | 4.767 | 5.656 |
| U-3-0.4 | 858.71 | 899.68 | 934.63 | 897.67 | 6.743 | 6.132 | 5.093 | 5.989 |
| U-3-0.6 | 966.43 | 925.44 | 955.72 | 949.19 | 7.563 | 6.974 | 4.79 | 6.442 |
| U-6-0.2 | 1072.98 | 1037.12 | 1194.43 | 1101.51 | 6.843 | 5.709 | 5.176 | 5.909 |
| U-6-0.4 | 1331.55 | 1277.68 | 1198.29 | 1269.17 | 7.797 | 6.5313 | 4.48 | 6.269 |
| U-6-0.6 | 1065.97 | 1194.33 | 1257.75 | 1172.68 | 8.36 | 6.546 | 4.03 | 6.312 |
| U-9-0.2 | 1204.45 | 1184.2 | 1369.33 | 1252.66 | 7.352 | 6.101 | 5.329 | 6.261 |
| U-9-0.4 | 1474.63 | 1654.36 | 1447.25 | 1525.41 | 7.563 | 6.037 | 5.174 | 6.258 |
| U-9-0.6 | 1405.87 | 1285.44 | 1485 | 1392.1 | 8.376 | 5.307 | 4.131 | 5.938 |
| U-12-0.2 | 1593.81 | 1533.54 | 1351.32 | 1492.89 | 8.389 | 6.375 | 4.429 | 6.398 |
| U-12-0.4 | 1367.94 | 1185.13 | 1459.62 | 1337.56 | 9.765 | 6.431 | 4.26 | 6.819 |
| U-12-0.6 | 1400.65 | 1133.67 | 1279.5 | 1271.28 | 10.446 | 6.748 | 3.91 | 7.035 |
| Treatment Number | σr (kPa) | εf 1 (%) | E (MPa) | E50 2 (MPa) | αc 3 (%) | αs 4 (%) | βcc 5 (%) | βsc 6 (%) | βcl 7 (%) | βsl 8 (%) |
|---|---|---|---|---|---|---|---|---|---|---|
| U-0-0 | 0 | 1.7 | 20.10 | 35.06 | — | — | — | — | — | — |
| U-3-0.2 | 0 | 1.9 | 23.28 | 46.23 | 9.24 | 3.71 | — | — | — | — |
| U-3-0.4 | 0 | 2.5 | 23.81 | 46.72 | 15.68 | 8.24 | 5.89 | 4.37 | — | — |
| U-3-0.6 | 350.25 | 3.0 | 37.06 | 46.71 | 24.43 | 14.45 | 7.56 | 5.74 | — | — |
| U-6-0.2 | 301.45 | 2.5 | 40.38 | 48.90 | 14.13 | 32.82 | — | — | 4.48 | 28.07 |
| U-6-0.4 | 574.30 | 3.0 | 53.29 | 45.32 | 21.09 | 53.04 | 6.09 | 15.22 | 4.68 | 41.38 |
| U-6-0.6 | 634.38 | 3.3 | 43.73 | 48.59 | 21.91 | 41.40 | 0.68 | −7.60 | −2.02 | 23.54 |
| U-9-0.2 | 600.80 | 3.1 | 24.34 | 44.80 | 20.92 | 51.05 | — | — | 5.95 | 13.72 |
| U-9-0.4 | 831.22 | 4.4 | 79.43 | 53.78 | 20.87 | 83.94 | −0.04 | 21.77 | −0.18 | 20.19 |
| U-9-0.6 | 837.12 | 4.7 | 38.80 | 50.04 | 14.68 | 67.86 | −5.11 | −8.74 | −5.93 | 18.71 |
| U-12-0.2 | 634.53 | 4.2 | 42.85 | 35.89 | 23.56 | 80.01 | — | — | 2.19 | 19.18 |
| U-12-0.4 | 865.07 | 6.4 | 62.37 | 41.88 | 31.69 | 61.28 | 6.58 | −10.40 | 8.96 | −12.31 |
| U-12-0.6 | 892.12 | 4.4 | 32.34 | 35.99 | 35.87 | 53.29 | 3.17 | −4.96 | 18.47 | −8.68 |
Publisher’s Note: MDPI stays neutral with regard to jurisdictional claims in published maps and institutional affiliations. |
© 2021 by the authors. Licensee MDPI, Basel, Switzerland. This article is an open access article distributed under the terms and conditions of the Creative Commons Attribution (CC BY) license (https://creativecommons.org/licenses/by/4.0/).
Share and Cite
Yuan, H.; Ren, G.; Liu, K.; Zhao, Z. Effect of Incorporating Polyvinyl Alcohol Fiber on the Mechanical Properties of EICP-Treated Sand. Materials 2021, 14, 2765. https://doi.org/10.3390/ma14112765
Yuan H, Ren G, Liu K, Zhao Z. Effect of Incorporating Polyvinyl Alcohol Fiber on the Mechanical Properties of EICP-Treated Sand. Materials. 2021; 14(11):2765. https://doi.org/10.3390/ma14112765
Chicago/Turabian StyleYuan, Hua, Guanzhou Ren, Kang Liu, and Zhiliang Zhao. 2021. "Effect of Incorporating Polyvinyl Alcohol Fiber on the Mechanical Properties of EICP-Treated Sand" Materials 14, no. 11: 2765. https://doi.org/10.3390/ma14112765