Author Contributions
Conceptualization, P.G., A.S.S., and E.A.G.; methodology, H.L., A.S.S., and J.C.; software, H.L.; formal analysis, H.L. and A.S.S.; investigation, H.L.; resources, A.S.S., J.C., and P.G.; data curation, H.L., A.S.S., and P.G.; writing—original draft preparation, H.L.; writing—review and editing, A.S.S. and J.A.W.; visualization, H.L.; supervision, J.A.W. and E.A.G.; project administration, J.A.W. and E.A.G.; funding acquisition, P.G. and E.A.G. All authors have read and agreed to the published version of the manuscript.
Figure 1.
Schematic diagram of the laser-interference system. An angle between the beams of is used in this study.
Figure 1.
Schematic diagram of the laser-interference system. An angle between the beams of is used in this study.
Figure 2.
Photographs of the laser-processed area on copper using the spot-by-spot method with laser spot sizes of: (
a) 4 mm and (
b) 5 mm. The photos were taken immediately after processing. The label numbers correspond to conditions shown in
Table A1.
Figure 2.
Photographs of the laser-processed area on copper using the spot-by-spot method with laser spot sizes of: (
a) 4 mm and (
b) 5 mm. The photos were taken immediately after processing. The label numbers correspond to conditions shown in
Table A1.
Figure 3.
Schematic figure for the single-lap shear joints.
Figure 3.
Schematic figure for the single-lap shear joints.
Figure 4.
Photographs showing the single-lap shear join bonding process and fixture: (a) specimens placed on one side of the fixture; (b) adhesive applied on the bonding area; (c) specimens placed on the other side of the fixture; (d) tightened bolts pressed the two specimens firmly onto each other.
Figure 5.
SEM micrographs of the as-received unprocessed copper surface at different magnifications: (a) 300×, (b) 500×, (c) 1000×, (d) 2000×, (e) 5000×.
Figure 5.
SEM micrographs of the as-received unprocessed copper surface at different magnifications: (a) 300×, (b) 500×, (c) 1000×, (d) 2000×, (e) 5000×.
Figure 6.
SEM micrographs (2000×) of the laser-interference-processed area using the spot-by-spot method with a 4 mm spot size on copper. Each frame shows a different number of pulses per spot: (a) 2, (b) 4, (c) 6, (d) 8, (e) 10, (f) 12.
Figure 6.
SEM micrographs (2000×) of the laser-interference-processed area using the spot-by-spot method with a 4 mm spot size on copper. Each frame shows a different number of pulses per spot: (a) 2, (b) 4, (c) 6, (d) 8, (e) 10, (f) 12.
Figure 7.
SEM micrographs (2000×) of the laser-interference-processed area using the spot-by-spot method with a 5 mm spot size on copper. Each frame shows a different number of pulses per spot: (a) 2, (b) 4, (c) 6, (d) 8, (e) 10, (f) 12.
Figure 7.
SEM micrographs (2000×) of the laser-interference-processed area using the spot-by-spot method with a 5 mm spot size on copper. Each frame shows a different number of pulses per spot: (a) 2, (b) 4, (c) 6, (d) 8, (e) 10, (f) 12.
Figure 8.
SEM micrographs of the laser-interference processed Cu surface (spot-by-spot method) with a 4 mm spot size and two pulses per spot at different magnifications: (a) 300×, (b) 500×, (c) 1000×, (d) 2000×, (e) 5000×.
Figure 8.
SEM micrographs of the laser-interference processed Cu surface (spot-by-spot method) with a 4 mm spot size and two pulses per spot at different magnifications: (a) 300×, (b) 500×, (c) 1000×, (d) 2000×, (e) 5000×.
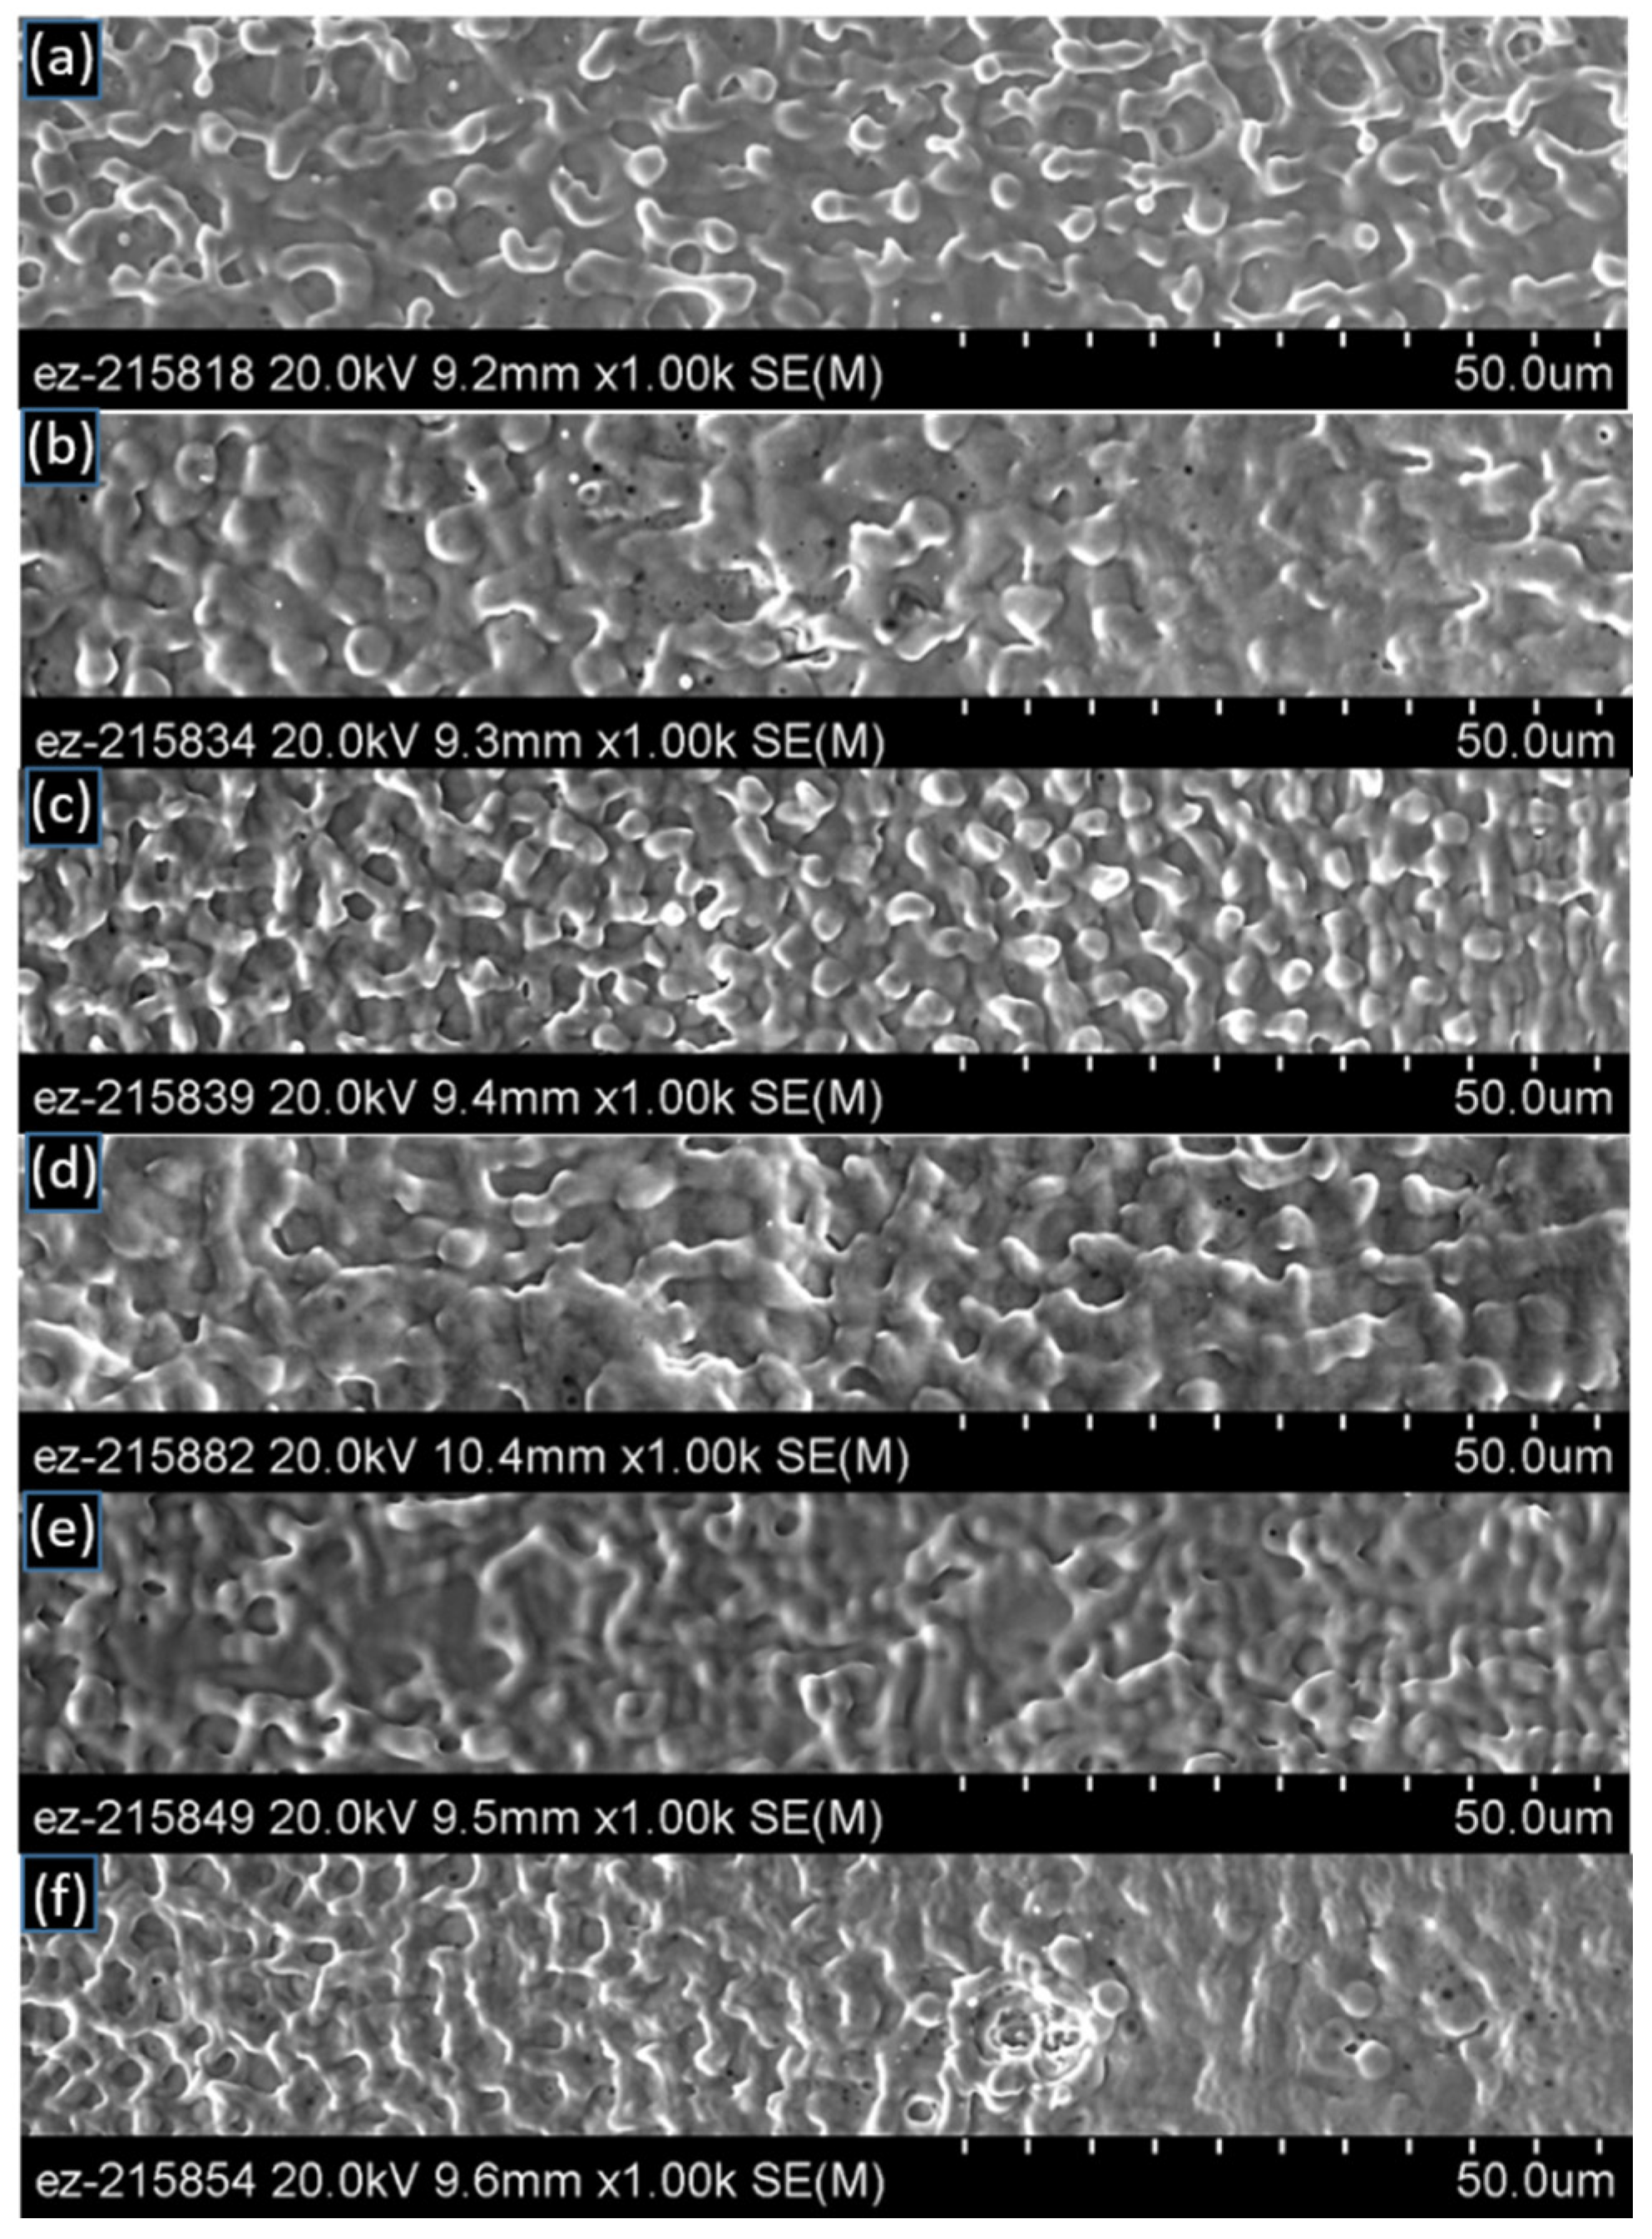
Figure 9.
SEM images (2000× magnification) of the laser-interference-processed area using the laser raster method with a 5 mm spot size on copper. Each frame shows a different raster speed (mm/s): (a) 2, (b) 4, (c) 6, (d) 8, (e) 10, (f) 12.
Figure 9.
SEM images (2000× magnification) of the laser-interference-processed area using the laser raster method with a 5 mm spot size on copper. Each frame shows a different raster speed (mm/s): (a) 2, (b) 4, (c) 6, (d) 8, (e) 10, (f) 12.
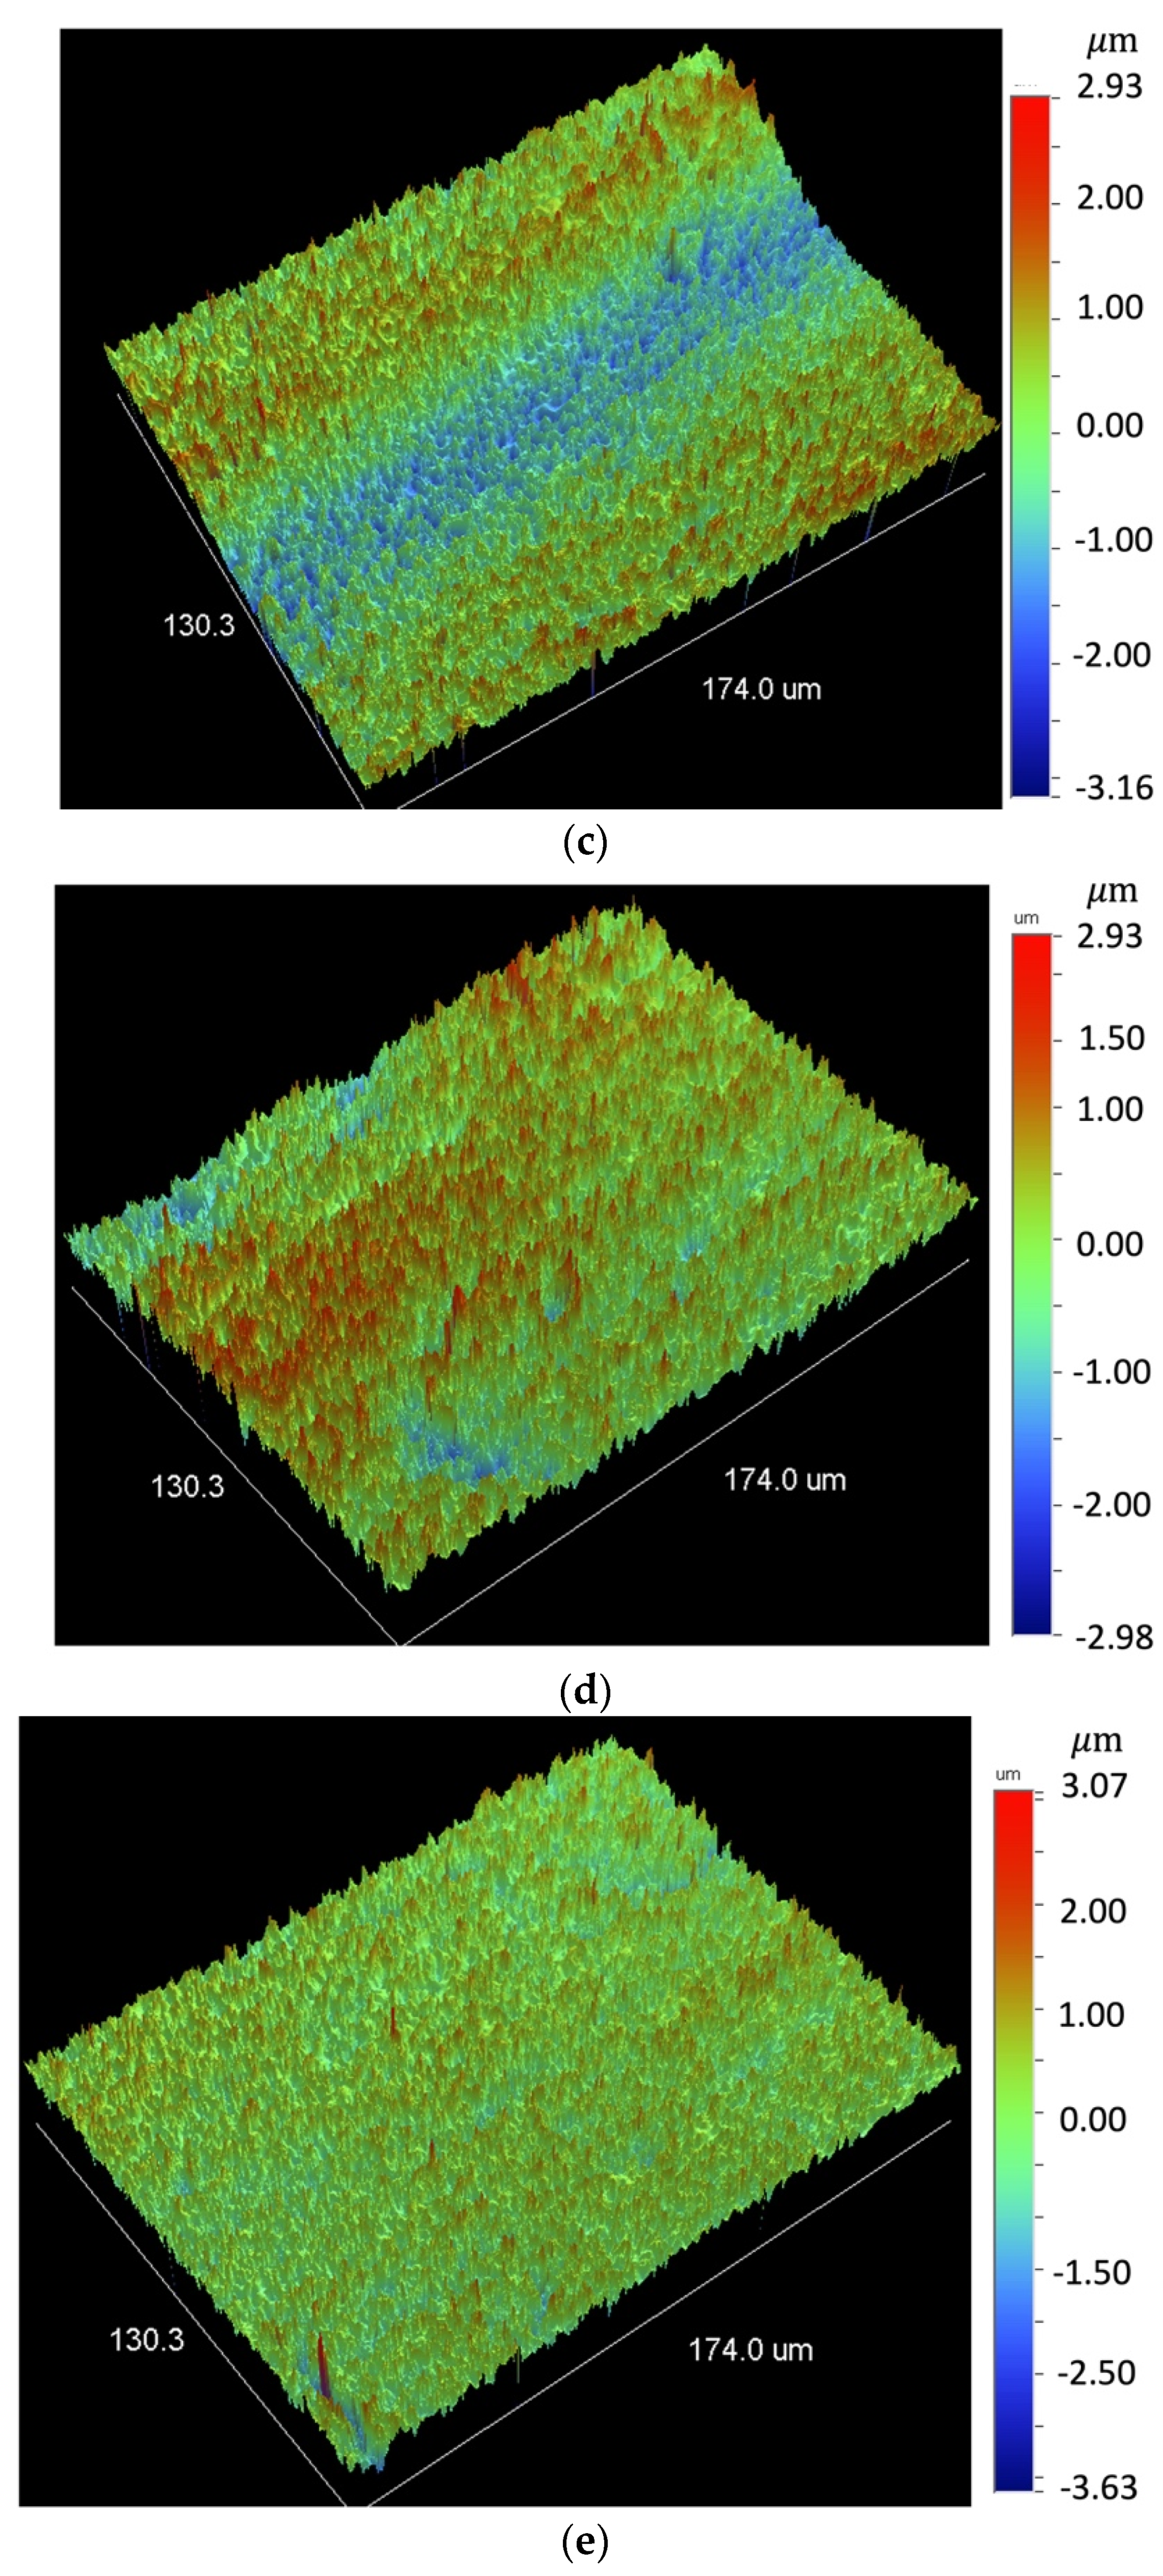
Figure 10.
3D surface profile at 50× magnification for: (a) as-received, unprocessed specimen and (b–e) spot-by-spot laser-interference processed Cu: (b) two pulses F1 = 2.785 J/cm2 per pulse, (c) two pulses F1 = 1.782 J/cm2 per pulse, (d) six pulses F1 = 1.782 J/cm2 per pulse, and (e) 12 pulses F1 = 1.782 J/cm2 per pulse.
Figure 11.
3D surface profile at 50× magnification for laser-interference raster processed with F1 = 2.785 J/cm2 per pulse (5 mm spot size): (a) 2 mm/s and (b) 6 mm/s.
Figure 11.
3D surface profile at 50× magnification for laser-interference raster processed with F1 = 2.785 J/cm2 per pulse (5 mm spot size): (a) 2 mm/s and (b) 6 mm/s.
Figure 12.
Selected photographs of the overlapping bonding area after single-lap shear testing. Each top and bottom pair of images correspond to the same bonded specimen: (a) A2 baseline specimen; mixed failure, (b) C3 (12 mm/s) adhesive failure; and (c) C4 (12 mm/s) adhesive failure.
Figure 12.
Selected photographs of the overlapping bonding area after single-lap shear testing. Each top and bottom pair of images correspond to the same bonded specimen: (a) A2 baseline specimen; mixed failure, (b) C3 (12 mm/s) adhesive failure; and (c) C4 (12 mm/s) adhesive failure.
Figure 13.
Load versus displacement variation during single-lap shear testing for (a): baseline specimen A3 and (b) laser-structured specimens B4 and C1 (6 and 12 mm/s raster speed, respectively).
Figure 13.
Load versus displacement variation during single-lap shear testing for (a): baseline specimen A3 and (b) laser-structured specimens B4 and C1 (6 and 12 mm/s raster speed, respectively).
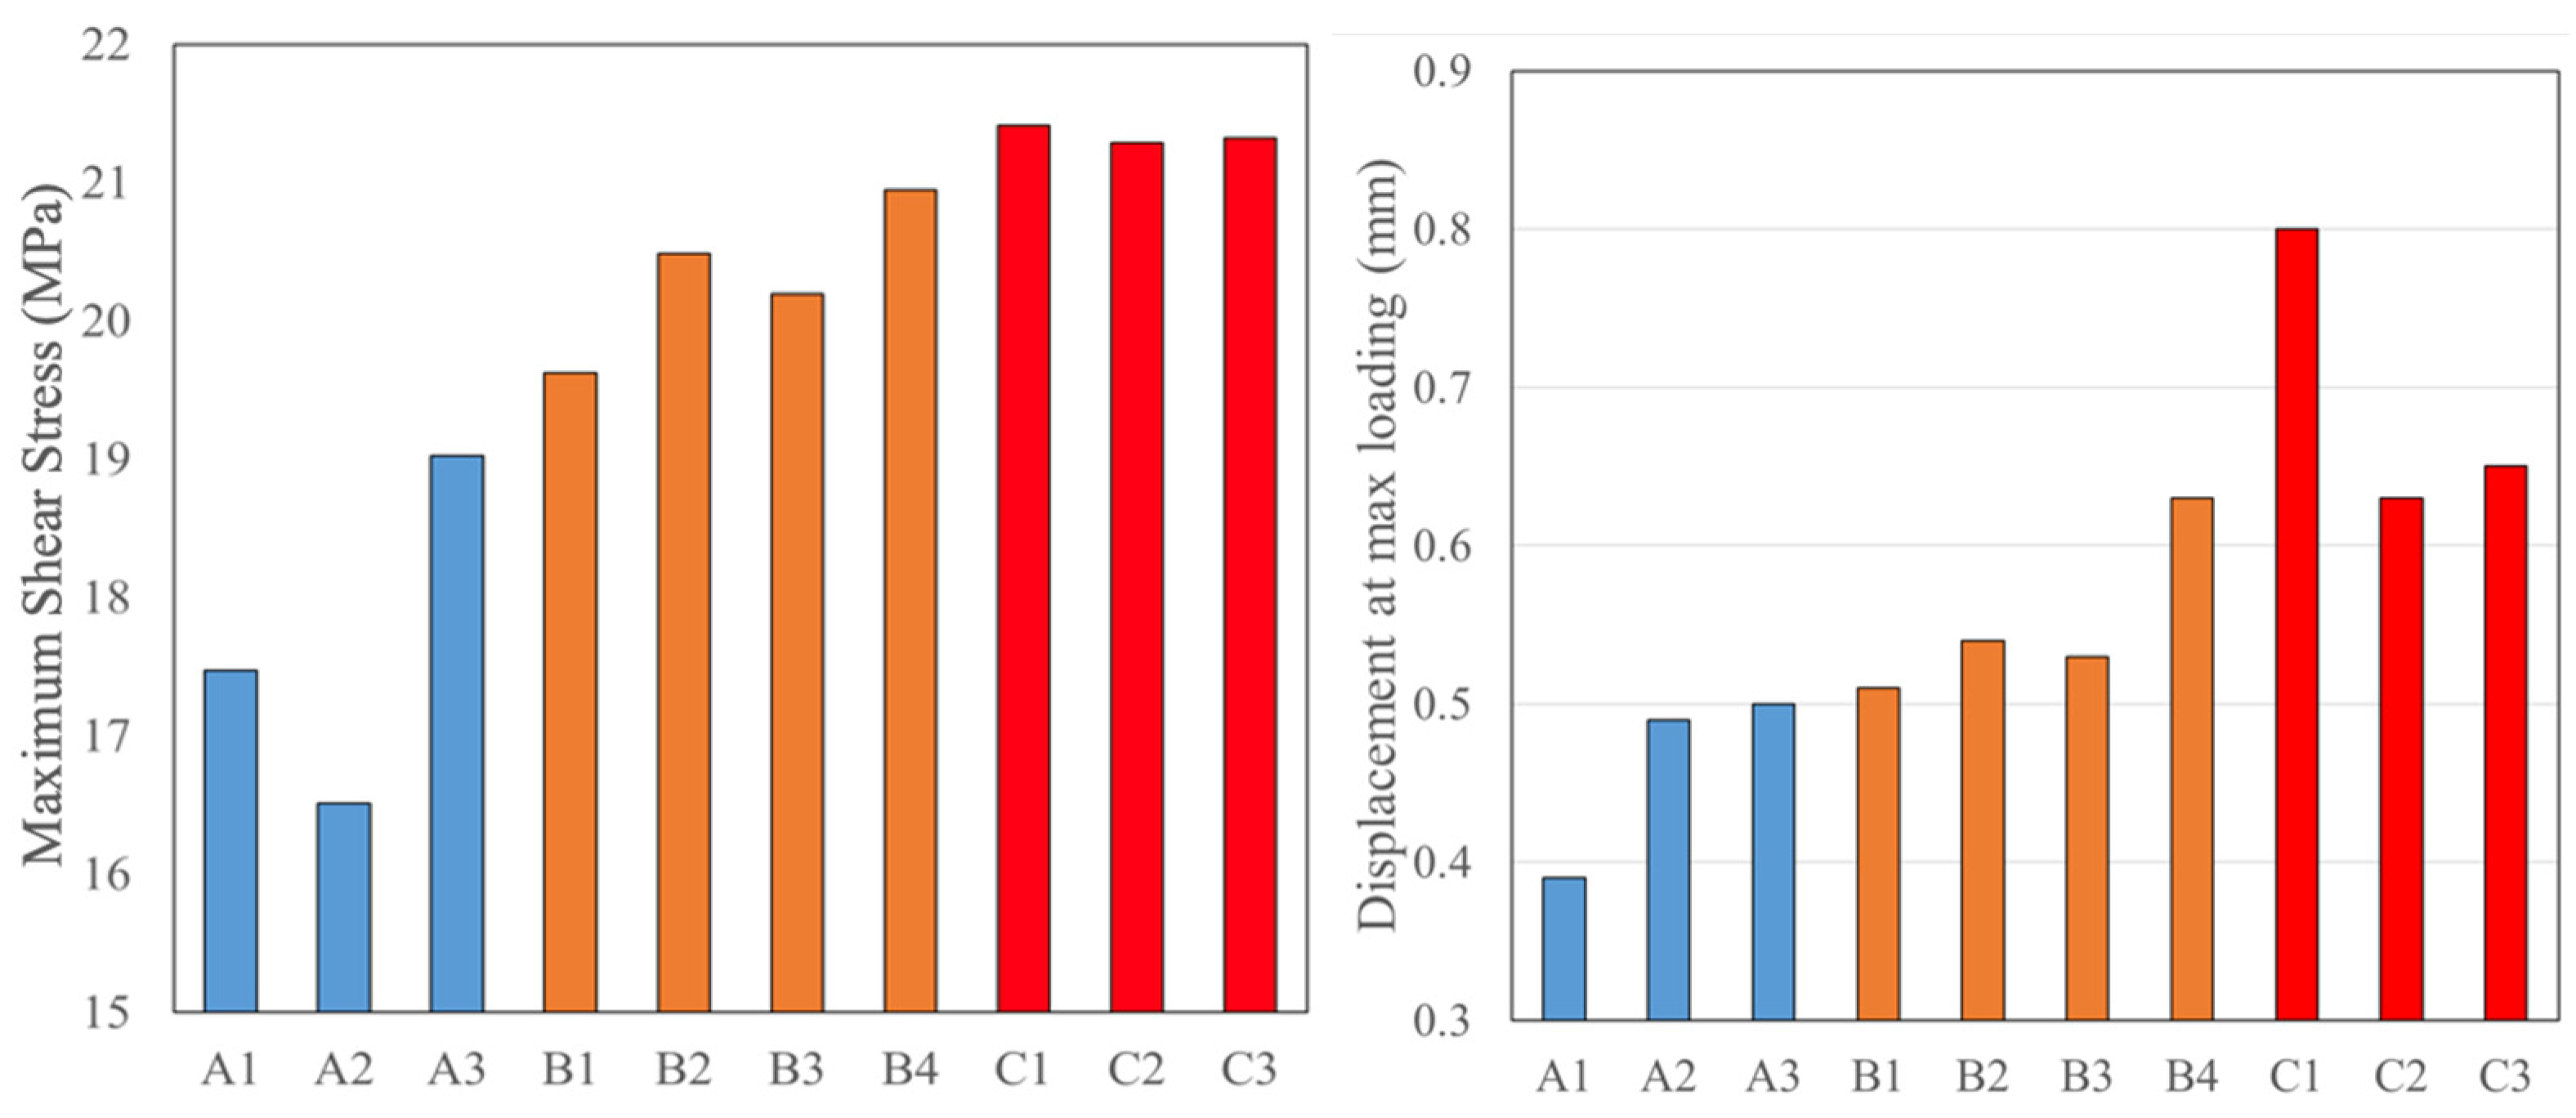
Figure 14.
Shear strength (left) and displacement at maximum loading (right) for the laser-structured specimens and baseline (A: Baseline; B: 6 mm/s; C: 12 mm/s).
Figure 14.
Shear strength (left) and displacement at maximum loading (right) for the laser-structured specimens and baseline (A: Baseline; B: 6 mm/s; C: 12 mm/s).
Table 1.
Survey of surface topology features for single pulse laser-interference processing of pure Al and Cu reported in the literatures.
Table 1.
Survey of surface topology features for single pulse laser-interference processing of pure Al and Cu reported in the literatures.
| pexp [μm] | | | | Metal | Surface Condition | Reference |
|---|
| 2.2 | 0.7 | 0.9 | 1.2 | Al | rough | D’Alessandria et al. [16] |
| 3.4 | 1.4 | 0.97 | 1.37 | Al | rough |
| 3.4 | 1.45 | 1.42 | 1.75 | Al | polished |
| 4.5 | 1.5 | 0.8 | 0.9 | Al | rough |
| 4.7 | 1.3 | 1.5 | 1.68 | Al | polished | Lasagni et al. [14] |
| 3.5 | 1.4 | 1.7 | 2.7 | Cu | polished | Lasagni et al. [14] |
Table 2.
Topology variation for spot-by-spot laser processing with 4 mm spot size.
Table 2.
Topology variation for spot-by-spot laser processing with 4 mm spot size.
| Case No. | NP | Topology Description | Protrusion Size [μm] | Feature Density | Feature Height |
|---|
| 1 | 2 | Network protrusions | 2 | Medium | Medium |
| 2 | 4 | Flatter, thick network | 3.5 | Very low | Very small |
| 3 | 6 | Upward protrusions | 2.5 | Very high | Very high |
| 4 | 8 | Flatter, thick protrusions | 3 | Very low | Medium |
| 5 | 10 | Flat, thin protrusions | 1.7 | High | Very small |
| 6 | 12 | Flat protrusions | 2.2–4.5 | High to low | Very small |
Table 3.
Topology variation for spot-by-spot laser-interference processing with 5 mm spot size.
Table 3.
Topology variation for spot-by-spot laser-interference processing with 5 mm spot size.
| Case No. | NP | Topology Description | Protrusion Size [μm] | Feature Density | Feature Height |
|---|
| 1 | 2 | Network protrusions | 2 | Medium | High |
| 2 | 4 | Network protrusions and Melt rings | 1.2–1.7 | High | High |
| 3 | 6 | Flatter network protrusions and Melt rings | 1.5 | Medium | Small |
| 4 | 8 | Network protrusions | 1.5 | Medium | Medium to Small |
| 5 | 10 | Flatter, thin protrusions | 1.5 | Medium | Small |
| 6 | 12 | Flatter, thin protrusions | 1.7 | Medium | Small |
Table 4.
Topology variation for the raster laser processing with 5 mm spot size.
Table 4.
Topology variation for the raster laser processing with 5 mm spot size.
| Case No. | U [mm/s] | Topology Description | Protrusion Size [μm] | Feature Density | Feature Height |
|---|
| 1 | 2 | Network protrusions | 1.2 | Medium | Medium |
| 2 | 4 | Network protrusions and small melt rings | 2 | Medium | Small |
| 3 | 6 | Flatter, network protrusions and large melt rings | 1.5 | Medium | Small/Medium |
| 4 | 8 | Flatter, network protrusions | 1.2–1.5 | Low | Small/Medium |
| 5 | 10 | Flatter, thicker protrusions | 1.5–2 | Low | Small/Medium |
| 6 | 12 | Deeper, thin protrusions | 1.5 | Medium | High |
Table 5.
Geometry, maximum loading, maximum shear stress, and displacement at maximum loading for the laser-structured (raster method) and baseline specimens (A: Baseline: B: 6 mm/s; C: 12 mm/s).
Table 5.
Geometry, maximum loading, maximum shear stress, and displacement at maximum loading for the laser-structured (raster method) and baseline specimens (A: Baseline: B: 6 mm/s; C: 12 mm/s).
| Specimen Label (Condition) | Overlap Length [mm] | Overlap Area [mm2] | Max Load [N] | Shear-Lap Stress [MPa] | Max Disp. at Max Load [mm] | * Surface Topology |
|---|
| A1 (base) | 13.7 | 347.5 | 4981 | 14.34 | 0.26 | Flatter, typical to rolling operations |
| A2 (base) | 14.9 | 379.5 | 6629 | 17.47 | 0.39 |
| A3 (base) | 16.0 | 407.4 | 7751 | 19.02 | 0.50 |
| B1 (6 mm/s) | 16.0 | 406.2 | 7969 | 19.62 | 0.53 | network, medium density, large melt rings |
| B2 (6 mm/s) | 16.0 | 400.1 | 8194 | 20.49 | 0.51 |
| B3 (6 mm/s) | 16.1 | 409.2 | 8263 | 20.19 | 0.51 |
| B4 (6 mm/s) | 15.9 | 403.6 | 8453 | 20.94 | 0.63 |
| C1 (12 mm/s) | 16.1 | 401.1 | 8563 | 21.34 | 0.80 | Thin protrusions with medium density |
| C2 (12 mm/s) | 17.1 | 435.1 | 9262 | 21.29 | 0.63 |
| C3 (12 mm/s) | 17.0 | 431.6 | 9201 | 21.32 | 0.65 |
| C4 (12 mm/s) | 16.1 | 409.7 | 4852 | 11.84 | 0.36 |
Table 6.
Statistics and percentage increase in the maximum shear stress and maximum displacement for the laser-structured specimens with respect to the baseline.
Table 6.
Statistics and percentage increase in the maximum shear stress and maximum displacement for the laser-structured specimens with respect to the baseline.
| Methods | Maximum Shear Stress [MPa] | Std. Deviation [MPa] | Increase [%] | Displacement at Max Loading [mm] | Std. Deviation [mm] | Increase [%] |
|---|
| Baseline | 18.25 | 1.10 | N/A | 0.45 | 0.078 | N/A |
| Laser: 6 mm/s | 20.25 | 0.66 | 11.0 | 0.56 | 0.064 | 25.1 |
| Laser: 12 mm/s | 21.30 | 0.02 | 16.8 | 0.64 | 0.014 | 43.8 |


 ,
, 


