
Recovery of Industrial Wastes as Fillers in the Epoxy Thermosets for Building Application


Abstract
:
1. Introduction
2. Materials
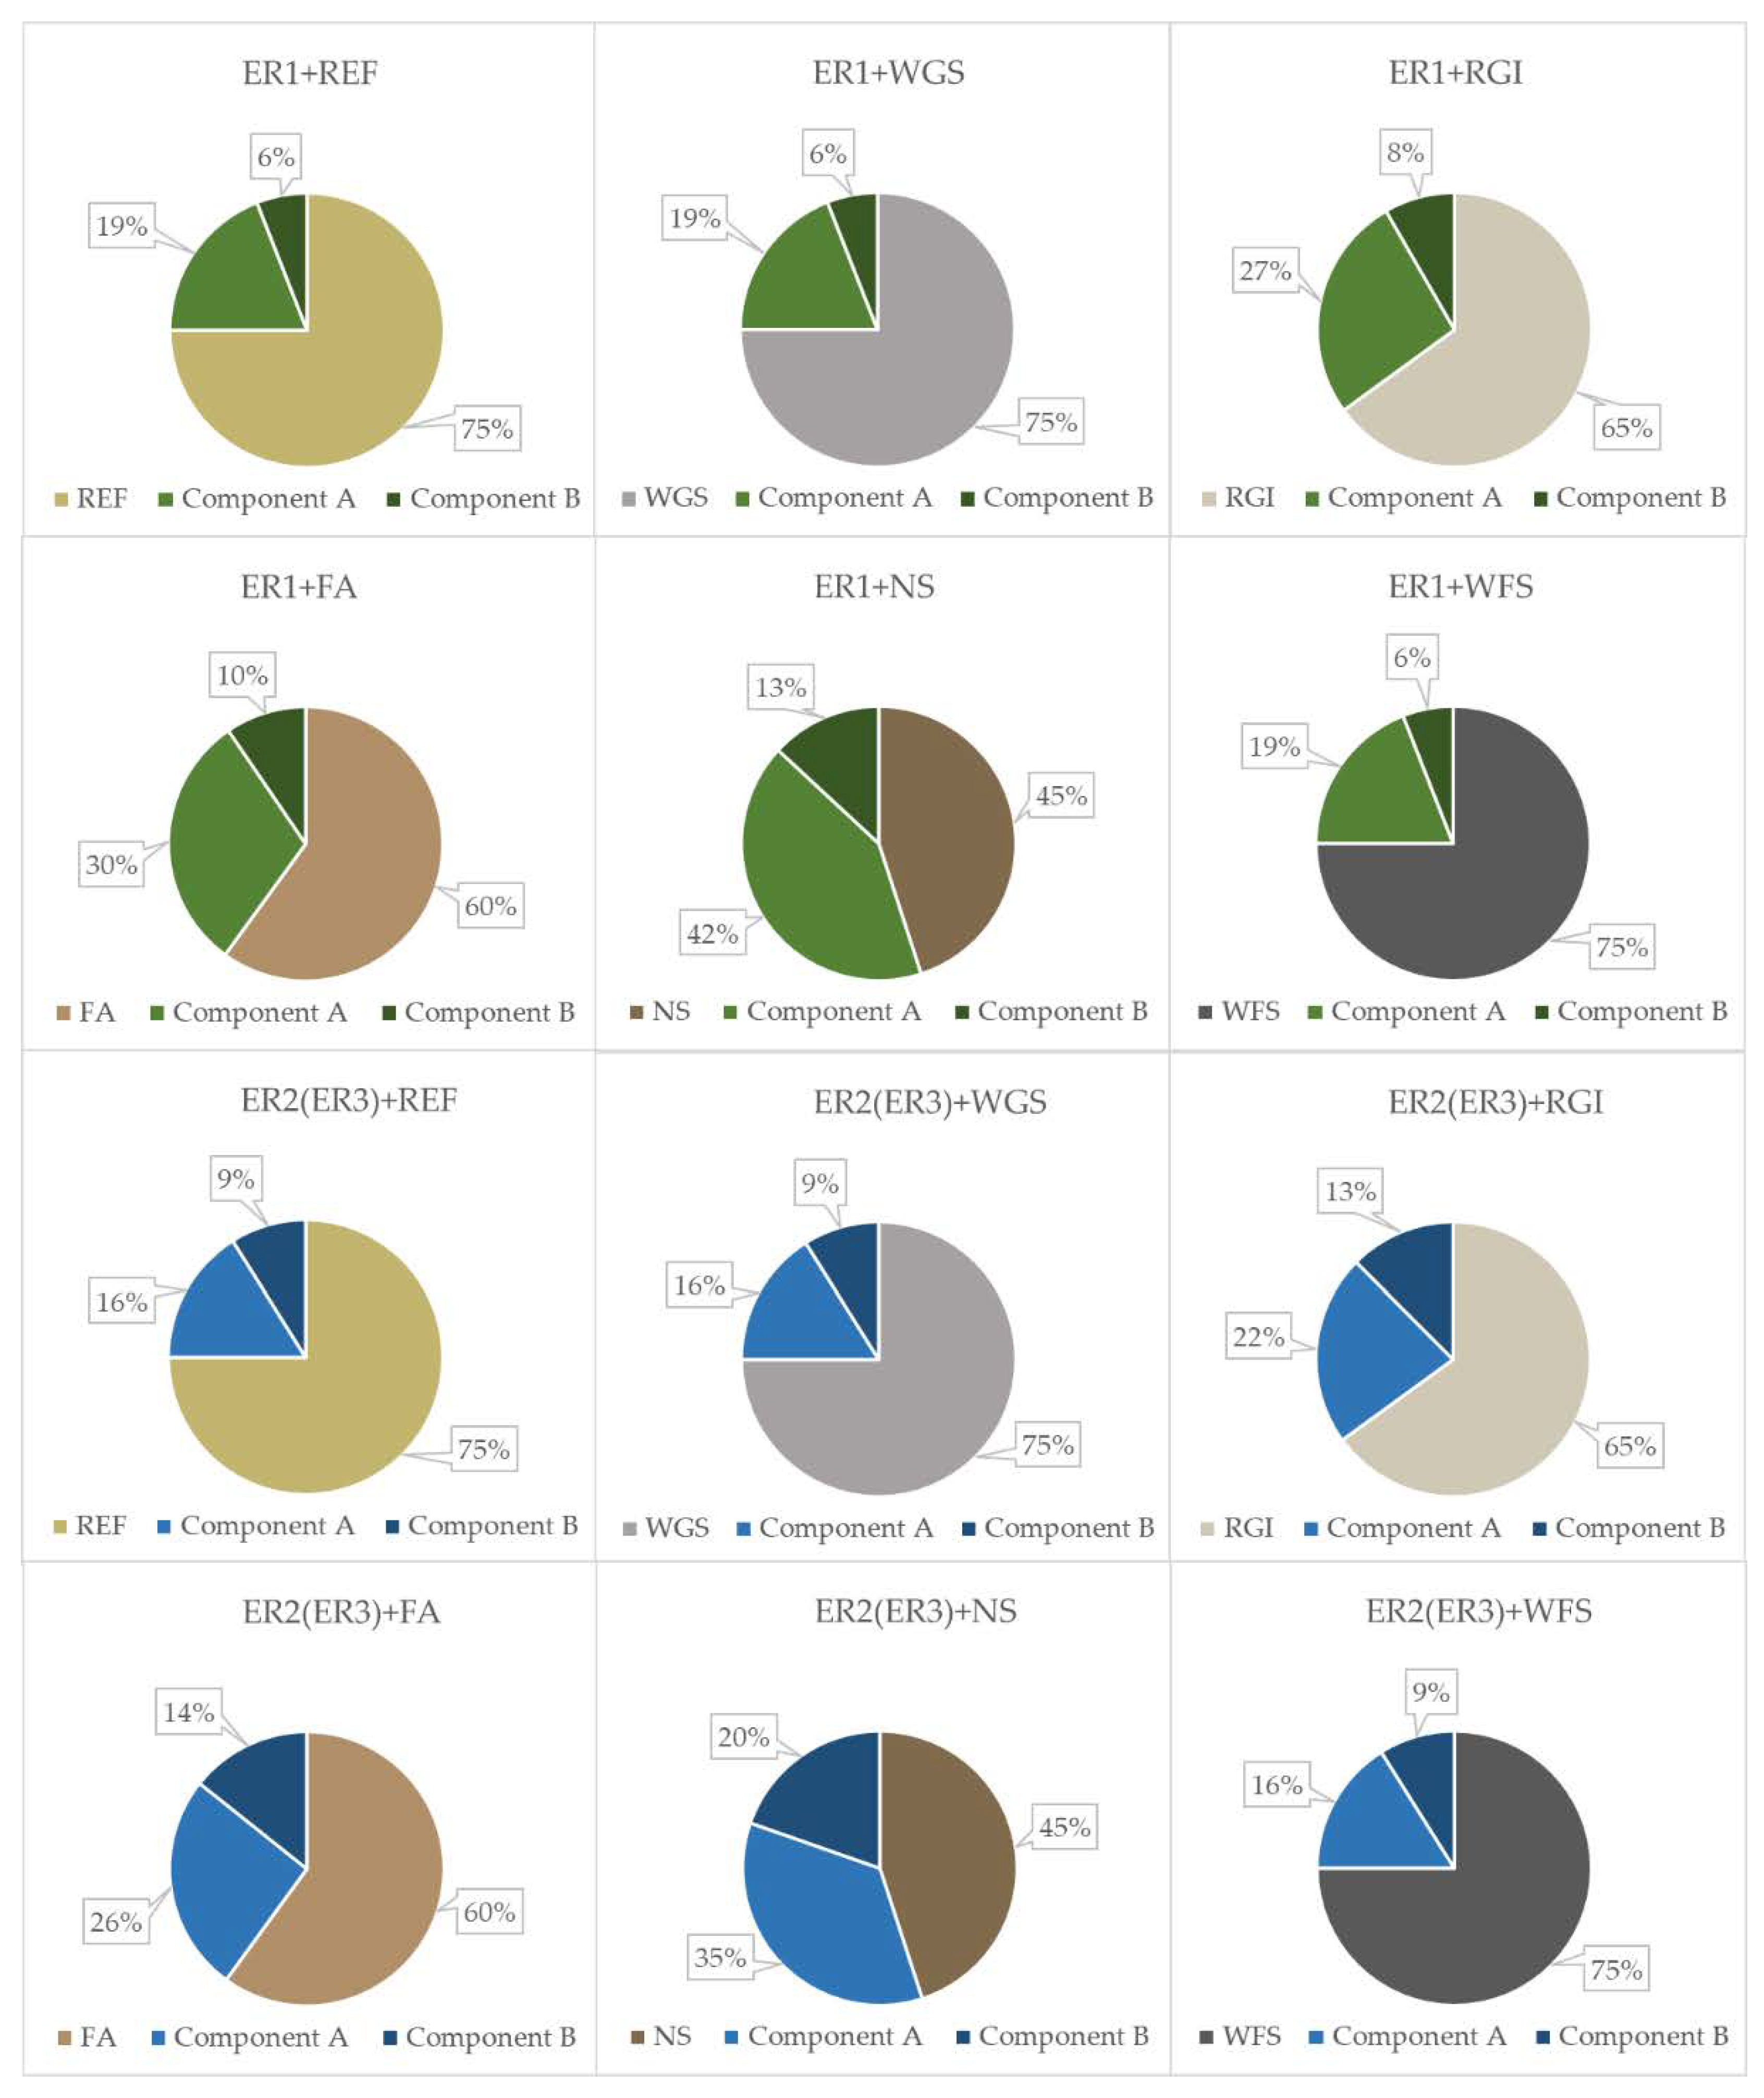
2.1. Tested Formulations
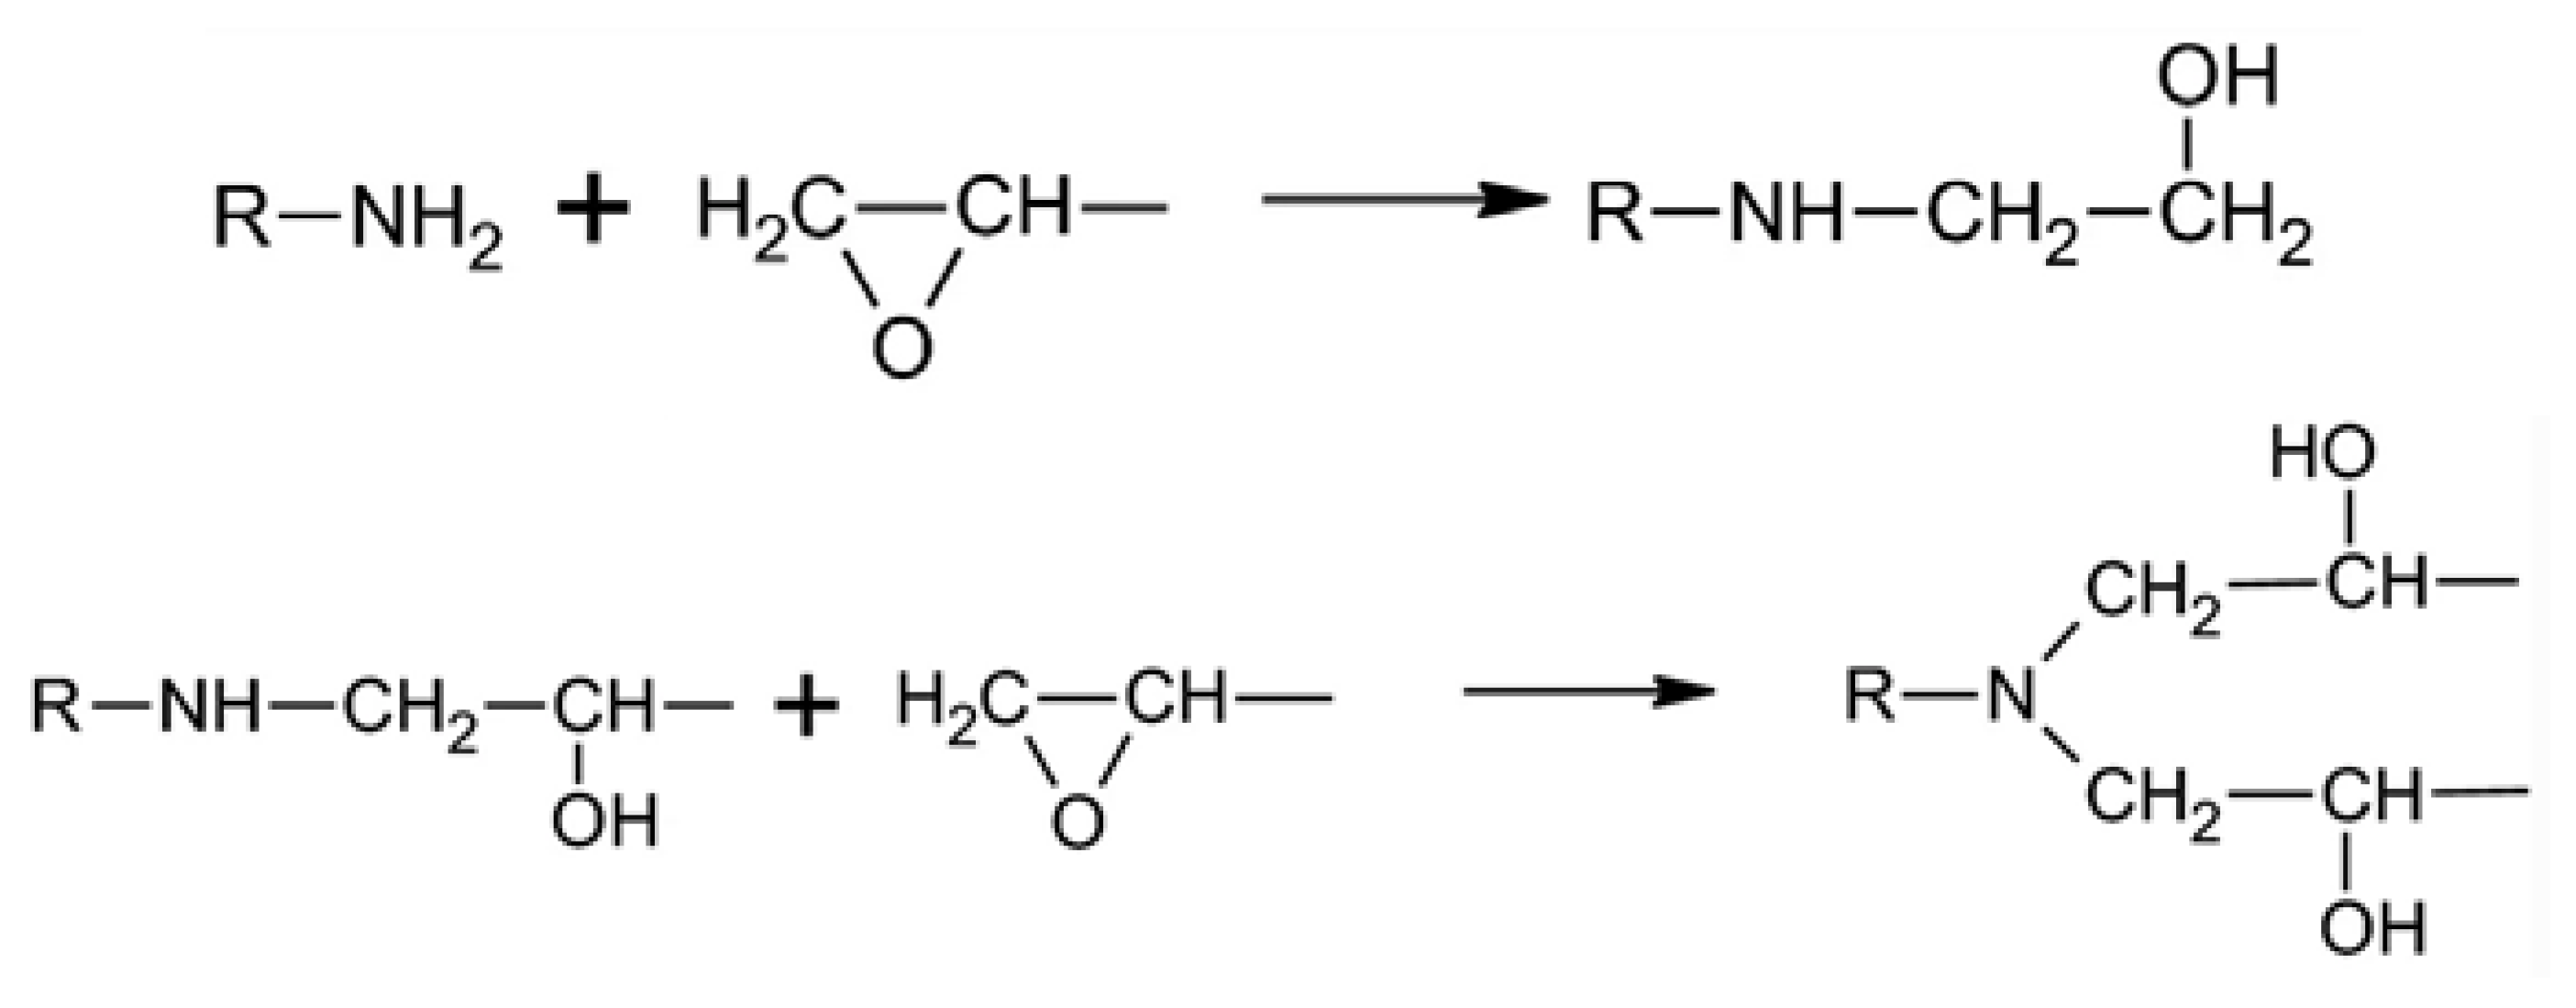
2.2. Epoxy Resin
2.3. Fillers
2.3.1. Reference Filler—Quartz Sand (REF)
2.3.2. Waste Glass from Solar Panels (WGS)
2.3.3. Waste from the Production of Mineral Insulation Boards (RGI)
2.3.4. Fly Ash (FA)
2.3.5. Neutralisation Sludge (NS)
2.3.6. Waste Foundry Sand (WFS)
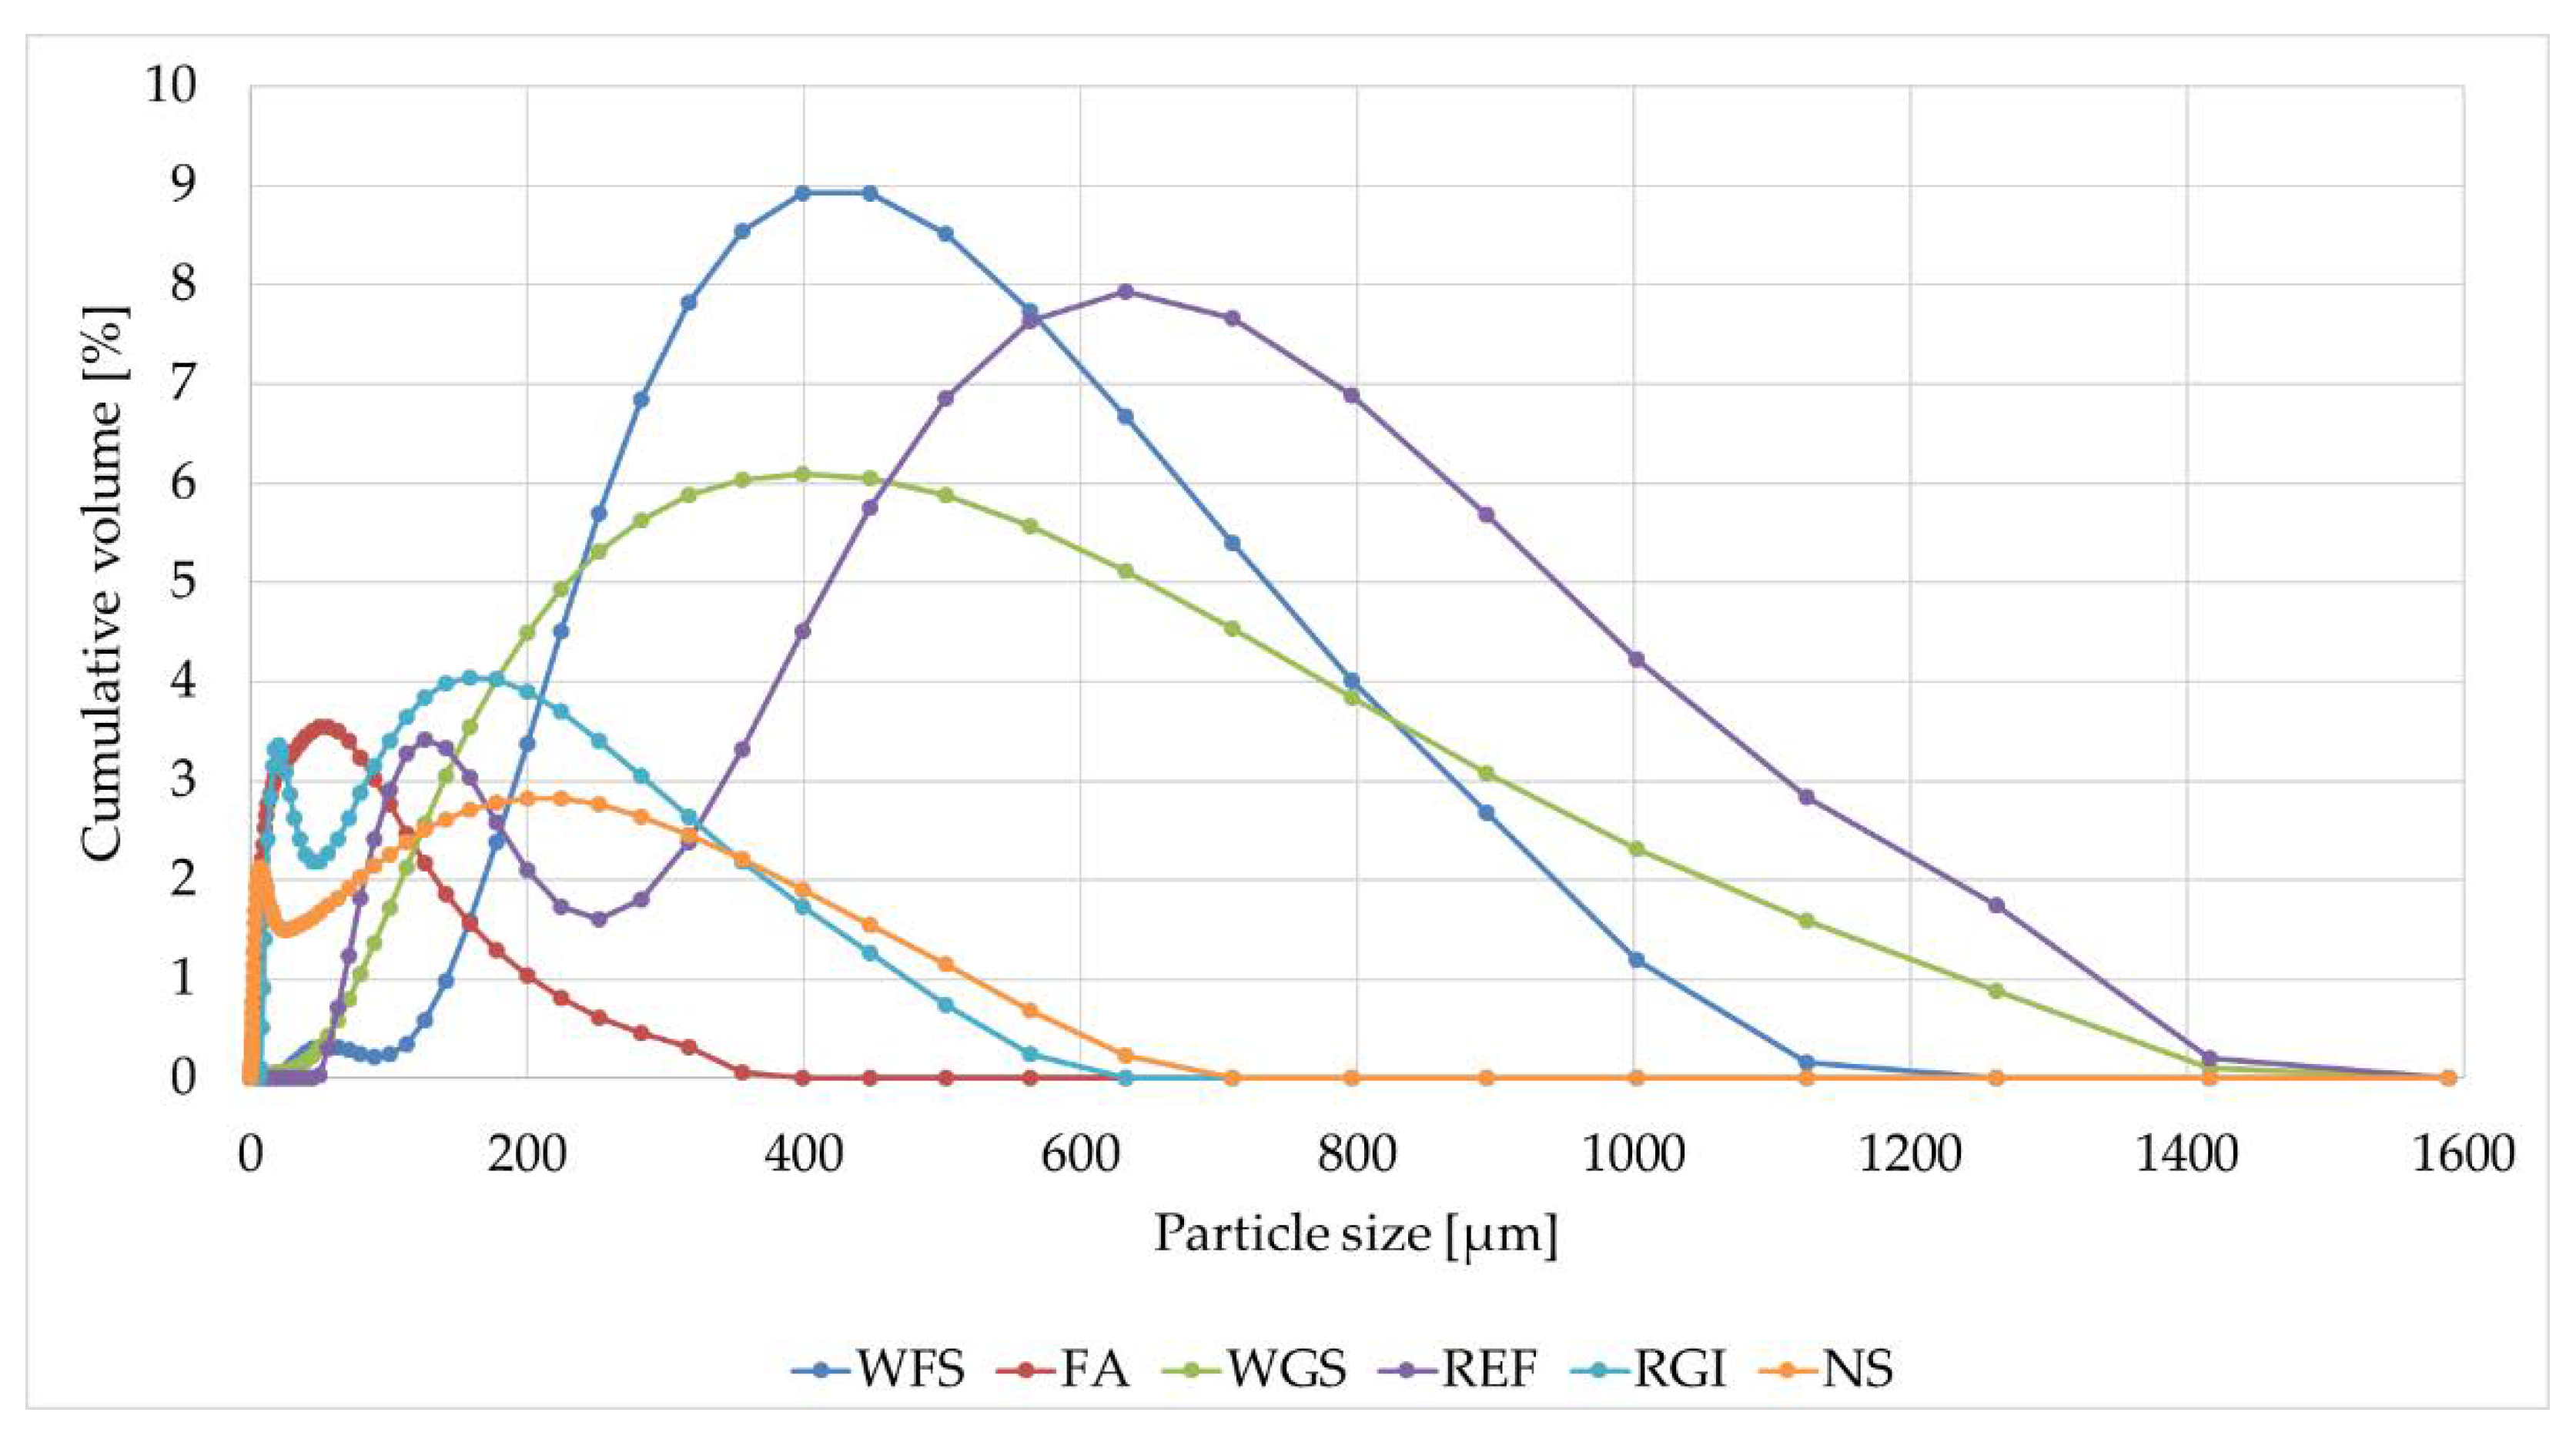
2.3.7. Summary of Properties of Input Raw Materials
3. Methods
3.1. Compressive and Flexural Strength
3.2. Cohesion with Concrete
3.3. Dynamic Viscosity
3.4. Abrasion Resistance
3.5. Impact Resistance
3.6. Hardness
3.7. Thermal Expansion
3.8. Effects of the Aggressive Environment
3.9. Microstructure—Digital Microscope and SEM
3.10. FTIR
3.11. CT Tomography
4. Results and Discussion
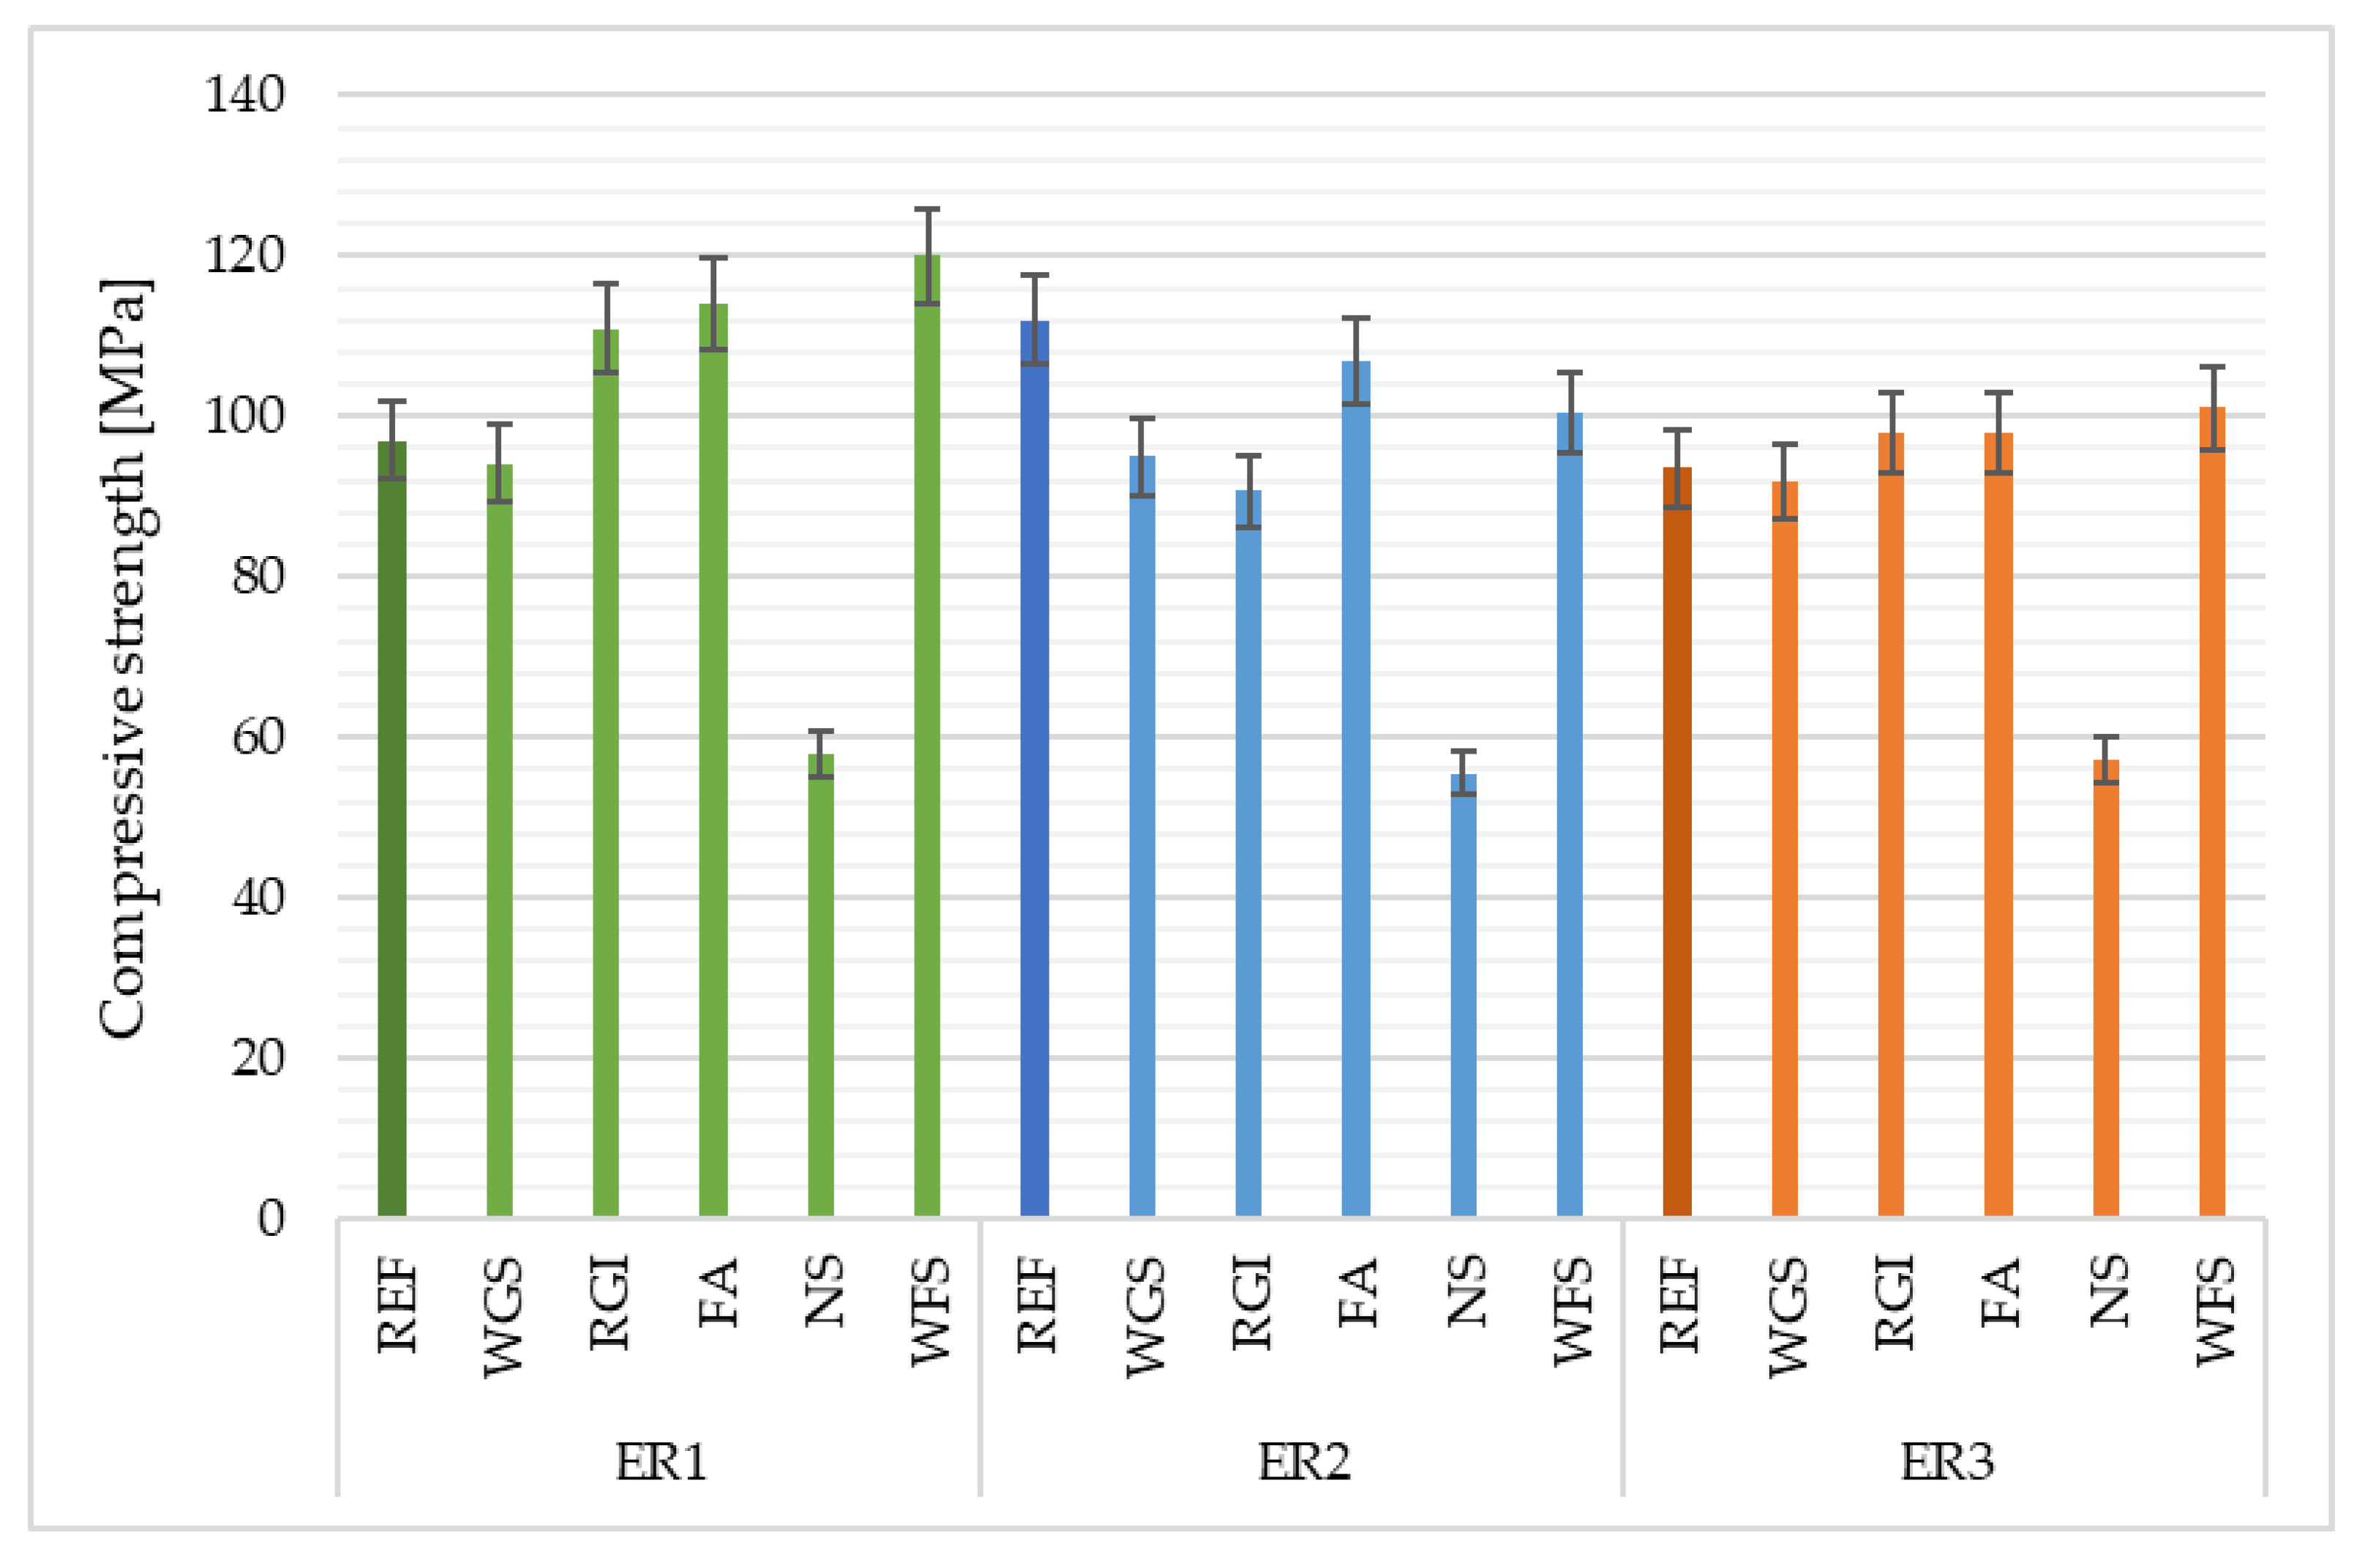
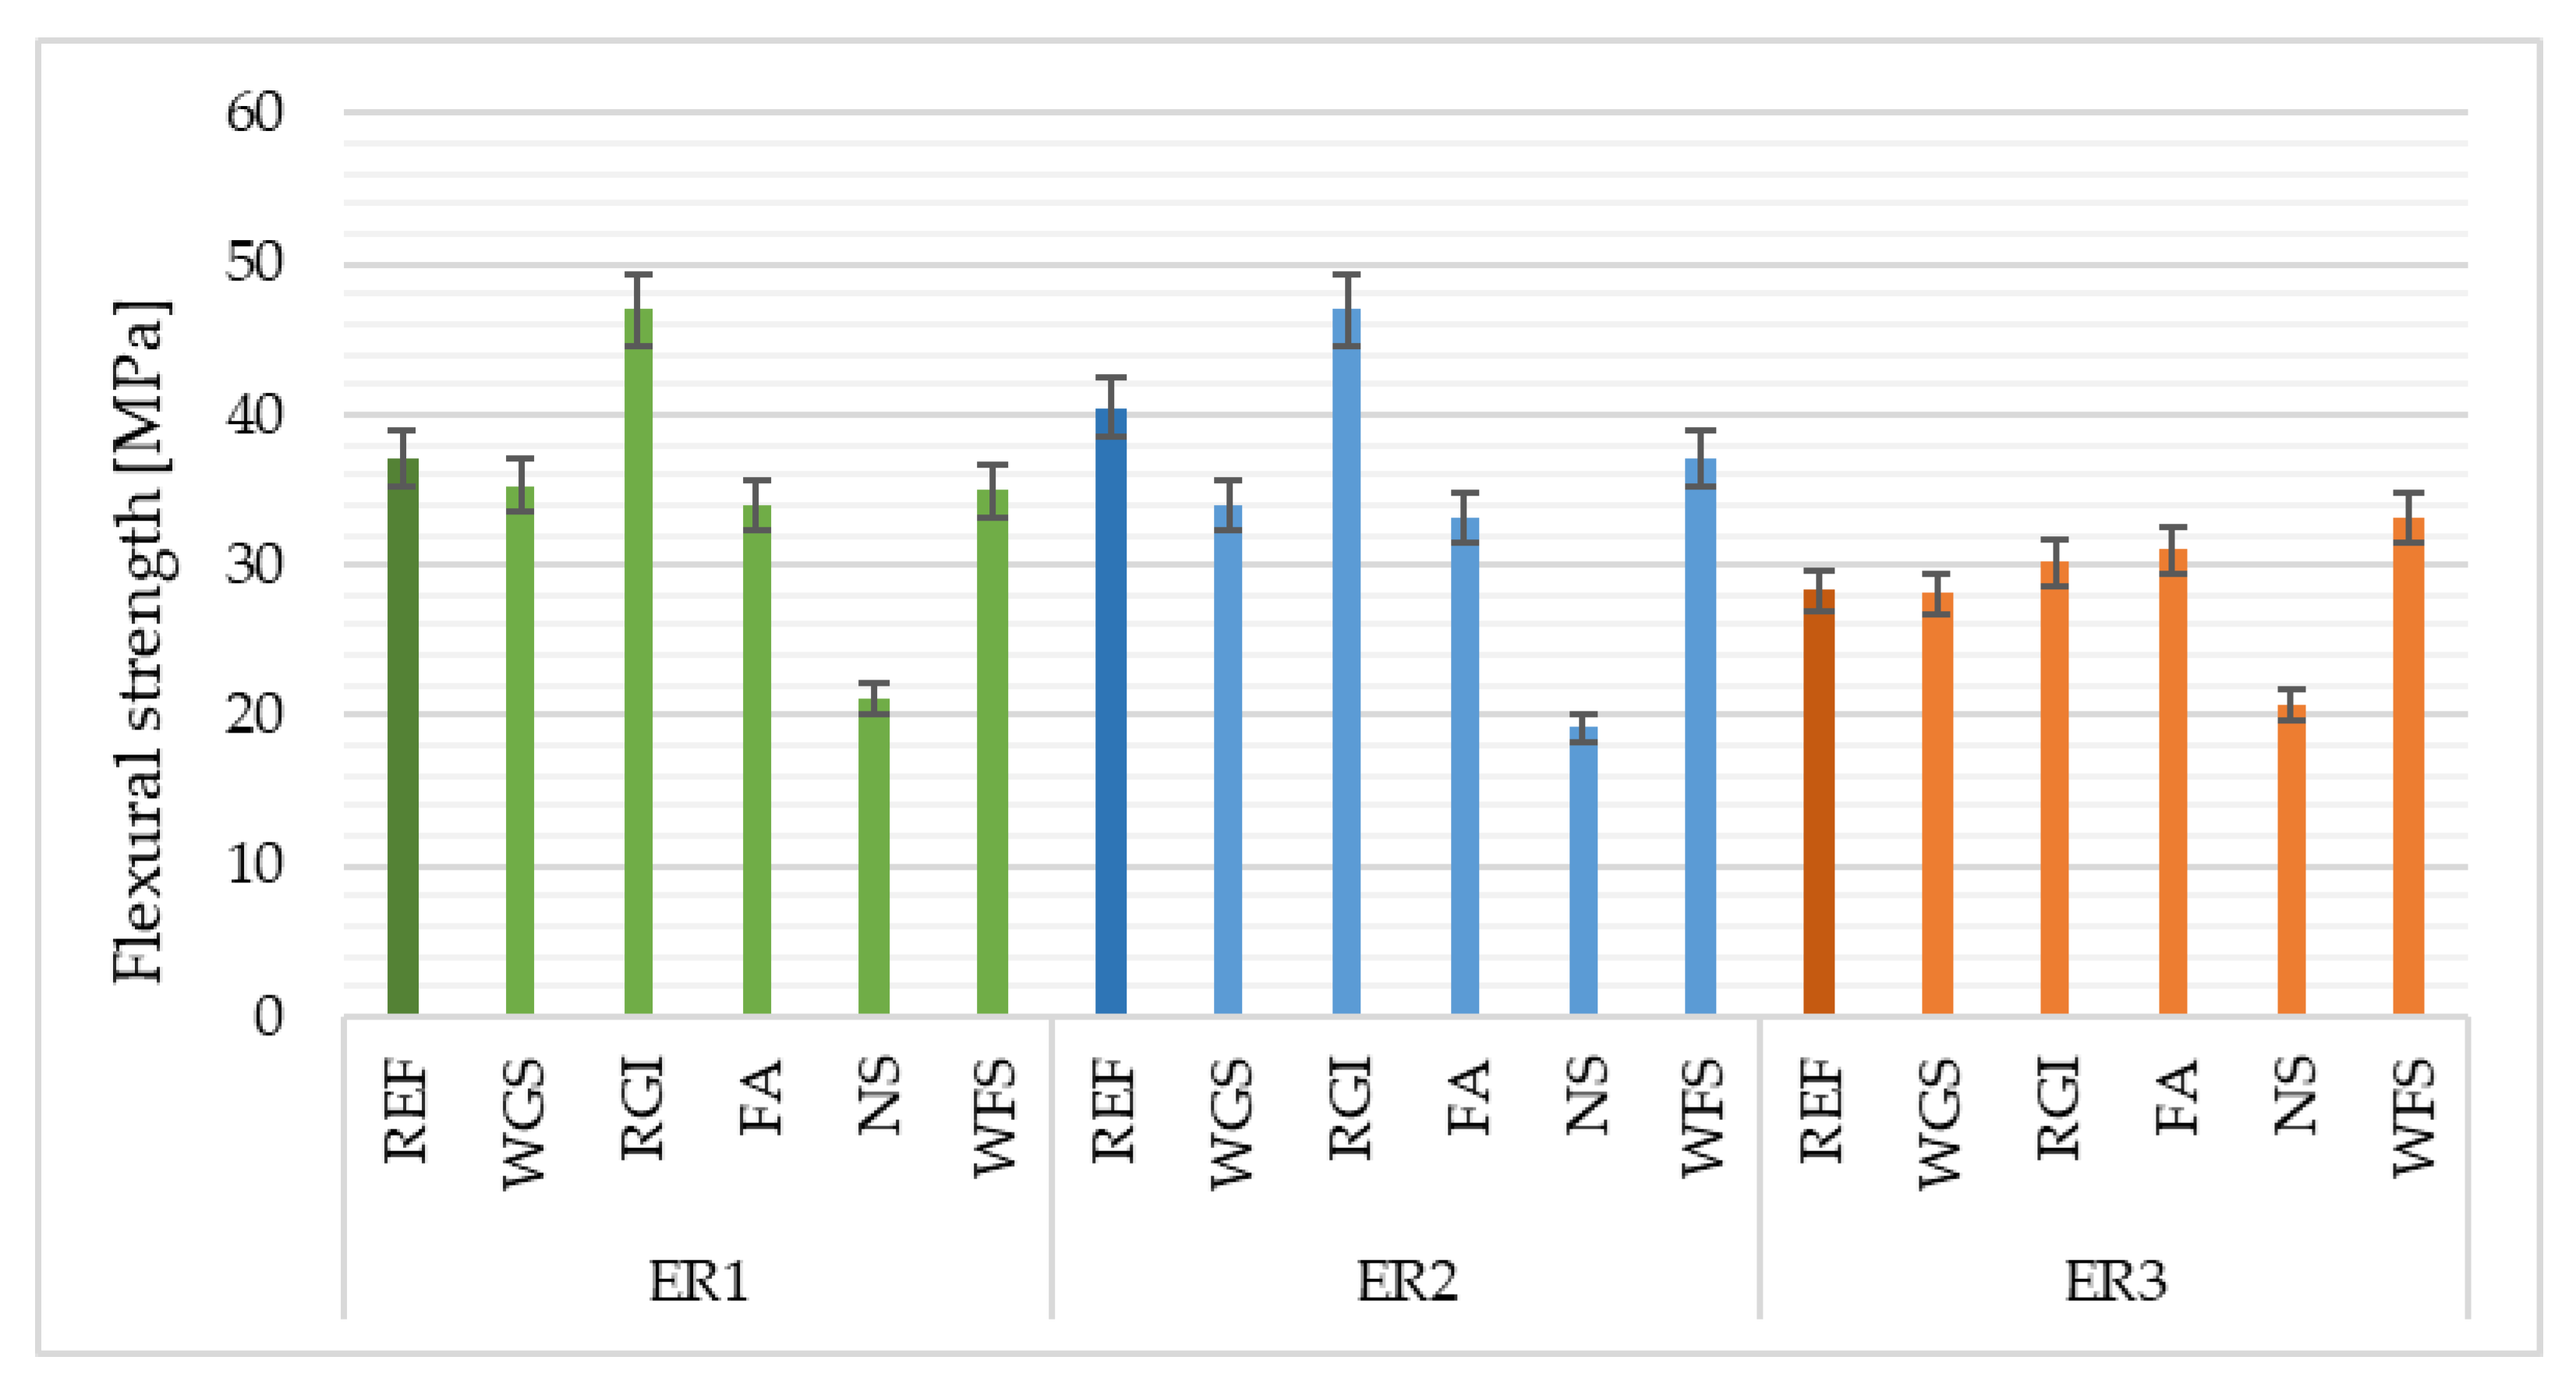
4.1. Compressive and Flexural Strength
4.2. Cohesion with Concrete
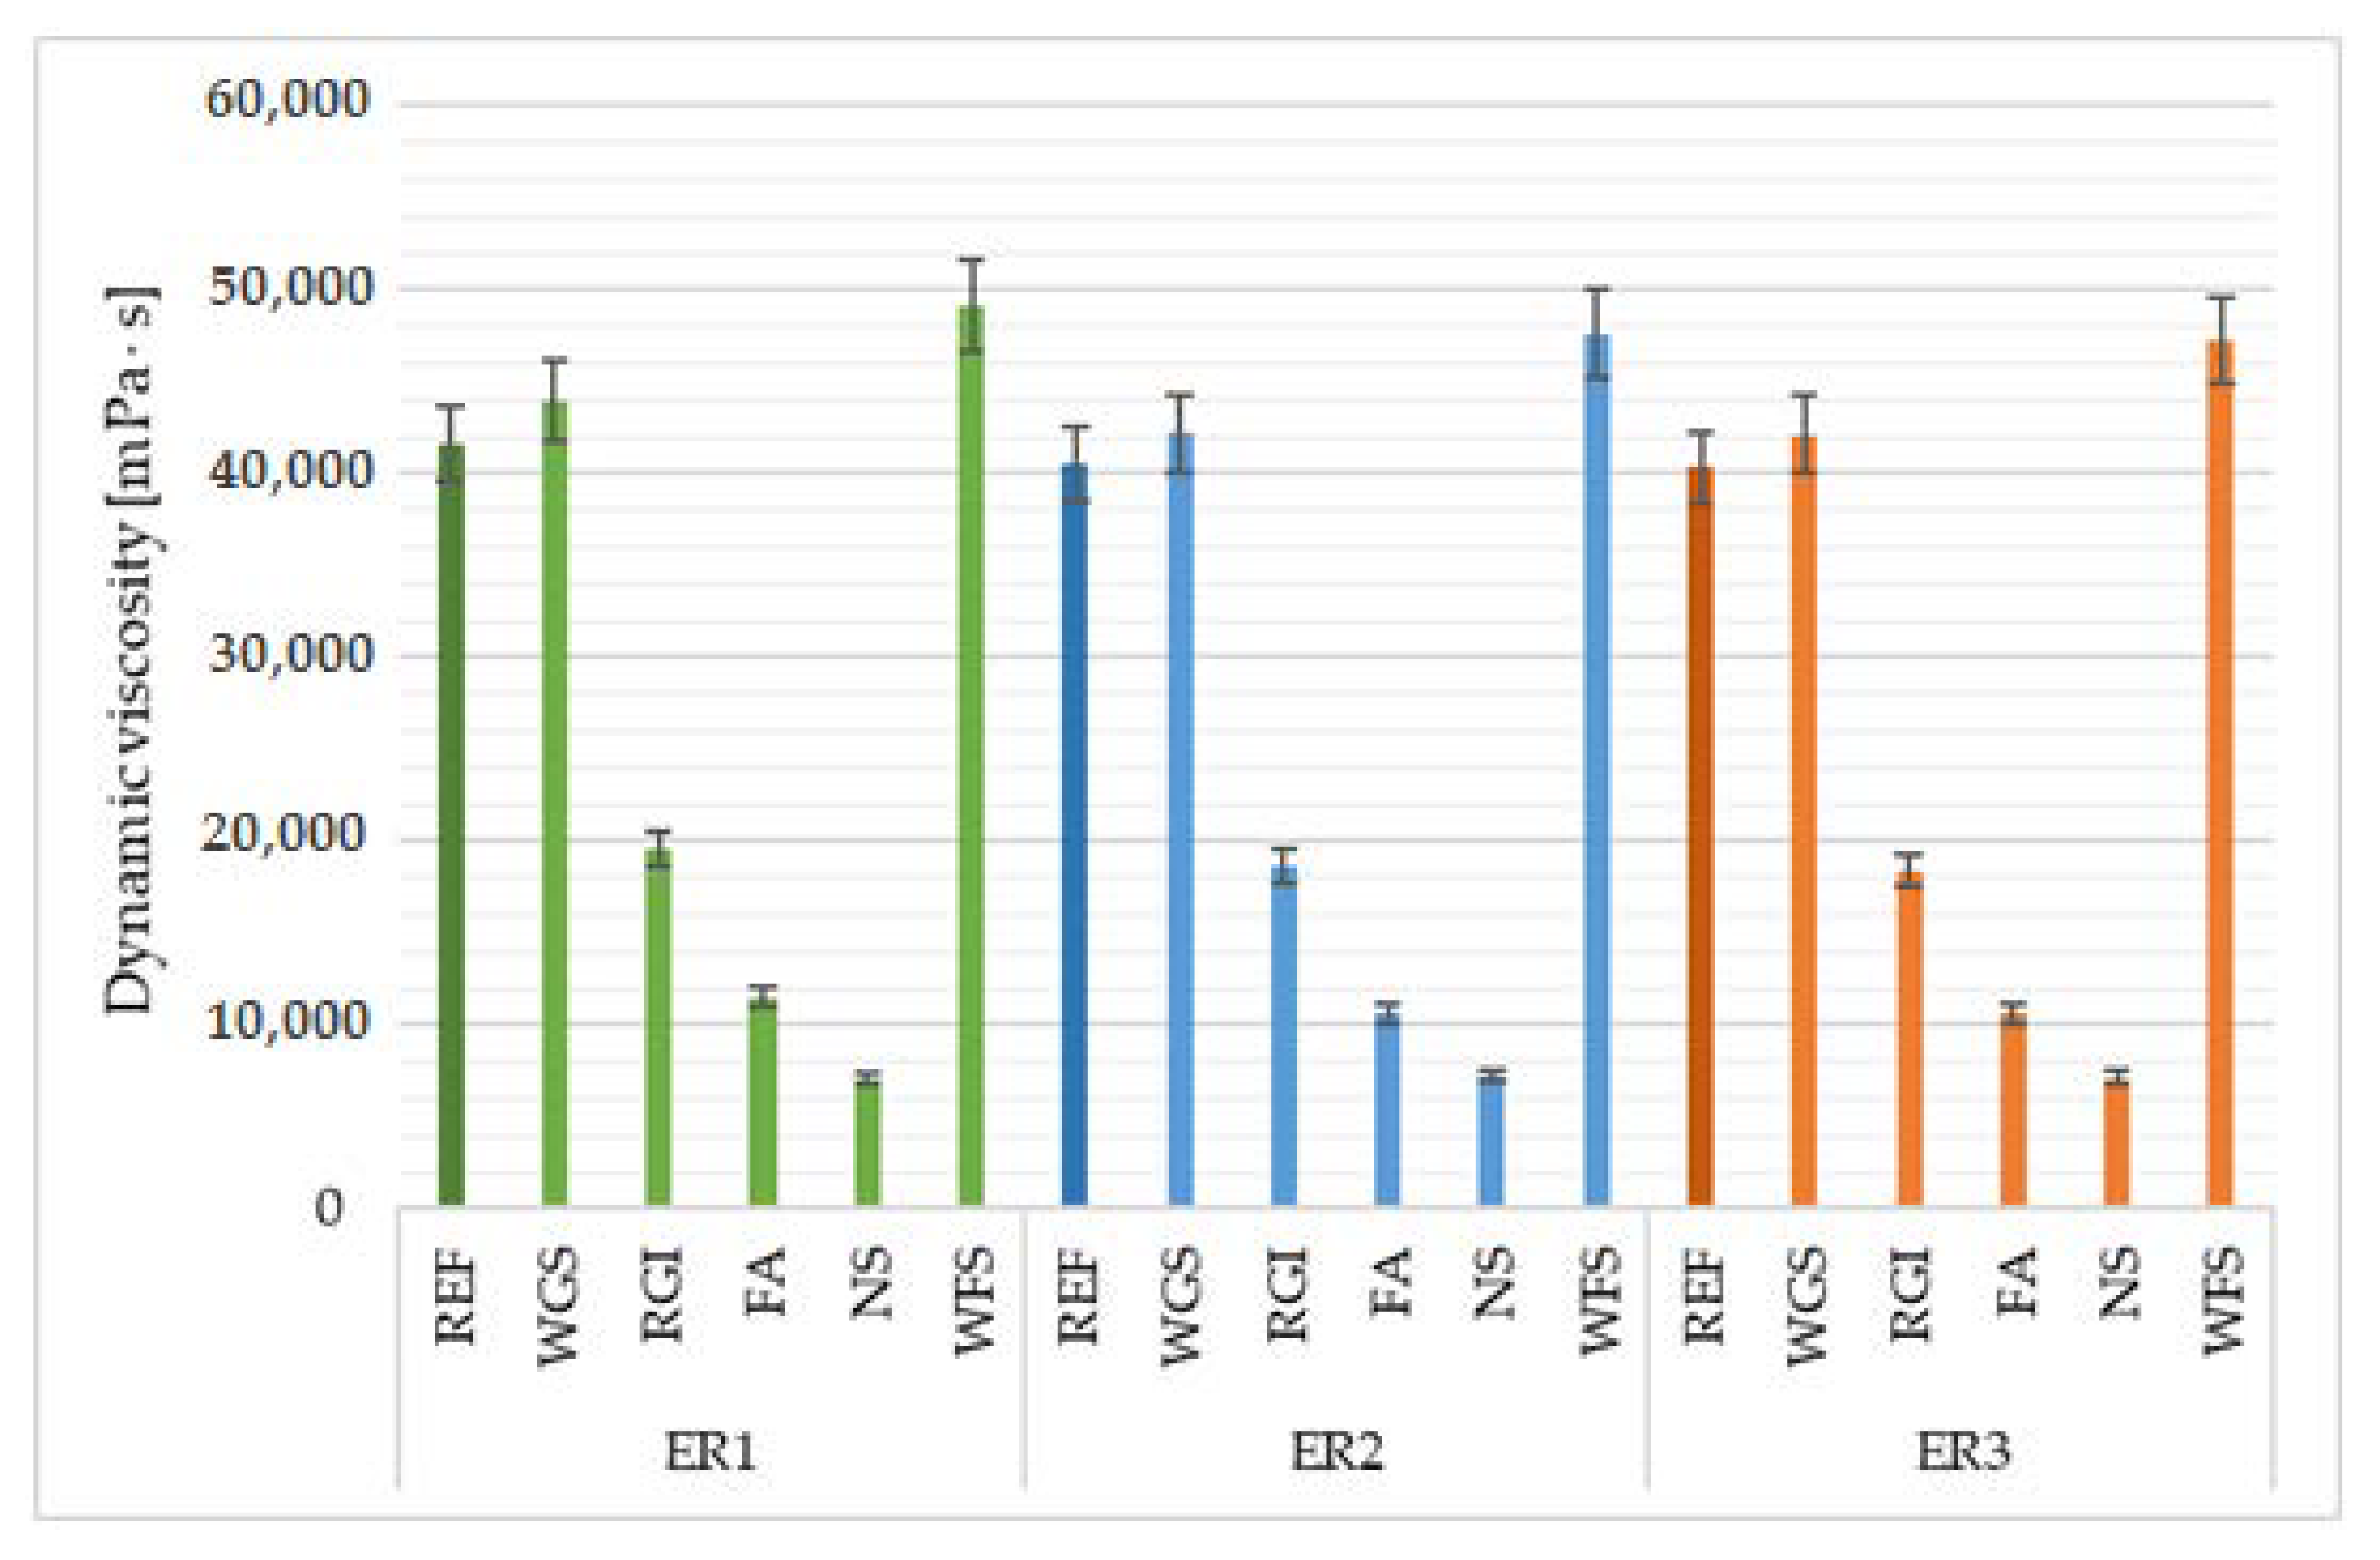
4.3. Dynamic Viscosity
4.4. Abrasion Resistance
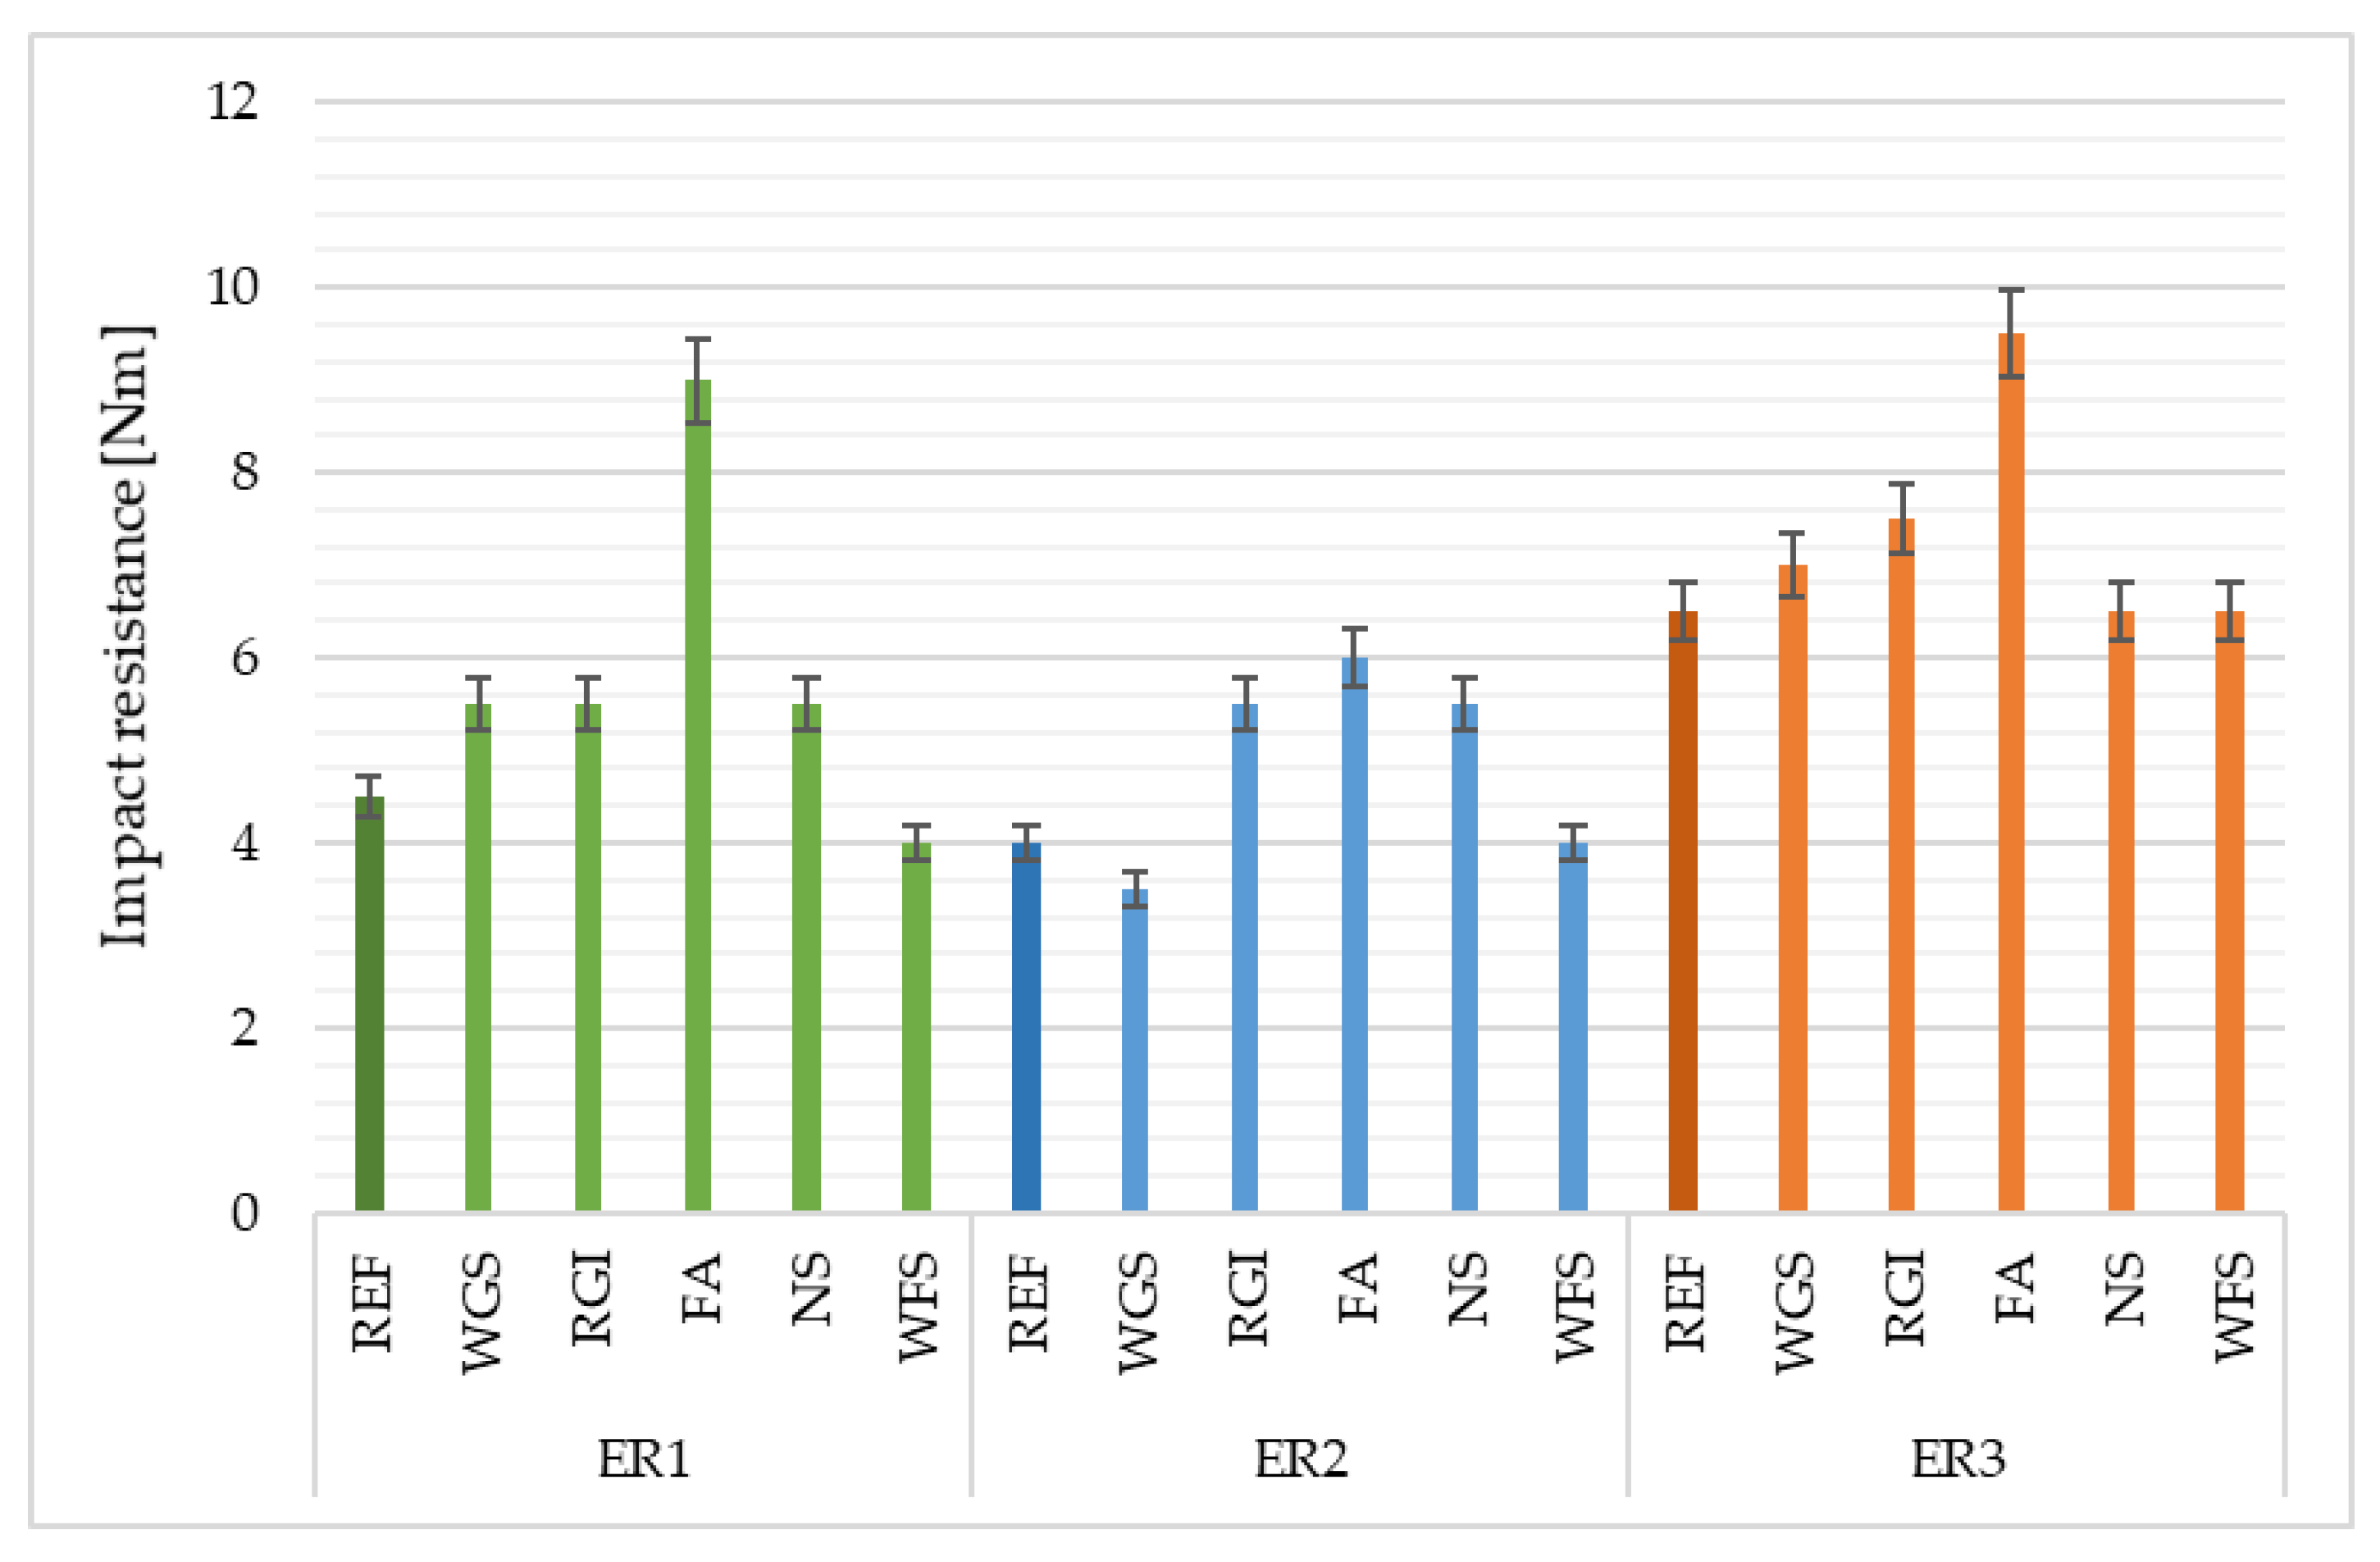
4.5. Impact Resistance
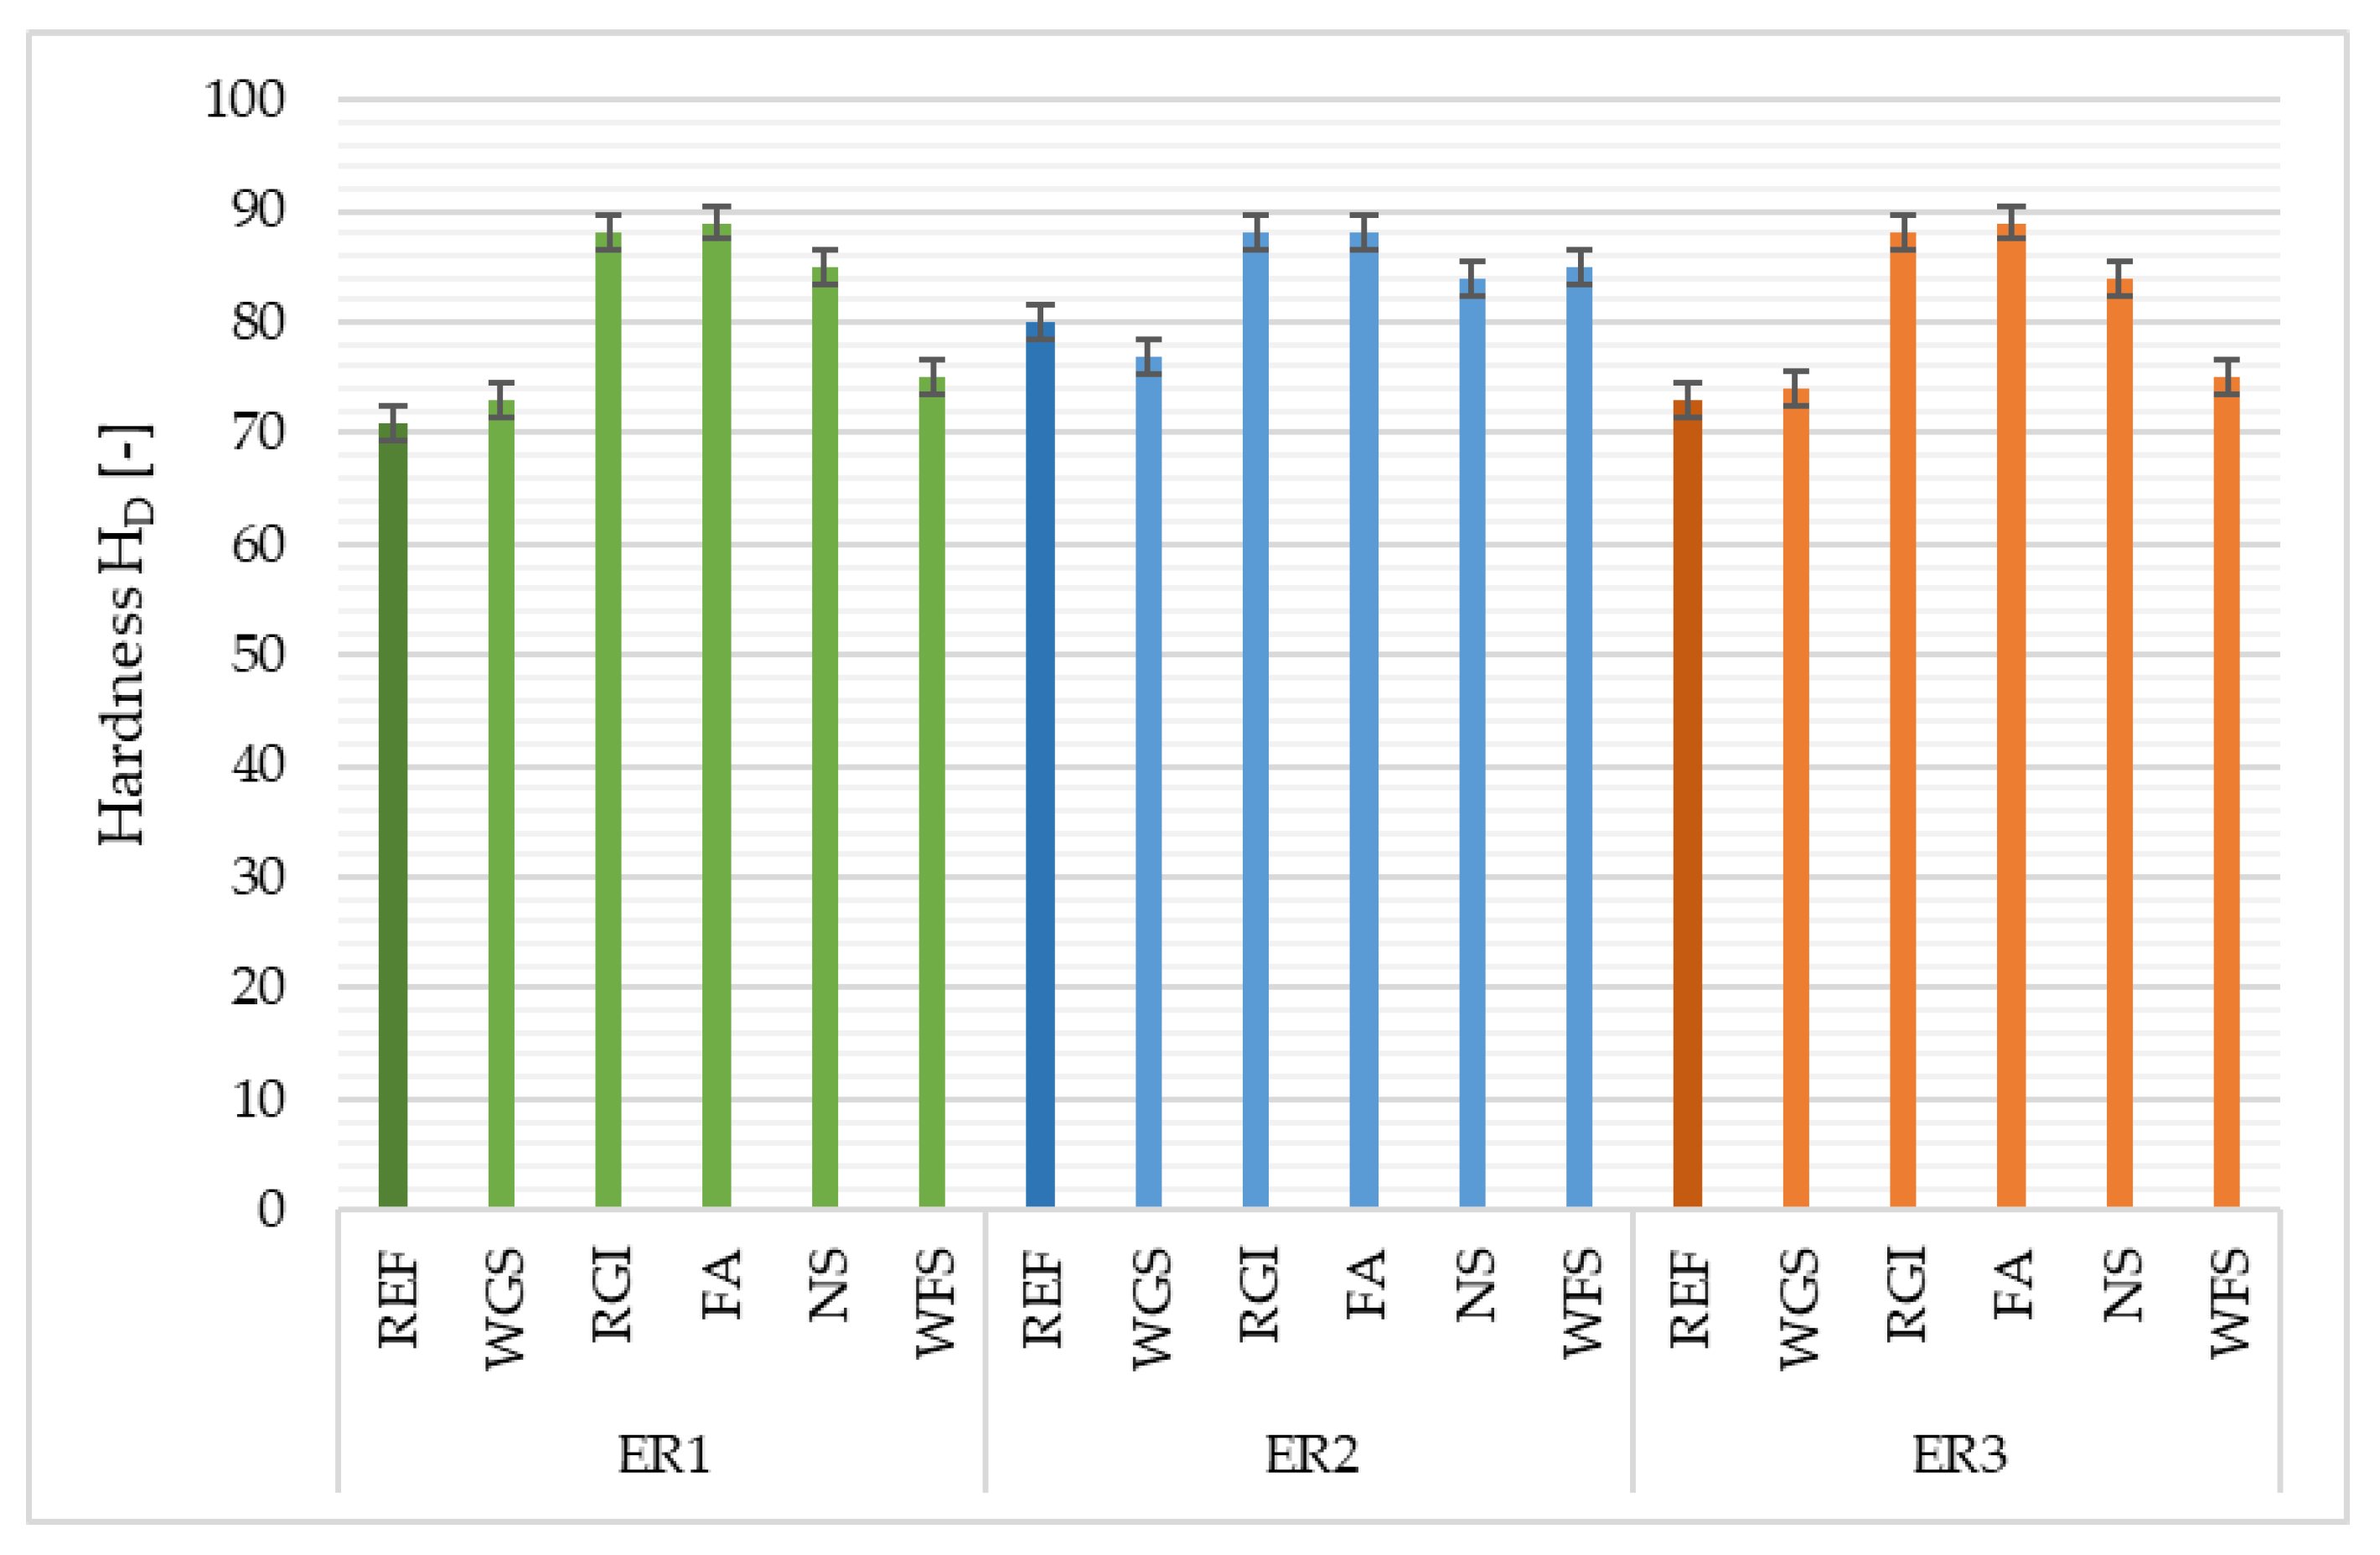
4.6. Hardness
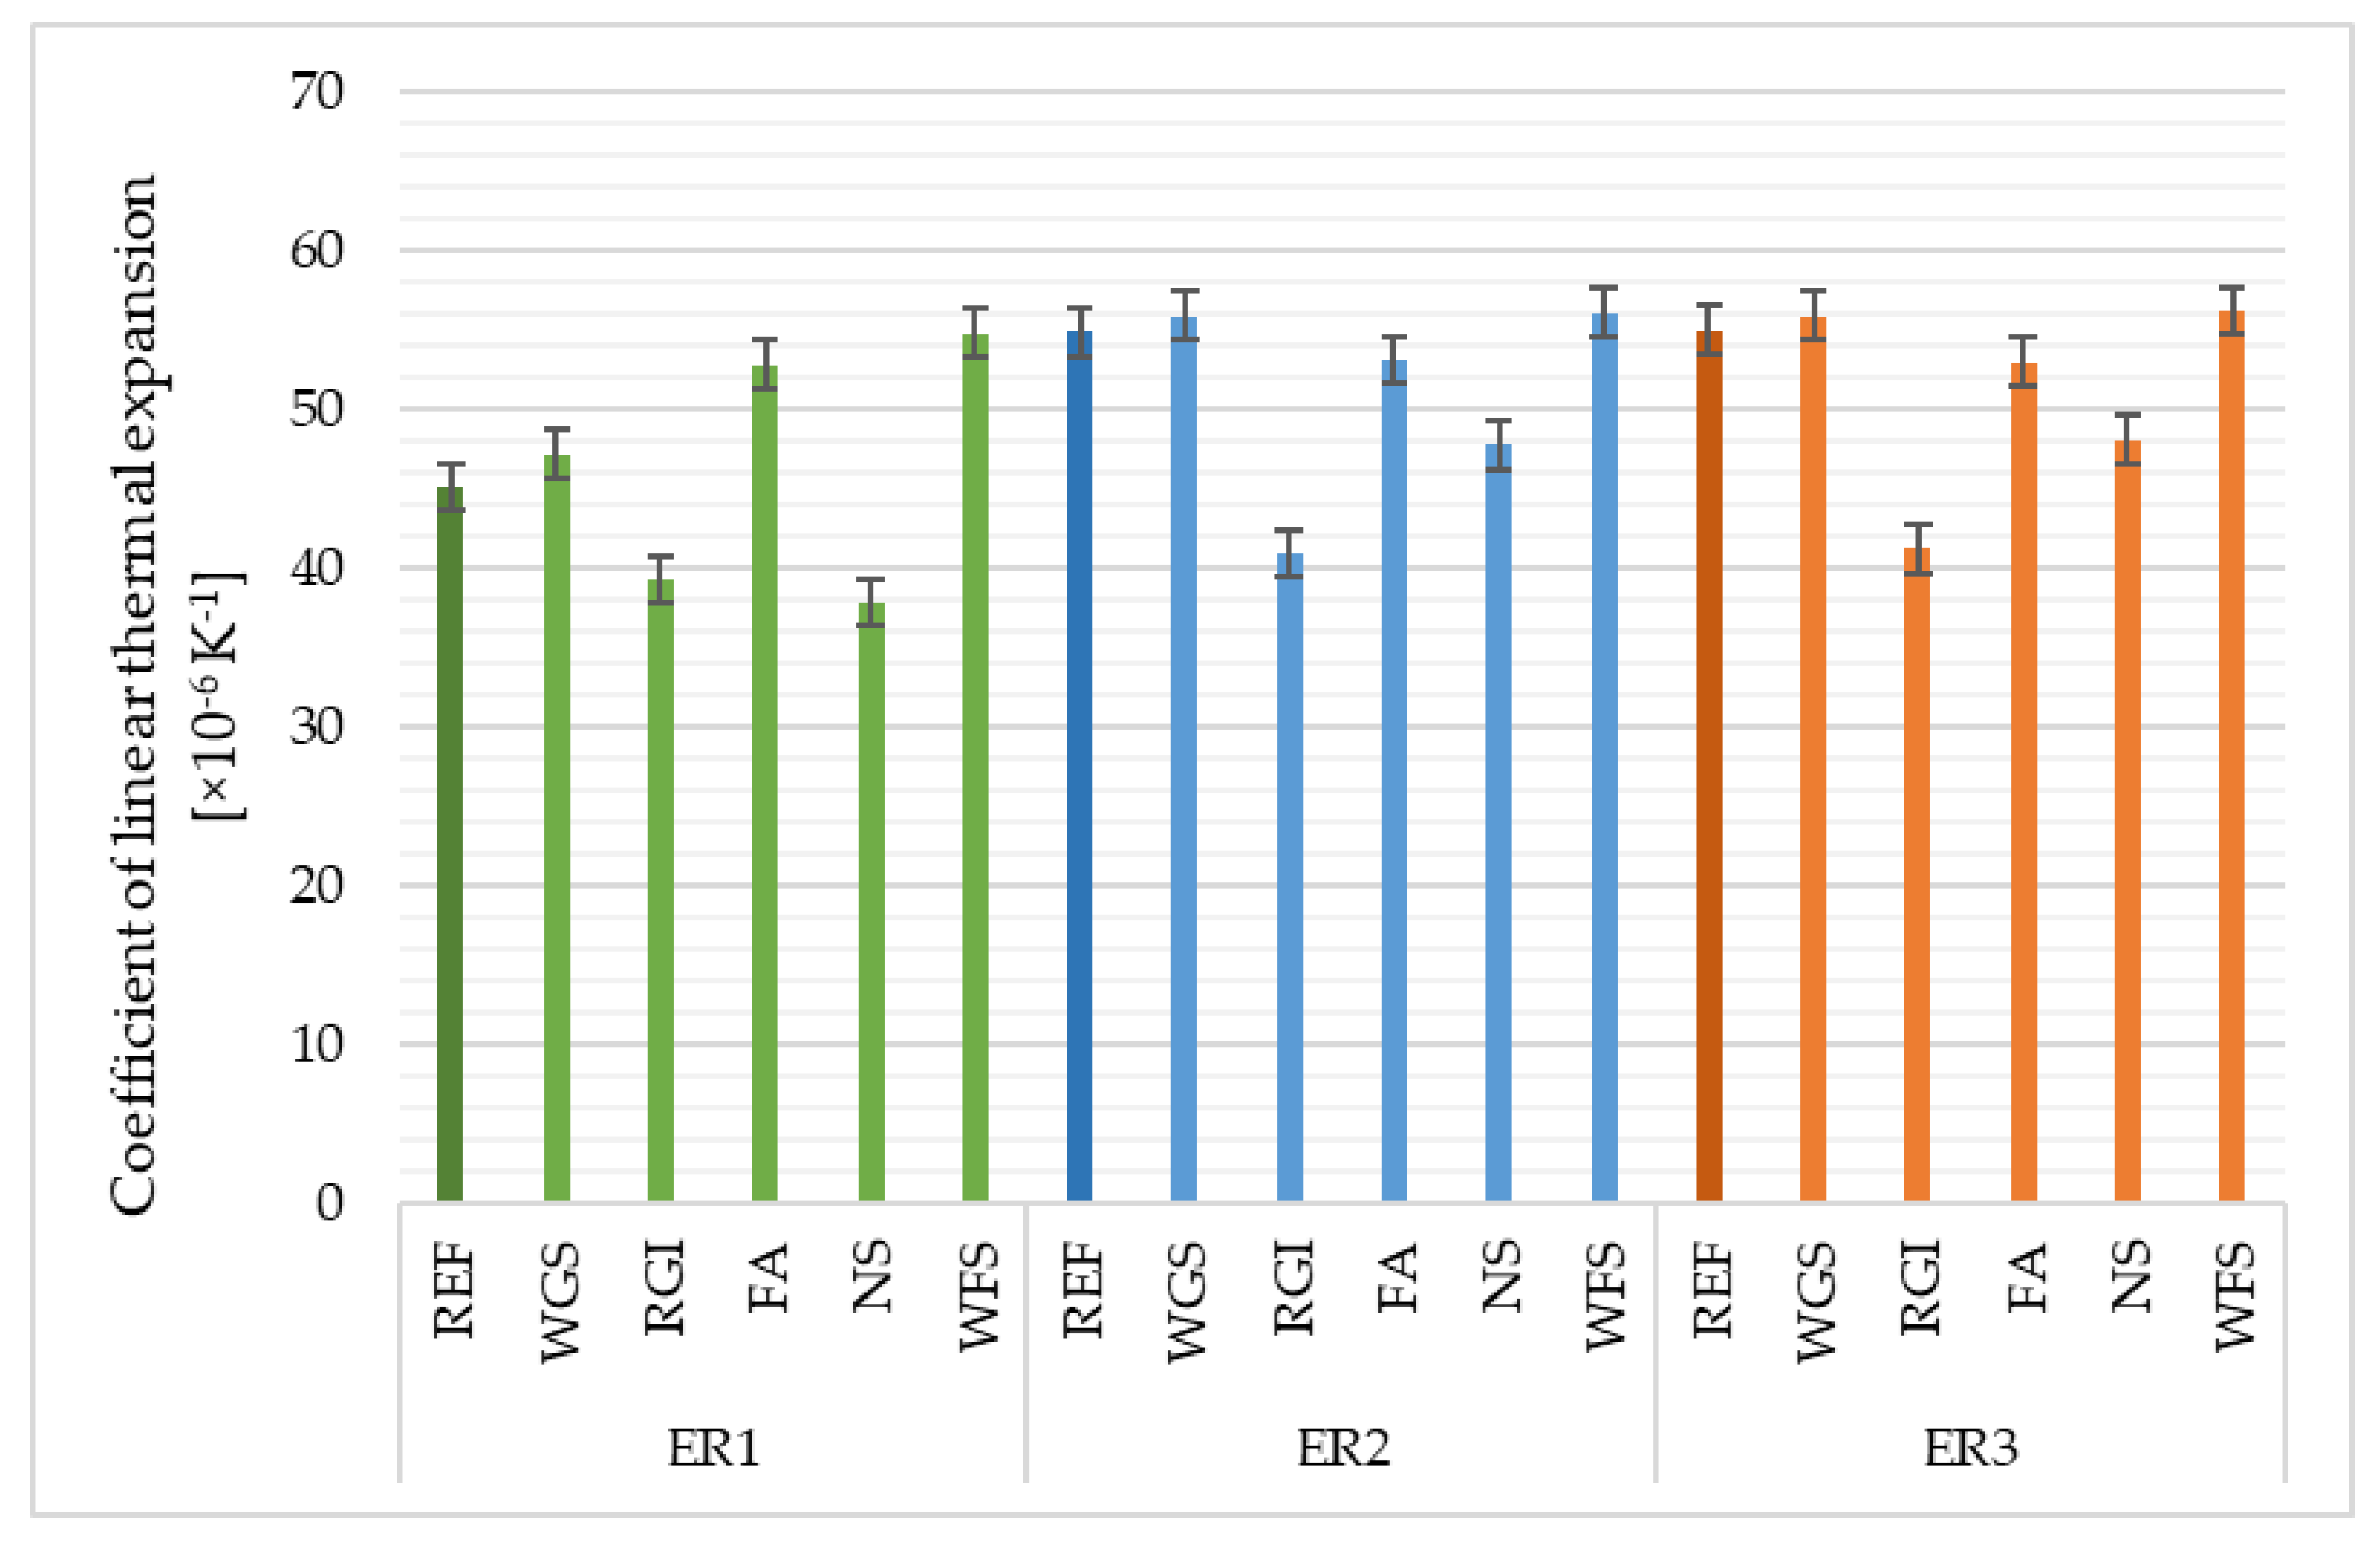
4.7. Coefficient of Linear Thermal Expansion
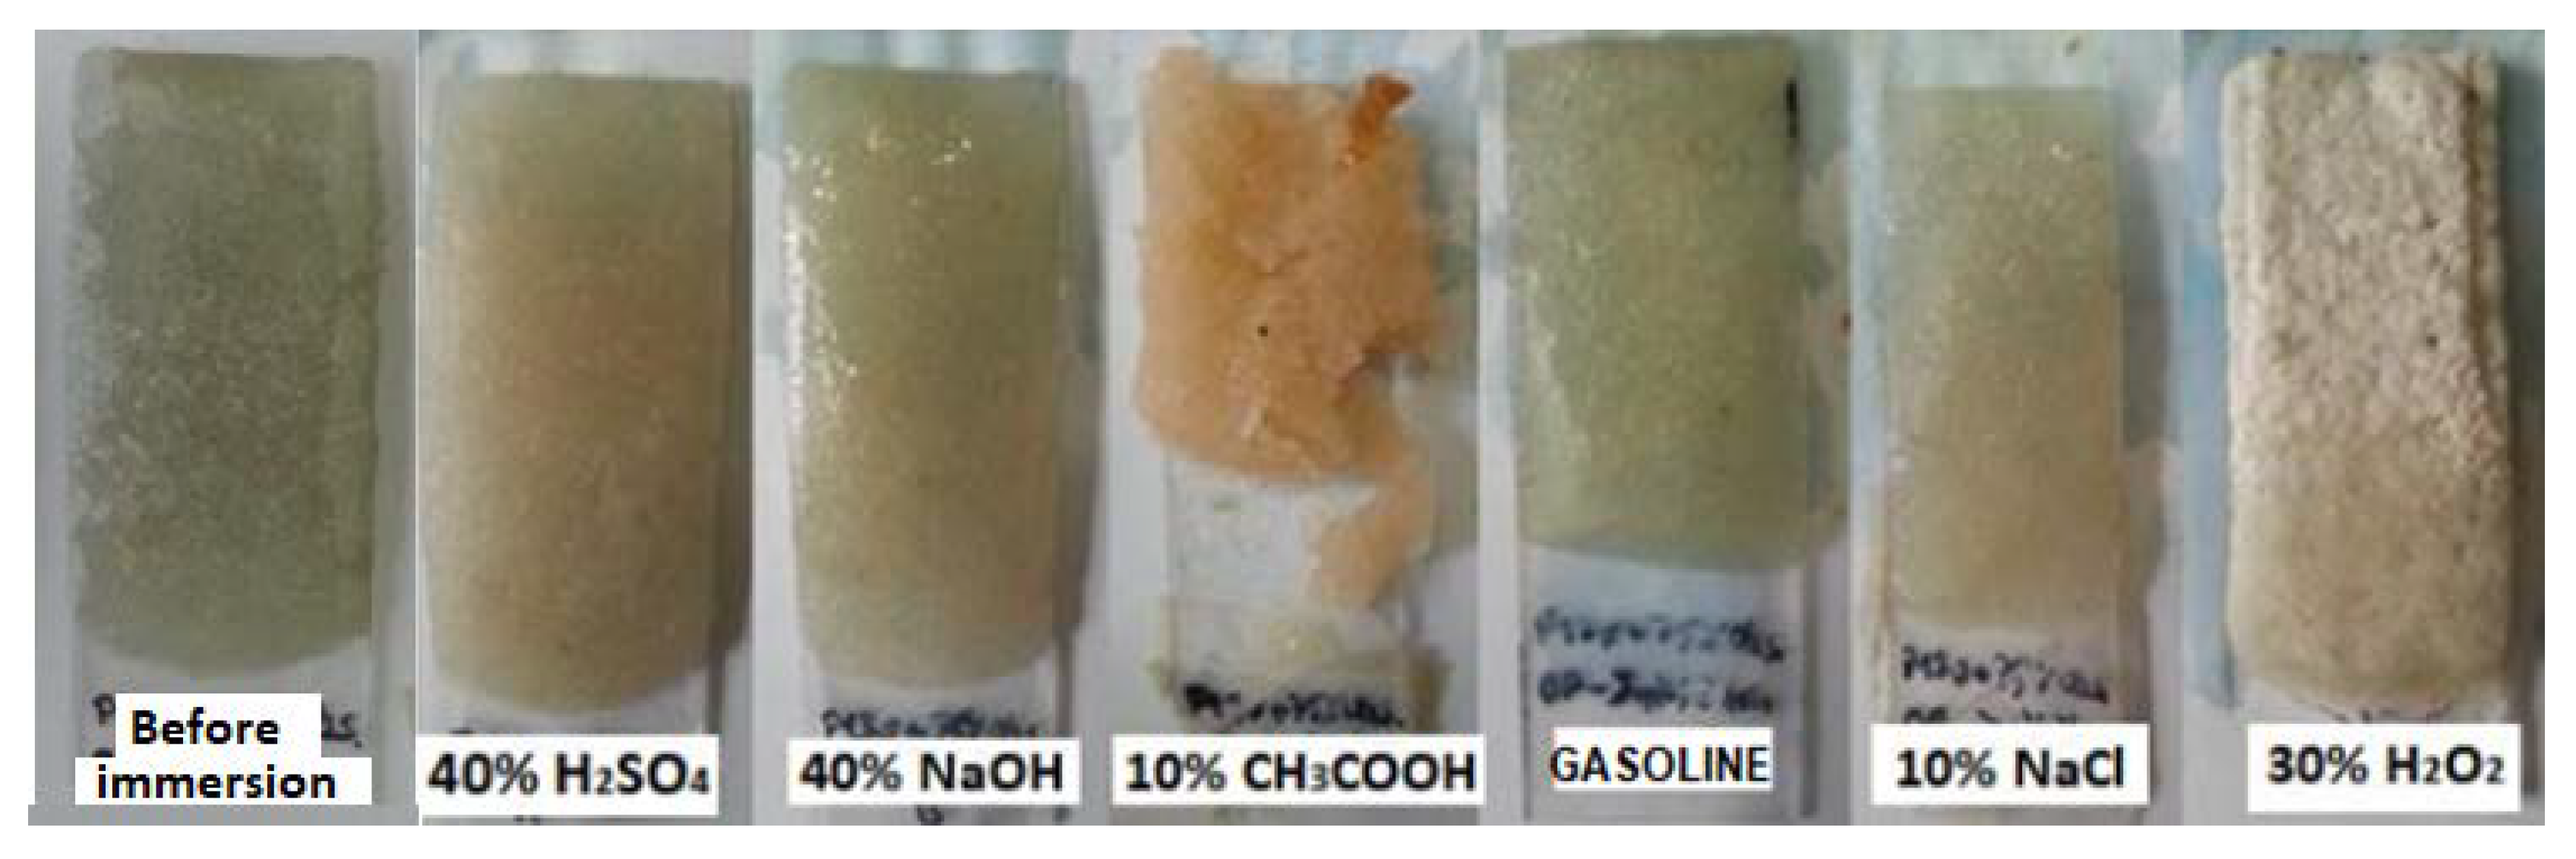
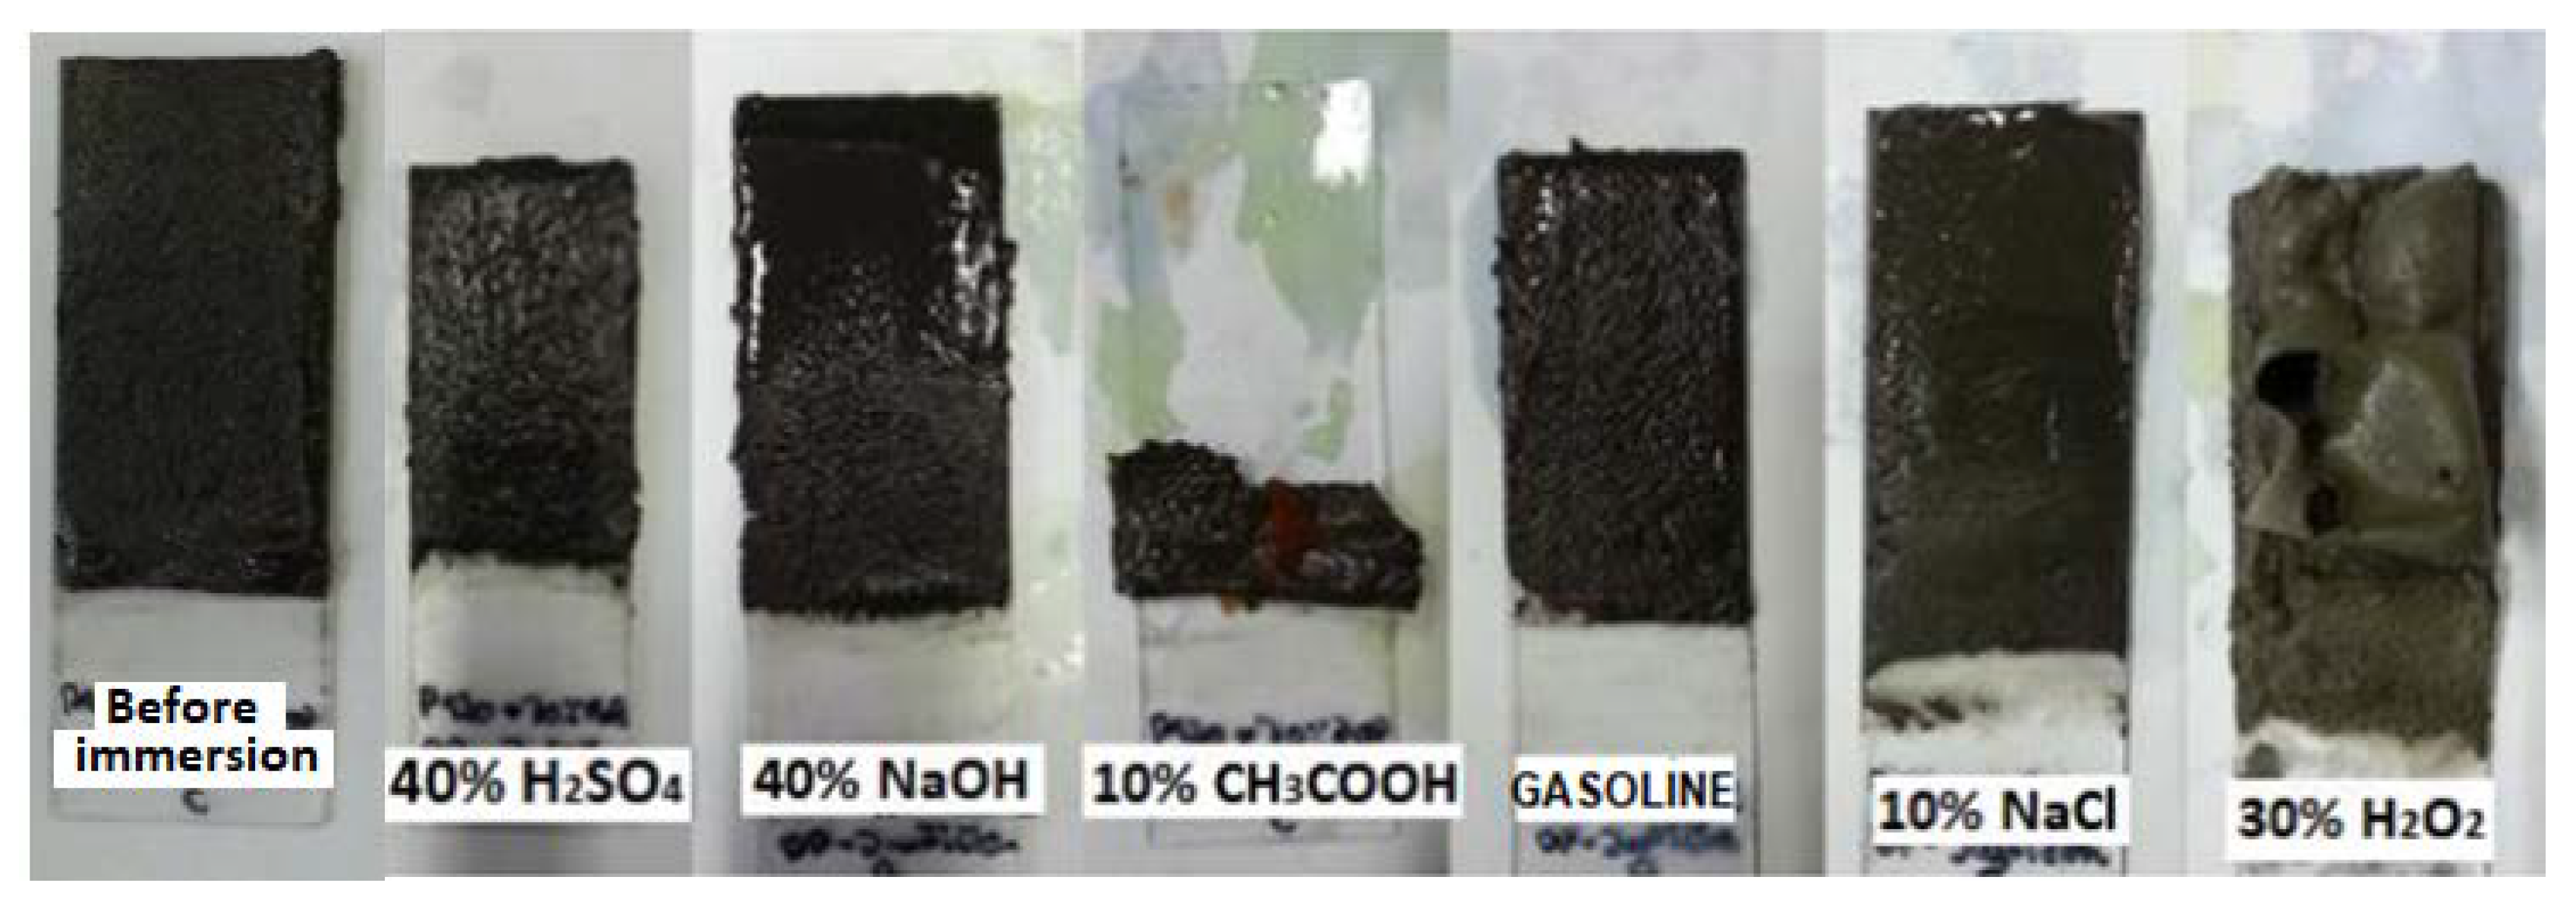
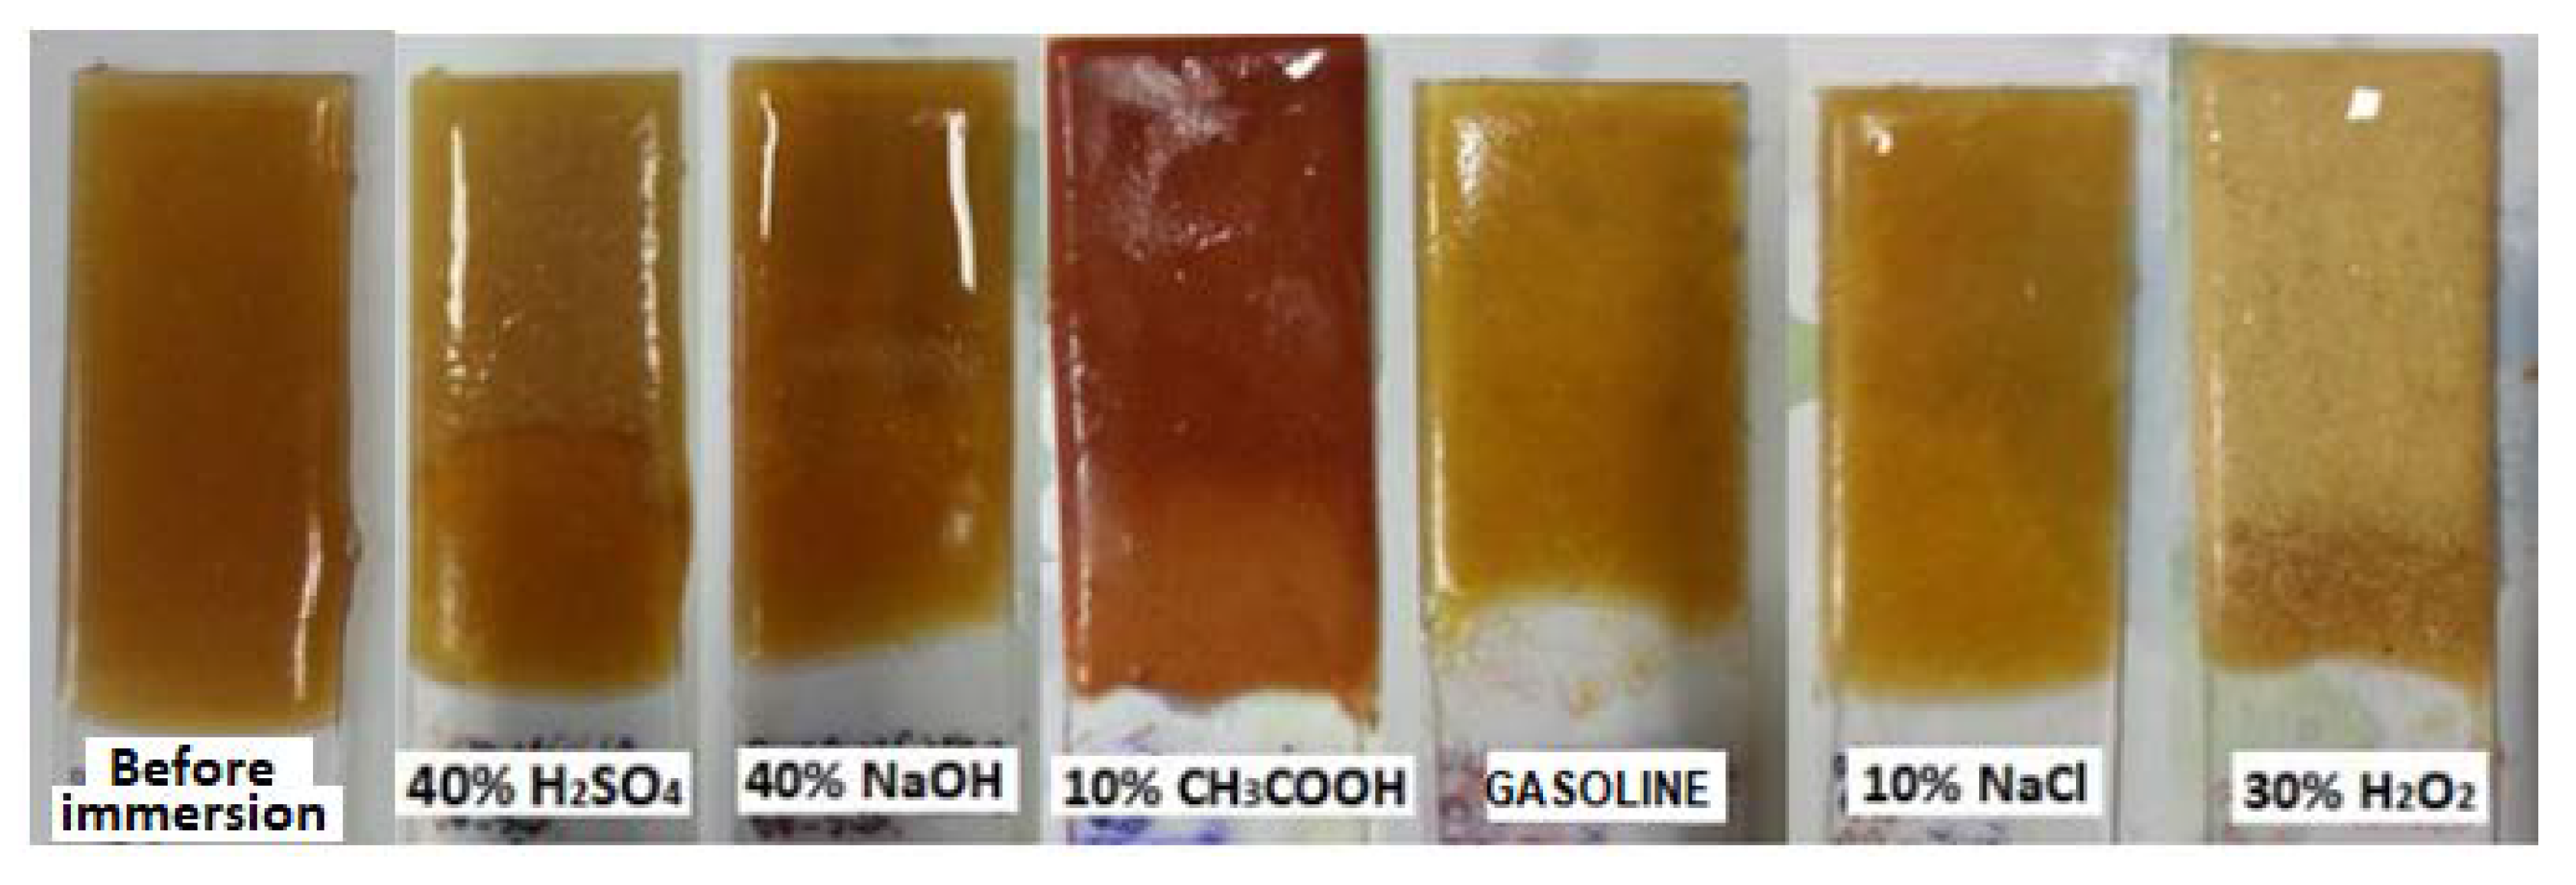
4.8. Effects of the Aggressive Environment
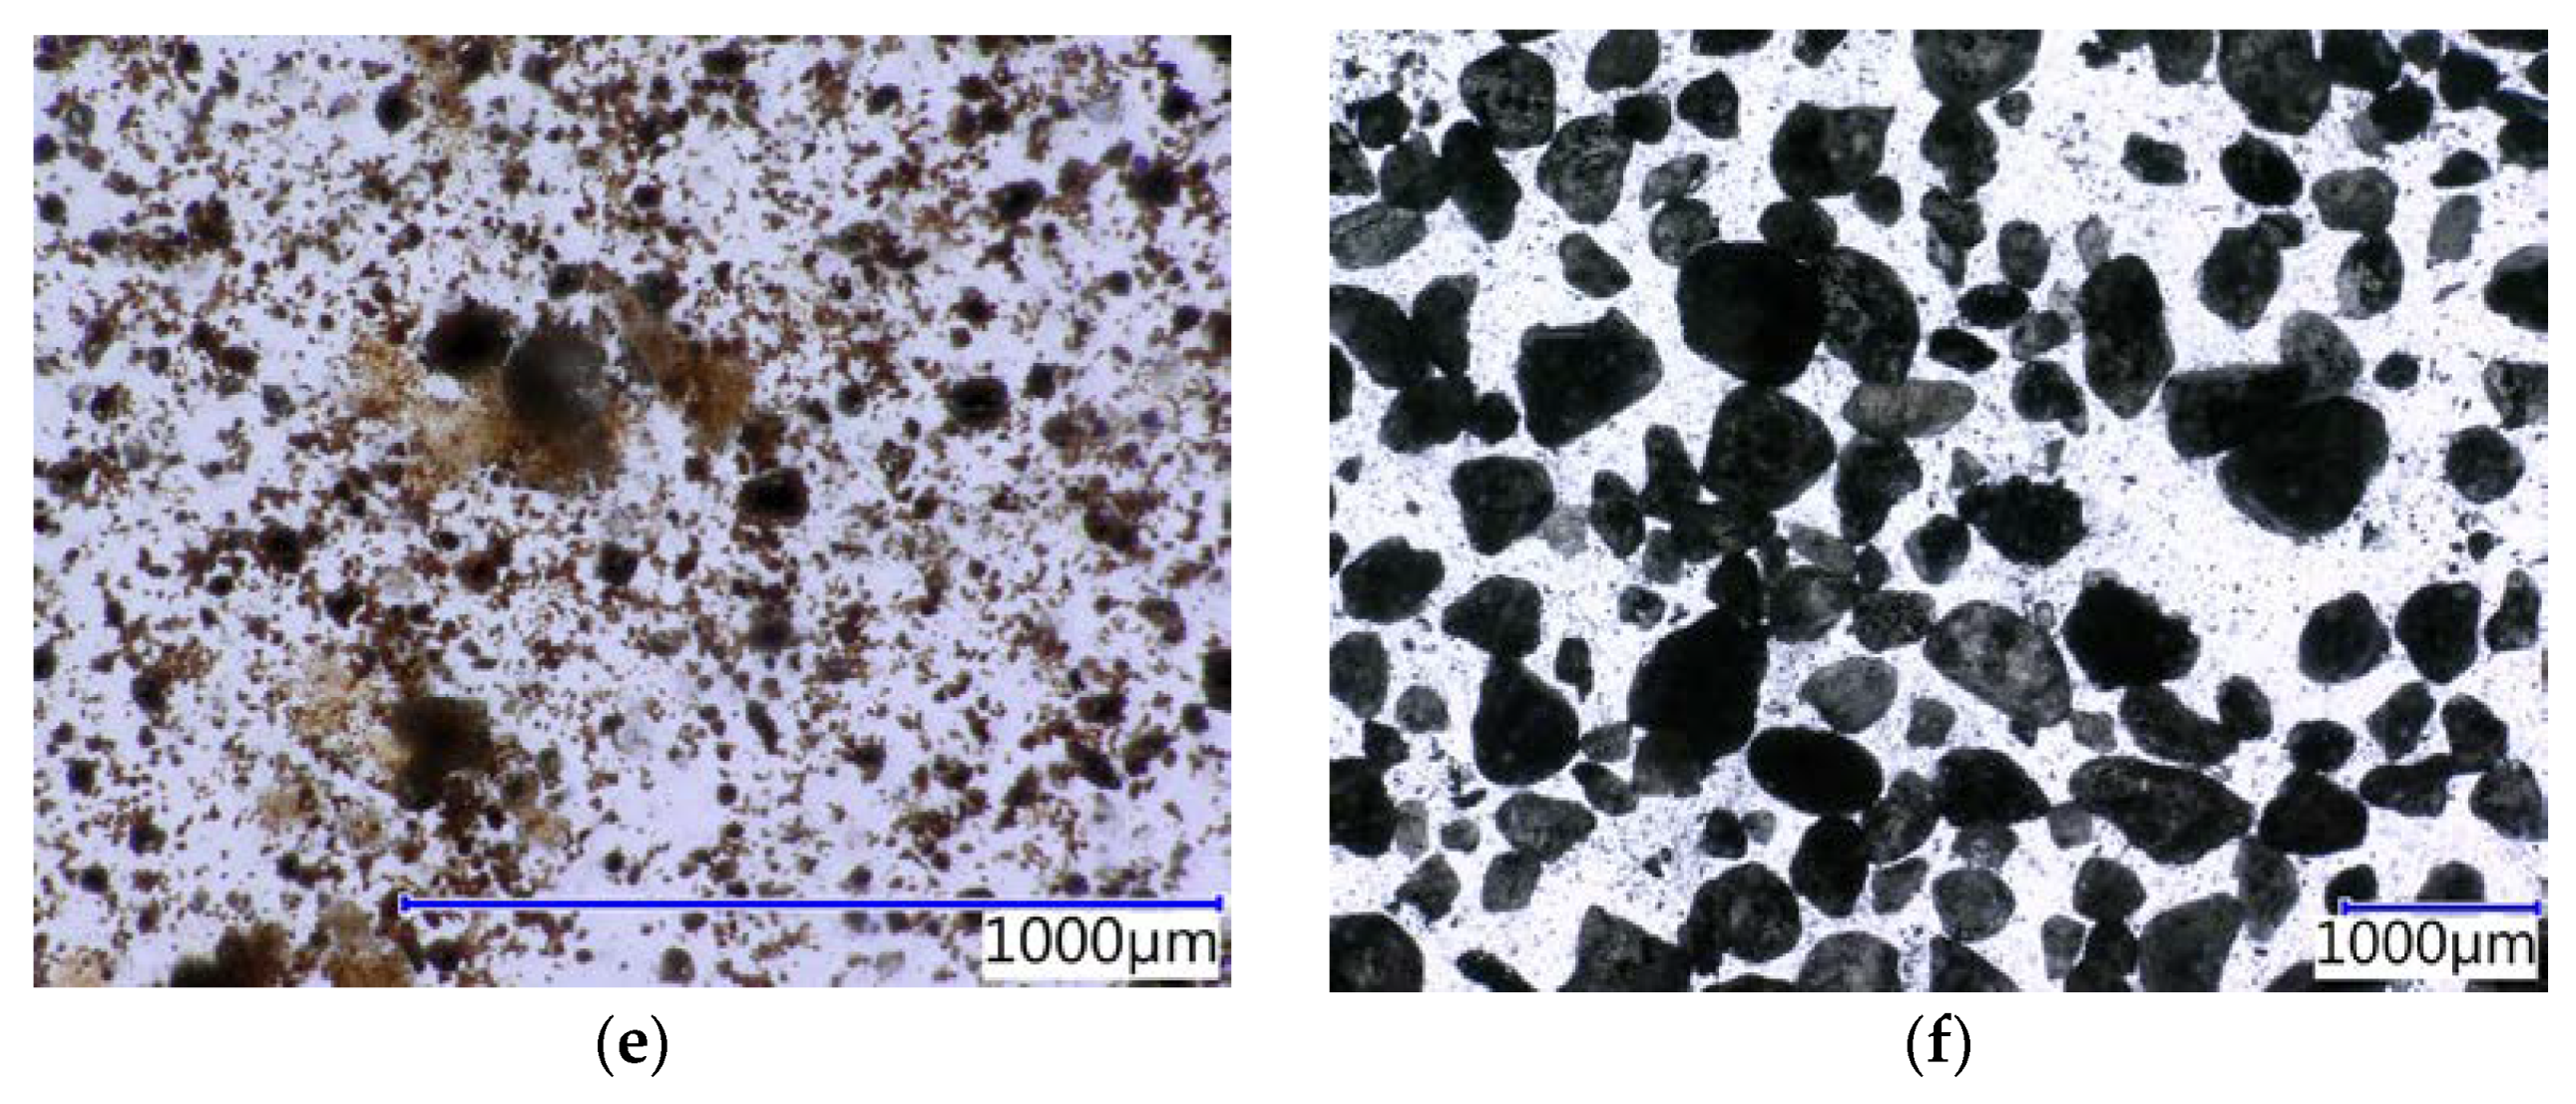
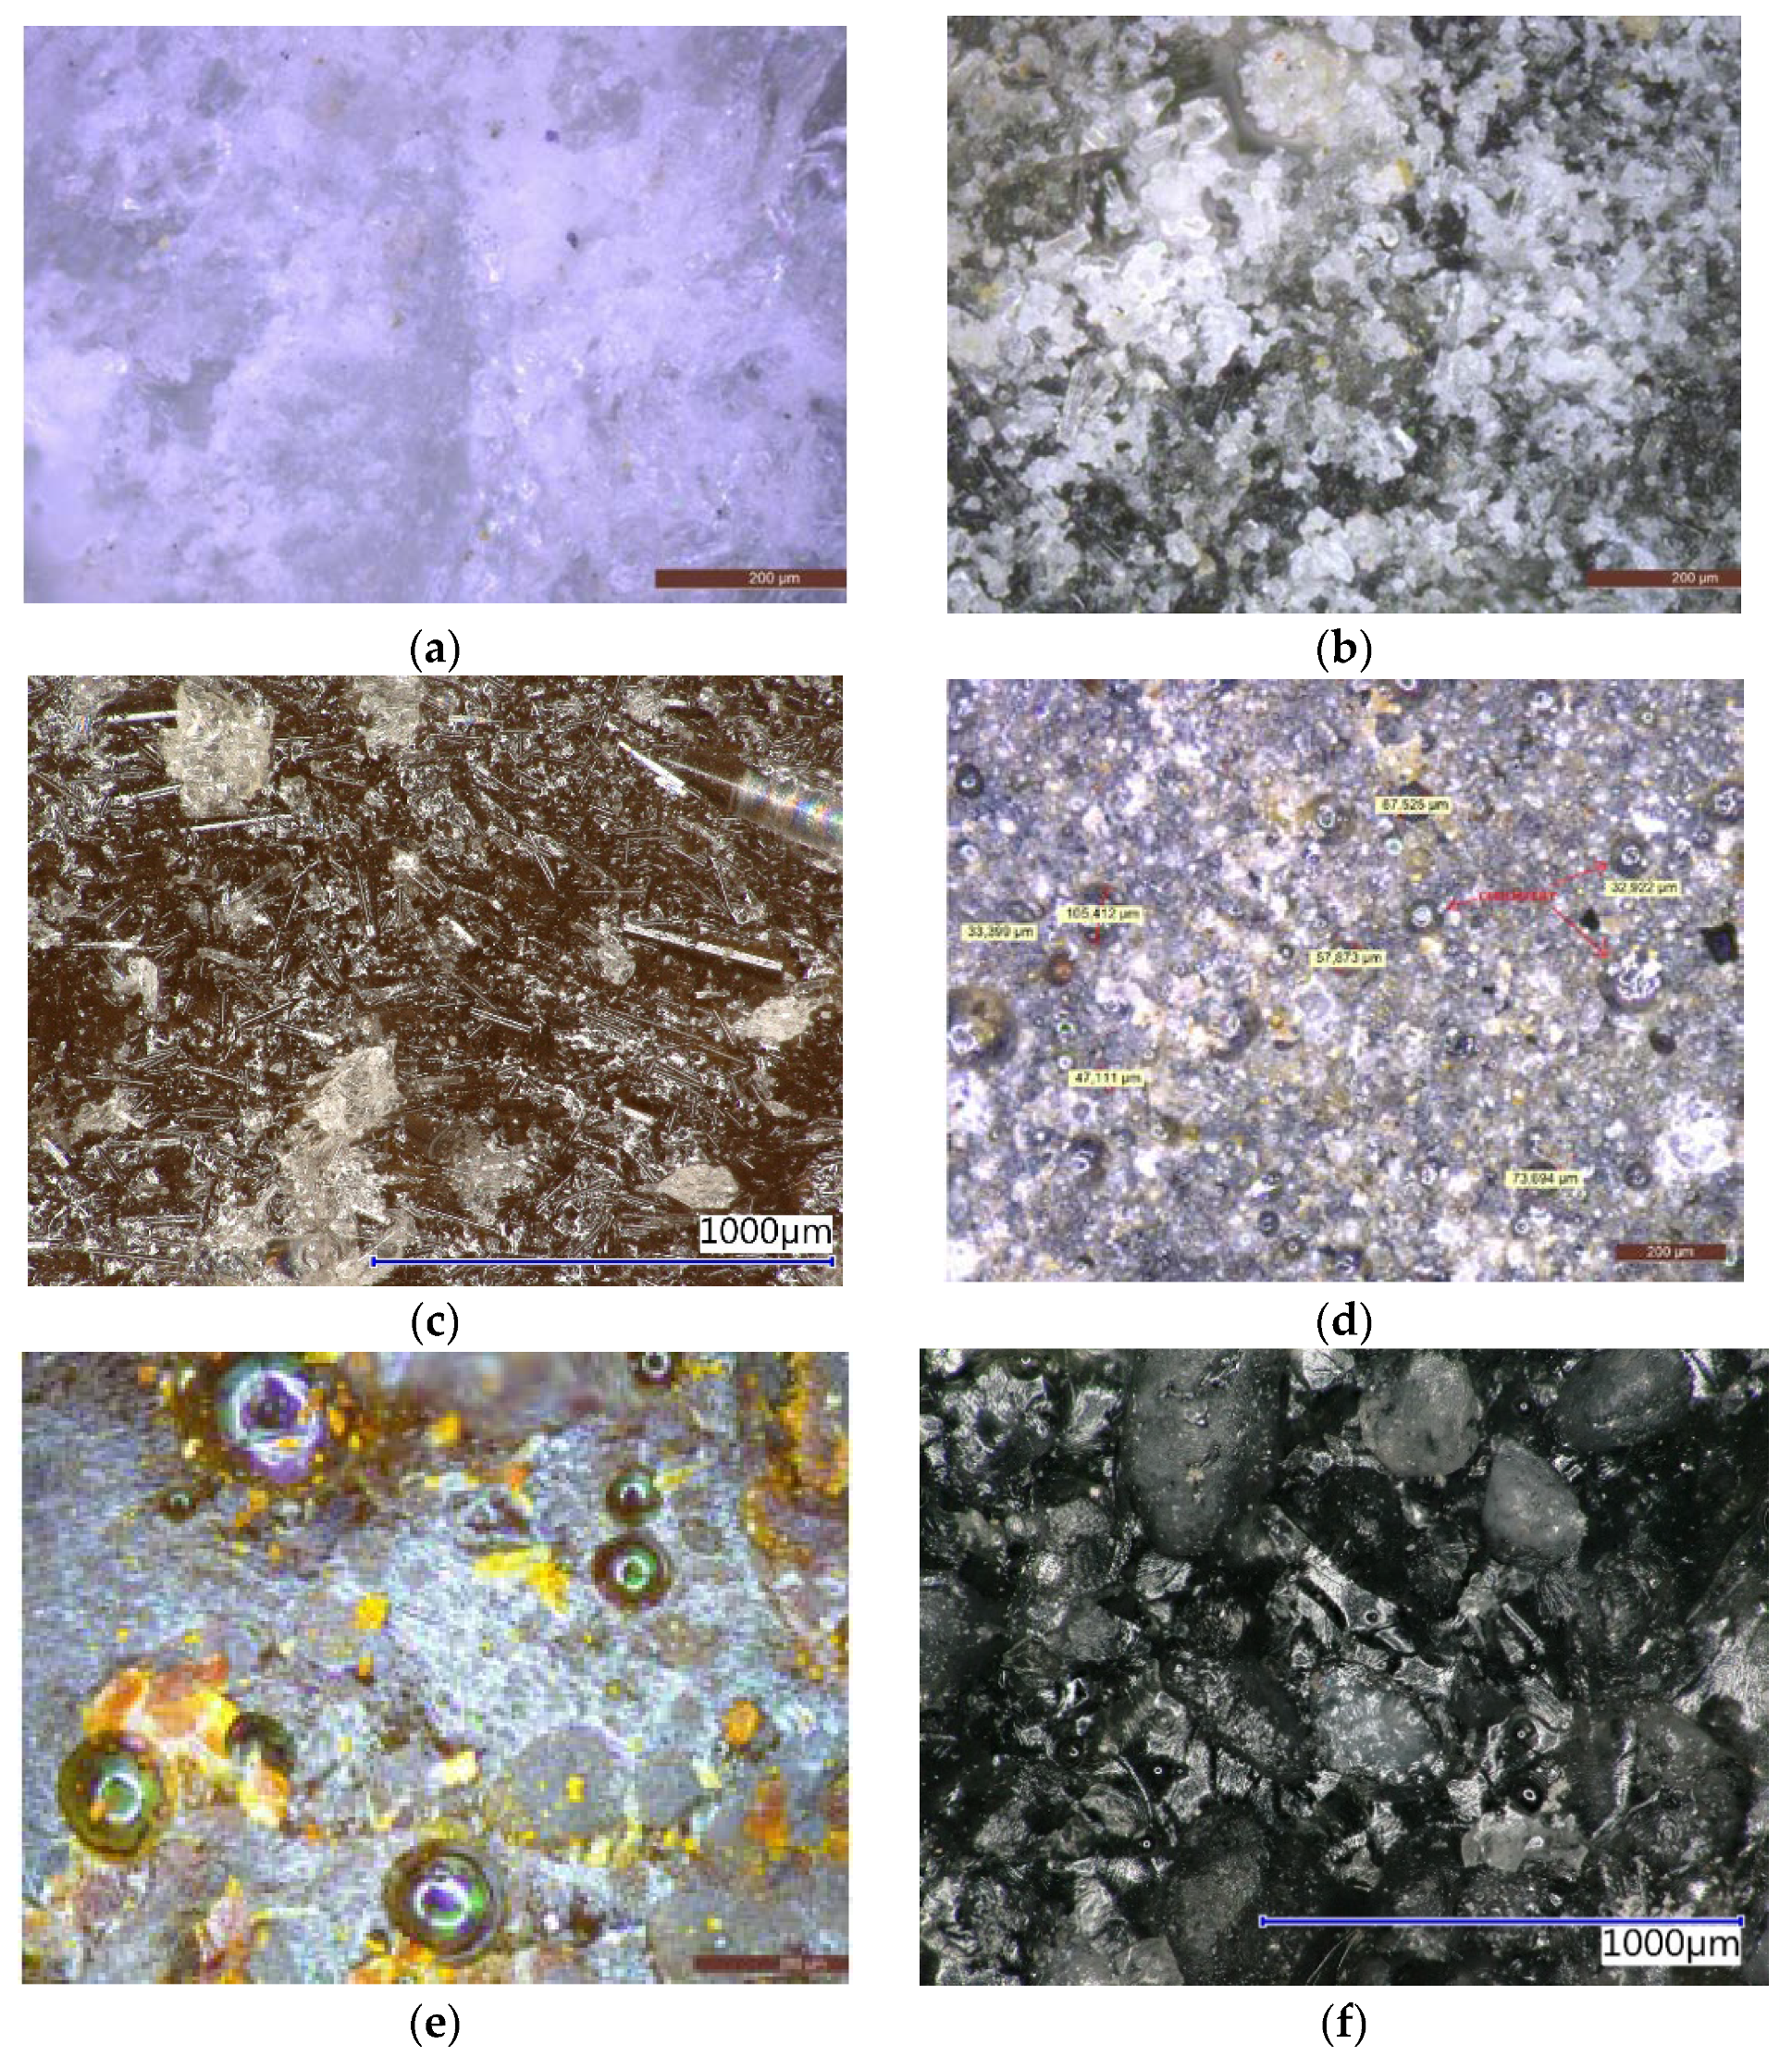
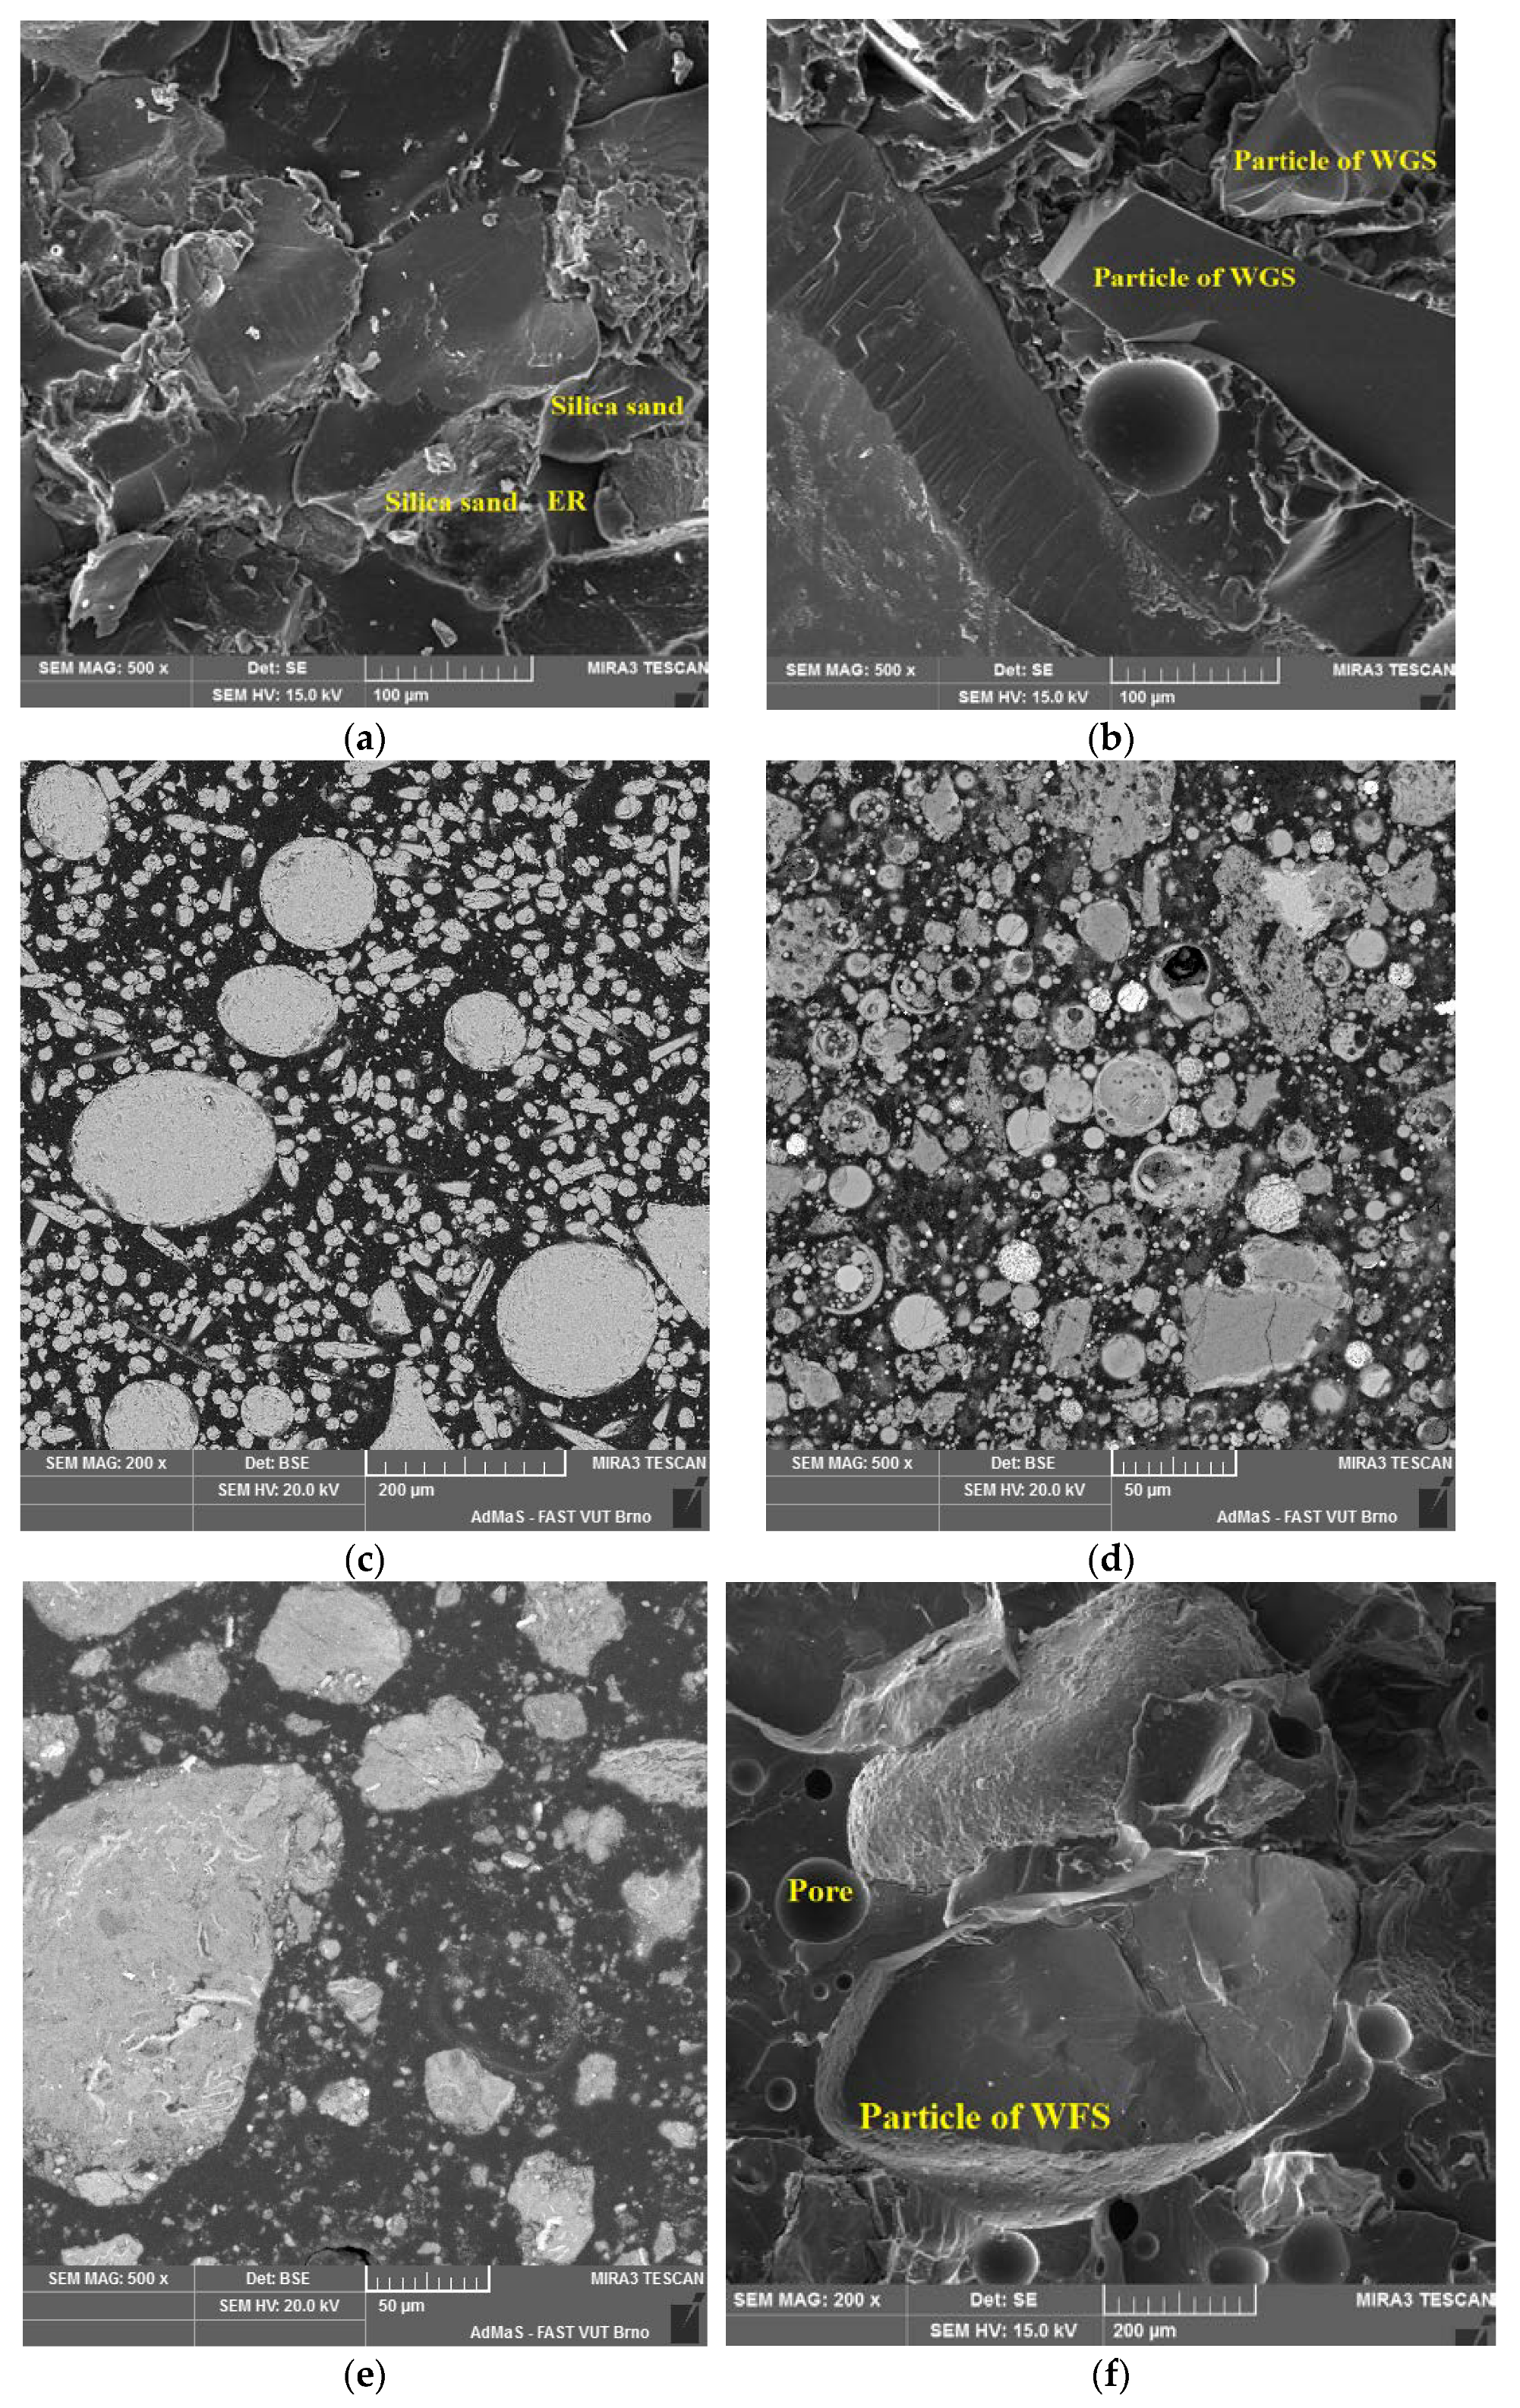
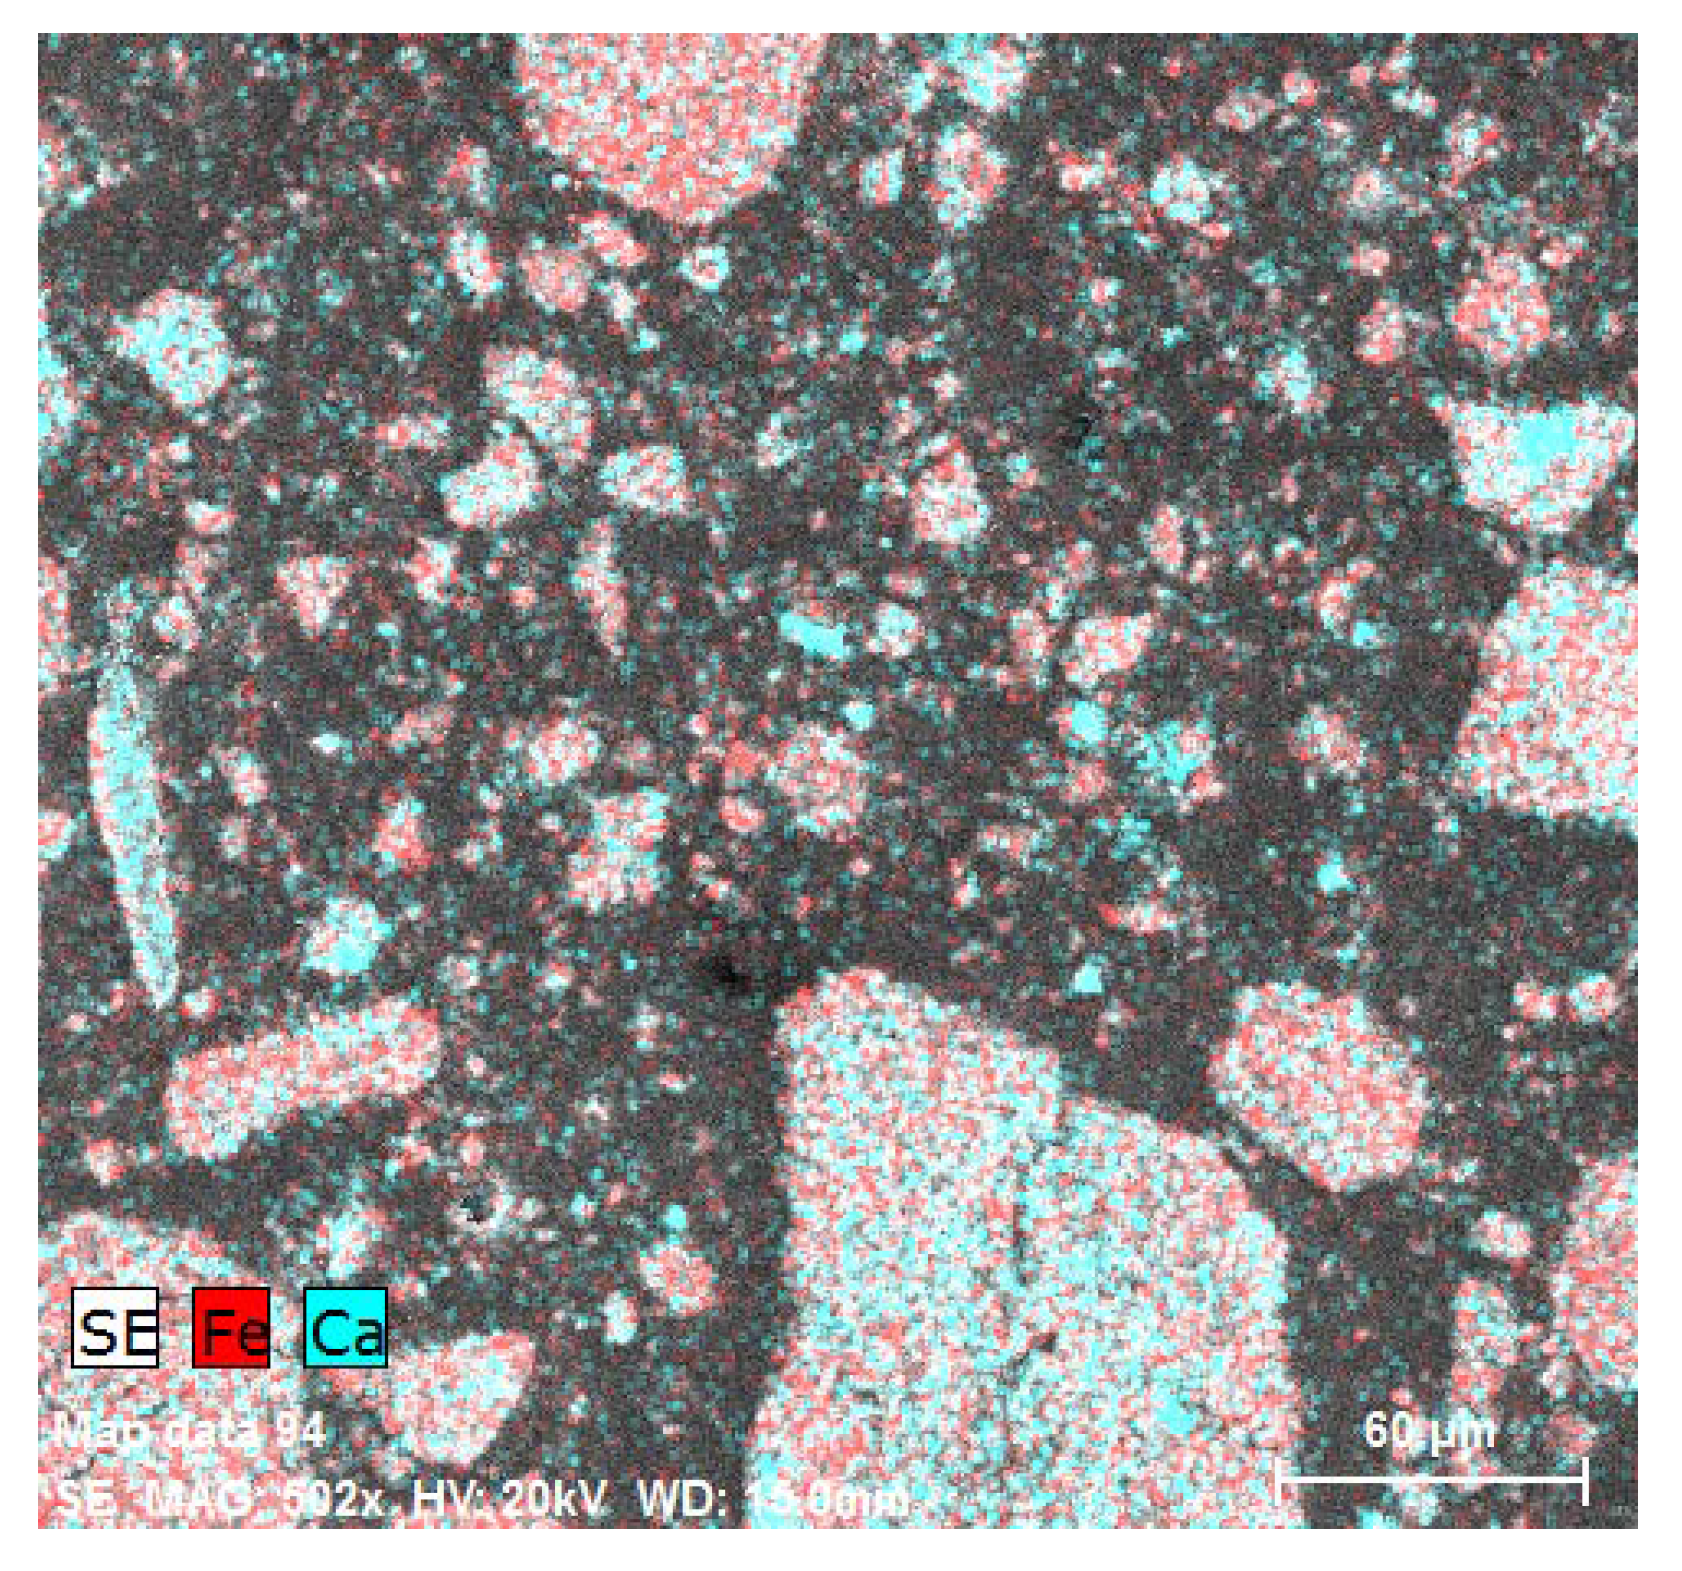
4.9. Microstructure—Digital Microscope and SEM
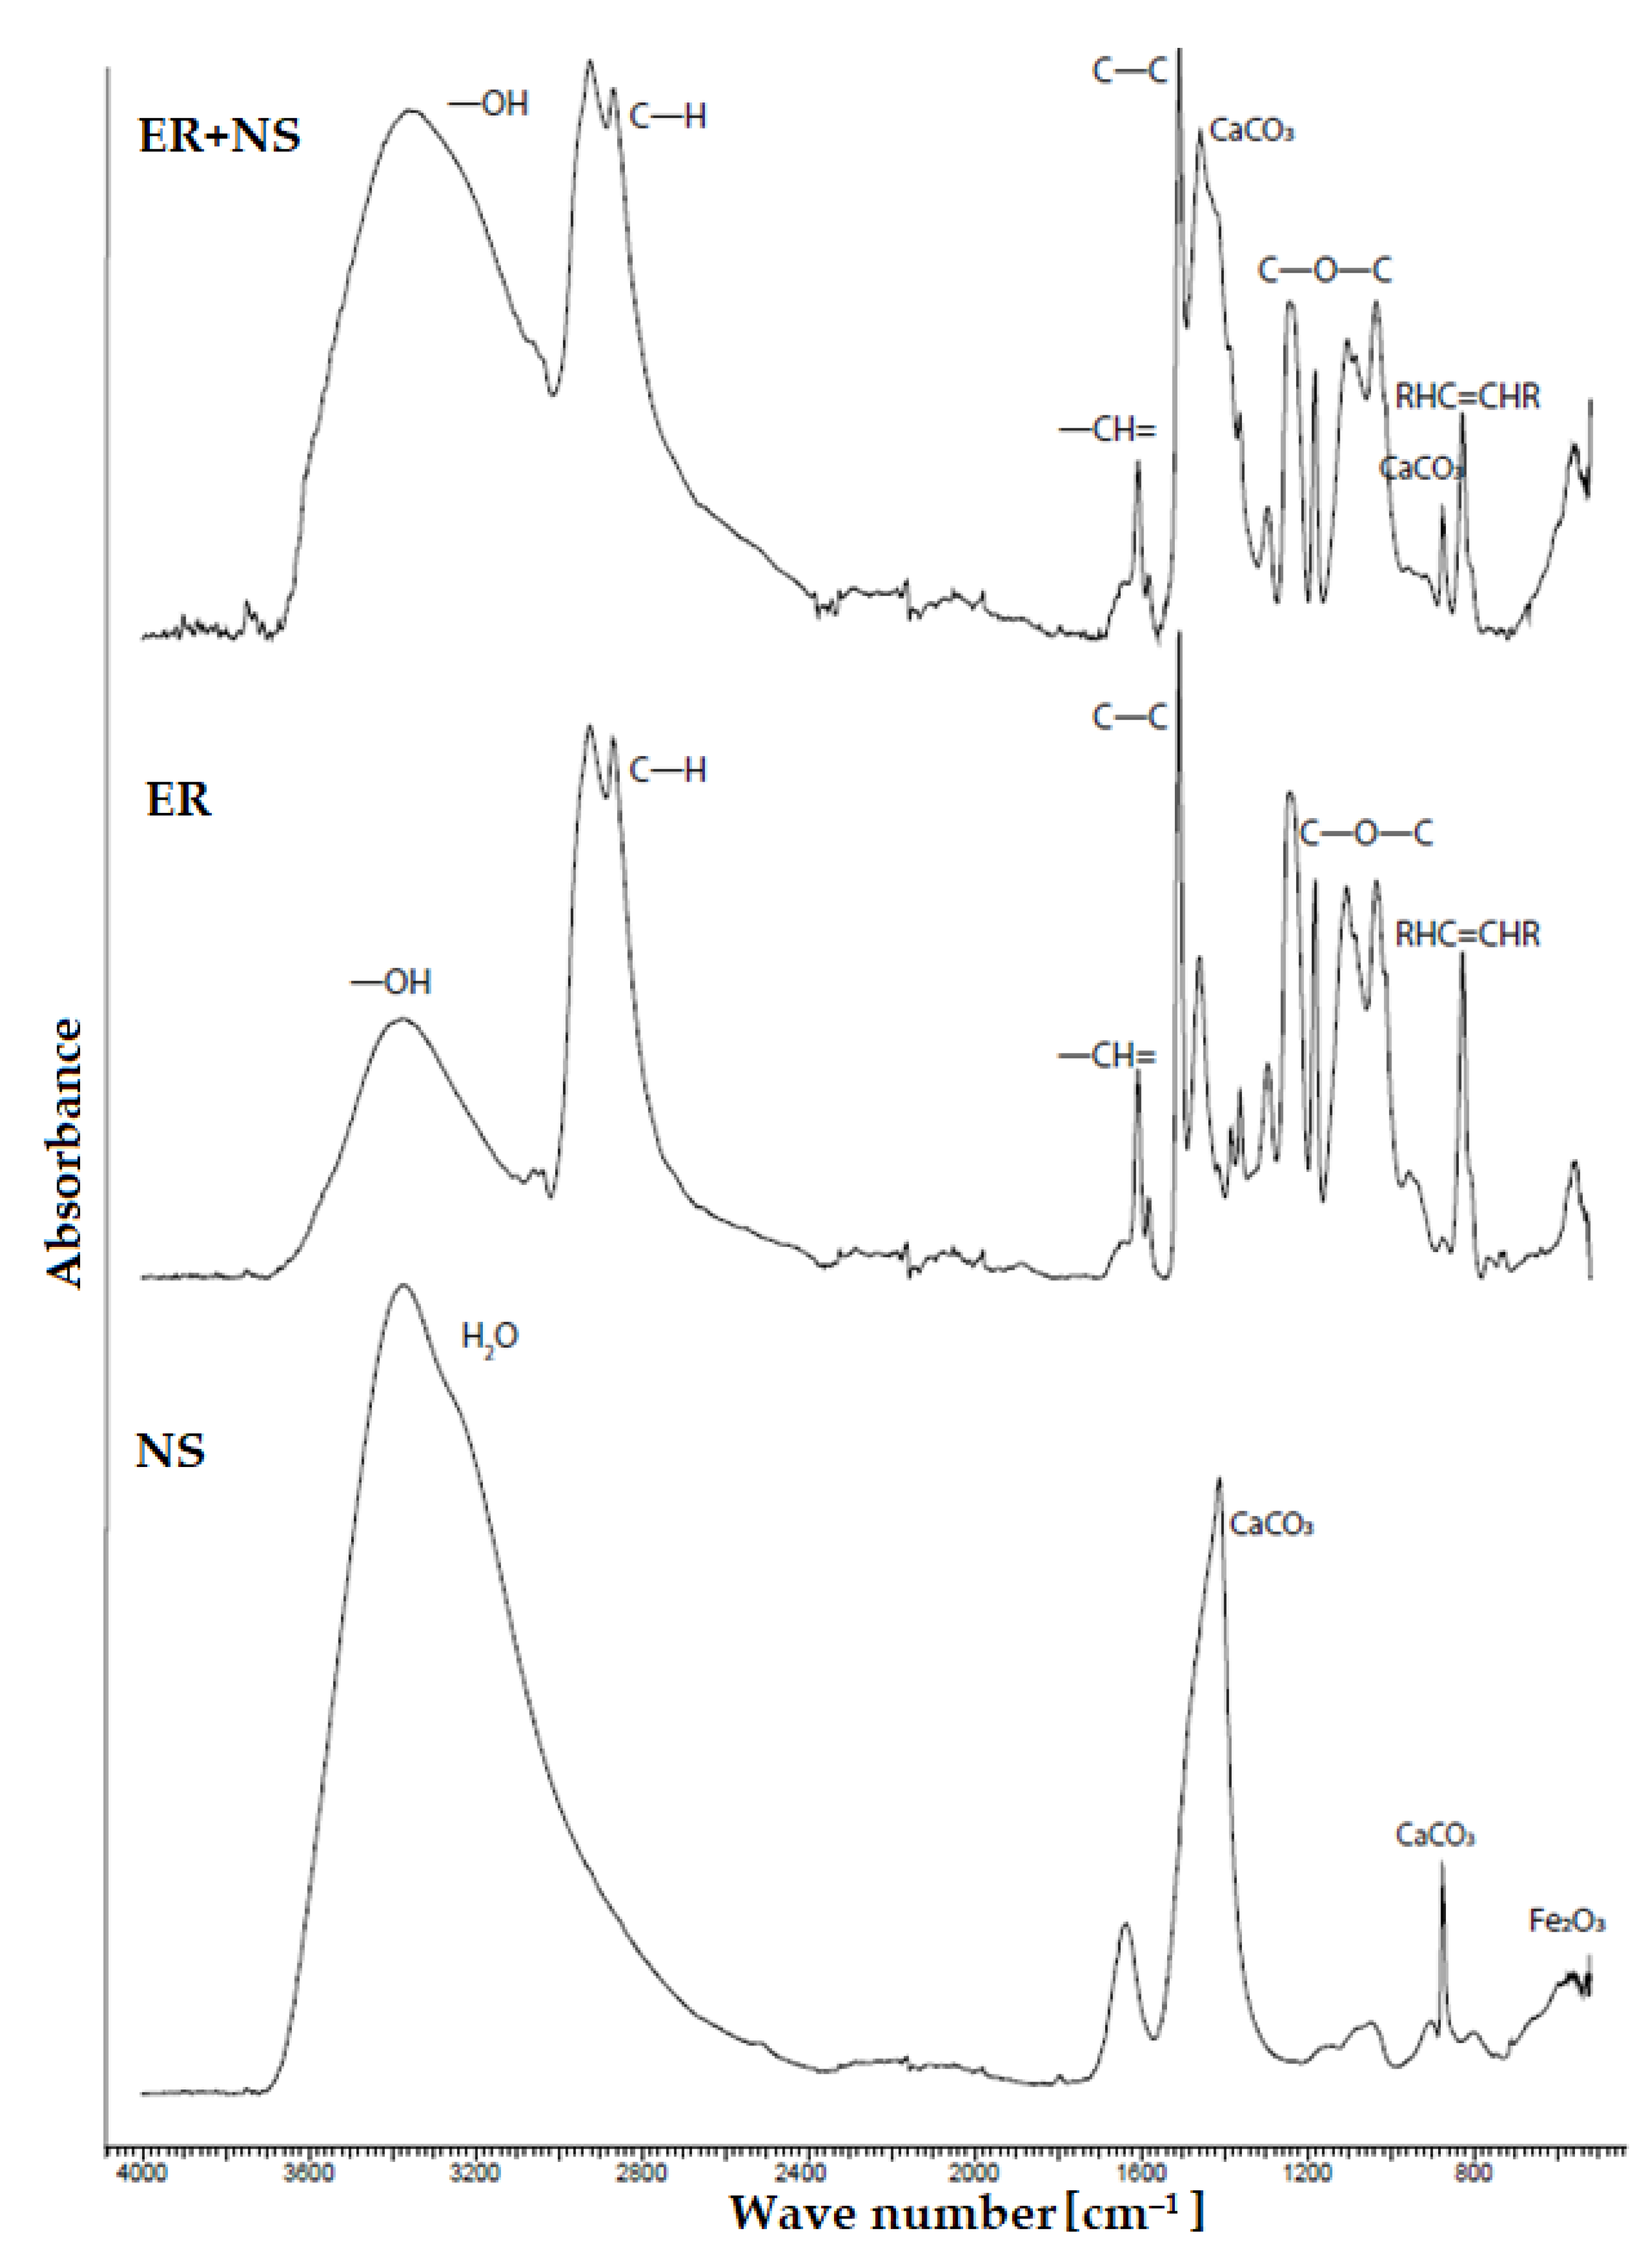
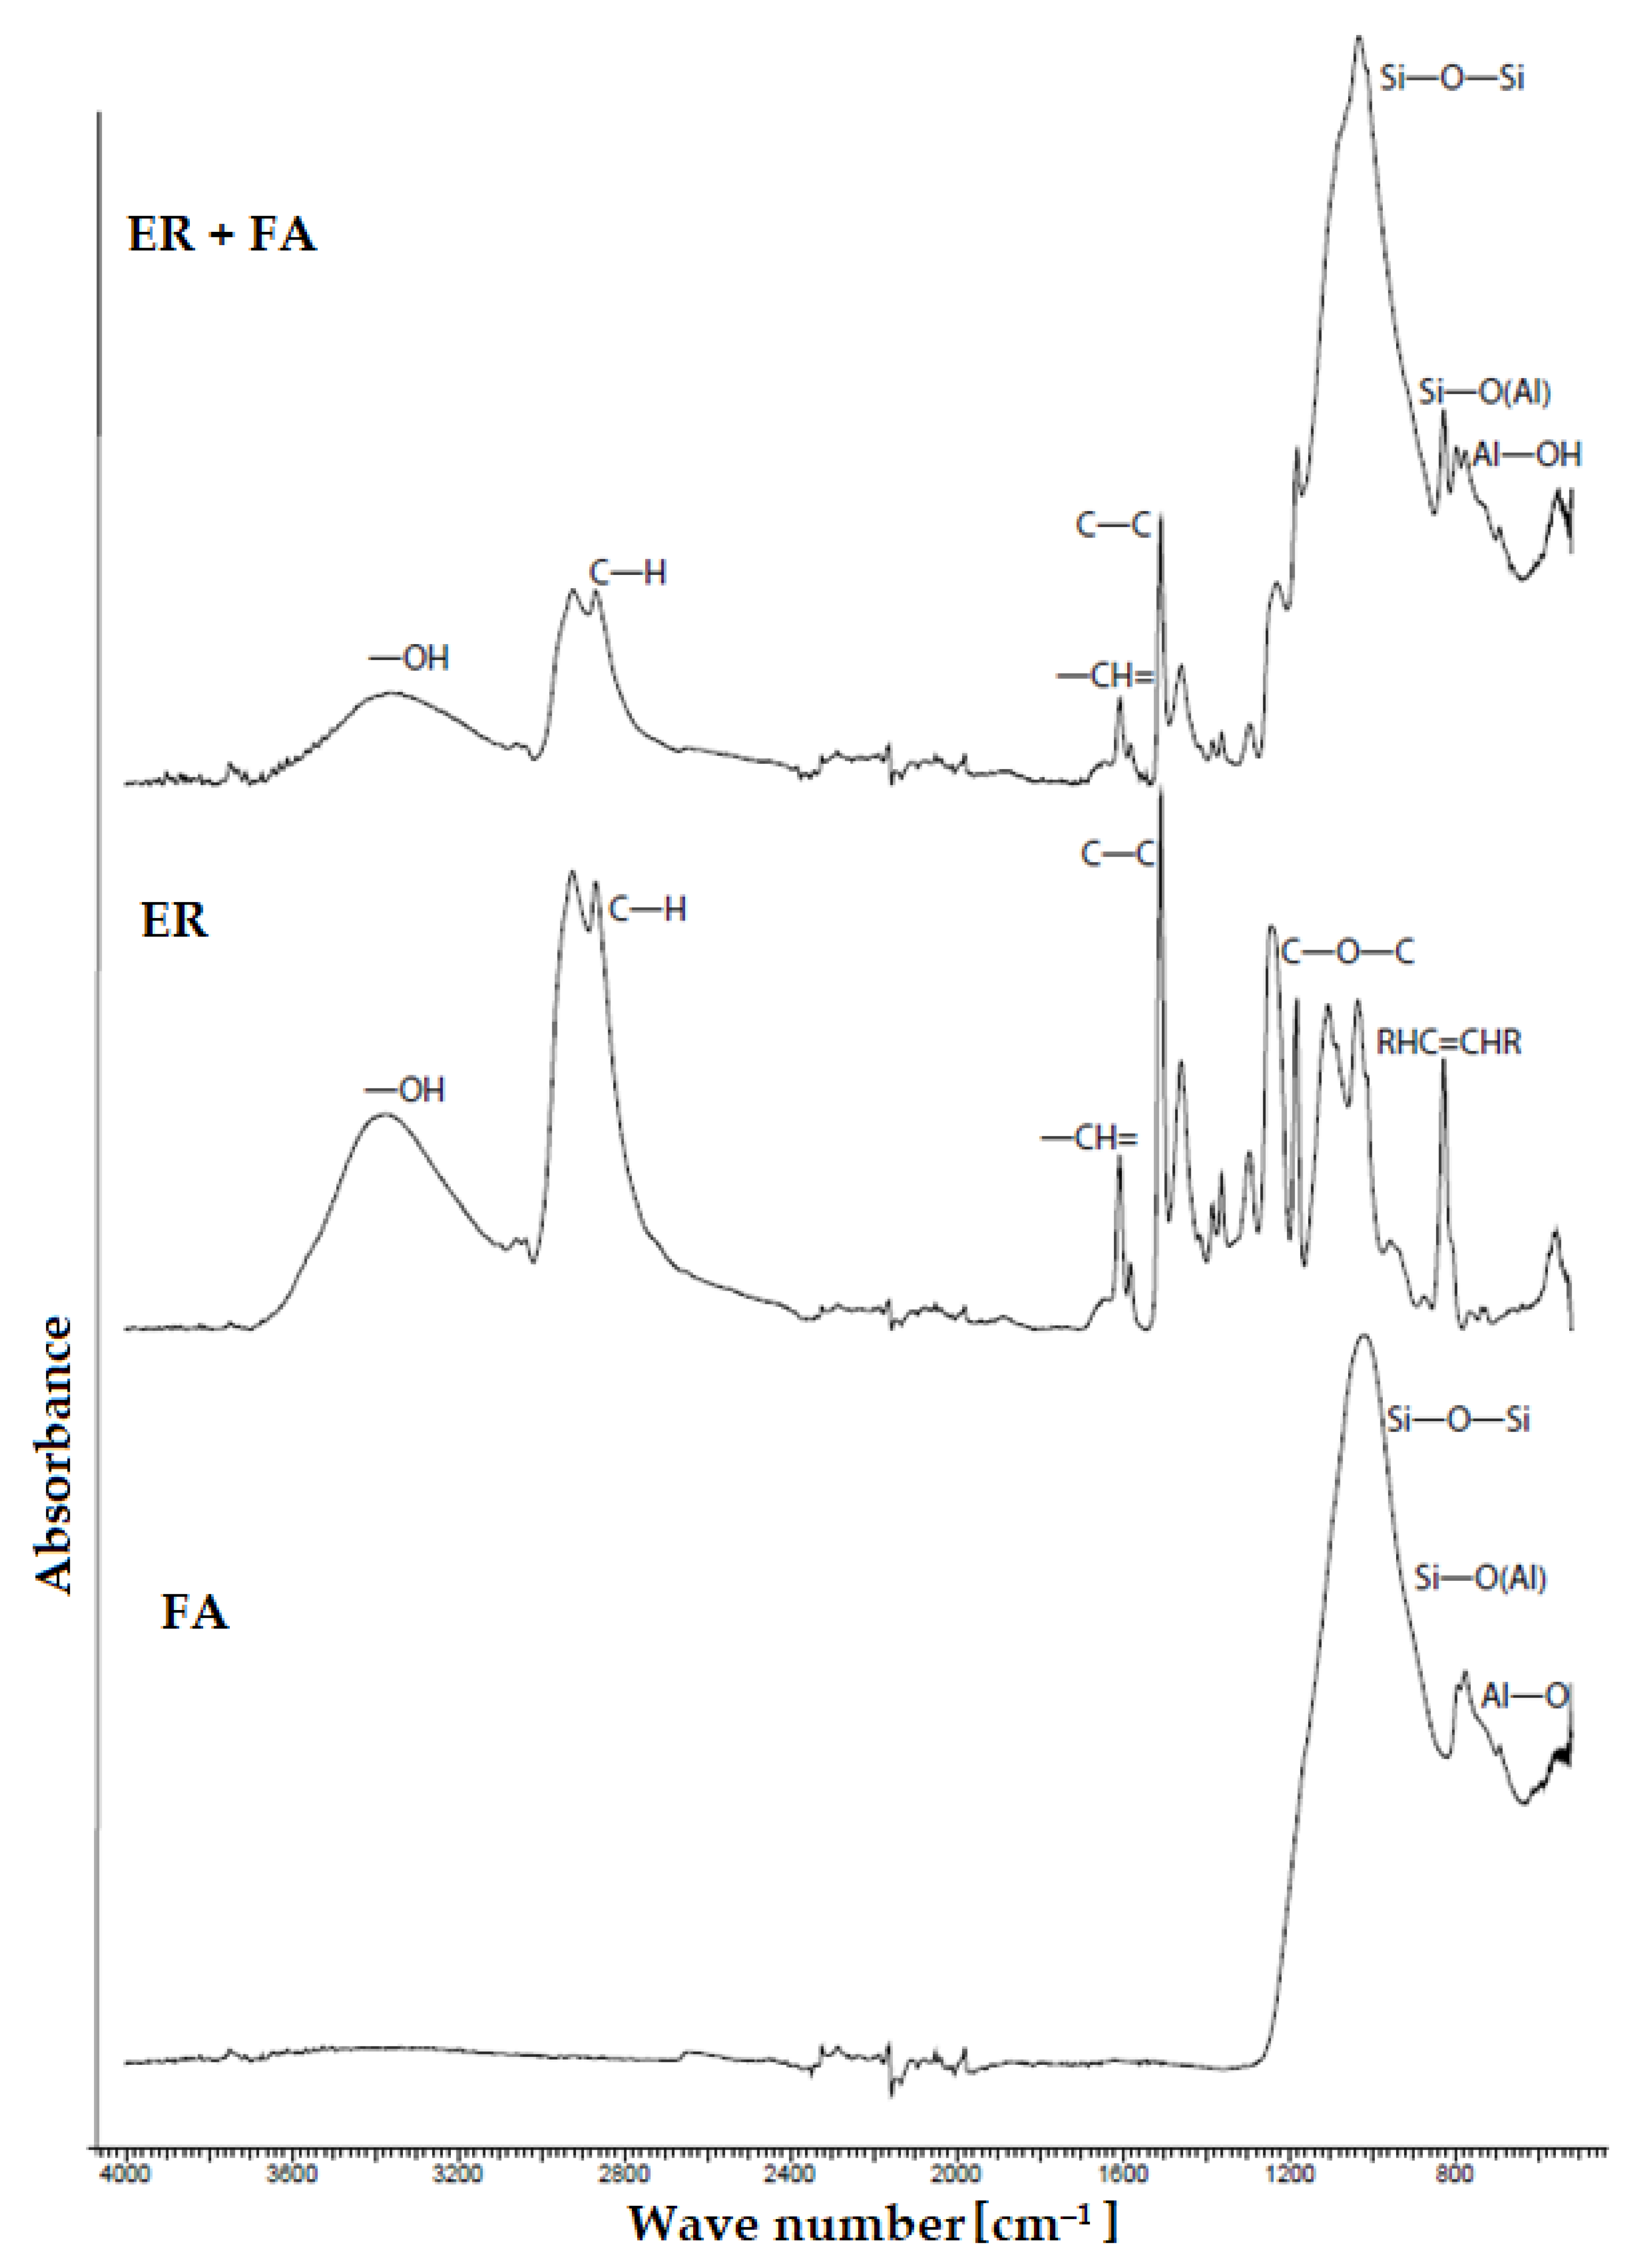
4.10. FTIR
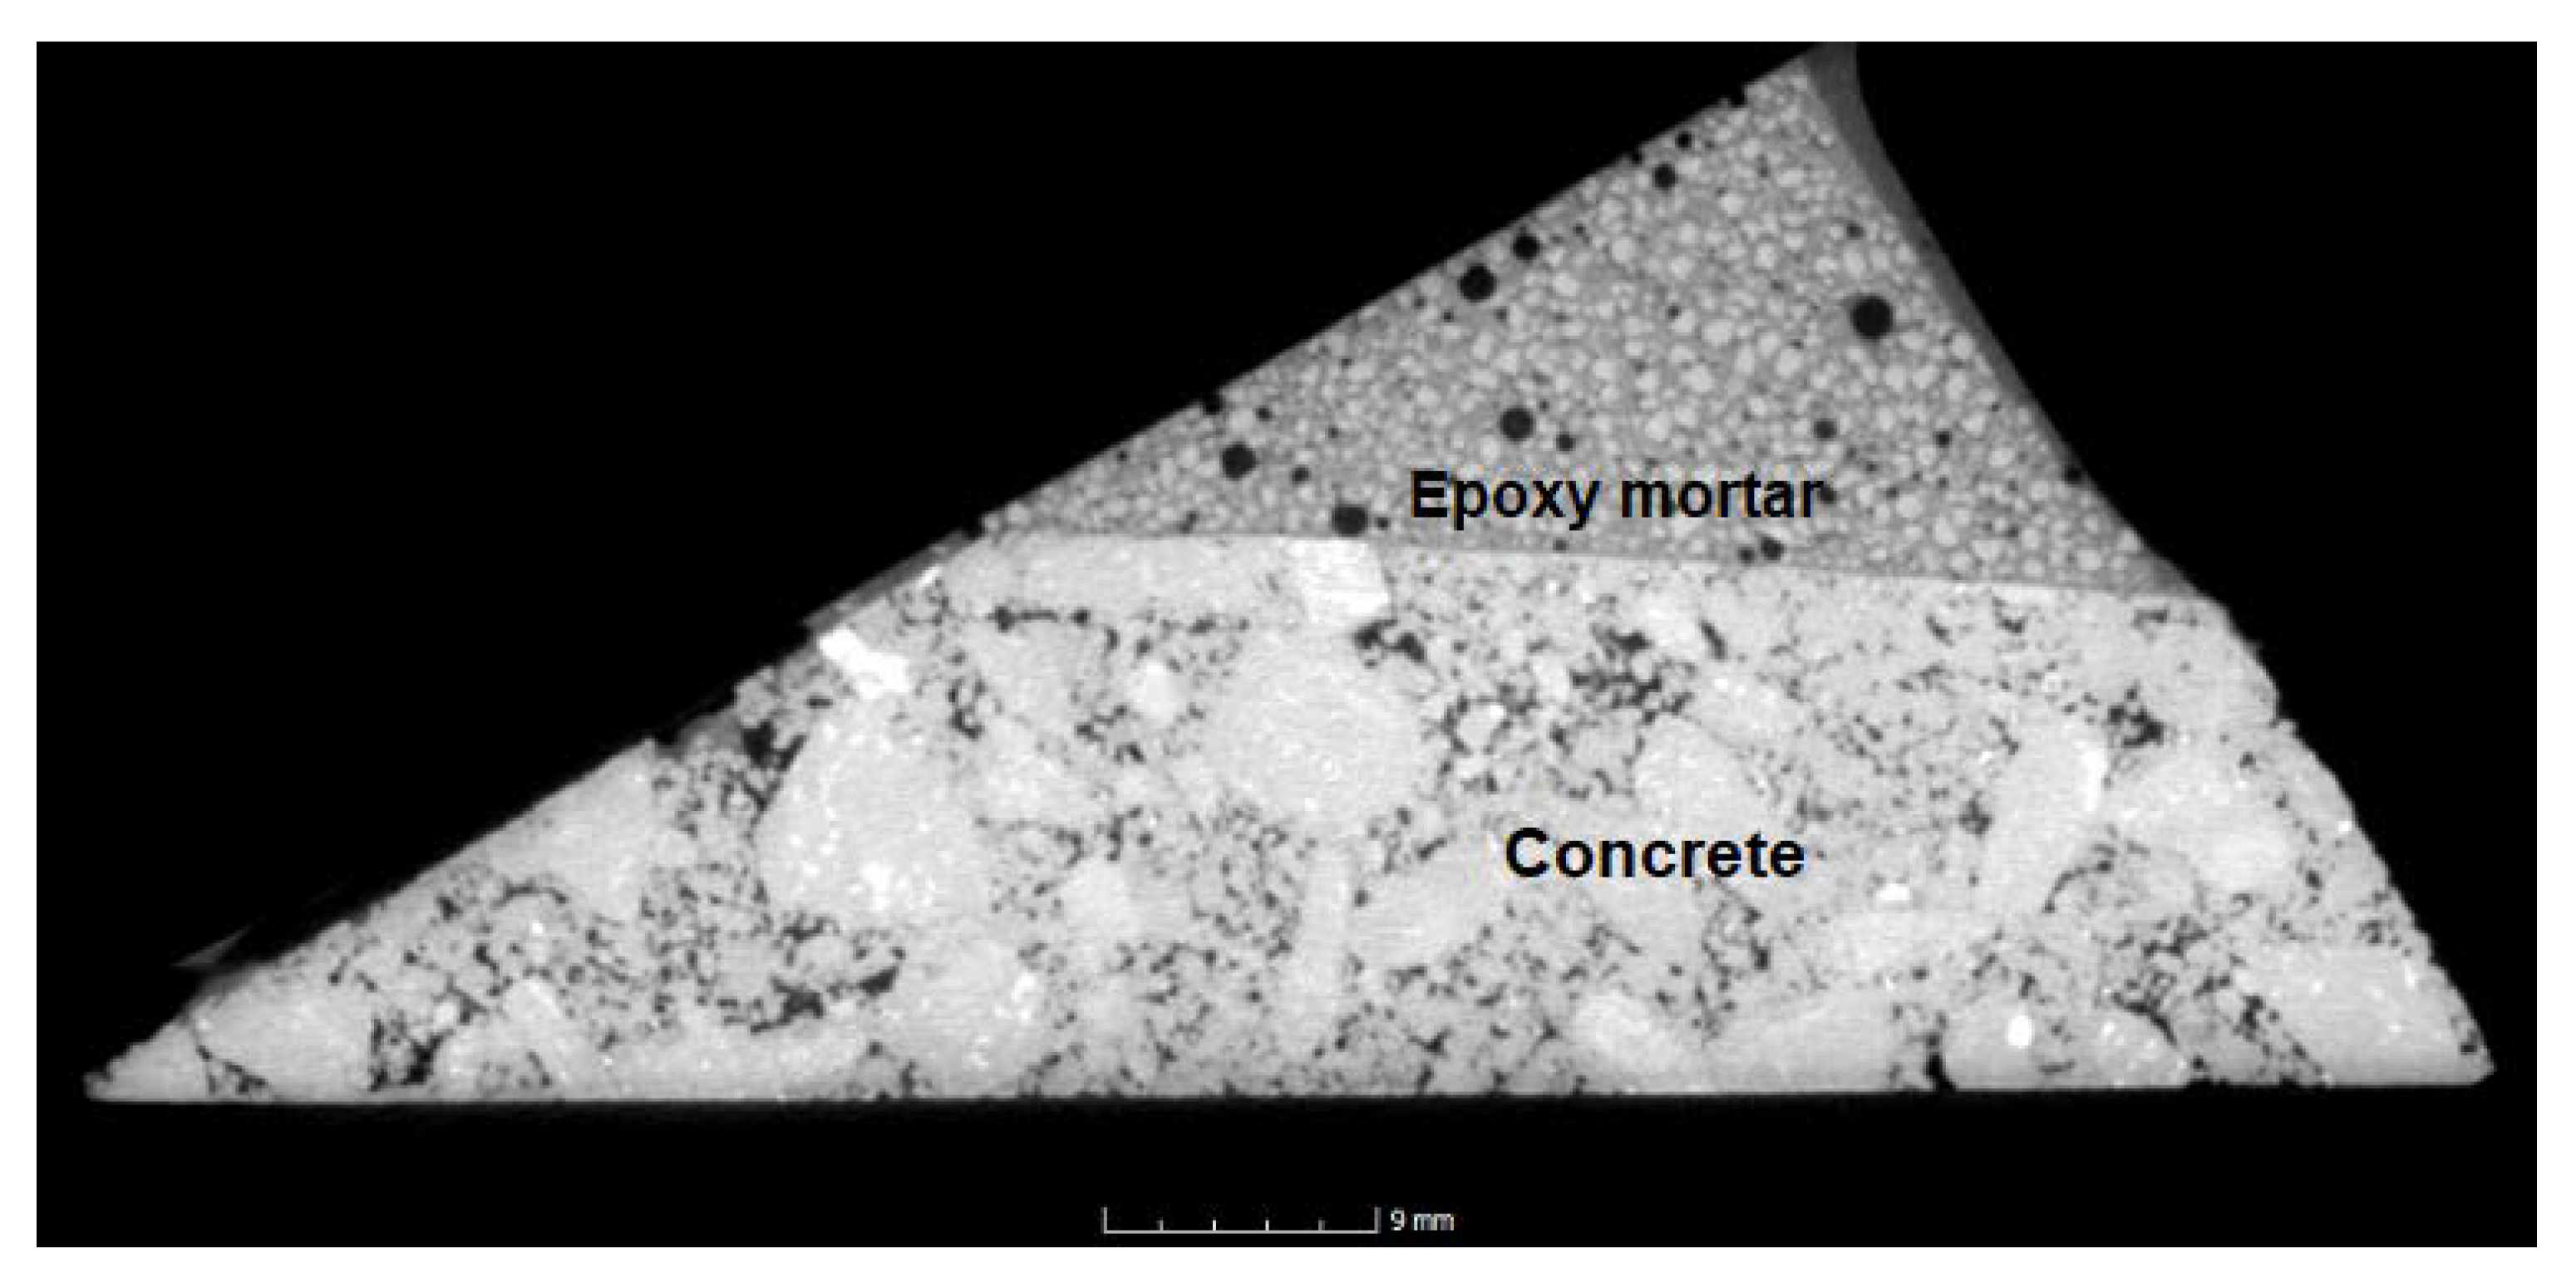
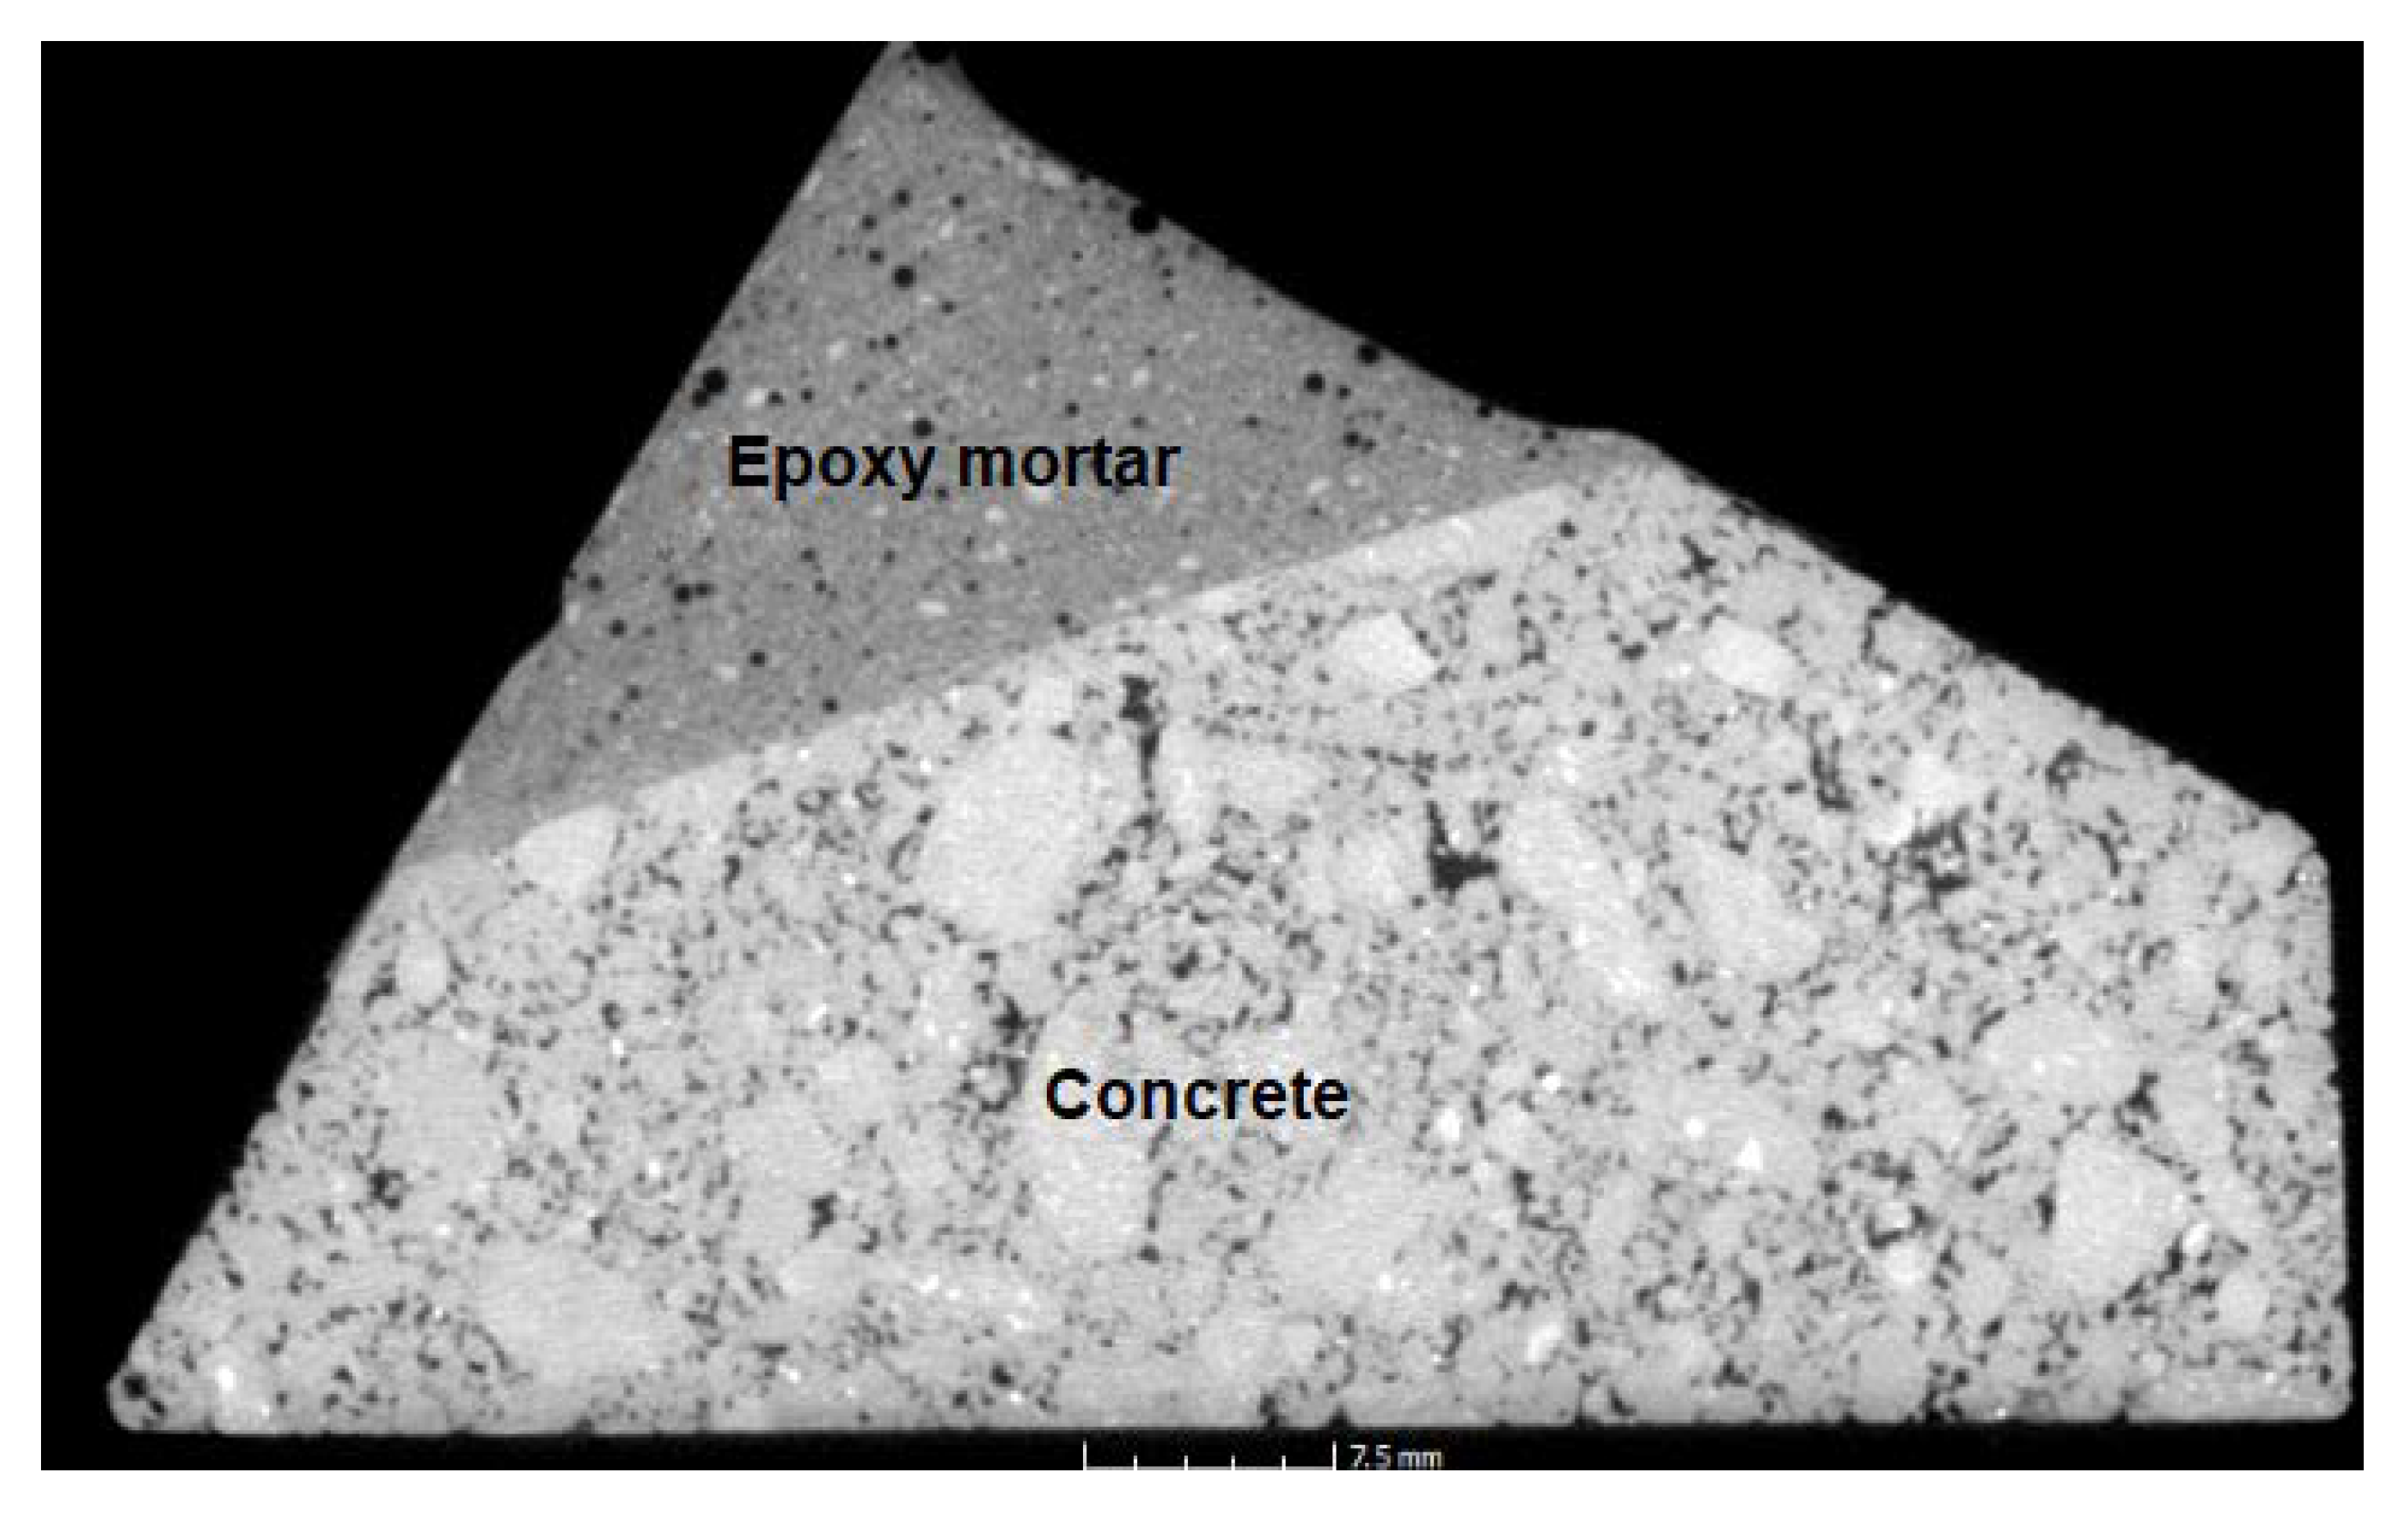
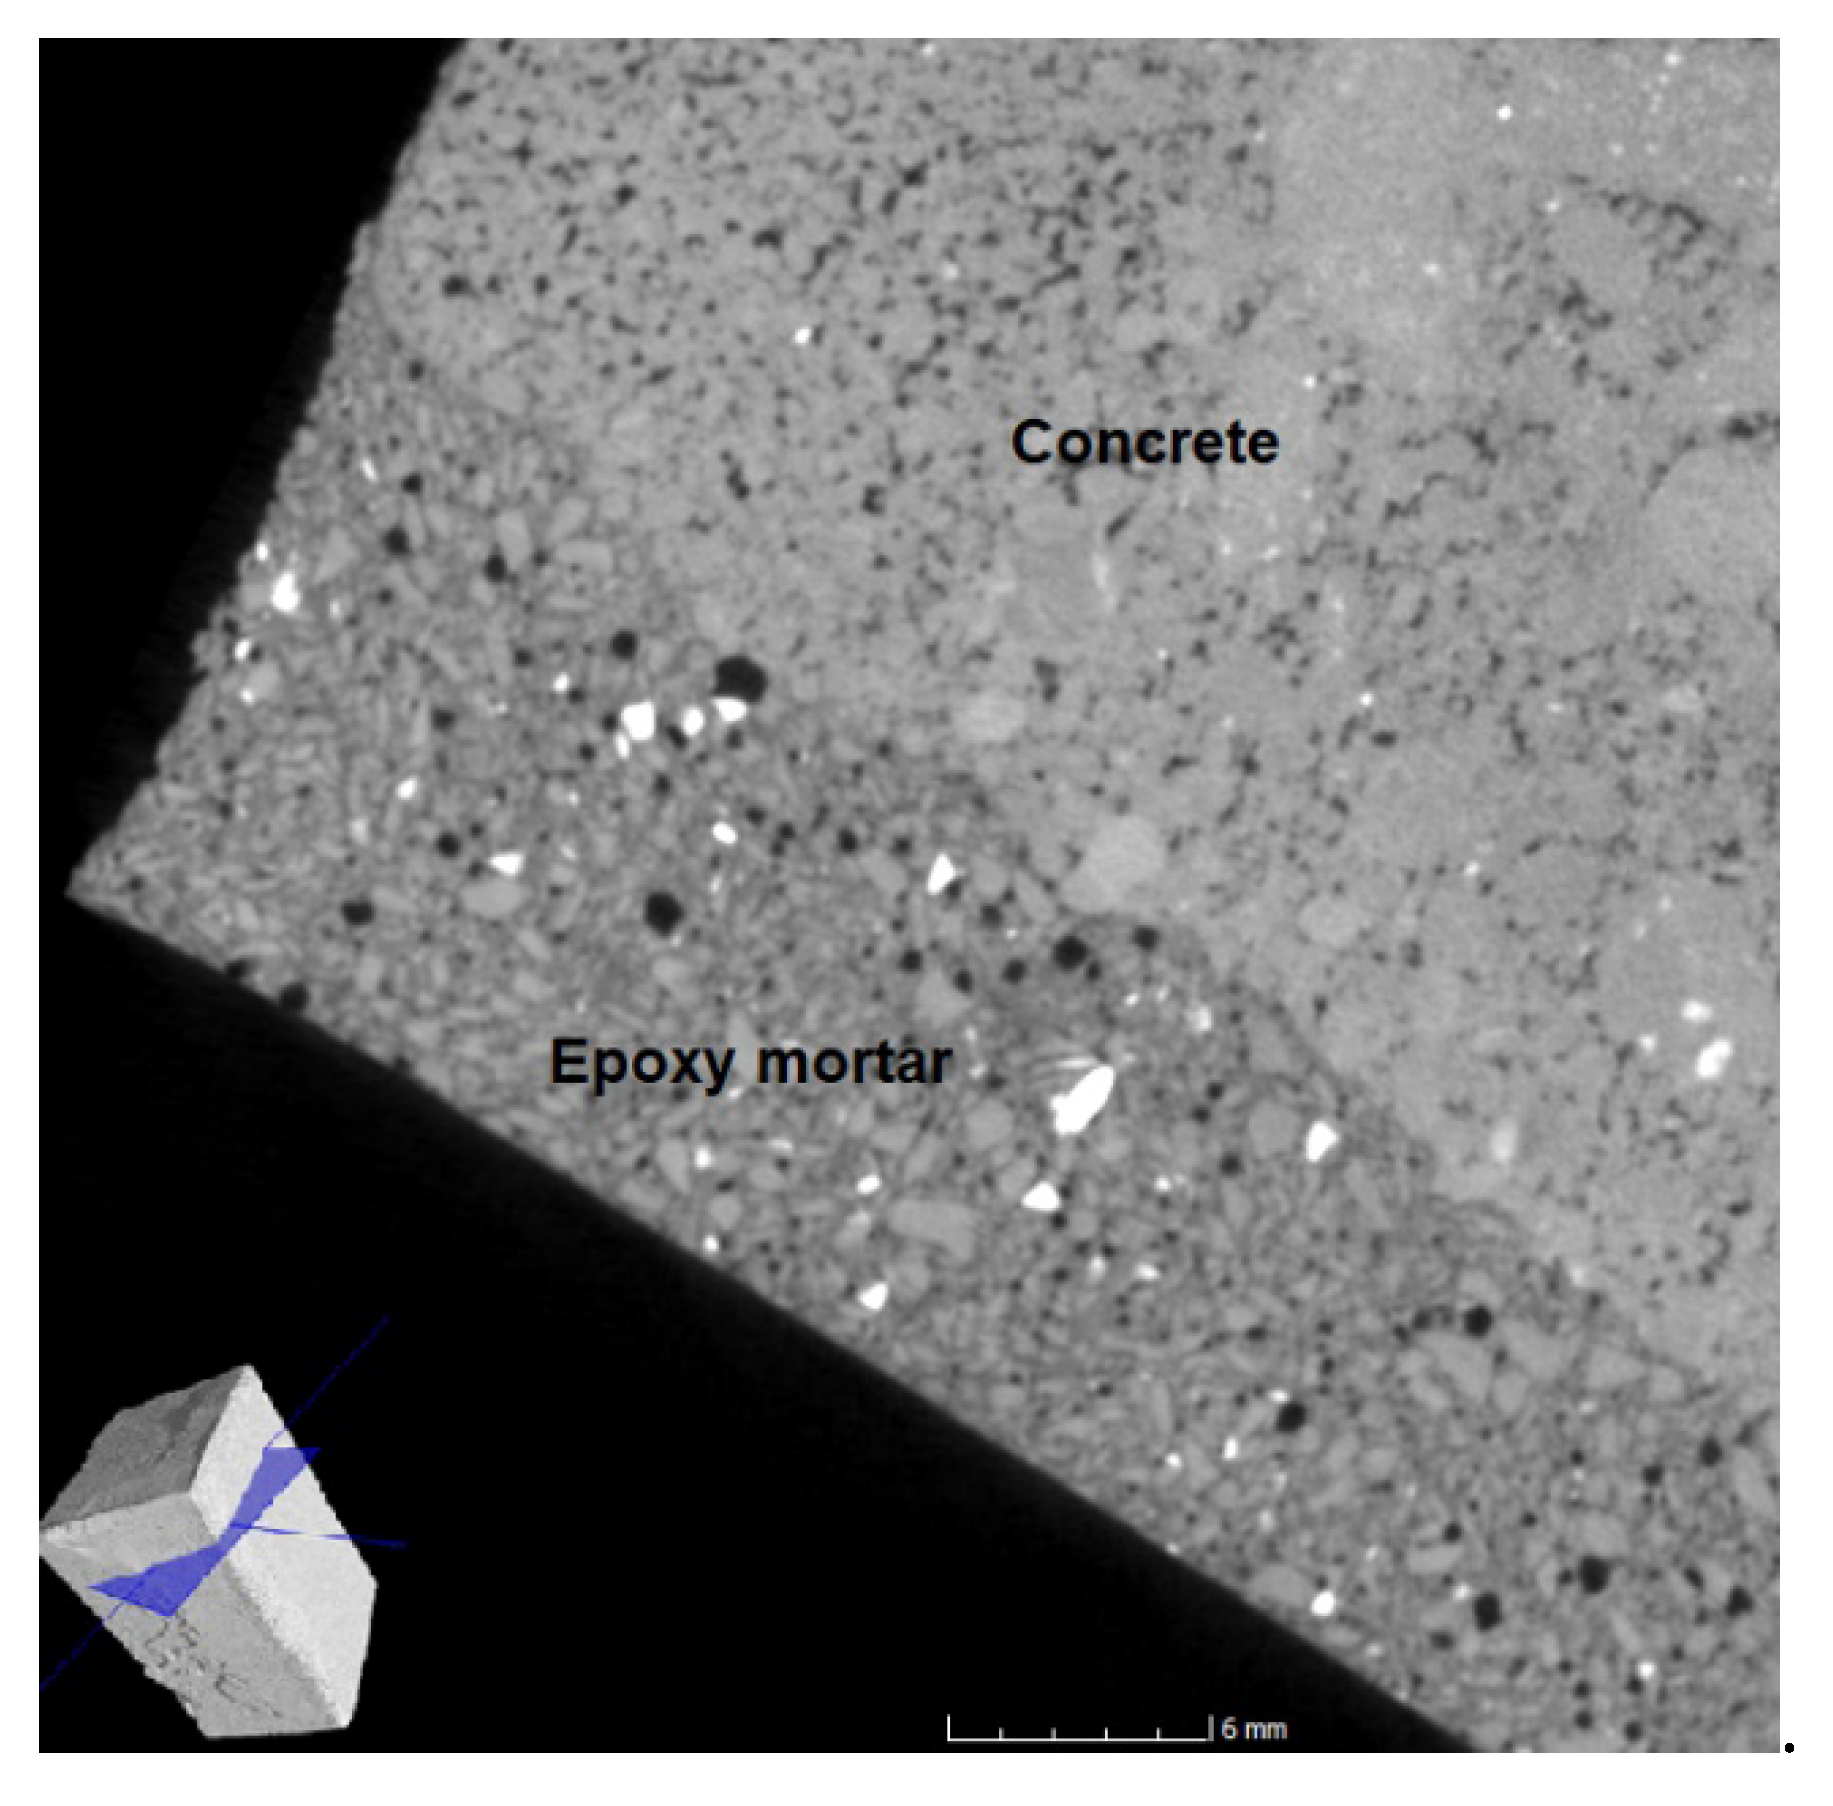
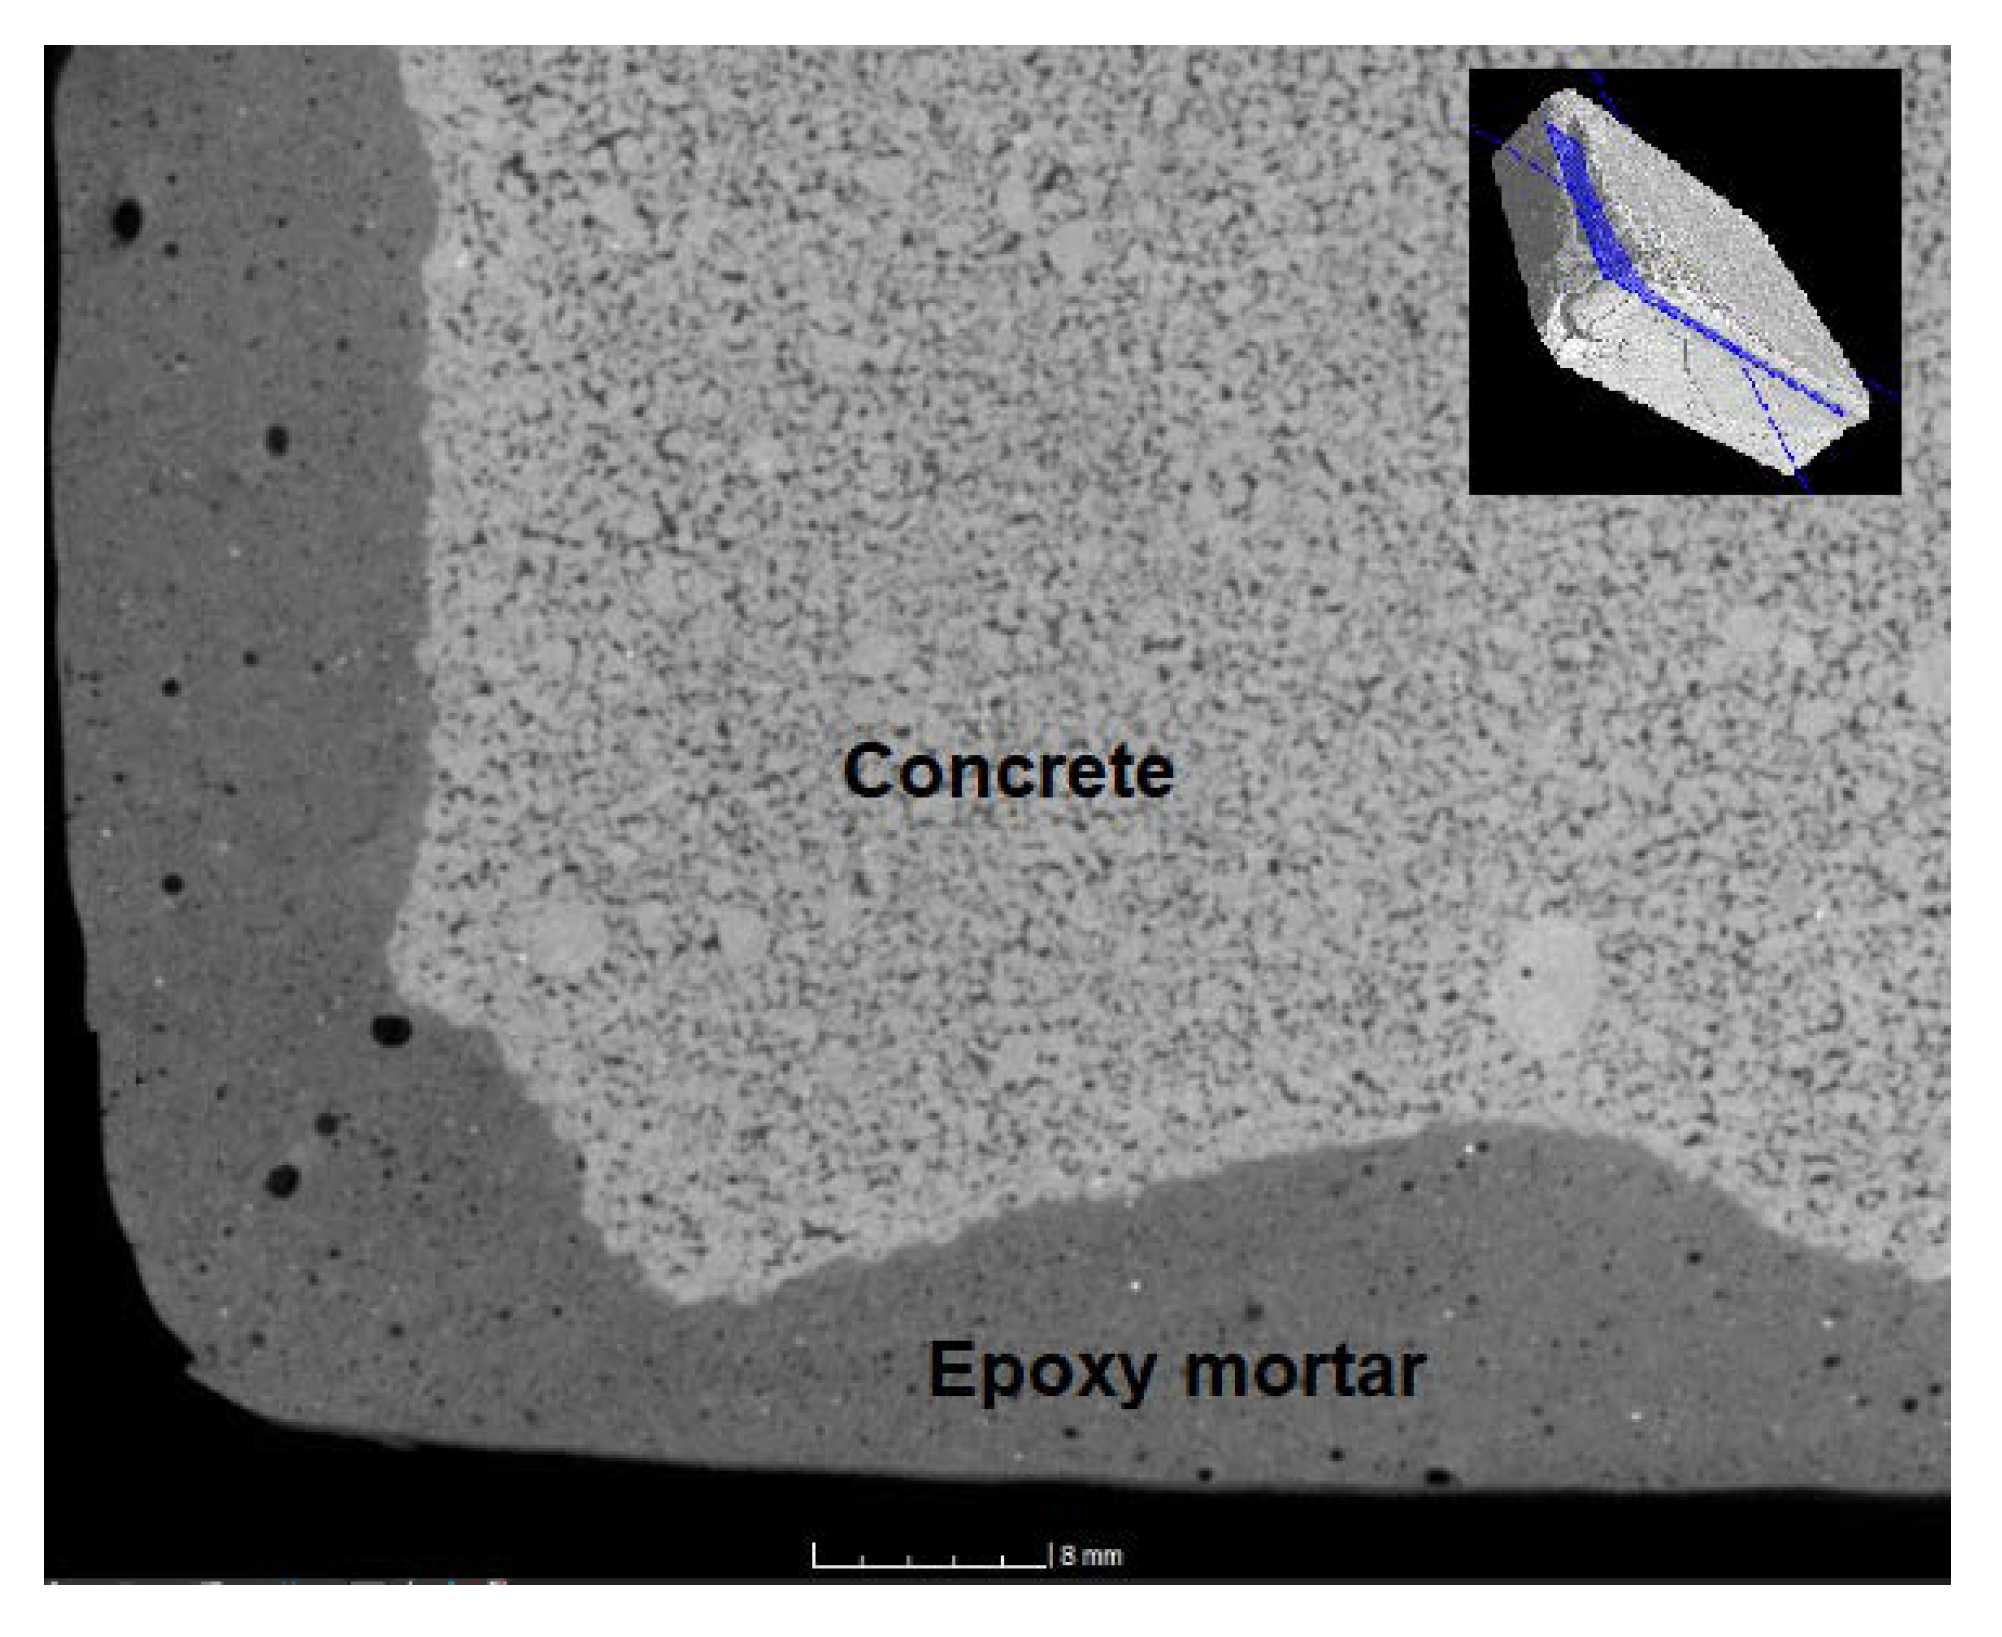
4.11. CT Tomography
5. Conclusions
Author Contributions
Funding
Institutional Review Board Statement
Informed Consent Statement
Data Availability Statement
Conflicts of Interest
References
- Kiruthika, C.; Prabha, S.L.; Neelamegam, M. Different aspects of polyester polymer concrete for sustainable construction. Mater. Proc. 2021, 43, 1622–1625. [Google Scholar] [CrossRef]
- Fang, H.; Yu, Z.; Wang, J.; Wang, F.; Zhang, J.; Chen, J. Effects of crushed stones on the compression properties of polymer grout materials. Constr. Build. Mater. 2021, 271, 121517. [Google Scholar] [CrossRef]
- Conradi, M.; Kocijan, A.; Zorko, M.; Verpoest, I. Damage resistance and anticorrosion properties of nanosilica-filled epoxy-resin composite coatings. Prog. Org. Coat. 2015, 80, 20–26. [Google Scholar] [CrossRef]
- Tian, W.; Meng, F.; Liu, L.; Li, Y.; Wang, F. The failure behaviour of a commercial highly pigmented epoxy coating under marine alternating hydrostatic pressure. Prog. Org. Coat. 2015, 82, 101–112. [Google Scholar] [CrossRef]
- Lin, Y.T.; Don, T.M.; Wong, C.J.; Meng, F.C.; Lin, Y.J.; Lee, S.Y.; Chiu, W.Y. Improvement of mechanical properties and anticorrosion performance of epoxy coatings by the introduction of polyaniline/graphene composite. Surf. Coat. Technol. 2019, 374, 1128–1138. [Google Scholar] [CrossRef]
- Cai, Y.; Meng, F.; Liu, L.; Liu, R.; Cui, Y.; Zheng, H.; Wang, F. The effect of the modification of mica by high-temperature mechanochemistry on the anticorrosion performance of epoxy coatings. Polymers 2021, 13, 378. [Google Scholar] [CrossRef]
- Naeem, M.M.; Radwan, M.A.; Sadek, M.A.; Elazab, H.A. Mechanical characteristics for different composite materials based on commercial epoxy resins and different fillers. J. Eng. Appl. Sci. 2017, 12, 1179–1185. [Google Scholar] [CrossRef]
- Garg, A.C.; Mai, Y.W. Failure mechanisms in toughened epoxy resins—A review. Compos. Sci. Technol. 1988, 31, 179–223. [Google Scholar] [CrossRef]
- Fila, K.; Gargol, M.; Goliszek, M.; Podkościelna, B. Synthesis of epoxy resins derivatives of naphthalene-2,7-diol and their cross-linked products. J. Therm. Anal. Calorim. 2019, 138, 4349–4358. [Google Scholar] [CrossRef] [Green Version]
- Vipulanandan, C.; Dharmarajan, N. Flexural behavior of polyester polymer concrete. Cem. Concr. Res. 1987, 17, 219–230. [Google Scholar] [CrossRef]
- Rebeiz, K.S.; Serhal, S.P.; Craft, A.P. Properties of polymer concrete using fly ash. J. Mater. Civ. Eng. 2004, 16, 15–19. [Google Scholar] [CrossRef]
- Gnatowski, A.; Koszkul, J. Investigations of the influence of compatibilizer and filler type on the properties of chosen polymer blends. J. Mater. Process. Technol. 2005, 162–163, 52–58. [Google Scholar] [CrossRef]
- Atzeni, C.; Massidda, L.; Sanna, U. Mechanical properties of epoxy mortars with fly ash as filler. Cem. Concr. Compos. 1990, 12, 3–8. [Google Scholar] [CrossRef]
- Lin, F.; Bhatia, G.S.; Ford, J.D. Thermal conductivities of powder-filled epoxy resins. J. Appl. Polym. Sci. 1993, 49, 1901–1908. [Google Scholar] [CrossRef]
- Bărbuţă, M.; Harja, M.; Baran, I. Comparison of mechanical properties for polymer concrete with different types of filler. J. Mater. Civ. Eng. 2010, 22, 696–701. [Google Scholar] [CrossRef]
- Wahid, F.; Manalo, A.; Wong, H.S.; Abousnina, R.; Alajarmeh, O.S.; Zhuge, Y. Schubel, P. Optimal design for epoxy polymer concrete based on mechanical properties and durability aspects. Constr. Build. Mater. 2020, 232, 117229. [Google Scholar] [CrossRef]
- Lokuge, W.; Aravinthan, T. Effect of fly ash on the behaviour of polymer concrete with different types of resin. Mater. Des. 2013, 51, 175–181. [Google Scholar] [CrossRef]
- Ferdous, W.; Manalo, A.; Aravinthan, T.; Van Erp, G. Properties of epoxy polymer concrete matrix: Effect of resin-to-filler ratio and determination of optimal mix for composite railway sleepers. Constr. Build. Mater. 2016, 124, 287–300. [Google Scholar] [CrossRef]
- Buketov, A.; Maruschak, P.; Sapronov, O.; Zinchenko, D.; Yatsyuk, V.; Panin, S. Enhancing performance characteristics of equipment of sea and river transport by using epoxy composites. Transport 2016, 31, 333–342. [Google Scholar] [CrossRef] [Green Version]
- Jin, F.L.; Park, S.J. Thermal properties of epoxy resin/filler hybrid composites. Polym. Degrad. Stab. 2012, 97, 2148–2153. [Google Scholar] [CrossRef]
- Buketov, A.; Maruschak, P.; Sapronov, O.; Brailo, M.; Leshchenko, O.; Bencheikh, L.; Menou, A. Investigation of thermophysical properties of epoxy nanocomposites. Mol. Cryst. Liq. Cryst. 2016, 628, 167–179. [Google Scholar] [CrossRef]
- Chowaniec, A.; Sadowski, Ł.; Żak, A. The chemical and microstructural analysis of the adhesive properties of epoxy resin coatings modified using waste glass powder. Appl. Surf. Sci. 2020, 504, 144373. [Google Scholar] [CrossRef]
- Madej, L.; Malinowski, L.; Perzynski, K.; Mojzeszko, M.; Wang, J.; Cios, G.; Bala, P. Considering influence of microstructure morphology of epoxy/glass composite on its behavior under deformation conditions-digital material representation case study. Arch. Civ. Mech. Eng. 2019, 19, 1304–1315. [Google Scholar] [CrossRef]
- Mahadeva Raju, G.K.; Madhu, G.M.; Khan, M.A.; Reddy, P.D.S. Characterizing and Modeling of Mechanical Properties of Epoxy Polymer Composites Reinforced with Fly ash. Mater. Today Proc. 2018, 5, 27998–28007. [Google Scholar] [CrossRef]
- Sosoi, G.; Barbuta, M.; Serbanoui, A.A.; Babor, D.; Burlacu, A. Wastes as aggregate substitution in polymer concrete. Procedia Manuf. 2018, 22, 347–351. [Google Scholar] [CrossRef]
- Mészárosová, L.; Tůmová, E.; Drochytka, R. Epoxy Screed as Possible Protection of Floor Surfaces. Adv. Mater. Res. 2015, 1100, 166–169. [Google Scholar] [CrossRef]
- Dohnálková, B.; Drochytka, R.; Hodul, J. New possibilities of neutralisation sludge solidification technology. J. Clean. Prod. 2018, 204, 1097–1107. [Google Scholar] [CrossRef]
- Canel, A.; Korkut, H.; Korkut, T. Improving neutron and gamma flexible shielding by adding medium-heavy metal powder to epoxy based composite materials. Radiation Phys. Chem. 2019, 158, 13–16. [Google Scholar] [CrossRef]
- Hodul, J.; Žlebek, T.; Drochytka, R. Development of Epoxy Grout Containing Fine Waste from Production of Mineral Wool Board Insulation. Appl. Mech. Mater. 2018, 878, 275–280. [Google Scholar] [CrossRef]
- Drochytka, R.; Hodul, J. Experimental Verification of Use of Secondary Raw Materials as Fillers in Epoxy Polymer Concrete. In Proceedings of the International Congress on Polymers in Concrete (ICPIC 2018), Washington, DC, USA, 29 April–1 May 2019; Reda Taha, M.M., Ed.; Springer: Cham, Switzerland, 2018; pp. 135–141. [Google Scholar] [CrossRef]
- Zhang, J.; Xu, Y.C.; Huang, P. Effect of cure cycle on curing process and hardness for epoxy resin. Express Polym. Lett. 2009, 3, 534–541. [Google Scholar] [CrossRef]
- CEN. EN 13501-1— Fire Classification of Construction Products and Building Elements—Part 1: Classification Using Data from Reaction to Fire Tests; European Committee for Standardization (CEN): Brussels, Belgium, 2009. [Google Scholar]
- D’Almeida, J.R.M.; Manfredini, B.H.P. Hardness evaluation of epoxy resin filled with mineral waste. J. Appl. Polym. Sci. 2002, 84, 2178–2184. [Google Scholar] [CrossRef]
- Arulrajah, A.; Yaghoubi, E.; Imteaz, M.; Horpibulsuk, S. Recycled waste foundry sand as a sustainable subgrade fill and pipe-bedding construction material: Engineering and environmental evaluation. Sustain. Cities Soc. 2017, 28, 343–349. [Google Scholar] [CrossRef]
- Siddique, R.; Singh, G. Utilization of waste foundry sand (WFS) in concrete manufacturing. Resour. Conserv. Recycl. 2011, 55, 885–892. [Google Scholar] [CrossRef]
- CEN. EN 12808-3—Grouts for Tiles. Determination of Flexural and Compressive Strength; European Committee for Standardization (CEN): Brussels, Belgium, 2008. [Google Scholar]
- CEN. EN 1542—Products and Systems for the Protection and Repair of Concrete Structures—Test Methods—Measurement of Bond Strength by Pull-Off; European Committee for Standardization (CEN): Brussels, Belgium, 1999. [Google Scholar]
- CEN. EN 13892-3—Methods of Test for Screed Materials—Part 3: Determination of Wear Resistance—Böhme; European Committee for Standardization (CEN): Brussels, Belgium, 2014. [Google Scholar]
- CEN; ISO. ISO 6272-1—Paints and Varnishes—Rapid—Deformation (Impact Resistance) Tests—Part 1: Falling-Weight Test, Large-Area Indenter; European Committee for Standardization (CEN): Brussels, Belgium; Technical Committee ISO/TC35/SC9: Geneva, Switzerland, 2011. [Google Scholar]
- CEN; ISO. EN ISO 868:2003—Plastics and Ebonite—Determination of Indentation Hardness by Means of a Durometer (Shore Hardness); European Committee for Standardization (CEN): Brussels, Belgium; Technical Committee ISO/TC61/SC2: Geneva, Switzerland, 2003. [Google Scholar]
- Drochytka, R.; Dohnálek, J.; Bydžovský, J.; Pumpr, V.; Dufka, Á.; Dohnálek, P. Technical Conditions for Rehabilitation of Concrete Structures; TP SSBK III; Association for the Rehabilitation of Concrete Structures: Brno, Czech Republic, 2012; ISBN 978-80-260-2210-7. [Google Scholar]
- CEN. EN 1504-3—Products and Systems for the Protection and Repair of Concrete Structures—Definitions, Requirements, Quality Control and Evaluation of Conformity—Part 3: Structural and Non-Structural Repair; European Committee for Standardization (CEN): Brussels, Belgium, 2005. [Google Scholar]
- Courard, L.; Schwall, D.; Garbacz, A.; Piotrowski, T. Effect of concrete substrate texture on the adhesion properties of PCC repair mortar. In Proceedings ISPIC 2006 International Symposium Polymers in Concrete, Guimarães, Portugal, 2–4 April 2006; Aguiar, J.B., Jalali, S., Camões, A., Ferreira, R.M., Eds.; Oficinas Gráficas de Barbosa & Xavier, Lda: Braga, Portugal, 2006; pp. 99–110. [Google Scholar]
- Bagherzadeh, A.; Jamshidi, M.; Monemian, F. Investigating mechanical and bonding properties of micro/nano filler containing epoxy adhesives for anchoring steel bar in concrete. Constr. Build. Mater. 2020, 240, 117979. [Google Scholar] [CrossRef]
- Stabik, J.; Dybowska, A.; Szczepanik, M.; Suchoń, Ł. Viscosity measurements of epoxy resin filled with ferrite powders. Arch. Mater. Sci. Eng. 2009, 38, 34–40. [Google Scholar]
- Bloom, P.D.; Baikerikar, K.G.; Anderegg, J.W.; Sheares, V.V. Fabrication and wear resistance of Al–Cu–Fe quasicrystal-epoxy composite materials. Mater. Eng. A 2003, 360, 46–57. [Google Scholar] [CrossRef]
- Srivastava, V.K.; Pathak, J.P. Friction and wear properties of bushing bearing of graphite filled short glass fiber composite in dry sliding. Wear 1996, 197, 145–150. [Google Scholar] [CrossRef]
- Yousif, B.F.; Nirmal, U.; Wong, K.J. Three-body abrasion on wear and frictional performance of treated betelnut fibre reinforced epoxy (T-BFRE) composite. Mater. Des. 2010, 31, 4514–4521. [Google Scholar] [CrossRef]
- Yasmin, A.; Daniel, I.M. Mechanical and thermal properties of graphite platelet/epoxy composites. Polymer 2004, 45, 8211–8219. [Google Scholar] [CrossRef]
- Ogata, M.; Kinjo, N.; Kawata, T. Effects of crosslinking on physical properties of phenol–formaldehyde novolac cured epoxy resins. J. Appl. Polym. Sci. 1993, 48, 583–601. [Google Scholar] [CrossRef]
- Wong, C.P.; Bollampally, R.S. Thermal conductivity, elastic modulus, and coefficient of thermal expansion of polymer composites filled with ceramic particles for electronic packaging. J. Appl. Polym. Sci. 1999, 74, 3396–3403. [Google Scholar] [CrossRef]
- Kalenda, P.; Kalendová, A. Improved chemical resistance of epoxy resin-based coating compositions. Dye. Pigment. 1994, 27, 305–312. [Google Scholar] [CrossRef]
- Kim, D.H.; Yu, A.; Goh, M. Oxidative chemical depolymerization of thermoset epoxy resin for green recycling. J. Ind. Eng. Chem. 2021, 96, 76–81. [Google Scholar] [CrossRef]
- Morin, C.; Loppinet-Serani, A.; Cansell, F.; Aymonier, C. Near- and supercritical solvolysis of carbon fibre reinforced polymers (CFRPs) for recycling carbon fibers as a valuable resource: State of the art. J. Supercrit. Fluids 2012, 66, 232–240. [Google Scholar] [CrossRef] [Green Version]
- Huang, H.; Yin, Y.; Cheng, H.; Zhao, Z.; Zhang, B. Degradation mechanism of CF/EP composites in supercritical n-butanol with alkali additives. J. Polym. Environ. 2017, 25, 115–125. [Google Scholar] [CrossRef]
- Das, M.; Varughese, S. A novel sonochemical approach for enhanced recovery of carbon fiber from CFRP waste using mild acid-peroxide mixture. ACS Sustain. Chem. Eng. 2016, 4, 2080–2087. [Google Scholar] [CrossRef]
- Xu, P.; Li, J.; Ding, J. Chemical recycling of carbon fibre/epoxy composites in a mixed solution of peroxide hydrogen and N,N-dimethylformamide. Compos. Sci. Technol 2013, 82, 54–59. [Google Scholar] [CrossRef]
- Ma, Y.; Nutt, S. Chemical treatment for recycling of amine/epoxy composites at atmospheric pressure. Polym. Degrad. Stab. 2018, 153, 307–317. [Google Scholar] [CrossRef]
- Ma, Y.; Kim, D.; Nutt, S.R. Chemical treatment for dissolution of amine-cured epoxies at atmospheric pressure. Polym. Degrad. Stabil. 2017, 146, 240–249. [Google Scholar] [CrossRef]
- Navarro, C.A.; Kedzie, E.A.; Ma, Y.; Michael, K.H.; Nutt, S.R.; Williams, T.J. Mechanism and catalysis of oxidative degradation of fiber-reinforced epoxy composites. Top. Catal. 2018, 61, 704–709. [Google Scholar] [CrossRef]


| Epoxy Binder | Component A | Component B | Mix Ratio by Weight of Resin to Hardener |
|---|---|---|---|
| ER 1 | Epoxy resin, (alkoxymethyl) oxirane (C12–C14 alkyl), solvent naphtha (petroleum), light aromatic | Benzyl alcohol, polymer with benzenamine, hydrogenated formaldehyde, 2,4,6-tris (dimethylaminomethyl) phenol, 1,4-bis(aminocyclohexyl)methane | 3.2:1 |
| ER 2 | Epoxy resin, (alkoxymethyl) oxirane (C12–C14 alkyl), solvent naphtha (petroleum), light aromatic | Benzyl alcohol, fatty acids, reaction products with triethylenetetramine, 3-(aminomethyl)-3,5,5-trimethylcyclohexan-1-amin, bisfenol Am-fenylenbis (methylamin), N,N-dimethylpropan-1,3-diamin, 2,4,6-tris(dimethylaminomethyl) phenol | 1.8:1 |
| ER 3 | Epoxy resin, oxirane, formaldehyde,oligomeric reaction products with 1-chlor-2, 3-epoxypropane and phenol | Trisphenol, benzyl alcohol, Methylene oxide polymer with benzenamine, hydrogenated, 4, 4-Methylenebis | 1.8:1 |
| Epoxy Binder | Specific Weight at 20 °C (kg/L) | Pot Life at 20 °C (min) | Max. Moisture of Substrate (%) | Dynamic Viscosity (mPa·s) |
|---|---|---|---|---|
| ER 1 | 1.30 | 20 | 5 | 2200 |
| ER 2 | 1.11 | 2 | 12 | 2160 |
| ER 3 | 1.10 | 20 | 4 | 2150 |
| Parameter | REF | WGS | RGI | FA | NS | WFS |
|---|---|---|---|---|---|---|
| SiO2 | 99.5 | 71.0 | 50.6 | 53.4 | 1.12 | 94.0 |
| Al2O3 | 0.41 | 0.499 | 13.5 | 18.34 | 0.53 | 1.72 |
| Fe2O3 | 0.028 | 0.11 | 0.33 | 10.57 | 56.6 | 0.387 |
| Na2O | 0.029 | 12.4 | 0.35 | 0.21 | 0.08 | 1.99 |
| K2O | 0.222 | 0.171 | 0.58 | 0.91 | 0.06 | 0.726 |
| CaO | 0.038 | 8.45 | 21.2 | 4.13 | 15.5 | 0.174 |
| MgO | - | 4.04 | 0.45 | 0.89 | 0.05 | 0.057 |
| MnO | - | 0.006 | - | - | - | 0.011 |
| ZnO | 0.01 | - | - | - | - | - |
| SrO | - | 0.005 | 0.11 | - | - | - |
| CuO | - | - | - | - | 0.326 | - |
| NiO | - | - | - | - | 0.014 | - |
| Cr2O3 | <0.004 | 0.005 | - | - | 0.023 | 0.081 |
| TiO2 | 0.031 | 0.023 | 0.32 | - | - | 0.037 |
| SO4 | - | - | - | 0.25 | 0.47 | - |
| PbO | 0.02 | - | - | - | 0.262 | - |
| V2O5 | - | - | - | - | 1.43 × 10⁻⁴ | - |
| TOC | - | - | - | 5.2 | 0.02 | - |
| Parameter | REF | WGS | RGI | FA | NS | WFS |
|---|---|---|---|---|---|---|
| Specific gravity (kg/m3) | 2662 | 2509 | 2620 | 2390 | 2960 | 2680 |
| Specific surface area (cm2/g) | 330 | 390 | 900 | 3410 | 7800 | 430 |
| Indication of a Breach | Evaluation Criterion |
|---|---|
| 7 | The material shows no changes |
| 6 | Colour changes |
| 5 | Swelling + colour changes |
| 4 | Peeling the material off the slide |
| 3 | Peeling the material off the slide + swelling + colour changes |
| 2 | Peeling the material off the slide + softening |
| 1 | Complete decomposition of the material |
| Material | Aggressive Medium | Concentration | REF | WGS | RGI | FA | NS | WFS |
|---|---|---|---|---|---|---|---|---|
| ER1 | H2SO4 | 40% | 7 | 7 | 6 | 7 | 6 | 7 |
| ER2 | 7 | 7 | 6 | 7 | 6 | 7 | ||
| ER3 | 7 | 7 | 7 | 7 | 6 | 7 | ||
| ER1 | NaOH | 40% | 7 | 7 | 7 | 7 | 7 | 7 |
| ER2 | 7 | 7 | 7 | 7 | 6 | 7 | ||
| ER3 | 7 | 7 | 7 | 7 | 7 | 7 | ||
| ER1 | CH3COOH | 10% | 1 | 3 | 2 | 1 | 1 | 2 |
| ER2 | 1 | 3 | 2 | 1 | 1 | 2 | ||
| ER3 | 2 | 3 | 3 | 2 | 2 | 2 | ||
| ER1 | Gasoline | - | 7 | 7 | 7 | 7 | 7 | 7 |
| ER2 | 7 | 7 | 7 | 7 | 6 | 7 | ||
| ER3 | 7 | 7 | 7 | 7 | 7 | 7 | ||
| ER1 | NaCl | 10% | 7 | 7 | 7 | 7 | 7 | 7 |
| ER2 | 7 | 7 | 7 | 7 | 7 | 7 | ||
| ER3 | 7 | 7 | 7 | 7 | 7 | 7 | ||
| ER1 | H2O2 | 30% | 5 | 6 | 6 | 2 | 3 | 5 |
| ER2 | 5 | 6 | 5 | 2 | 4 | 5 | ||
| ER3 | 5 | 6 | 6 | 3 | 4 | 6 | ||
| ER1 | Distilled water | - | 7 | 7 | 7 | 7 | 7 | 7 |
| ER2 | 7 | 7 | 7 | 7 | 7 | 7 | ||
| ER3 | 7 | 7 | 7 | 7 | 7 | 7 |
Publisher’s Note: MDPI stays neutral with regard to jurisdictional claims in published maps and institutional affiliations. |
© 2021 by the authors. Licensee MDPI, Basel, Switzerland. This article is an open access article distributed under the terms and conditions of the Creative Commons Attribution (CC BY) license (https://creativecommons.org/licenses/by/4.0/).
Share and Cite
Hodul, J.; Mészárosová, L.; Drochytka, R. Recovery of Industrial Wastes as Fillers in the Epoxy Thermosets for Building Application. Materials 2021, 14, 3490. https://doi.org/10.3390/ma14133490
Hodul J, Mészárosová L, Drochytka R. Recovery of Industrial Wastes as Fillers in the Epoxy Thermosets for Building Application. Materials. 2021; 14(13):3490. https://doi.org/10.3390/ma14133490
Chicago/Turabian StyleHodul, Jakub, Lenka Mészárosová, and Rostislav Drochytka. 2021. "Recovery of Industrial Wastes as Fillers in the Epoxy Thermosets for Building Application" Materials 14, no. 13: 3490. https://doi.org/10.3390/ma14133490