
Methane and Carbon Dioxide Hydrate Formation and Dissociation in Presence of a Pure Quartz Porous Framework Impregnated with CuSn12 Metallic Powder: An Experimental Report


Abstract
:1. Introduction
2. Materials and Methods
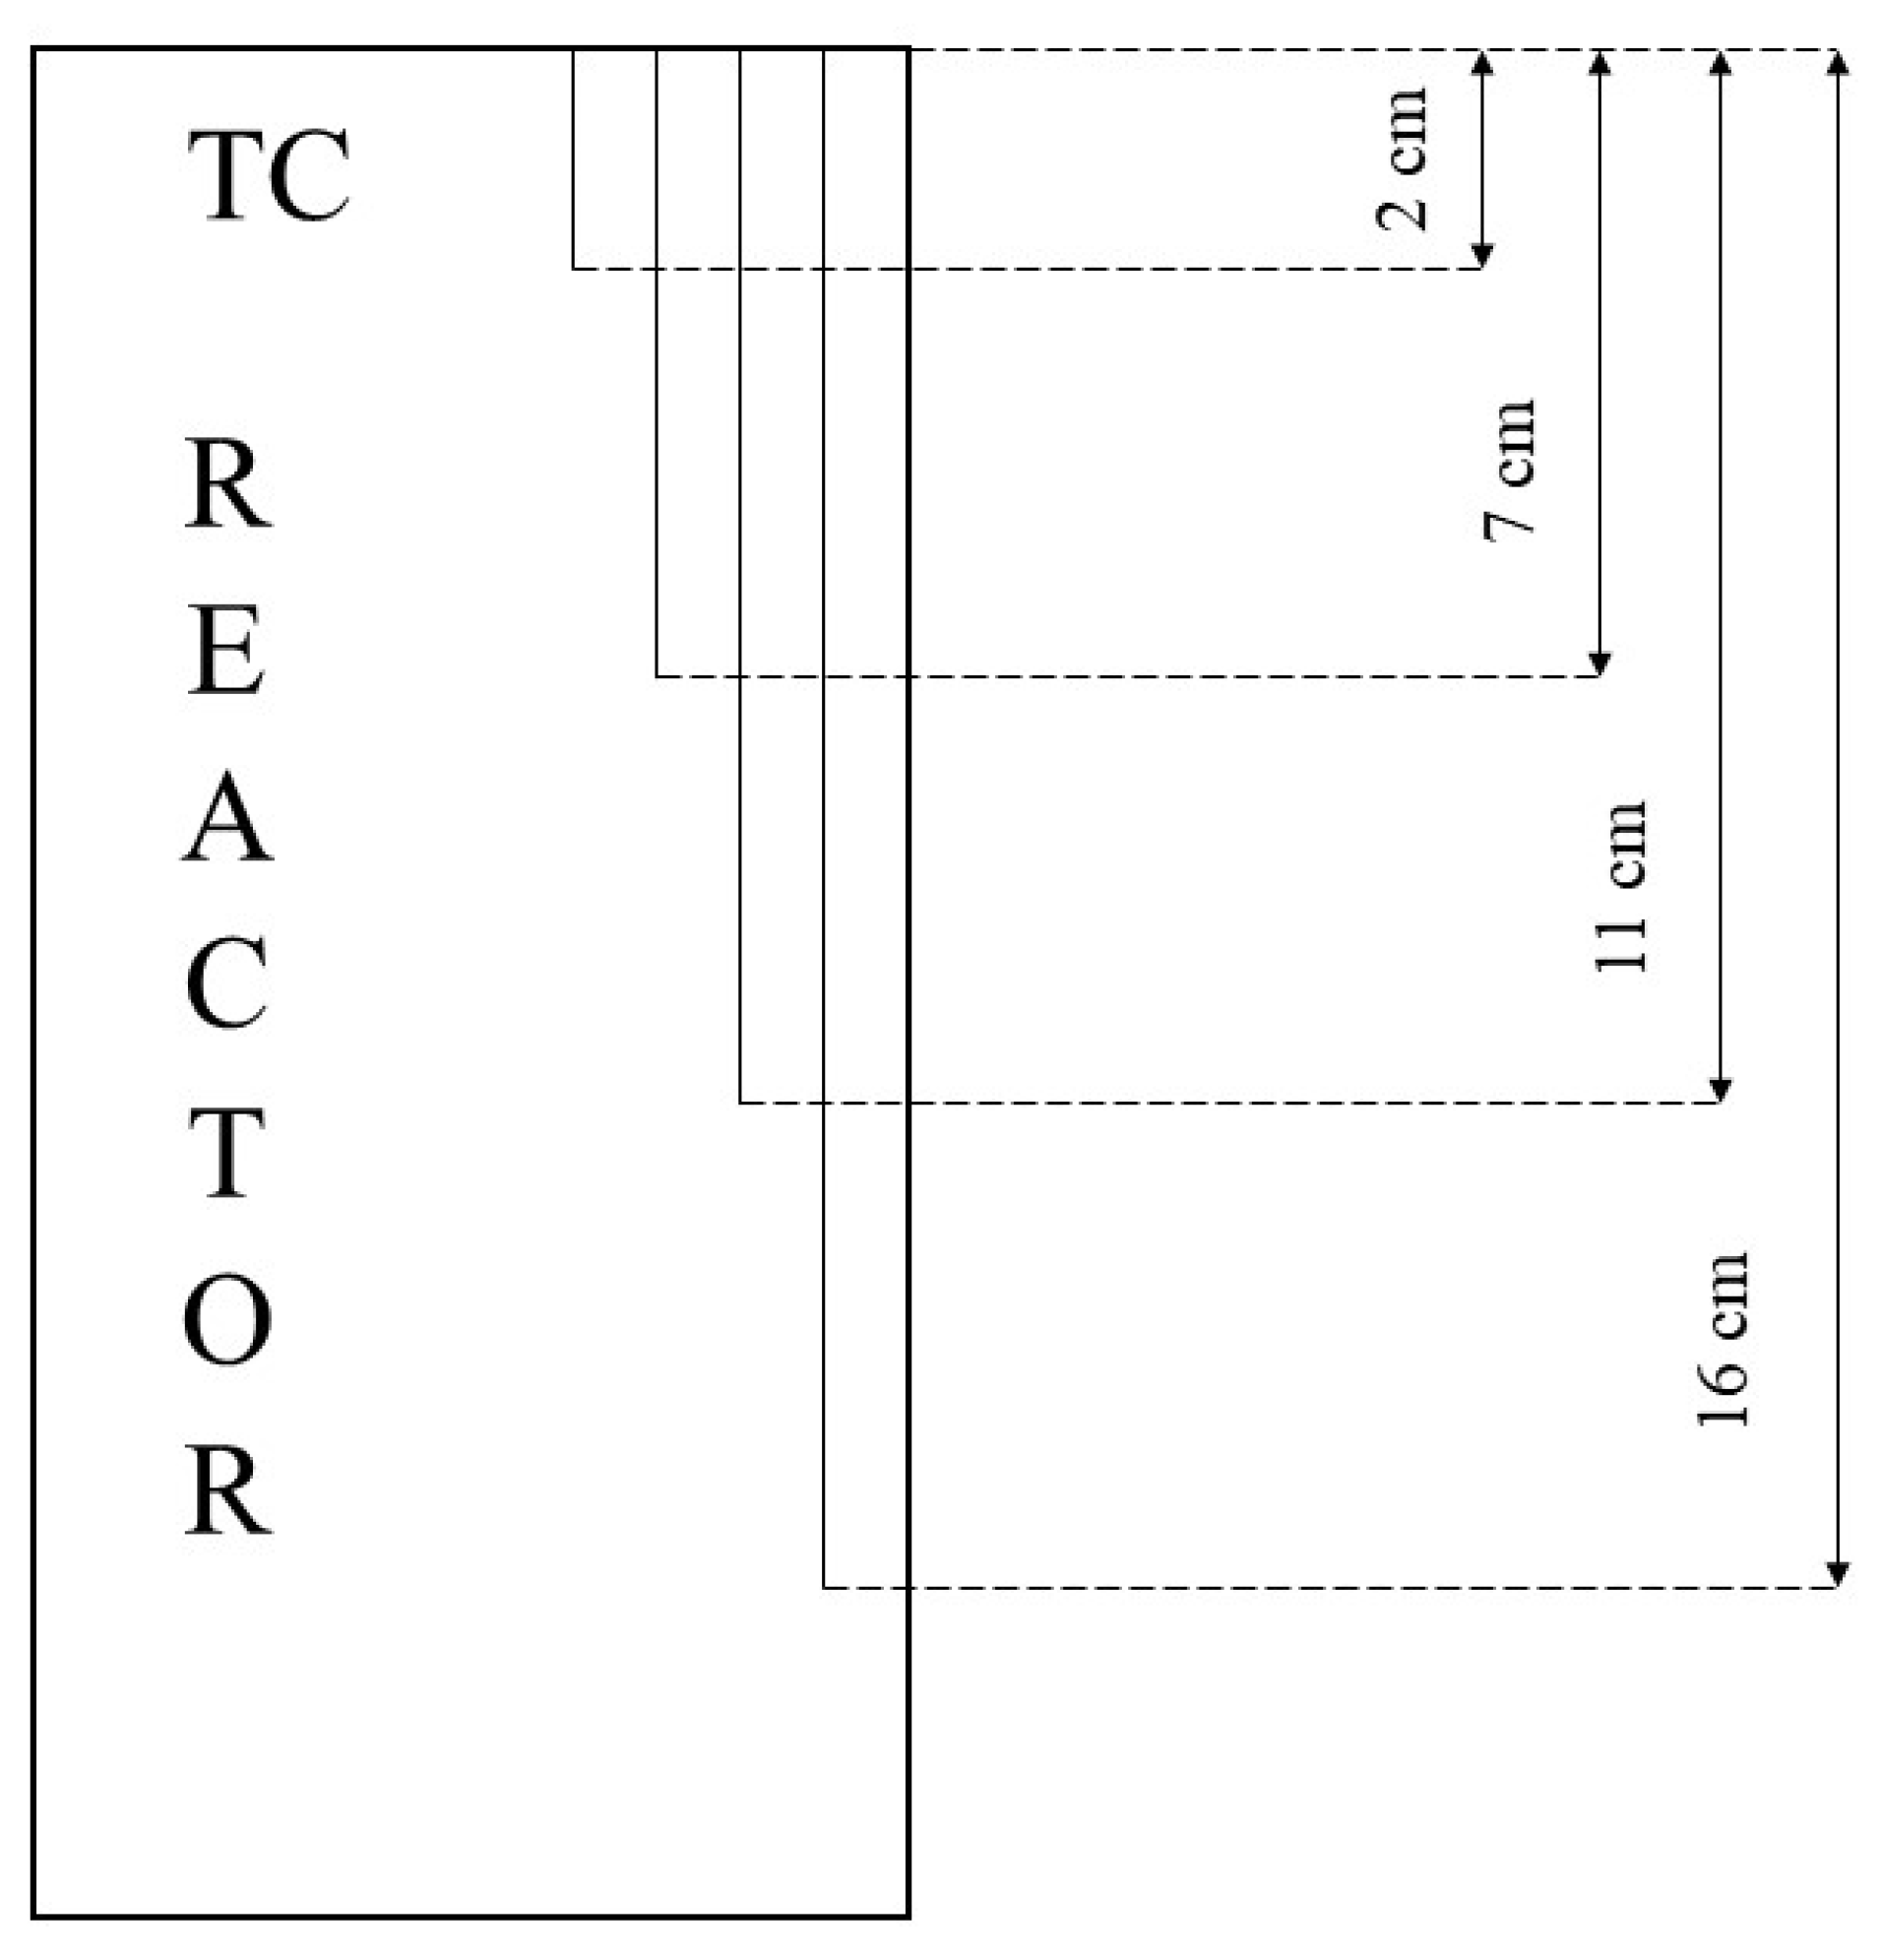
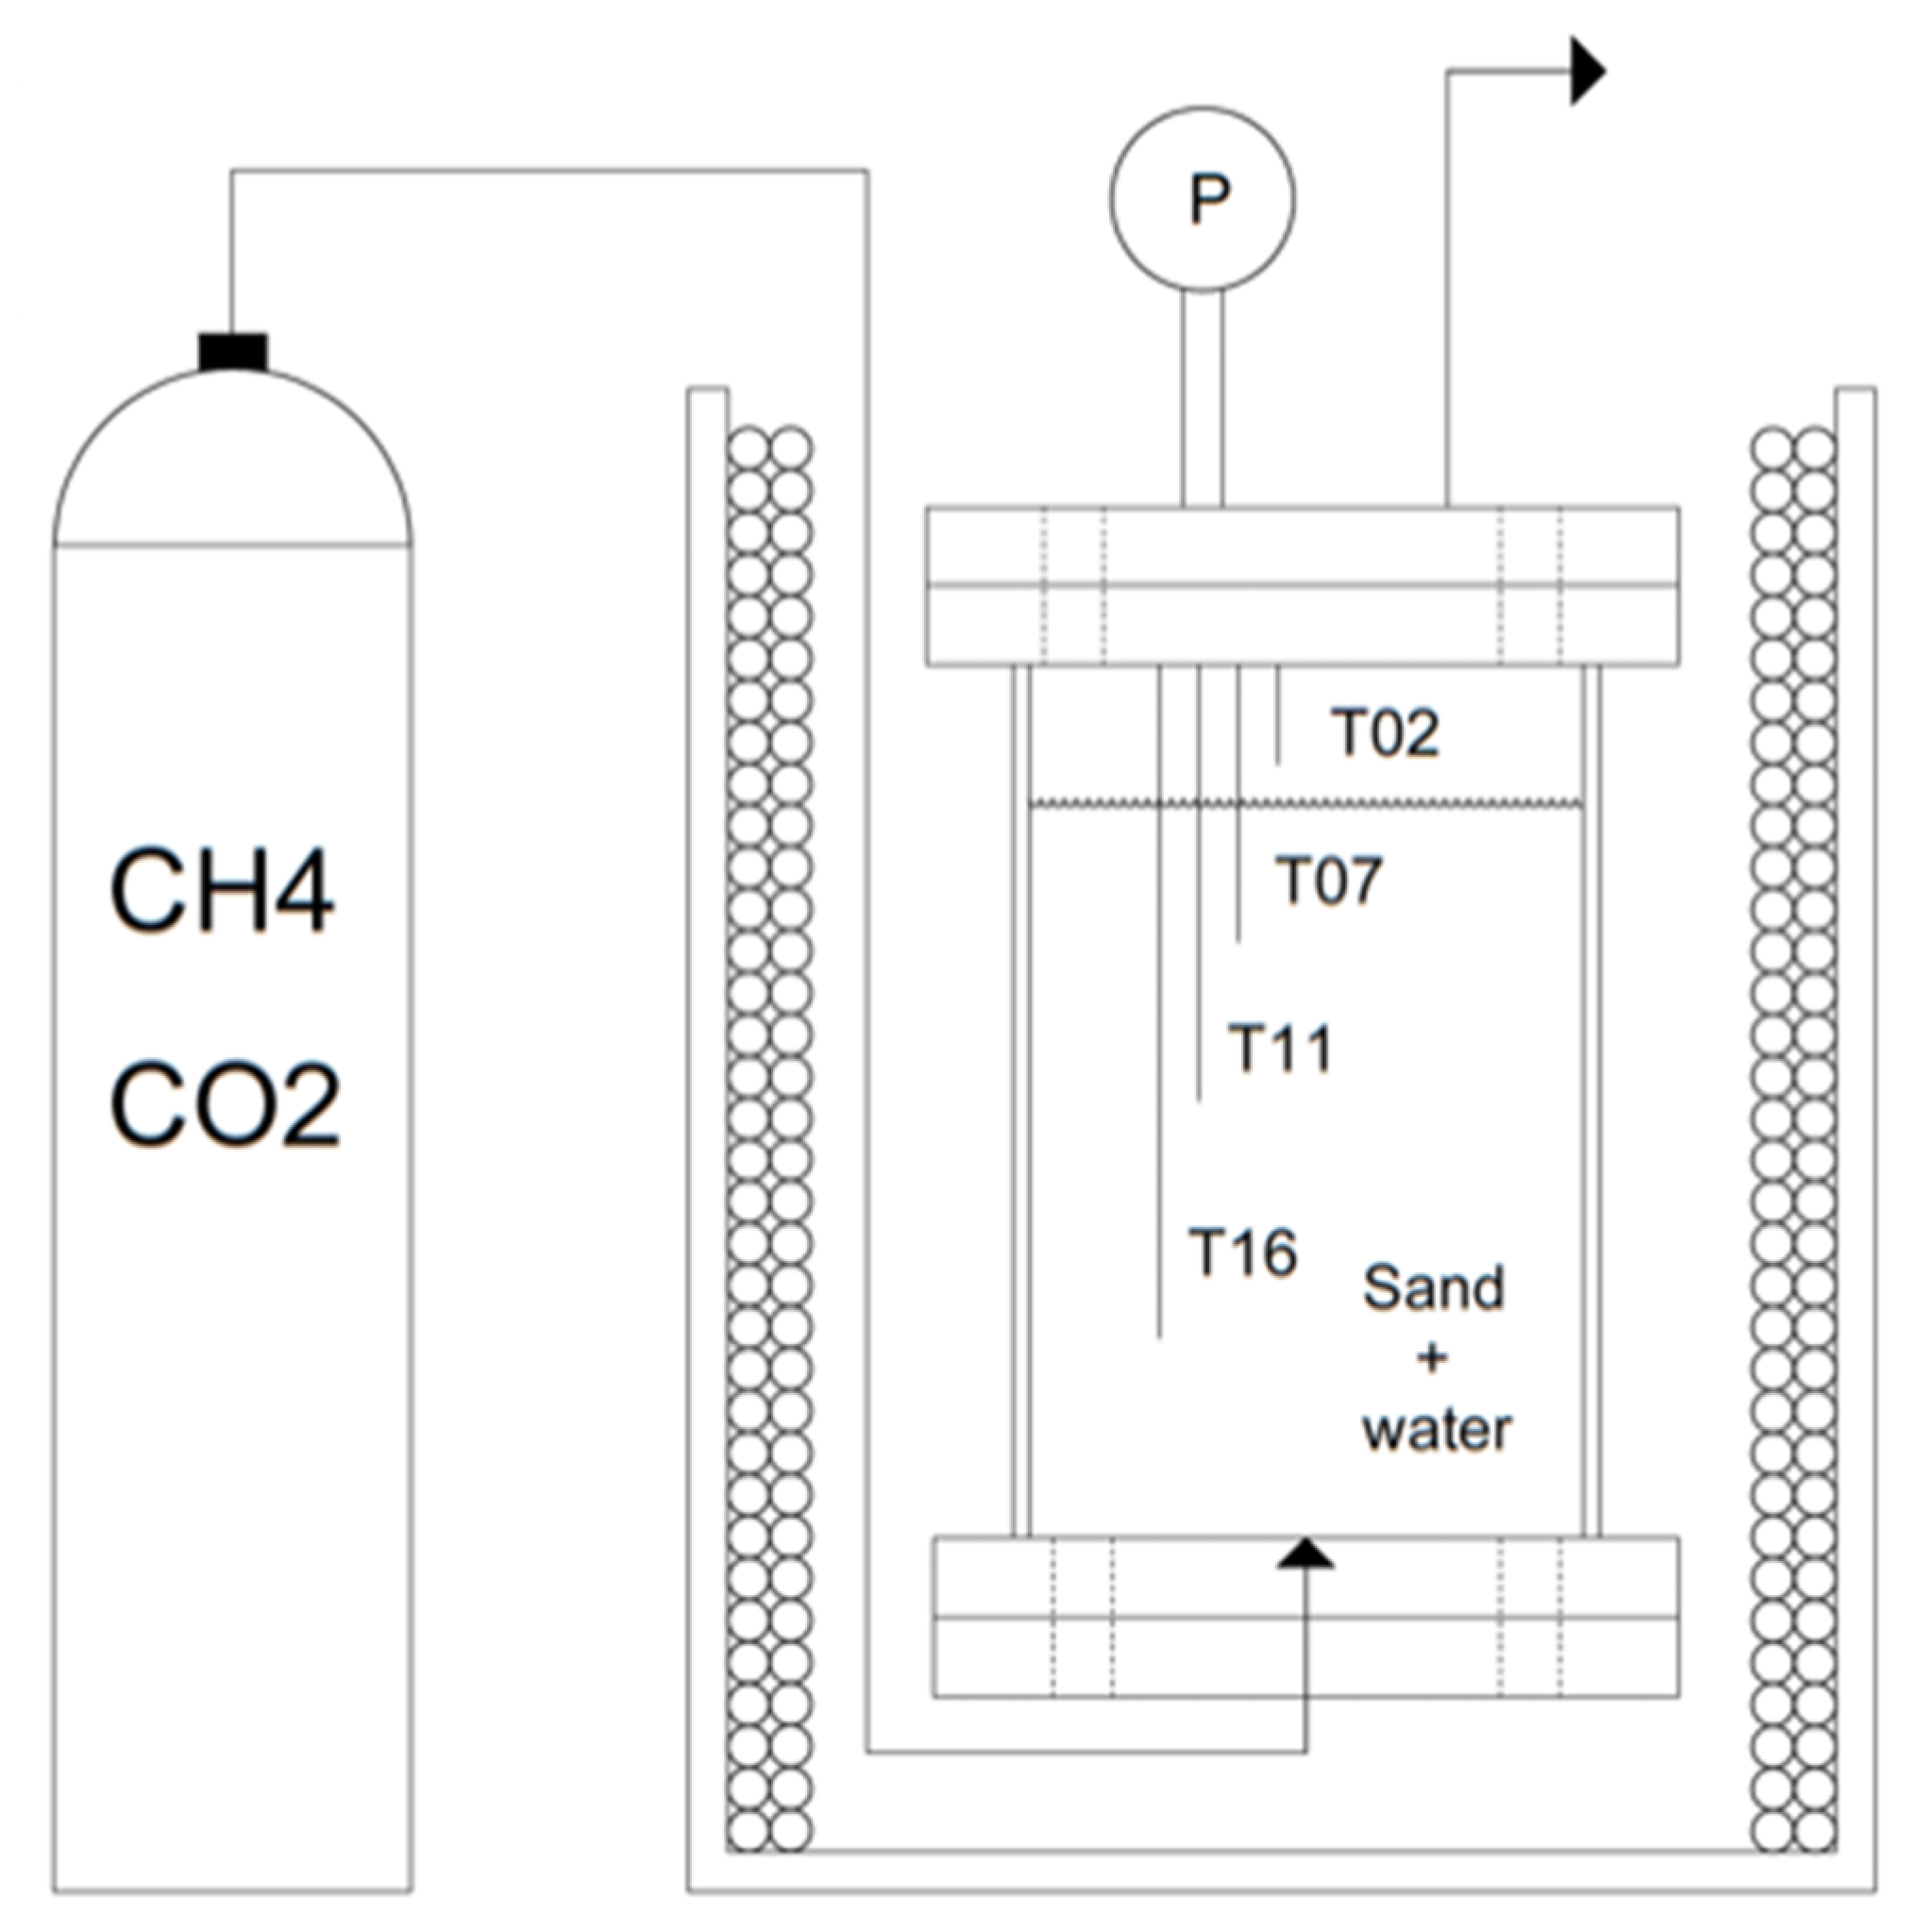
2.1. Experimental Apparatus
2.2. Materials
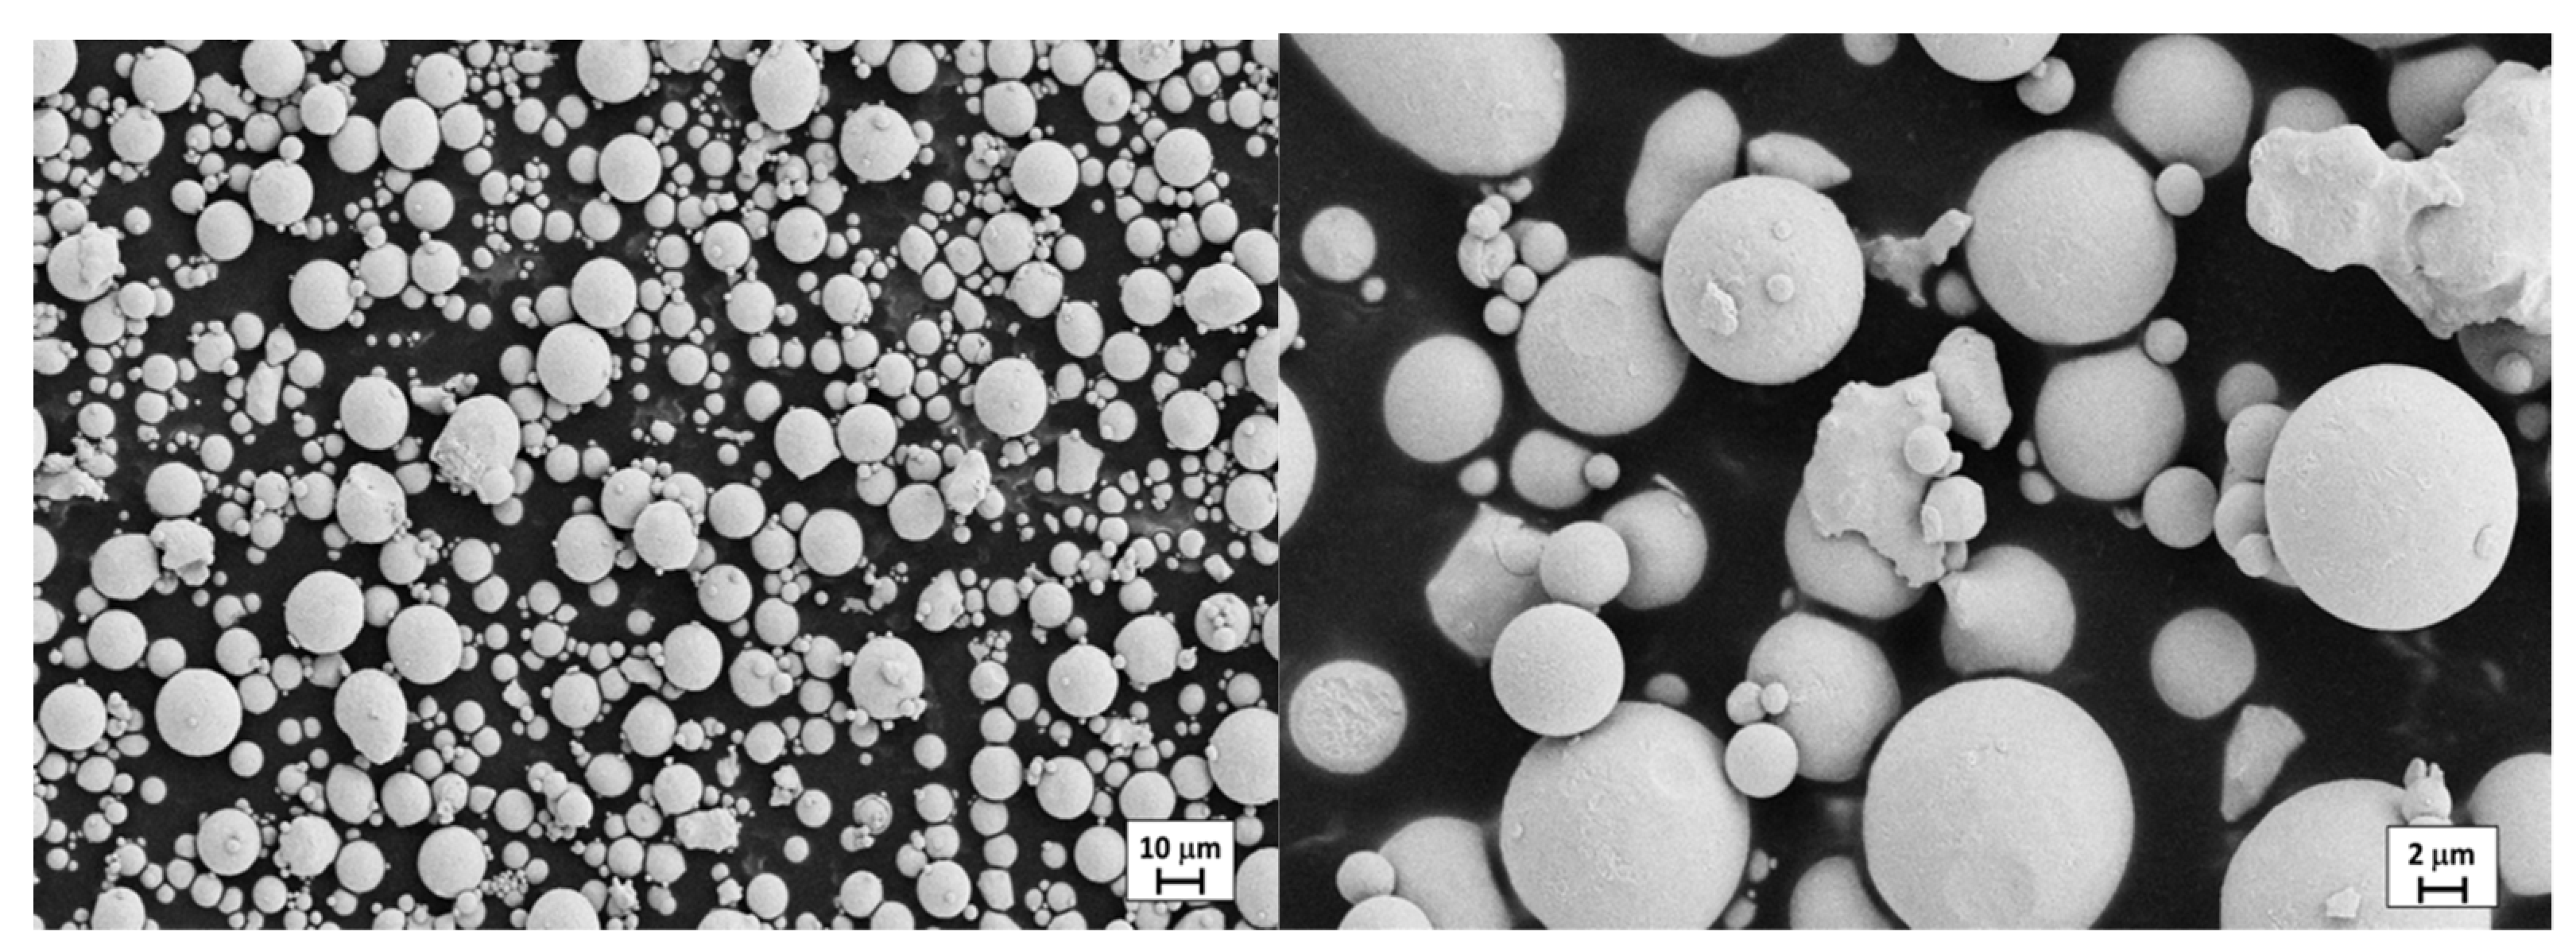
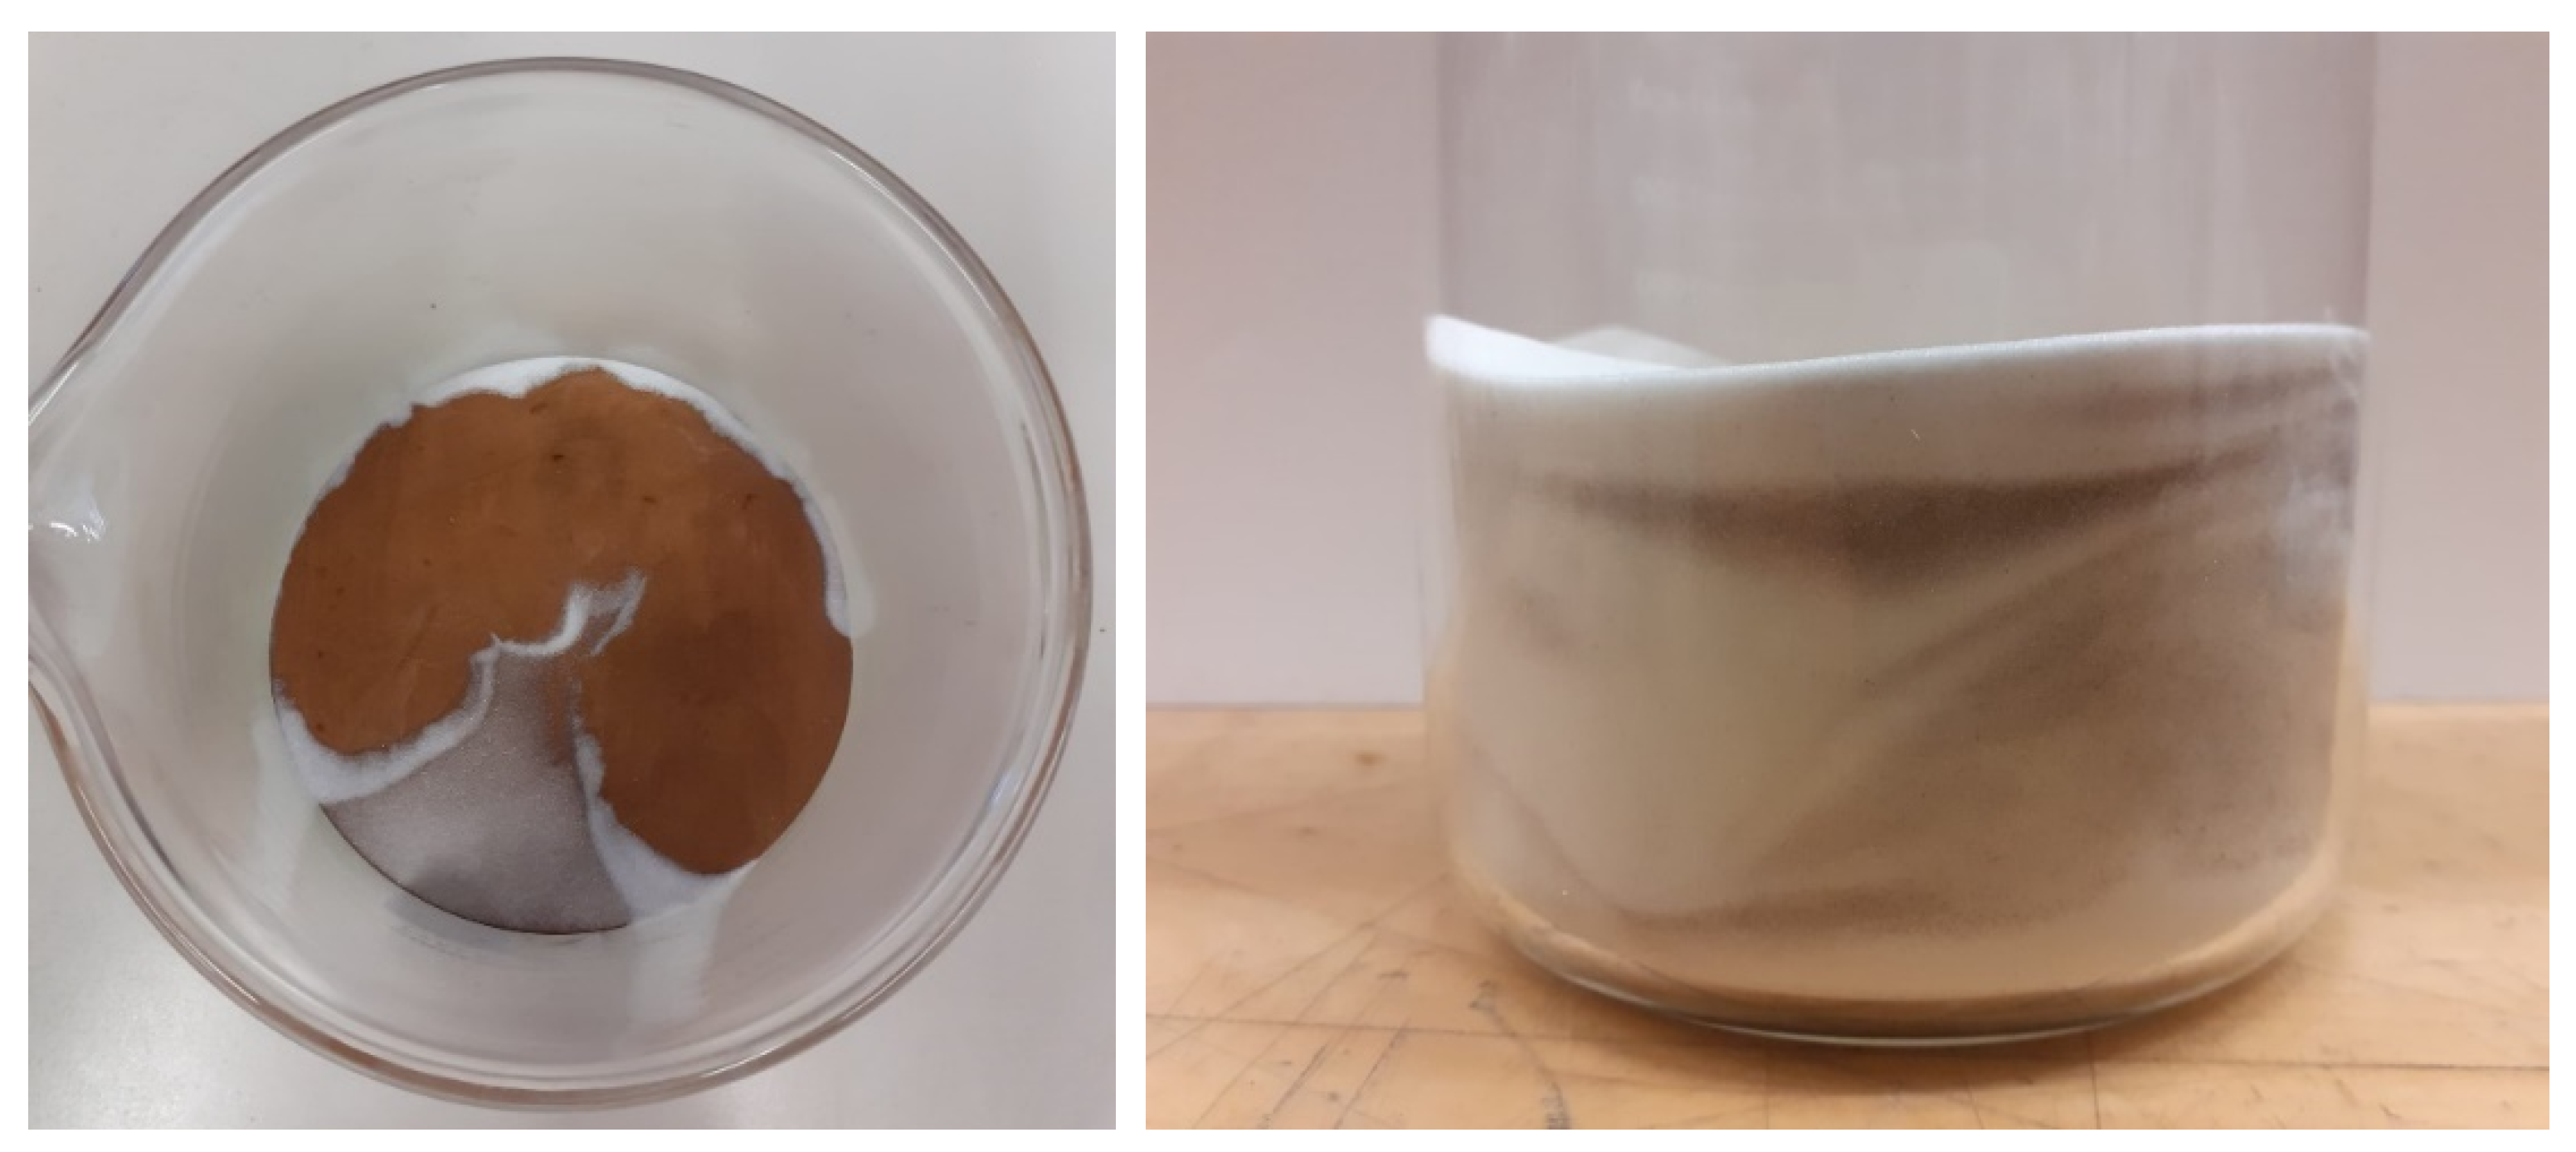
CuSn12 Powder
2.3. Methods
3. Results
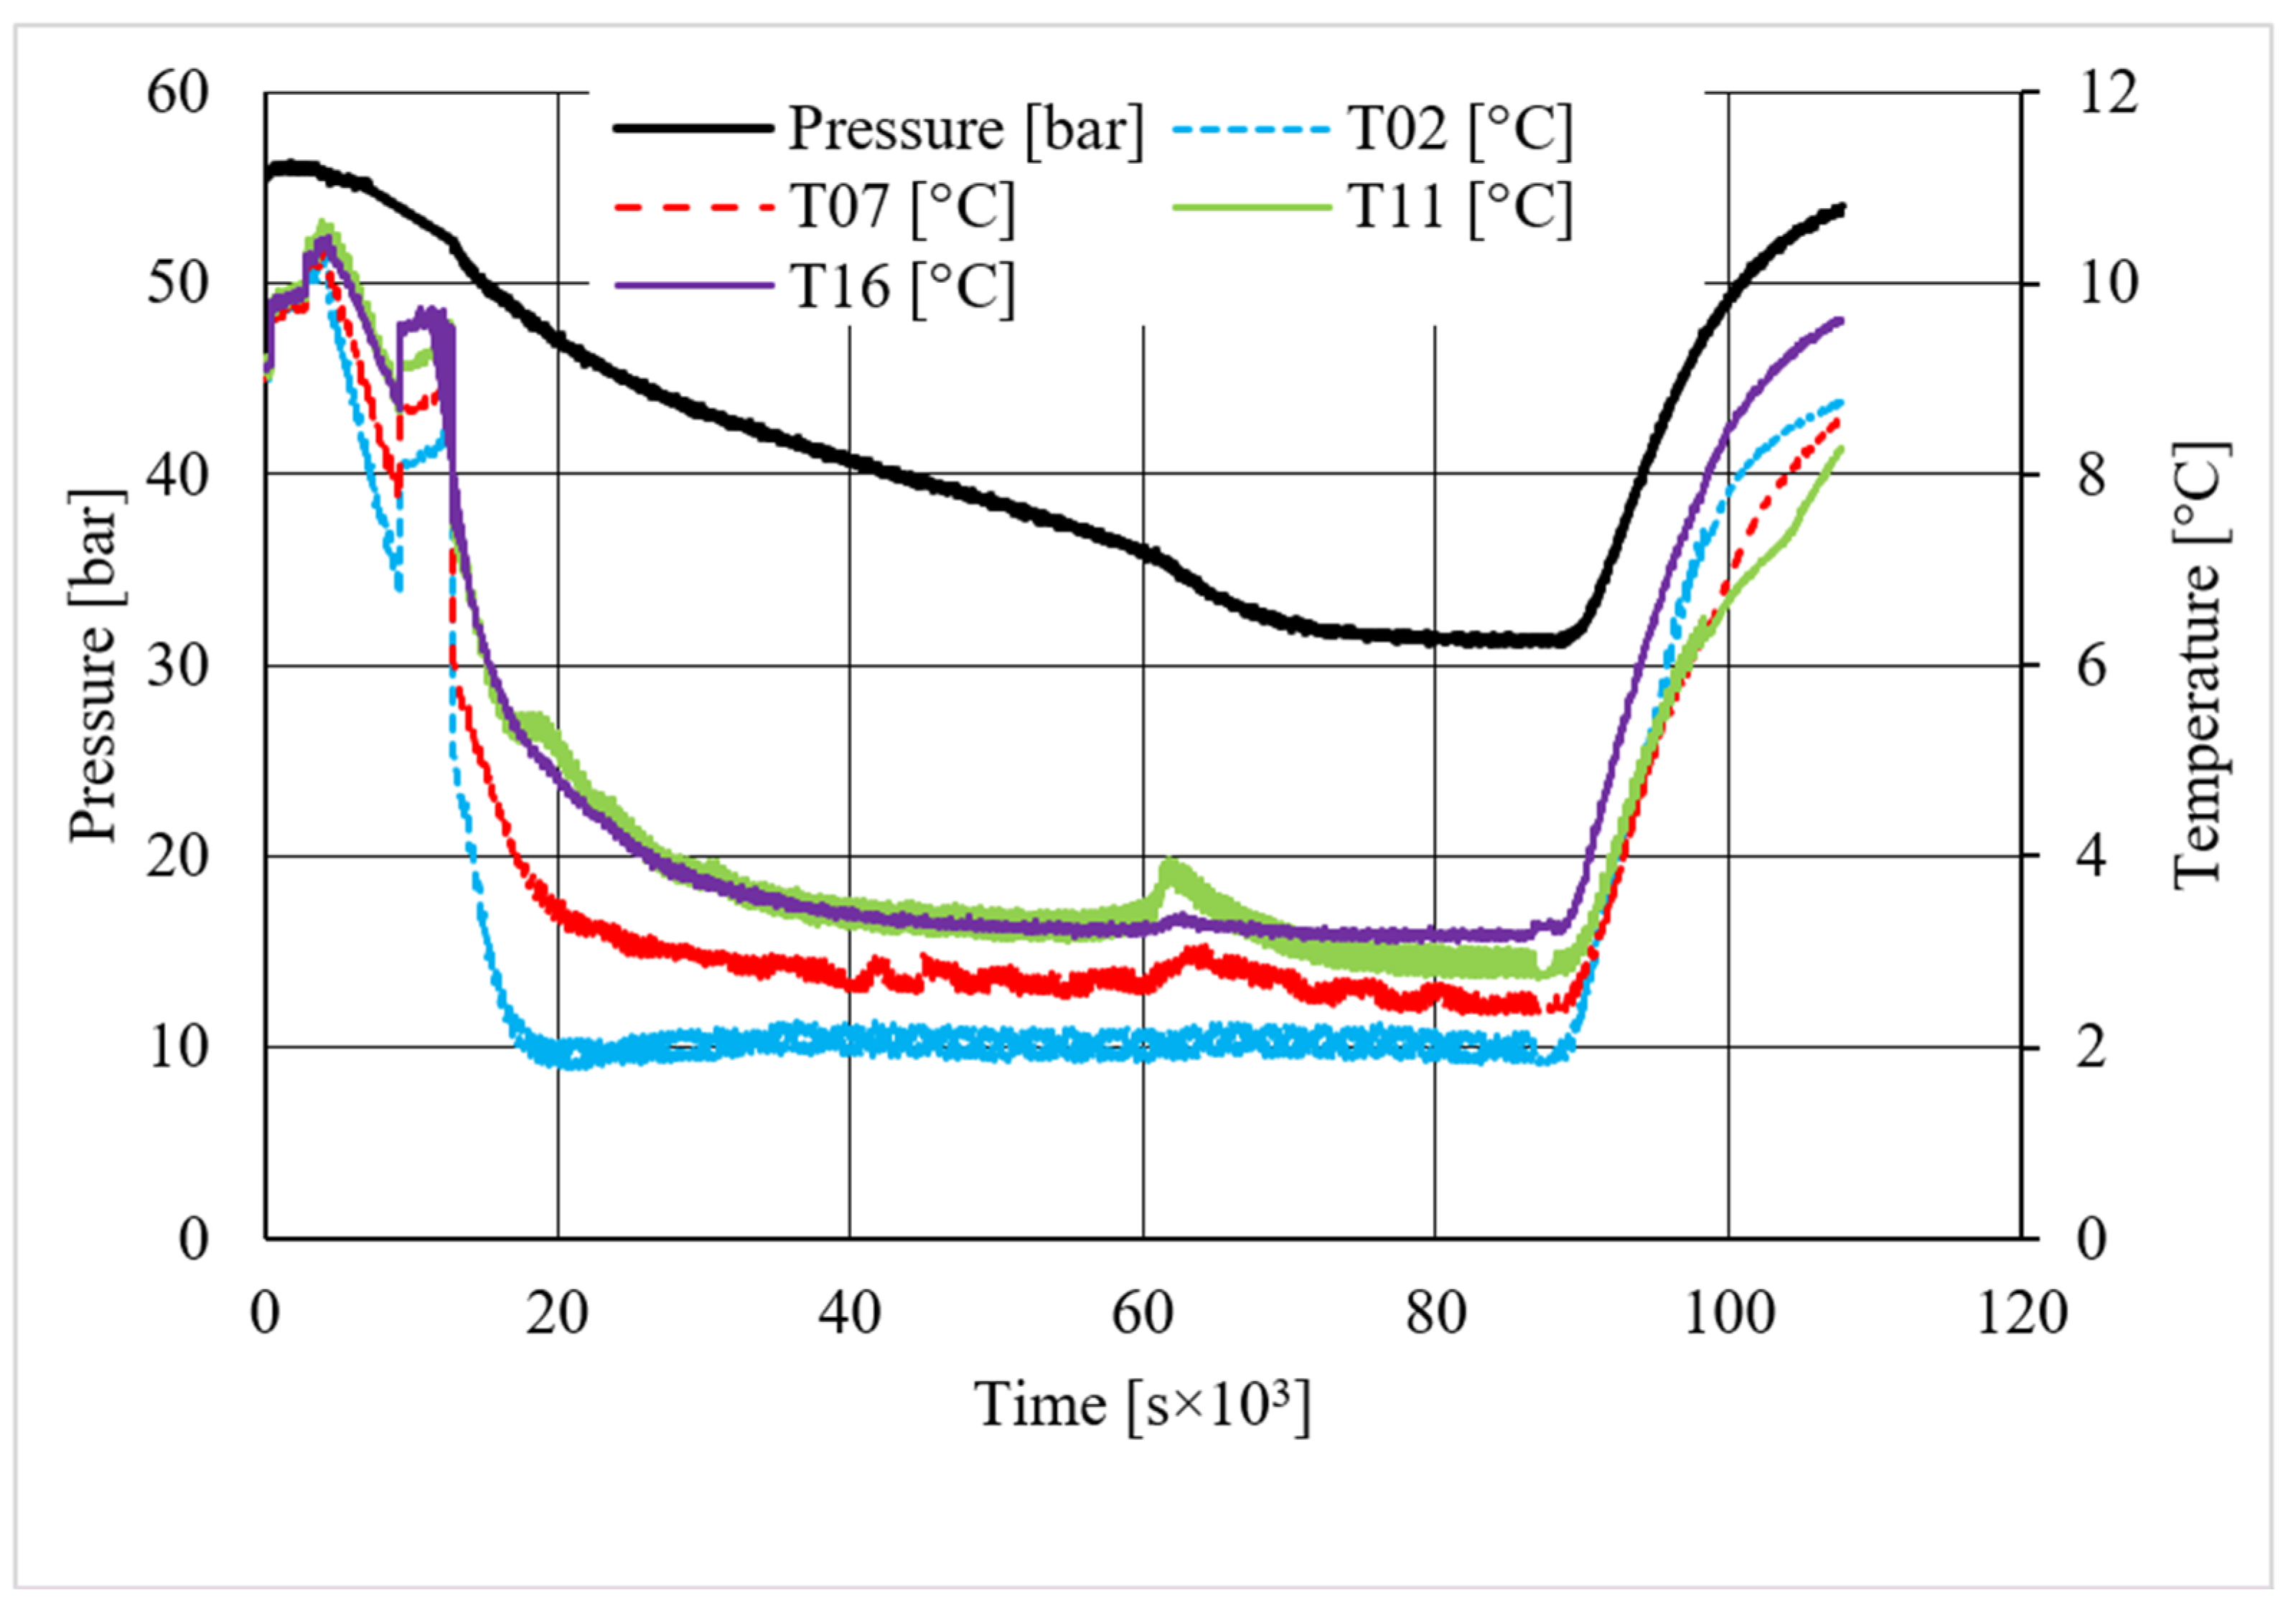
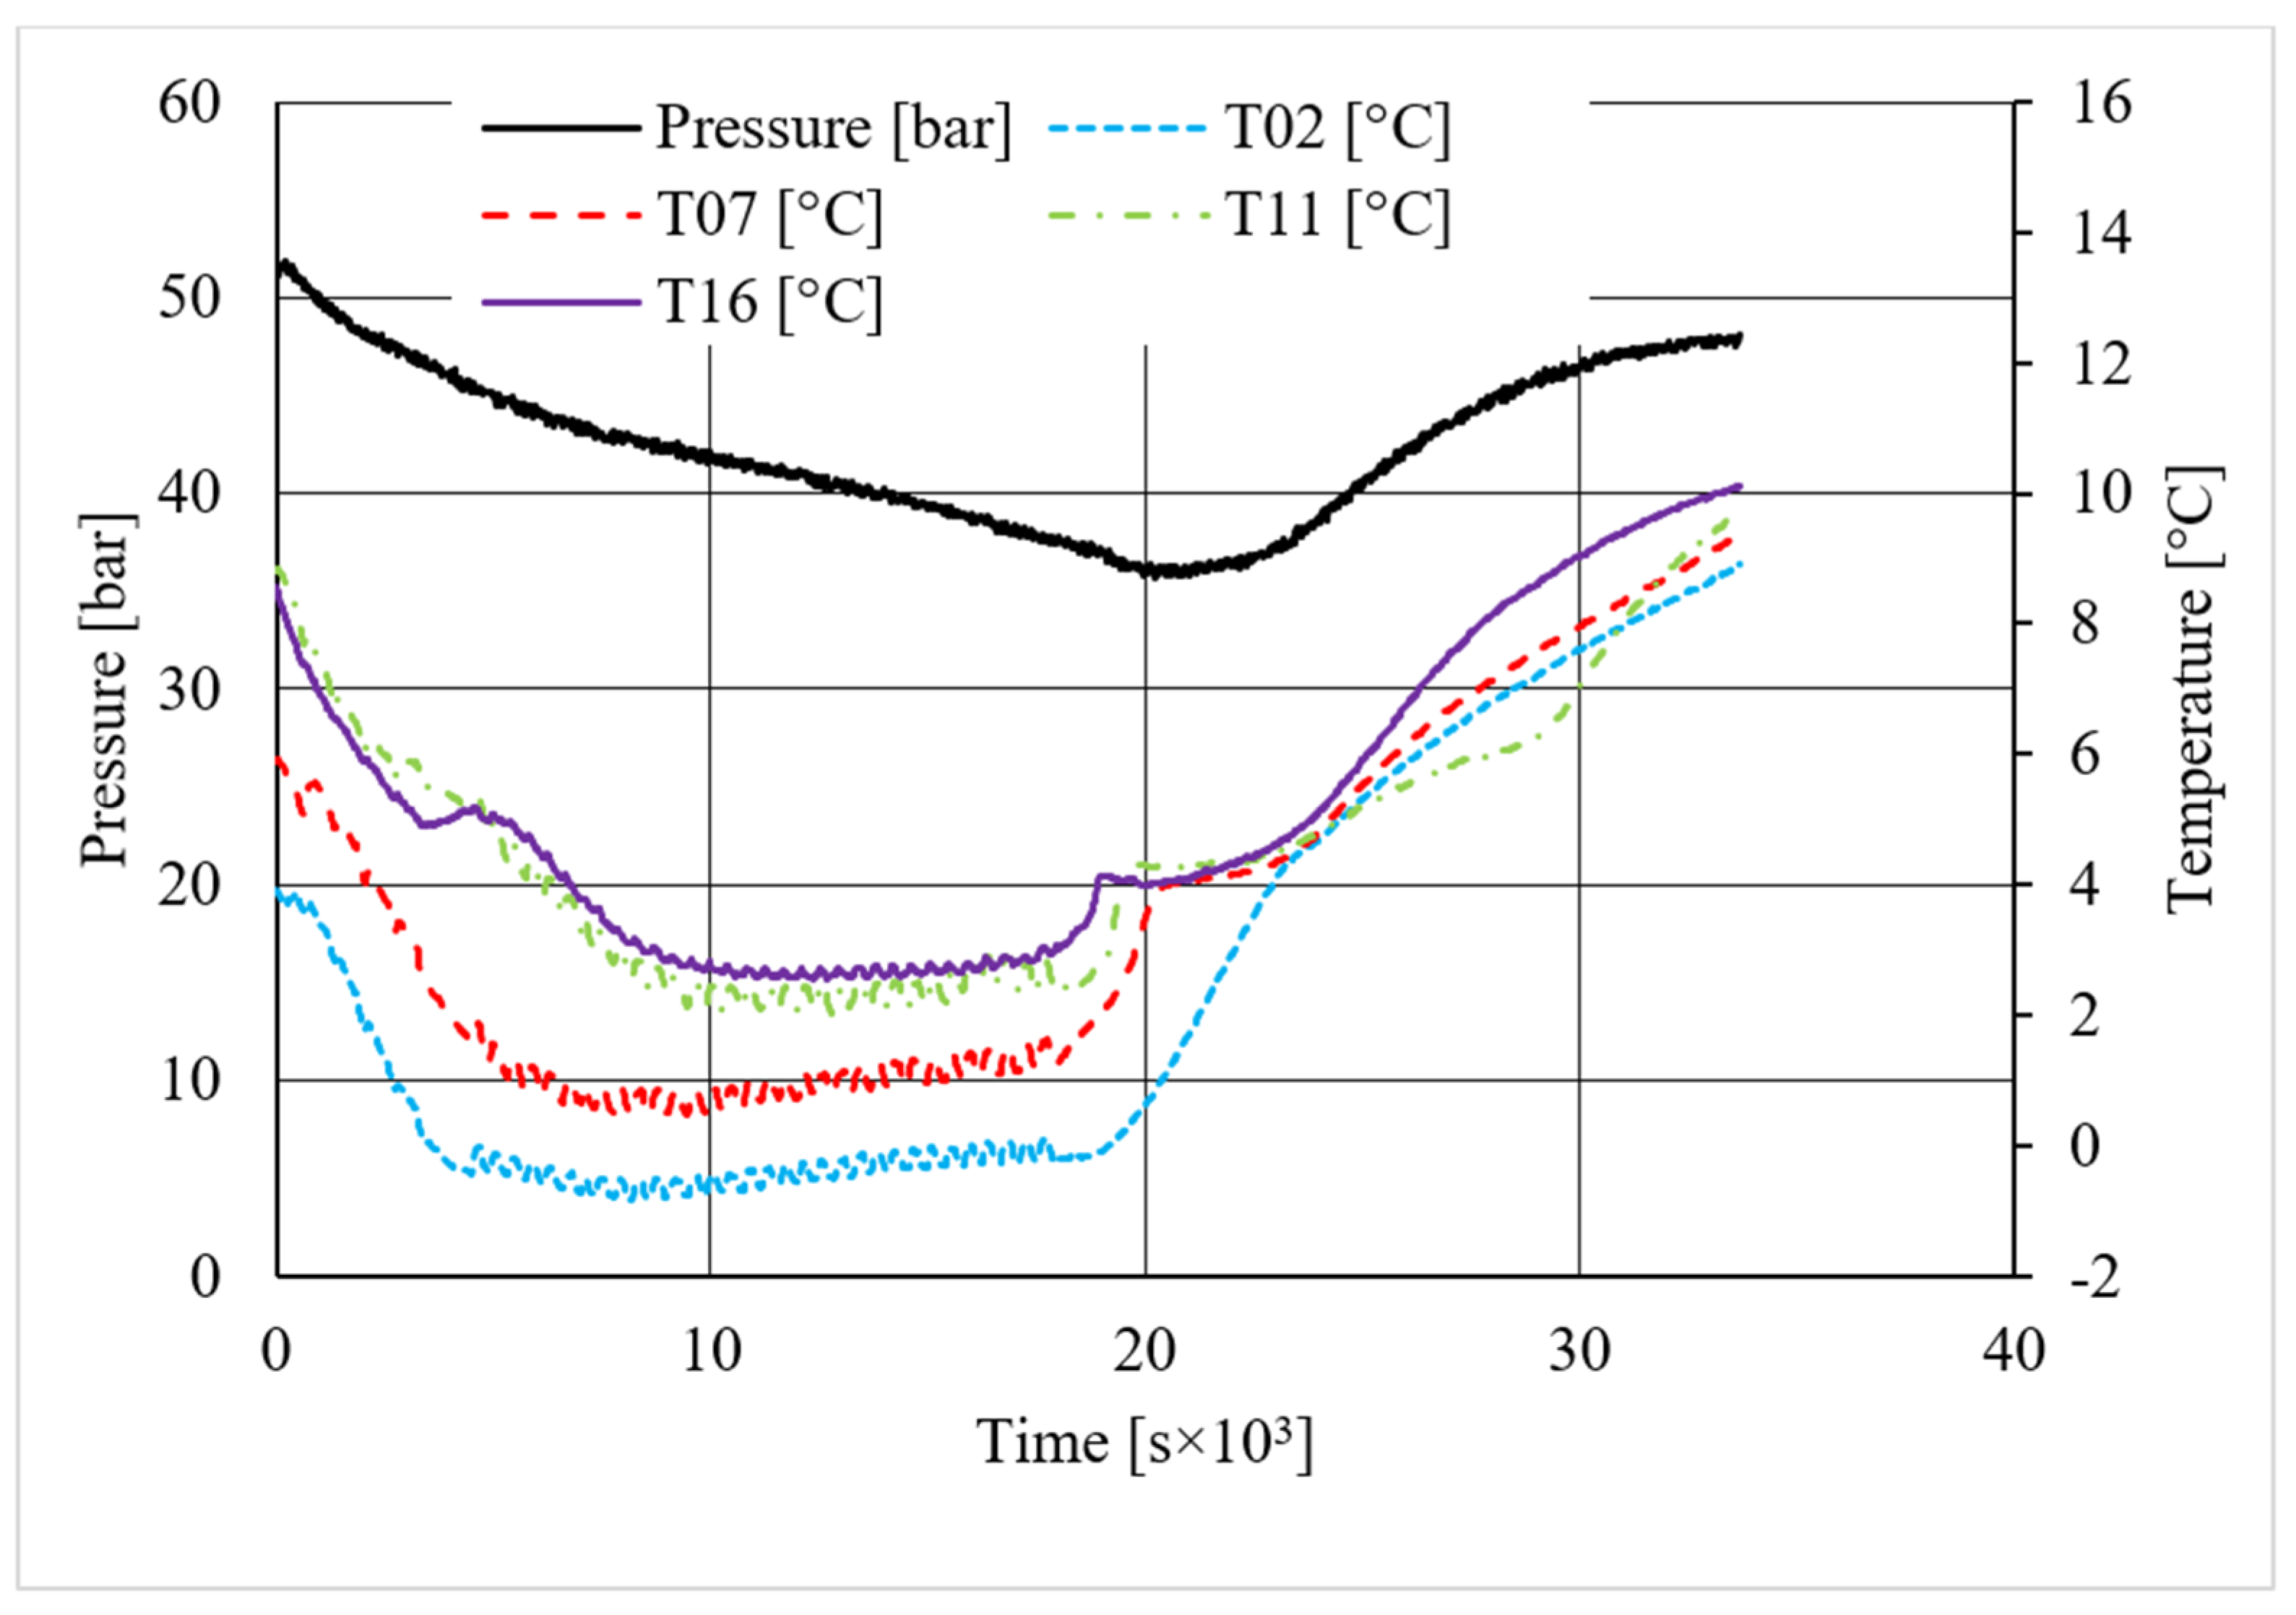
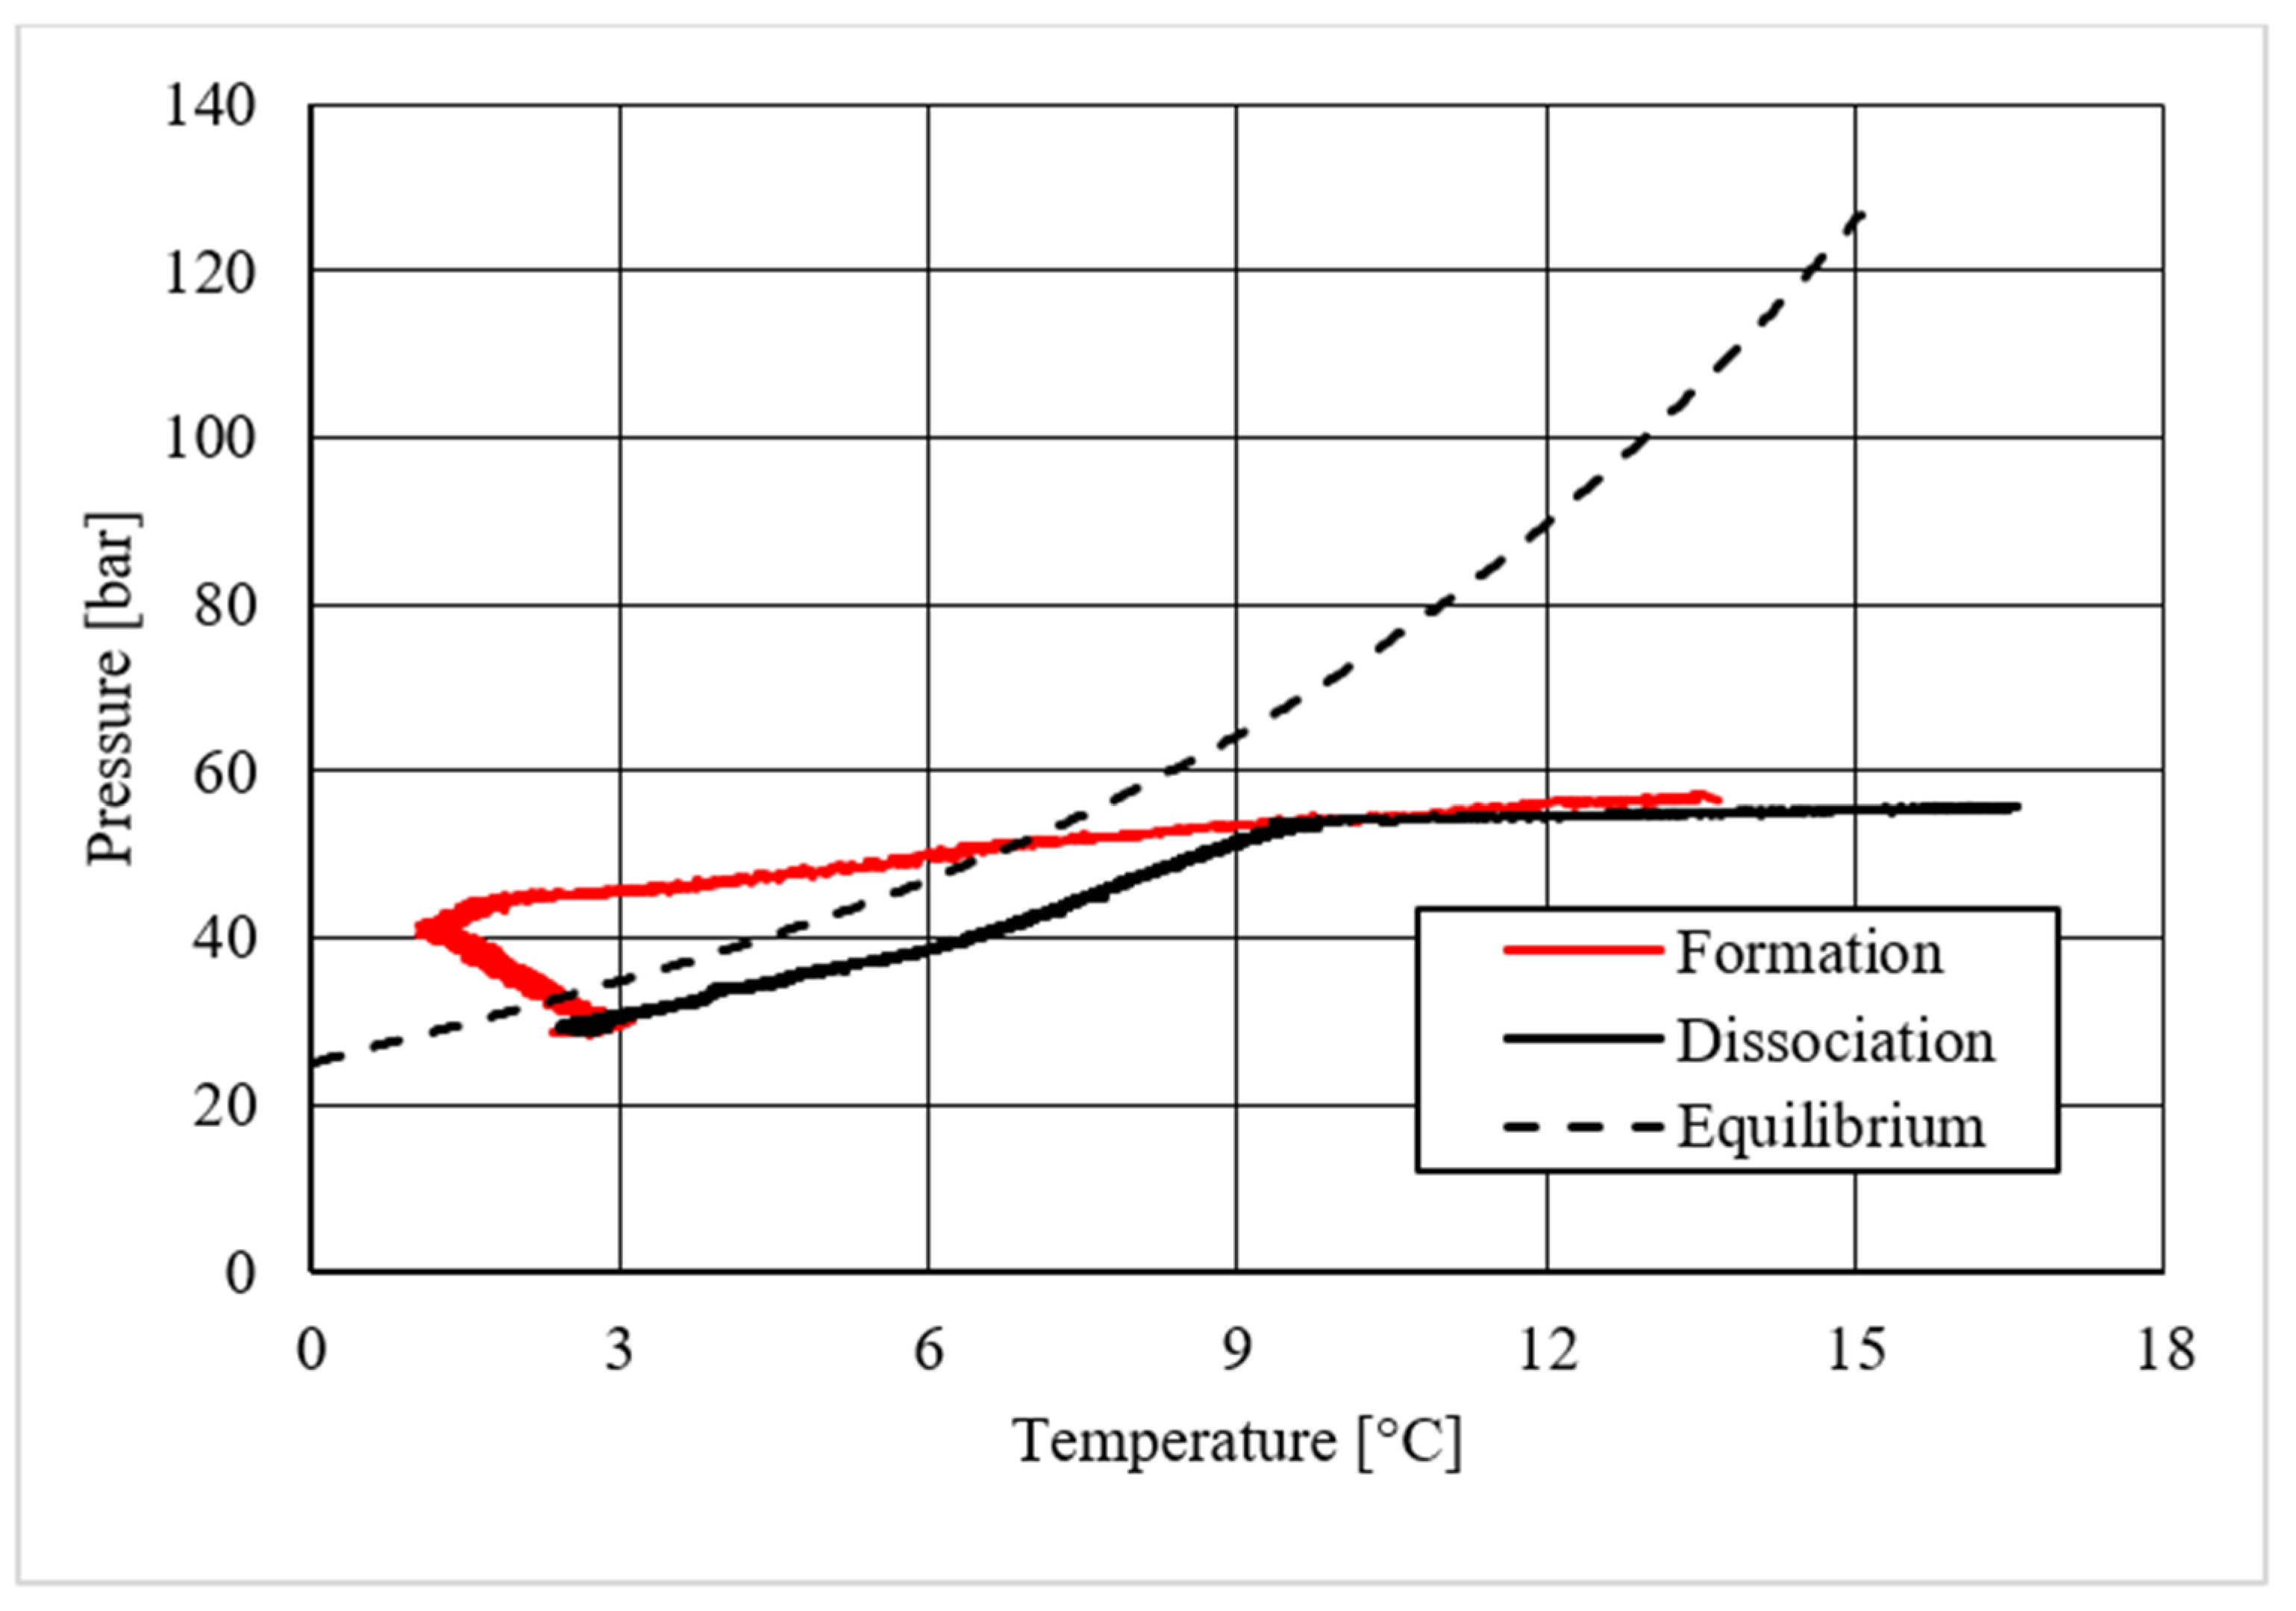
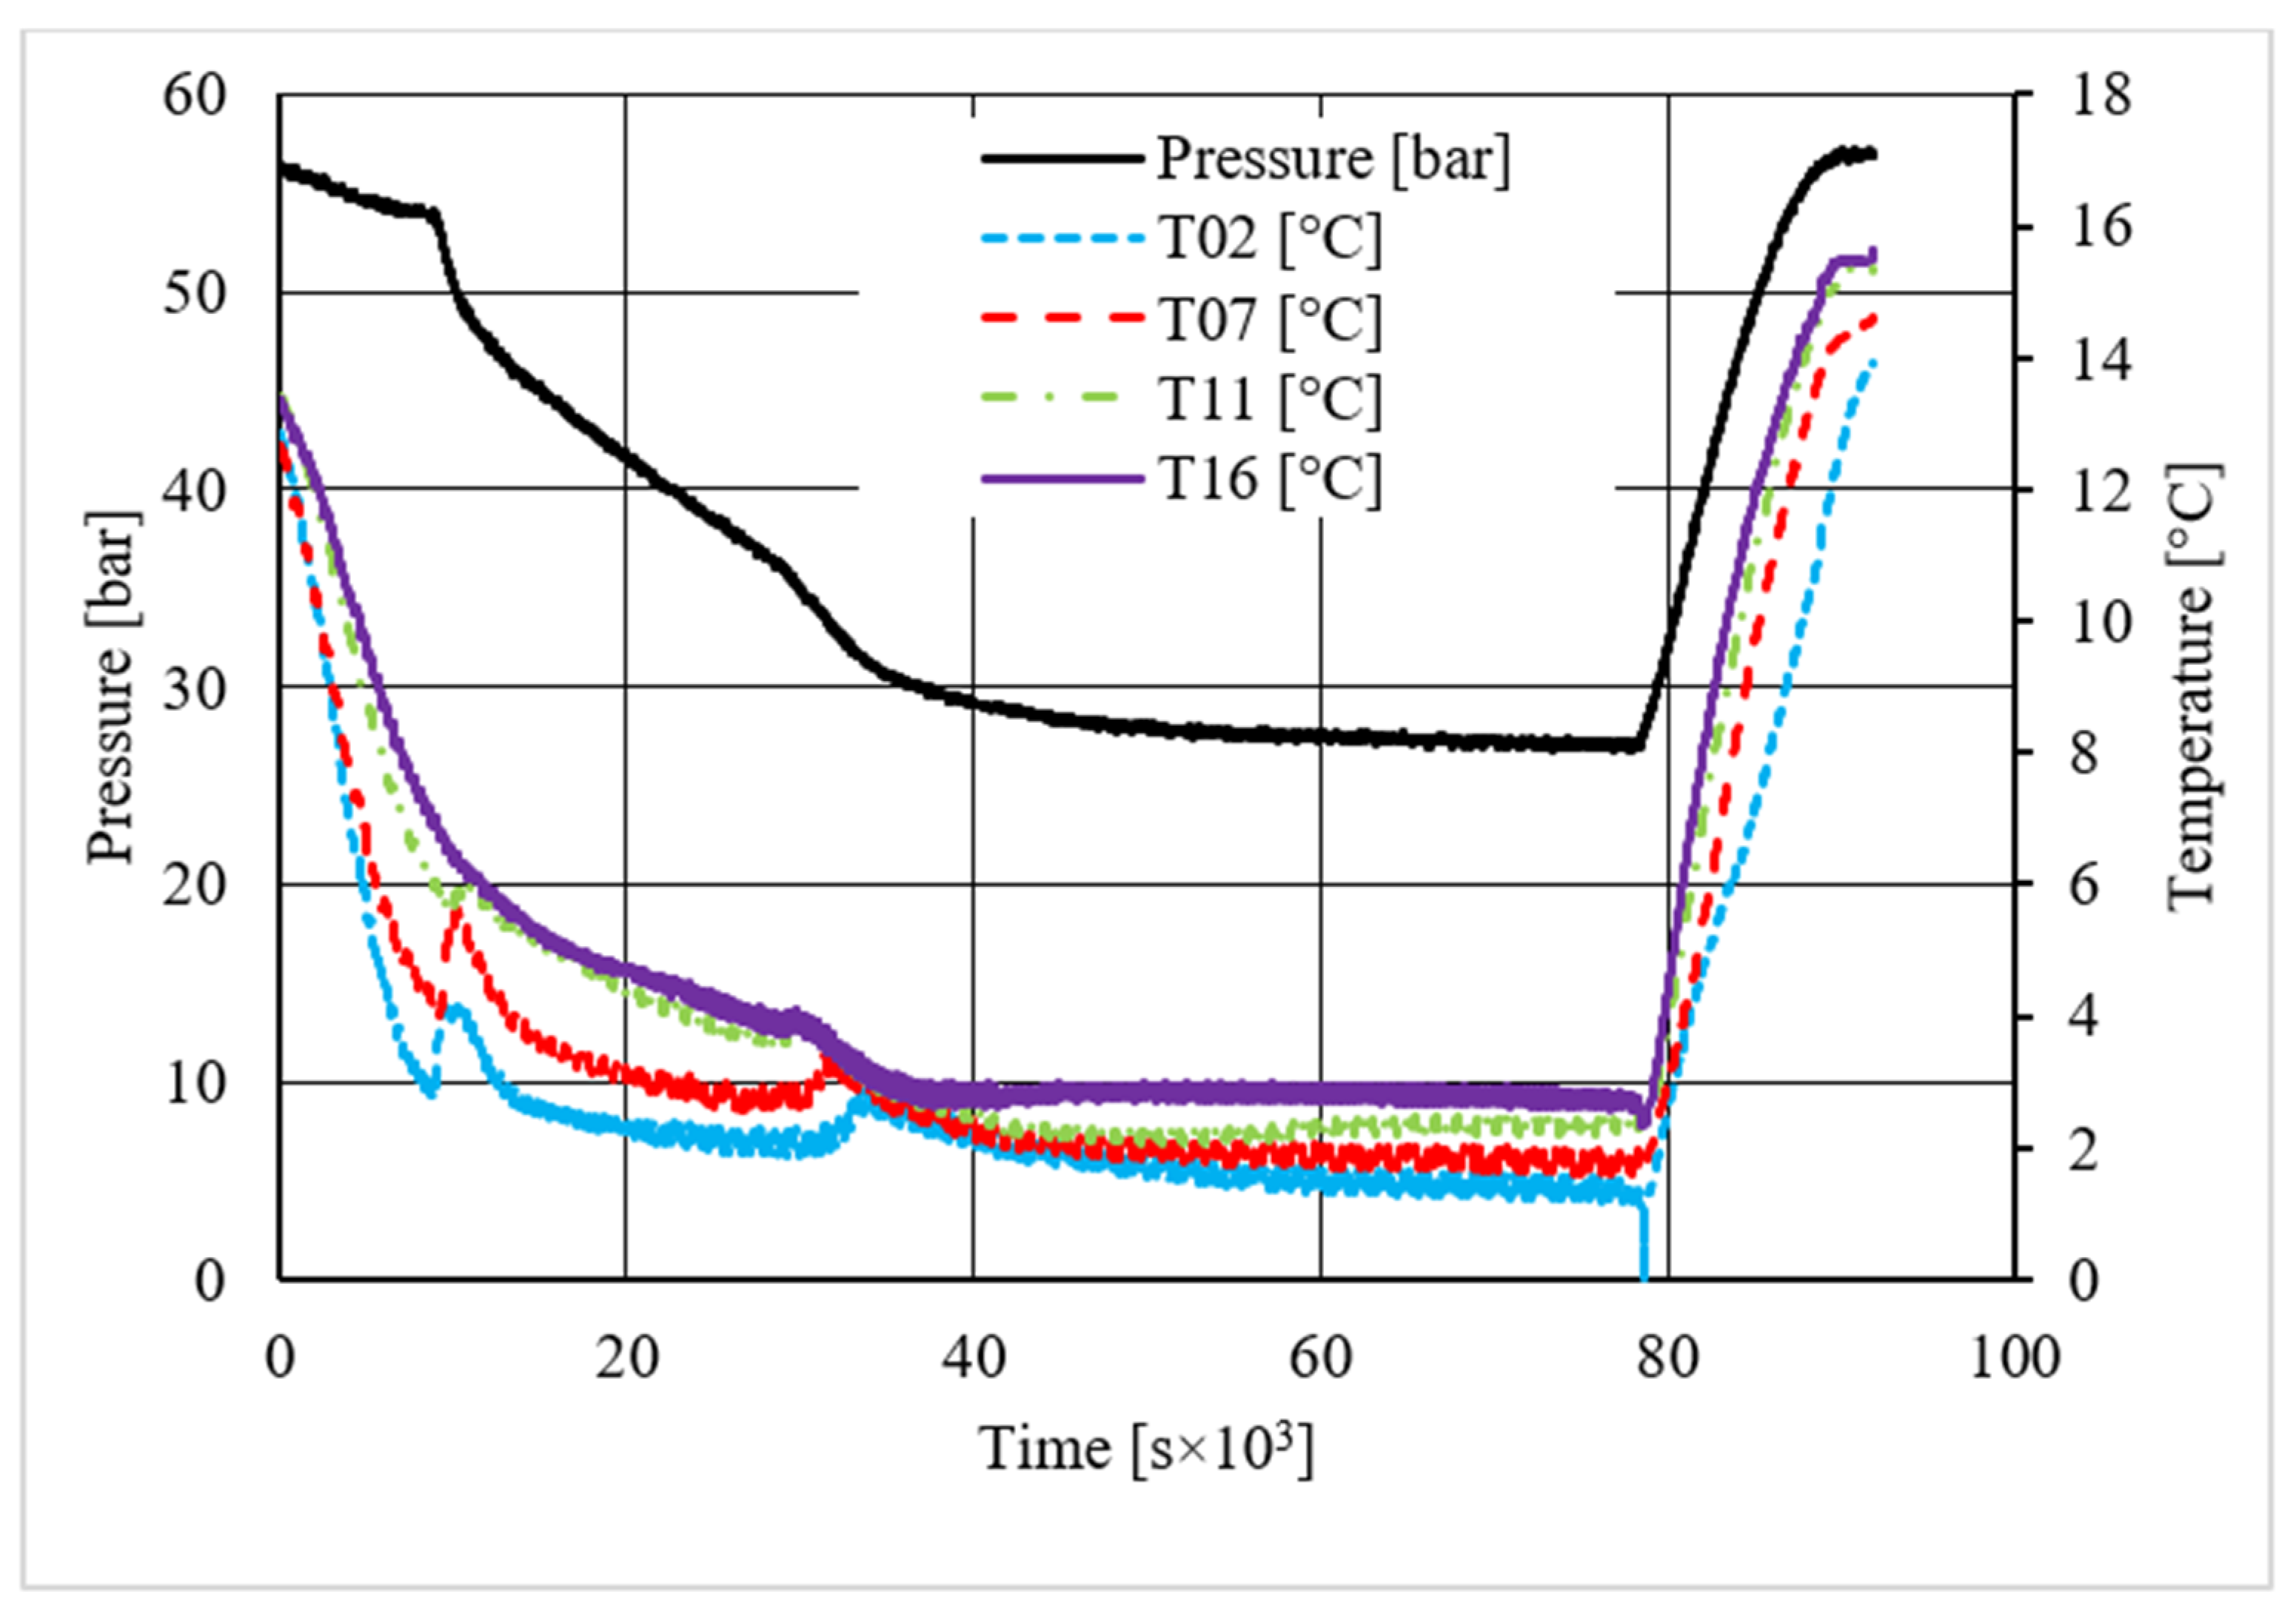
3.1. Methane Hydrate Formation Tests
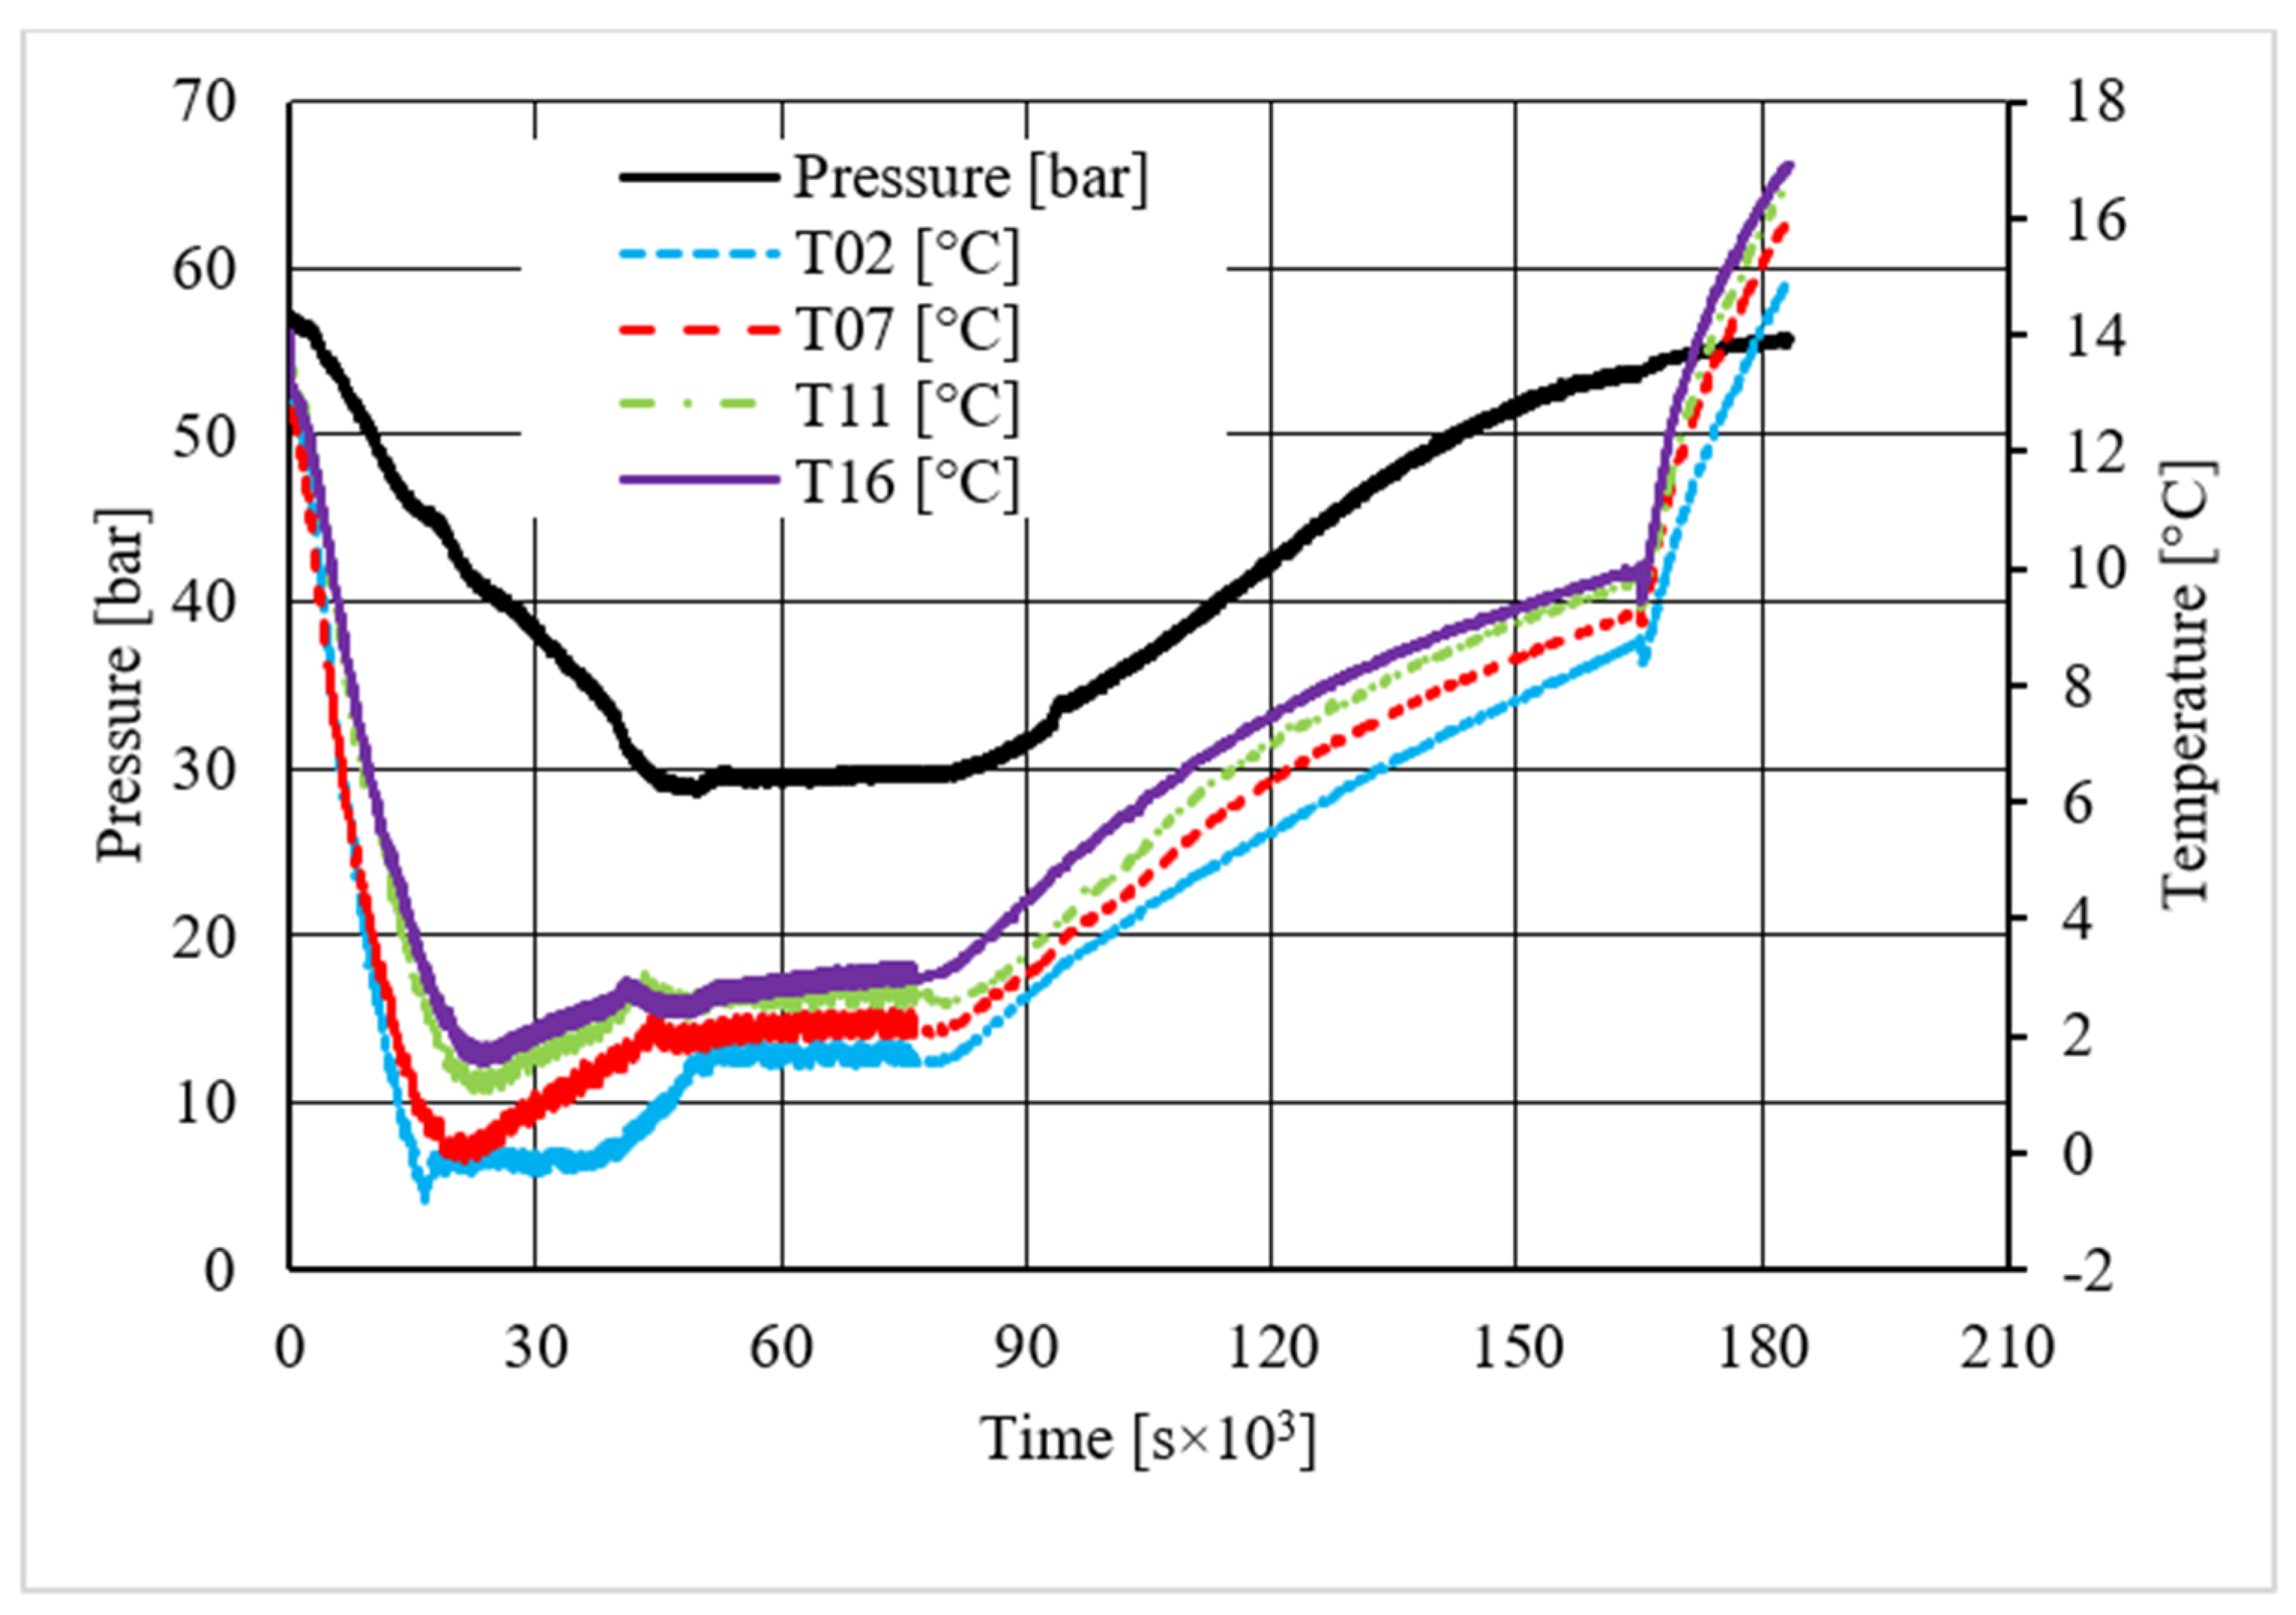
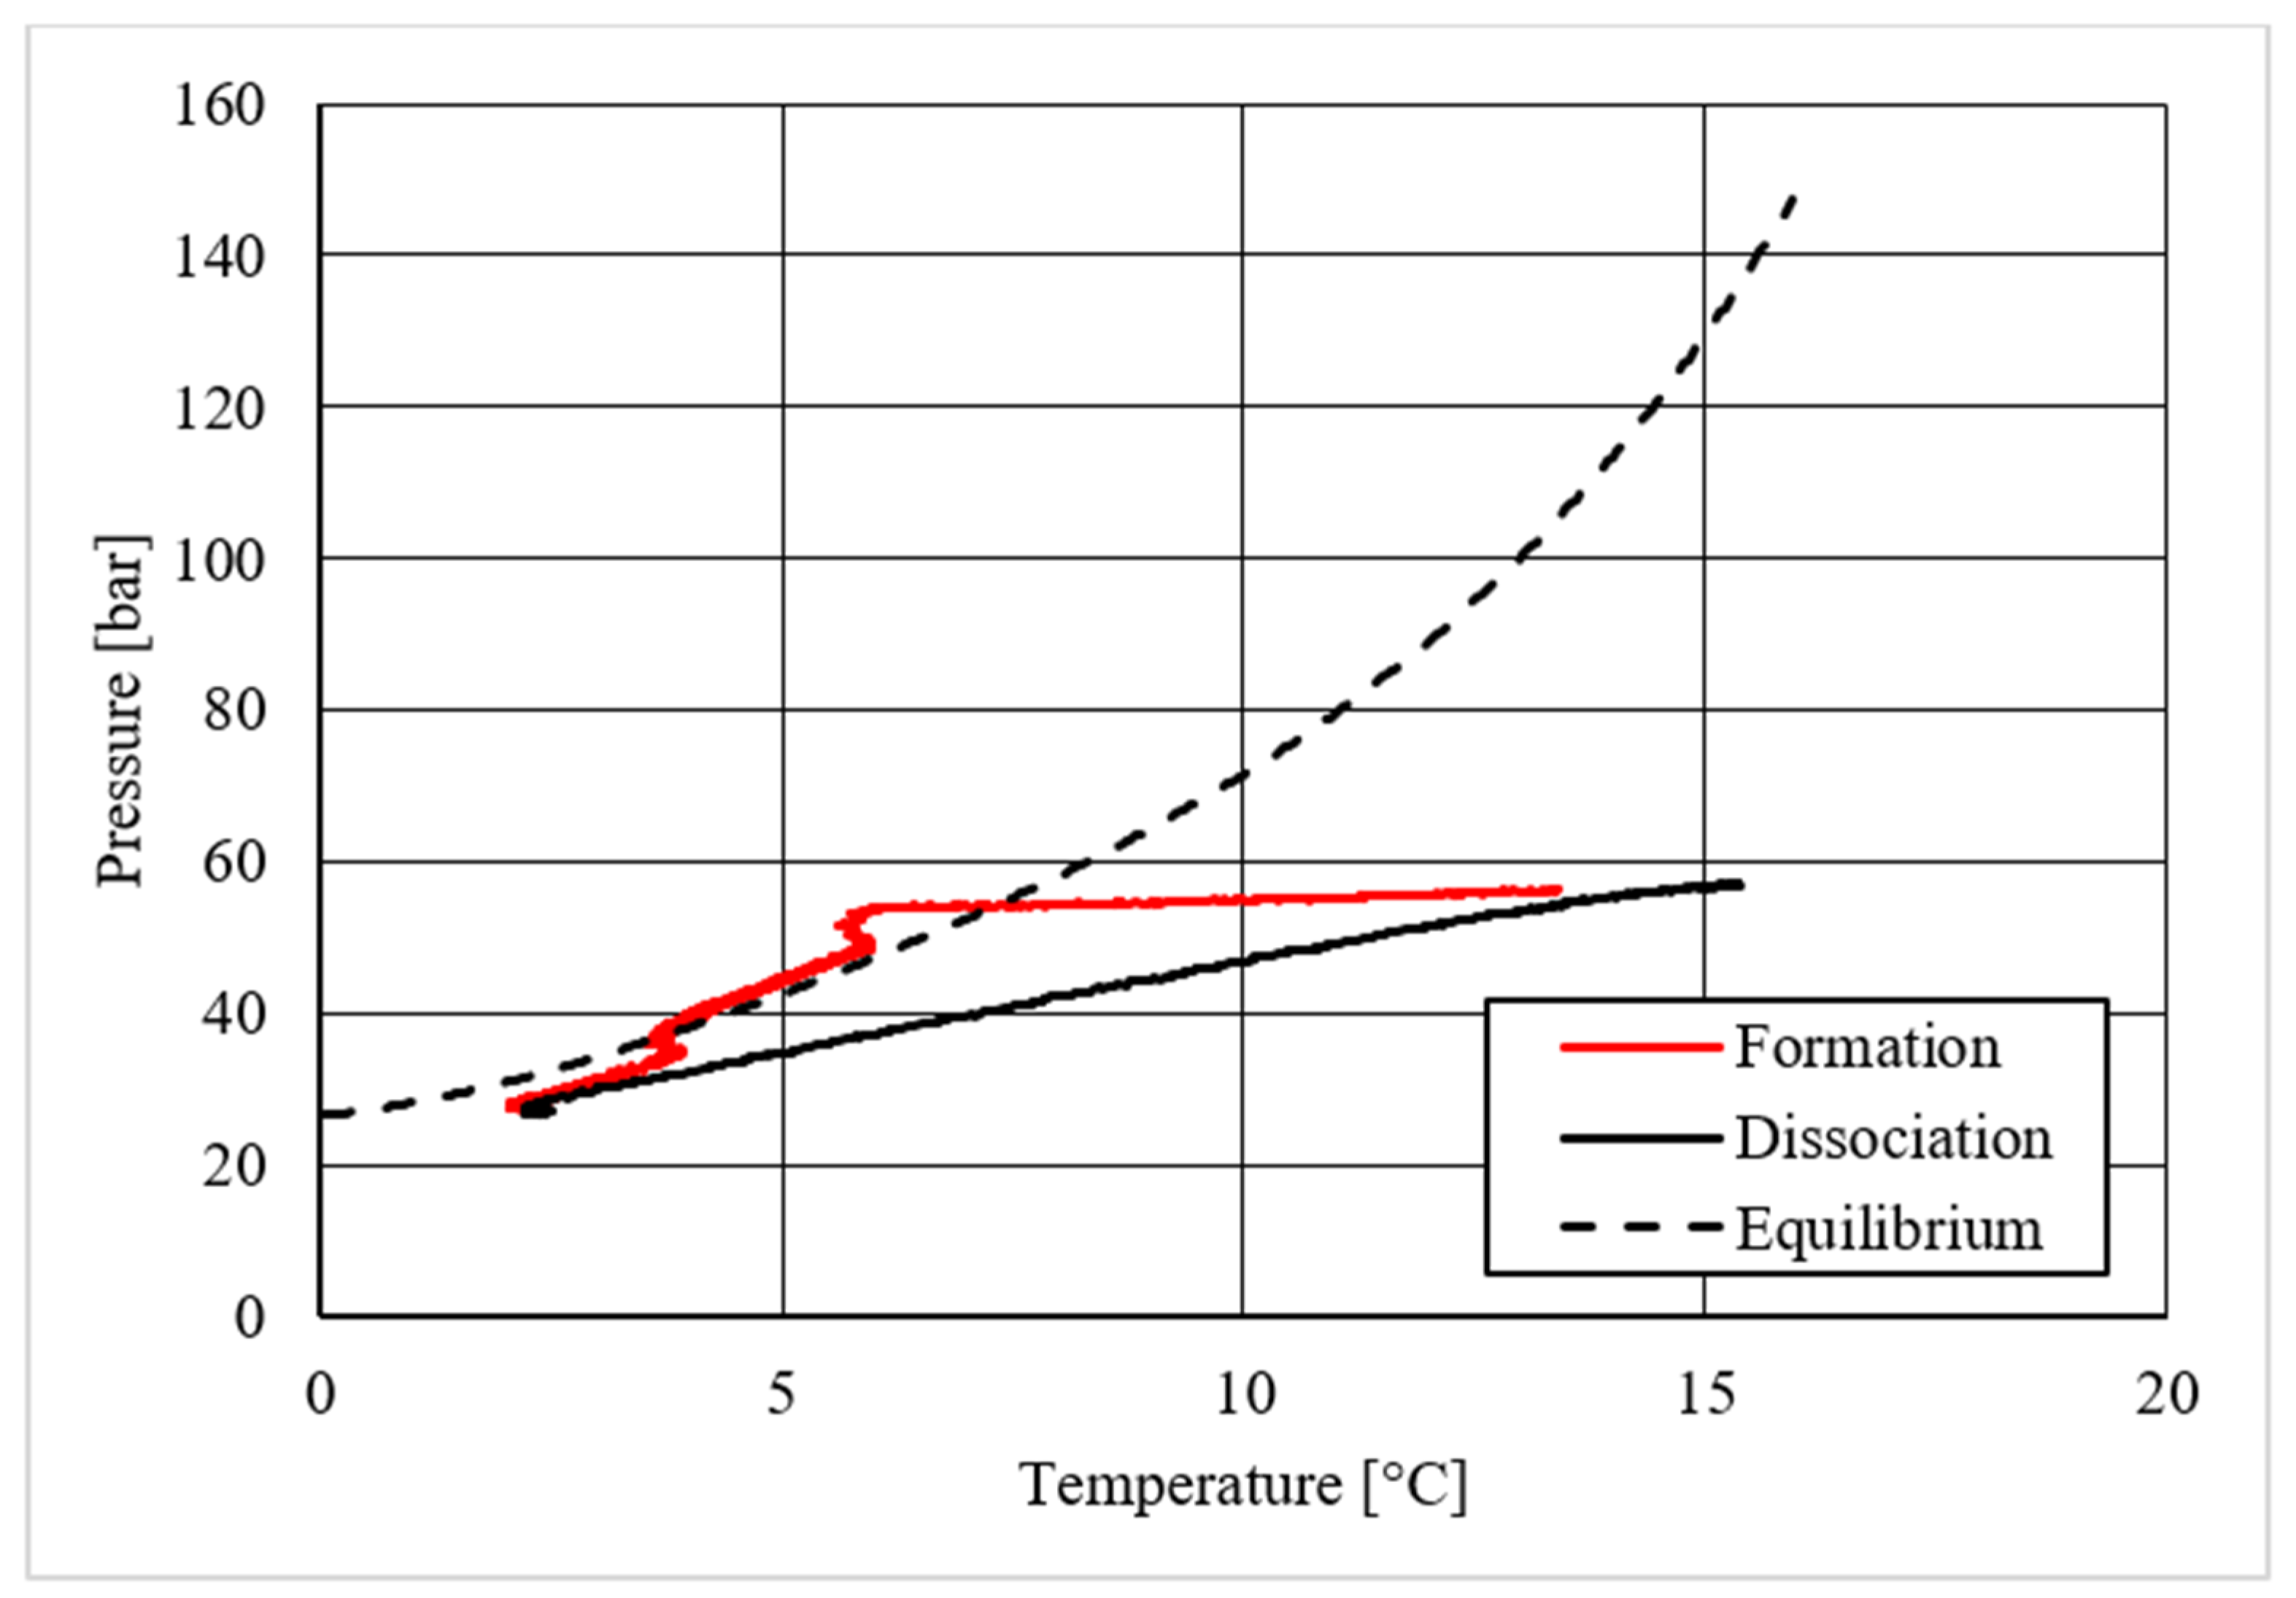
3.2. Carbon Dioxide Hydrate Formation Tests
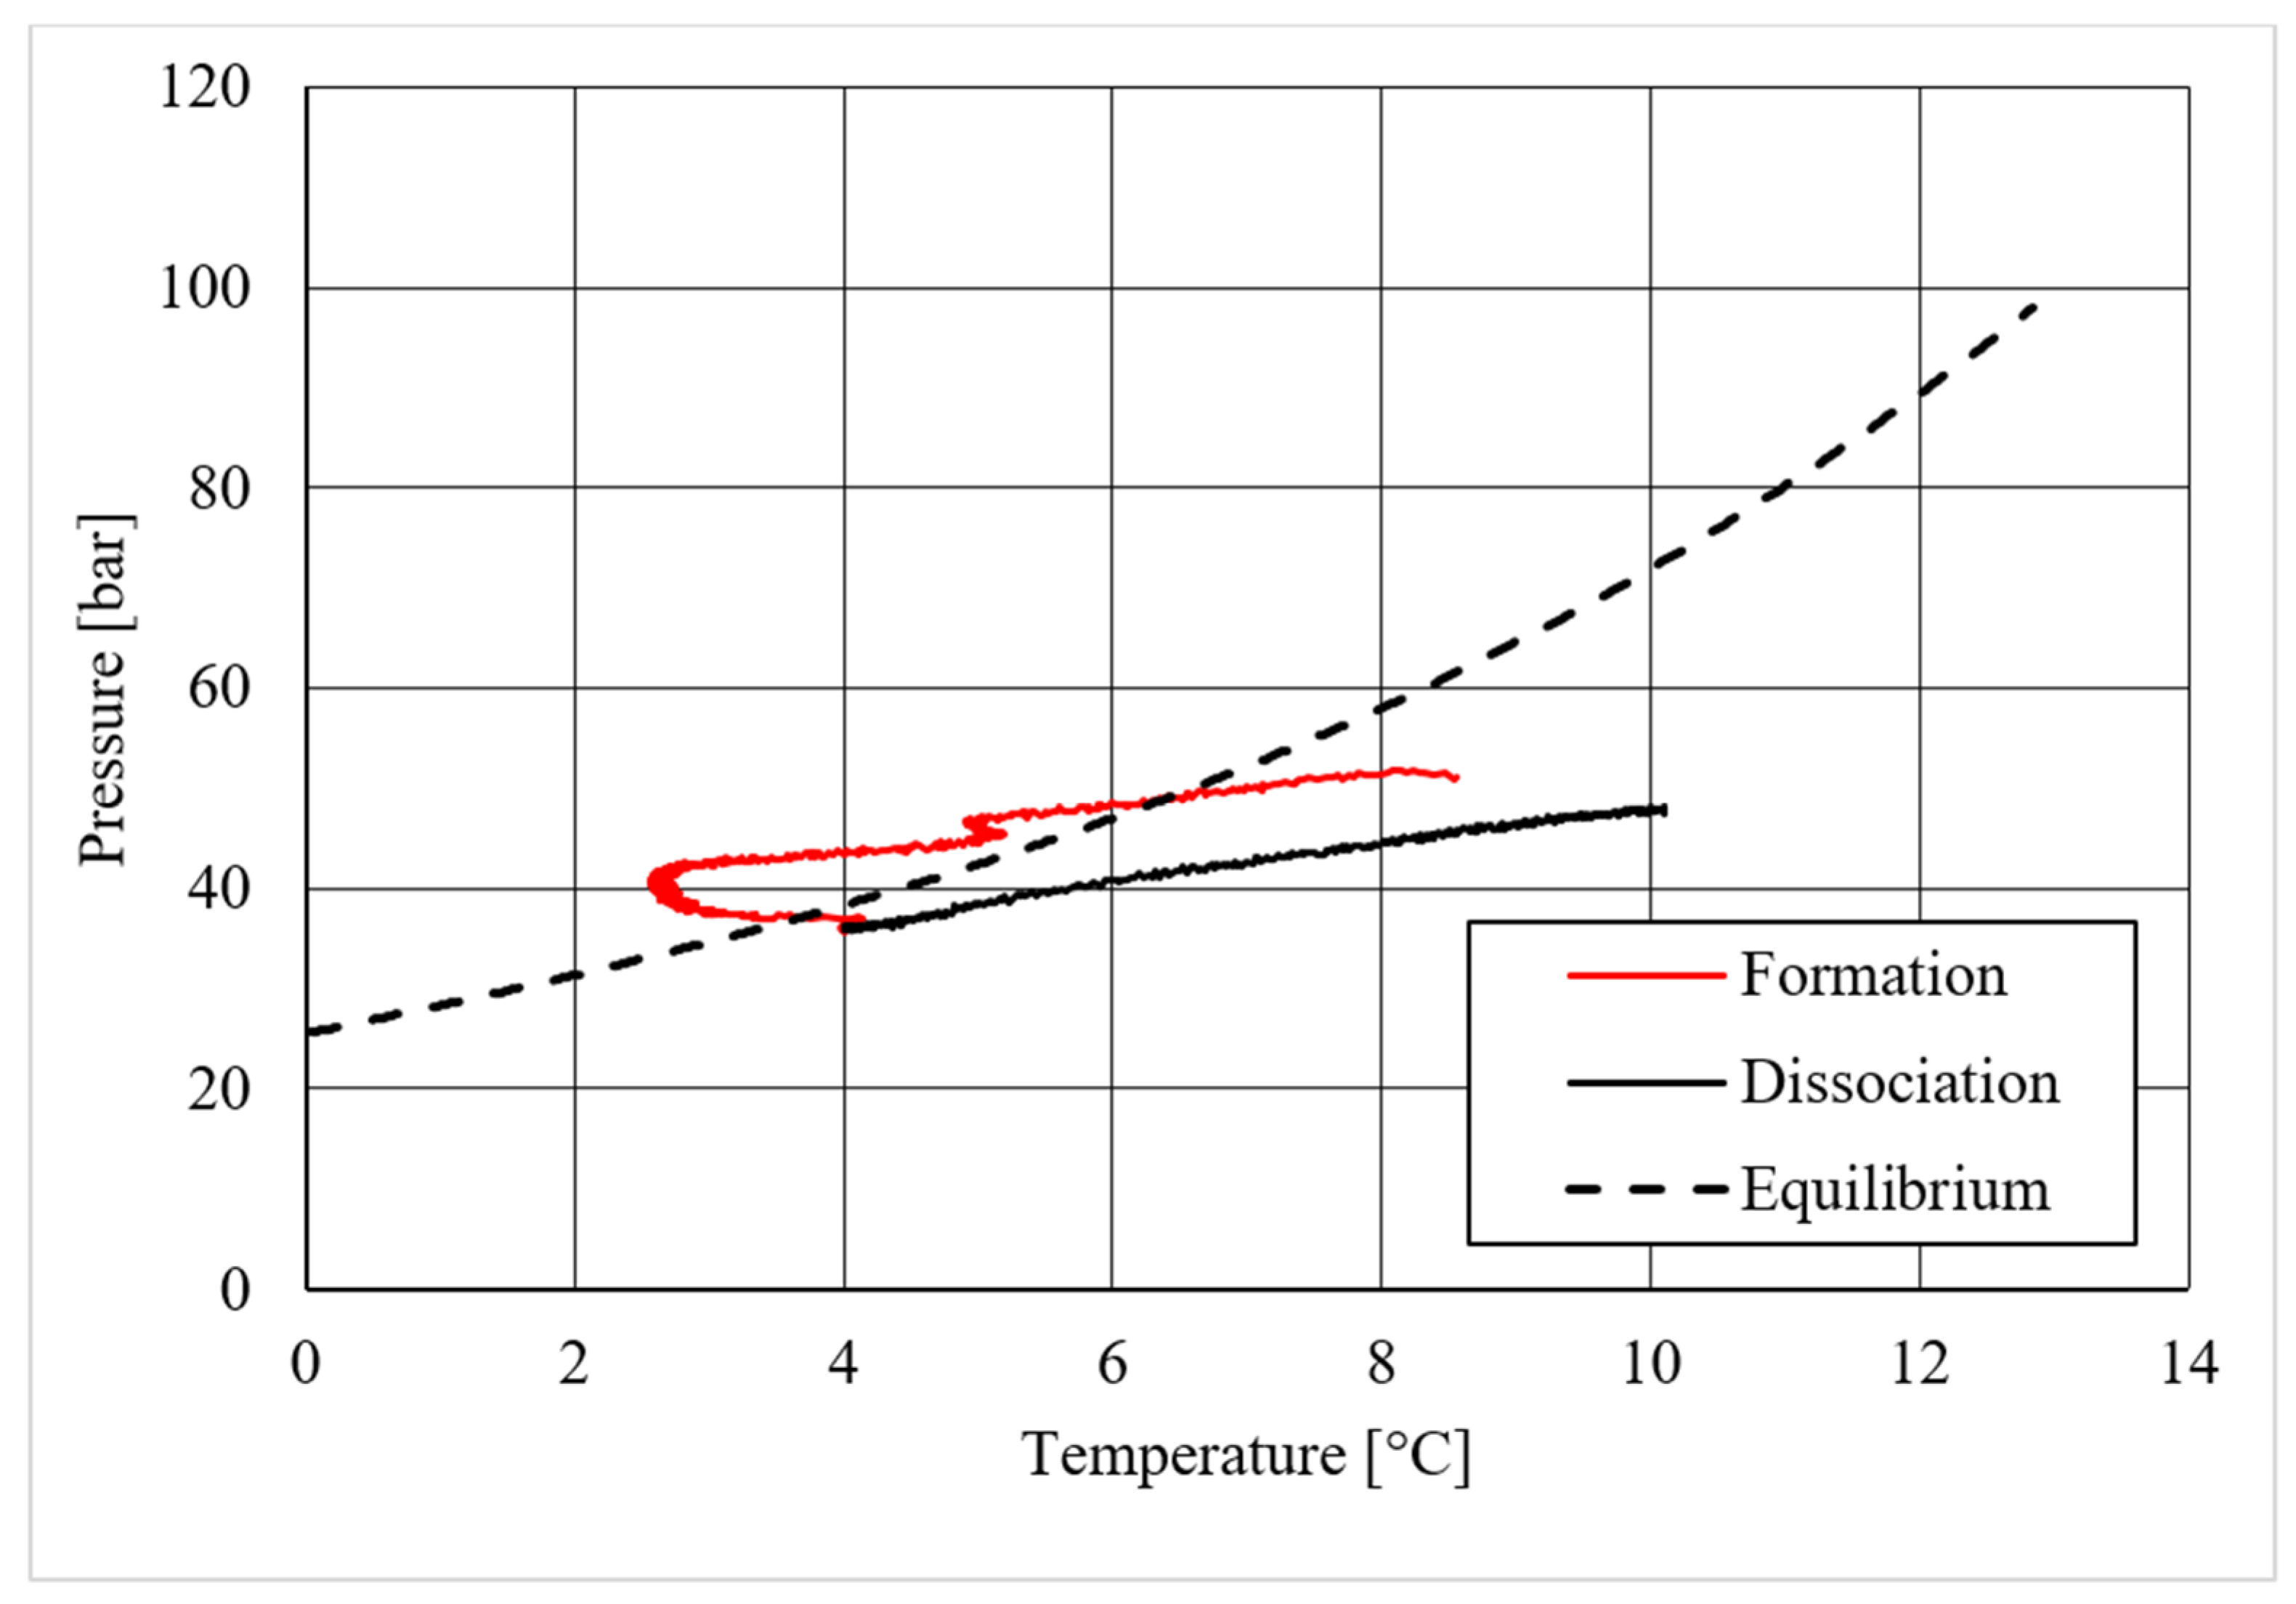
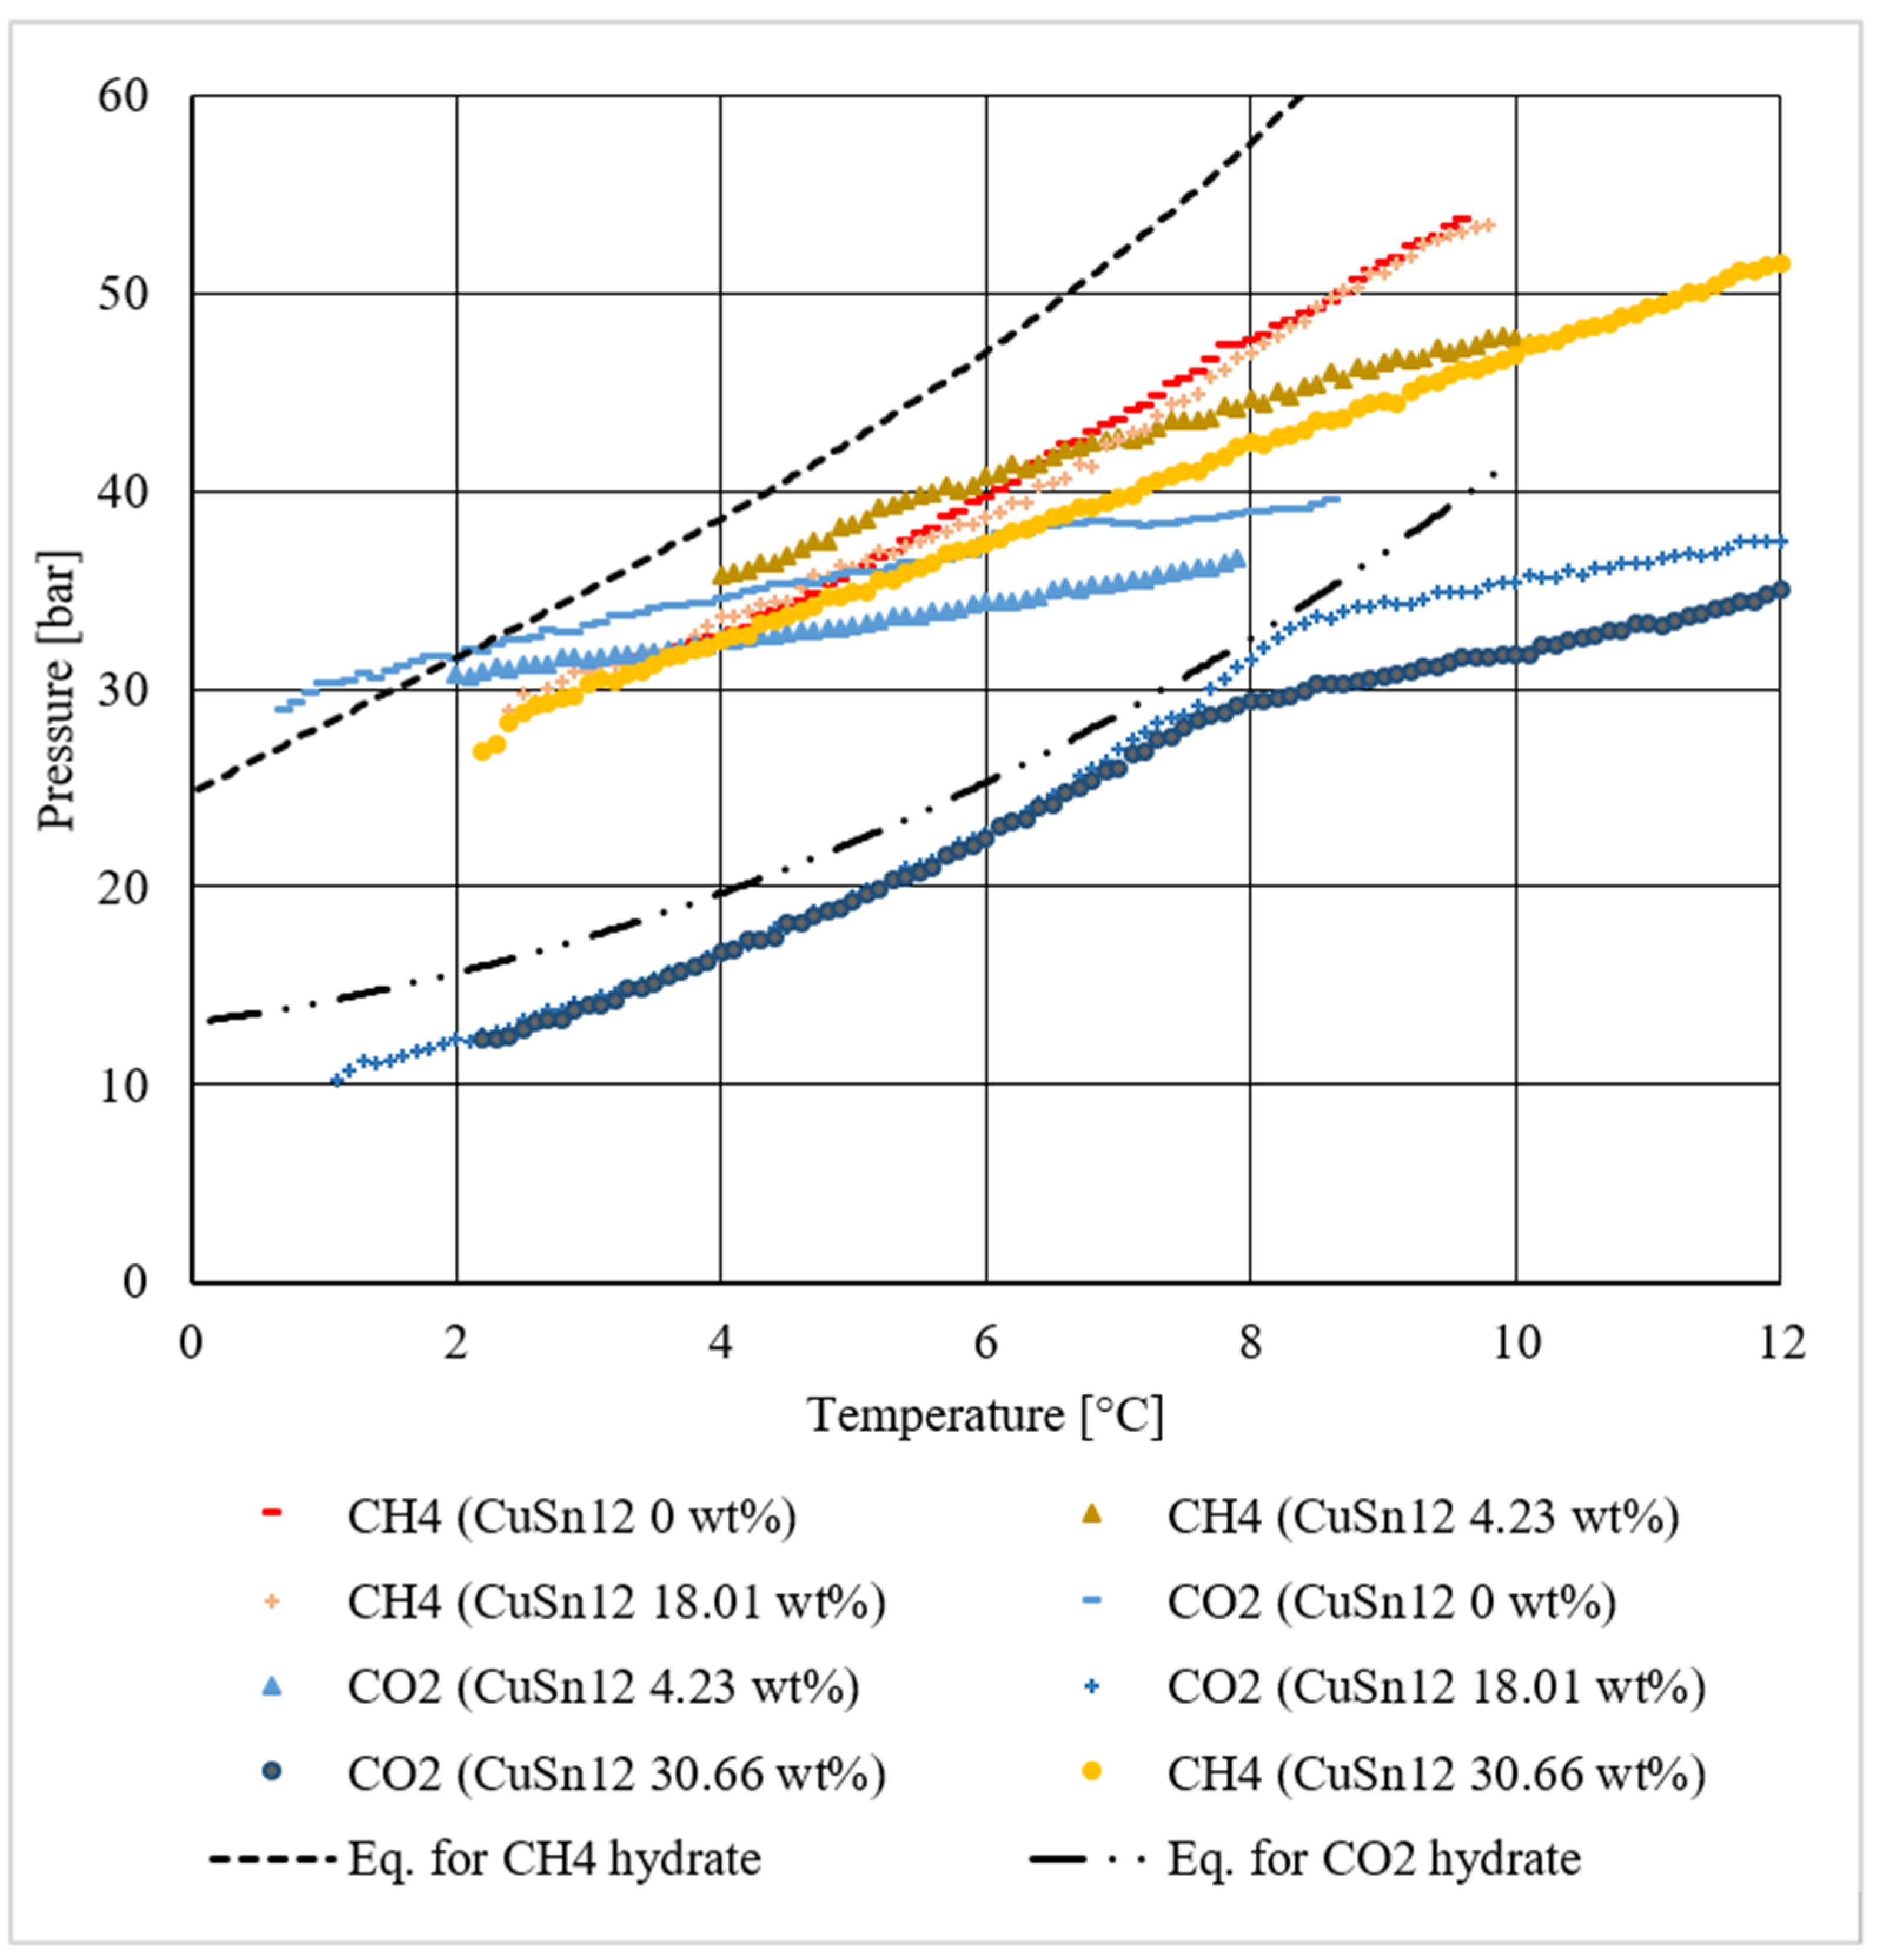
3.3. Direct Comparison between Results Reached with Methane and Carbon Dioxide
4. Conclusions
Author Contributions
Funding
Institutional Review Board Statement
Informed Consent Statement
Data Availability Statement
Conflicts of Interest
References
- Sloan, E.D. Clathrate Hydrates of Natural Gases; Taylor & Francis: Abingdon, UK, 2007. [Google Scholar]
- Gambelli, A.M.; Rossi, F. Natural gas hydrates: Comparison between two different applications of thermal stimulation for performing CO2 replacement. Energy 2019, 172, 423–434. [Google Scholar] [CrossRef]
- Gambelli, A.M.; Castellani, B.; Nicolini, A.; Rossi, F. Experimental study on natural gas hydrate exploitation: Optimization of methane recovery, carbon dioxide storage and deposit structure preservation. J. Pet. Sci. Eng. 2019, 177, 594–601. [Google Scholar] [CrossRef]
- Li, X.S.; Xu, C.G.; Zhang, Y.; Ruan, X.K.; Li, G.; Wang, Y. Investigation into gas production from natural gas hydrate: A review. Appl. Energy 2016, 172, 286–322. [Google Scholar] [CrossRef] [Green Version]
- Durham, W.B.; Kirby, S.H.; Stern, L.A.; Zhang, W. The strength and rheology of methane clathrate hydrate. J. Geophys. Res. Solar Earth 2003, 32, 1978–2012. [Google Scholar] [CrossRef] [Green Version]
- Winters, W.J.; Pecher, I.A.; Waite, W.F.; Mason, D.H. Physical properties and rock physics models of sediment containing natural and laboratory-formed methane gas hydrate. Am. Mineral. 2004, 89, 1221–1227. [Google Scholar] [CrossRef]
- Yun, T.S.; Santamarina, J.C.; Ruppel, C. Mechanical properties of sand, silt, and clay containing tetrahydrofuran hydrate. J. Geophys. Res. Solar Earth 2007, 112, 1978–2012. [Google Scholar] [CrossRef]
- Lu, X.; Wang, L.; Zhang, X.; Wang, S.; Yao, H.; Li, Q. Instability of seabed and pipes induced by NGH dissociation. In Proceedings of the Twentieth International Offshore and Polar Engineering Conference, Beijing, China, 20–25 June 2010. [Google Scholar]
- Sultan, N.; Cochonat, P.; Foucher, J.P.; Mienert, J. Effect of gas hydrates melting on seafloor slope instability. Mar. Geol. 2004, 213, 379–401. [Google Scholar] [CrossRef] [Green Version]
- Xu, W.; Germanovich, L.N. Excess pore pressure resulting from methane hydrate dissociation in marine sediments: A theoretical approach. J. Geophys. Geophys. Res. Solar Earth 2006, 111, 1978–2012. [Google Scholar] [CrossRef]
- Miyazaki, K.; Masui, A.; Yamamoto, Y.; Ogata, Y.; Aoki, K.; Yamaguchi, T. Investigation of deformation mechanism for methane hydrate sediment based upon mechanical properties in unloading and reloading process under triaxial compression. In Proceedings of the Eighth ISOPE Ocean Mining Symposium, Chennai, India, 20–24 September 2009. [Google Scholar]
- Gambelli, A.M. An experimental description of the double positive effect of CO2 injection in methane hydrate deposits in terms of climate change mitigation. Chem. Eng. Sci. 2021, 233, 116430. [Google Scholar] [CrossRef]
- Nair, V.C.; Prasad, S.K.; Kumar, R.; Sangwai, J.S. Energy recovery from simulated clayey gas hydrate reservoir using depressurization by constant rate gas release, thermal stimulation and their combinations. Appl. Energy 2018, 225, 755–768. [Google Scholar] [CrossRef]
- Gambelli, A.M.; Rossi, F. Experimental investigation on the possibility of defining the feasibility of CO2/CH4 exchange into a natural gas hydrate marine reservoir via fast analysis of sediment properties. Chem. Eng. Res. Des. 2021, 171, 327–339. [Google Scholar] [CrossRef]
- Gambelli, A.M.; Filipponi, M.; Rossi, F. How methane release may affect carbon dioxide storage during replacement processes in natural gas hydrate reservoirs. J. Pet. Sci. Eng. 2021, 205, 108895. [Google Scholar] [CrossRef]
- Feng, J.C.; Wang, Y.; Li, X.S. Hydrate dissociation induced by depressurization in conjunction with warm brine stimulation in cubic hydrate simulator with silica sand. Appl. Energy 2016, 174, 81–91. [Google Scholar] [CrossRef]
- Tupsakhare, S.S.; Castaldi, M.J. Efficiency enhancements in methane recovery from natural gas hydrates using injection of CO2/N2 gas mixture simulating in-situ combustion. Appl. Energy 2019, 236, 825–836. [Google Scholar] [CrossRef]
- Collett, T.S.; Ginsburg, G.D. Gas hydrates in the Messoyakha gas field of the west Siberian basin—A re-examination of the geologic evidence. Int. J. Offshore Polar Eng. 1997, 8, 96–103. [Google Scholar]
- Collett, T.S.; Kuuskraa, V.A. Hydrates contain vast store of world gas resources. Oil Gas J. 1998, 96, 90–95. [Google Scholar]
- Wang, Y.; Feng, J.C.; Li, X.S.; Zhan, L.; Li, X.Y. Pilot-scale experimental evaluation of gas recovery from methane hydrate using cycling-depressurization scheme. Energy 2018, 160, 835–844. [Google Scholar] [CrossRef]
- Rossi, F.; Gambelli, A.M. Thermodynamic phase equilibrium of single-guest hydrate and formation data of hydrate in presence of chemical additives: A review. Fluid Phase Equilib. 2021, 536, 112958. [Google Scholar] [CrossRef]
- Badawy, W.A.; Ismail, K.M.; Fathi, A.M. Effect of Ni content on the corrosion behavior of Cu-Ni alloys in neutral chloride solutions. Electrochim. Acta 2005, 50, 3603–3608. [Google Scholar] [CrossRef]
- Gambelli, A.M.; Castellani, B.; Nicolini, A.; Rossi, F. Water Salinity as Potential Aid for Improving the Carbon Dioxide Replacement Process’ Effectiveness in Natural Gas Hydrate Reservoirs. Processes 2020, 8, 1298. [Google Scholar] [CrossRef]
- Gambelli, A.M.; Castellani, B.; Nicolini, A.; Rossi, F. Gas hydrate formation as a strategy for CH4/CO2 separation: Experimental study on gaseous mixtures produced via Sabatier reaction. J. Nat. Gas Sci. Eng. 2019, 71, 102985. [Google Scholar] [CrossRef]
- Di Schino, A.; Alleva, L.; Guagnelli, M. Microstructure evolution during quenching and tempering of martensite in a medium C steel. Mat. Sci. Forum 2012, 715–716, 860–865. [Google Scholar] [CrossRef]
- Di Schino, A. Manufacturing and application of stainless steels. Metals 2020, 10, 327. [Google Scholar] [CrossRef] [Green Version]
- Mancini, S.; Langellotto, L.; Di Nunzio, P.E.; Zitelli, C.; Di Schino, A. Defect reduction and quality optimization by modelling plastic deformation and metallurgical evolution in ferritic stainless steels. Metals 2020, 10, 186. [Google Scholar] [CrossRef] [Green Version]
- Wang, Y.; Feng, J.C.; Li, X.S.; Zhang, Y. Experimental investigation of optimization of well spacing for gas recovery from methane hydrate reservoir in sandy sediment by heat stimulation. Appl. Energy 2017, 207, 562–572. [Google Scholar] [CrossRef]
- Yuan, Q.; Sun, C.Y.; Yang, X.; Ma, P.C.; Ma, Z.W.; Liu, B.; Ma, Q.L.; Yang, L.Y.; Chen, G.J. Recovery of methane from hydrate reservoir with gaseous carbon dioxide using a three-dimensional middle-size reactor. Energy 2012, 40, 47–58. [Google Scholar] [CrossRef]
- Yin, Z.; Huang, L.; Linga, P. Effect of wellbore design on the production behaviour of methane hydrate-bearing sediments induced by depressurization. Appl. Energy 2019, 254, 113635. [Google Scholar] [CrossRef]
- Said, S.; Grovindaraj, V.; Herri, J.M.; Ouabbas, Y.; Khodja, M.; Belloum, M.; Sangway, J.S.; Nagarajan, R. A study on the influence on nanofluids on gas hydrate formation kinetics and their potential: Application to the CO2 capture process. J. Nat. Gas Sci. Eng. 2016, 32, 95–108. [Google Scholar] [CrossRef]
- Pahlavanzadeh, H.; Khanlarkhani, M.; Rezei, S.; Mohammadi, A.H. Experimental and modelling studies on the effects of nanofluids (SiO2, Al2O3, and CuO) and surfactants (SDS and CTAB) on CH4 and CO2 clathrate hydrates formation. Fuel 2019, 253, 1392–1405. [Google Scholar] [CrossRef]
- Gambelli, A.M. Analyses on CH4 and CO2 hydrate formation to define the optimal pressure for CO2 injection to maximize the replacement efficiency into natural gas hydrate in presence of silica-based natural porous medium, via depressurization techniques. Chem. Eng. Process. Process Intensif. 2021, 167, 108512. [Google Scholar] [CrossRef]
- Bavoh, C.B.; Partoon, B.; Lal, B.; Keong, L.K. Methane hydrate-liquid-vapor-equilibrium phase condition measurements in the presence of natural amino acids. J. Nat. Gas Sci. Eng. 2017, 37, 425–434. [Google Scholar] [CrossRef]
- Bottger, A.; Kamps, A.P.S.; Maurer, G. An experimental investigation on the phase equilibrium of the binary system (methane + water) at low temperatures: Solubility of methane in water and three-phase (vapour + liquid + hydrate) equilibrium. Fluid Phase Equilib. 2016, 407, 209–216. [Google Scholar] [CrossRef]
- Castellani, B.; Gambelli, A.M.; Nicolini, A.; Rossi, F. Energy and Environmental Analysis of Membrane-Based CH4-CO2 Replacement Processes in Natural Gas Hydrates. Energies 2019, 12, 850. [Google Scholar] [CrossRef] [Green Version]
- Nema, Y.; Ohmura, R.; Senaha, I.; Yasuda, K. Quadruple point determination in carbon dioxide hydrate forming system. Fluid Phase Equilib. 2017, 441, 49–53. [Google Scholar] [CrossRef]
- Nagashima, H.D.; Ohmura, R. Phase equilibrium condition measurements in methane clathrate hydrate forming system from 197.3 K to 238.7 K. J. Chem. Thermodyn. 2016, 102, 252–256. [Google Scholar] [CrossRef]
- Nagashima, H.D.; Fukushima, N.; Ohmura, R. Phase equilibrium condition measurements in carbon dioxide clathrate hydrate forming system from 199.1 K to 247.1 K. Fluid Phase Equilib. 2016, 413, 53–56. [Google Scholar] [CrossRef]
- Kassim, Z.; Khan, M.S.; Lal, B. Thermodynamic modelling on methane hydrate equilibrium condition in the presence of electrolyte inhibitor. Mater. Today Prec. 2019, 19, 1395–1402. [Google Scholar] [CrossRef]
- Khan, M.S.; Partoon, B.; Bavoh, C.B.; Lal, B.; Mellon, B.M. Influence of tetramethylammonium hydroxide on methane and carbon dioxide gas hydrate phase equilibrium conditions. Fluid Phase Equilib. 2017, 440, 1–8. [Google Scholar] [CrossRef]
- Khan, M.S.; Bavoh, C.; Partoon, B.; Lal, B.; Bustam, M.A.; Shariff, A.M. Thermodynamic effect of ammonium based ionic liquids on CO2 hydrates phase boundary. J. Mol. Liq. 2017, 238, 533–539. [Google Scholar] [CrossRef]
- Ohmura, R.; Uchida, T.; Takeya, S.; Nagao, J.; Minagawa, H.; Ebinuma, T.; Narita, H. Clathrate hydrate formation in (methane + water + methylcyclohexanone) systems: The first phase equilibrium data. J. Chem. Thermodyn. 2003, 35, 2045–2054. [Google Scholar] [CrossRef]
- Sangwai, J.S.; Oellrich, L. Phase equilibrium of semiclathrate hydrates of methane in aqueous solutions of tetra-n-butyl ammonium bromide (TBAB) and TBAB-NaCl. Fluid Phase Equilib. 2014, 367, 95–102. [Google Scholar] [CrossRef]
- Sadeq, D.; Iglauer, S.; Lebedev, M.; Smith, C.; Barifcani, A. Experimental determination of hydrate phase equilibrium for different gas mixtures containing methane, carbon dioxide and nitrogen with motor current measurements. J. Nat. Gas Sci. Eng. 2017, 38, 59–73. [Google Scholar] [CrossRef] [Green Version]
- Saberi, A.; Alamdari, A.; Shariati, A.; Mohammadi, A.H. Experimental measurement and thermodynamic modelling of equilibrium condition for natural gas hydrate in MEG aqueous solution. Fluid Phase Equilib. 2018, 459, 110–118. [Google Scholar] [CrossRef]
- Fernàndez-Fernàndez, A.M.; Pérez-Rodrìguez, M.; Comesana, A.; Pineiro, M.M. Three-phase equilibrium curve shift for methane hydrate in oceanic conditions calculated from Molecular Dynamics simulations. J. Mol. Liq. 2019, 274, 426–433. [Google Scholar] [CrossRef]
- Chen, L.; Sun, C.; Chen, G.; Nie, Y.; Sun, Z.; Liu, Y. Measurements of Hydrate Equilibrium Conditions for CH4, CO2, and CH4+C2H6+C3H8 in Various Systems by Step-heating Method. Chin. J. Chem. Eng. 2009, 17, 635–641. [Google Scholar] [CrossRef]
- Chu, C.K.; Chen, P.C.; Chen, Y.P.; Lin, S.T.; Chen, L.J. Inhibition effect of 1-ethyl-3-methylimidazolium chloride on methane hydrate equilibrium. J. Chem. Thermodyn. 2015, 91, 141–145. [Google Scholar] [CrossRef]
- Jarrahian, A.; Nakhaee, A. Hydrate-liquid-vapor equilibrium condition for N2 + CO2 + H2O system: Measurement and modelling. Fuel 2019, 237, 769–774. [Google Scholar] [CrossRef]
- Kyung, D.; Lee, K.; Kim, H.; Lee, W. Effect of marine environmental factors on the phase equilibrium of CO2 hydrate. Int. J. Greenh. Gas Control. 2014, 20, 285–292. [Google Scholar] [CrossRef]
- Seo, Y.T.; Lee, H. Multiple-phase hydrate equilibria of the ternary carbon dioxide, methane, and water mixtures. J. Phys. Chem. B 2001, 105, 10084–10090. [Google Scholar] [CrossRef]
- Semenov, A.P.; Medvedev, V.I.; Guschin, P.A.; Yakushev, V. Effect of heating rate on the accuracy of measuring equilibrium conditions for methane and argon hydrates. Chem. Eng. Sci. 2015, 137, 161–169. [Google Scholar] [CrossRef]
- Shu, S.; Tiwikrama, A.H.; Yang, C.; Lee, M. Phase equilibrium and dynamic behavior of methane hydrates decomposition via depressurization in the presence of a promoter tert-butanol. J. Taiwan Inst. Chem. Eng. 2019, 95, 119–130. [Google Scholar] [CrossRef]
- Shicai, S.; Yong, Z.; Changling, L.; Yufeng, L. Preliminary study on measurement technology for hydrate phase equilibrium. Fluid Phase Equilib. 2015, 403, 60–69. [Google Scholar] [CrossRef]
- Xu, S.; Fan, S.; Yao, H.; Wang, Y.; Lang, X.; Lv, P.; Fang, S. The phase equilibria of multicomponent gas hydrate in methanol/ethylene glycol solution based formation water. J. Chem. Thermodyn. 2017, 104, 212–217. [Google Scholar] [CrossRef]
- Yu, Y.S.; Zhou, S.D.; Li, X.S.; Wang, S.L. Effect of graphite nanoparticles on CO2 hydrate phase equilibrium. Fluid Phase Equilib. 2016, 414, 23–28. [Google Scholar] [CrossRef]
- Pahlavanzadeh, H.; Farhoudi, A.; Manteghian, M. Experimental measurement of carbon dioxide clathrate hydrate in the presence of adamantane and other water soluble and insoluble additives. J. Chem. Thermodyn. 2019, 135, 352–358. [Google Scholar] [CrossRef]
- Herri, J.M.; Bouchemoua, A.; Kwatersky, M.; Fezoua, A.; Ouabbas, Y.; Cameirao, A. Gas hydrate equilibria for CO2-N2 and CO2-CH4 gas mixtures–Experimental studies and thermodynamic modelling. Fluid Phase Equilib. 2011, 301, 171–190. [Google Scholar] [CrossRef] [Green Version]
- Borchardt, L.; Nickel, W.; Casco, M.; Senkovska, I.; Bon, V.; Wallacher, D. Illuminating solid gas storage in confined space-methane hydrate formation in porous model carbons. Phys. Chem. Chem. Phys. 2016, 18, 20607–20614. [Google Scholar] [CrossRef] [Green Version]
- Miyawaki, J.; Kanda, T.; Suzuki, T.; Okui, T.; Maeda, Y.; Kaneko, K. Macroscopic evidence of enhanced formation of methane nanohydrates in hydrophobic nanospaces. J. Phys. Chem. B 1998, 102, 2187–2192. [Google Scholar] [CrossRef]
- Najibi, H.; Mirzaee Shayegan, M.; Heidary, H. Experimental investigation of methane hydrate formation in the presence of copper oxide nanoparticles and SDS. J. Nat. Gas Sci. Eng. 2015, 23, 315–323. [Google Scholar] [CrossRef]
- Pahlavanzadeh, H.; Rezaei, S.; Khanlarkhani, M.; Manteghian, M.; Mohammadi, A.H. Kinetic study of methane hydrate formation in the presence of copper nanoparticles and CTAB. J. Nat. Gas Sci. Eng. 2016, 34, 803–810. [Google Scholar] [CrossRef]
- Gambelli, A.M.; Rossi, F. Thermodynamic and kinetic characterization of methane hydrate nucleation, growth and dissociation processes, according to the labile Cluster theory. Chem. Eng. J. 2021, 425, 130706. [Google Scholar] [CrossRef]


| Board Height Internal Height | 21 22.1 | cm cm | Internal Pipe Volume Volume of Intake Pipes | 1 18 | cm3 cm3 |
| Depth from the edge | 18.5 | cm | Gas volume from the high edge | 90 | cm3 |
| Depth edge to the network | 18.3 | cm | Total volume of free gas | 109 | cm3 |
| Weld thickness | 1.1 | cm | Internal reactor volume | 949 | cm3 |
| Thickness from the edge | 1 | cm | Total reactor volume | 950 | cm3 |
| Internal diameter | 7.4 | cm | – | – | – |
| Temperature [°C] | 0 [wt.%] | 4.23 [wt.%] | 18.1 [wt.%] | 30.66 [wt.%] |
|---|---|---|---|---|
| 2.2 | 26.86 | |||
| 2.3 | 27.19 | |||
| 2.4 | 28.93 | 28.32 | ||
| 2.5 | 29.72 | 28.84 | ||
| 2.6 | 29.46 | 29.1 | ||
| 2.7 | 29.99 | 29.3 | ||
| 2.8 | 30.34 | 29.57 | ||
| 2.9 | 30.86 | 29.68 | ||
| 3 | 30.89 | 30.25 | ||
| 3.1 | 31.25 | 31.34 | 30.47 | |
| 3.2 | 31.28 | 31.29 | 30.35 | |
| 3.3 | 31.34 | 31.14 | 30.8 | |
| 3.4 | 31.58 | 31.57 | 30.91 | |
| 3.5 | 31.56 | 31.91 | 31.25 | |
| 3.6 | 31.9 | 31.91 | 31.56 | |
| 3.7 | 32.12 | 32.13 | 31.67 | |
| 3.8 | 32.32 | 32.66 | 31.91 | |
| 3.9 | 32.52 | 33.15 | 32.13 | |
| 4 | 32.64 | 35.78 | 33.74 | 32.48 |
| 4.1 | 32.98 | 35.91 | 33.68 | 32.7 |
| 4.2 | 33.11 | 36.01 | 33.87 | 32.76 |
| 4.3 | 33.67 | 36.36 | 34.32 | 33.31 |
| 4.4 | 33.87 | 36.36 | 34.4 | 33.47 |
| 4.5 | 34.31 | 36.7 | 34.41 | 33.63 |
| 4.6 | 34.45 | 37.04 | 35.2 | 33.88 |
| 4.7 | 34.76 | 37.43 | 35.72 | 34.19 |
| 4.8 | 35.25 | 37.46 | 35.65 | 34.68 |
| 4.9 | 35.51 | 38.23 | 36.26 | 34.63 |
| 5 | 35.87 | 38.32 | 36.12 | 34.85 |
| 5.1 | 36.12 | 38.58 | 36.44 | 34.89 |
| 5.2 | 36.65 | 39.14 | 36.94 | 35.53 |
| 5.3 | 36.89 | 39.34 | 36.8 | 35.56 |
| 5.4 | 37.41 | 39.54 | 37.23 | 35.88 |
| 5.5 | 37.87 | 39.77 | 37.42 | 36.07 |
| 5.6 | 38.08 | 39.9 | 37.71 | 36.36 |
| 5.7 | 38.73 | 40.24 | 38 | 36.8 |
| 5.8 | 38.91 | 40.09 | 38.31 | 36.97 |
| 5.9 | 39.37 | 40.26 | 38.31 | 37.11 |
| 6 | 39.68 | 40.82 | 38.68 | 37.34 |
| 6.1 | 40.04 | 40.88 | 38.94 | 37.56 |
| 6.2 | 40.35 | 41.41 | 39.37 | 37.95 |
| 6.3 | 41.02 | 41.1 | 39.43 | 38.09 |
| 6.4 | 41.33 | 41.38 | 40.33 | 38.34 |
| 6.5 | 41.9 | 41.7 | 40.34 | 38.63 |
| 6.6 | 42.39 | 42.13 | 40.62 | 38.86 |
| 6.7 | 42.48 | 42.21 | 41.37 | 39.12 |
| 6.8 | 43.02 | 42.46 | 41.29 | 39.17 |
| 6.9 | 43.27 | 42.57 | 42.34 | 39.48 |
| 7 | 43.54 | 42.73 | 42.57 | 39.69 |
| 7.1 | 44.08 | 42.61 | 42.92 | 39.79 |
| 7.2 | 44.26 | 42.82 | 43.14 | 40.27 |
| 7.3 | 44.84 | 43.21 | 43.81 | 40.56 |
| 7.4 | 45.35 | 43.56 | 44.38 | 40.79 |
| 7.5 | 45.62 | 43.52 | 44.53 | 40.95 |
| 7.6 | 46 | 43.61 | 44.89 | 41.03 |
| 7.7 | 46.61 | 43.71 | 45.81 | 41.46 |
| 7.8 | 47.39 | 44.26 | 46.16 | 41.76 |
| 7.9 | 47.35 | 44.23 | 46.74 | 42.19 |
| 8 | 47.58 | 44.7 | 47.05 | 42.48 |
| 8.1 | 47.84 | 44.41 | 47.54 | 42.4 |
| 8.2 | 48.29 | 45.01 | 47.85 | 42.71 |
| 8.3 | 48.64 | 44.74 | 48.3 | 42.8 |
| 8.4 | 48.9 | 45.31 | 48.6 | 43.05 |
| 8.5 | 49.18 | 45.45 | 49.26 | 43.52 |
| 8.6 | 49.55 | 46.07 | 49.8 | 43.62 |
| 8.7 | 50.06 | 45.6 | 50.2 | 43.65 |
| 8.8 | 50.63 | 46.29 | 50.33 | 44.19 |
| 8.9 | 51.21 | 46.16 | 51.08 | 44.46 |
| 9 | 51.53 | 46.51 | 51.08 | 44.53 |
| 9.1 | 51.81 | 46.74 | 51.57 | 44.44 |
| 9.2 | 52.34 | 46.65 | 51.89 | 44.98 |
| 9.3 | 52.65 | 46.81 | 52.47 | 45.37 |
| 9.4 | 52.87 | 47.19 | 52.77 | 45.59 |
| 9.5 | 53.36 | 46.96 | 53 | 45.86 |
| 9.6 | 53.69 | 47.25 | 53.14 | 46.1 |
| 9.7 | 47.38 | 53.32 | 46.09 | |
| 9.8 | 47.77 | 53.45 | 46.42 | |
| 9.9 | 47.83 | 46.63 | ||
| 10 | 47.77 | 46.89 | ||
| 10.1 | 47.54 | 47.37 | ||
| 10.2 | 47.51 | |||
| 10.3 | 47.64 | |||
| 10.4 | 47.96 | |||
| 10.5 | 48.26 | |||
| 10.6 | 48.31 | |||
| 10.7 | 48.44 | |||
| 10.8 | 48.83 | |||
| 10.9 | 48.97 | |||
| 11 | 49.3 | |||
| 11.1 | 49.46 | |||
| 11.2 | 49.73 | |||
| 11.3 | 49.99 | |||
| 11.4 | 50.08 | |||
| 11.5 | 50.44 | |||
| 11.6 | 50.73 | |||
| 11.7 | 51.09 | |||
| 11.8 | 51.12 | |||
| 11.9 | 51.36 | |||
| 12 | 51.57 | |||
| 12.1 | 51.68 | |||
| 12.2 | 51.95 | |||
| 12.3 | 52.26 | |||
| 12.4 | 52.22 | |||
| 12.5 | 52.45 | |||
| 12.6 | 52.88 | |||
| 12.7 | 53.14 | |||
| 12.8 | 53.37 | |||
| 12.9 | 53.16 | |||
| 13 | 53.35 | |||
| 13.1 | 53.91 | |||
| 13.2 | 53.94 | |||
| 13.3 | 54.08 | |||
| 13.4 | 54.39 | |||
| 13.5 | 54.56 | |||
| 13.6 | 54.78 | |||
| 13.7 | 54.76 | |||
| 13.8 | 55.03 | |||
| 13.9 | 55.34 | |||
| 14 | 55.44 | |||
| 14.1 | 55.58 | |||
| 14.2 | 55.59 | |||
| 14.3 | 55.81 | |||
| 14.4 | 55.88 | |||
| 14.5 | 56.18 | |||
| 14.6 | 56.45 | |||
| 14.7 | 56.41 | |||
| 14.8 | 56.57 | |||
| 14.9 | 56.67 | |||
| 15 | 56.57 | |||
| 15.1 | 56.54 | |||
| 15.2 | 56.91 | |||
| 15.3 | 56.65 | |||
| 15.4 | 56.87 |
| Temperature [°C] | 0 [wt.%] | 4.23 [wt.%] | 18.1 [wt.%] | 30.66 [wt.%] |
|---|---|---|---|---|
| 0.7 | 28.97 | |||
| 0.8 | 29.24 | |||
| 0.9 | 29.73 | |||
| 1 | 30.25 | |||
| 1.1 | 30.22 | 10.24 | ||
| 1.2 | 30.34 | 10.73 | ||
| 1.3 | 30.78 | 11.14 | ||
| 1.4 | 30.56 | 11.04 | ||
| 1.5 | 30.91 | 11.24 | ||
| 1.6 | 31.09 | 11.47 | ||
| 1.7 | 31.36 | 11.75 | ||
| 1.8 | 31.55 | 11.78 | ||
| 1.9 | 31.55 | 12.08 | ||
| 2 | 31.42 | 30.78 | 12.36 | |
| 2.1 | 31.98 | 30.68 | 12.16 | |
| 2.2 | 31.89 | 30.88 | 12.58 | 12.34 |
| 2.3 | 32.23 | 31.07 | 12.62 | 12.31 |
| 2.4 | 32.4 | 30.99 | 12.85 | 12.43 |
| 2.5 | 32.43 | 31.25 | 13.22 | 12.85 |
| 2.6 | 32.52 | 31.28 | 13.39 | 13.16 |
| 2.7 | 32.92 | 31.25 | 13.74 | 13.3 |
| 2.8 | 32.84 | 31.56 | 13.77 | 13.29 |
| 2.9 | 32.79 | 31.61 | 14.08 | 13.75 |
| 3 | 33.22 | 31.49 | 14.06 | 14.01 |
| 3.1 | 33.31 | 31.56 | 14.53 | 14.04 |
| 3.2 | 33.68 | 31.69 | 14.64 | 14.26 |
| 3.3 | 33.66 | 31.78 | 14.7 | 14.83 |
| 3.4 | 33.86 | 31.87 | 15.1 | 14.91 |
| 3.5 | 34 | 31.8 | 15.4 | 15.11 |
| 3.6 | 34.15 | 31.99 | 15.67 | 15.45 |
| 3.7 | 34.22 | 32.13 | 15.82 | 15.75 |
| 3.8 | 34.32 | 32.21 | 15.94 | 15.97 |
| 3.9 | 34.32 | 32.21 | 16.42 | 16.22 |
| 4 | 34.52 | 32.52 | 16.6 | 16.73 |
| 4.1 | 34.65 | 32.43 | 16.91 | 16.76 |
| 4.2 | 34.88 | 32.59 | 17.03 | 17.3 |
| 4.3 | 34.98 | 32.74 | 17.3 | 17.3 |
| 4.4 | 35.28 | 32.76 | 17.88 | 17.41 |
| 4.5 | 35.26 | 32.79 | 17.97 | 18.19 |
| 4.6 | 35.4 | 32.92 | 18.19 | 18.16 |
| 4.7 | 35.26 | 32.96 | 18.76 | 18.49 |
| 4.8 | 35.56 | 33.1 | 18.81 | 18.76 |
| 4.9 | 35.72 | 33.09 | 19.07 | 18.94 |
| 5 | 35.82 | 33.19 | 19.51 | 19.28 |
| 5.1 | 35.87 | 33.31 | 19.86 | 19.57 |
| 5.2 | 35.87 | 33.49 | 19.86 | 19.91 |
| 5.3 | 36.13 | 33.62 | 20.2 | 20.31 |
| 5.4 | 36.32 | 33.63 | 20.94 | 20.49 |
| 5.5 | 36.35 | 33.66 | 21.12 | 20.76 |
| 5.6 | 36.31 | 33.87 | 21.31 | 21 |
| 5.7 | 36.54 | 33.98 | 21.57 | 21.53 |
| 5.8 | 36.72 | 34 | 22.15 | 21.8 |
| 5.9 | 36.79 | 34.26 | 22.43 | 22.07 |
| 6 | 37.42 | 34.37 | 22.65 | 22.46 |
| 6.1 | 37.8 | 34.45 | 23.03 | 23.11 |
| 6.2 | 37.91 | 34.45 | 23.46 | 23.31 |
| 6.3 | 37.85 | 34.59 | 23.8 | 23.45 |
| 6.4 | 38.32 | 34.67 | 24.33 | 24.01 |
| 6.5 | 38.19 | 35.07 | 24.65 | 24.12 |
| 6.6 | 38.28 | 35.18 | 24.91 | 24.72 |
| 6.7 | 38.32 | 35.07 | 25.58 | 25 |
| 6.8 | 38.39 | 35.29 | 25.96 | 25.37 |
| 6.9 | 38.39 | 35.32 | 26.4 | 25.81 |
| 7 | 38.35 | 35.42 | 26.97 | 25.98 |
| 7.1 | 38.35 | 35.55 | 27.46 | 26.72 |
| 7.2 | 38.23 | 35.56 | 27.76 | 26.87 |
| 7.3 | 38.36 | 35.76 | 28.36 | 27.48 |
| 7.4 | 38.38 | 35.88 | 28.54 | 27.58 |
| 7.5 | 38.44 | 36 | 28.71 | 28.1 |
| 7.6 | 38.61 | 36.17 | 29.18 | 28.47 |
| 7.7 | 38.59 | 36.13 | 29.99 | 28.67 |
| 7.8 | 38.67 | 36.38 | 30.51 | 28.85 |
| 7.9 | 38.78 | 36.57 | 31.07 | 29.12 |
| 8 | 38.93 | 31.42 | 29.37 | |
| 8.1 | 38.92 | 32.06 | 29.37 | |
| 8.2 | 39.07 | 32.53 | 29.55 | |
| 8.3 | 39.03 | 33.02 | 29.59 | |
| 8.4 | 39.04 | 33.31 | 29.9 | |
| 8.5 | 39.34 | 33.64 | 30.21 | |
| 8.6 | 39.51 | 33.53 | 30.25 | |
| 8.7 | 33.87 | 30.23 | ||
| 8.8 | 34.17 | 30.33 | ||
| 8.9 | 34.11 | 30.56 | ||
| 9 | 34.41 | 30.68 | ||
| 9.1 | 34.25 | 30.79 | ||
| 9.2 | 34.35 | 30.91 | ||
| 9.3 | 34.53 | 31.12 | ||
| 9.4 | 34.87 | 31.08 | ||
| 9.5 | 34.9 | 31.32 | ||
| 9.6 | 34.96 | 31.56 | ||
| 9.7 | 34.92 | 31.61 | ||
| 9.8 | 35.21 | 31.65 | ||
| 9.9 | 35.41 | 31.69 | ||
| 10 | 35.35 | 31.75 | ||
| 10.1 | 35.74 | 31.69 | ||
| 10.2 | 35.65 | 32.17 | ||
| 10.3 | 35.63 | 32.22 | ||
| 10.4 | 35.94 | 32.4 | ||
| 10.5 | 35.8 | 32.55 | ||
| 10.6 | 36.14 | 32.76 | ||
| 10.7 | 36.14 | 33 | ||
| 10.8 | 36.32 | 32.9 | ||
| 10.9 | 36.36 | 33.32 | ||
| 11 | 36.36 | 33.29 | ||
| 11.1 | 36.62 | 33.18 | ||
| 11.2 | 36.73 | 33.4 | ||
| 11.3 | 36.88 | 33.63 | ||
| 11.4 | 36.79 | 33.86 | ||
| 11.5 | 36.88 | 34.09 | ||
| 11.6 | 37.11 | 34.19 | ||
| 11.7 | 37.41 | 34.41 | ||
| 11.8 | 37.41 | 34.41 | ||
| 11.9 | 37.43 | 34.77 | ||
| 12 | 37.47 | 35.08 | ||
| 12.1 | 37.6 | 35.34 | ||
| 12.2 | 37.61 | 35.57 | ||
| 12.3 | 37.94 | 36.01 | ||
| 12.4 | 37.99 | 36.66 | ||
| 12.5 | 37.91 | 37.19 | ||
| 12.6 | 37.95 | 38.89 | ||
| 12.7 | 37.99 | 39.67 | ||
| 12.8 | 37.93 | |||
| 12.9 | 38.07 | |||
| 13 | 38.2 |
Publisher’s Note: MDPI stays neutral with regard to jurisdictional claims in published maps and institutional affiliations. |
© 2021 by the authors. Licensee MDPI, Basel, Switzerland. This article is an open access article distributed under the terms and conditions of the Creative Commons Attribution (CC BY) license (https://creativecommons.org/licenses/by/4.0/).
Share and Cite
Gambelli, A.M.; Stornelli, G.; Di Schino, A.; Rossi, F. Methane and Carbon Dioxide Hydrate Formation and Dissociation in Presence of a Pure Quartz Porous Framework Impregnated with CuSn12 Metallic Powder: An Experimental Report. Materials 2021, 14, 5115. https://doi.org/10.3390/ma14175115
Gambelli AM, Stornelli G, Di Schino A, Rossi F. Methane and Carbon Dioxide Hydrate Formation and Dissociation in Presence of a Pure Quartz Porous Framework Impregnated with CuSn12 Metallic Powder: An Experimental Report. Materials. 2021; 14(17):5115. https://doi.org/10.3390/ma14175115
Chicago/Turabian StyleGambelli, Alberto Maria, Giulia Stornelli, Andrea Di Schino, and Federico Rossi. 2021. "Methane and Carbon Dioxide Hydrate Formation and Dissociation in Presence of a Pure Quartz Porous Framework Impregnated with CuSn12 Metallic Powder: An Experimental Report" Materials 14, no. 17: 5115. https://doi.org/10.3390/ma14175115