Article

Electrochemically Driven Phase Transition in LiCoO2 Cathode

1
School of Automobile and Transportation, Xihua University, Chengdu 610039, China
2
School of Materials Science and Engineering, Xihua University, Chengdu 610039, China
3
School of Advanced Materials and Nanotechnology, Xidian University, Xi’an 710126, China
4
School of Optoelectronic Science and Engineering, University of Electronic Science and Technology of China, Chengdu 610054, China
*
Authors to whom correspondence should be addressed.
Materials 2021, 14(2), 242; https://doi.org/10.3390/ma14020242
Submission received: 10 November 2020 / Revised: 29 December 2020 / Accepted: 29 December 2020 / Published: 6 January 2021

Abstract

:
Lithium cobalt oxide (LiCoO2), which has been successfully applied in commercial lithium-ion batteries for portable devices, possesses a theoretical specific capacity of 274 mAh g−1. However, its actual capacity is only half of the theoretical specific capacity, because the charging voltage is restricted below 4.2 V. If a higher charging voltage is applied, an irreversible phase transition of LiCoO2 during delithiation would occur, resulting in severe capacity fading. Therefore, it is essential to investigate the electrochemically driven phase transition of LiCoO2 cathode material to approach its theoretical capacity. In this work, it was observed that LiCoO2 partially degraded to Co3O4 after 150 charging-discharging cycles. From the perspective of crystallography, the conventional cell of LiCoO2 was rebuilt to an orthonormal coordinate, and the transition path from layered LiCoO2 to cubic Co3O4 proposed. The theoretical analysis indicated that the electrochemically driven phase transition from LiCoO2 to Co3O4 underwent several stages. Based on this, an experimental verification was made by doping LiCoO2 with Al, In, Mg, and Zr, respectively. The doped samples theoretically predicted behavior. The findings in this study provide insights into the electrochemically driven phase transition in LiCoO2, and the phase transition can be eliminated to improve the capacity of LiCoO2 to its theoretical value.

1. Introduction

Lithium-ion batteries (LIBs) are widely implemented in mobile equipment and electric vehicles to provide power because of their high power density and cycle stability [1,2,3,4]. In general, cathode materials are the major factor for the performance of LIBs, and higher energy density and better cycle stability are pursued [5,6,7,8,9,10]. Layered lithium cobalt oxide (LiCoO2) is considered as one of the most important cathode materials due to its large theoretical capacity of 274 mAh g−1 [11,12]. LiCoO2 operates by reversible de-intercalation (charge) and intercalation (discharge) of lithium ions, without the irreversible phase transition of crystal structures [13,14,15]. The charging voltage of LiCoO2 cathode is restricted to 4.2 V to avoid the irreversible phase transition. Due to this limitation, commercial LiCoO2 only exhibits a little more than half of its theoretical value [1,16]. The irreversible phase transition arising from over charging voltage would cause the cathode capacity to fade quickly [17,18,19]. Therefore, to further improve the performance of LiCoO2, e.g., charging voltage, capacity, and cycling stability, great efforts should be made to inhibit the irreversible phase transition during charge/discharge cycles [20]. Although various beneficial modifications have been reported in recent years [21,22,23], there is a lack of insight into the origin of electrochemically driven phase transition in LiCoO2. Hence, currently, LiCoO2 is still unable to be charged to a higher voltage and its capacity is much less than its theoretical value.
Van der Ven et al [24] theoretically studied the phase stability in LixCoO2 with different lithium contents and predicted that LixCoO2 went through a phase transition from O3 to H1-3 symmetries as lithium content decreased. Chen et al [25] verified the phase transition in LixCoO2 with decreasing lithium content by in-situ XRD. Dahéron et al [26] and Ohnishi et al [27] found the degraded product of CoxOy from LiCoO2 due to the irreversible electrochemically driven phase transition. However, the phase of CoxOy is still controversial. Electrochemically driven phase transition path in LiCoO2 is still unclear. It is widely acknowledged that an effective strategy to improve the capacity of LiCoO2 is to inhibit its phase transition during delithiation. Liu et al [28] improved the capacity of LiCoO2 to 190 mAh g−1 with 96% capacity retention over 50 cycles by inhibiting the order-disorder transition and H1-3 transition. Therefore, it is of utmost significance to determine the mechanism of the electrochemically driven phase transition in LiCoO2 during charge/discharge cycles, to further improve the cycling stability and practical capacity of LiCoO2.
In this work, the electrochemically driven phase transition of LiCoO2 during charge/discharge cycles was investigated. The microstructure change of LiCoO2 after 150 cycles at charging voltage of 4.3 V was observed by high resolution transmission electron microscope (HRTEM). From the perspective of crystallography, the conventional cell of LiCoO2 was rebuilt to an orthonormal coordinate, the Co and O sites in LiCoO2 and Co3O4 were compared, and the electrochemically driven phase transition route was proposed. Both experimental observation and theoretical analysis indicated that the electrochemically driven phase transition occurred at the surface of LiCoO2 particle. Furthermore, relevant experiments were designed to verify the proposed transition mechanism.

2. Experimental Procedure and Computational Method

2.1. Samples Preparation

In this study, LiCoO2 powders were synthesized by sintering the oxide mixture of Li2CO3 and Co3O4 at 1000 °C for 12 h. Then, the as-prepared LiCoO2 was used as cathode in the Li-ion coin-cell, in which the counter electrode was metallic lithium foil, 1M LiPF6 was electrolyte, and Celgard 2300 was separator. After 150 charging-discharging cycles under 2.8–4.3 V at 0.5C, the cell was disassembled, and the electrode was removed. Then, the cathode powder was stripped and washed by alcohol for microstructure characterization by HRTEM.
The doped LiCoO2 powders were synthesized by the same procedure, using Al2O3, In2O3, MgO, and ZrO2 as dopants. The doping content was controlled at 1 mol% in all samples. To characterize the electrochemical performance, the doped or undoped LiCoO2 powders were mixed with the solvent system including 10 wt% acetylene black, 10wt% PVDF and N-methyl-2-pyrrolidine (NMP) to prepare a homogenous slurry. The slurry was casted on Al foil, dried at 120 °C and employed as a cathode in 2032-type Li-ion coin-cell. The coin-cells were assembled by using Celgard 2300 as a separator, a counter electrode of metallic lithium foil, and LiPF6 dissolved in the mixed organic solvent of ethylene carbonate, dimethyl carbonate, and diethyl carbonate to obtain 1M solution as the electrolyte.

2.2. Characterization

The microstructure was observed by transmission electron microscopy (TEM, JEM 2100F, JEOL, Tokyo, Japan). X-ray photoelectron spectroscopy (XPS, Thermo Fisher ESCALAB Xi+, Waltham, MA, USA) analysis was performed to determine the elemental valence states. The crystalline phase of as-prepared powders was identified by X-ray diffraction (XRD, Bruker D8 Advanced, Hamburg, Germany) in standard θ–2θ configuration, using Cu Kα radiation. The galvanostatic charge-discharge performance was measured in the potential range of 2.0–4.3 V (vs. Li/Li+) at room temperature by using a battery test system (Land CT2001A, Wuhan Jinnuo Electronic Co. Ltd., Wuhan, China).

2.3. Density Functional Theory Calculations

A first-principles calculation was performed by using the Vienna ab initio simulation package (VASP) [29] within the density functional theory (DFT) using the supplied PAW pseudopotentials [30,31] and the Perdew–Burke–Ernzerhof generalized gradient approximation (PBE-GGA) [32]. Cut-off energy for the plane wave basis was chosen as 570 eV and 6 × 6 × 6 Monkhorst-Pack k grid was used for sampling the Brillouin zone. Structure optimization was performed with the convergence criteria that energy change was less than 1 × 10⁻⁴ eV before calculating the energy at each transition step.

3. Results and Discussion

3.1. Microstructure Characterization

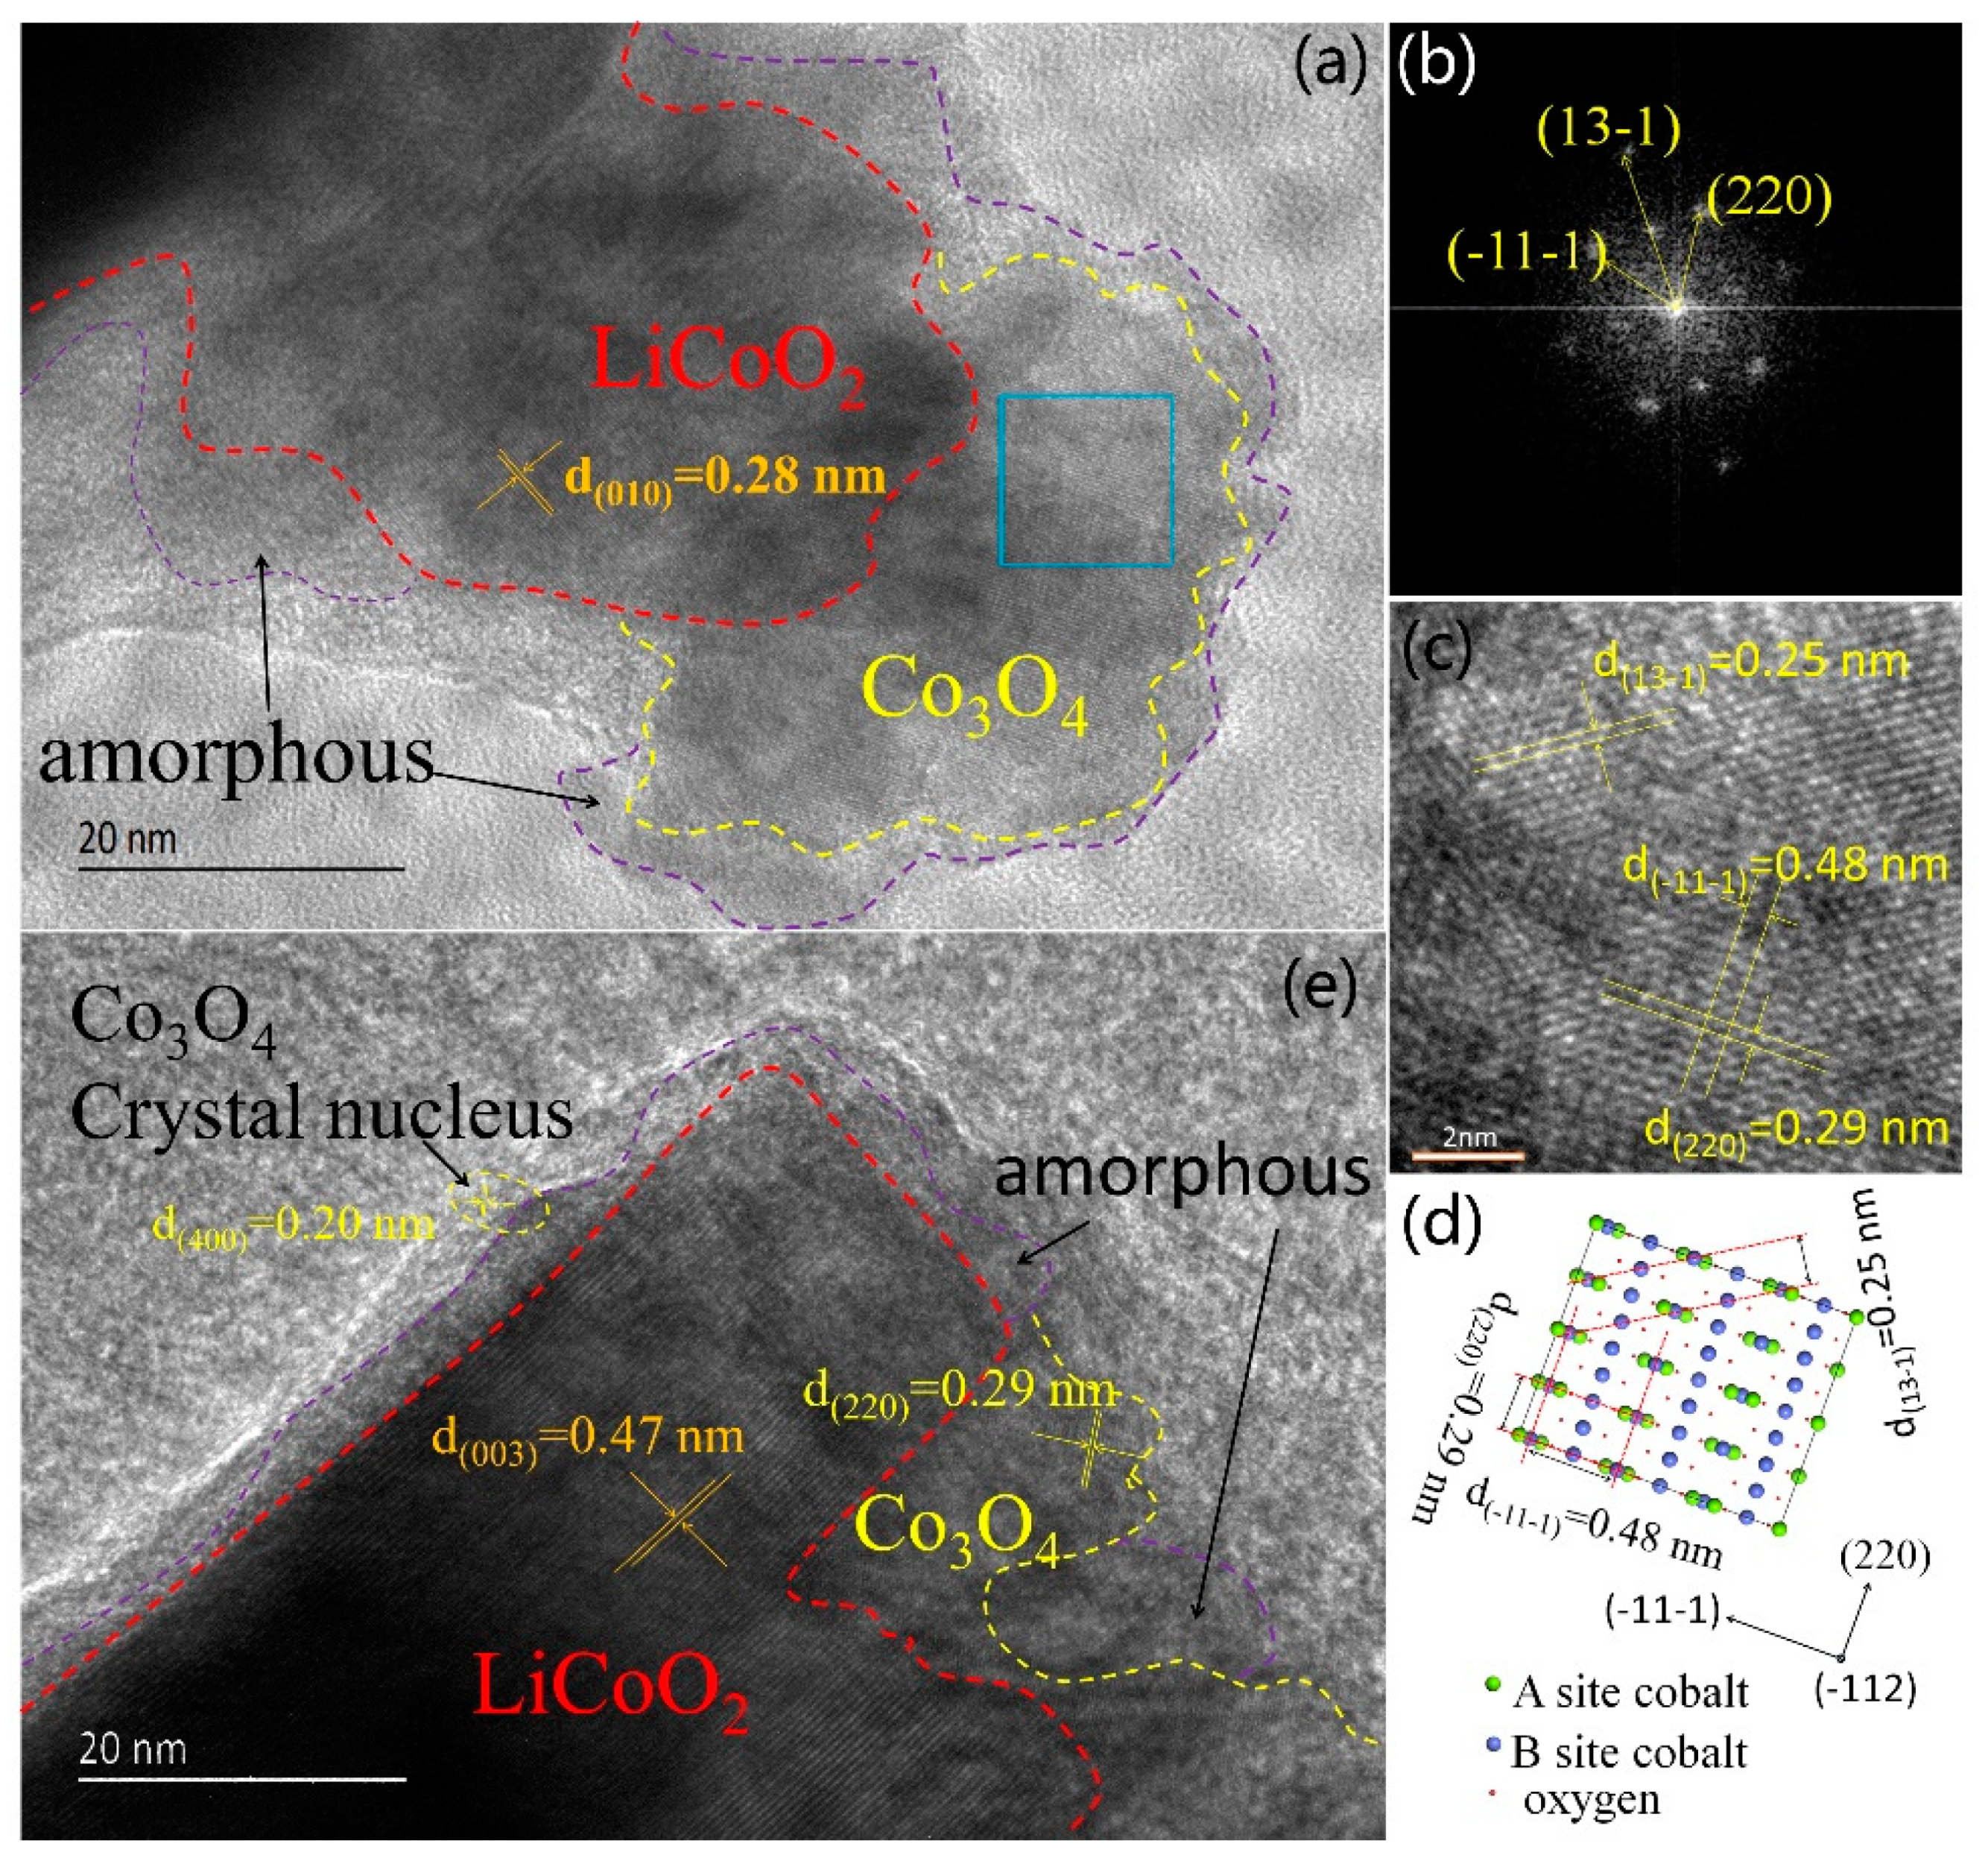
The as-prepared coin-cell was operated under 2.8–4.3 V (vs. Li/Li+) and was then disassembled to evaluate the degradation of LiCoO2 cathode. Figure 1 shows the Coulombic efficiency of the as-prepared Li-ion coin-cell with LiCoO2 as cathode. At the beginning, the Coulombic efficiency was low because the high charging voltage caused the phase transition of LiCoO2 cathode material. As a result, Li ions failed to re-intercalate into the cathode. In order to investigate the electrochemically driven phase transition of LiCoO2 cathode, the degradation of LiCoO2 cathode from disassembled cell was observed by HRTEM, and the obtained images are shown in Figure 2. Three different phase regions were observed on the LiCoO2 particle surface, namely LiCoO2 crystal, Co3O4 crystal and amorphous, respectively, as shown in Figure 2a,b. Also, Figure 2b shows a very small crystallite inclusion indicated by the yellow dash circle which is considered to be Co3O4 crystal nucleus. Figure 2c shows the corresponding fast Fourier transformation (FFT) of the square selected area in Figure 2a. Analysis of FFT pattern indicates that the phase constitution of the square selected area in Figure 2a is Co3O4 (PDF#80-1540) with Fd-3m symmetry. Figure 2d,e are inverse FFT of Figure 2b and atomic configuration of Co3O4 ( 1 ¯ 12 ) surface, respectively. Microstructure analysis of the degradation of LiCoO2 cathode revealed that a phase transition occurred from layered LiCoO2 to cubic Co3O4 in the surface zone of LiCoO2 cathode.
XPS analysis was employed to determine the valence state of Co element during the degradation of LiCoO2 cathode, as shown in Figure 3. The surface of degraded LiCoO2 particles contained Co2+ and Co3+ ions, with more Co2+ than Co3+. In contrast, pristine LiCoO2 before charge-discharge cycling only contained Co3+ ions. Apparently, Co2+ ions were produced from the phase transition of LiCoO2 during the process of delithiation-lithiation, and originated from electrochemically driven phase transition product, Co3O4. This result further indicated the surface phase transition from layered LiCoO2 to cubic Co3O4.

3.2. Modeling and Density Functional Theory Calculations:

According to the TEM analysis, surface composition of as-prepared LiCoO2 particles degraded into Co3O4 after 150 cycles in the potential range of 2.8~4.3 V. During the charge process, de-intercalation of Li-ions occurred as follows:
LiCoO 2     charging   discharging   xLi + + Li 1 x ( CoO 2 )
During the discharge process, an inverse reaction of Equation (1) occurred. However, some Li-ions failed to be intercalated into the layered structure of cathode, resulting in capacity fading, as shown in Figure 2. The failure of Li-ions to re-intercalate was attributed to the structural transformation of layered (CoO2) during delithiation, which is an irreversible phase transition causing degradation.
LiCoO 2 charging ( high   voltage ) Li + + 1 3 O 2 + 1 3 Co 3 O 4
Comparing the structure of layered (CoO2) lacking lithium ion with that of Co3O4, it was inferred that the following two steps likely occurred: (1) Li-ions were released from cathode under external field, and the lattice of (CoO2) expanded; (2) lattice oxygen escaped from the layered (CoO2), forming amorphous CoxO and then transforming to Co3O4. Figure 4 schematically shows the de-intercalation of Li-ions from LiCoO2 and the electrochemically driven phase transition from LiCoO2 to Co3O4, DFT calculation was performed according to the proposed transition path. In order to provide insights into the mechanism of degradation of LiCoO2 to Co3O4, the crystal cell of layered LiCoO2 was rebuilt from a hexagonal presentation to an orthogonal coordination, as shown in Figure 4a. After comparing each atom position in (CoO2) and Co3O4, a first principles calculation was performed based on DFT [33,34]. In the rebuilt LiCoO2 cell, 64 atoms were employed to perform the DFT calculation. The occupancy and displacement of atoms in rebuilt LiCoO2 cell were gradually changed to approach Co3O4 structure in order to simulate the transition path and to calculate the potential barrier during transition. Figure 4b shows the calculated total energy along the transition path from LiCoO2 to Co3O4. Under an external electric field, LiCoO2 overcame the potential barrier at transition steps 1 and 2 to release Li-ions. Accompanying the release of Li-ions, partial loss of lattice oxygen and lattice expansion occurred. The oxygen escaped from lattice because the applied voltage made the Fermi level touch O 2p level. Due to the existence of the potential barrier, this reaction was driven by an external electric field.
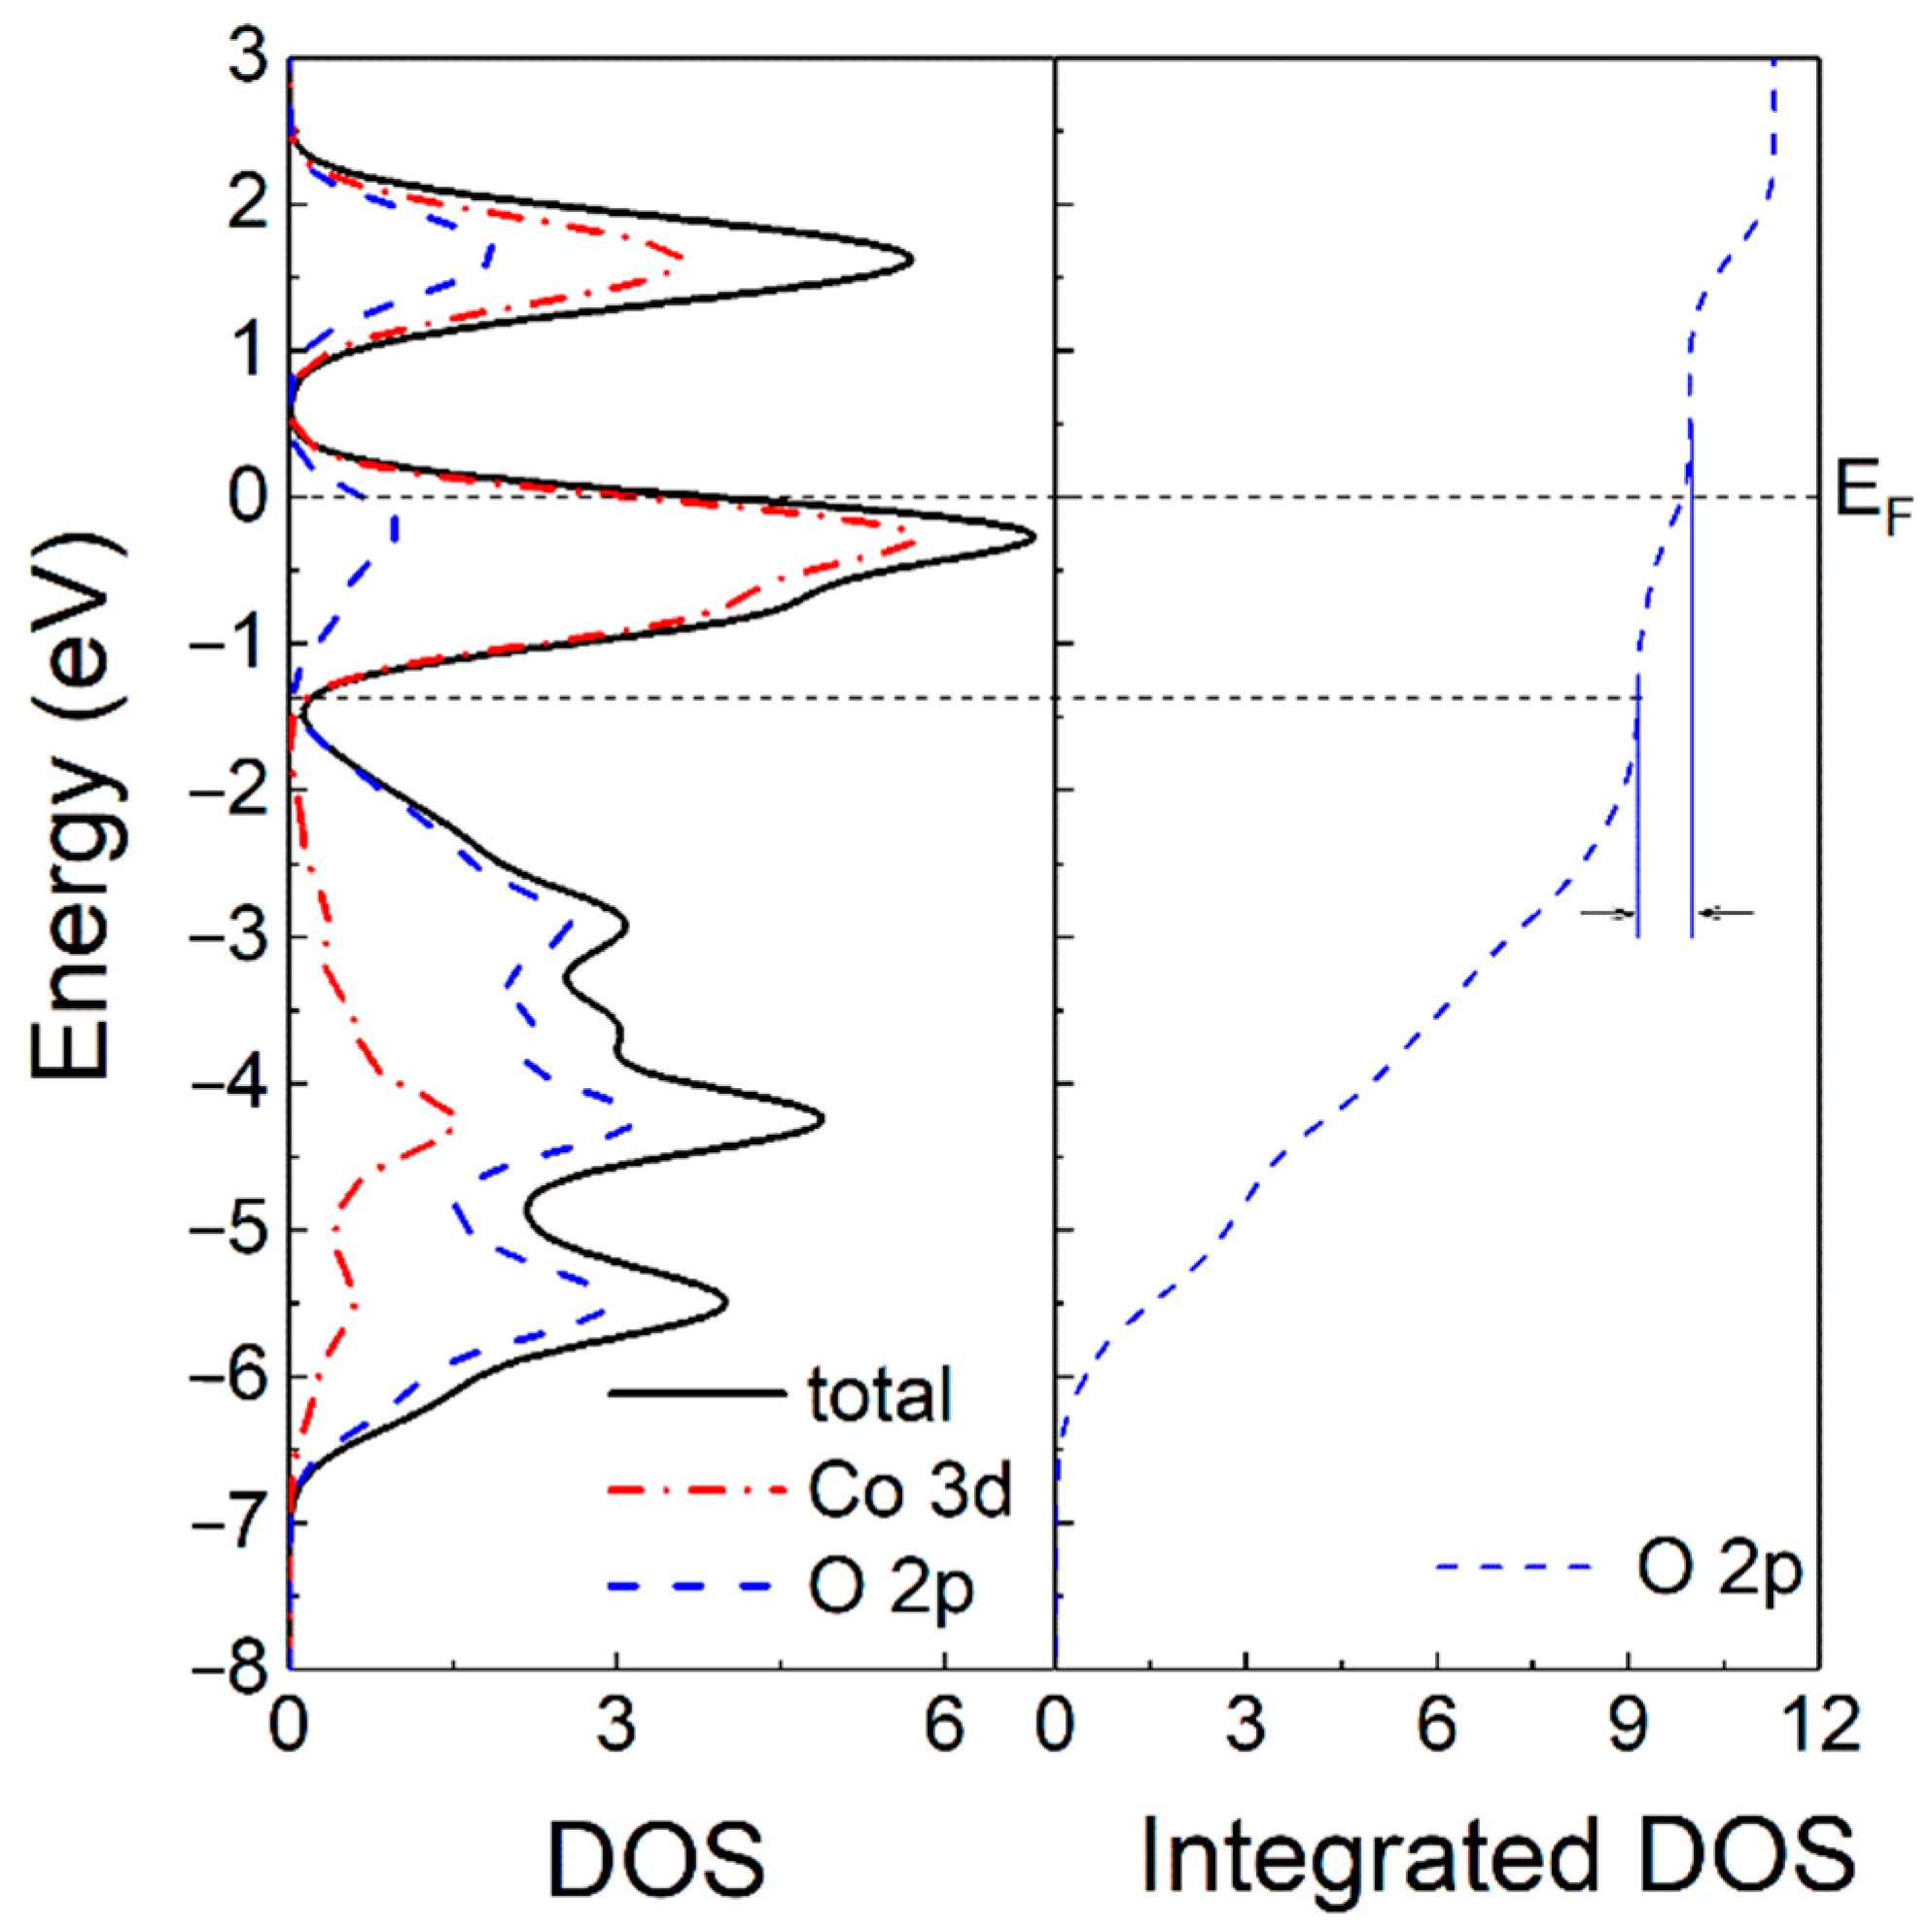
Figure 5 shows the calculated density of states (DOS) and integrated DOS of LiCoO2. First principles calculation indicates that LiCoO2 is a compound with significant covalent character [35]. The interaction of Co 3d-electrons with O 2p-electrons resulted in a splitting of the 3d levels and a hybridization of Co 3d and O 2p levels. Under an external field, Li-ions deintercalated from layered LiCoO2 cathode, which lowered the Fermi level to touch O 2p level. This led to the generation of holes in the bonding anion p-state. Thus, oxidation reaction of anions occurred, causing the decomposition of (CoO2) by oxygen loss. In LiCoO2 cathode, oxygen atoms form an interstitial octahedron, and cobalt atoms occupy the center. Li-ions take positive electricity, and Co-O octahedrons take negative electricity. When Li-ions were released from LiCoO2 cathode, the lattice expanded due to the electrostatic repulsion between Co-O octahedrons. Hence, partial oxygen loss and lattice expansion led to degradation of LiCoO2 into amorphous CoxOy which was observed in Figure 2e. Besides, CoxO eventually formed Co3O4 which contributed to the capacity fading. As can be seen, in the integrated DOS for O atoms, the hybridization part of O-2p orbitals with Co-3d orbitals above −1.5 eV was less than one electron per unit cell. This indicated that an appropriate applied voltage would not lead to oxygen loss. The experimental results also confirmed that LiCoO2 cathode exhibited good cycling stability when the charge voltage was at 4.2 eV. The calculated energy barrier along transition path indicated that the degradation process should overcome a potential barrier to finally form Co3O4. Consequently, in order to maintain the layered structure of LiCoO2 and to improve its charge voltage and capacity, its lattice should be compressed by doping ions with smaller radius and the hole capture level should be introduced by doping ions with lower valence, which was confirmed by our previous work [36].

3.3. Experimental Verification

From the aforementioned microstructure analysis and first principle calculation, it can be inferred that two key issues prompt the irreversible transition of LiCoO2 after releasing lithium. One is lattice expansion, and the other is O2− oxidation. If these two factors are inhibited, the cycling stability of LiCoO2 cathode material will be improved. Doping ions with smaller radius would inhibit the lattice expansion, while doping ions with lower valence would trap more holes. Therefore, through doping, the performance of LIBs would be improved or deteriorated at charge voltage above 4.2 V. To verify the theoretical analysis, LiCoO2 was doped with 1 mol% of Al, In, Mg, and Zr, respectively.
The experimental result based on the theoretical prediction are listed in Table 1. Among the doping ions, Al and In ions have the same valence state of +3 as Co ions in LiCoO2, but the radius of Al3+ ions is smaller than that of Co3+ and the radius of In3+ ions is larger than that of Co3+. Hence, Al doping can compress the LiCoO2 lattice and inhibit the phase transition. In doping will expand the LiCoO2 lattice, promoting the phase transition which would cause performance deterioration. Mg2+ and Zr4+ have similar ionic radius compared to Co3+, but different valence state. Mg doping will introduce the acceptor level which will enable trapping of holes, and thus inhibit O2− oxidation. Zr doping will form donor level due to higher valence, which will compensate the intrinsic acceptor level to promote the O2− oxidation [36]. Figure 6 shows the XRD patterns of doped and undoped LiCoO2 samples. As can be seen, doping with 1% Al, In, Mg and Zr did not change the phase of LiCoO2. The inset is the enlarged view of (003) and (104) peaks of Al and In doped samples. It can be seen that both the (003) and (104) peaks of Al doped sample shifted towards higher angles, which indicated that the lattice shrunk according to the Bragg equation, while the In doped sample showed the effect of lattice expansion. The calculated lattice parameters and their variation are shown in Table 2.
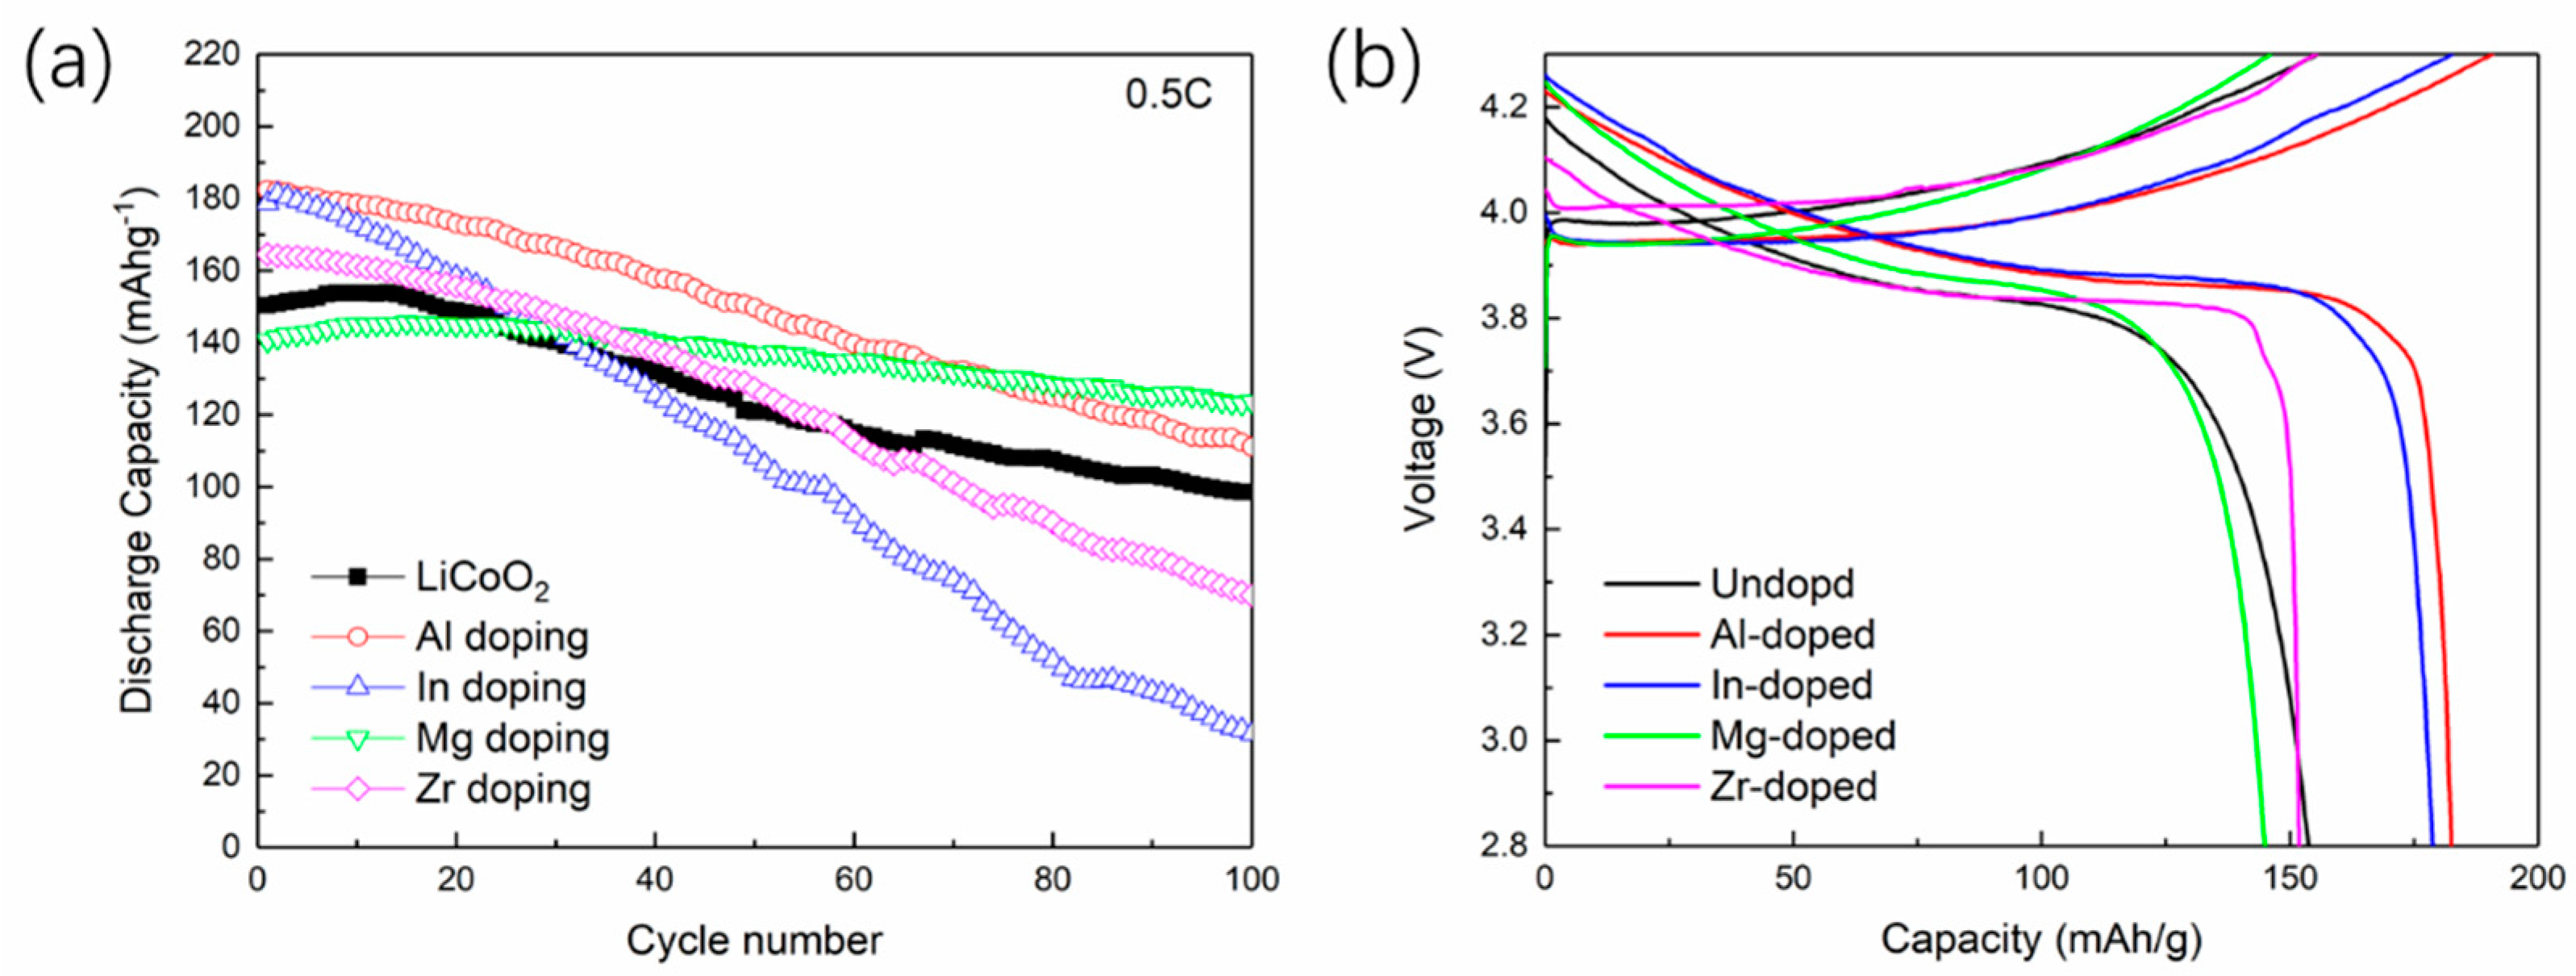
Figure 7 shows the cycling performance and charge-discharge profiles of doped and undoped LiCoO2 samples. The galvanostatic charge-discharge performance was measured at 0.5 C by charging to 4.3 V. After 100 cycles, Al and Mg doped LiCoO2 exhibited better capacities, while In and Zr doped LiCoO2 exhibited worse capacities, in agreement with the theoretical prediction. This verifies the theoretical analysis on the electrochemically driven phase transition from LiCoO2 to Co3O4. Notably, Al doped LiCoO2 demonstrated good cycling stability under 0.5 C after 100 cycles, and a specific capacity as high as 180 mAh g−1 during the initial cycles. Therefore, the capacity and cycling stability can be effectively improved through our proposed mechanism. Namely, the electrochemically driven phase transition can be inhibited by doping elements with smaller radius or lower valence.

4. Conclusions

In this study, HRTEM observations of LiCoO2 cathode particle were performed after 150 charging-discharging cycles under 2.8–4.3 V. It was found that the surface of LiCoO2 particle consisted of LiCoO2 crystal, Co3O4 crystal, Co3O4 crystal nucleus, and an amorphous region. According to the degradation product Co3O4 from LiCoO2, DFT calculations were performed to investigate the electrochemically driven phase transition path. Theoretical analysis indicated that the electrochemically driven phase transition undergoes two stages, lattice expansion, and oxygen escape. Through doping, the electrochemically driven phase transition of LiCoO2 could be inhibited and the electrochemical performance could be improved. The experimental verification was made by doping LiCoO2 with Al, In, Mg, and Zr to confirm the proposed electrochemically driven phase transition mechanism. Al or Mg doping significantly improved the cycling stability of LiCoO2 cathode materials by inhibiting the lattice expansion or oxygen escape, respectively.

Author Contributions

Conceptualization, R.H. and D.Z.; methodology, J.T., Z.W., H.H., J.L., and R.H.; software, G.L., J.T. and D.Z.; validation, Z.W., R.H. and D.Z.; investigation, J.T., R.H. and D.Z.; writing—original draft preparation, J.T.; writing—review and editing, R.H. and D.Z.; visualization, H.H. and J.L.; funding acquisition, J.L., Z.W., and D.Z. All authors have read and agreed to the published version of the manuscript.

Funding

This work was supported by the National Natural Science Foundation of China (Grant Nos. 51703182 & 51701147), Sichuan Science and Technology Program (2017JY0137 & 2019JDTD0024), and “Young Scholars” Program of Xihua University.

Institutional Review Board Statement

Not applicable.

Informed Consent Statement

Not applicable.

Data Availability Statement

The data presented in this study are available on request from the corresponding author.

Conflicts of Interest

The authors declare no conflict of interest.

References

  1. Liu, C.; Neale, Z.G. Understanding electrochemical potentials of cathode materials in rechargeable batteries. Mater. Today 2016, 19, 109–123. [Google Scholar] [CrossRef]
  2. Jaguemont, J.; Boulon, L. A comprehensive review of lithium-ion batteries used in hybrid andelectric vehicles at cold temperatures. Appl. Energy 2016, 164, 99–114. [Google Scholar] [CrossRef]
  3. Horiba, T.; Maeshima, T. Applications of high power density lithium ion batteries. J. Power Sour. 2005, 146, 107–110. [Google Scholar] [CrossRef]
  4. Liu, S.; Xiong, L. Long cycle life lithium ion battery with lithium nickel cobalt manganese oxide (NCM) cathode. J. Power Sour. 2014, 261, 285–291. [Google Scholar] [CrossRef]
  5. Nitta, N.; Wu, F. Li-ion battery materials: Present and future. Mater. Today 2015, 18, 252–264. [Google Scholar] [CrossRef]
  6. Nirmale, T.C.; Kale, B. A review on cellulose and lignin based binders and electrodes: Small steps towards a sustainable lithium ion battery. Int. J. Biol. Macromol. 2017, 103, 1032–1043. [Google Scholar] [CrossRef]
  7. Xu, B.; Qian, D. Recent progress in cathode materials research for advanced lithium ion batteries. Mater. Sci. Eng. R Rep. 2012, 73, 51–65. [Google Scholar] [CrossRef]
  8. Kang, K.; Meng, Y.S. Electrodes with High Power and High Capacity for Rechargeable Lithium Batteries. Science 2006, 311, 977–980. [Google Scholar] [CrossRef]
  9. Kang, B.; Ceder, G. Battery materials for ultrafast charging and discharging. Nature 2009, 458, 190. [Google Scholar] [CrossRef]
  10. Yang, Y.; Ma, J. Tuning charge–discharge induced unit cell breathing in layer-structured cath-ode materials for lithium-ion batteries. Nat. Commun. 2014, 5, 5381. [Google Scholar] [CrossRef]
  11. Konishi, H.; Hirano, T. Evaluation of Stability of Charged Lithium-rich Layer-structured Cath-ode Material at Elevated Temperature. Electrochim. Acta 2015, 169, 310–316. [Google Scholar] [CrossRef]
  12. Konishi, H.; Hirano, T. Origin of hysteresis between charge and discharge processes in lithiu-m-rich layer-structured cathode material for lithium-ion battery. J. Power Sour. 2015, 298, 144–149. [Google Scholar] [CrossRef]
  13. Goodenough, J.; Park, K. The Li-Ion Rechargeable Battery: A Perspective. J. Am. Chem. Soc. 2013, 135, 1167–1176. [Google Scholar] [CrossRef] [PubMed]
  14. Vasileiadis, A.; Klerk, N. Toward Optimal Performance and In-Depth Understanding of Spine-l Li4Ti5O12 Electrodes through Phase Field Modeling. Adv. Funct. Mater. 2018, 28, 1705992. [Google Scholar] [CrossRef]
  15. Sharma, N.; Peterson, V. Structural changes in a commercial lithium-ion battery during electr-ochemical cycling: An in situ neutron diffraction study. J. Power Sour. 2010, 195, 8258–8266. [Google Scholar] [CrossRef]
  16. Whittingham, M.S. Lithium Batteries and Cathode Materials. Chem. Rev. 2004, 104, 4271–4301. [Google Scholar] [CrossRef]
  17. Zhu, W.; Liu, D.Q. Phase Transformation of Doped LiCoPO4 during Galvanostatic Cycling. Materials 2020, 13, 3810. [Google Scholar] [CrossRef]
  18. Wang, A.; Hou, C. Exploration of the evolution of nanotechnology from a patent co-classification perspective. Nanotechnol. Rev. 2018, 7, 233–245. [Google Scholar] [CrossRef]
  19. Li, Z.; Xu, K. Recent development of Supercapacitor Electrode Based on Carbon Materials. Nanotechnol. Rev. 2019, 8, 35–49. [Google Scholar] [CrossRef] [Green Version]
  20. Luo, W.; Li, X. Synthesis and Characterization of Mg Substituted LiCoO2. J. Electrochem. Soc. 2010, 157, A782–A790. [Google Scholar] [CrossRef]
  21. Xu, H.J.; Deng, S.N. Improved electrochemical performance of Li1.2Mn0.54Ni0.13Co0.13O2 by Mg doping for lithium ion battery cathode material. J. Mater. Chem. A 2014, 2, 15015–15021. [Google Scholar] [CrossRef]
  22. An, J.; Shi, L.Y. Insights into the stable layered structure of a Li-rich cathode material for lithium-ion batteries. J. Mater. Chem. A 2017, 5, 19738–19744. [Google Scholar] [CrossRef]
  23. Antonio, E.G.; Ulissi, U. A Long-Life Lithium Ion Battery with Enhanced Electrode/Electrolyt-e Interface by Using an Ionic Liquid Solution. Chem. A Eur. J. 2016, 22, 6808–6814. [Google Scholar] [CrossRef]
  24. Van der Ven, A.; Aydinol, K. First-principles investigation of phase stability in LixCoO2. Phys. Rev. B. 1998, 58, 2975–2987. [Google Scholar] [CrossRef]
  25. Chen, Z.H.; Lu, Z.H. Staging Phase Transitions in LixCoO2. J. Electrochem. Soc. 2002, 149, A1604–A1609. [Google Scholar] [CrossRef]
  26. Dahéron, L.; Dedryvère, R. Electron Transfer Mechanisms upon Lithium Deintercalation from LiCoO2 to CoO2 Investigated by XPS. Chem. Mater. 2008, 20, 583–590. [Google Scholar] [CrossRef]
  27. Ohnishi, M.; Matsuoka, O. Investigation of the surface degradation of LiCoO2 particles in the cathode materials of Li-ion batteries using FIB-TOF-SIMS. J. Surf. Anal. 2013, 20, 99–110. [Google Scholar] [CrossRef]
  28. Liu, Q.; Su, X. Approaching the capacity limit of lithium cobalt oxide in lithium ion batteries via lanthanum and aluminium doping. Nat. Energy 2018, 3, 936–943. [Google Scholar] [CrossRef]
  29. Kresse, G.; Furthmüller, J. Efficient iterative schemes for ab initio total-energy calculations using a plane-wave basis set. Phys. Rev. B Condens. Matter Mater. Phys. 1996, 54, 11169–11186. [Google Scholar] [CrossRef]
  30. Blöchl, P.E. Projector augmented-wave method. Phys. Rev. B Condens. Matter. 1994, 50, 17953–17979. [Google Scholar] [CrossRef] [Green Version]
  31. Kresse, G.; Joubert, D. From ultrasoft pseudopotentials to the projector augmented-wave method. Phys. Rev. B 1999, 59, 1758–1775. [Google Scholar] [CrossRef]
  32. Perdew, J.P.; Burke, K. Generalized gradient approximation made simple. Phys. Rev. Lett. 1996, 77, 3865–3868. [Google Scholar] [CrossRef] [PubMed] [Green Version]
  33. Nityananda, R.; Hohenberg, P. Inhomogeneous electron gas. Resonance 2017, 22, 809–811. [Google Scholar] [CrossRef]
  34. Eschrig, H.; Seifert, G. Current density functional theory of quantum electrodynamics. Solid State Commun. 1985, 56, 777–780. [Google Scholar] [CrossRef]
  35. Melot, B.C.; Tarascon, J.M. Design and preparation of materials for advanced electrochemical storage. Acc. Chem. Res. 2013, 46, 1226–1238. [Google Scholar] [CrossRef]
  36. Xiang, Q.X.; Li, L. Inhibiting degradation of LiCoO2 cathode material by anisotropic strain during delithiation. Mater. Res. Express 2020, 7, 025501. [Google Scholar] [CrossRef]
  37. Amdouni, N.; Zarrouk, H. Structural and electrochemical properties of LiCoO2 and LiAlyCo1−yO2 (y=0.1 and 0.2) oxides: A comparative study of electrodes prepared by the citrate precursor route. Ionics 2003, 9, 47–55. [Google Scholar] [CrossRef]
  38. Xie, M.; Hu, T. Synthesis of high-voltage (4.7 V) LiCoO2 cathode materials with Al doping a-nd conformal Al2O3 coating by atomic layer deposition. RSC Adv. 2016, 6, 63250–63255. [Google Scholar] [CrossRef]
  39. Needham, S.A.; Wang, G.X. Synthesis and electrochemical performance of doped LiCoO2 materials. J. Power Sources 2007, 174, 828–831. [Google Scholar] [CrossRef]
Figure 1. The Coulombic efficiency of Li-ion coin-cell with LiCoO2 as cathode materials.
Materials 14 00242 g001
Figure 2. High resolution transmission electron microscope (HRTEM) images and structure analysis of LiCoO2 after 150 charging-discharging cycles under 4.3 V. (a) HRTEM image consists of LiCoO2, Co3O4 and amorphous region, (b) HRTEM image consist of LiCoO2, Co3O4, Co3O4 crystal nucleus and amorphous region, (c) FFT of the blue square selected region in (a); (d) inverse FFT of (c); (e) the atomic model of Co3O4 ( 1 ¯ 12 ) surface.
Materials 14 00242 g002
Figure 3. XPS of LiCoO2 after 150 charging-discharging cycles under 4.2 V.
Materials 14 00242 g003
Figure 4. (a) Schematic diagram of electrochemically driven phase transition path from LiCoO2 to Co3O4; (b) calculated potential barrier along the proposed electrochemically driven phase transition path from LiCoO2 to Co3O4.
Materials 14 00242 g004
Figure 5. Calculated density of states (DOS) and integrated DOS of LiCoO2.
Materials 14 00242 g005
Figure 6. (a) XRD patterns of doped and undoped LiCoO2. (b) Enlarged view of (003) peak. (c) Enlarged view of (104) peak.
Materials 14 00242 g006
Figure 7. (a) Cycling performance comparison; (b) The charge-discharge profiles of doped and undoped LiCoO2.
Materials 14 00242 g007
Table 1. The theoretical prediction, experimental results, and literature results of the cycling performance for doped LiCoO2.
Doping IonIon Radius (Å)EffectTheoretical PredictionExperimental ResultsLiterature Results
Al3+0.50Inhibit lattice expansionImprovedBetterBetter [37,38]
In3+0.81Promote lattice expansionDeterioratedWorse-
Mg2+0.72Inhibit oxidationImprovedBetterBetter [20]
Zr4+0.72Promote oxidationDeterioratedWorseWorse [39]
Co3+ (Reference)0.745Reference
Table 2. Calculated lattice parameters of doped LiCoO2, and their variation compared to the undoped LiCoO2.
Doped ElementLattice a (Å)ΔaLattice cΔc (Å)
Al2.8147(4)−0.051%14.0458(5)−0.042%
In2.8169(7)0.028%14.0569(3)0.037%
Mg2.8160(4)−0.005%14.0535(9)0.013%
Zr2.8159(6)−0.005%14.0493(5)−0.018%
undoped (Reference)2.8161(8)-14.0517(8)-
Publisher’s Note: MDPI stays neutral with regard to jurisdictional claims in published maps and institutional affiliations.