Abstract
The rolling contact fatigue of gear surfaces in a heavy loader gearbox is investigated under various working conditions using the critical plane-based multiaxial Fatemi–Socie criterion. The mechanism for residual stress to increase the fatigue initiation life is that the compressive residual stress has a negative normal component on the critical plane. Based on this mechanism, the genetic algorithm is used to search the optimum residual stress distribution that can maximize the fatigue initiation life for a wide range of working conditions. The optimum residual stress distribution is more effective in increasing the fatigue initiation life when the friction coefficient is larger than its critical value, above which the fatigue initiation moves from the subsurface to the surface. Finally, the effect on the fatigue initiation life when the residual stress distribution deviates from the optimum distribution is analyzed. A sound physical explanation for this effect is provided. This yields a useful guideline to design the residual stress distribution.
1. Introduction
The gearbox is the most important transmission system in many applications such as heavy equipment, automobiles, helicopters, wind turbines, etc. [1,2]. A key aspect in designing a gearbox is to prolong the gear tooth longevity. Rolling contact fatigue (RCF) that results from the cyclic rolling–sliding contact in the gear meshing pair is a common failure mode of the gear tooth surface [3]. It cannot be avoided and must occur as long as gears are operated long enough. RCF first leads to the initiation of fatigue microcracks. These microcracks then propagate and merge into multiple macrocracks, which can form pieces of material removed from the bulk, i.e., pitting. Pitting can accelerate tooth surface deterioration [4], cause transmission error [5], and increase vibration and noise [6], etc. Therefore, it is imperative to investigate the behavior of RCF.
Sharif et al. [7] investigated the influence of surface roughness on RCF under elastohydrodynamic (EHL) contact conditions. They pointed out that the ratio of the film thickness over the surface roughness is the key index of the fatigue performance. Li and Kahraman [8] proposed a novel model for the progression of pitting behavior in spur gear contacts. The novelty lies in the model’s capability of simultaneously considering various time-varying variables such as contact load, contact radii, and surface velocities. Paulson et al. [9] found that Hertzian pressure distribution, compared with EHL under the same contact loading, reduces fatigue life. Moreover, the material degradation affected the contact pressure distribution and somehow increased the fatigue life. Wang et al. [10,11] performed extensive finite element simulations of RCF in carburized gear surfaces and revealed that proper carburization process can improve the fatigue performance. Golmohammadi and Sadeghi [12] studied the effect of surface dents on RCF and found that a dent of sharp edge and high pile-up can significantly deteriorate the fatigue performance.
The work in [7,8,9,10,11,12] provided useful insights into RCF. Unfortunately, they ignored the residual stress (RS) induced by shot peening, which is an essential treatment to enhance the fatigue performance in gear manufacturing (see Figure 1, where the typical RS distribution induced by shot peening is shown [13]). Liu et al. [14] revealed that compressive residual stress (CRS) can increase fatigue initiation life in contrast to tensile residual stress (TRS). Paladugu and Hyde [15] additionally considered the material microstructure under dry and lubricated conditions and confirmed the conclusion in [14]. Wang et al. [16] compared TRS and CRS of the same magnitude and found that the decrease in fatigue initiation life induced by TRS is four times the increase by CRS. Xu et al. [17] presented a model to predict the initiation and propagation of cracks due to RCF and showed that the prediction considering residual stresses is in better agreement with the experiments. Ooi et al. [18] theoretically and experimentally demonstrated that the effect of residual stress on the RCF life of carburized AISI 8620 steel varies with the percentage of restrained austenite.
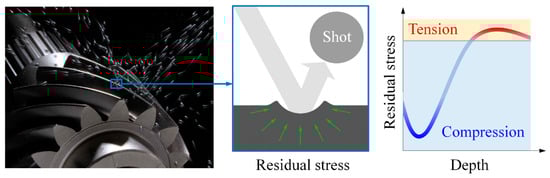
Figure 1.
Shot peening in gear manufacturing and typical residual stress (RS) distribution.
Although RS was included in the investigation of RCF in [14,15,16,17,18], the effect of the distribution of residual stress was not addressed. Guan et al. [19] and Zhang et al. [20] examined the effect of CRS distribution resulting from different shot peening processes and pointed out the potential of tailoring CRS distribution to improve the fatigue performance. However, no further study on this issue was carried out. Walvekar and Sadeghi [21] studied the effect of CRS distributions through a parametric study and demonstrated the dependence of fatigue performance on variables associated with the CRS distribution profile, such as the depth and magnitude of the peak CRS and the CRS layer thickness (see Figure 1). Morris et al. [22] included the effect of material microstructure and reported that higher CRS near the surface results in deeper initiation of fatigue cracks, which therefore enhances the fatigue performance.
As can be seen from the above literature review, relevant works addressing the effect of RS distribution [19,20,21,22] have provided useful information for the RS distribution design. However, they only considered the effect of a single variable of the distribution profile. No efforts were made to optimize the RS distribution to obtain the best fatigue performance. Therefore, the current study adopts a genetic-algorithm-based optimization scheme to search for the optimum RS distribution. Based on the optimization results, some recommendations for the RS distribution design are provided. As an example, this work is performed for the surfaces of gears used in the gearbox of a heavy loader.
2. Residual Stress Distribution
The components of residual stress are depicted in Figure 2a. Both normal components in the x and z directions exhibit identical distributions, while the component in the y direction is small enough to be ignored [23]. The typical RS distribution along the depth (see, e.g., [13]) induced by shot peening is shown in Figure 1. However, the distribution is too complex and requires too many variables to define its profile. This disables efficient optimization of RS distribution (introduced in Section 5). Thus, as was done in [21], the distribution profile is simplified by ignoring the detrimental TRS and assuming the profile to consist of straight lines, as shown in Figure 2b. This simplification reduces the number of variables of the distribution profile without losing the basic features of the RS distribution. The design variables for the optimization of the RS distribution profile are as follows:
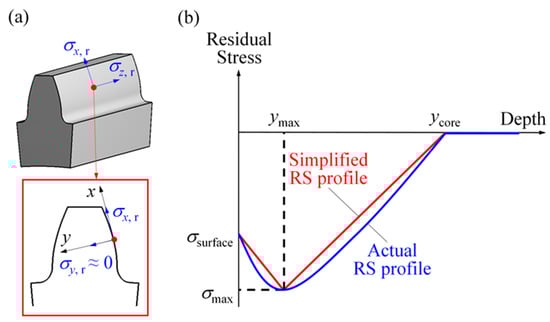
Figure 2.
(a) RS components demonstrated on a gear tooth and (b) a simplified RS distribution profile along the depth.
- (1)
- σsurface—the RS at the surface;
- (2)
- σmax—the peak RS;
- (3)
- ymax—the depth of σmax;
- (4)
- ycore—the depth where RS vanishes.
The values of these variables can be controlled to formulate different RS distributions by adjusting shot peening process parameters such as the shot velocity, shot size, coverage, etc. [24].
3. Gear Contact Model
Figure 3a presents the contact problem in a pair of meshing gears used in the 157 kW gearbox of a heavy loader. The geometry and material properties of the gears are presented in Table 1. The contact of a helical gear pair is equivalent to that of a tapered roller and a deformable half-space, to which the solution can be found in [25]. The present study focuses on the methodology for the design of RS distribution. The methodology itself is universal and valid for any type of gear. Therefore, for the convince of demonstrating this methodology, the helix angle is not considered and both the pinion and gear are regarded as spur gears, the simplest type of gear. The contact of meshing teeth is equivalent to that of two cylinders of varying radii (indicated by two dashed arcs), which depends on the position of the meshing point on the line of action (LOA). Since the gear contact is elastic, the contact of two cylinders can be simplified as that of a rigid cylinder of equivalent radius R and a deformable half-space of equivalent Young’s modulus E* in plane strain condition [23], as shown in Figure 3b.
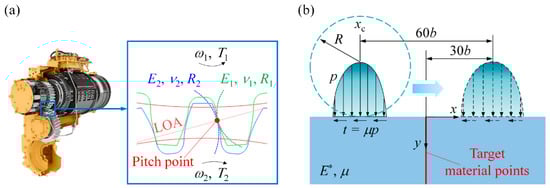
Figure 3.
(a) The meshing gear pair in a heavy loader gearbox and (b) the simplified contact model.

Table 1.
Gear pair parameters.
The contact model in Figure 3b aims to simulate the contact in the region close to the pitch point, where it is more susceptible to RCF since there is only one pair of teeth in contact [26]. Thus, the rated meshing force per unit length Prated = 423 N/mm, which can be easily obtained using the parameters in Table 1 [27], is the normal contact load. To gain basic physical insights, the variation of R is ignored and R = 15.231 mm at the pitch point is used for the rigid cylinder. Due to the involute geometry, the gear surface is subjected to rolling–sliding contact. This type of contact loading can be represented by Hertzian pressure with shear traction:
where p is the normal pressure, P is the applied normal load, xc is the x-coordinate of the normal pressure center, b = (4PR/(πE*))0.5 is the half contact width, t is the shear traction, and μ is the friction coefficient ranging from 0 to 0.3, representing ideally lubricated to dry friction conditions.
The analytical solution for the stress/strain field in the half-space was provided in [28] (see Appendix A). When the RS distribution is incorporated in the half-space, it can be demonstrated that the deformation in the half-space is still elastic and the RS distribution is not altered as the number of loading cycles increases. Therefore, the RS distribution can be directly added to the stress solution provided in [28] to obtain the stress field with the presence of RS. Since material points at the same depth are subjected to the same loading cycle, the fatigue analysis will be conducted only for target points at x = 0 (see the red line in Figure 3b). xc is varied from −30b to 30b so that the pressure profile moves over a sufficiently long distance to ensure that the material points at x = 0 undergo a complete loading cycle.
4. Fatemi–Socie Multiaxial Fatigue Criterion
The complex multiaxial stress state exists in the half-space subjected to rolling–sliding contact. Moreover, this kind of contact loading is a typical non-proportional loading that results in stress components varying non-proportionally during the loading process, i.e., the principal directions constantly change. To analyze the RCF, a proper multiaxial fatigue criterion that takes the effect of the loading non-proportionality into account is needed. The critical plane-based Fatemi–Socie fatigue criterion [29] showed good agreement between the predicted and experimental results in RCF in gears [30] and was adopted extensively in many theoretical studies on gear RCF (see, e.g., [14]). Therefore, this criterion is also used in the present study.
The Fatemi–Socie fatigue criterion states that a fatigue microcrack at a material point is initiated along the critical plane that has the maximum shear strain range over a loading cycle. However, each material point usually has multiple critical planes. In this case, the fatigue microcrack occurs along the critical plane with the maximum fatigue damage. The fatigue damage of one material point on an arbitrary plane can be quantified by the Fatemi–Socie damage parameter (FSDP) as follows:
where Δγ and σn,max are the maximum shear strain range and maximum normal stress on this plane over one loading cycle, respectively; Y is the material yield strength, and k is a fitting parameter ranging from 0 to 1 [31]. For high cycle fatigue, which is the case in the present study, k approaches unity. Thus, k = 1 is adopted. The normal stress component is included to consider the fact that compressive stress tends to retard fatigue microcrack initiation while tensile stress accelerates the initiation. The maximum FSDP on all the critical planes is denoted by DFS. The fatigue initiation life Nf of a material point is related to DFS by:
where Nf is the number of loading cycles when the fatigue microcrack is initiated; G = E/(2 + 2ν); and are the shear fatigue strength coefficient and the shear fatigue ductility coefficient, respectively; m and n are the fatigue strength exponent and the fatigue ductility exponent, respectively. = 1296 MPa, = 0.437, m = −0.087, and n = −0.58. Note that temperature may have an impact on the above parameters. However, this is not considered since this paper only focuses on demonstrating the methodology for the design of RS distribution. One can easily incorporate a temperature-dependent fatigue citation in the proposed methodology to obtain a temperature-dependent optimum RS distribution.
Figure 4a shows a flow chart that illustrates the procedure to predict DFS and Nf for one material point. The critical plane needs to be first identified. To this end, the stress–strain history over a loading cycle for a material point should be obtained. This can be done by taking the coordinates of this point into Equations (A1)–(A7) and varying xc from −30b to 30b. Then, all the candidate planes that pass this point are examined to find the critical plane. Each candidate plane is characterized by the angle α between its normal direction and the x-axis (see Figure 4b), ranging from 0° to 180° with intervals of 0.2°. The stress–strain components on each candidate plane can be obtained by coordinate transformation.
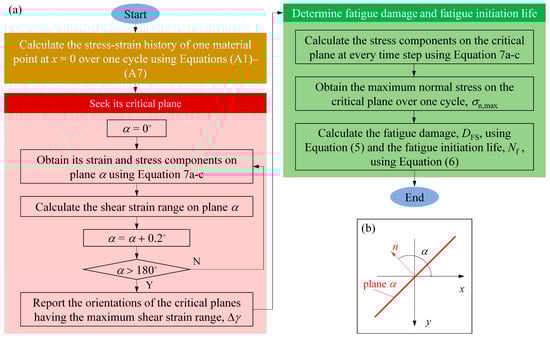
Figure 4.
(a) The numerical procedure to determine DFS and Nf of a material point and (b) the definition of plane orientation α.
Each candidate plane’s Δγ and σn,max can thus be obtained. Then, the critical planes can be determined. DFS is the largest FSDP among all the critical planes. Finally, the fatigue initiation life of this point, Nf, can be calculated using Equation (6).
5. Optimization Scheme
The genetic algorithm (GA) is an optimization methodology inspired by the “survival of the fittest” rule in the theory of evolution. It is an efficient and robust method to solve complex optimization problems [32,33,34,35]. In gear-related problems, it has been used to optimize the tooth profile [35], maintain the reliability of gear transmission [36], and improve the load-sharing performance of planetary gears [37]. In this paper, the GA is used to search for the optimum RS distribution that maximizes the fatigue initiation life of the gear surface, which is (Nf)min, i.e., the minimum Nf among all the points. Since (Nf)min increases with decreasing (DFS)max according to Equation (6), the objective of this optimization problem is to minimize (DFS)max. As can be seen from Figure 2, σsurface, σmax, ymax, and ycore are the four design variables for the optimization, and thus, the constraints are applied on these four variables.
The mathematical description of this optimization problem is as follows:
where x = (σsurface, σmax, ymax, ycore) is called an individual in GA. Each component of the individual is called a “gene”. The constraints in Equation (8b–g) are summarized from the existing experimental [38,39,40,41] and theoretical [13,42] results for RS distribution profiles produced using the shot peening process.
The basic steps in the GA [43] are illustrated by the flow chart in Figure 5.
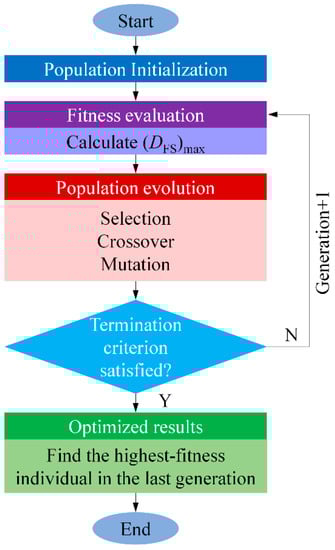
Figure 5.
Basic steps in the genetic algorithm (GA).
Step 1: Population initialization. Generate a random initial population containing N individuals that satisfy the constraints in Equation (8b–g).
Step 2: Fitness evaluation. Calculate (DFS)max for each individual and use 1/(DFS)max to measure its fitness. Individuals having higher fitness are more likely to survive.
Step 3: Population evolution. Three genetic operators are needed for population evolution to select and generate individuals with high fitness and eliminate those with low fitness. The selection operator is first applied to specify individuals of higher fitness as parents for the next generation. Then, two parents exchange one or multiple genes and generate two new individuals using the crossover operator. The crossover fraction, Pc, decides how many individuals are generated in the next generation. Finally, genes of individuals are altered randomly using the mutation operator.
Step 4: Termination. The optimization process is terminated once one of the following two criteria is satisfied:
- (1)
- The generation number reaches the prescribed upper limit Gmax;
- (2)
- The relative change in the highest fitness over Gs generations is less than the function tolerance value e.
The optimum solution is the individual with the highest fitness in the last generation. The input parameters for the GA are listed in Table 2.
Table 2.
Parameters of the genetic algorithm.
6. Results and Discussion
6.1. Mechanism for RS to Increase (Nf)min
As mentioned, since the fatigue damage along the x-axis direction exhibits a uniform distribution, fatigue analysis was performed for material points at x = 0. Figure 6 shows the shear strain range Δγ, the maximum normal stress over a loading cycle σn,max, and the FSDP on all the candidate planes (0° ≤ α ≤ 180°) of material points at x = 0 for three working conditions where P/Prated = 1 with μ = 0, 0.1, and 0.3 without the presence of RS. These results are normalized by their maximum absolute values. The critical planes of each material point along the depth are denoted by the solid cyan lines in the Δγ and FSDP distribution.
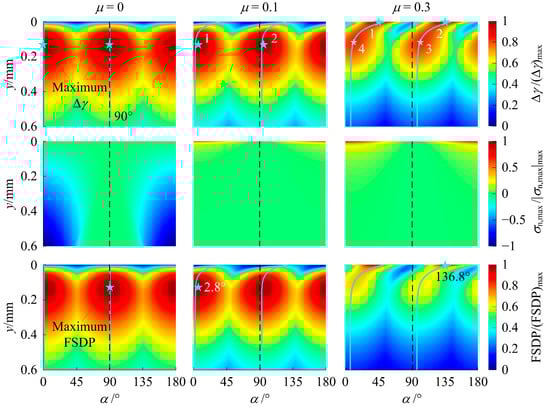
Figure 6.
The contour of Δγ/Δγmax, σn,max/|σn,max|max and the Fatemi–Socie damage parameter (FSDP)/(FSDP)max for P/Prated = 1 and μ = 0, 0.1, and 0.3.
As would be expected from the theory of elasticity [44], each point has two critical planes with equal maximum Δγ. These two planes have an α with a difference of 90°. For μ = 0, the critical plane orientations are independent of the depth. For μ ≠ 0, they depend on the depth due to the shear traction induced by friction. The effect of shear traction decays with increasing depth. The effect of σn,max on the fatigue damage is demonstrated by the difference between the distributions of Δγ and FSDP. σn,max is compressive for μ = 0 and tensile for μ ≠ 0. For μ = 0 and 0.1, the effect of σn,max is negligible. Due to the mild friction on the surface, the maximum damage occurs below the surface. On the other hand, for μ = 0.3, the effect of σn,max is appreciable and the high friction gives rise to the maximum damage appearing on the surface. For all the three cases (P/Prated = 1; μ = 0, 0.1, and 0.3), since the σn,max distribution over α is not uniform, the FSDP on the two critical planes is different according to Equation (5). Thus, there is only one critical plane having the largest FSDP (i.e., DFS) and the orientation of the critical plane corresponding to DFS is denoted by αc.
Figure 7 shows a typical RS distribution and the normal component σn,r introduced by this RS distribution on all candidate planes. The σn,r distribution in Figure 7b can be added to the σn,max distribution without RS in Figure 6 to obtain the new σn,max distribution with RS. In this way, the FSDP distribution can be changed by RS. Nonetheless, there is an exception that when αc is close to 90° (see Figure 6, μ = 0), Nf will remain unchanged since RS will have zero normal components on the αc plane and will not be able to decrease DFS in such a case.
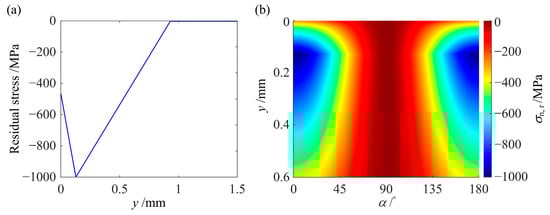
Figure 7.
(a) A typical RS distribution profile and (b) the contour of σn,r resulting from this RS distribution.
Figure 8a presents the DFS distributions along the depth for different μ under the rated normal load. It is of interest to decrease (DFS)max so that (Nf)min can be increased. From Figure 8a, as μ increases, the location of (DFS)max moves from the depth of around 0.13 mm to the surface. μc can be defined as the critical friction coefficient. For μ < μc, the location of (DFS)max is below the surface. For μ > μc, the location of (DFS)max is on the surface. It should be noted that the DFS distributions for different normal loadings ranging from 0.5Prated to 1.5Prated share similar profiles. For this reason, Figure 8a is only shown for a fixed normal load with different μ and μc = 0.23 is independent of normal loading.
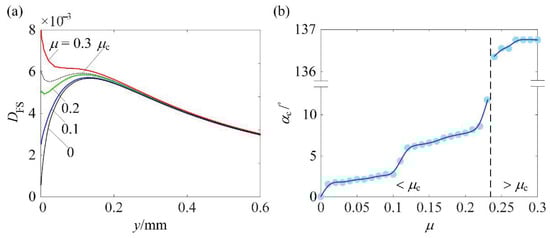
Figure 8.
(a) DFS distribution along the depth for P/Prated = 1, μ = 0.1, 0.2, and 0.3, and (b) αc as a function of μ.
Figure 8b presents αc associated with (DFS)max as a function of μ under the rated normal load. For 0 < μ ≤ 0.3, αc associated with (DFS)max is not close to 90°. This provides the solid theoretical basis that (DFS)max can be decreased or (Nf)min can be increased by introducing a proper RS distribution. Since there are four variables to define the RS distribution profile, the optimum RS distribution that can maximize (Nf)min was sought using the optimization scheme introduced in the previous section.
6.2. Increase in (Nf)min Induced by the Optimum RS Distribution
Figure 9a presents the percentage increase in (Nf)min induced by the optimum RS distribution compared to the case without RS. From the discussion on Figure 8, the DFS distribution depends on the working condition and so does the optimum RS distribution. Thus, the percentage increase in (Nf)min varies with the working condition. As the normal loading and μ increase, the percentage increase in (Nf)min increases. Compared with the increasing normal loading, μ has a higher impact on the percentage increase in (Nf)min. Moreover, when μ > μc, the percentage increase in (Nf)min is dramatically higher than that when μ < μc.
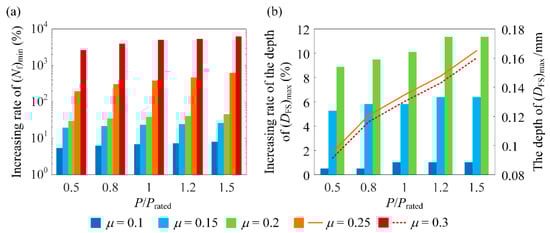
Figure 9.
(a) The percentage increase in (Nf)min, and (b) the percentage increase in the depth of (DFS)max for μ = 0.1, 0.15, and 0.2 (left vertical axis) and the depth of (DFS)max for μ = 0.25 and 0.3 (right vertical axis) when the optimum RS distribution is introduced compared to the case without RS.
Figure 9b presents the percentage increase in the depth of (DFS)max induced by the optimum RS distribution for μ < μc. For μ > μc, (DFS)max moves from the surface to the subsurface. In this case, the depth of (DFS)max when the optimum RS distribution is applied is presented. The increase in the depth of (DFS)max is beneficial in increasing the propagation life since more loading cycles are needed for the fatigue microcrack to propagate to the surface before a pitting particle is formed [14]. Provided that the relation between the depth of (DFS)max and the propagation life is quantified, the RS distribution can be optimized to maximize the sum of the initiation life, (Nf)min, and propagation life. Nonetheless, this is out of the scope of the present study.
Figure 9a demonstrates that the optimum RS distribution, which is obtained using the GA, can indeed substantially increase (Nf)min. Theoretically speaking, the shot peening process parameters can be adjusted to achieve the optimum RS distribution. However, in engineering practice, it is almost impossible to precisely achieve the optimum RS distribution in this way. Thus, it is desired that the optimum RS distribution can be varied to some extent while (Nf)min is not sacrificed too much. By this means, it is more apt to adjust the shot peening process parameters to obtain an acceptable RS distribution and achieve a satisfying (Nf)min. To this end, it is necessary to investigate how the variables of the RS distribution profile affect (Nf)min when they deviate from those of the optimum distribution.
6.3. Effect on (Nf)min When the RS Distribution Deviates from the Optimum
Since the optimum RS distribution depends on the DFS distribution, which has a weak dependence on the normal load P, the effect on (Nf)min when the RS distribution deviates from the optimum is also weakly dependent on P. In light of this, the optimum RS distributions under investigation are those for fixed P with different μ. Figure 10 shows the optimum RS stress distribution for P/Prated = 1 and μ = 0.1, 0.2, and 0.3. The optimum distributions exhibit two common features. They all have nearly the same (ymax)opt of 0.5b, which is the depth of the maximum Δγ [21], and the same (σmax)opt = −1000 MPa, which is the lower limit of σmax. (σsurface)opt and (ycore)opt do not exhibit a simple dependence on μ since they do not monotonically increase or decrease with μ. The effect on (Nf)min when the RS distribution deviates from the optimum shall be investigated by deviating a single component of (σsurface, σmax, ymax, and ycore) from its corresponding optimum value.
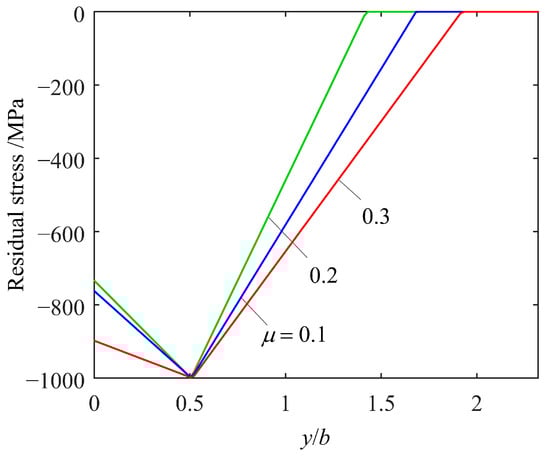
Figure 10.
The optimum RS distribution along the depth for P/Prated = 1 and μ = 0.1, 0.2, and 0.3.
Figure 11 shows the percentage decrease in (Nf)min when ymax and ycore deviate from their optimum values. As can be seen from Figure 11a, the deviation from (ymax)opt causes a slight decrease in (Nf)min. As μ increases, (Nf)min becomes more sensitive to the deviation of ymax. From Figure 11b, it can be seen that the deviation of ycore almost has no effect on (Nf)min. Figure 12 shows and explains the effect on (Nf)min when σsurface deviates from (σsurface)opt. As can be seen from Figure 12a, for relatively low μ, deviation of σsurface does not affect (Nf)min since (DFS)max occurs in the subsurface. However, for μ = 0.3, (Nf)min is very sensitive to the deviation of σsurface unless σsurface/(σsurface)opt becomes larger than 0.96. This can be explained by Figure 12b. As |σsurface| increases, (DFS)max, which appears on the surface, decreases and the location of (DFS)max moves from the surface to the subsurface when σsurface/(σsurface)opt reaches 0.96. Thereafter, (DFS)max in the subsurface is not affected by σsurface and neither is (Nf)min.
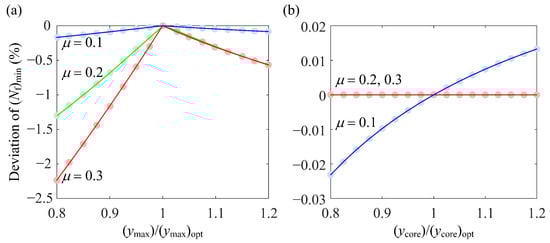
Figure 11.
The percentage decrease in (Nf)min when (a) ymax and (b) ycore deviate from their optimum values for P/Prated = 1 and μ = 0.1, 0.2, and 0.3.
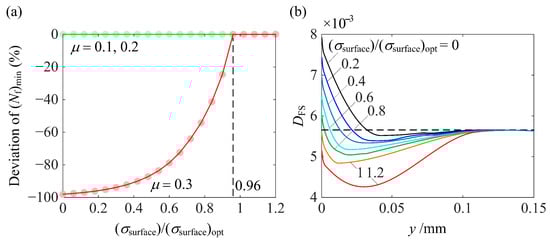
Figure 12.
(a) The percentage decrease in (Nf)min for P/Prated = 1 and μ = 0.1, 0.2, and 0.3 and (b) the variation of the DFS distribution along the depth for P/Prated = 1 and μ = 0.3 when σsurface deviates from (σsurface)opt.
As shown in Figure 10, (σmax)opt for all the three cases reached its lower limit, −1000 MPa. To investigate the effect on (Nf)min when σmax deviates from (σmax)opt, σmax has to be increased. However, since the constraint in Equation (8b) must be satisfied, increasing σmax should be coupled with increasing σsurface. To this end, we simply increased both σmax and σsurface by the same amount from (σmax)opt and (σsurface)opt, respectively. In this way, the effect of deviation of σmax was studied. Figure 13 shows (Nf)min and the orientation of the critical plane corresponding to (DFS)max, αc, as functions of |σmax| for four values of μ. The effect of deviation of σmax on (Nf)min is salient in agreement with the experimental results reported in [45,46,47] that the peak RS plays a major role in the fatigue performance.
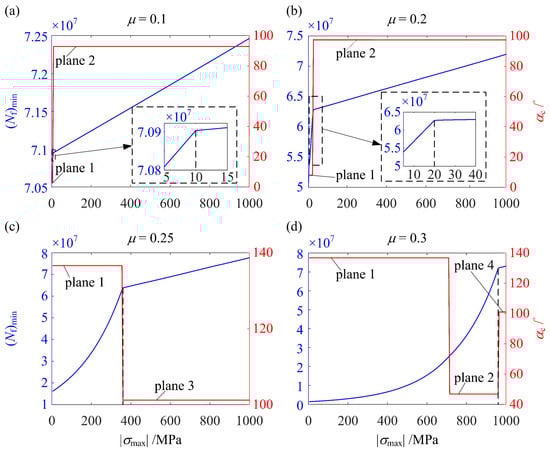
Figure 13.
The effect on (Nf)min and αc when σmax deviates from (σmax)opt = −1000 MPa for P/Prated = 1 and (a) μ = 0.1, (b) μ = 0.2, (c) μ = 0.25, and (d) μ = 0.3.
For μ < μc, the location of (DFS)max remains in the subsurface. As shown in Figure 6 (μ = 0.1), the material point at this location has two critical planes of maximum Δγ, which are denoted as planes 1 and 2 with orientations of α1 and α2 close to 0° and 90°, respectively. Initially, without RS, i.e., |σmax| = 0, plane 1 has a higher σn,max than plane 2 (see Figure 6). According to Equations (5) and (6), the FSDP on plane 1 is larger and is thus equal to (DFS)max. Consequently, αc = α. Since the magnitude of the negative normal component of RS on plane 1 is larger than on plane 2 (see Figure 7b), as |σmax| increases, the FSDP on plane 1 decreases faster and is exceeded by the FSDP on plane 2. As a result, the FSDP on plane 2 becomes (DFS)max so that αc switches to α2. This results in the two distinct stages of (Nf)min vs. |σmax| in Figure 13a,b.
For μ ≥ μc, the location of (DFS)max moves from the surface to the subsurface as |σmax| increases. As shown in Figure 6 (μ = 0.3), when (DFS)max is on the surface, the two critical planes of maximum Δγ of the material point at the location of (DFS)max are denoted as planes 1 and 2. When (DFS)max moves to the subsurface, the counterparts of planes 1 and 2 are denoted by planes 3 and 4. As can be seen, since α1 ≈ 45° and α2 ≈ 135°, the negative normal component on planes 1 and 2 are almost the same (see Figure 7b). This results in almost identical FSDP vs. |σmax| for these two planes. Thus, unlike Figure 13a,b, the switch of αc from α2 to α1 (see Figure 13d) is not reflected as the deflection on the curve of (Nf)min vs. |σmax|. Therefore, the two distinct stages of (Nf)min vs. |σmax| in Figure 13c,d result from the change in the location of (DFS)max, which is different from the case of μ < μc in Figure 13a,b.
Despite the reason leading to the two distinct stages of (Nf)min vs. |σmax| being different for μ < μc and μ ≥ μc, it is interesting to investigate |σmax,t|, at which the two stages are divided. As demonstrated in Figure 14, |σmax,t| increases with μ significantly faster when μ > μc. The increasing rates of (Nf)min with |σmax| before and after |σmax,t| are also presented in this figure. For μ < μc, (Nf)min vs. |σmax| is bilinear and the increasing rate is thus the slope. For μ ≥ μc, (Nf)min vs. σmax is nonlinear when |σmax| < |σmax,t|. Thus, the increasing rate is obtained as the average of ∂(Nf)min/∂|σmax| over 0 < |σmax| < |σmax,t| for qualitative analysis. In general, the increasing rate of (Nf)min with |σmax| when |σmax| < |σmax,t| is higher. This indicates that a further increase in |σmax| over |σmax,t| becomes less effective in increasing (Nf)min. This theoretical finding is in accordance with experimental results showing that RS induced by additional shot peening is less effective in preventing fatigue in 17NiVrMo6-4 steel [48,49] and Austempered ductile iron [50].
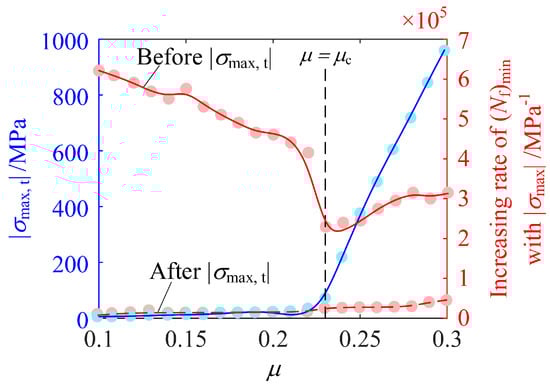
Figure 14.
|σmax,t| and the increasing rate of (Nf)min with |σmax| before and after |σmax,t| as functions of μ.
The results presented in Figure 13 and Figure 14 provide useful information on the effect on (Nf)min when σmax deviates from (σmax)opt. It is true that the ideal scenario is that |σmax| = |(σmax)opt| = 1000 MPa. However, a higher |σmax| requires higher shot velocity that leads to higher surface roughness. Moreover, when |σmax| > |σmax,t|, it becomes less effective in increasing (Nf)min by increasing |σmax|. This is especially problematic for the case of low μ, where αc is close to 90° (see Figure 13a). In this case, the negative component of RS on this critical plane is trivial and the increasing rate of (Nf)min with |σmax| is also very slow. Therefore, when one tries to increase (Nf)min by increasing |σmax|, he may need to comprehensively consider the slowing increasing rate of (Nf)min with |σmax| and the increasing surface roughness.
7. Conclusions
An RCF analysis based on the multiaxial Fatemi–Socie fatigue criterion was conducted for gear surfaces in a heavy loader gearbox under various working conditions with different combinations of meshing force and friction coefficient. The effect of RS on the fatigue performance was intensively studied. As μ increases, the fatigue initiation location moves from the subsurface to the surface. The μ at which this transition occurs was defined as μc. The mechanism for RS to increase the fatigue initiation life is that the compressive RS has a negative component on the critical plane and, thus, suppresses the fatigue damage.
The RS distribution, simplified as a piecewise bilinear function of the depth to the surface, is described by four variables, including ysurface, ycore, σmax, and σsurface. The optimum RS distribution that can increase the fatigue initiation life of the gear surface (Nf)min to the maximum was sought using the GA. The optimum RS distribution is not universal but depends on the working condition. It was demonstrated that the optimum RS distribution can substantially increase (Nf)min under a wide range of working conditions. This improvement in fatigue performance is more significant for higher μ. Another unexpected benefit brought by the optimum RS distribution is that the fatigue initiation occurs at a deeper depth, which increases the fatigue propagation life.
In practice, it is difficult to exactly achieve the optimum RS distribution by adjusting shot peening process parameters. Thus, it is important to explore to what extent modifications can be made on the optimum distribution without too much sacrificing of (Nf)min. It was found that for any μ, be it larger or smaller than μc, the deviation of ycore and ymax from their optimum values has a negligible effect on (Nf)min. On the other hand, σmax has a salient effect and |σmax| should be as large as possible. However, in practice, a cautious decision should be made since increasing |σmax| increases surface roughness and can have a trivial effect on increasing (Nf)min when μ is low or |σmax| > |σmax,t|. The effect of the deviation of σsurface depends on μ. For μ < μc, σsurface has no effect. For μ > μc, σsurface should be close to (σsurface)opt, leaving little room for acceptable deviation of σsurface. This information can serve as a general guidance on RS distribution design by properly modifying the optimum one obtained from GA optimization.
Author Contributions
Conceptualization, Z.C. and Y.J.; funding acquisition, Z.T. and S.T.; investigation, Z.C. and Y.J.; methodology, Z.C.; software, Y.J.; supervision, Z.T. and S.T.; visualization, Z.C. and Y.J.; writing—original draft preparation, Z.C.; writing—review and editing, Z.C., Y.J., Z.T. and S.T. All authors have read and agreed to the published version of the manuscript.
Funding
This research was funded by the National Key R&D Program of China (2019YFB2004604), the National Natural Science Foundation of China (52075481), and the Zhejiang Provincial Natural Science Foundation of China (LR19E050002).
Data Availability Statement
The data presented in this study are available on request from the corresponding author.
Conflicts of Interest
The authors declare no conflict of interest.
Nomenclature
| critical plane | The plane that has the maximum shear strain range over a loading cycle |
| FSDP | Fatemi–Socie damage parameter |
| RS | Residual stress |
| DFS | The maximum FSDP on all the critical planes of a material point |
| (DFS)max | The maximum DFS of all material points |
| Nf | Fatigue initiation life of a material point |
| (Nf)min | Minimum fatigue initiation life of all material points or fatigue initiation life of the gear surface |
| α | Plane orientation |
| αc | The orientation of the critical plane corresponding to DFS |
| Δγ | The maximum shear strain range on a plane over a loading cycle |
| σn,max | Maximum normal stress on a plane over a cycle |
| σsurface | RS at the surface |
| σmax | Peak RS |
| ymax | Depth of σmax |
| ycore | Depth where RS vanishes |
| σmax,t | The transition value for σmax |
| Subscripts | |
| opt | Values associated with the optimum RS distribution |
| 1, 2, 3, … | Values associated with plane 1, 2, 3, … |
Appendix A
Hills et al. [28] provided the analytical solution for the stress field in the half-space subjected to Hertzian loading with shear traction, as shown in Figure 3b. At the surface,
where pm = (4E*P/(πR))0.5 is the maximum Hertizian pressure (see Equation (3)) and x′ = (x − xc)/b. In the subsurface,
where y′ = y/b and s is a function of x′ and y′.
The strain field can be obtained using Equations (A1)–(A7) and Hooke’s law.
References
- Jiang, G.; He, H.; Yan, J.; Xie, P. Multiscale convolutional neural networks for fault diagnosis of wind turbine gearbox. IEEE Trans. Ind. Electron. 2018, 66, 3196–3207. [Google Scholar] [CrossRef]
- Liu, J. A dynamic modelling method of a rotor-roller bearing-housing system with a localized fault including the additional excitation zone. J. Sound Vib. 2020, 469, 115144. [Google Scholar] [CrossRef]
- Mechanism of Gear Tooth Failures; American Gear Manufacturing Association: Alexandria, VA, USA, 2004.
- Kundu, P.; Darpe, A.K.; Kulkarni, M.S. An ensemble decision tree methodology for remaining useful life prediction of spur gears under natural pitting progression. Struct. Health Monit. 2020, 19, 854–872. [Google Scholar] [CrossRef]
- Doğan, O.; Karpat, F. Crack detection for spur gears with asymmetric teeth based on the dynamic transmission error. Mech. Mach. Theory 2019, 133, 417–431. [Google Scholar] [CrossRef]
- Luo, Y.; Baddour, N.; Liang, M. Dynamical modeling and experimental validation for tooth pitting and spalling in spur gears. Mech. Syst. Signal Process. 2019, 119, 155–181. [Google Scholar] [CrossRef]
- Sharif, K.; Evans, H.; Snidle, R. Modelling of elastohydrodynamic lubrication and fatigue of rough surfaces: The effect of lambda ratio. Proc. Inst. Mech. Eng. Part J J. Eng. Tribol. 2012, 226, 1039–1050. [Google Scholar] [CrossRef]
- Li, S.; Kahraman, A. A micro-pitting model for spur gear contacts. Int. J. Fatigue 2014, 59, 224–233. [Google Scholar] [CrossRef]
- Paulson, N.R.; Sadeghi, F.; Habchi, W. A coupled finite element EHL and continuum damage mechanics model for rolling contact fatigue. Tribol. Int. 2017, 107, 173–183. [Google Scholar] [CrossRef]
- Wang, W.; Liu, H.; Zhu, C.; Jinyuan, T.; Jiang, C. Evaluation of contact fatigue risk of a carburized gear considering of mechanical properties. Friction 2019. [Google Scholar] [CrossRef]
- Wang, W.; Liu, H.; Zhu, C.; Sun, Z. Evaluation of contact fatigue life of a wind turbine carburized gear considering gradients of mechanical properties. Int. J. Damage Mech. 2019, 28, 1170–1190. [Google Scholar] [CrossRef]
- Golmohammadi, Z.; Sadeghi, F. A Coupled Multibody Finite Element Model for Investigating Effects of Surface Defects on Rolling Contact Fatigue. J. Tribol. 2019, 141. [Google Scholar] [CrossRef]
- Jebahi, M.; Gakwaya, A.; Lévesque, J.; Mechri, O.; Ba, K. Robust methodology to simulate real shot peening process using discrete-continuum coupling method. Int. J. Mech. Sci. 2016, 107, 21–33. [Google Scholar] [CrossRef]
- Liu, H.; Liu, H.; Zhu, C.; He, H.; Wei, P. Evaluation of Contact Fatigue Life of a Wind Turbine Gear Pair Considering Residual Stress. J. Tribol. 2018, 140, 041102. [Google Scholar] [CrossRef]
- Paladugu, M.; Hyde, R.S. Influence of microstructure on retained austenite and residual stress changes under rolling contact fatigue in mixed lubrication conditions. Wear 2018, 406–407, 84–91. [Google Scholar] [CrossRef]
- Wang, W.; Liu, H.; Zhu, C.; Du, X.; Tang, J. Effect of the residual stress on contact fatigue of a wind turbine carburized gear with multiaxial fatigue criteria. Int. J. Mech. Sci. 2019, 151, 263–273. [Google Scholar] [CrossRef]
- Xu, X.; Lai, J.; Lohmann, C.; Tenberge, P.; Weibring, M.; Dong, P. A model to predict initiation and propagation of micro-pitting on tooth flanks of spur gears. Int. J. Fatigue 2019, 122, 106–115. [Google Scholar] [CrossRef]
- Ooi, G.T.C.; Roy, S.; Sundararajan, S. Investigating the effect of retained austenite and residual stress on rolling contact fatigue of carburized steel with XFEM and experimental approaches. Mater. Sci. Eng. A 2018, 732, 311–319. [Google Scholar] [CrossRef]
- Guan, J.; Wang, L.; Mao, Y.; Shi, X.; Ma, X.; Hu, B. A continuum damage mechanics based approach to damage evolution of M50 bearing steel considering residual stress induced by shot peening. Tribol. Int. 2018, 126, 218–228. [Google Scholar] [CrossRef]
- Zhang, Y.; Qu, S.; Lu, F.; Lai, F.; Ji, V.; Liu, H.; Li, X. Microstructures and rolling contact fatigue behaviors of 17Cr2Ni2MoVNb steel under combined ultrasonic surface rolling and shot peening. Int. J. Fatigue 2020, 141, 105867. [Google Scholar] [CrossRef]
- Walvekar, A.A.; Sadeghi, F. Rolling contact fatigue of case carburized steels. Int. J. Fatigue 2017, 95, 264–281. [Google Scholar] [CrossRef]
- Morris, D.; Sadeghi, F.; Chen, Y.C.; Wang, C.; Wang, B. Effect of residual stresses on microstructural evolution due to rolling contact fatigue. J. Tribol. 2018, 140, 061402. [Google Scholar] [CrossRef]
- Johnson, K.L. Contact Mechanics; Cambridge University Press: Cambridge, UK, 1985; ISBN 9781139171731. [Google Scholar]
- Pham, T.Q.; Khun, N.W.; Butler, D.L. New approach to estimate coverage parameter in 3D FEM shot peening simulation. Surf. Eng. 2017, 33, 687–695. [Google Scholar] [CrossRef]
- Zhang, H.; Wang, W.; Zhang, S.; Zhao, Z. Modeling of Finite-Length Line Contact Problem with Consideration of Two Free-End Surfaces. J. Tribol. 2016, 138, 1–10. [Google Scholar] [CrossRef]
- Geitner, M.; Zornek, B.; Tobie, T.; Stahl, K. Investigations on the pitting load capacity of internal spur and helical gears. Forsch. im Ingenieurwesen/Eng. Res. 2019, 83, 553–561. [Google Scholar] [CrossRef]
- Wang, Q.; Zhao, B.; Fu, Y.; Kong, X.; Ma, H. An improved time-varying mesh stiffness model for helical gear pairs considering axial mesh force component. Mech. Syst. Signal Process. 2018, 106, 413–429. [Google Scholar] [CrossRef]
- Hills, D.A.; Nowell, D.S.A. Elastic Contacts, 1st ed.; Butterworth-Heinemann: Oxford, UK, 1993. [Google Scholar]
- Fatemi, A.; Socie, D.F. A critical plane approach to multiaxial fatigue damage including out-of-phase loading. Fatigue Fract. Eng. Mater. Struct. 1988, 11, 149–165. [Google Scholar] [CrossRef]
- Basan, R.; Marohnić, T. Multiaxial fatigue life calculation model for components in rolling-sliding line contact with application to gears. Fatigue Fract. Eng. Mater. Struct. 2019, 42, 1478–1493. [Google Scholar] [CrossRef]
- Shamsaei, N.; Fatemi, A. Effect of hardness on multiaxial fatigue behaviour and some simple approximations for steels. Fatigue Fract. Eng. Mater. Struct. 2009, 32, 631–646. [Google Scholar] [CrossRef]
- Tong, Z.; Xin, J.; Tong, S.; Yang, Z.; Zhao, J.; Mao, J. Internal flow structure, fault detection, and performance optimization of centrifugal pumps. J. Zhejiang Univ. A 2020, 21, 85–117. [Google Scholar] [CrossRef]
- Chen, Y.; Tong, Z.; Zheng, Y.; Samuelson, H.; Norford, L. Transfer learning with deep neural networks for model predictive control of HVAC and natural ventilation in smart buildings. J. Clean. Prod. 2020, 254, 119866. [Google Scholar] [CrossRef]
- Zhang, D.; Tong, Z.; Li, Y. The role of cash holding towards cleaner production in China’s manufacturing sectors: A financial constraint perspective. J. Clean. Prod. 2020, 245, 118875. [Google Scholar] [CrossRef]
- Bonori, G.; Barbieri, M.; Pellicano, F. Optimum profile modifications of spur gears by means of genetic algorithms. J. Sound Vib. 2008, 313, 603–616. [Google Scholar] [CrossRef]
- Zhang, G.; Wang, G.; Li, X.; Ren, Y. Global optimization of reliability design for large ball mill gear transmission based on the Kriging model and genetic algorithm. Mech. Mach. Theory 2013, 69, 321–336. [Google Scholar] [CrossRef]
- Zhang, J.; Qin, X.; Xie, C.; Chen, H.; Jin, L. Optimization design on dynamic load sharing performance for an in-wheel motor speed reducer based on genetic algorithm. Mech. Mach. Theory 2018, 122, 132–147. [Google Scholar] [CrossRef]
- Wang, S.; Li, Y.; Yao, M.; Wang, R. Compressive residual stress introduced by shot peening. J. Mater. Process. Technol. 1998, 73, 64–73. [Google Scholar] [CrossRef]
- James, M.N.; Hughes, D.J.; Chen, Z.; Lombard, H.; Hattingh, D.G.; Asquith, D.; Yates, J.R.; Webster, P.J. Residual stresses and fatigue performance. Eng. Fail. Anal. 2007, 14, 384–395. [Google Scholar] [CrossRef]
- Chen, M.; Jiang, C.; Xu, Z.; Zhan, K.; Ji, V. Experimental study on macro- and microstress state, microstructural evolution of austenitic and ferritic steel processed by shot peening. Surf. Coat. Technol. 2019, 359, 511–519. [Google Scholar] [CrossRef]
- Vantadori, S.; Zanichelli, A. Fretting-fatigue analysis of shot-peened aluminium and titanium test specimens. Fatigue Fract. Eng. Mater. Struct. 2020. [Google Scholar] [CrossRef]
- Lin, Q.; Liu, H.; Zhu, C.; Chen, D.; Zhou, S. Effects of different shot peening parameters on residual stress, surface roughness and cell size. Surf. Coat. Technol. 2020, 398, 126054. [Google Scholar] [CrossRef]
- Mirjalili, S. Genetic algorithm. Stud. Comput. Intell. 2019, 780, 43–55. [Google Scholar] [CrossRef]
- Timoshenko, S.P.; Goodier, J.N. Theory of Elasticity; McGraw-Hill: New York, NY, USA, 1951. [Google Scholar]
- Farrahi, G.H.; Lebrijn, J.L.; Couratin, D. Effect of shot peening on resdiual stress and fatigue life of a spring steel. Fatigue Fract. Eng. Mater. Struct. 1995, 18, 211–220. [Google Scholar] [CrossRef]
- Cao, Y.J.; Sun, J.Q.; Ma, F.; Chen, Y.Y.; Cheng, X.Z.; Gao, X.; Xie, K. Effect of the microstructure and residual stress on tribological behavior of induction hardened GCr15 steel. Tribol. Int. 2017, 115, 108–115. [Google Scholar] [CrossRef]
- Yang, D.; Xiao, X.; Liu, Y.; Sun, J. Peripheral milling-induced residual stress and its effect on tensile-tensile fatigue life of aeronautic titanium alloy Ti-6Al-4V. Aeronaut. J. 2019, 123, 212–229. [Google Scholar] [CrossRef]
- Peyrac, C.; Flavenot, J. Optimisation of carburising and shot peening, in order to improve both bending and contact fatigue behaviour for gear applications. In Proceedings of the ICSP-9, Paris, France, 6–9 September 2005. [Google Scholar]
- Terrin, A.; Meneghetti, G. A comparison of rolling contact fatigue behaviour of 17NiCrMo6-4 case-hardened disc specimens and gears. Fatigue Fract. Eng. Mater. Struct. 2018, 41, 2321–2337. [Google Scholar] [CrossRef]
- Zammit, A. Shot Peening of Austempered Ductile Iron. In Advanced Surface Engineering Research; IntechOpen: Rijeka, Croatia, 2018. [Google Scholar]


Publisher’s Note: MDPI stays neutral with regard to jurisdictional claims in published maps and institutional affiliations. |
© 2021 by the authors. Licensee MDPI, Basel, Switzerland. This article is an open access article distributed under the terms and conditions of the Creative Commons Attribution (CC BY) license (http://creativecommons.org/licenses/by/4.0/).