
Prediction of Second Melting Temperatures Already Observed in Pure Elements by Molecular Dynamics Simulations


Abstract
:
1. Introduction
2. Thermodynamic Consequences of Bonds or Antibonds Presence above Tm
3. Application of NCHN Model to Liquid Elements: First-Order Glass Transition during the First Cooling and Second-Order Transition during Heating
4. Singular Values of Enthalpy of Glacial Phases in Liquid Elements
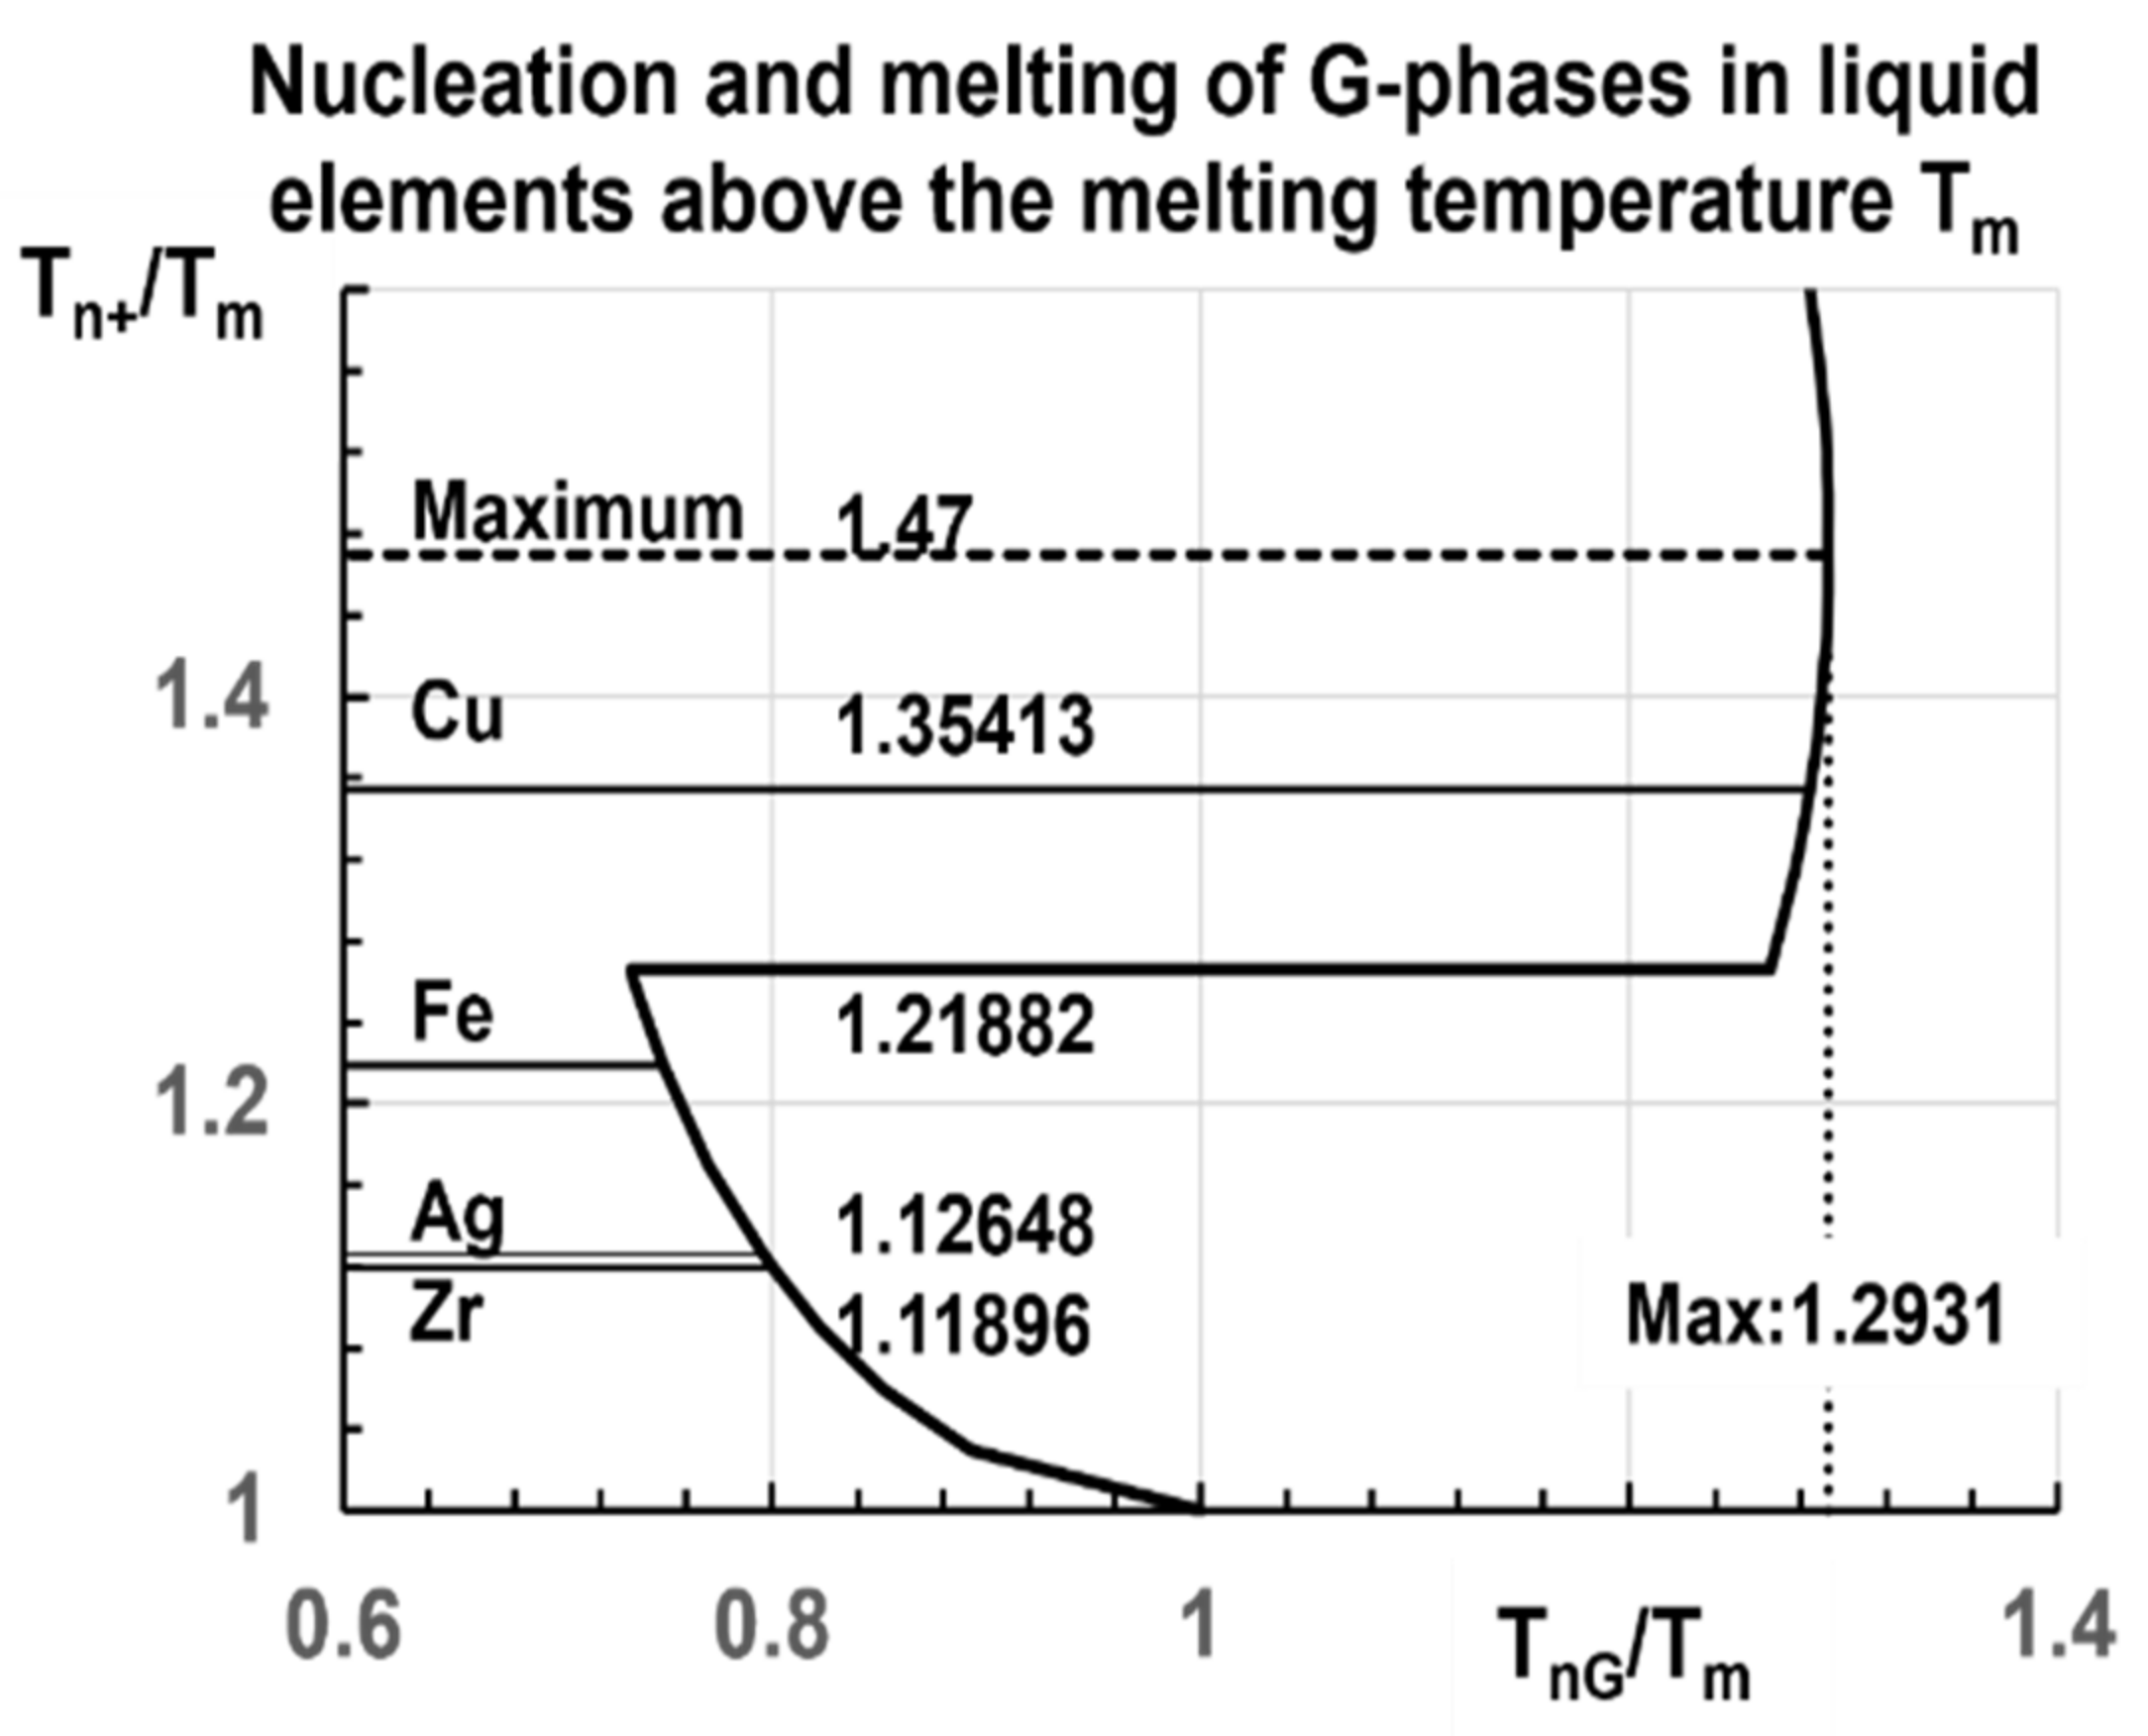
5. Universal Law for the Second Melting Temperature Tn+ Depending on the Homogeneous Nucleation Temperature TnG of Glacial Phases
6. Observations of Second Melting Temperatures Tn+ with MD Simulations
6.1. Zirconium
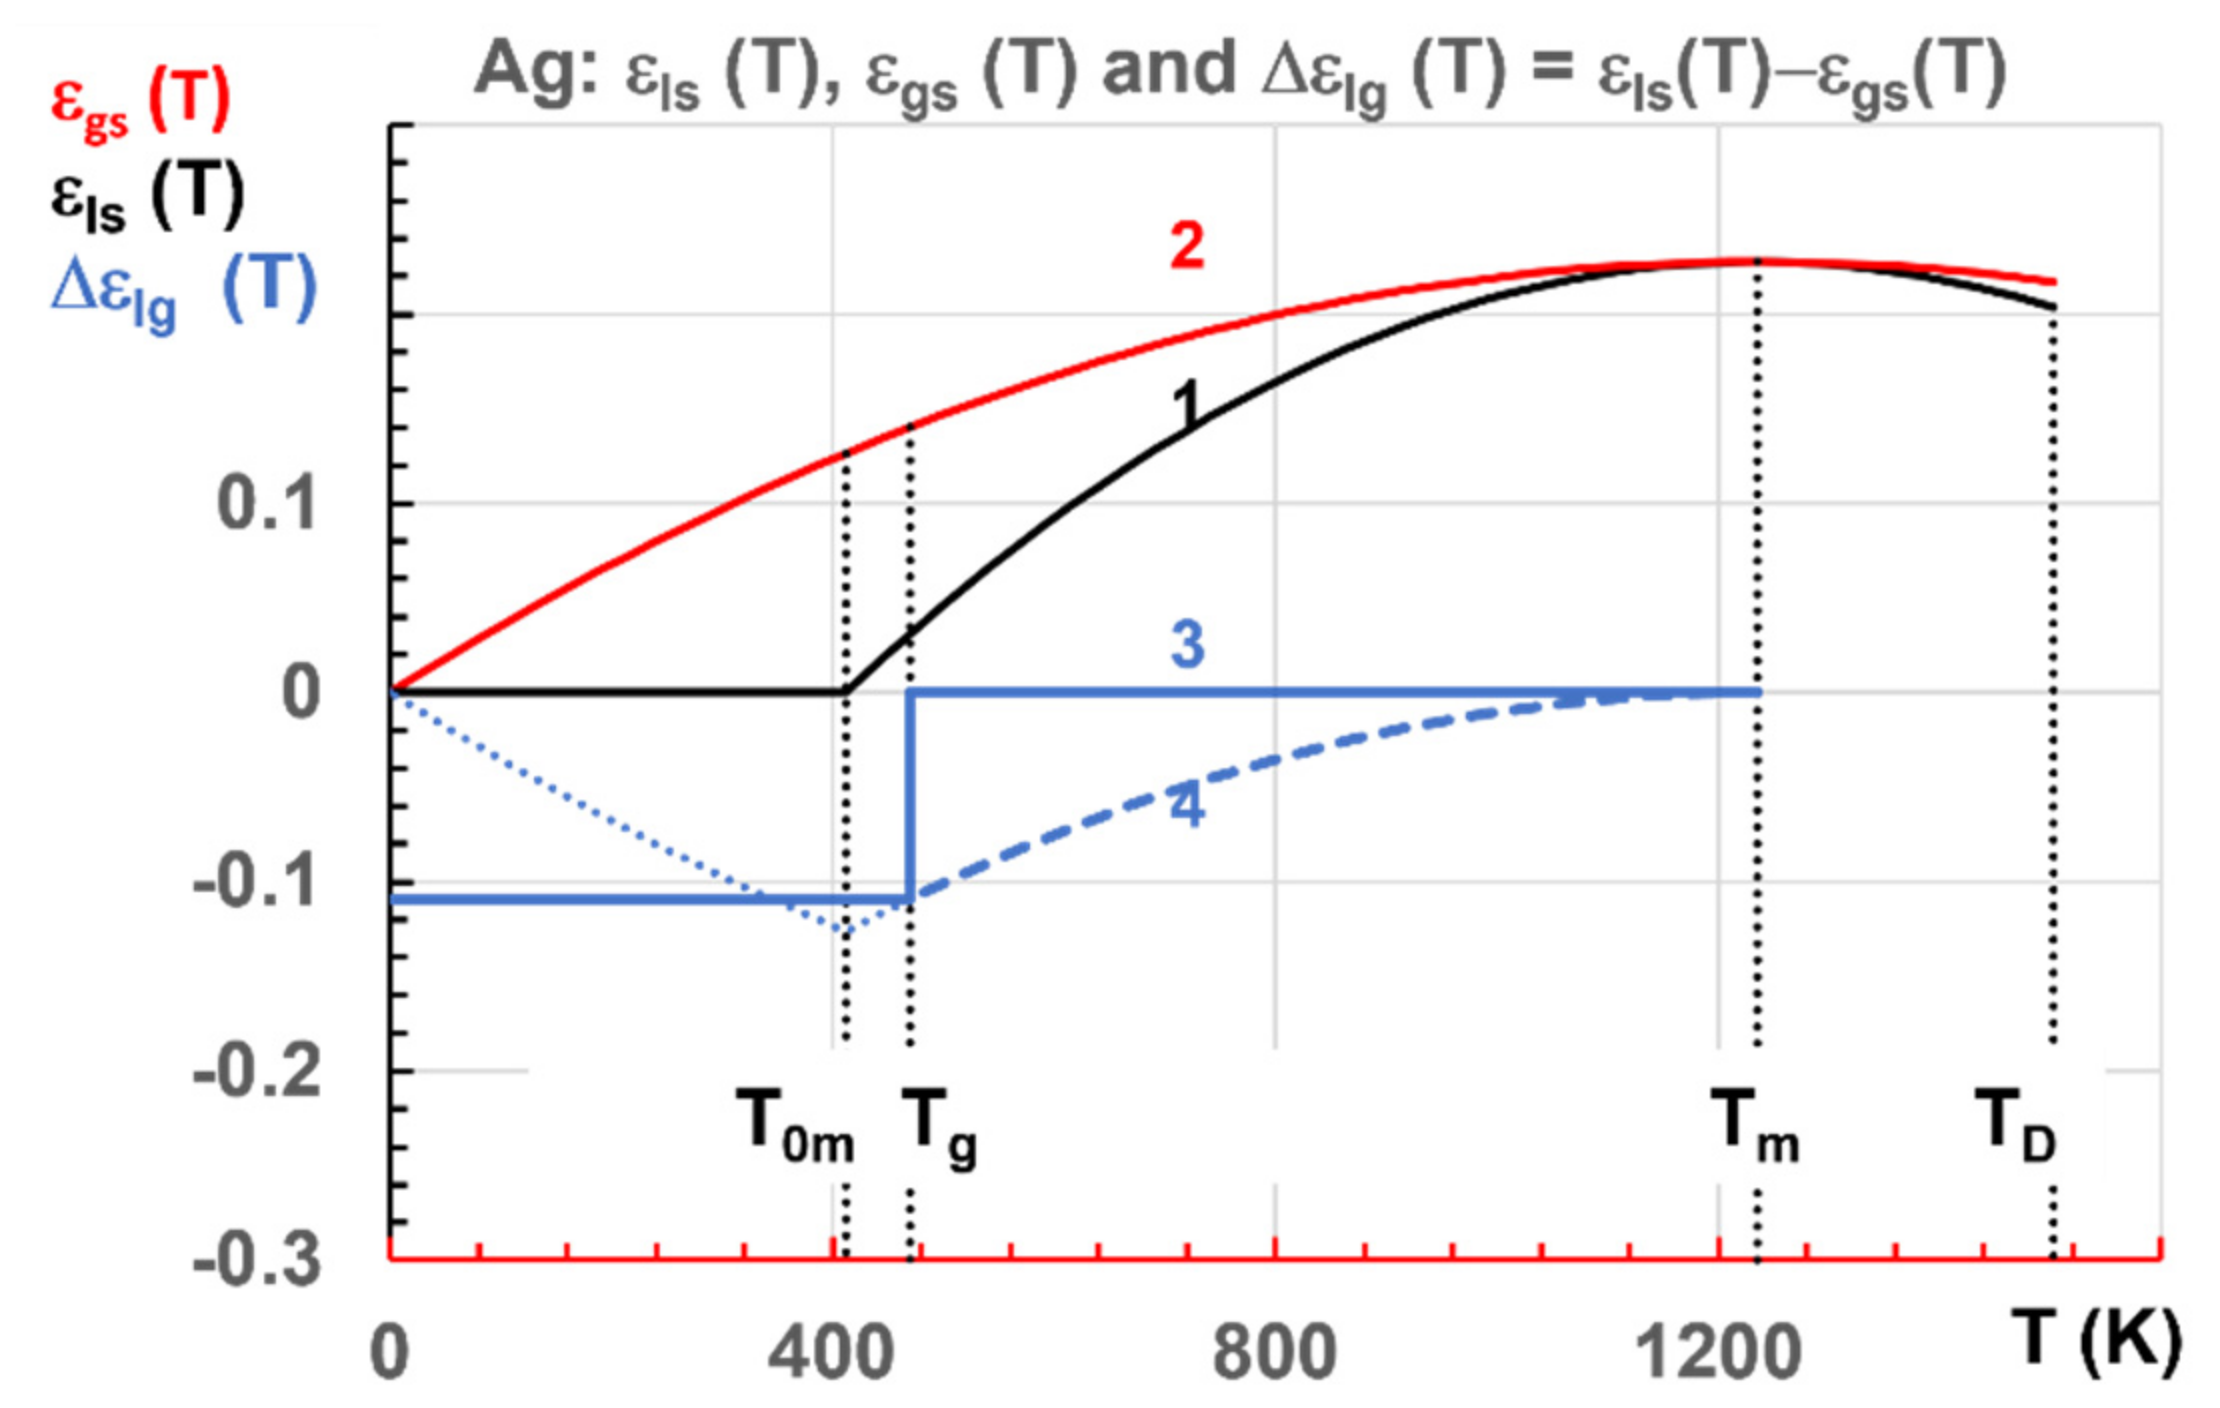
6.2. Silver
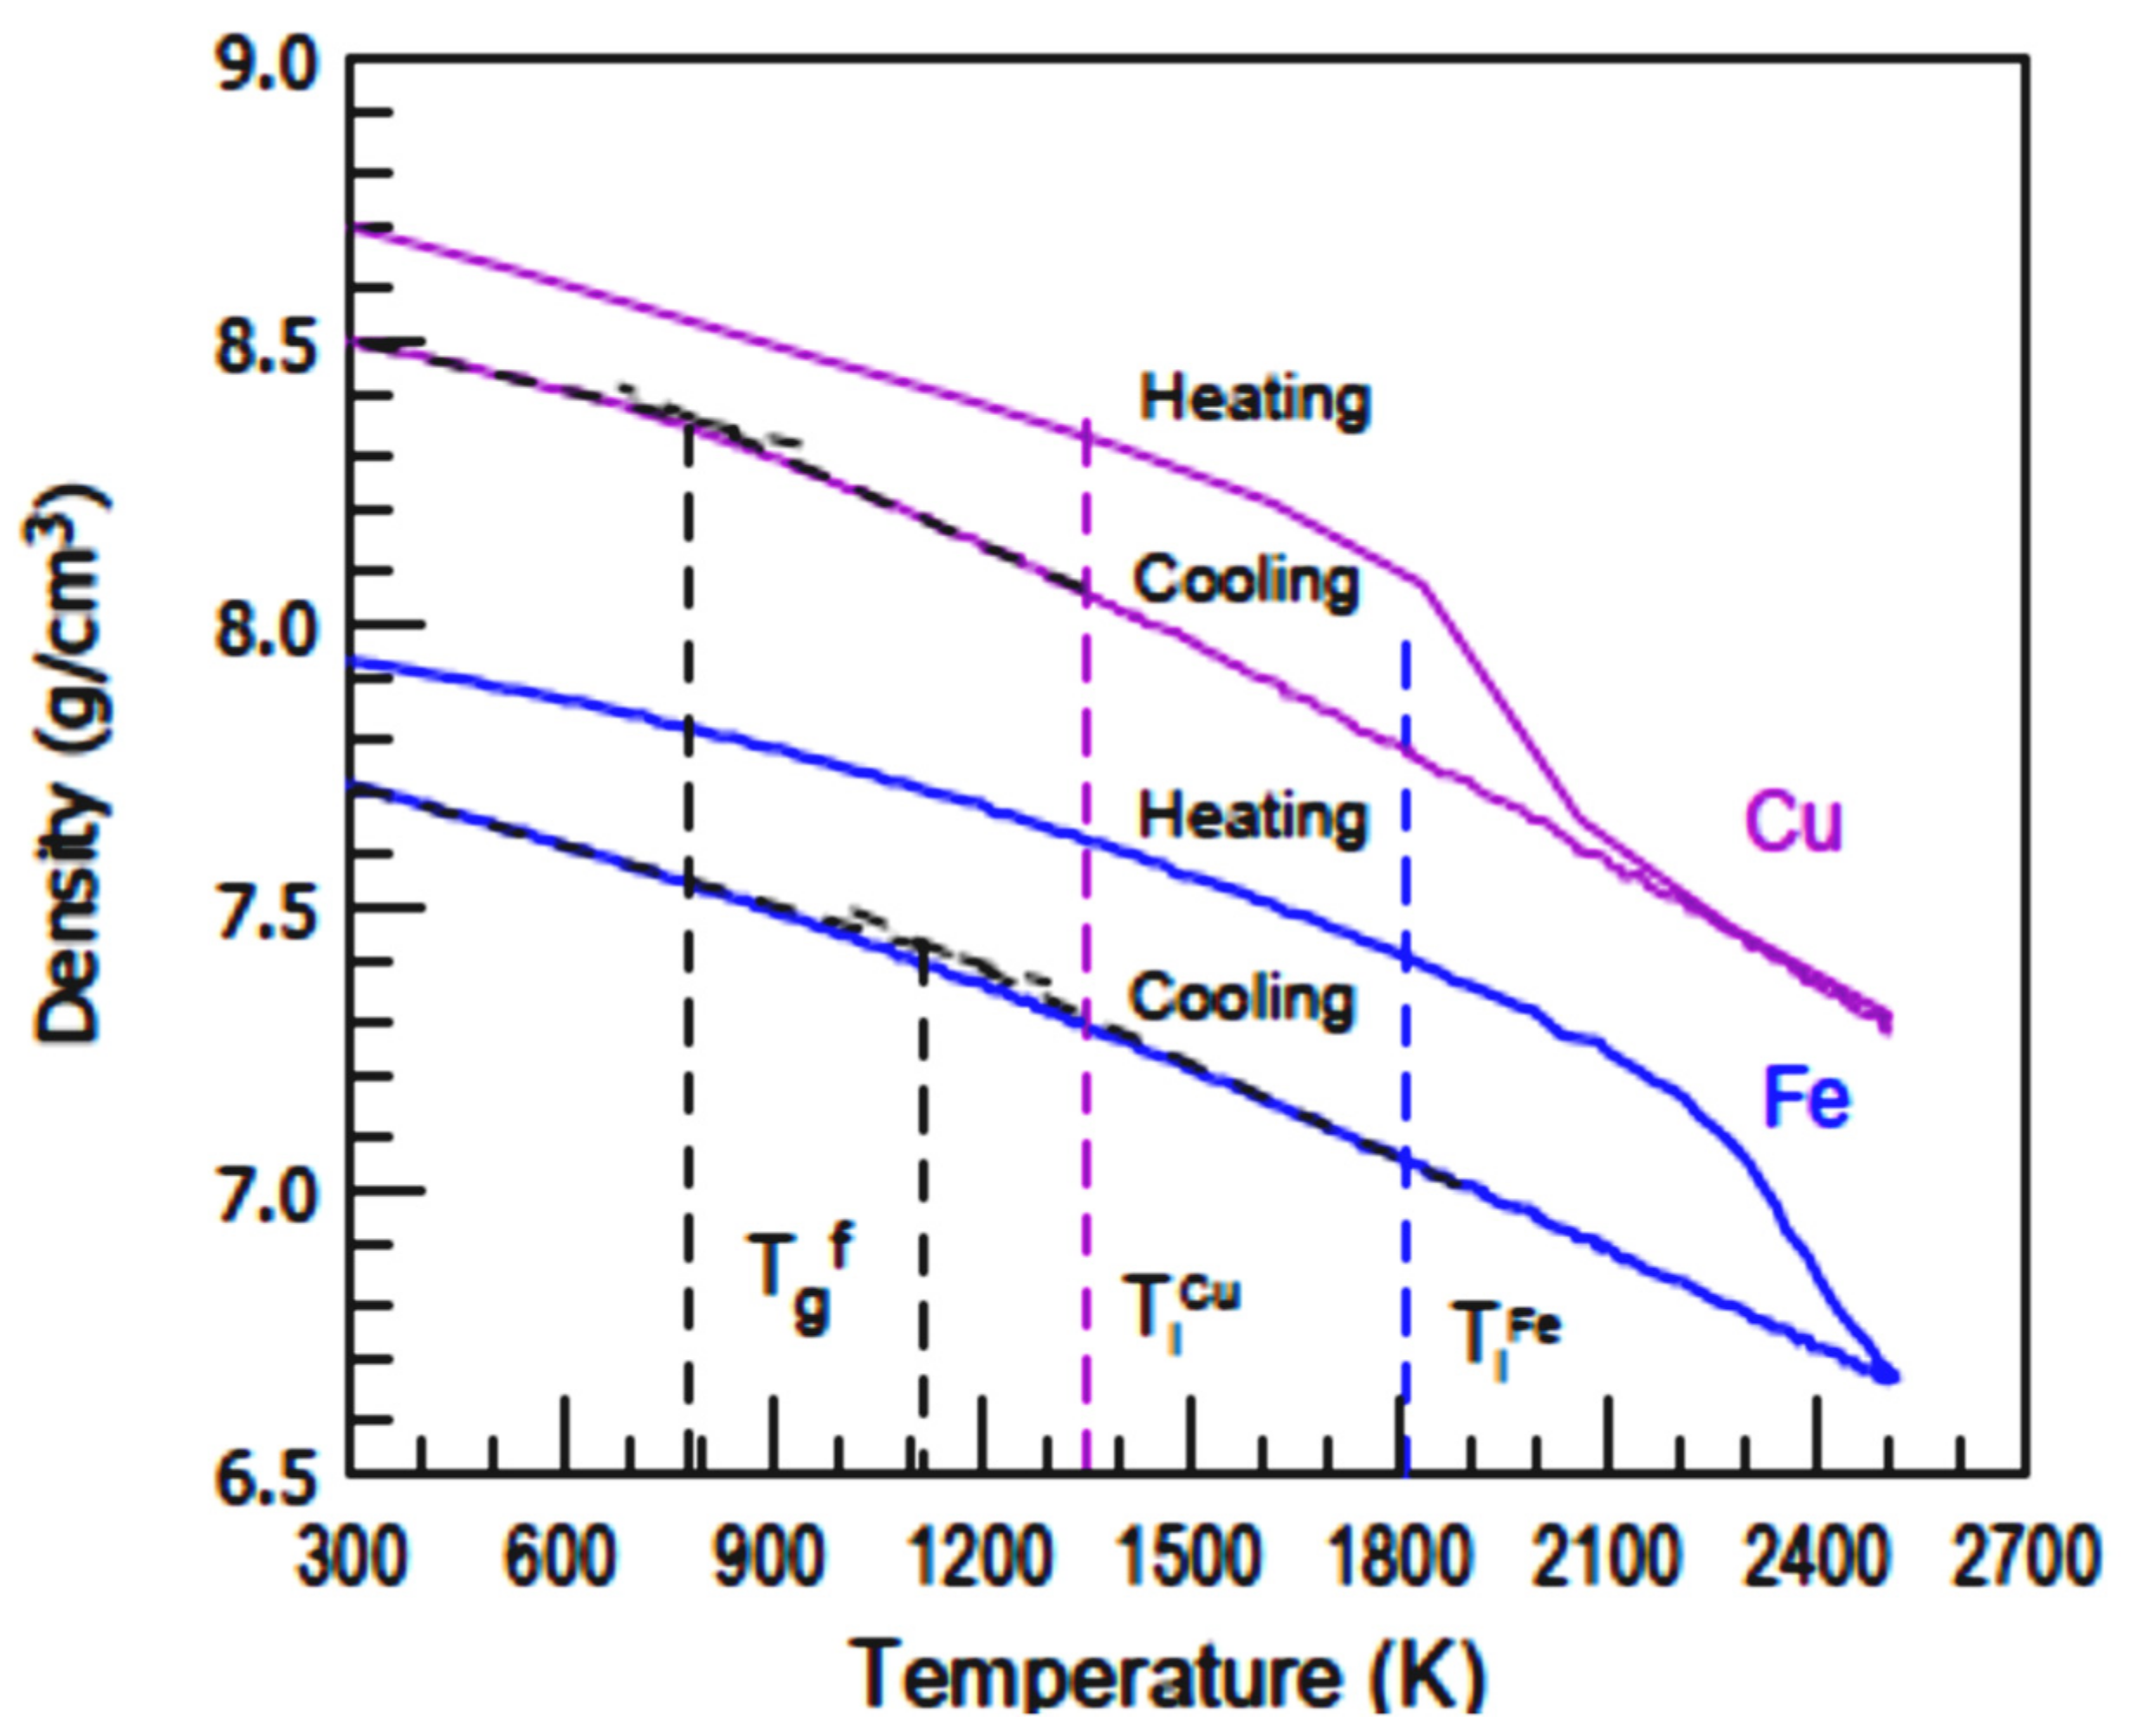
6.3. Iron and Copper
7. Glacial Phases Formation below Tm with Singular Enthalpies with MD Simulations
7.1. Silver
7.2. Tantalum
7.3. Zirconium
7.4. Nickel
7.5. Copper
7.6. Iron
8. The Free Fall Solidification of Tantalum and Rhenium Droplets via Glacial Phases
9. The Two Peaks of Recalescence of Undercooled Cobalt in High Magnetic Field B = 12 Tesla and B = 0
10. Thermodynamics of Configurons
11. A New Panorama for Melting and Solidification
12. Conclusions
Author Contributions
Funding
Institutional Review Board Statement
Informed Consent Statement
Data Availability Statement
Conflicts of Interest
References
- Tournier, R.F.; Ojovan, M.I. Building and breaking bonds by homogenous nucleation in glass-forming melts leading to three liquid states. Materials 2021, 14, 2287. [Google Scholar] [CrossRef]
- Tournier, R.F. First-order transitions in glasses and melts induced by solid superclusters nucleated by homogeneous nucleation instead of surface melting. Chem. Phys. 2019, 524, 40–54. [Google Scholar] [CrossRef] [Green Version]
- Wang, L.-M.; Borick, S.; Angell, C.A. An electrospray technique for hyperquenched glass calorimetry studies: Propylene glycol and di-n-butylphthalate. J. Non-Cryst. Solids 2007, 353, 3829–3837. [Google Scholar] [CrossRef]
- Hornboll, L.; Yue, Y. Enthalpy relaxation in hyperquenched glasses of different fragility. J. Non-Cryst. Solids 2008, 354, 1832–1870. [Google Scholar] [CrossRef]
- Inoue, A.; Zhang, T.; Masumoto, T. The structural relaxation and glass transition of La-Al-Ni and Zr-Al-Cu amorphous alloys with a significant supercooled liquid region. J. Non-Cryst. Solids 1992, 150, 396. [Google Scholar] [CrossRef]
- Hu, L.; Zhang, C.; Yue, Y. Thermodynamic anomaly of the sub-Tg relaxation in hyperquenched metallic glasses. J. Chem. Phys. 2013, 138, 174508. [Google Scholar] [CrossRef] [PubMed]
- Ozhovan, M.I. Topological characteristics of bonds in SiO2 and GeO2 oxide systems at glass-liquid transition. J. Exp. Theor. Phys. 2006, 103, 819–829. [Google Scholar] [CrossRef]
- Ojovan, M.I.; Travis, K.P.; Hand, R.J. Thermodynamic parameters of bonds in glassy materials from viscosity temperature relationships. J. Phys. Cond. Matter. 2007, 19, 415107. [Google Scholar] [CrossRef] [Green Version]
- Ojovan, M.I.; Lee, W.E. Connectivity and glass transition in disordered oxide systems. J. Non-Cryst. Solids 2010, 356, 2534–2540. [Google Scholar] [CrossRef]
- Ojovan, M.I. Ordering and structural changes at the glass-liquid transition. J. Non-Cryst. Solids 2013, 382, 79. [Google Scholar] [CrossRef]
- Ojovan, M.I.; Louzguine-Luzgin, D.V. Revealing Structural Changes at Glass Transition via Radial Distribution Functions. Phys. B 2020, 124, 3186–3194. [Google Scholar] [CrossRef]
- Ojovan, M.I.; Tournier, R.F. On structural rearrangements in amorphous silica at the glass transition. Materials 2021, 14, 5235. [Google Scholar] [CrossRef]
- Kearns, K.L.; Whiteker, K.R.; Ediger, M.D.; Huth, H.; Schick, C. Observation of low heat capacities for vapor-deposited glasses of indomethacin as determined by AC nanocalorimetry. J. Chem. Phys. 2010, 133, 014702. [Google Scholar] [CrossRef] [PubMed]
- Kearns, K.L.; Swallen, S.F.; Ediger, M.D.; Wu, T.; Sun, Y.; Yu, L. Hiking down the energy landscape: Progress toward the Kauzmann temperature via vapor deposition. J. Phys. Chem. B. 2008, 112, 4934–4942. [Google Scholar] [CrossRef] [PubMed]
- Kearns, K.L.; Swallen, S.F.; Ediger, M.D.; Wu, T.; Yu, L. Influence of substrate temperature on the stability of glasses prepared by vapor deposition. J. Chem. Phys. 2007, 127, 154702. [Google Scholar] [CrossRef] [Green Version]
- Whiteker, K.R.; Scifo, D.J.; Ediger, M.D.; Ahrenberg, M.; Schick, C. High stable glasses of cis-decalin and cis/trans-decalin mixtures. J. Phys. Chem. 2013, 117, 12724–12733. [Google Scholar] [CrossRef]
- Whiteker, K.R.; Tylinski, M.; Ahrenberg, M.; Schick, C.; Ediger, M.D. Kinetic stability and heat capacity of vapor-deposited glass of o-terphenyl. J. Chem. Phys. 2015, 143, 084511. [Google Scholar] [CrossRef]
- Ahrenberg, M.; Chua, Y.Z.; Whitaker, R.; Huth, H.; Ediger, M.D.; Schick, C. In situ investigation of vapor-deposited glasses of toluene and ethylbenzene via alternating current chip-nanocalorimetry. J. Chem. Phys. 2013, 138, 024501. [Google Scholar] [CrossRef] [Green Version]
- Tylinski, M.; Chua, Y.Z.; Beasley, M.S.; Ediger, M.D. Vapor-deposited alcohol glasses reveal a wide-range of kinetic stability. J. Chem. Phys. 2016, 145, 174506. [Google Scholar] [CrossRef] [Green Version]
- Ramos, S.L.; Oguni, M.; Ishii, K.; Nakayama, H. Character of devitrification, viewed from enthalpic paths, of the vapor-deposited ethylbenzene glasses. J. Phys. Chem. B. 2011, 115, 14327–14332. [Google Scholar] [CrossRef]
- Leon-Gutierrez, E.; Sepulveda, A.; Garcia, G.; Clavaguera-Mora, M.T.; Rodriguez-Vieja, J. Stability of thin film glasses of toluene and ethylbenzene formed by vapor deposition: An in-situ nanocalorimetric study. Phys. Chem. Chem. Phys. 2010, 12, 14693–14698. [Google Scholar] [CrossRef]
- Yu, H.-B.; Luo, Y.; Samwer, K. Ultrastable metallic glass. Adv. Mater. 2013, 25, 5904–5908. [Google Scholar] [CrossRef]
- Wang, J.Q.; Shen, Y.; Perepezko, J.H.; Ediger, M.D. Increasing the kinetic stability of bulk metallic glasses. Acta Mater. 2016, 104, 25–32. [Google Scholar] [CrossRef]
- Beasley, M.S.; Tylinski, M.; Chua, Y.Z.; Schick, C.; Ediger, M.D. Glasses of three alkyl phosphates show a range of kinetic stabilities when prepared by physical vapor deposition. J. Chem. Phys. 2018, 148, 174503. [Google Scholar] [CrossRef]
- Chua, Y.Z.; Ahrenberg, M.; Tylinski, M.; Ediger, M.D.; Schick, C. How much time is needed to form a kinetically stable glass? Ac calorimetric study of vapor-deposited glasses of ethylcyclohexane. J. Chem. Phys. 2015, 142, 054506. [Google Scholar] [CrossRef] [PubMed]
- Kivelson, D.; Kivelson, S.A.; Zhao, X.; Nussinov, Z.; Tarjus, G. A thermodynamic theory of supercooled liquids. Phys. A 1995, 219, 27–38. [Google Scholar] [CrossRef]
- Ha, A.; Cohen, I.; Zhao, X.; Lee, M.; Kivelson, D. Supercooled liquids and polyamorphism. J. Phys. Chem. Lett. 1996, 100, 1–4. [Google Scholar] [CrossRef]
- Kurita, R.; Tanaka, H. On the abundance and general nature of the liquid-liquid phase transition in molecular systems. J. Phys. Condens. Matter. 2005, 17, L293–L302. [Google Scholar] [CrossRef]
- Kobayashi, M.; Tanaka, H. The reversibility and first-order nature of liquid-liquid transition in a molecular liquid. Nat. Comm. 2016, 7, 13438. [Google Scholar] [CrossRef] [Green Version]
- Zhu, M.; Wang, J.-Q.; Perepezko, J.H.; Yu, L. Possible existence of two amorphous phases of D-Mannitol related by a first-order transition. J. Chem. Phys. 2015, 142, 244504. [Google Scholar] [CrossRef]
- Tournier, R.F. Homogeneous nucleation of phase transformations in supercooled water. Phys. B 2020, 579, 411895. [Google Scholar] [CrossRef]
- Kurtuldu, G.; Shamlaye, K.F.; Löffler, J. Metastable quasi-crystal-induced nucleation in a bulk glass-forming melt. Proc. Natl. Acad. Sci. USA 2018, 115, 6123–6128. [Google Scholar] [CrossRef] [PubMed] [Green Version]
- Tournier, R.F.; Ojovan, M.I. Undercooled Phase Behind the Glass Phase with Superheated Medium-Range Order above Glass Transition Temperature. Physica B 2021, 602, 412542. [Google Scholar] [CrossRef]
- Tournier, R.F.; Ojovan, M.I. Dewetting Temperatures of Prefrozen and Grafted Layers in Ultrathin Films Viewed as Melt-Memory Effects. Physica B 2021, 611, 412796. [Google Scholar] [CrossRef]
- Shen, J.; Lu, Z.; Wang, J.Q.; Lan, S.; Zhang, F.; Chen, M.W.; Wang, X.L.; Wen, P.; Sun, Y.H.; Bai, H.Y.; et al. Metallic glacial glass formation by a first-order liquid-liquid transition. J. Phys. Chem. Lett. 2020, 11, 6718–6723. [Google Scholar] [CrossRef] [PubMed]
- Tournier, R.F. Presence of intrinsic growth nuclei in overheated and undercooled liquid elements. Physica B 2007, 392, 79–91. [Google Scholar] [CrossRef]
- Tournier, R.F. Crystal growth nucleation and Fermi energy equalization of intrinsic spherical nuclei in glass-forming melts. Sci. Technol. Adv. Mater. 2009, 10, 014617. [Google Scholar] [CrossRef]
- Tournier, R.F. Thermodynamic origin of the vitreous transition. Materials 2011, 4, 869–892. [Google Scholar] [CrossRef] [Green Version]
- Tournier, R.F. Thermodynamic and kinetic origin of the vitreous transition. Intermetallics 2012, 30, 104–110. [Google Scholar] [CrossRef]
- Tournier, R.F. Fragile-to-fragile liquid transition at Tg and stable-glass phase nucleation rate maximum at the Kauzmann temperature. Physica B 2014, 454, 253–271. [Google Scholar] [CrossRef] [Green Version]
- Tournier, R.F. Predicting glass-to-glass and liquid-to-liquid phase transitions in supercooled water using non-classical nucleation theory. Chem. Phys. 2018, 500, 45–53. [Google Scholar] [CrossRef] [Green Version]
- Tournier, R.F. Amorphous ices. In Encyclopedia of Glass Science, Technology, History, and Culture; Richet, P., Ed.; Wiley & Sons: Hoboken, NJ, USA, 2021; Volume 1, p. 3.14. [Google Scholar]
- Angell, C.A.; Rao, K.J. Configurational excitations in condensed matter and the “bond lattice”. Model for the liquid-glass transition. J. Chem. Phys. 1972, 57, 470–481. [Google Scholar] [CrossRef]
- Kuchemann, S.; Gibbins, G.; Corkerton, J.; Brug, E.; Ruebsam, J.; Samwer, K. From ultrafast to slow: Heating rate dependence of the glass transition temperature in metallic systems. Phil. Mag. Lett. 2016, 96, 454–460. [Google Scholar] [CrossRef]
- An, Q.; Johnson, W.L.; Samwer, K.; Corona, S.L.; Goddard, W.A., III. First-order transition in liquid Ag to the heterogeneous G-Phase. J. Phys. Chem. Lett. 2020, 11, 632–645. [Google Scholar] [CrossRef] [Green Version]
- An, Q.; Johnson, W.L.; Samwer, K.; Corona, S.L.; Goddard, W.A., III. Formation of two glass phases in binary Cu-Ag liquid. Acta Mater. 2020, 195, 274–281. [Google Scholar] [CrossRef]
- Daeges, J.; Gleiter, H.; Perepezko, J.H. Superheating of metal crystals. Phys. Lett. A. 1986, 119, 79–82. [Google Scholar] [CrossRef]
- Lu, K.; Sheng, H.; Jin, Z. Melting and superheating of crystals. Chin. J. Mater. Res. 1997, 11, 658–665. [Google Scholar]
- Zhang, D.L.; Cantor, B. Melting behaviour of In and Pb particles embedded in an Al Matrix. Acta Metall. Mater. 1991, 39, 1595–1602. [Google Scholar] [CrossRef]
- Lu, K.; Li, Y. Homogeneous nucleation catastroph as a kinetic stability limit for superheated crystal. Phys. Rev. Lett. 1998, 80, 4474–4477. [Google Scholar] [CrossRef] [Green Version]
- Tournier, R.F. Glass phase and other multiple liquid-to-liquid transitions resulting from two-liquid competition. Chem. Phys. Lett. 2016, 665, 64–70. [Google Scholar] [CrossRef] [Green Version]
- Li, J.J.Z.; Rhim, W.K.; Zeng, X.R.; Samwer, K.; Johnson, W.L. Evidence for a liquid-liquid phase transition in metallic fluid observed by electrostatic levitation. Acta Mater. 2011, 59, 2166–2171. [Google Scholar] [CrossRef]
- Hu, Q.; Sheng, H.C.; Fu, M.W.; Zeng, X.R. Influence of melt temperature on the Invar effect in (Fe71.2B.024Y4.8)96Nb4 bulk metallic glasses. J. Mater. Sci. 2019, 48, 6900–6906. [Google Scholar]
- Popel, P.S.; Sidorov, V.E. Microheterogeneity of liquid metallic solutions and its influence on the structure and propertes of rapidly quenched alloys. Mater.Sci. Eng. 1997, 226–228, 237–244. [Google Scholar] [CrossRef]
- Lan, S.; Blodgett, M.; Kelton, K.F. Structural crossover in a supercooled metallic liquid and the link to a liquid-to-liquid phase transition. Appl. Phys. Lett. 2016, 108, 211907. [Google Scholar] [CrossRef]
- Mukherjee, S.; Zhou, Z.; Schroers, J.; Johnson, W.L.; Rhim, W.K. Overheating threshold and its effect on time-temperature-transformation diagrams of zirconium based bulk metallic glasses. Appl. Phys. Lett. 2004, 84, 5010–5012. [Google Scholar] [CrossRef] [Green Version]
- Busch, R.; Kim, H.J.; Johnson, W.L. Thermodynamic and kinetics of the undercoolerd liquid and the glazss transition of the Zr41.2Ti13.6Cu12.5Ni10.0Be22.5 alloy. J. Appl. Phys. 1995, 77, 4039–4043. [Google Scholar] [CrossRef] [Green Version]
- He, Y.; Li, J.; Wang, J.; Kou, H.; Beaugnon, E. Liquid-liquid structure transition and nucleation in undercooled Co-B eutectic alloys. Appl. Phys. A. 2017, 123, 391. [Google Scholar] [CrossRef]
- Yang, B.; Perepezko, J.H.; Schmelzer, J.W.P.; GaO, Y.; Schick, C. Dependence of crystal nucleation on prior liquid overheating by differential fast scanning calorimetry. J. Chem. Phys. 2014, 140, 104513. [Google Scholar] [CrossRef]
- Wei, S.; Yang, F.; Bednarcik, J.; Kaban, I.; Shuleshova, O.; Meyer, A.; Busch, R. Liquid-liquid transition in a strong bulk metallic glass-forming liquid. Nat. Commun. 2013, 4, 2083. [Google Scholar] [CrossRef] [Green Version]
- Way, C.; Wadhwa, P.; Busch, R. The influence of shear rate and temperature on the viscosity and fragility of the Zr41.2Ti13.6Cu12.5Ni10.0Be22.5 metallic-glass-forming liquid. Acta Mater. 2007, 55, 2977–2983. [Google Scholar] [CrossRef]
- Jiang, H.-R.; Bochtler, B.; Riegler, S.S.; Wei, X.-S.; Neuber, N.; Frey, M.; Gallino, I.; Busch, R.; Shen, J. Thermodynamic and kinetic studies of the Cu-Zr-Al(-Sn) bulk metallic glasses. J. All. Comp. 2020, 844, 156126. [Google Scholar] [CrossRef]
- Kim, Y.H.; Kiraga, K.; Inoue, A.; Masumoto, T.; Jo, H.H. Crystallization and high mechanical strength of Al-based amorphous alloys. Mater. Trans. 1994, 35, 293–302. [Google Scholar] [CrossRef] [Green Version]
- Dahlborg, U.; Calvo-Dahlborg, M.; Popel, P.S.; Sidorov, V.R. Structure and properties of some glass-forming liquid alloys. Eur. Phys. J. 2000, B14, 639–648. [Google Scholar] [CrossRef]
- Yue, Y. Experimental evidence for the existence of an ordered structure in a silicate liquid above its liquidus temperature. J. Non-Cryst. Solids 2004, 345–346, 523–527. [Google Scholar] [CrossRef]
- Chen, E.-Y.; Peng, S.-X.; Peng, L.; Michiel, M.D.; Vaughan, G.B.M.; Yu, Y.; Yu, H.-B.; Ruta, B.; Wei, S.; Liu, L. Glass-forming ability correlated with the liquid-liquid transition in Pd42.5Ni42.5P15 alloy. Scripta Mater. 2021, 193, 117–121. [Google Scholar] [CrossRef]
- Lan, S.; Ren, Y.; Wei, X.Y.; Wang, B.; Gilbert, E.P.; Shibayama, T.; Watanabe, S.; Ohnuma, M.; Wang, X.-L. Hidden amorphous phase and reentrant supercooled liquid in Pd-Ni-P metallic glass. Nat. Commun. 2017, 8, 14679. [Google Scholar] [CrossRef]
- Xu, W.; Sandor, M.T.; Yu, Y.; Ke, H.-B.; Zhang, H.P.; Li, M.-Z.; Wang, W.-H.; Liu, L.; Wu, Y. Evidence of liquid-liquid transition in glass-forming La50Al35Ni15 melt above liquidus temperature. Nat. Commun. 2015, 6, 7696. [Google Scholar] [CrossRef]
- Zeng, Y.Q.; Yu, J.S.; Tian, Y.; Hirata, A.; Fujita, T.; Zhang, X.H.; Nishiyama, N.; Kato, H.; Jiang, J.Q.; Inoue, A.; et al. Improving glass forming ability of off-eutectic metallic glass formers by manipulating primary crystallization reactions. Acta Mater. 2020, 200, 710–719. [Google Scholar] [CrossRef]
- Tournier, R.F.; Ojovan, M.I. Comments about a recent publication entitled entitled "Improving glass forming ability of off-eutectic metallic glass formers by manipulating primary crystallization reactions”. Scripta Mater. 2021. under publication. [Google Scholar] [CrossRef]
- Zeng, Y.Q.; Yu, J.S.; Tian, Y.; Hirata, A.; Fujita, T.; Zhang, X.H.; Nishiyama, N.; Kato, H.; Jiang, J.Q.; Inoue, A.; et al. Response to the commentary by Robert Tournier and Michael Ojovan on our publication entitled “Improving glass forming”. Scripta Mater. 2021. under publication. [Google Scholar] [CrossRef]
- Tournier, R.F. Lindemann’s rule applied to the melting of crystals and ultra-stable glasses. Chem. Phys. Lett. 2016, 651, 198–202, Erratum in 2017, 675, 174. [Google Scholar] [CrossRef] [Green Version]
- Bossy, J.; Hansen, T.; Glyde, H.R. Amorphous solid Helium in porous melts. Phys. Rev. B 2010, 81, 184507. [Google Scholar] [CrossRef]
- Bera, S.; Maloney, J.; Mulders, N.; Cheng, Z.G.; Chan, M.H.W.; Burns, C.A.; Zhang, S. Pressure-dependent phase transformation of solid helium confined with a nanoporous material. Phys. Rev. B 2013, 88, 054512. [Google Scholar] [CrossRef]
- Tournier, R.F.; Bossy, J. 4He glass phase: A model for liquid elements. Chem. Phys. Lett. 2016, 658, 282–286. [Google Scholar] [CrossRef] [Green Version]
- Tournier, R.F. Validation of non-classical homogeneous nucleation model for G-glass and L-glass formations in liquid elements with recent molecular dynamics simulations. Scripta Mater. 2021, 199, 113859. [Google Scholar] [CrossRef]
- Vopson, M.M.; Rugers, N.; Hepburn, I. The generalized Lindemann Melting coefficient. Sol. State Commun. 2020, 318, 113977. [Google Scholar] [CrossRef]
- Bazlov, A.I.; Louzguine-Luzguin, D.V. Crystallization of FCC and BCC liquid metals studied by molecular dynamics simulation. Metals 2020, 10, 1532. [Google Scholar]
- Becker, S.; Devijver, E.; Molinier, R.; Jakse, N. Glass-forming ability of elemental zirconium. Phys. Rev. B 2020, 102, 104205. [Google Scholar] [CrossRef]
- Cortella, L.; Vinet, B.; Desre, P.J.; Pasturel, A.; Paxton, A.T.; Van Schilfgaarde, M. Evidences of transition metastable phases in refractory metals solidified from highly undercooled liquids in a droplet. Phys. Rev. Lett. 1993, 70, 1469–1472. [Google Scholar] [CrossRef]
- Wang, J.; He, Y.; Li, J.; Li, C.; Kou, H.; Zhang, P.; Beaugnon, E. Nucleation of supercooled Co melts under a high magnetic field. Mater. Chem. Phys. 2019, 225, 133–136. [Google Scholar] [CrossRef]
- Shephard, J.J.; Salzmann, C.G. Molecular reorientation dynamics govern the glass transition of the amorphous state. J. Phys. Chem. Lett. 2016, 7, 2181–2185. [Google Scholar] [CrossRef]
- Shephard, J.J.; Ling, S.; Sosso, G.C.; Michalides, A.; Slater, B.; Salzmann, C.G. High-density amorphous ice simply-derailed state along the ice 1 to ice IV pathway. J. Phys. Chem. Lett. 2017, 8, 1645–1650. [Google Scholar] [CrossRef] [PubMed] [Green Version]
- Zhong, L.; Wang, J.; Sheng, H.; Zhang, Z.; Mao, S.X. Formation of monoatomic metallic glasses through ultrafast liquid quenching. Nature 2014, 512, 177. [Google Scholar] [CrossRef]
- Louzguine-Luzguin, D.V.; Belosludov, R.; Saito, M.; Kawazoe, Y.; Inoue, A. Glass transition behavior of Ni: Calculation, prediction, and experiment. J. Appl. Phys. 2008, 104, 123529. [Google Scholar] [CrossRef]
- Louzguine-Luzgin, D.V.; Miyama, M.; Nishio, N.; Tsarkov, A.A.; Greer, A.L. Vitrification and nanocrytallization of pure liquid Ni studied using molecular-dynamics simulation. J. Chem. Phys. 2019, 151, 124502. [Google Scholar] [CrossRef]
- Herlach, D.M. Non-equilibrium solidification of undercooled metallic melts. Mater. Sci. Eng. 1994, R12, 177–272. [Google Scholar] [CrossRef]
- Stewart, G.R. Measurement of low-temperatutre specific heat. Rev. Sci. Instrum. 1983, 54, 1–11. [Google Scholar] [CrossRef]
- Taylor, R.E.; Finch, R.A. The Specific Heats and Resistivities of Molybdenum, Tantalum, and Rhenium from Low to High Temperatures. s.l.: Standard Distribution Lists for Unclassified Scientific and Technical Reports. In Proceedings of the Atomic International, Canoga Park, CA, USA, 15 December 1960; TID-4500 (16th Ed.). 1960; pp. 1–37. [Google Scholar]
- Tournier, R.F. Crystallization of supercooled liquid elements induced by superclusters containing magic atom numbers. Metals 2014, 4, 359–387. [Google Scholar] [CrossRef] [Green Version]
- Thurnay, K. Properties of Transition Metals; Forschungszentrum Karlsruhe: Karlsruhe, Germany, 1998. [Google Scholar] [CrossRef]
- Inoue, A. Stabilization of metallic supercooled liquid and bulk amorphous alloys. Acta Mater. 2000, 48, 279–306. [Google Scholar] [CrossRef]
- Hikima, T.; Okamoto, N.; Hanaya, M.; Oguni, M. Calorimetric study of triphenylethene: Observation of homogeneous-nucleation-based crystallization. J. Chem. Therm. 1998, 30, 509–523. [Google Scholar] [CrossRef]
- Hikima, T.; Hanaya, M.; Oguni, M. Discovery of a potentially homogeneous-nucleation-based crystallization around the glass transition temperature in Salol. Solid State Comm. 1995, 93, 713–717. [Google Scholar] [CrossRef]
- Kelton, K.F. Crystal nucleation in liquids and glasses. Solid State Phys. 1991, 45, 75–177. [Google Scholar]
- He, Y.-X.; Li, J.-S.; Wang, J.; Beaugnon, E. Liquid-liquid structure transition in metallic melt and its impact on solidification: A review. [ed.] Elsevier. Trans. Nonferr. Met. Soc. China 2020, 30, 2293–2310. [Google Scholar] [CrossRef]
- He, Y.; Li, J.; Li, L.; Wang, J.; Yildiz, E.; Beaugnon, E. Composition dependent characteristic transition temperatures of Co-B melts. J. Non-Cryst. Solids 2019, 522, 119583. [Google Scholar] [CrossRef]
- Tlahuice-Flores, A.; Munoz-Castro, A. Bonding and properties of superatoms. Analogs to atoms and molecules and related concepts from superatomic clusters. J. Quantum Chem. 2019, 119, e25756. [Google Scholar] [CrossRef] [Green Version]
- Kuzmin, V.I.; Tytik, D.I.; Belashchenko, G.K.; Sirenko, A.N. Structure of silver clusters with magic numbers of atoms by data of molecular dynamics. Colloid J. 2008, 70, 284–296. [Google Scholar] [CrossRef]
- Popel, P.S.; Chikova, O.A.; Matveev, V.M. Metastable colloidal states of liquid metallic solutions. High Temp. Mater. Proc. 1995, 4, 219–233. [Google Scholar] [CrossRef]
- Popel, P.S.; Dahlborg, U.; Calvo-Dahlborg, M. On the existence of metastable microheterogeneities in metallic melts. IOP Conf. Ser. Mater.Sci. Eng. 2017, 192, 012012. [Google Scholar] [CrossRef]


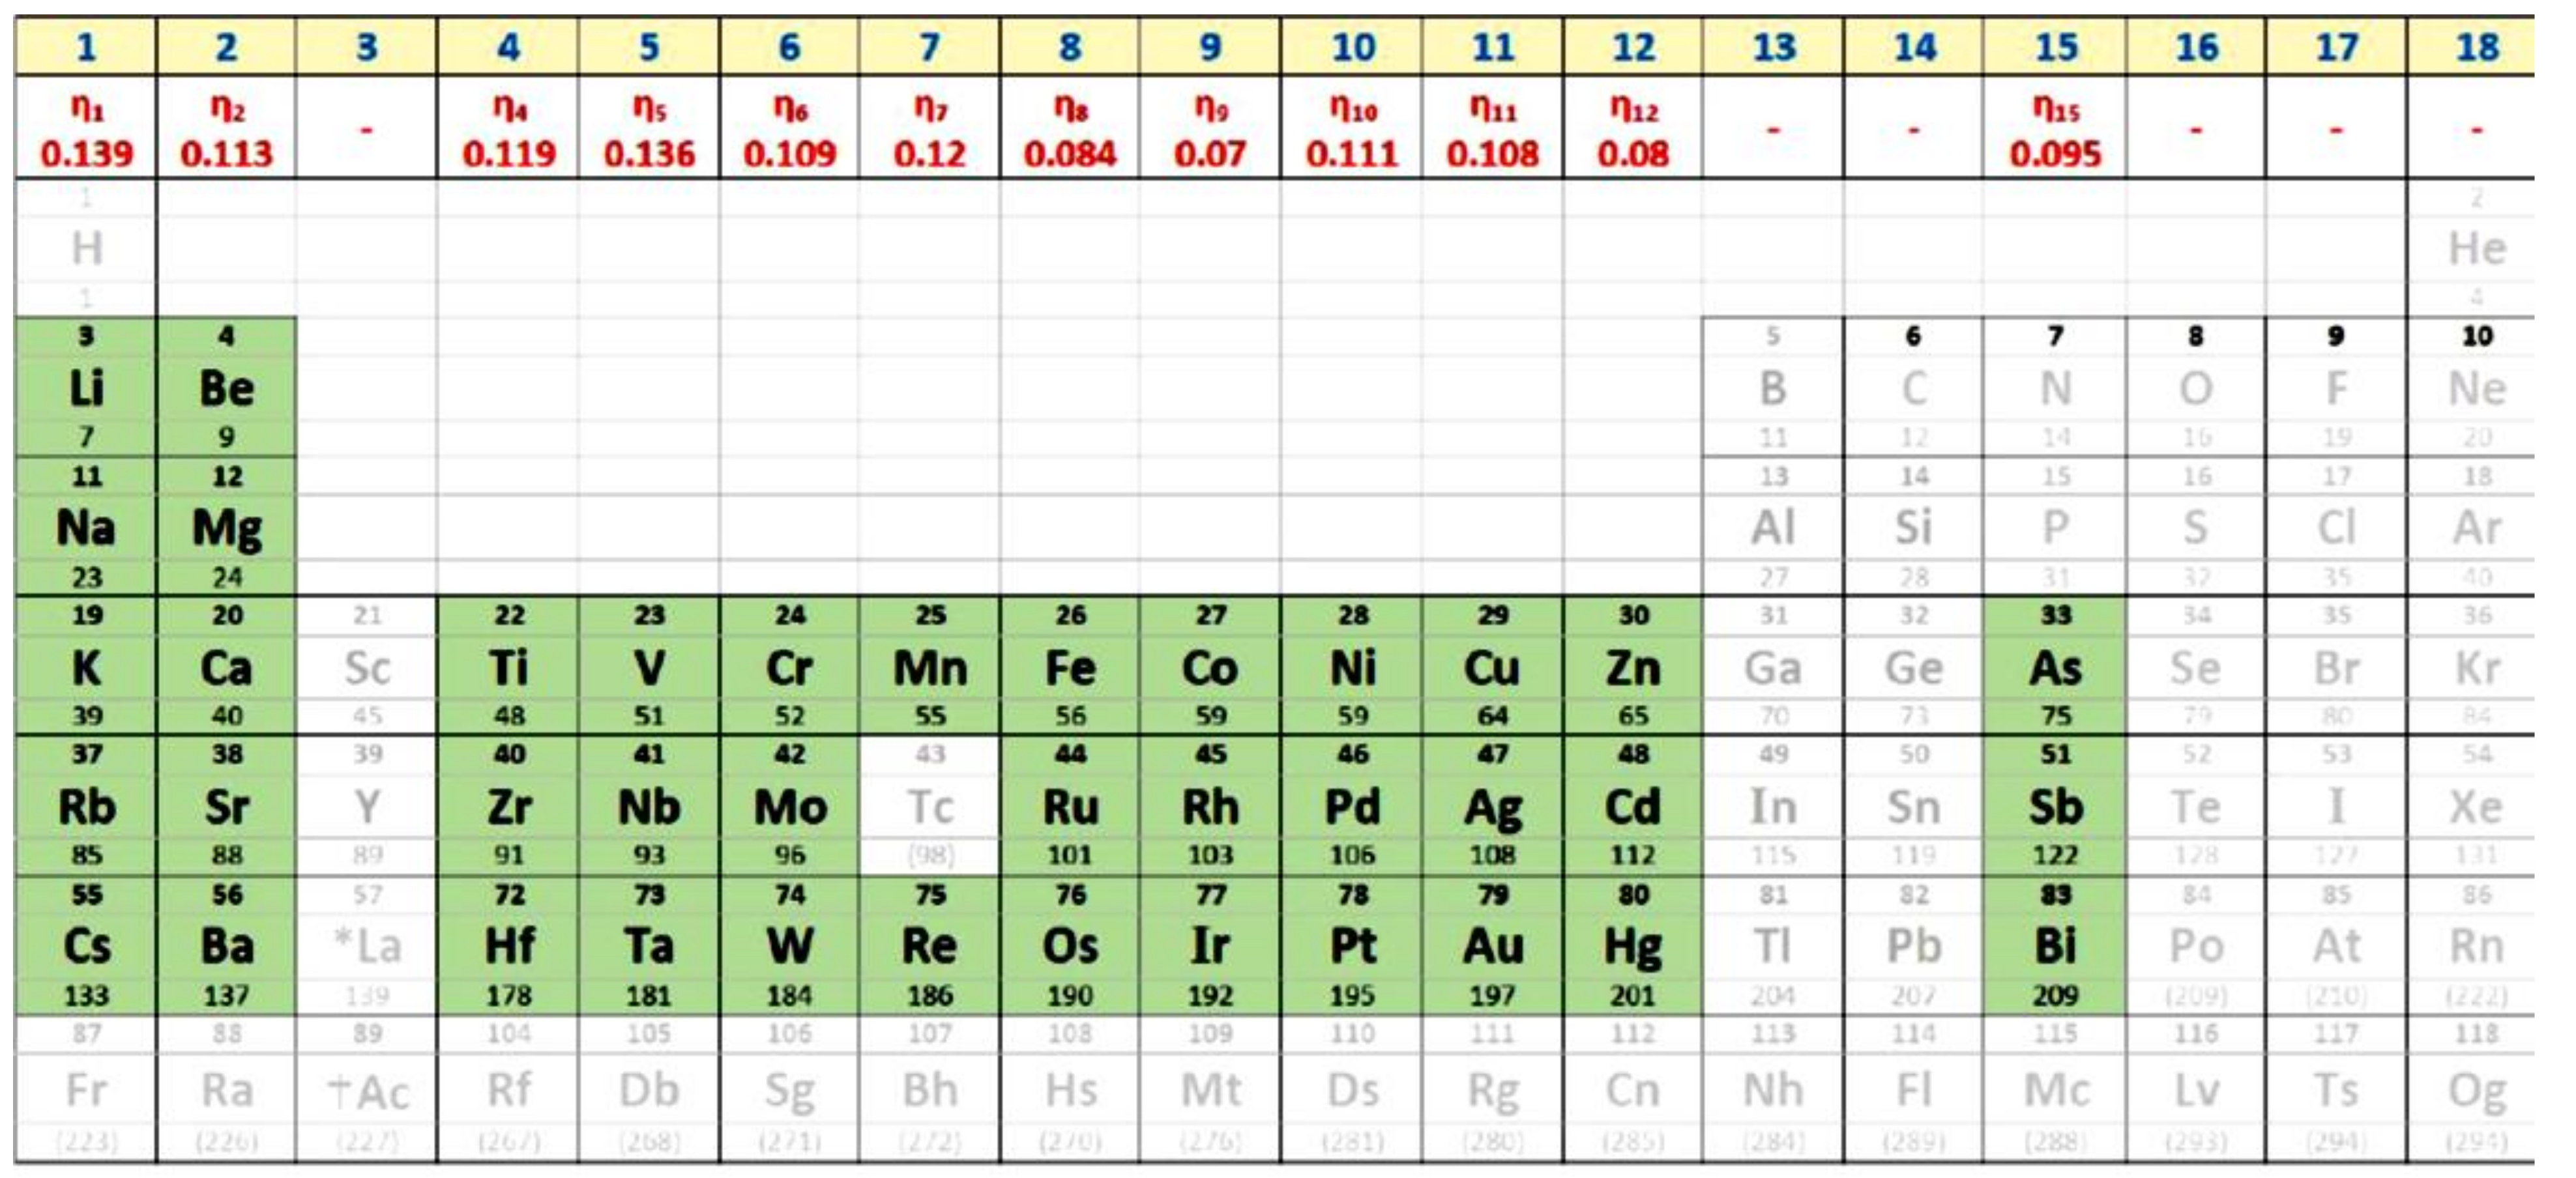
| δls | εgs0 | ∆εlg (θ0m) | 1.25 εgs0 | ∆εlg (θg) | θg | Tm | Tg | TD | |
|---|---|---|---|---|---|---|---|---|---|
| Li | 0.139 | −0.29732 | −0.16518 | −0.37165 | −0.13544 | −0.60368 | 464 | 184 | 581 |
| Ta | 0.136 | −0.29050 | −0.16139 | −0.36312 | −0.13305 | −0.60531 | 3288 | 1298 | 4109 |
| Re | 0.12 | −0.25440 | −0.14133 | −0.31800 | −0.11981 | −0.61382 | 3458 | 1335 | 4237 |
| Zr | 0.119 | −0.25216 | −0.14009 | −0.31520 | −0.11896 | −0.61433 | 2125 | 820 | 2600 |
| Mg | 0.113 | −0.23877 | −0.13265 | −0.29846 | −0.11377 | −0.61741 | 923 | 353 | 1121 |
| Ni | 0.111 | −0.23432 | −0.13018 | −0.29290 | −0.11202 | −0.61843 | 1728 | 659 | 2092 |
| Ag | 0.108 | −0.22766 | −0.12648 | −0.28458 | −0.10937 | −0.61994 | 1235 | 469 | 1489 |
| As | 0.095 | −0.19903 | −0.11057 | −0.24878 | −0.08824 | −0.62635 | 1090 | 407 | 1290 |
| Fe | 0.084 | −0.17506 | −0.09725 | −0.21882 | −0.08729 | −0.63159 | 1811 | 667 | 2109 |
| Zn | 0.08 | −0.16640 | −0.09244 | −0.20800 | −0.08346 | −0.63345 | 693 | 254 | 801 |
| Co | 0.07 | −0.14490 | −0.08050 | −0.18113 | −0.07368 | −0.63780 | 1768 | 640 | 2013 |
| θg = θn+ | εgs0 | θnG | TnG | εls (θnG) | εgs (θnG) | ∆εlg (θnG) | θn+ (θnG) | Tn+ | Tn+/Tm | TnG/Tm | |
|---|---|---|---|---|---|---|---|---|---|---|---|
| Ta | 0.29050 | 3.13616 | 0.27222 | 4183 | 2.61326 | 2.90376 | −0.29050 | 0.29050 | 4243 | 1.29050 | 1.27222 |
| Re | 0.31800 | 3.28633 | 0.27823 | 4420 | 2.71392 | 3.03193 | −0.31800 | 0.31800 | 4558 | 1.318 | 1.27823 |
| Zr | 0.11896 | 2.39071 | −0.19952 | 1701 | 2.17658 | 2.29554 | −0.11896 | 0.11896 | 2378 | 1.11896 | 0.80048 |
| Ag | 0.12648 | 2.41812 | −0.20456 | 982 | 2.19045 | 2.31694 | −0.12648 | 0.12648 | 1391 | 1.12648 | 0.79544 |
| Fe | 0.21882 | 2.79005 | −0.25049 | 1357 | 2.39618 | 2.61500 | −0.21882 | 0.21882 | 2207 | 1.21866 | 0.74951 |
| Cu | 0.35413 | 3.50151 | 0.28445 | 1744 | 2.86407 | 3.21820 | −0.35413 | 0.35413 | 1839 | 1.35413 | 1.28445 |
| Co | 0.0805 | 2.25612 | −0.16895 | 1469 | 2.11122 | 2.19172 | −0.0805 | 0.0805 | 1910 | 1.0805 | 0.83105 |
| Max | 0.47 | 4.37685 | 0.29310 | - | 3.53084 | 4.00084 | −0.47001 | 0.47001 | - | 1.47000 | 1.29310 |
| 1 | 2 | 3 | 4 | 5 | 6 | 7 | 8 | 9 | 10 | 11 |
|---|---|---|---|---|---|---|---|---|---|---|
| 2 | Tg (K) | θg | εgs0 | θnG | εls (θnG) | εgs (θnG) | ∆εlg (θnG) | TnG (K) | R (K/s) | LnR |
| Heating | ||||||||||
| 3 | 1200 | −0.02826 | 0.88766 | −0.33762 | 0.66000 | 0.78648 | −0.12648 | 818 | 2.27 × 10¹² | 28.45 |
| 4 | 1110.6 | −0.10066 | 1.71541 | −0.32584 | 1.30562 | 1.53328 | −0.22766 | 832.5 | 1.7 × 10¹² | 28.162 |
| 5 | 1023 | −0.17154 | 1.53040 | −0.25713 | 1.30274 | 1.42922 | −0.12648 | 917 | 1.18 × 10¹² | 27.797 |
| Cooling | ||||||||||
| 6 | 925 | −0.25095 | 1.33097 | −0.41358 | 0.81873 | 1.10331 | −0.28457 | 724 | −6.80 × 10¹¹ | 27.245 |
| 7 | 839 | −0.32059 | 1.15715 | −0.39673 | 0.74736 | 0.97502 | −0.22766 | 745 | −3.40 × 10¹¹ | 26.55 |
| 8 | 785.6 | −0.36384 | 1.04711 | −0.34755 | 0.76252 | 0.92063 | −0.15810 | 806 | −1.88 × 10¹¹ | 25.959 |
| 9 | 686.4 | −0.44417 | 0.83156 | −0.32438 | 0.63468 | 0.74406 | −0.10937 | 834 | −3.40 × 10¹⁰ | 24.249 |
| δls | θg | Tg | εgs0 | θnG | TnG | εls (θnG) | εgs (θnG) | ∆εlg (θnG) | θn+ | Tn+ | Tm | Ref. | |
|---|---|---|---|---|---|---|---|---|---|---|---|---|---|
| Ta | |||||||||||||
| 1 | 0.136 | 0.00000 | 3288 | 2.00000 | −0.23070 | 2529 | 1.76050 | 1.89356 | −0.13306 | 0.13305 | 3725 | 3288 | |
| 2 | 0.136 | 0.00000 | 3288 | 2.00000 | −0.25408 | 2453 | 1.70950 | 1.87089 | −0.16139 | 0.16139 | 3819 | 3288 | |
| 3 | 0.136 | −0.49817 | 1650 | 0.67235 | −0.39788 | 1980 | 0.43286 | 0.56591 | −0.13305 | 0.13305 | 3725 | 3288 | [84] |
| 4 | 0.136 | −0.49817 | 1650 | 0.67235 | −0.4382 | 1847 | 0.38187 | 0.54325 | −0.16139 | 0.16139 | 3819 | 3288 | [84] |
| Zr | |||||||||||||
| 5 | 0.119 | 0.00000 | 2125 | 2.00000 | −0.21814 | 1661 | 1.78587 | 1.90483 | −0.11896 | 0.11896 | 2378 | 2125 | |
| 6 | 0.119 | 0.00000 | 2125 | 2.00000 | −0.23672 | 1622 | 1.74784 | 1.88793 | −0.14009 | 0.14009 | 2423 | 2125 | |
| 7 | 0.119 | −0.52941 | 1000 | 0.57212 | −0.40785 | 1258 | −0.35799 | −0.47695 | −0.11896 | 0.11896 | 2378 | 2125 | [79] |
| 8 | 0.119 | −0.52941 | 1000 | 0.57212 | −0.44259 | 1184 | 0.31996 | 0.46005 | −0.14009 | 0.14009 | 2423 | 2125 | [79] |
| 9 | 0.119 | −0.58118 | 890 | 0.38727 | −0.49573 | 1072 | 0.17313 | 0.29209 | −0.11896 | 0.11896 | 2378 | 2125 | [79] |
| Ni | |||||||||||||
| 10 | 0.111 | 0.00000 | 1728 | 2.00000 | −0.21168 | 1362 | 1.79836 | 1.91038 | −0.11202 | 0.11202 | 1922 | 1728 | |
| 11 | 0.111 | 0.00000 | 1728 | 2.00000 | −0.22819 | 1334 | 1.76568 | 1.89586 | −0.13018 | 0.13018 | 1953 | 1728 | |
| 12 | 0.111 | −0.33449 | 1150 | 1.12207 | −0.28261 | 1240 | 0.92043 | 1.03245 | −0.11202 | 0.11202 | 1922 | 1728 | [85] |
| 13 | 0.111 | −0.4618 | 930 | 0.7812 | −0.3387 | 1143 | 0.57956 | 0.69158 | −0.11202 | 0.11202 | 1922 | 1728 | [86] |
| Ag | |||||||||||||
| 14 | 0.108 | 0.00000 | 1234.9 | 2.00000 | −0.20916 | 977 | 1.80313 | 1.91250 | −0.10937 | 0.10937 | 1370 | 1234.9 | [45] |
| 15 | 0.108 | 0.00000 | 1234.9 | 2.00000 | −0.22493 | 957 | 1.77233 | 1.89881 | −0.12648 | 0.12648 | 1391 | 1234.9 | [45] |
| 16 | 0.108 | 0.00000 | 1234.9 | 2.00000 | −0.30177 | 862 | 1.59021 | 1.81787 | −0.22766 | 0.15810 | 1430 | 1234.9 | |
| Cu | |||||||||||||
| 17 | 0.108 | 0.00000 | 1358 | 2.00000 | −0.30177 | 948 | 1.59021 | 1.81787 | −0.22766 | 0.22766 | 1667 | 1358 | [78] |
| 18 | 0.108 | −0.41090 | 800 | 0.92317 | −0.33107 | 908 | 0.6955 | 0.82198 | −0.12648 | 0.12648 | 1530 | 1358 | [78] |
| Fe | |||||||||||||
| 19 | 0.084 | 0.00000 | 1811 | 2.00000 | −0.29585 | 1275 | 1.60613 | 1.82495 | −0.21882 | 0.21882 | 2207 | 1811 | [78] |
| 20 | 0.084 | −0.42736 | 1000 | 0.82123 | −0.46169 | 975 | 0.42736 | 0.64618 | −0.21882 | 0.21882 | 2207 | 1811 | [78] |
| Co | |||||||||||||
| 21 | 0.07 | 0 | 1768 | 2 | −0.17948 | 1451 | 1.85504 | 1.93557 | −0.0805 | 0.0805 | 1910 | 1768 | [81] |
| 22 | 0.07 | −0.20136 | 1412 | 1.45491 | −0.21039 | 1396 | 1.31001 | 1.39051 | −0.0805 | 0.0805 | 1910 | 1769 | [81] |
| Metal | Tm, K | Tn+/Tm | Sd (in Units of R) | Hd, KJ/mol | S/Sm = H/Hm |
|---|---|---|---|---|---|
| Co | 1768 | 1.0805 | 44.83 | 686.60 | 0.925 |
| Zr | 2125 | 1.11896 | 30.90 | 578.32 | 0.894 |
| Ag | 1235 | 1.12648 | 29.16 | 318.25 | 0.888 |
| Fe | 1811 | 1.21866 | 17.60 | 292.03 | 0.821 |
| Ta | 3288 | 1.29050 | 13.68 | 422.60 | 0.775 |
| Re | 3458 | 1.318 | 12.64 | 414.67 | 0.759 |
| Cu | 1358 | 1.35413 | 11.53 | 140.19 | 0.738 |
Publisher’s Note: MDPI stays neutral with regard to jurisdictional claims in published maps and institutional affiliations. |
© 2021 by the authors. Licensee MDPI, Basel, Switzerland. This article is an open access article distributed under the terms and conditions of the Creative Commons Attribution (CC BY) license (https://creativecommons.org/licenses/by/4.0/).
Share and Cite
Tournier, R.F.; Ojovan, M.I. Prediction of Second Melting Temperatures Already Observed in Pure Elements by Molecular Dynamics Simulations. Materials 2021, 14, 6509. https://doi.org/10.3390/ma14216509
Tournier RF, Ojovan MI. Prediction of Second Melting Temperatures Already Observed in Pure Elements by Molecular Dynamics Simulations. Materials. 2021; 14(21):6509. https://doi.org/10.3390/ma14216509
Chicago/Turabian StyleTournier, Robert F., and Michael I. Ojovan. 2021. "Prediction of Second Melting Temperatures Already Observed in Pure Elements by Molecular Dynamics Simulations" Materials 14, no. 21: 6509. https://doi.org/10.3390/ma14216509