Article

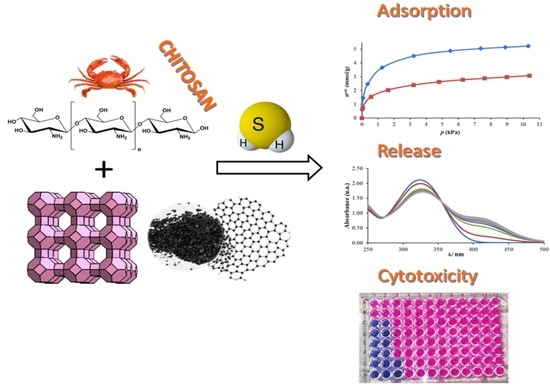
Chitosan Biocomposites for the Adsorption and Release of H2S

1
Centro de Química Estrutural, Faculdade de Ciências da Universidade de Lisboa, 1749-016 Lisboa, Portugal
2
CERENA, Departamento de Engenharia Química, Instituto Superior Técnico, Universidade de Lisboa, 1049-001 Lisboa, Portugal
*
Authors to whom correspondence should be addressed.
Materials 2021, 14(21), 6701; https://doi.org/10.3390/ma14216701
Submission received: 19 October 2021 / Revised: 2 November 2021 / Accepted: 4 November 2021 / Published: 7 November 2021
(This article belongs to the Special Issue Feature Collection on Porous Materials)

Abstract

:
The search for H2S donors has been increasing due to the multiple therapeutic effects of the gas. However, the use of nanoporous materials has not been investigated despite their potential. Zeolites and activated carbons are known as good gas adsorbents and their modification with chitosan may increase the material biocompatibility and simultaneously its release time in aqueous solution, thus making them good H2S donors. Herein, we modified with chitosan a series of A zeolites (3A, 4A and 5A) with different pore sizes and an activated carbon obtained from glycerin. The amount of H2S adsorbed was evaluated by a volumetric method and their release capacity in aqueous solution was measured. These studies aimed to verify which of the materials had appropriate H2S adsorption/release properties to be considered a potential H2S donor. Additionally, cytotoxicity assays using HeLa cells were performed. Considering the obtained results, the chitosan composite with the A zeolite with the larger pore opening was the most promising material to be used as a H2S donor so a further cytotoxicity assay using H2S loaded was conducted and no toxicity was observed.

Graphical Abstract

1. Introduction

Since its discovery by Carl Wilhelm Scheele in 1775 [1] research on hydrogen sulphide has been changing. Initially, it was mainly focused on its toxicology [2,3,4] and methods for separating it from gas mixtures [5]. The detection of endogenously produced H2S in the brain tissues of mammals in 1989 and the paper of Abe and Kimura suggesting that endogenous H2S plays a functional role in the regulation of neuronal function [6,7,8] redirected the research to the potential physiological and pathophysiological role of H2S. Currently, its therapeutic effects are recognized and exogenous H2S exerts cytoprotective and anticancer effects, promotes wound healing, inhibits platelet aggregation and protects against myocardial ischemia, among others [9,10]. However, the main challenge remains the effective exogenously delivery of H2S. The direct use of gas or sulphide salts has many drawbacks such as poor dose control leading to toxicity and difficulty in storing and handling gas at high pressures. Developing small molecules that trigger H2S after a specific stimulus (hydrolyses, thiol, light and enzymes) was an attempt to achieve controlled H2S release in biological conditions. However, their application has found some drawbacks, such as the fast diffusion of the molecules after administration that causes systemic delivery or the formation of by-products that may be toxic or responsible for the therapeutic effect, and poor water solubility [11,12]. Although some of those small molecules showed potential, some obstacles to their practical application have been observed. For instance, garlic and garlic-derived sulphur compounds are known to have protective effects in biological systems; however, it is claimed that this effect is from sulphane sulphur compounds and not from hydrogen sulphide [13,14] and the same was observed with p-hydroxybenzothioamide (thiol activated H2S donor). The amount of H2S released by this donor is so little that more investigations are needed to clarify if the observed biological activities may be attributed to H2S [13,15]. Another work involving Lawesson’s reagent demonstrated that it reduced the severity of colitis, yet in addition to the poor solubility of the Lawesson’s reagent the H2S release mechanism involved the hydrolysis reaction of the reagent, leading to an uncontrollable release of H2S [16]. Additionally, the synthesis of those donors may have several reaction steps, which may impede its use. Comprehensive reviews concerning H2S donors may be found [11,13,17], in which the great prevalence of homogeneous donors is evidenced. The use of porous materials as H2S donors has been less explored despite it being a promising strategy that may help to overcome some of the problems observed with homogeneous donors (synthesis, unknown reaction mechanism and formation of by-products). The high surface area of porous materials led to a high payload of the gas, yet its release may be faster than desired [12]. Surface modification of the material can be a strategy to overcome this limitation [18]. Among the high diversity of polymers that may be used for this purpose, chitosan—a biodegradable polymer (polysaccharide) with many biological applications (inhibition of tumour cells, antifungal properties, acceleration of wound healing) [19]—has been used in the modification of materials for several purposes [20,21]. Although its potential research concerning H2S adsorption and its release in the liquid phase by porous materials is very scarce [22].
Here, the H2S donors’ capacities of several materials, zeolites (3A, 4A, 5A), crystalline hydrated aluminosilicate, with different pore openings of 3, 4 and 5 Å and an activated carbon (obtained from glycerin) and their chitosan composites, were evaluated. The selection of the materials allowed us to observe the influence the ABET surface areas, the cation in the structure’s and material’s chemical nature have on their H2S adsorption/release capacity as well as on the synthesis of chitosan biocomposites.
The demonstration of the biocompatibility was assessed with cytotoxicity assays using HeLa cells for all the chitosan composites. The biocomposite 5A@Chi, the material that showed the best H2S adsorption/release proprieties, was loaded with H2S and cytotoxicity assays were also performed.

2. Materials and Methods

All chemicals were commercial and used as received. Zeolites (3A, 4A and 5A) from BDH—Laboratory Reagent, sulfuric acid 96%, acetic acid glacial, low molecular weight chitosan, sodium sulphide nonahydrate ≥ 99.99%, and Teflon (poly(tetrafluoroethylene)) particle size 35 μm from Sigma-Aldrich, a mixture of industrial crude glycerin (82% glycerol, from a Portuguese company) and 5,5′-Dithiobis(2-nitrobenzoic Acid) > 98% from TCI.
The HeLa (human cervical cancer cell line) cells for the cytotoxicity studies were from the American Type Culture Collection, Manassas, VA, USA. The medium RPMI-1640 without L-glutamine from Corning Inc. Penicillin-streptomycin, L-glutamine, foetal bovine serum (FBS), trypsin (2.5%, without phenol red), were from Thermo Fisher Scientific (Manassas, VA, USA).

2.1. Materials

The glycerin-based activated carbon (Gta@600) was prepared by a combination of acid carbonization and thermal activation, as described in detail elsewhere [23]. Briefly, the glycerin@char (G@char) was prepared by hydrothermal synthesis using a mixture of glycerin and sulfuric acid in a volume ratio of 1:0.5. The mixture was transferred to a Teflon-lined stainless-steel autoclave and the acid carbonization was made at 180 °C for 6 h in an oven (Medline Scientific Limited, model ON-02G) pre-heated to the desired temperature. The G@char was washed with distilled water until reaching pH 7 and was dried. The thermal activation of G@char under a N2 flow of 5 cm/min at 600 °C for 1 h led to the activated carbon (Gta@600).
Chitosan-based materials were synthesized using a methodology adapted from the literature [24]. Briefly, the chitosan (0.5 g) was dissolved in 1 wt. % of acetic acid solution (50 mL). Then, after complete dissolution (24 h), this mixture was added to a suspension containing 2 g of materials (zeolites or activated carbon) and 40 mL of water and it was stirred for 24 h. The mixture solution obtained was washed three times by centrifugation at 1400× g with distilled water, and was dried overnight at 50 °C.

2.2. Materials Characterization

Fourier-Transform Infrared (FTIR) spectra were acquired in KBr pellets using a Nicolet 6700 FTIR spectrometer between 4000 and 400 cm−1 (64 scanning; 4 cm−1 resolution). The samples were sputtered-coated with a gold/palladium alloy (80/20 wt.%) (5–10 nm thick) and the morphology of the powers was analysed by Scanning Electron Microscopy (SEM) performed on a Zeiss Supra 55 VP apparatus using 5 kV as the accelerating voltage. An X-ray diffractometer (Pan Analytical PW3050/60X’Pert PRO) was used to acquire the XRD patterns in the range of 5–60° (2θ) with CuKα radiation (λ = 0.15406 Å). Elemental analysis was carried out in a CHNS Analyzer (Thermofinnigan Flash, EA, 1112 series). Oxygen content for the activated carbons was obtained by the difference between the total percentage (100%) and the sum of percentage (wt.%) of carbon, hydrogen, sulphur, and nitrogen.
Nitrogen gas adsorption–desorption isotherms were measured at −196 °C in a constant volume adsorption automated apparatus (Quantacrome, Nova 2200e). Prior to measurements, about 50 mg of each sample was degassed under a vacuum of 0.133 Pa at 150 °C for 2 h and 120 °C overnight for zeolites and activated carbons materials, respectively. The N2 isotherms data were used to estimate the apparent area, ABET, and to evaluate it through the BET equation (0.05 < p/p0 < 0.15) and ISO 92777 [25,26]. The microporosity was analysed by NLDFT (non-local density functional theory) model, using the N2—silica equilibrium transition kernel at 77K based on a cylindrical pore model provided by NovaWin version 10.0 software. Thermogravimetry coupled with Differential Scanning Calorimetry (TG-DSC) data were obtained using equipment from Setaram (mod. TG-DSC 111). Experiments were carried out under air flux with a temperature ramp of 5 °C/min from ambient to 600 °C.

2.3. Hydrogen Sulphide Adsorption Studies

Gas-solid hydrogen sulphide adsorption isotherms (Air Liquide) were obtained at low relative pressures, with ≈ 60–100 mg of sample, by volumetric method. The sample temperature (25 °C) was maintained with a water bath (Sub Aqua 2 Plus, Grant). Sample outgassing was carried out in a vacuum greater than 10−2 Pa, for 2.5 h at 150 °C. This method is described in detail in References [27,28,29] and a schematic representation of the apparatus and of the methodology used are shown in the Supporting Materials (Figure S1.1).

2.4. Hydrogen Sulphide Release in Aqueous Solution

The H2S release from the materials was followed in aqueous solution by UV-Vis using the DTNB (5,5′-Dithiobis (2-Nitrobenzoic Acid)) based on a methodology previously reported [30]. The reaction involved is shown in Equation (1). Briefly, 1L of a DTNB solution (0.116 mM) was prepared by dissolving 46 mg of DTNB (>98% TCI) in 1L of PBS (phosphate buffer solution) at pH 7.2 prepared in mili-Q water. Before the release studies, a calibration curve was performed using the DTNB solution and a Na2S·9H2O solution freshly prepared. Aliquots of 10 μL of the Na2S solution (2.1 mM) were added to a cuvette having 3 mL of DTNB solution; 2 min after each addition the UV-Vis spectrum was taken between 250–550 nm. The obtained spectra and calibration curve are presented in the Supplementary Materials (Figure S2.1).
Materials 14 06701 i001
The release studies were conducted by adding the H2S loaded samples to the DTNB solution followed by stirring. The kinetic curves were obtained with a UV-Vis spectrophotometer (Genesys 10S UV-Vis Spectrophotometer from Thermo Scientific Blank) at room temperature. The first spectrum was acquired after 2 min of sample addition, followed by 15 min intervals until no changes were observed in the spectra. To prevent sample dispersion in the liquid phase, the materials were mixed with Teflon particles, in a wt.% ratio of 75:25 (sample:Teflon) to form pellets as described in [22,31]. The quantity of DTNB solution used was dependent on the material adsorption and release capacity and was such that it was in excess to assure that all the H2S released was quantified and produced considerable changes in the UV-Vis spectrum without saturating it. These conditions were achieved by using 2.5 mL of DTNB solution for Gta@600 (mpellets = 6.2 mg), Gta@600Chi (mpellets = 6.1 mg), 3A@Chi (mpellets = 8 mg) and 4A@Chi (mpellets = 5.4 mg) and 50, 150, 100 and 60 mL for 3A (mpellets = 4.1 mg), 4A (mpellets = 2mg), 5A (mpellets = 4.1 mg) and 5A@Chi (mpellets = 3 mg), respectively. The pellet was H2S loaded by introducing it into a small glass basket inside a glass container with a PTFE vacuum valve. The container was connected to the vacuum line, and samples were outgassed, as stated before. After the material returned to room temperature, H2S was introduced and was left equilibrating overnight. After evacuation, to remove the excess of H2S, the container was filled with helium until atmospheric pressure.

2.5. In vitro Cytotoxicity Studies

Cytotoxicity studies were performed using HeLa cells due to their broad use as a first assessment of materials’ toxicity. Before the assays, the cell culture was incubated at 37 °C in a humidified atmosphere with 5% CO2 and was left to grow until ≈ 70–80% subconfluency in the RPMI-1640 medium with 10% (v/v) foetal bovine serum (FBS), antibiotics (100 UI/mL penicillin and 100 μg/mL streptomycin) and 2 mM glutamine. To this end, cells were seeded in 96-well plates (2500 cells/well for the 72 h experiment and 7500 cells/well for the 24 h experiment) or in 12-well plates (112.5 cell/well for 48 experiment) for the loaded 5A@Chi studies. After 24 h incubation, the medium was replaced with fresh media containing the materials in suspension at 450 μg/mL for the materials’ cytotoxicity assays or solid H2S loaded 5A@Chi (1 mg/well or 4.5 mg/well) for release studies
Cell viabilities were determined by adding 10 μL/well or 200 μL/well of Alamar-Blue solution in 96 well plates and 12 well plates, respectively, and were incubated for 4 h at 37 °C. A change in the solution colour from blue to pink allows the quantification of the live cells by fluorescence (λex = 560 nm, λem = 590 nm). The relative cell viability (%) was calculated using untreated cells as a control and was calculated as follows (Equation (2)):
cell viability (%) = [fluorescence average]sample/[fluorescence average]control × 100
Data are expressed as mean value ± standard deviation (n = 3). Statistical significance was calculated using analysis of variance ANOVA.

3. Results

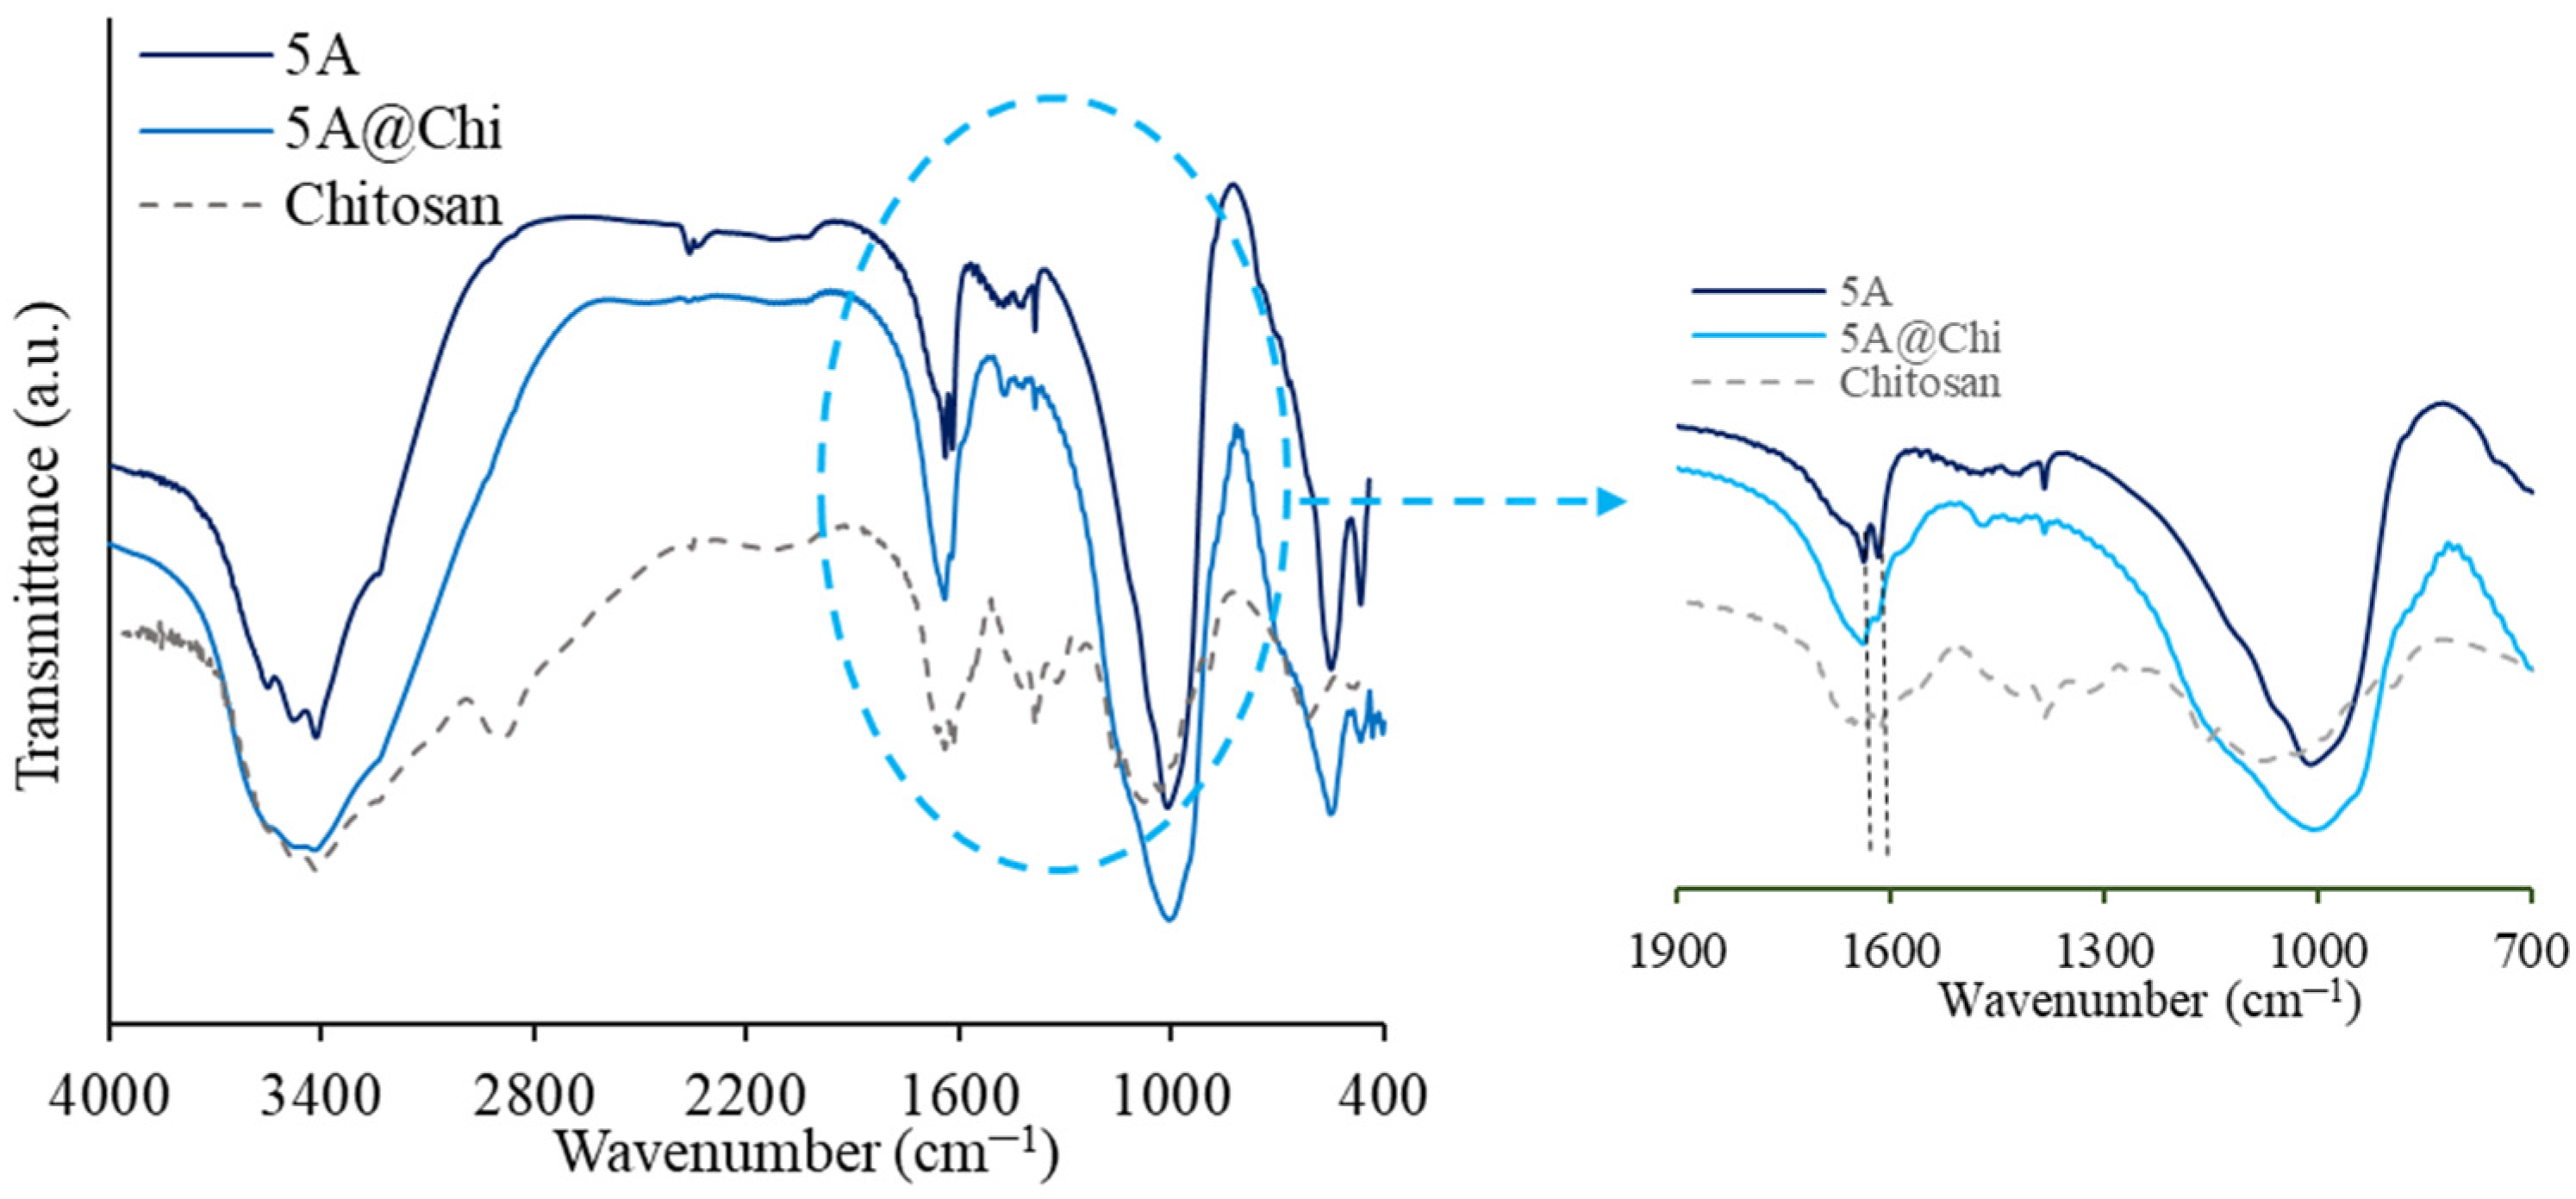
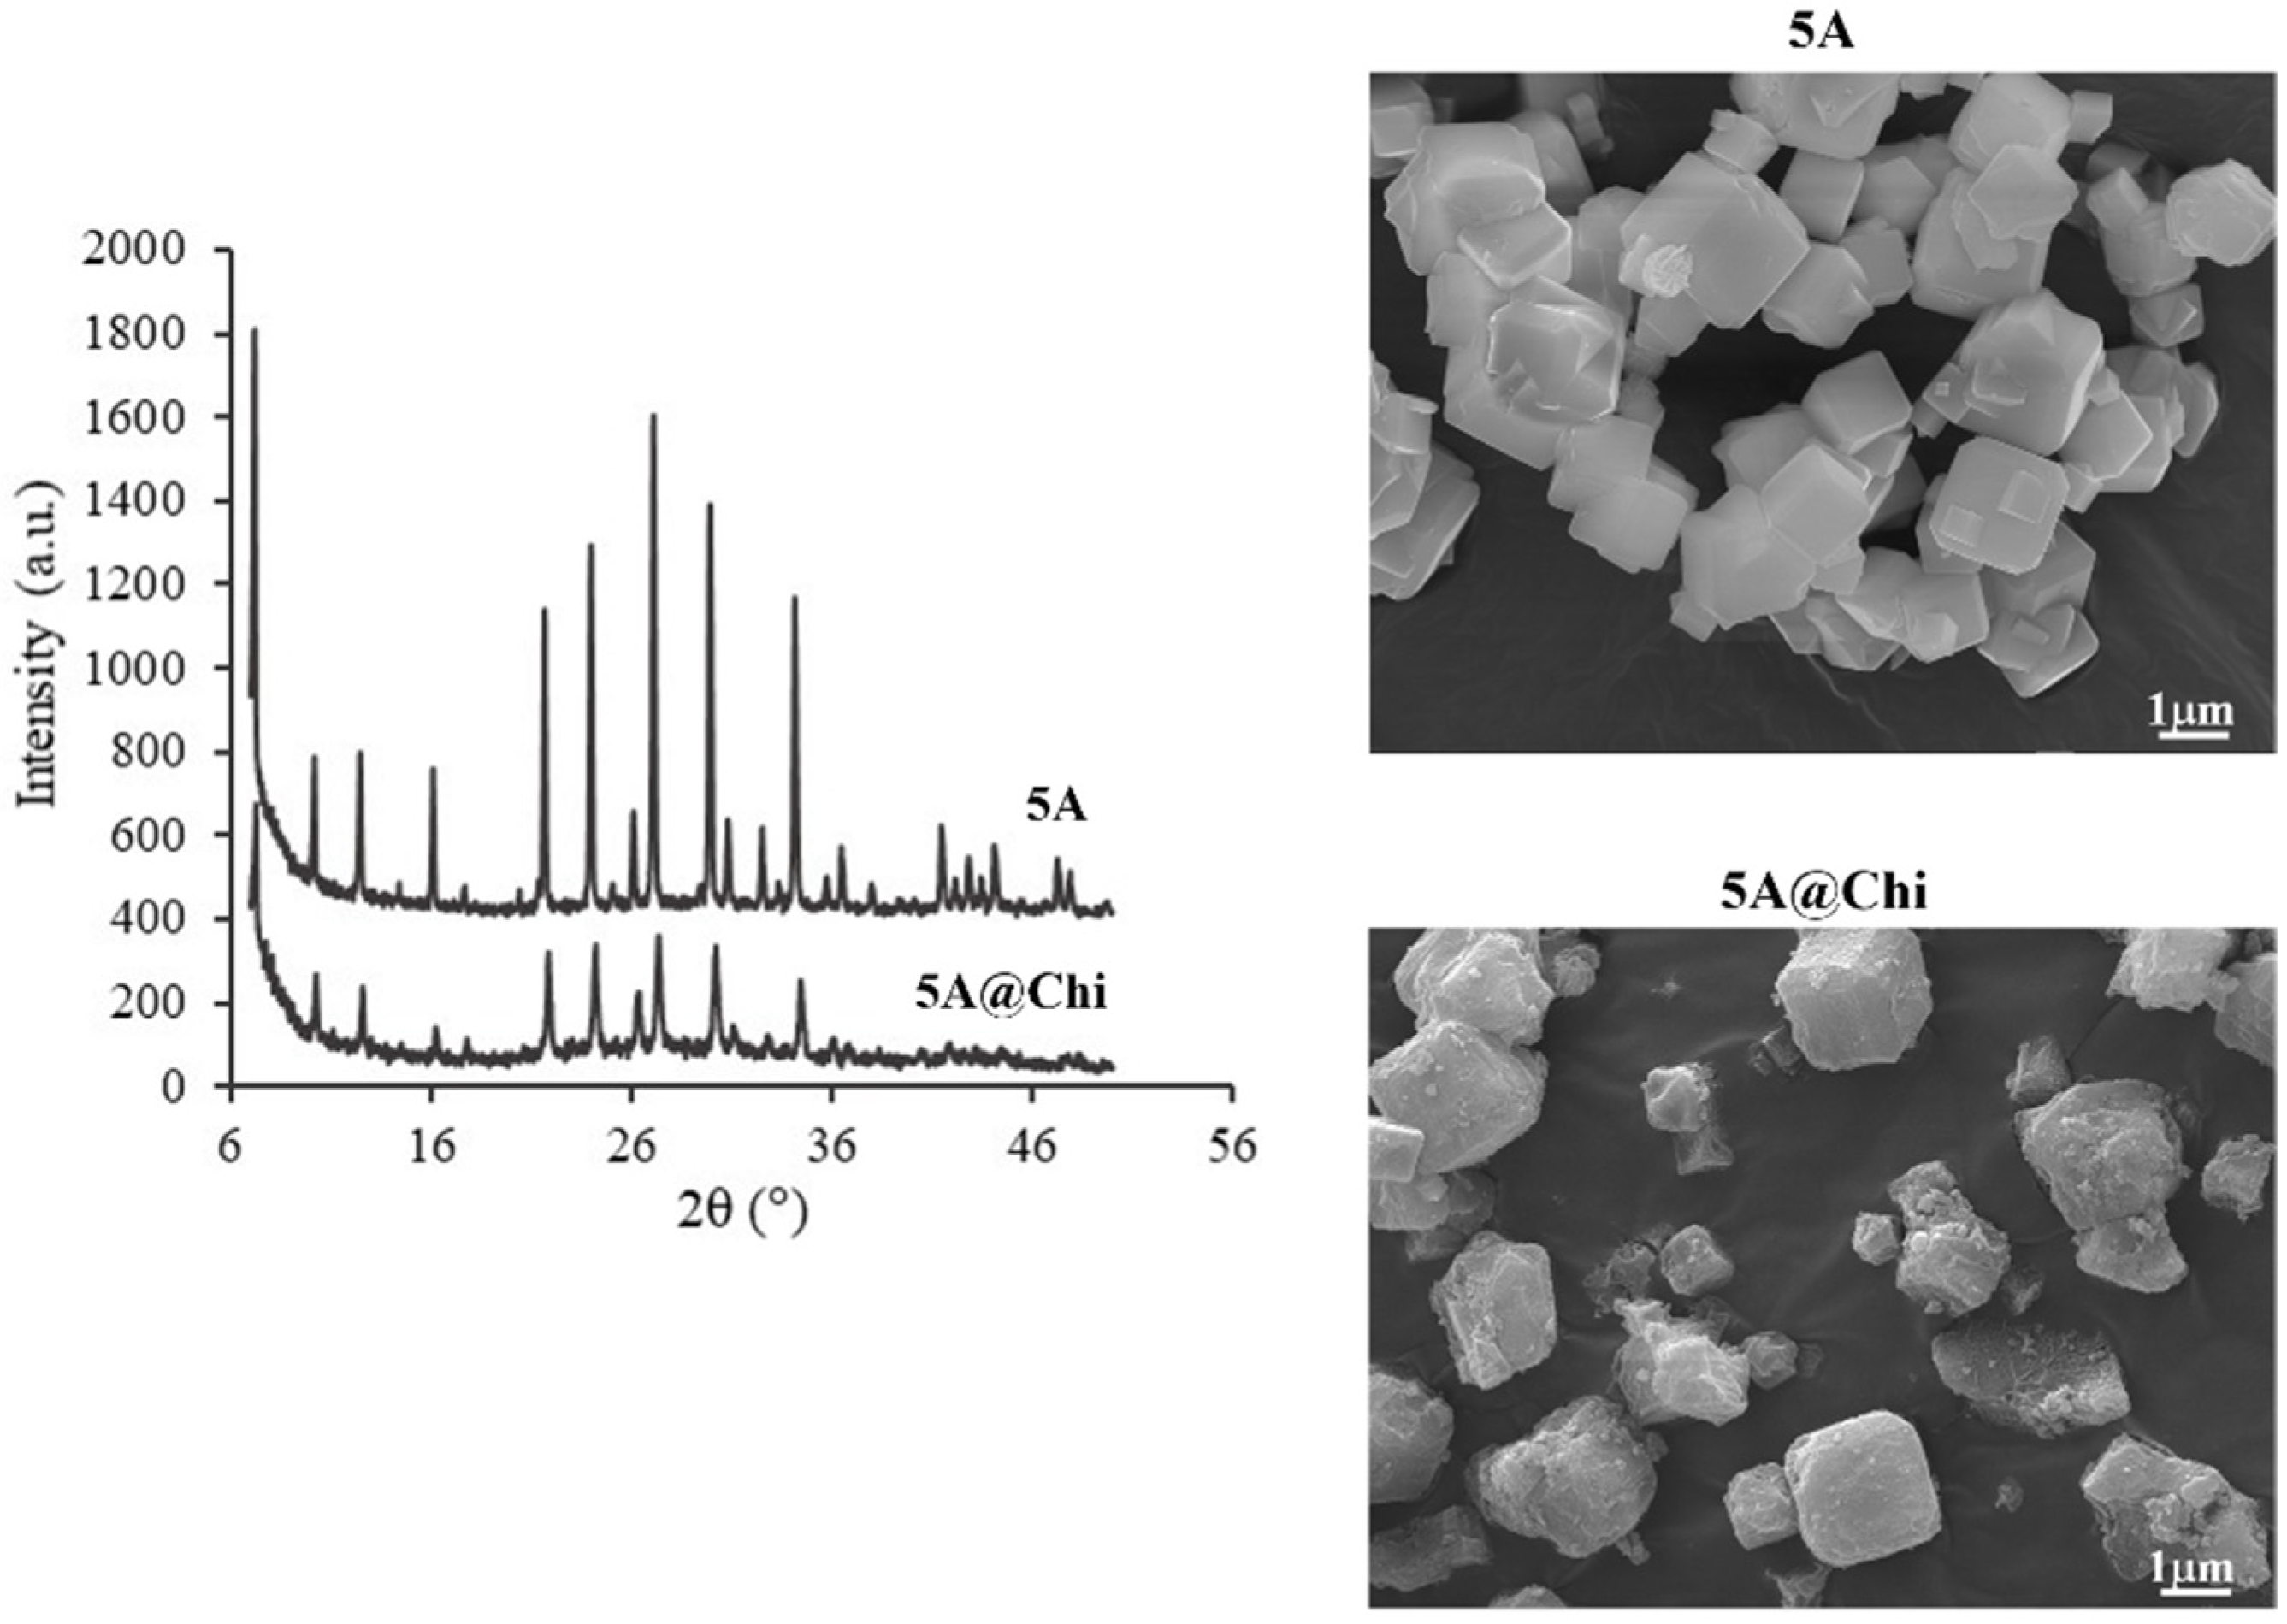
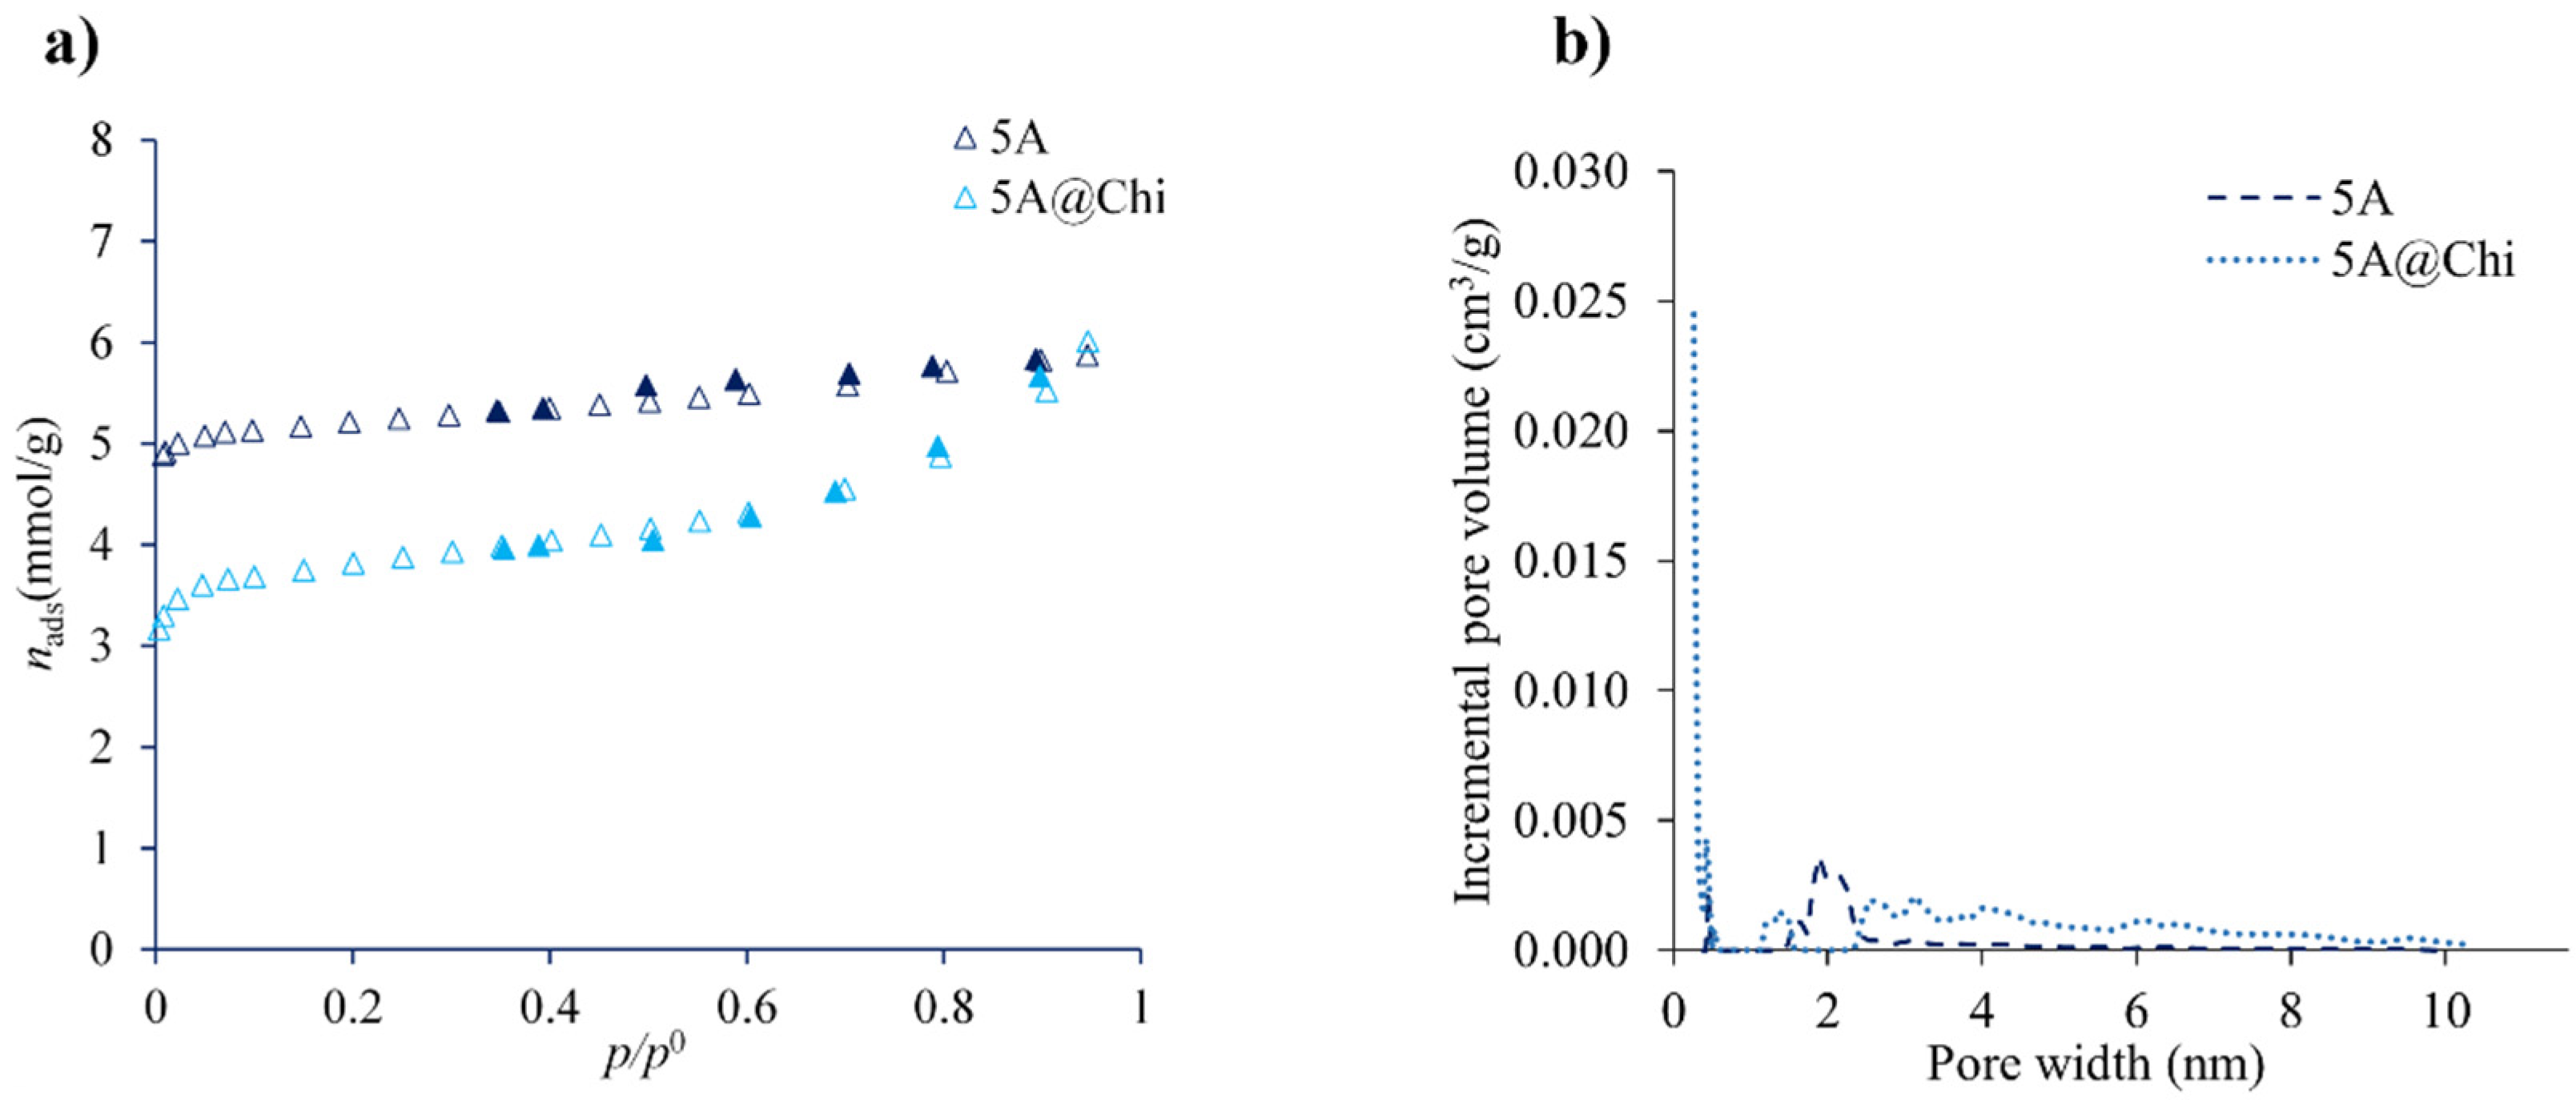
3.1. Characterization of the Materials

Different techniques were used for the characterization of the chitosan-modified materials such as Fourier-Transform Infrared (FTIR) spectroscopy, X-ray powder diffraction (XRD), Scanning Electron Microscopy (SEM), thermogravimetric analysis (TG-DSC), and elemental analysis. The results suggested that, although the chitosan was present in all the composites, the synthetic procedure led to some unexpected results in some of the studied zeolites. In fact, for 5A@Chi, all the data indicated the presence of the chitosan without the damage of the material’s surface. The FTIR spectra of the 5A@Chi (Figure 1) showed a broader band at ≈3600–3300 cm−1 in comparison with the 5A zeolite, which may be attributed to hydrogen-bonded O–H stretching overlapped with the several N–H stretching bands present in the chitosan. The bands in ≈1600 cm−1 zone may be attributed to the chitosan by its amide characteristic bands, with the C=O amide I and N–H bending amide II appearing at ≈1640 cm−1, and ≈1610 cm−1, respectively [19], but also to the stretching and bending vibration of the hydroxyl groups in the zeolites (1630 cm−1) [19,32]. The bands at ≈1415 cm−1 (C–N stretching coupled with N–H plane deformation) and ≈1390 cm−1 C–N stretching of the amino groups at 1325 cm−1 of chitosan were observed. Finally, the Si–O–Si and the Al–O–Si bending vibrations were observed at ≈440 cm−1 and 550 cm−1, respectively.
CHNS elemental analyses were also performed, and the results are shown in Table 1. The amount of C present in the 5A@Chi comes exclusively from the chitosan and confirms its presence yet is in low quantities. The fact that the N in the zeolites’ biocomposites could not be determined may be explained by its proportion in the chitosan. The elemental analysis of chitosan showed that the C proportion is 5.3 times more than N, so since chitosan is present in low quantities in the zeolites its determination is not possible [33].
The TG-DSC curves for 5A zeolite with and without chitosan (Figure 2) revealed initially (below 225 °C) a strong contribution for the mass decreases due to the water loss, corresponding to an endothermic peak in the DSC curve. After about 225 °C, the DSC signal is endothermic and can be ascribed to the polymer decomposition, that is, the oxidation of the organic molecules of chitosan in agreement with the data documented in the literature [34,35,36], indicating that the decomposition of chitosan, in various atmospheres, occurs mainly between 225 and 525 °C. In this way, Table 2 shows the amount of chitosan estimated by subtracting, for a respective material, the mass losses in the temperature range of 225–525 °C of the material with and without chitosan.
Figure 3 shows the XRD and SEM images of the 5A zeolite and 5A@Chi. The XDR pattern of 5A@Chi shows only a reduction in the reflection peak’s intensity in comparison with 5A, which may result from hydrogen bonds between chitosan and zeolite [37]. The SEM images show the representative well-defined cubic shape with a homogeneous and smooth surface of the type A zeolites [35] concurrently with the presence of chitosan in their surfaces.
The N2 adsorption-desorption isotherms at −196 °C of zeolites (5A and 5A@Chi) are shown in Figure 4a. The original zeolite (5A) exhibited a Type I isotherm with a small H4 hysteresis loop, as often found for zeolites [28]. For the biocomposite (5A@Chi), the isotherm is of the same type as for the parent material, but the H4 hysteresis loop [28] is now more evident, as a more probable consequence of the chitosan deposition. The latter observation agrees with some (although low) degree of mesoporosity that is formed upon the modification of the zeolite with chitosan, as can be noticed from the pore-size distribution in Figure 4b. The obtained ABET surface areas, in the context of the present work, are regarded as an apparent surface as indicated by IUPAC [28], for 5A and 5A@Chi were of 409 m2 g−1 and 301 m2 g−1, respectively, which corresponds to a decrease of ≈26%, suggesting that chitosan is partially covering the pores. If the reduction in the microporous volumes (obtained by the t-method [28]) is considered, from 0.167 to 0.102 cm3 g−1 for 5A and 5A@Chi, respectively, the decrease is even higher (39%).
For the other zeolites composites (3A@Chi and 4A@Chi), the TG-DSC (Figure S3.1), SEM images (Figures S4.1 and S4.2) and elemental analysis gave similar results to the 5A@Chi mostly due to the nature of the techniques, it being possible to assert by the elemental analysis (% carbon) (Table 1) and TG-DSC (Table 2) that the presence of chitosan was more expressive in the 4A@Chi composite and less for the 3A@Chi. Nevertheless, the FTIR spectra and the XDR pattern revealed unexpected results. The FTIR spectra (Figures S5.1 and S5.2) showed the same bands as 5A@Chi, an exception was made for the Al–O–Si bending vibrations, which was not present while, in the XDR (Figures S4.1 and S4.2), the reflection peaks were broadened suggesting the loss of the crystalline domain. These observations led to the fact that there would be any aspect in the synthetic procedure that could explain this evidence, then we decided to treat the 4A zeolite only with a solution of acetic acid 1 wt.% without chitosan (4A@Ac). The FTIR spectrum had substantial changes when compared with the untreated 4A zeolite, one of them being the disappearance of the Al–O–Si bending vibrations (Figure S5.3), suggesting that the acetic acid solution affected the crystal structure of 4A zeolite. The XDR pattern also shows broadened reflection peaks (Figure S4.3). In fact, this phenomenon has already been mentioned by Kyotani et al. [38], who noticed acetic acid may damage the surface of NaA zeolite by way of the dissolution of sodium and silicon affecting the crystal structure and elemental composition.
The 4A@Chi N2 isotherms (Figure S6.1) presented a Type II isotherm with a surface area of 48 m2 g−1; the 4A@Ac showed a Type I isotherm with an ABET of 110 m2 g−1 (Figure S6.2), while the 4A zeolite had ABET of 363 m2 g−1 [37]. This high decrease in the area of 4A@Chi (≈87%) and 4A@Ac (≈70%) in comparison with the 4A zeolite confirms that the acetic acid solution affects the 4A zeolite structure and the presence of chitosan.
Finally, the Gta@600 and Gta@600Chi FTIR spectra (Figure S5.4) display the glycerin-carbons bands of symmetric (971–1220 cm−1) and asymmetric (1384 cm−1) stretching modes of −SO3H groups. The amides bands of the glycerin-carbons (1637 cm−1 and 1614 cm−1) could also be observed, which overlap the amides regions of the chitosan. No relevant information could be retrieved (Figure S4.4) for Gta@600 and Gta@600Chi from XDR since both materials showed broad reflections, indicating the amorphous patterns, as expected for this type of carbon material [39].
The TG-DSC analysis (Figure S3.1) indicated that a similar situation occurs initially for the carbon material (Gta@600) in comparison with the zeolite´s composites, although the total mass loss at the end is more pronounced due to the decomposition of the carbon matrix itself. The elemental analysis (Table 1) of the Gta@600 and Gta@600Chi shows a decrease in the carbon quantity due to the presence of chitosan. This may be related to the increase in the oxygen content that is present in the chitosan polymer.
Finally, the Gta@600 displayed a Type I isotherm corresponding to microporous materials, which was further confirmed by the DFT pore-size distribution in (Figure S6.3a,b)). The Gta@600Chi exhibited an isotherm characteristic of a non-porous material and with low surface area (<5 m2 g−1), as a most probable consequence of the extensive coverage of the porosity by the chitosan. In fact, as shown in Table 2, the Gta@600Chi was the material with the highest chitosan amount.

3.2. Hydrogen Sulphide Adsorption Isotherms

The H2S adsorption data show that, among the composites, only the 5A@Chi presented some adsorption capacity. For the others it became negligible. These results corroborate the N2 isotherms data, namely, those obtained for Gta@600Chi, indicating the formation of a non-porous material, suggesting that the introduction of the polymer in the Gta@600 blocked the access to the pores; whereas, for 4A@Chi, besides this pore blocking event it may also result from the surface damage caused by acid acetic solution as discussed before.
Analysing the parent materials, in the case of 4A and 5A zeolites (Figure S7.1), with pore openings of 0.38 and 5 nm [40], respectively, hydrogen sulphide is expected to enter the structure (Figure S7.2) as seen by the amounts adsorbed in Figure 5 and Figure S1.2. Following the same reasoning, the 3A zeolite has a pore opening of 0.3 nm [40], thus H2S molecules (kinetics diameter is 0.36 nm [41]) do not easily access the porosity of the material, making the adsorption kinetics too slow. This explains why no isotherm was obtained for the latter.
Among all the parent materials, 5A zeolite has the higher adsorption capacity for hydrogen sulphide, followed by 4A zeolite and activated carbon. Although the ABET of the activated carbon (466 m2 g−1) is higher than for 5A zeolite (409 m2 g−1), it has a lower adsorption capacity, suggesting that, besides the apparent surface area, the interactions with the surface, namely between the cations in the zeolite and the H2S dipole (0.98 D [42]), can also play an important role. On the other hand, the higher adsorption of 5A in comparison with 4A may be attributed, besides the higher ABET, to the presence of the Ca2+ cation in its structure, which is known to increase the H2S adsorption capacity on LTA zeolites [43].
Additionally, the adsorption capacity of chitosan for the H2S was evaluated (Supplementary Materials Figure S1.3) and no significant adsorption was observed.

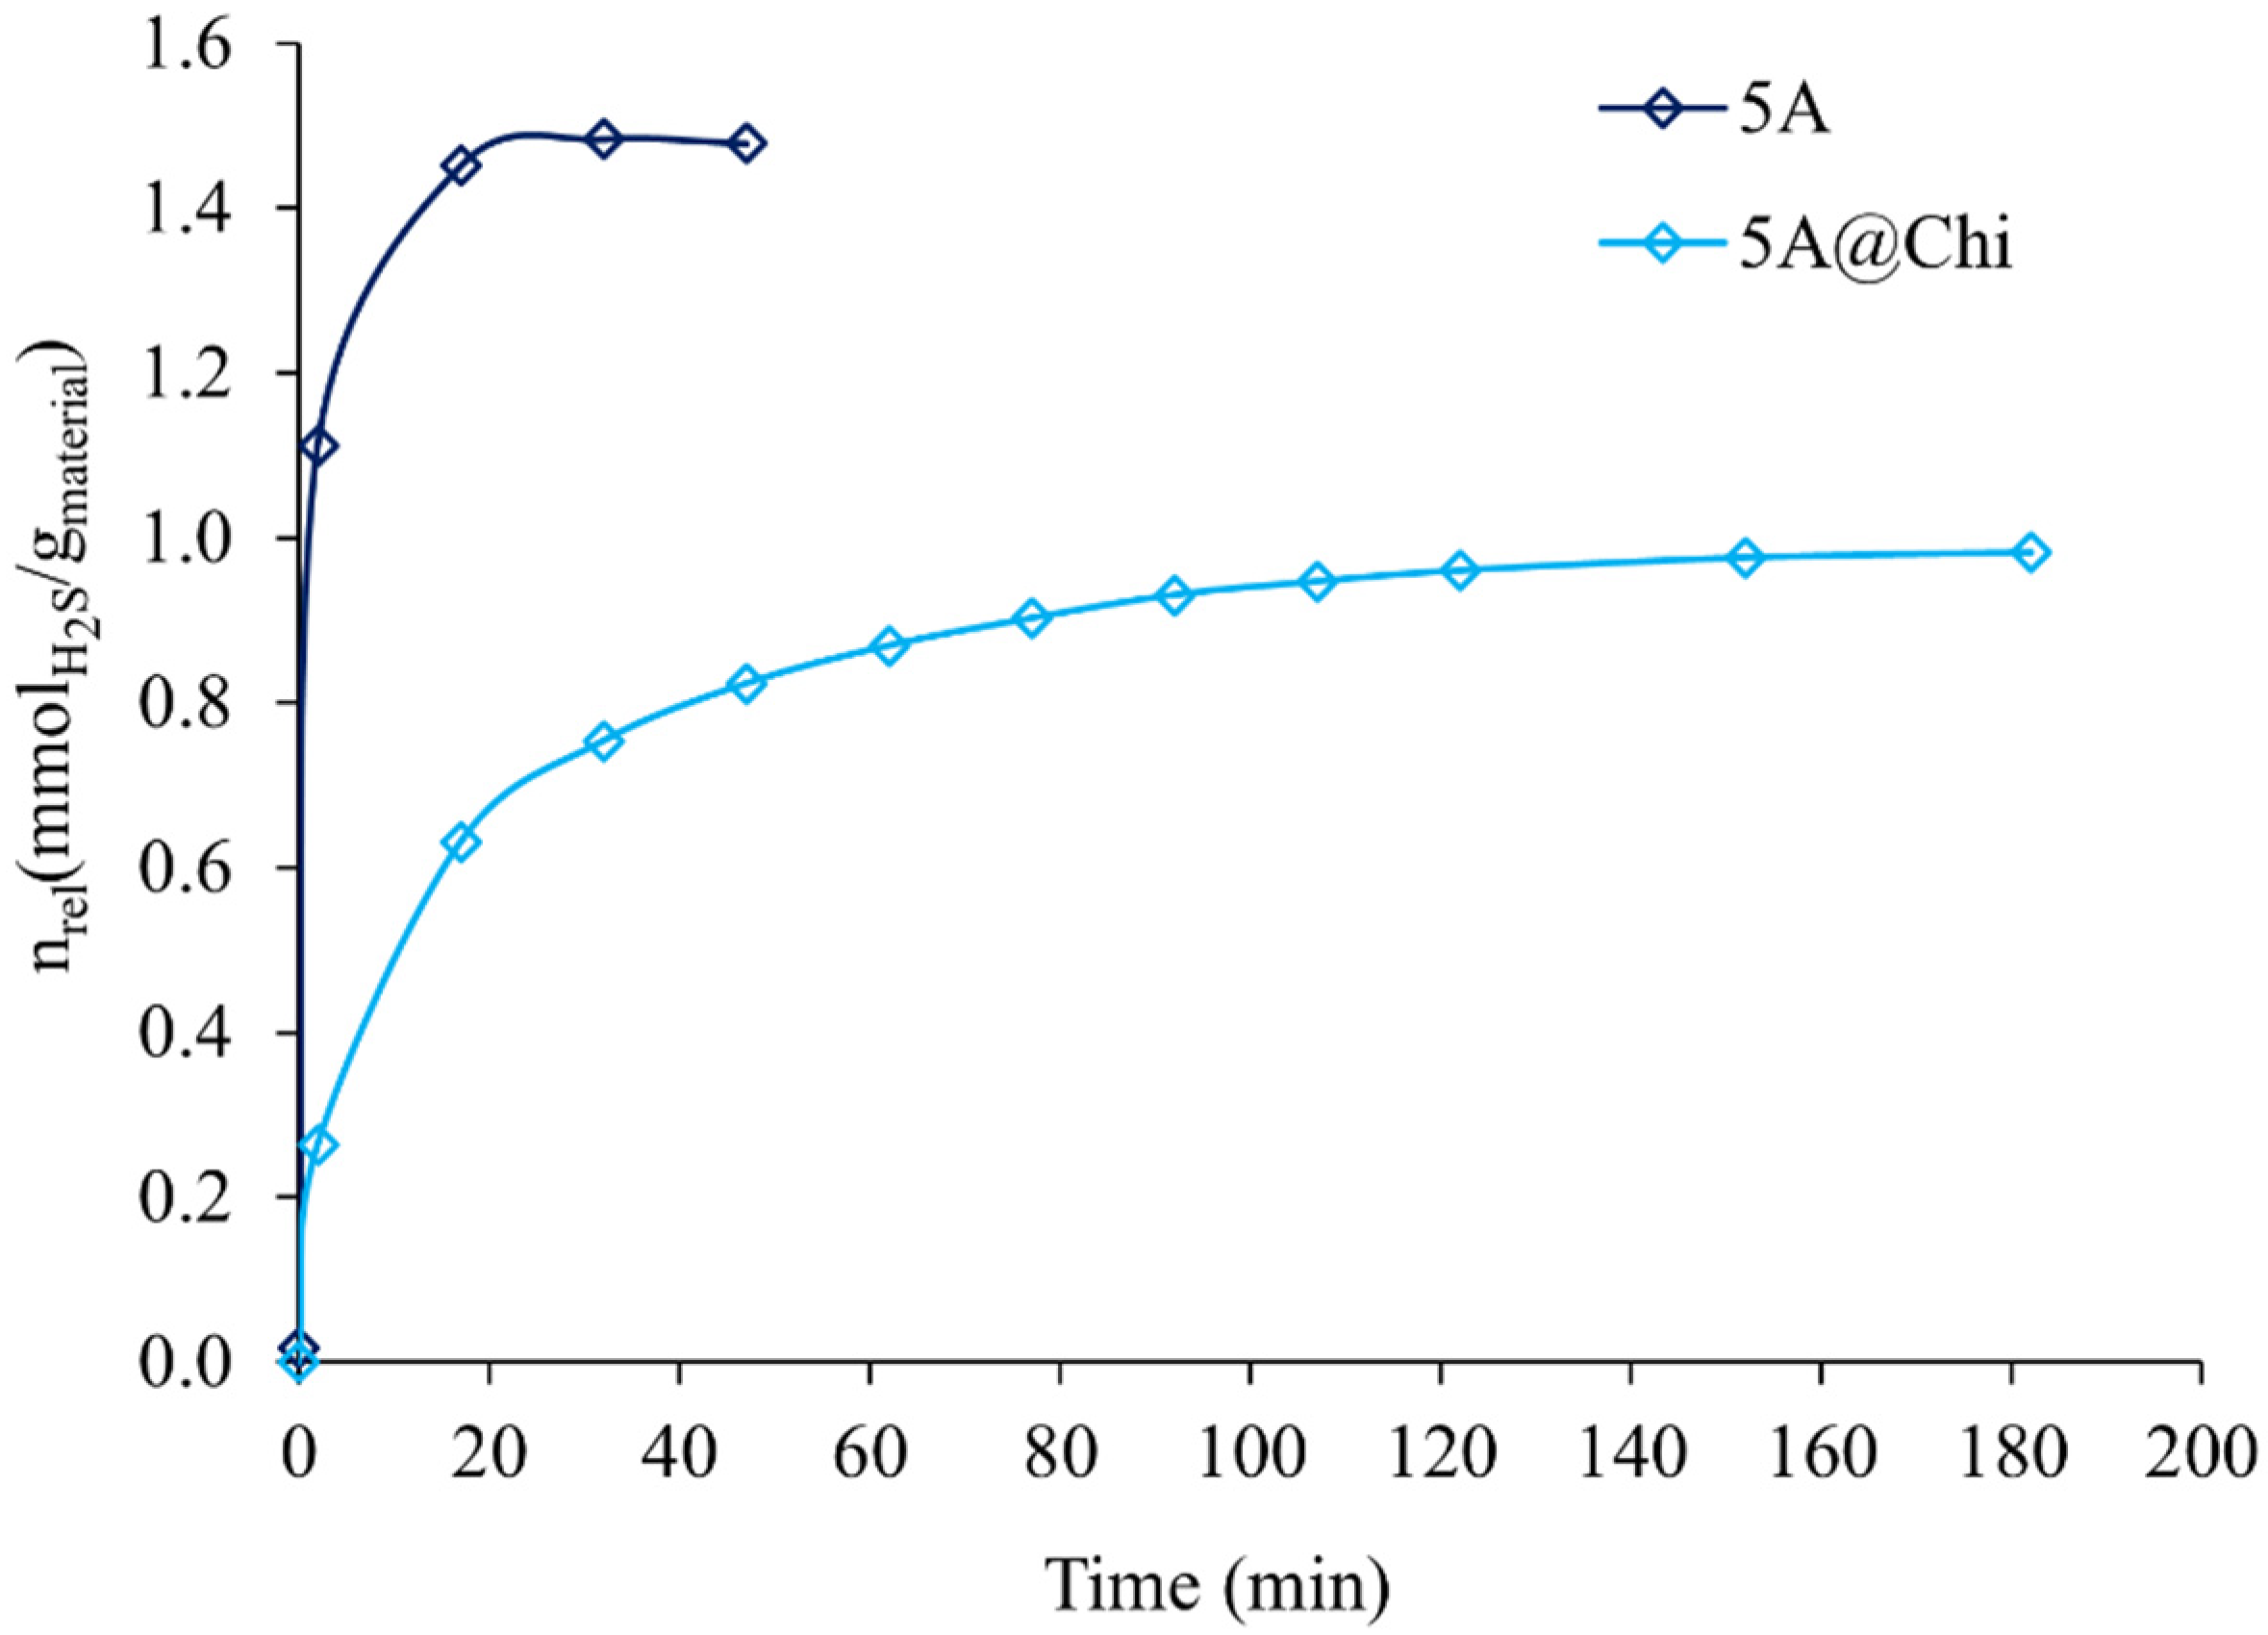
3.3. Hydrogen Sulphide Release in Aqueous Solution

The H2S release in aqueous solution at pH=7.2 was very fast for all the studied materials (≈17 min) except for 5A@Chi (Figure 6 and Supplementary Materials Figure S2.2). In this material, after an initial burst (17 min) corresponding to the release of ≈64% of the total gas released, a still release until 120 min was observed. Additionally, the amount of H2S released by the composites was also negligible (except for 5A@Chi) and is in line with the marked reduction in the porosity, as already discussed. Additionally, analysing Table 3 it is also possible to observe that the materials released only a small part of the adsorbed gas. In the zeolites, this may be explained by the dissociation of H2S, by its coordination to the cations and/or by hydrogen-bond interactions with the framework oxygen or with SiOHAl [41]. The fact that 5A zeolite has Ca2+ ion in its framework leading to a stronger interaction with H2S, allied with its larger micropore size and volume allowing a deeper position inside the pores, may explain the amount released by 5A zeolite, since in the literature the dissociative H2S adsorption is mostly reported to occur with Na+ cations [43]. Finally, for 5A@Chi, a slow release was observed, indicating chitosan was able to delay the release of the gas, having reached the balance between the adsorbed and release kinetics. Although this is an important result, it is still behind the existing homogenous materials, which have longer releasing times, yet some of them, such as a phosphonamidothioate-based molecules, have a similar peak time (10 min) [44,45].
Regarding the activated carbon, the H2S released (Figure S2.2) was insignificant, which may be explained by material–H2S interaction. In fact, it is recognized that these interactions are very complex in activated carbons [46] and a more extended degradation of H2S may happen. Furthermore, in the release curve of Gta@600 after a plateau in absorbance had been reached, a decrease was observed due to the adsorption by the Gta@600 of the 5-thio-2-nitrobenzoate anion formed during the reaction (Equation (1)).

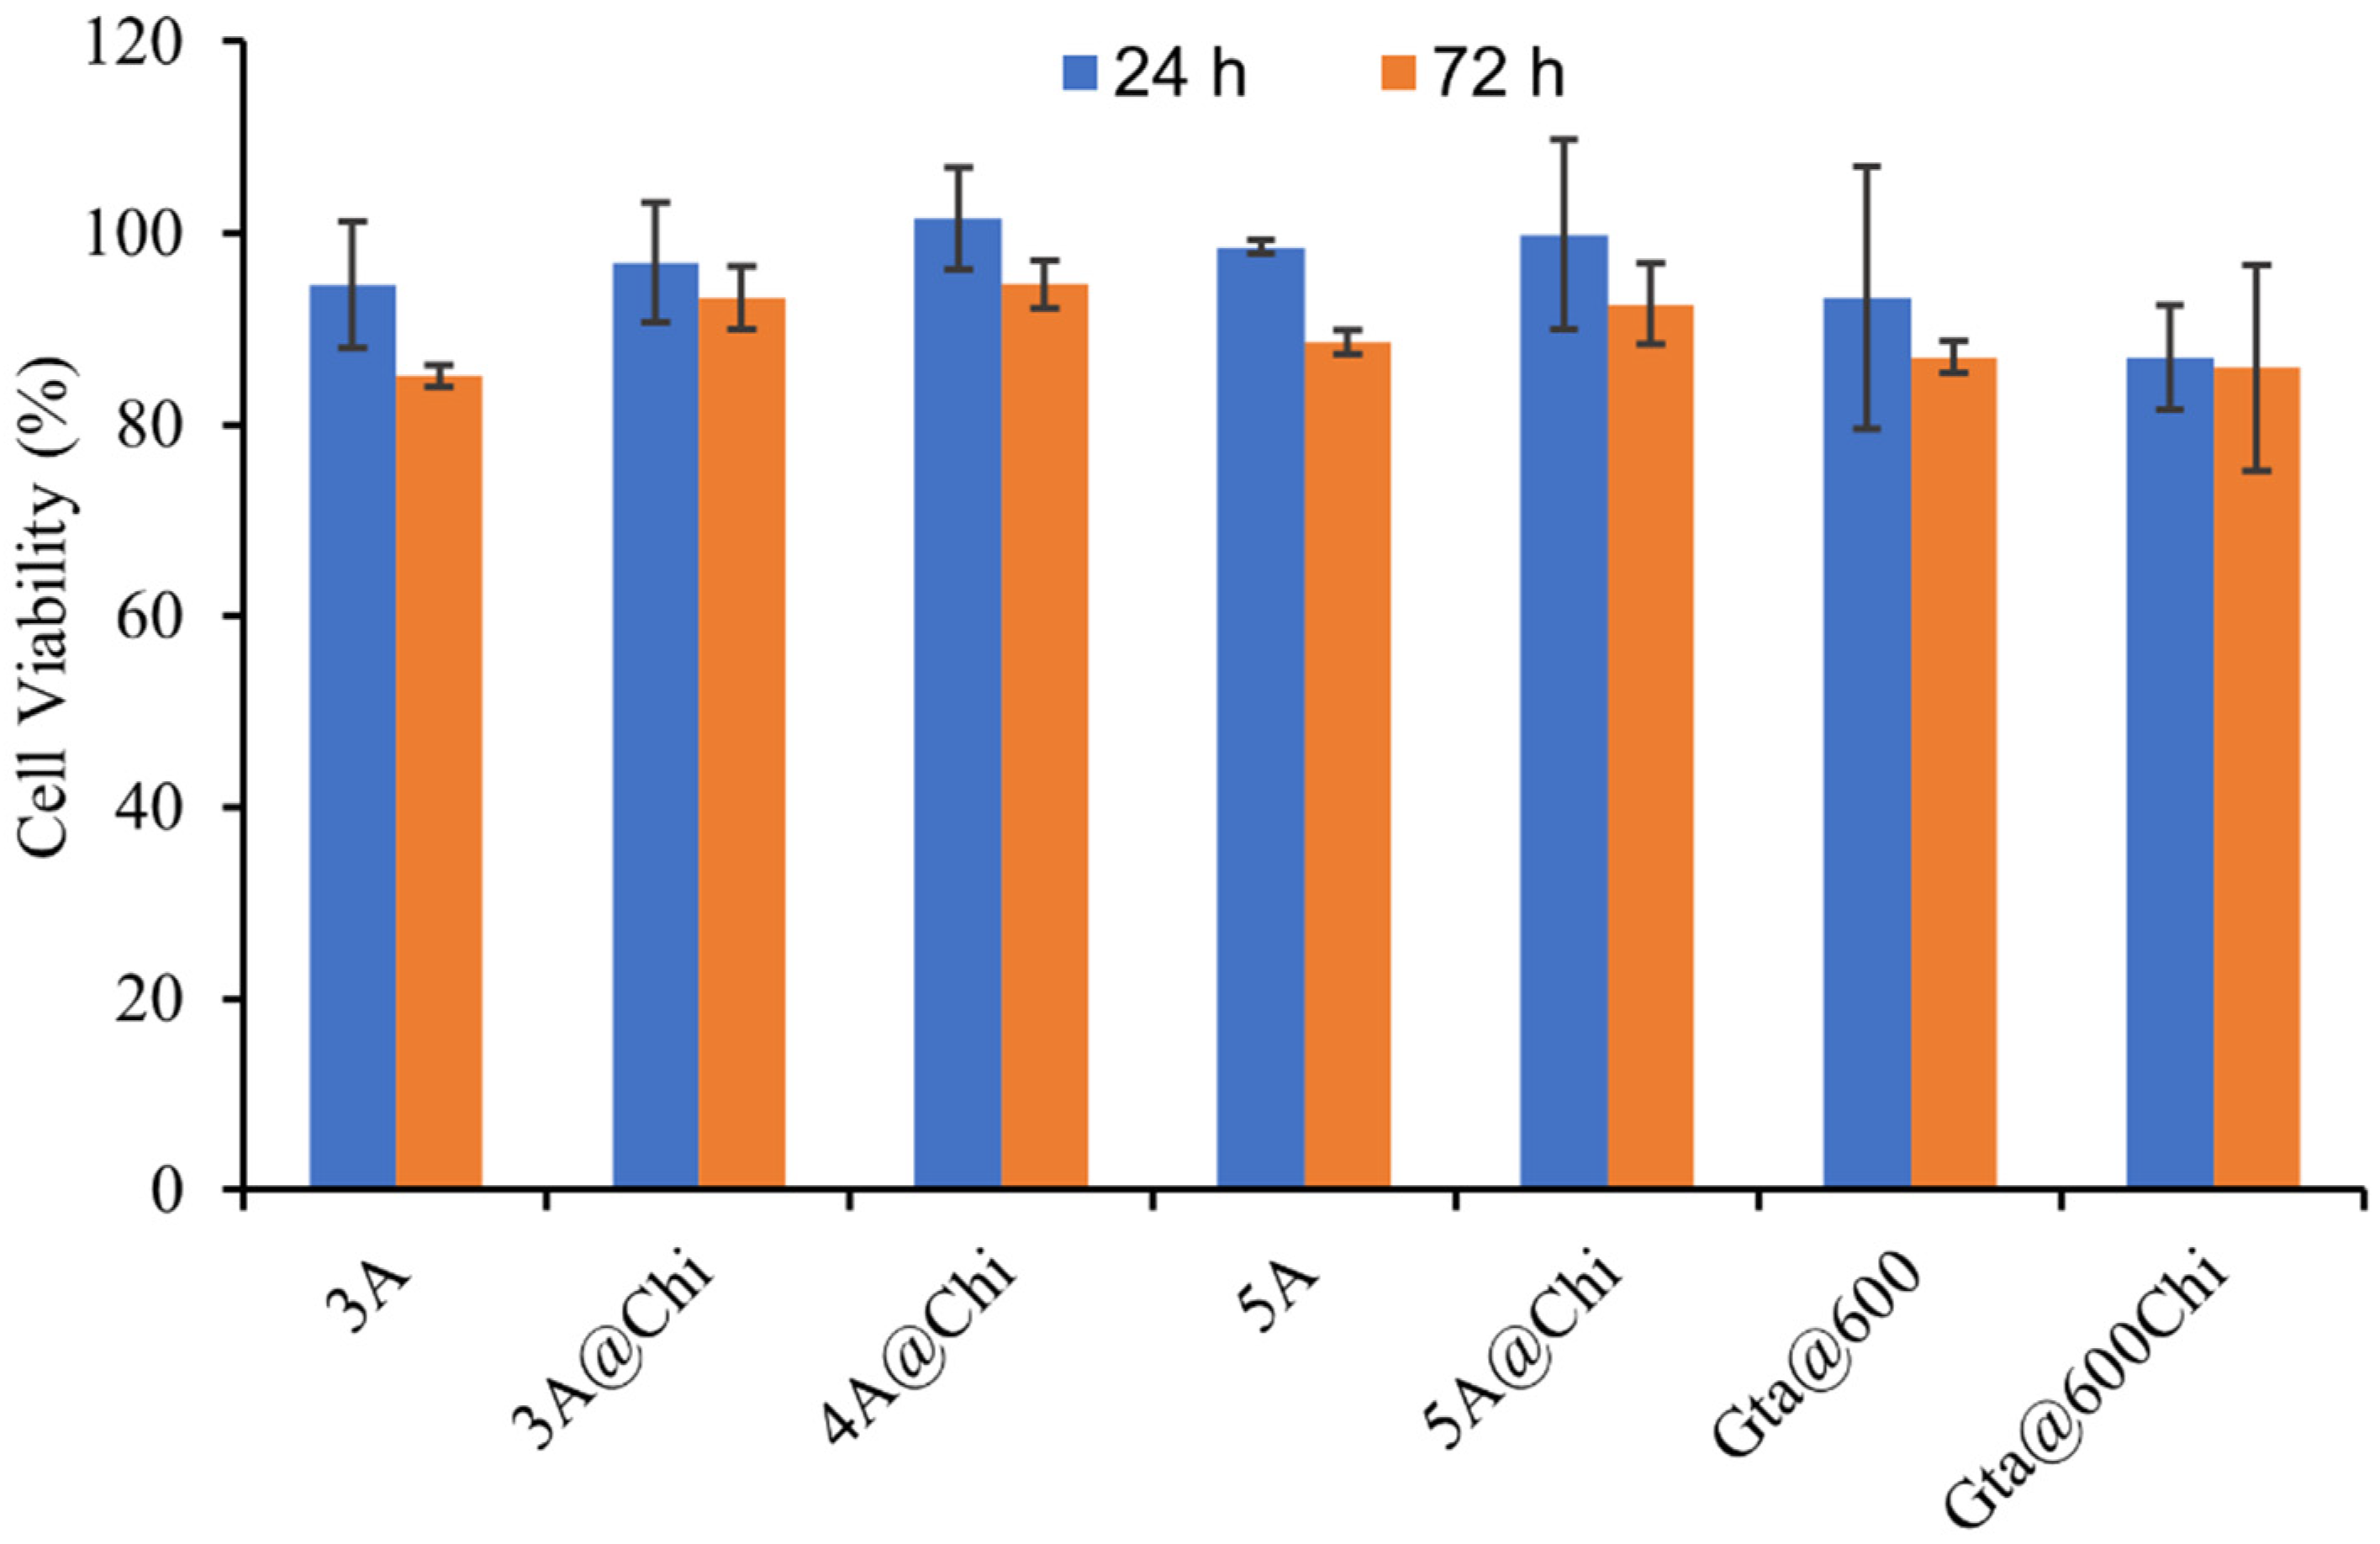
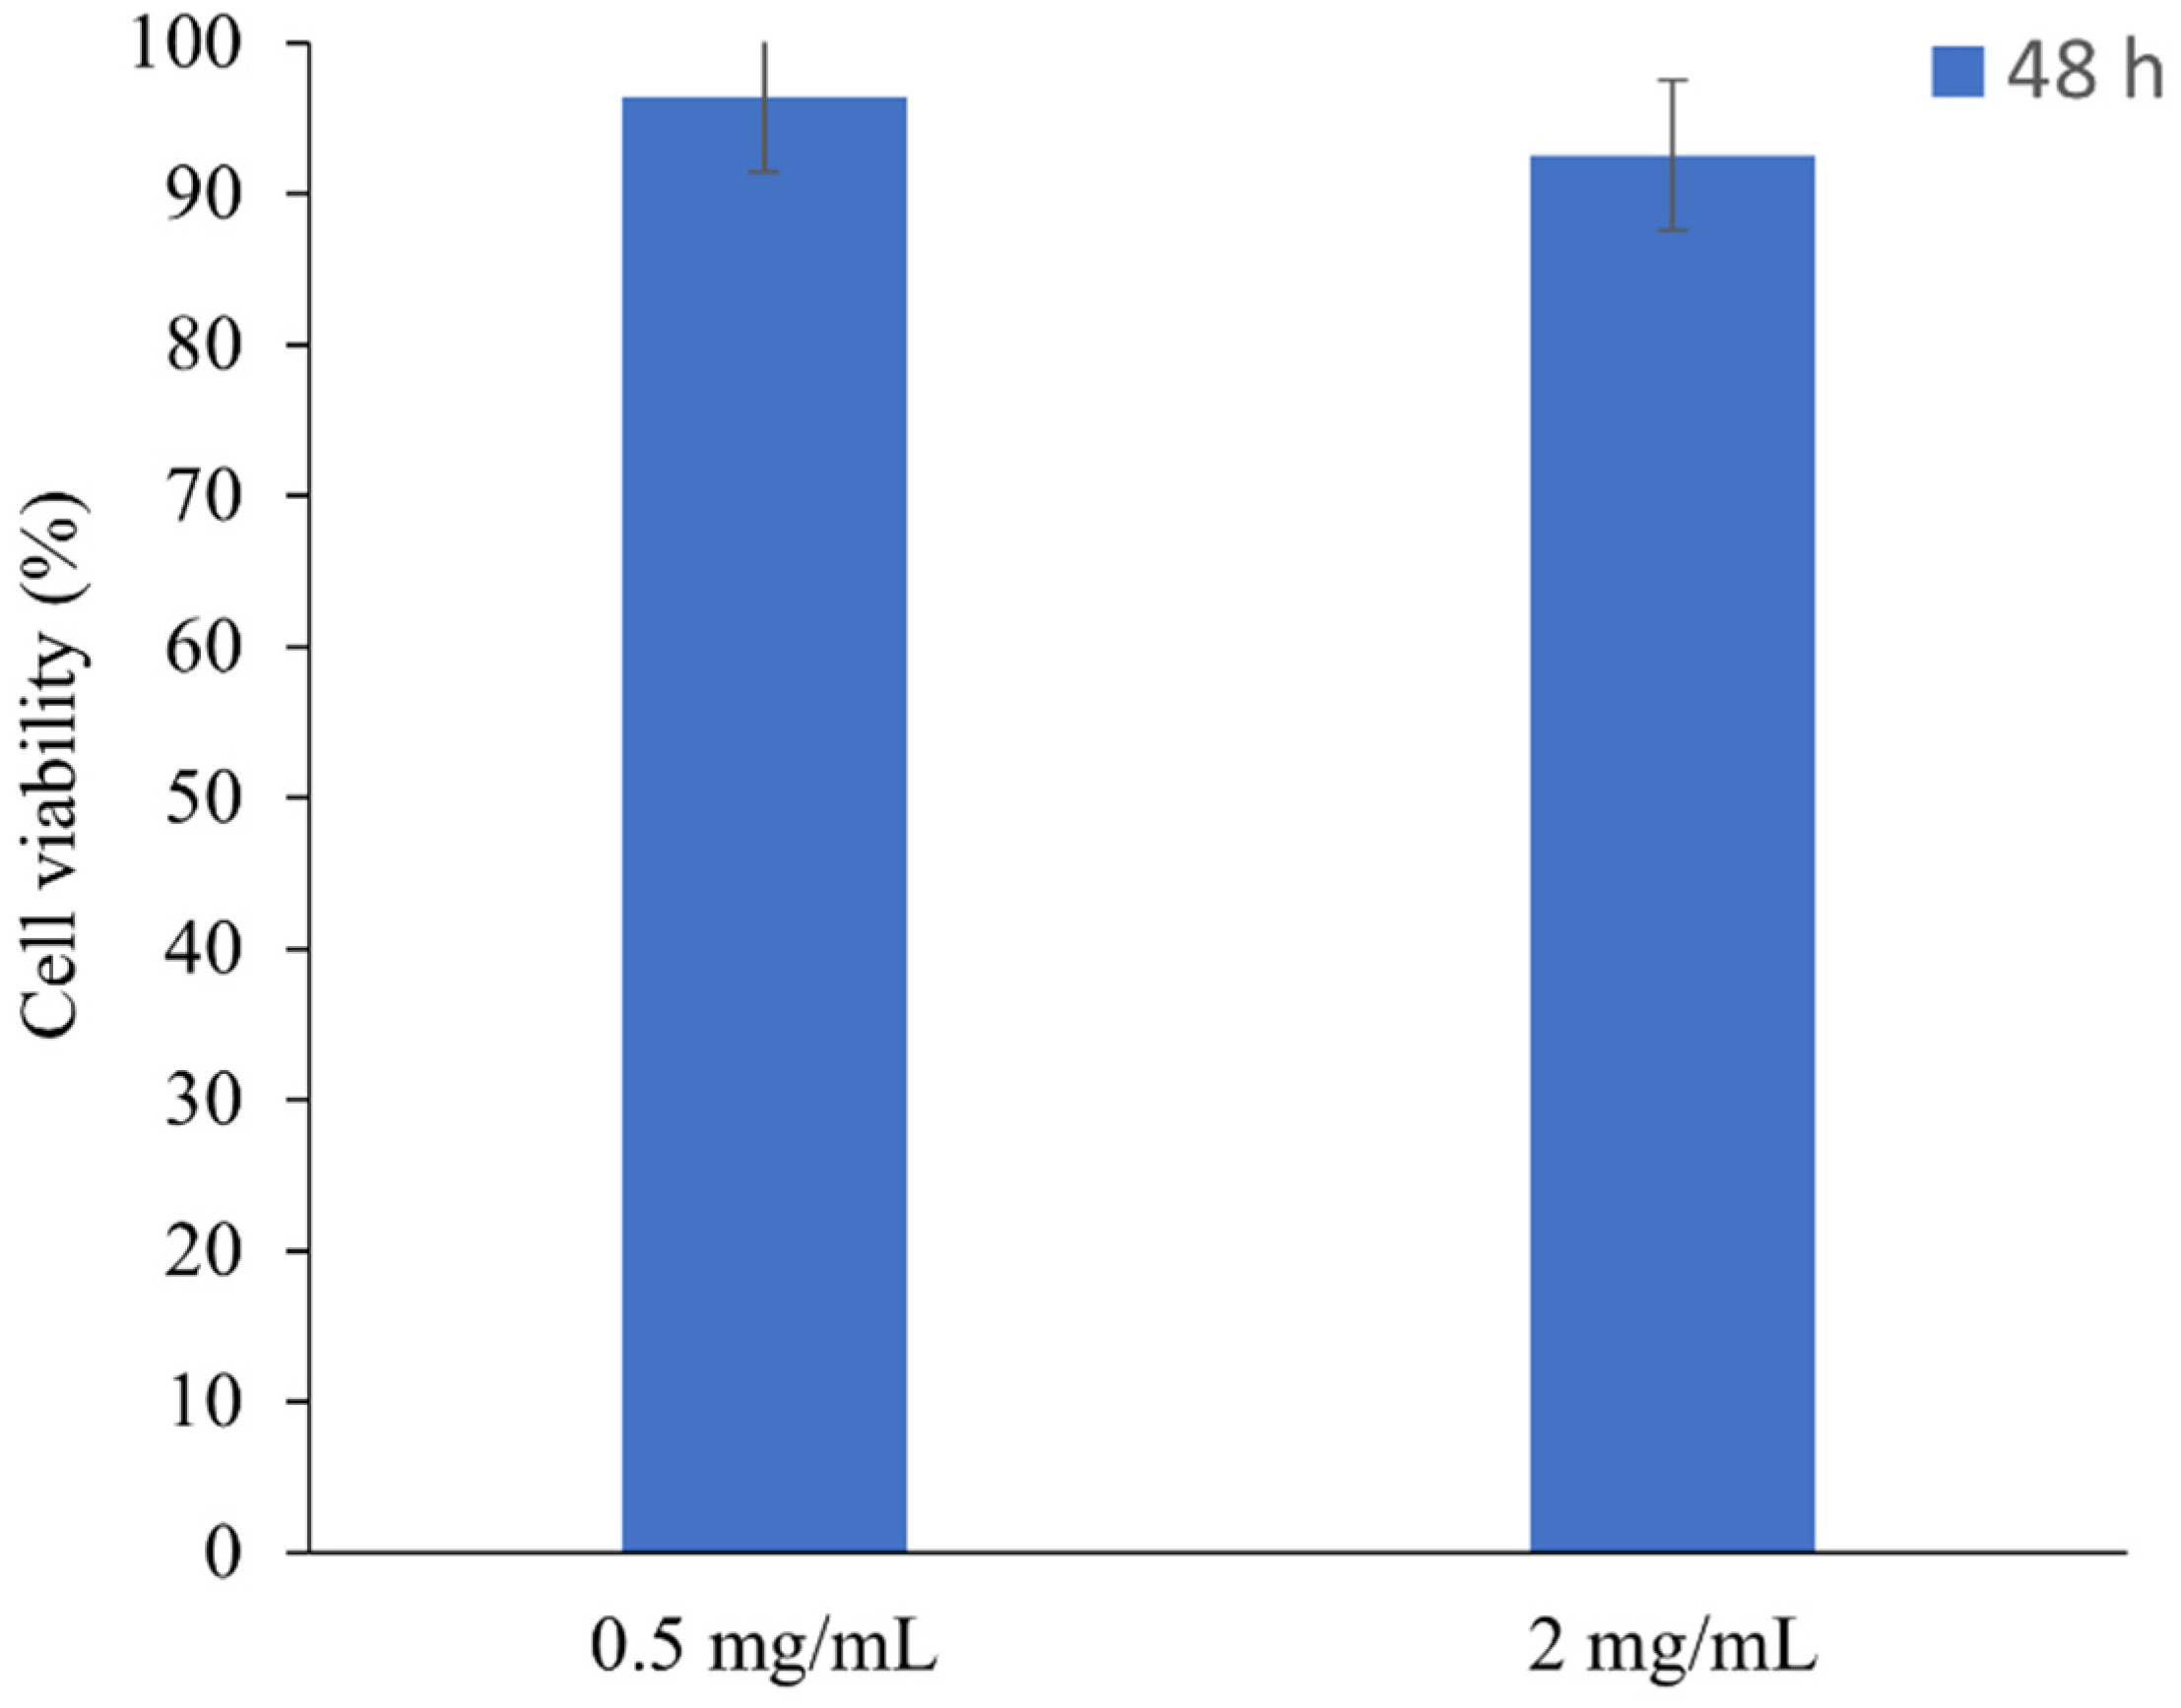
3.4. Cytotoxicity Results

HeLa cells were used for the cytotoxicity assay and a high material concentration of 450 μg/mL was chosen (Figure 7), since no toxicity is expected from those materials [41]. Zeolites 3A and 5A showed no toxicity, as observed previously for 4A zeolite [17]. The biocomposites showed no toxicity to the cells, as expected, since chitosan is a biocompatible polymer (Figure 7). The observed small decrease in the cell viability of Gta@600Chi when compared with Gta@600 had no significance and was within the experimental error.
To understand whether the loaded material remains not toxic to the cells, 0.5 mg/mL and 2 mg/mL of the most promising material (5A@Chi) was loaded with H2S and added to the HeLa cells. Both concentrations, which correspond to a H2S release of 0.49 μM and 2.20 μM, respectively, showed no toxicity after 48 h Figure 8.

4. Conclusions

The characterization results showed that, although the synthetic procedure was the same for all the materials, the obtained results are highly dependent on the zeolite type, and a damage of the 4A zeolite surface due to the acetic acid having been observed.
The 5A zeolite showed a higher adsorption capacity for hydrogen sulphide among all the studied materials due to its higher ABET and the presence of Ca2+ cations. Although with higher ABET, the activated carbon had the lower adsorption capacity, which may be explained by the weaker interaction of the gas with the surface. A decrease in the adsorption of biocomposites was observed when compared with the parent materials due to the presence of the chitosan on the surface. The damage in the 4A@Chi zeolites’ surface explained the severe decrease observed in the 4A@Chi adsorption capacity.
The hydrogen sulphide release studies in aqueous solutions showed that the composite 5A@Chi had the longest release rate, approaching 120 min. These results indicate that 5A@Chi has the best balance between hydrogen sulphide adsorption capacity and the release profile. Cytotoxicity assays showed that none of the materials tested were toxic to HeLa cells at the studied concentrations. Additionally, H2S loaded 5A@Chi did not show toxicity to cells at the concentrations of 0.5 mg/mL and 2 mg/mL.

Supplementary Materials

The following are available online at https://www.mdpi.com/article/10.3390/ma14216701/s1, Figure S1.1. Schematic representation of the volumetric apparatus used in this work.; Figure S1.2. H2S adsorption isotherms for the indicated samples.; Figure S1.3. H2S adsorption isotherm for the indicated samples.; Figure S2.1. UV-Vis spectra and calibration curve obtained using a Na2S solution.; Figure S2.2. H2S release curves in aqueous solution using the DTNB method for the indicated samples.; Figure S3.1. TG (solid lines) and DSC (dashed lines) data for the indicated samples.; Figure S4.1. Powder XRD patterns (left) and SEM images (right) of the 3A zeolite and 3A@Chi.; Figure S4.2. Powder XRD patterns (left) and SEM images (right) of the 4A zeolite and 4A@Chi.; Figure S4.3. Powder XRD pattern of the 4A zeolite treated with a 1 wt% acid acetic solution.; Figure S4.4. Powder XRD patterns of the Gta@600 and Gta@600Chi.; Figure S5.1. FTIR spectra of the indicated samples. An ampliation of the spectra is shown in the right.; Figure S5.2. FTIR spectra of the indicated samples. An ampliation of the spectra is shown in the right.; Figure S5.3. FTIR spectrum of the 4A zeolite treated with a 1wt% acid acetic solution 4A@Ac.; Figure S5.4. FTIR spectra of the indicated samples. An ampliation of the spectra is shown in the right side.; Figure S6.1. Nitrogen adsorption-desorption isotherms (a) and corresponding pore size distribution curves (b) for mentioned materials.; Figure S6.2. Nitrogen adsorption-desorption isotherms (a) and corresponding pore size distribution curves (b) for mentioned materials.; Figure S6.3. Nitrogen adsorption-desorption isotherms (a) and corresponding pore size distribution curves (b) of activated carbon materials.; Figure S7.1. Structure of type A zeolites.; Figure S7.2. Schematic representation of the structure relationship between the zeolite, H2S and chitosan.

Author Contributions

Conceptualization, S.C., M.B., J.P. and M.L.P.; methodology, S.C., M.B., J.P., M.L.P. and F.A.; validation, S.C., M.B. and J.P.; formal analysis, S.C., M.B. and J.P.; investigation, S.C., M.B. and J.P.; writing—original draft preparation, S.C., M.B. and J.P.; writing—review and editing, M.L.P. and F.A.; funding acquisition, J.P. and M.L.P.; S.C. and M.B. contributes equally for the manuscript. All authors have read and agreed to the published version of the manuscript.

Funding

This research was financed by Fundação para a Ciência e a Tecnologia (FCT) through projects PTDC/MEDQUI/28721/2017 and developed in the scope of the projects UIDB/00100/2020 (CQE), UIDB/04028/2020 & UIDP/04028/2020 (CERENA). M.B. acknowledges for FCT-Investigator contract-DL57.

Institutional Review Board Statement

Not applicable.

Informed Consent Statement

Not applicable.

Data Availability Statement

Data sharing is not applicable to this article.

Conflicts of Interest

The authors declare no conflict of interest.

References

  1. Smith, R.P. Macroscope: A Short History of Hydrogen Sulfide. Am. Sci. 2010, 98, 6–9. [Google Scholar]
  2. Snyder, J.W.; Safir, E.F.; Summerville, G.P.; Middleberg, R.A. Occupational fatality and persistent neurological sequelae after mass exposure to hydrogen sulfide. Am. J. Emerg. Med. 1995, 13, 199–203. [Google Scholar] [CrossRef]
  3. Milby, T.H.; Baselt, R.C. Hydrogen Sulfide Poisoning: Clarification of Some Controversial Issues. J. Ind. Med. 1999, 35, 192–195. [Google Scholar] [CrossRef]
  4. Warenycia, M.W.; Goodwin, L.R.; Benishin, C.G.; Reiffenstein, R.J.; Francom, D.M.; Taylor, J.D.; Dieken, F.P. Acute hydrogen sulfide poisoning. Demonstration of selective uptake of sulfide by the brainstem by measurement of brain sulfide levels. Biochem. Pharmacol. 1989, 38, 973–981. [Google Scholar] [CrossRef]
  5. Tabe-Mohammadi, A. A Review of the Applications of Membrane Separation Technology in Natural Gas Treatment. Sep. Sci. Technol. 1999, 34, 2095–2111. [Google Scholar] [CrossRef]
  6. Savage, J.C.; Gould, D.H. Determination of sulfide in brain tissue and rumen fluid by ion-interaction reversed-phase high-performance liquid chromatography. J. Chromatogr. B Biomed. Sci. Appl. 1990, 526, 540–545. [Google Scholar] [CrossRef]
  7. Goodwin, L.R.; Francom, D.; Dieken, F.P.; Taylor, J.D.; Warenycia, M.W.; Reiffenstein, R.J.; Dowling, G. Determination of sulfide in brain tissue by gas dialysis/ion chromatography: Postmortem studies and two case reports. J. Anal. Toxicol. 1989, 13, 105–109. [Google Scholar] [CrossRef]
  8. Abe, K.; Kimura, H. The possible role of hydrogen sulfide as an endogenous neuromodulator. J. Neurosci. 1996, 16, 1066–1071. [Google Scholar] [CrossRef] [Green Version]
  9. Zheng, Y.; Yu, B.; De La Cruz, L.K.; Choudhury, M.R.; Anifowose, A.; Wang, B. Toward hydrogen sulfide based therapeutics: Critical drug delivery and developability issues. Med. Res. Rev. 2018, 38, 57–100. [Google Scholar] [CrossRef] [PubMed]
  10. Qian, Y.; Matson, J.B. Gasotransmitter delivery via self-assembling peptides: Treating diseases with natural signaling gases. Adv. Drug Deliv. Rev. 2017, 110–111, 137–156. [Google Scholar] [CrossRef]
  11. Powell, C.R.; Dillon, K.M.; Matson, J.B. A review of hydrogen sulfide (H2S) donors: Chemistry and potential therapeutic applications. Biochem. Pharmacol. 2018, 149, 110–123. [Google Scholar] [CrossRef] [PubMed]
  12. Carné-Sánchez, A.; Carmona, F.J.; Kim, C.; Furukawa, S. Porous materials as carriers of gasotransmitters towards gas biology and therapeutic applications. Chem. Commun. 2020, 56, 9750–9766. [Google Scholar] [CrossRef]
  13. Zhao, Y.; Biggs, T.D.; Xian, M. Hydrogen sulfide (H2S) releasing agents: Chemistry and biological applications. Chem. Commun. 2014, 50, 11788–11805. [Google Scholar] [CrossRef] [PubMed] [Green Version]
  14. Benavides, G.A.; Squadrito, G.L.; Mills, R.W.; Patel, H.D.; Isbell, T.S.; Patel, R.P.; Darley-Usmar, V.M.; Doeller, J.E.; Kraus, D.W. Hydrogen sulfide mediates the vasoactivity of garlic. Proc. Natl. Acad. Sci. USA 2007, 104, 17977–17982. [Google Scholar] [CrossRef] [PubMed] [Green Version]
  15. Martelli, A.; Testai, L.; Citi, V.; Marino, A.; Pugliesi, I.; Barresi, E.; Nesi, G.; Rapposelli, S.; Taliana, S.; Da Settimo, F.; et al. Arylthioamides as H2S Donors: L-Cysteine-Activated Releasing Properties and Vascular Effects in Vitro and in Vivo. ACS Med. Chem. Lett. 2013, 4, 904–908. [Google Scholar] [CrossRef] [PubMed] [Green Version]
  16. Wallace, J.L.; Vong, L.; McKnight, W.; Dicay, M.; Martin, G.R. Endogenous and Exogenous Hydrogen Sulfide Promotes Resolution of Colitis in Rats. Gastroenterology 2009, 137, 569–578.e1. [Google Scholar] [CrossRef] [Green Version]
  17. Pinto, M.L.; Pinto, R.V.; Carvalho, S.; Antunes, F.; Pires, J. Emerging nitric oxide and hydrogen sulphide releasing carriers for skin wound healing therapy. ChemMedChem 2021. [Google Scholar] [CrossRef]
  18. Mahmodi, G.; Zarrintaj, P.; Taghizadeh, A.; Taghizadeh, M.; Manouchehri, S.; Dangwal, S.; Ronte, A.; Ganjali, M.R.; Ramsey, J.D.; Kim, S.J.; et al. From microporous to mesoporous mineral frameworks: An alliance between zeolite and chitosan. Carbohydr. Res. 2020, 489, 107930. [Google Scholar] [CrossRef] [PubMed]
  19. Rinaudo, M. Chitin and chitosan: Properties and applications. Prog. Polym. Sci. 2006, 31, 603–632. [Google Scholar] [CrossRef]
  20. Li, X.; Yang, Q.; Ouyang, J.; Yang, H.; Chang, S. Chitosan modified halloysite nanotubes as emerging porous microspheres for drug carrier. Appl. Clay Sci. 2016, 126, 306–312. [Google Scholar] [CrossRef]
  21. Płaza, A.; Kołodyńska, D.; Hałas, P.; Gęca, M.; Franus, M.; Hubicki, Z. The zeolite modified by chitosan as an adsorbent for environmental applications. Adsorpt. Sci. Technol. 2017, 35, 834–844. [Google Scholar] [CrossRef] [Green Version]
  22. Fernandes, A.C.; Pinto, R.; Carvalho, S.; Mafra, L.; Rocha, J.; Pinto, M.; Antunes, F.; Pires, J. Storage and delivery of H2S by microporous and mesoporous materials. Microporous Mesoporous Mater. 2021, 320, 111093. [Google Scholar] [CrossRef]
  23. Batista, M.K.S.; Mestre, A.S.; Matos, I.; Fonseca, I.M.; Carvalho, A.P. Biodiesel production waste as promising biomass precursor of reusable activated carbons for caffeine removal. RSC Adv. 2016, 6, 45419–45427. [Google Scholar] [CrossRef]
  24. Kumar, S.; Bera, R.; Das, N.; Koh, J. Chitosan-based zeolite-Y and ZSM-5 porous biocomposites for H2 and CO2 storage. Carbohydr. Polym. 2020, 232, 115808. [Google Scholar] [CrossRef] [PubMed]
  25. Rouquerol, F.; Rouquerol, J.; Sing, K. Adsorption by Powders and Porous Solids—Principles, Methodology and Applications, 1st ed.; Academic Press: London, UK, 1999; ISBN 9780080526010. [Google Scholar]
  26. ISO [International Organization for Standardization]. Determination of the Specific Surface Area of Solids by Gas Adsorption—BET Method (ISO 9277:2010(E)); ISO: Geneva, Switzerland, 2010; Volume 9277, 30p. [Google Scholar]
  27. Rouquerol, J.; Rouquerol, F.; Llewellyn, P.; Maurin, G.; Sing, K.S.W. Adsorption by Powders and Porous Solids: Principles, Methodology and Applications: Second Edition; Elsevier Inc.: Amsterdam, The Netherlands, 2013; ISBN 9780080970356. [Google Scholar]
  28. Thommes, M.; Kaneko, K.; Neimark, A.V.; Olivier, J.P.; Rodriguez-Reinoso, F.; Rouquerol, J.; Sing, K.S.W. Physisorption of gases, with special reference to the evaluation of surface area and pore size distribution (IUPAC Technical Report). Pure Appl. Chem. 2015, 87, 1051–1069. [Google Scholar] [CrossRef] [Green Version]
  29. Schäfer, K. The Virial Coefficients of Gases. A Critical Compilation; Von Dymond, J.H., Smith, E.B., Eds.; (Oxford Science Research Papers No. 2); Clarendon Press; Oxford University Press: London, UK, 1969. [Google Scholar]
  30. Li, Z.G. Quantification of hydrogen sulfide concentration using methylene blue and 5,5′-dithiobis(2-nitrobenzoic acid) methods in plants. Methods Enzymol. 2015, 554, 101–110. [Google Scholar] [CrossRef]
  31. Wheatley, P.S.; Butler, A.R.; Crane, M.S.; Fox, S.; Xiao, B.; Rossi, A.G.; Megson, I.L.; Morris, R.E. NO-releasing zeolites and their antithrombotic properties. J. Am. Chem. Soc. 2006, 128, 502–509. [Google Scholar] [CrossRef]
  32. Menazea, A.A.; Eid, M.M.; Ahmed, M.K. Synthesis, characterization, and evaluation of antimicrobial activity of novel Chitosan/Tigecycline composite. Int. J. Biol. Macromol. 2020, 147, 194–199. [Google Scholar] [CrossRef]
  33. Sarwar, A.; Katas, H.; Samsudin, S.N.; Zin, N.M. Regioselective sequential modification of chitosan via azide-alkyne click reaction: Synthesis, characterization, and antimicrobial activity of chitosan derivatives and nanoparticles. PLoS ONE 2015, 10, e0123084. [Google Scholar] [CrossRef] [Green Version]
  34. Hong, P.-Z.; Li, S.-D.; Ou, C.-Y.; Li, C.-P.; Yang, L.; Zhang, C.-H. Thermogravimetric analysis of chitosan. J. Appl. Polym. Sci. 2007, 105, 547–551. [Google Scholar] [CrossRef]
  35. Ziegler-Borowska, M.; Chełminiak, D.; Kaczmarek, H.; Kaczmarek-Kędziera, A. Effect of side substituents on thermal stability of the modified chitosan and its nanocomposites with magnetite. J. Therm. Anal. Calorim. 2016, 124, 1267–1280. [Google Scholar] [CrossRef] [Green Version]
  36. Moussout, H.; Aazza, M.; Ahlafi, H. Handbook of Chitin and Chitosan; Gopi, S., Thomas, A.P.S., Eds.; Elsevier: Amsterdam, The Netherlands, 2020; pp. 139–174. ISBN 9780128179680. [Google Scholar]
  37. Kusumaningtyas, R.D. Effect of zeolite 4A on water concentration in the system of the esterefication reaction of acetic acid with 1-butanol. Indones. J. Chem. 2006, 6, 132–137. [Google Scholar] [CrossRef]
  38. Yotani, T.K.; Himotsuma, N.S.; Akui, S.K.; Nanotech, B. FTIR-ATR Study of the Surface of a Tubular Zeolite NaA Membrane. Anal. Chem. 2006, 22, 325–327. [Google Scholar] [CrossRef] [Green Version]
  39. Asokan, V.; Kosinski, P.; Skodvin, T.; Myrseth, V. Characterization of carbon black modified by maleic acid. Front. Mater. Sci. 2013, 7, 302–307. [Google Scholar] [CrossRef]
  40. Cheung, O.; Hedin, N. Zeolites and related sorbents with narrow pores for CO2 separation from flue gas. RSC Adv. 2014, 4, 14480–14494. [Google Scholar] [CrossRef] [Green Version]
  41. Shah, M.S.; Tsapatsis, M.; Siepmann, J.I. Hydrogen Sulfide Capture: From Absorption in Polar Liquids to Oxide, Zeolite, and Metal-Organic Framework Adsorbents and Membranes. Chem. Rev. 2017, 117, 9755–9803. [Google Scholar] [CrossRef] [PubMed]
  42. CRC. Handbook of Chemistry and Physics, 97th ed.; Haynes, W.M., Ed.; CRC Press: Boca Raton, FL, USA, 2016; ISBN 1498754287. [Google Scholar]
  43. Starke, A.; Pasel, C.; Bläker, C.; Eckardt, T.; Zimmermann, J.; Bathen, D. Impact of Na+ and Ca2+ Cations on the Adsorption of H2S on Binder-Free LTA Zeolites. Adsorpt. Sci. Technol. 2021, 2021, 5531974. [Google Scholar] [CrossRef]
  44. Feng, S.; Zhao, Y.; Xian, M.; Wang, Q. Biological thiols-triggered hydrogen sulfide releasing microfibers for tissue engineering applications. Acta Biomater. 2015, 27, 205–213. [Google Scholar] [CrossRef] [Green Version]
  45. Jiang, W.; Yi, L.; Chaochao, H.; Jianming, K.; Jingjing, Y.; Zecong, X.; Jingjing, Z.; Anqi, C.; Xiaokun, L.; Jian, X.; et al. Novel H2S Releasing Nanofibrous Coating for In Vivo Dermal Wound Regeneration. ACS Appl. Mater. Interfaces 2016, 8, 27474–27481. [Google Scholar] [CrossRef]
  46. Peluso, A.; Gargiulo, N.; Aprea, P.; Pepe, F.; Caputo, D. Nanoporous Materials as H2S Adsorbents for Biogas Purification: A Review. Sep. Purif. Rev. 2019, 48, 78–89. [Google Scholar] [CrossRef]
Figure 1. FTIR spectra of the indicated samples. An ampliation of the spectrum is shown in the right side.
Materials 14 06701 g001
Figure 2. TG (solid lines) and DSC (dashed lines) data for the indicated samples.
Materials 14 06701 g002
Figure 3. Powder XRD patterns (left) and SEM images (right) of the 5A zeolite and 5A@Chi.
Materials 14 06701 g003
Figure 4. Nitrogen adsorption-desorption isotherms (a) and corresponding pore size distribution curves (b) of 5A zeolite and 5A@Chi materials.
Materials 14 06701 g004
Figure 5. H2S adsorption isotherms of the 5A zeolite and 5A@Chi.
Materials 14 06701 g005
Figure 6. H2S release curves in aqueous solution using the DTNB method for the 5A and 5A@Chi.
Materials 14 06701 g006
Figure 7. HeLa viability in the presence of unloaded materials. Materials toxicity was assessed after 24 h (blue bars) and 72 h (orange bars) in contact with cells, using a material concentration of 450 μg/mL. Each bar represents an average (of 3 independent experiments each one with 8 replicates) ± SD.
Materials 14 06701 g007
Figure 8. HeLa viability in the presence of loaded materials. Materials toxicity was assessed after 48 h in contact with cells, using a material concentration of 0.5 mg/mL and 2.0 mg/mL. Each bar represents an average (of 3 independent experiments each one with 2 replicates) ± SD.
Materials 14 06701 g008
Table 1. Elemental analysis of the composites.
SampleN (%)C (%)H (%)S (%)O (%)
3A@Chin.d.1.0 2.2 n.d.n.d
4A@Chin.d.1.9 2.4 n.d.n.d
5A@Chin.d.1.4 2.3 n.d.n.d
Gta@600Chi1.0752.1714.9
Gta@6000.980n.d.712.1
Table 2. Mass loss (%) in the range 225–525 °C.
SampleParent MaterialMaterial with ChitosanChitosan (%)
225 °C525 °C225 °C525 °C
3A16.520.716.926.15.4
4A1721.617.928.410.5
5A17.322.719.828.99.1
Gta@6009.153.18.375.623.3
Table 3. H2S released at room temperature using DNB method.
SampleH2Sreleased (mmolH2S/gsample)H2Sreleased (%)tmax (min)
3A1.60-17
3A@Chi0.02-17
4A1.3543.817
4A@Chi0.0318.817
5A1.4828.317
5A@Chi0.9831.8120
Gta@6000.020.9417
Gta@600Chi0.0122.2817
Publisher’s Note: MDPI stays neutral with regard to jurisdictional claims in published maps and institutional affiliations.

