
Effect of Implant Surface Roughness and Macro- and Micro-Structural Composition on Wear and Metal Particles Released

 , ,
, ,
Abstract
:1. Introduction
2. Materials and Methods
3. Results
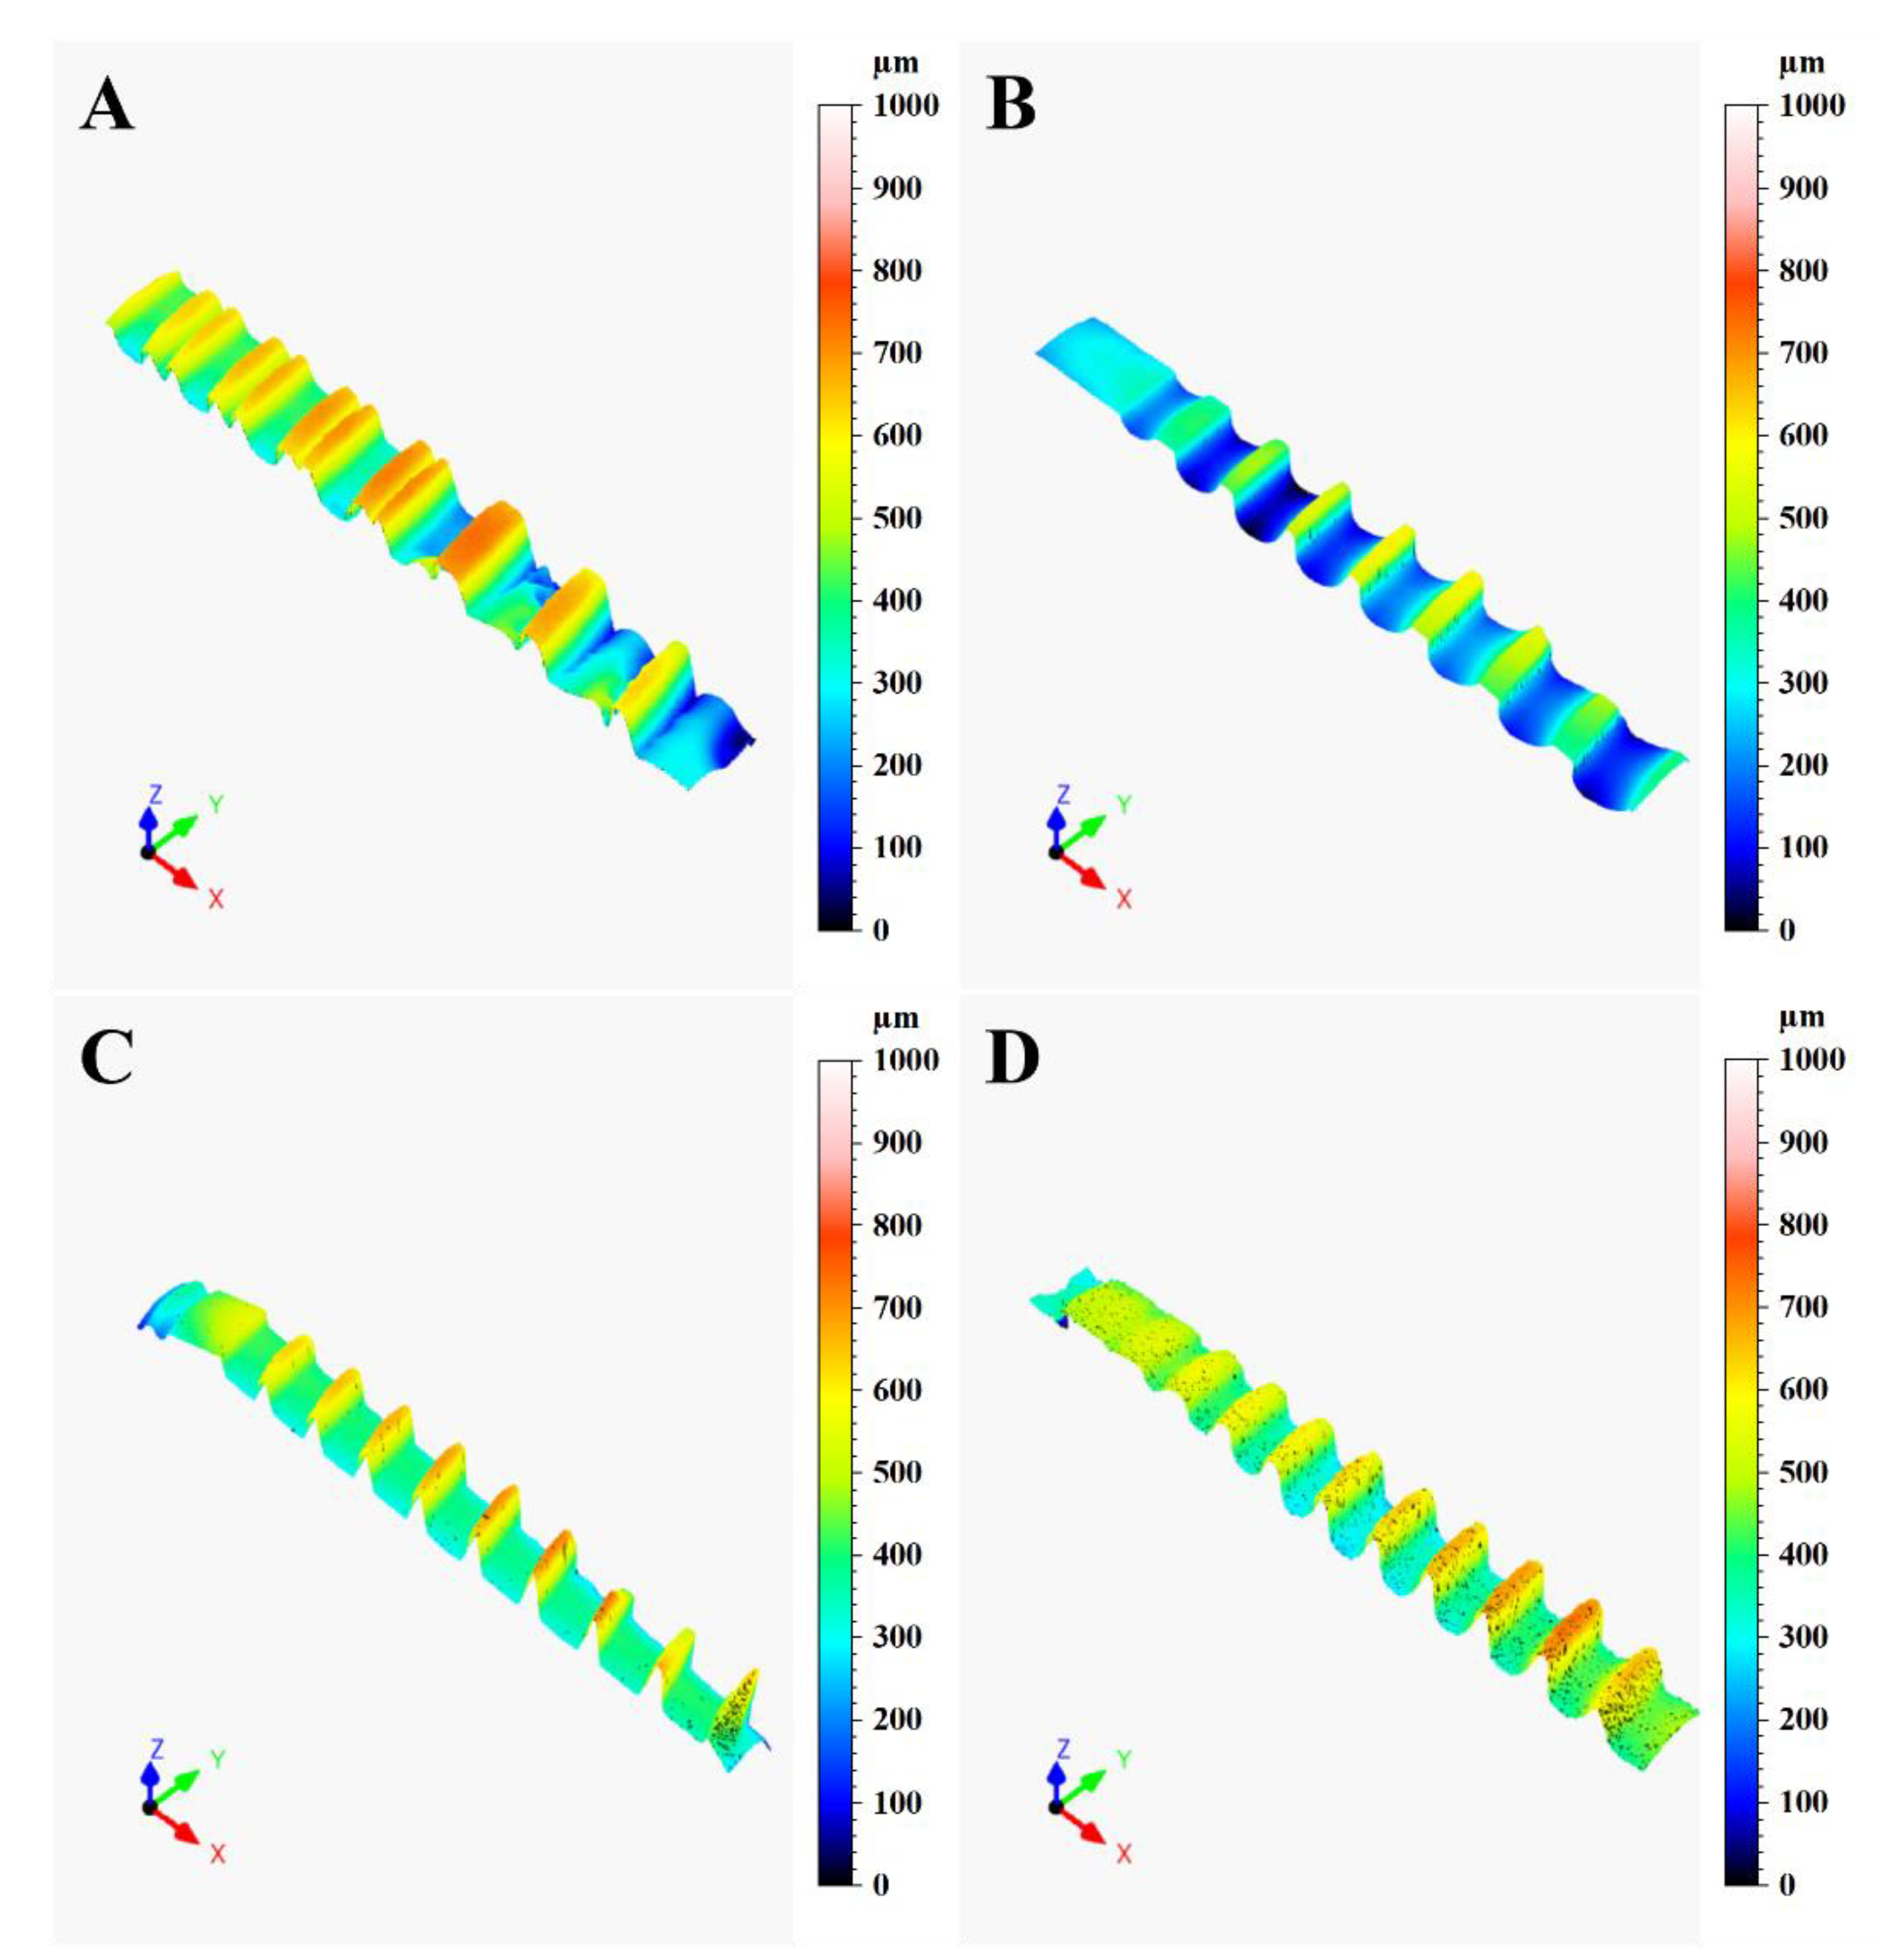
3.1. Confocal Microscopy
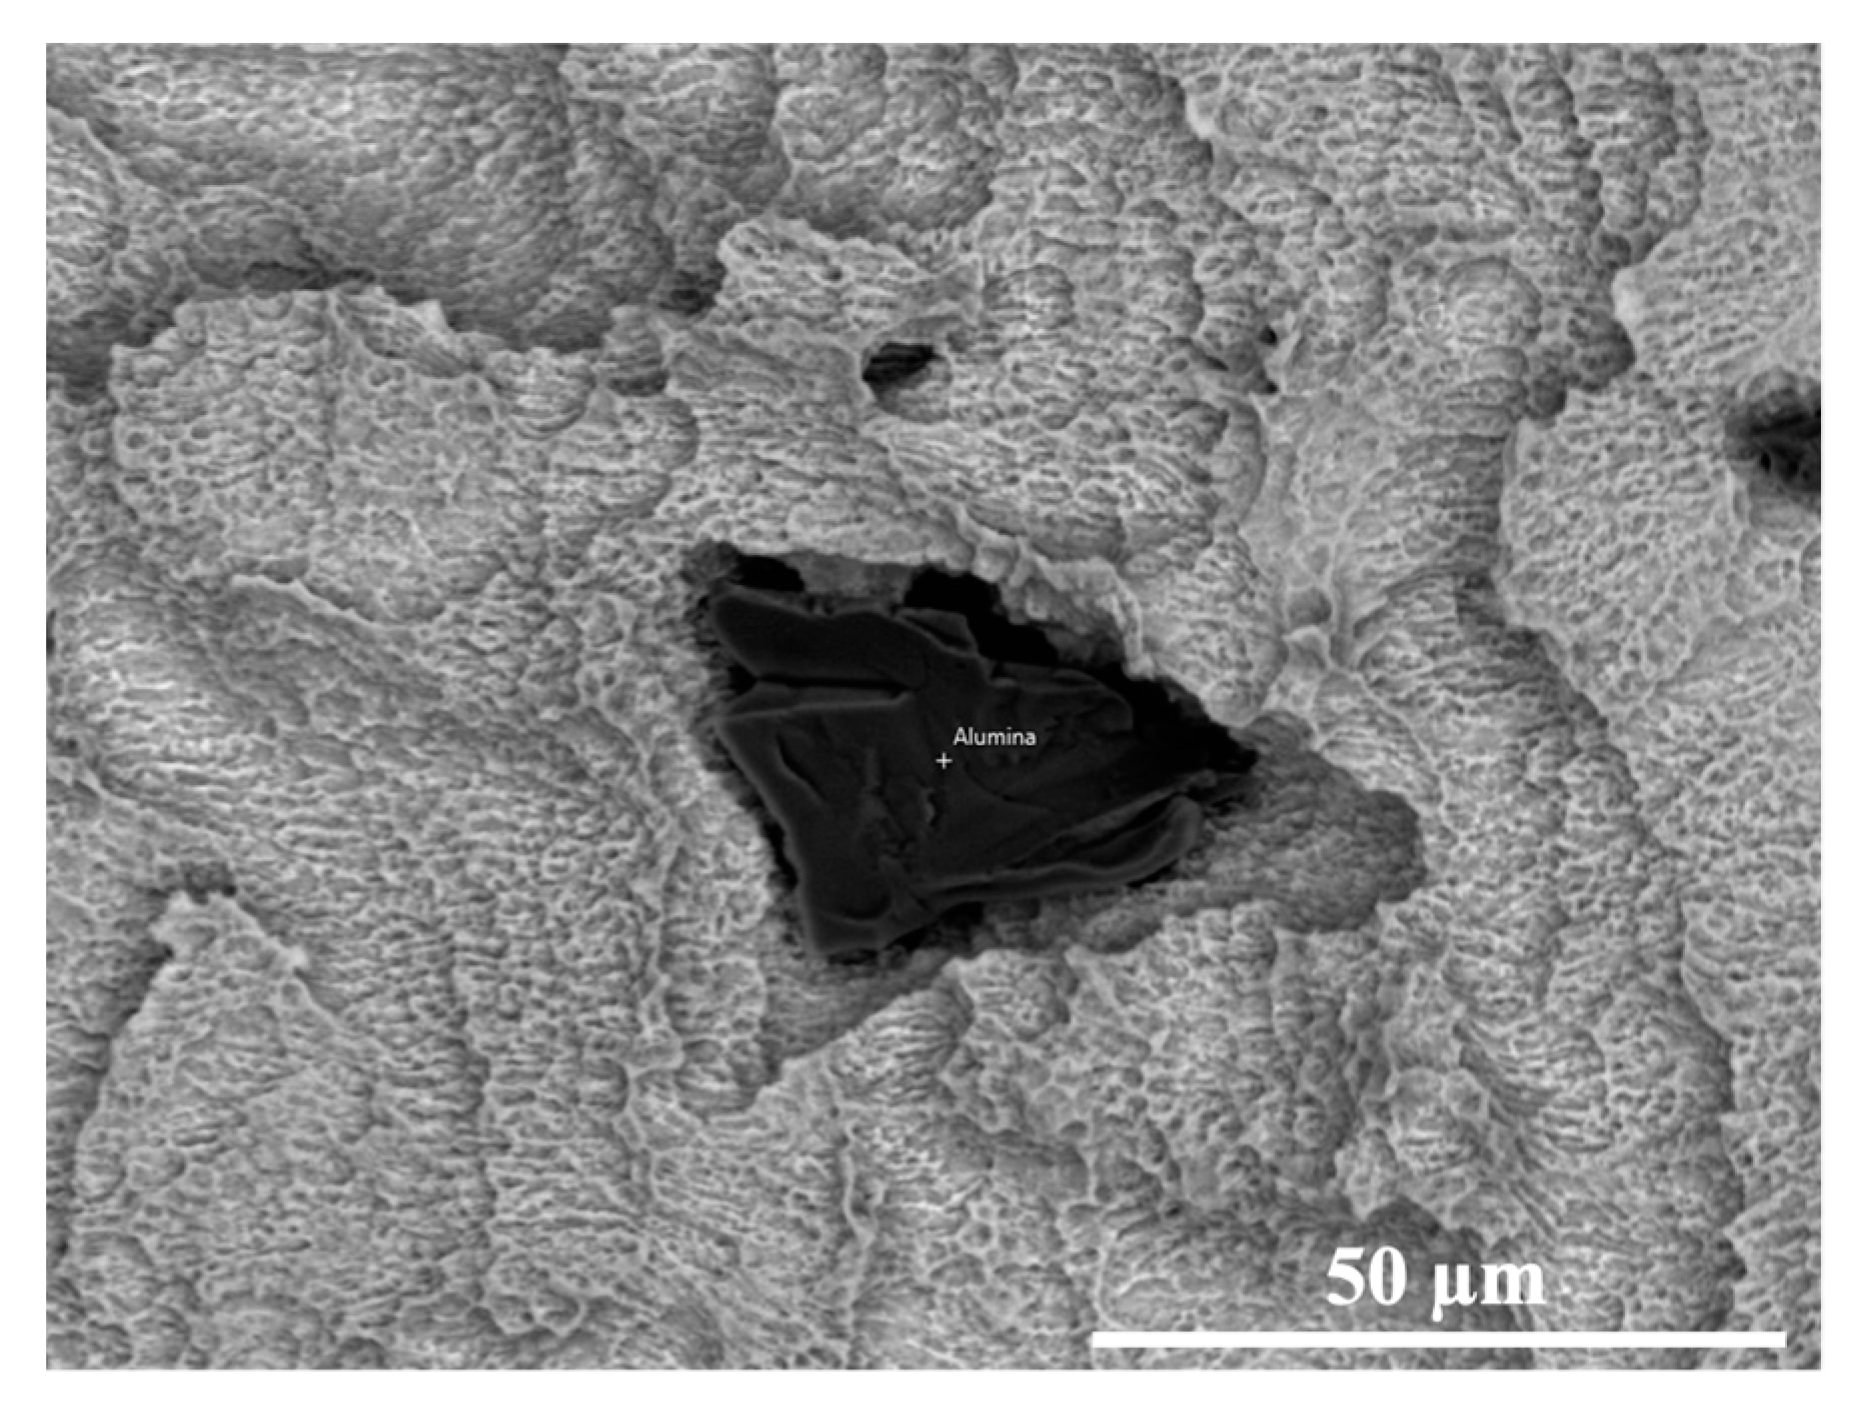
3.2. SEM-EDS
4. Discussion
5. Conclusions
- Many implant’s surface macro-components (thread design, screw pitch) and mi-cro-components (chemical surface composition, roughness, industrial surface treatment) can influence the surface wear during the implant placement.
- The surface wear and metal particle release during the implant placement can be also influenced by the manufacturer’s precision (sharpness of the cutting tool), the bone density, and implant macromorphology.
- The biological/clinical value of the presence of metal friction residues on the pe-ri-implant bone surface is not clear, although it was considered the major factor responsible for aseptic implant loosening.
Author Contributions
Funding
Institutional Review Board Statement
Informed Consent Statement
Data Availability Statement
Conflicts of Interest
References
- Matos, G.R.M. Surface roughness of dental implant and osseointegration. J. Maxillofac. Oral. Surg. 2021, 20, 1–4. [Google Scholar] [CrossRef]
- Marenzi, G.; Spagnuolo, G.; Sammartino, J.C.; Gasparro, R.; Rebaudi, A.; Salerno, M. Micro-scale surface pattering of titanium dental implants by anodization in the presence of modifying salts. Materials 2019, 30, 1753. [Google Scholar] [CrossRef] [Green Version]
- Velasco-Ortega, E.; Ortiz-García, I.; Jiménez-Guerra, A.; Monsalve-Guil, L.; Munoz-Guzon, F.; Perez, R.A.; Gil, F.J. Comparison between sandblasted acid-etched and oxidized titanium dental implants: In vivo study. Int. J. Mol. Sci. 2019, 20, 3267. [Google Scholar] [CrossRef] [PubMed] [Green Version]
- Tuan, R.S.; Lee, F.Y.-I.; Konttinen, Y.T.; Wilkinson, J.M.; Smith, R.L. What are the local and systemic biologic reactions and mediators to wear debris, and what host factors determine or modulate the biologic response to wear particles? J. Am. Acad. Orthop. Surg. 2008, 16, S42–S48. [Google Scholar] [CrossRef]
- Romanos, G.E.; Fischer, G.A.; Delgado-Ruiz, R. Titanium wear of dental implants from placement, under loading and maintenance protocols. Int. J. Mol. Sci. 2019, 20, 326. [Google Scholar] [CrossRef] [PubMed]
- Delgado-Ruiz, R.; Romanos, G. Potential causes of titanium particle and ion release in implant dentistry: A systematic review. Int. J. Mol. Sci. 2018, 13, 3585. [Google Scholar] [CrossRef] [PubMed] [Green Version]
- Zhou, Z.; Shi, Q.; Wang, J.; Chen, X.; Hao, Y.; Zhang, Y.; Wang, X. The unfavorable role of titanium particles released from dental implants. Nanotheranostics 2021, 5, 321–332. [Google Scholar] [CrossRef] [PubMed]
- Silva, G.A.F.; Faot, F.; da Silva, W.J.; Del Bel Cury, A.A. Does implant surface hydrophilicity influence the maintenance of surface integrity after insertion into low-density artificial bone? Dent. Mater. 2021, 37, e69–e84. [Google Scholar] [CrossRef]
- Marenzi, G.; Impero, F.; Scherillo, F.; Sammartino, J.C.; Squillace, A.; Spagnuolo, G. Effect of different surface treatments on titanium dental implant micro-morphology. Materials 2019, 12, 733. [Google Scholar] [CrossRef] [Green Version]
- Iorio-Siciliano, V.; Marenzi, G.; Blasi, A.; Mignogna, J.; Cafiero, C.; Wang, H.L.; Sammartino, G. Influence of platform-switched, laser-microtextured implant on marginal bone level: A 24-month case series study. Int. J. Oral Maxillofac. Implants 2016, 31, 162–166. [Google Scholar] [CrossRef] [Green Version]
- Cafiero, C.; Marenzi, G.; Blasi, A.; Iorio Siciliano, V.; Nicolò, M.; Sammartino, G. Soft and hard tissues healing at immediate transmucosal implants placed into molar extraction sites with collagen membrane uncovered: A 12-month prospective study. Implant Dent. 2013, 22, 474–480. [Google Scholar] [CrossRef] [PubMed]
- Lee, J.; Lee, J.B.; Yun, J.; Rhyu, I.C.; Lee, Y.M.; Lee, S.M.; Lee, M.K.; Kim, B.; Kim, P.; Koo, K.T. The impact of surface treatment in 3-dimensional printed implants for early osseointegration: A comparison study of three different surfaces. Sci. Rep. 2021, 11, 10453. [Google Scholar] [CrossRef] [PubMed]
- Zhang, W.J.; Liu, Y.; Sun, X.Y.; Zhao, O.; Quan, H.X. Clinical effect evaluation of anodized and sandblasted, large-grit, acid-etched implants within 10 years: A meta-analysis. Zhonghua Kou Qiang Yi Xue Za Zhi. 2021, 56, 362–369. [Google Scholar]
- Liu, Z.; Liu, X.; Ramakrishna, S. Surface engineering of biomaterials in orthopedic and dental implants: Strategies to improve osteointegration, bacteriostatic and bactericidal activities. Biotechnol. J. 2021, 16, 2000116. [Google Scholar] [CrossRef]
- Ullah, I.; Siddiqui, M.A.; Liu, H.; Kolawole, S.K.; Zhang, J.; Zhang, S.; Ren, L.; Yang, K. Mechanical, biological, and antibacterial characteristics of plasma-sprayed (Sr, Zn) substituted hydroxyapatite coating. ACS Biomater. Sci. Eng. 2020, 6, 1355–1366. [Google Scholar] [CrossRef]
- Pimenta, J.; Szmukler-Moncler, S.; Raigrodski, A.J. Physical characterization of 3 implant systems made of distinct materials with distinct surfaces. J. Prosthet. Dent. 2021, 2, 30728–30729. [Google Scholar] [CrossRef]
- Mata, A.; Su, X.; Fleischman, A.J.; Roy, S.; Banks, B.A.; Miller, S.K.; Midura, R.J. Osteoblast attachment to a textured surface in the absence of exogenous adhesion proteins. IEEE Trans. Nanobiosci. 2003, 2, 287–294. [Google Scholar] [CrossRef]
- Rüger, M.; Gensior, T.J.; Herren, C.; Von Walter, M.; Ocklenburg, C.; Marx, R.; Erli, H.J. The removal of Al2O3 particles from grit-blasted titanium implant surfaces: Effects on biocompatibility, osseointegration and interface strength in vivo. Acta Biomater. 2010, 6, 2852–2861. [Google Scholar] [CrossRef]
- Suarez-Lopez Del Amo, F.; Garaicoa-Pazmino, C.; Fretwurst, T. Dental Implants-associated release of titanium particles: A systematic review. Clin. Oral Implants Res. 2018, 29, 1085–1100. [Google Scholar] [CrossRef] [PubMed]
- Deppe, H.; Grunberg, C.; Thomas, M.; Sculean, A.; Benner, K.U.; Bauer, F.J.M. Surface morphology analysis of dental implants following insertion into bone using scanning electron microscopy: A pilot study. Clin. Oral Implants Res. 2015, 26, 1261–1266. [Google Scholar] [CrossRef]
- Marenzi, G.; Sammartino, J.C.; Quaremba, G.; Graziano, V.; Hassanin, A.E.; Qorri, M.E.; Sammartino, G.; Iorio-Siciliano, V. Clinical influence of micromorphological structure of dental implant bone drills. Biomed. Res. Int. 2018, 2018, 8143962. [Google Scholar] [CrossRef] [PubMed] [Green Version]
- Wennerberg, A.; Ide-Ektessabi, A.; Hatkamata, S.; Sawase, T.; Johansson, C.; Albrektsson, T.; Martinelli, A.; Sodervall, U.; Odelius, H. Titanium release from implants prepared with different surface roughness. An in vitro and in vivo study. Clin. Oral Implants Res. 2004, 15, 505–512. [Google Scholar] [CrossRef] [PubMed]
- Mombelli, A.; Hashim, D.; Cionca, N. What is the impact of titanium particles and biocorrosion on implant survival and complications? A critical review. Clin. Oral Implants Res. 2018, 29, 37–53. [Google Scholar] [CrossRef] [PubMed]
- Bonsignore, L.A.; Goldberg, V.M.; Greenfield, E.M. Machine oil inhibits the osseointegration of orthopaedic implants by impairing osteoblast attachment and spreading. J. Orthop. Res. 2015, 33, 979–987. [Google Scholar] [CrossRef]
- ISO4287, BSI Standards Publication Geometrical Product Specifications (GPS)—Surface Texture: Profile Method: Terms, Definitions and Surface Texture Parameters; British Standards Institution: London, UK, 1998.
- Thomas, T.R. Characterization of surface roughness. Precis. Eng. 1981, 3, 97–104. [Google Scholar] [CrossRef]
- Tatsuoka, M.M. Multivariate analysis. Applied Multivariate Analysis. Discriminant and Classification Analysis; Timm, N.H., Ed.; John Wiley & Sons, Inc.: New York, NY, USA; Springer: New York, NY, USA, 2004. [Google Scholar]
- Handbook of Applied Multivariate, Statistics and Mathematical Modeling, 1st ed.; Tinsley, H.; Brown, S. (Eds.) Academic Press: Cambridge, MA, USA, 2000. [Google Scholar]
- Niinomi, M. Mechanical biocompatibilities of titanium alloys for biomedical applications. J. Mech. Behav. Biomed. Mater. 2008, 1, 30–42. [Google Scholar] [CrossRef]
- Elias, C.N.; Fernandes, D.J.; de Souza, F.M.; Montiero, E.; De Biasi, R.S. Machanica and clinical properties of titanium and titanium based alloy (Ti G2, TiG4 cold worked nanostrustructured and Ti G5) for biomedical applications. J. Mater. Res. Technol. 2019, 8, 1060–1069. [Google Scholar] [CrossRef]
- Silva, G.A.F.; Faot, F.; Possebon, A.P.D.R.; da Silva, W.J.; Del Bel Cury, A.A. Effect of macrogeometry and bone type on insertion torque, primary stability, surface topography damage and titanium release of dental implants during surgical insertion into artificial bone. J. Mech. Behav. Biomed. Mater. 2021, 119, 104515. [Google Scholar] [CrossRef]
- Abuhussein, H.; Pagni, G.; Rebaudi, A.; Wang, H.-L. The effect of thread pattern upon implant osseointegration. Clin. Oral Implants Res. 2010, 21, 129–136. [Google Scholar] [CrossRef] [Green Version]
- Menini, M.; Bagnasco, F.; Calimodio, I.; Di Tullio, N.; Delucchi, F.; Baldi, D.; Pera, F. Influence of implant thread morphology on primary stability: A prospective clinical study. Biomed. Res. Int. 2020, 2020, 6974050. [Google Scholar] [CrossRef]
- Mattheos, N.; Li, X.; Zampelis, A.; Ma, L.; Janda, M. Investigating the micromorphological differences of the implant-abutment junction and their clinical implications: A pilot study. Clin. Oral Implants Res. 2016, 27, e134–e143. [Google Scholar] [CrossRef] [PubMed]
- Juodzbalys, G.; Sapragoniene, M.; Wennerberg, A.; Baltrukonis, T. Titanium dental implant surface micromorphology optimization. J. Oral Implantol. 2007, 33, 177–185. [Google Scholar] [CrossRef]
- Chung, S.H.; Heo, S.J.; Koak, J.Y.; Kim, S.K.; Lee, J.B.; Han, J.S.; Han, J.H.; Rhyu, I.C.; Lee, S.J. Effects of implant geometry and surface treatment on osseointegration after functional loading: A dog study. J. Oral Rehabil. 2008, 35, 229–236. [Google Scholar] [CrossRef] [PubMed]
- Motoyoshi, M.; Yano, S.; Tsuruoka, T.; Shimizu, N. Biomechanical effect of abutment on stability of orthodontic mini-implant. A finite element analysis. Clin. Oral Implants Res. 2005, 16, 480–485. [Google Scholar] [CrossRef] [PubMed]
- Kong, L.; Liu, B.L.; Hu, K.J.; Li, D.H.; Song, Y.L.; Ma, P.; Yang, J. Optimized thread pitch design and stress analysis of the cylinder screwed dental implant. Hua Xi Kou Qiang Yi Xue Za Zhi 2006, 24, 509–512. [Google Scholar]
- Hansson, S.; Werke, M. The implant thread as a retention element in cortical bone: The effect of thread size and thread profile: A finite element study. J. Biomech. 2003, 36, 1247–1258. [Google Scholar] [CrossRef]
- Rashad, A.; Sadr-Eshkevari, P.; Weuster, M.; Schmitz, I.; Prochnow, N.; Maurer, P. Material attrition and bone micromorphology after conventional and ultrasonic implant site preparation. Clin. Oral Implants Res. 2013, 24, 110–114. [Google Scholar] [CrossRef] [Green Version]
- Ono, T.; Hayashi, M.; Sasaki, F.; Nakashima, T. RANKL biology: Bone metabolism, the immune system, and beyond. Inflamm. Regen. 2020, 40, 2. [Google Scholar] [CrossRef] [Green Version]
- Jiang, Y.; Jia, T.; Gong, W.; Wooley, P.H.; Yang, S.Y. Titanium particle-challenged osteoblasts promote osteoclastogenesis and osteolysis in a murine model of periprosthestic osteolysis. Acta Biomater. 2013, 9, 7564–7572. [Google Scholar] [CrossRef] [Green Version]
- Córdova, L.A.; Trichet, V.; Escriou, V.; Rosset, P.; Amiaud, J.; Battaglia, S.; Charrier, C.; Berreur, M.; Brion, R.; Gouin, F.; et al. Inhibition of osteolysis and increase of bone formation after local administration of siRNA-targeting RANK in a polyethylene particle-induced osteolysis model. Acta Biomater. 2015, 13, 150–158. [Google Scholar] [CrossRef]
- Eroglu, C.N.; Ertugrul, A.S.; Eskitascioglu, M.; Eskitascioglu, G. Changes in the surface of bone and acid-etched and sandblasted implants following implantation and removal. Eur. J. Dent. 2016, 10, 77–81. [Google Scholar] [CrossRef] [PubMed]
- Deppe, H.; Wolff, C.; Bauer, F.; Ruthenberg, R.; Sculean, A.; Mucke, T. Dental implant surfaces after insertion in bone: An in vitro study in four commercial implant systems. Clin. Oral Investig. 2018, 22, 1593–1600. [Google Scholar] [CrossRef] [PubMed]
- Choi, M.G.; Koh, H.S.; Kluess, D.; O’Connor, D.; Mathur, A.; Truskey, G.A.; Rubin, J.; Zhou, D.X.F.; Sung, K.-L.P. Effects of titanium particle size on osteoblast functions in vitro and in vivo. Proc. Natl. Acad. Sci. USA 2005, 102, 4578–4583. [Google Scholar] [CrossRef] [PubMed] [Green Version]
- Stratton-Powell, A.A.; Pasko, K.M.; Brockett, C.L.; Tipper, J.L. The biologic response to polyetheretherketone (PEEK) wear particles in total joint replacement: A systematic review. Clin. Orthop. Relat. Res. 2016, 474, 2394–2404. [Google Scholar] [CrossRef] [Green Version]
- Yang, S.Y.; Ren, W.; Park, Y.; Sieving, A.; Hsu, S.; Nasser, S.; Wooley, P.H. Diverse cellular and apoptotic responses to variant shapes of UHMWPE particles in a murine model of inflammation. Biomaterials 2002, 23, 3535–3543. [Google Scholar] [CrossRef]
- Lohmann, C.H.; Dean, D.D.; Köster, G.; Casasola, D.; Buchhorn, G.H.; Fink, U.; Schwartz, Z.; Boyan, B.D. Ceramic and PMMA particles differentially affect osteoblast phenotype. Biomaterials 2002, 23, 1855–1863. [Google Scholar] [CrossRef]
- Klinder, A.; Seyfarth, A.; Hansmann, D.; Bader, R.; Jonitz-Heincke, A. Inflammatory response of human peripheral blood mononuclear cells and osteoblasts incubated with metallic and ceramic submicron particles. Front. Immunol. 2018, 9, 831. [Google Scholar] [CrossRef] [Green Version]
- Elias, C.N.; Rocha, F.A.; Nascimento, A.L.; Cohelo, P.G. Influence of implant shape, surface morphology, surgical technique and bone quality on the primary stability of dental implants. J. Mech. Behav. Biomed. Mater. 2012, 16, 169–180. [Google Scholar] [CrossRef]
- Zhang, L.; Haddouti, E.M.; Welle, K.; Burger, C.; Wirtz, D.C.; Schildberg, F.A.; Kabir, K. The effects of biomaterial implant wear debris on osteoblasts. Front. Cell Dev. Biol. 2020, 8, 352. [Google Scholar] [CrossRef]
- Li, J.; Hastings, G. Oxide bioceramics: Inert ceramic materials in medicine and dentistry. In Handbook of Biomaterial Properties; Black, J., Hastings, G.W., Eds.; Springer: Berlin, Germany, 2016; pp. 339–352. [Google Scholar]
- Bertoldi, C.; Pradelli, J.M.; Consolo, U.; Zaffe, D. Release of elements from retrieved maxillofacial plates and screws. J. Mater. Sci. Mater. Med. 2005, 16, 857–861. [Google Scholar] [CrossRef]
- Pérez-Granados, A.M.; Vaquero, M.P. Silicon, aluminium, arsenic and lithium: Essentiality and human health implications. J. Nutr. Health Aging 2002, 6, 154–162. [Google Scholar] [PubMed]
- Rondeau, V. A review of epidemiologic studies on aluminum and silica in relation to Alzheimer’s disease and associated disorders. Rev. Environ. Health 2002, 17, 107–121. [Google Scholar] [CrossRef] [PubMed]


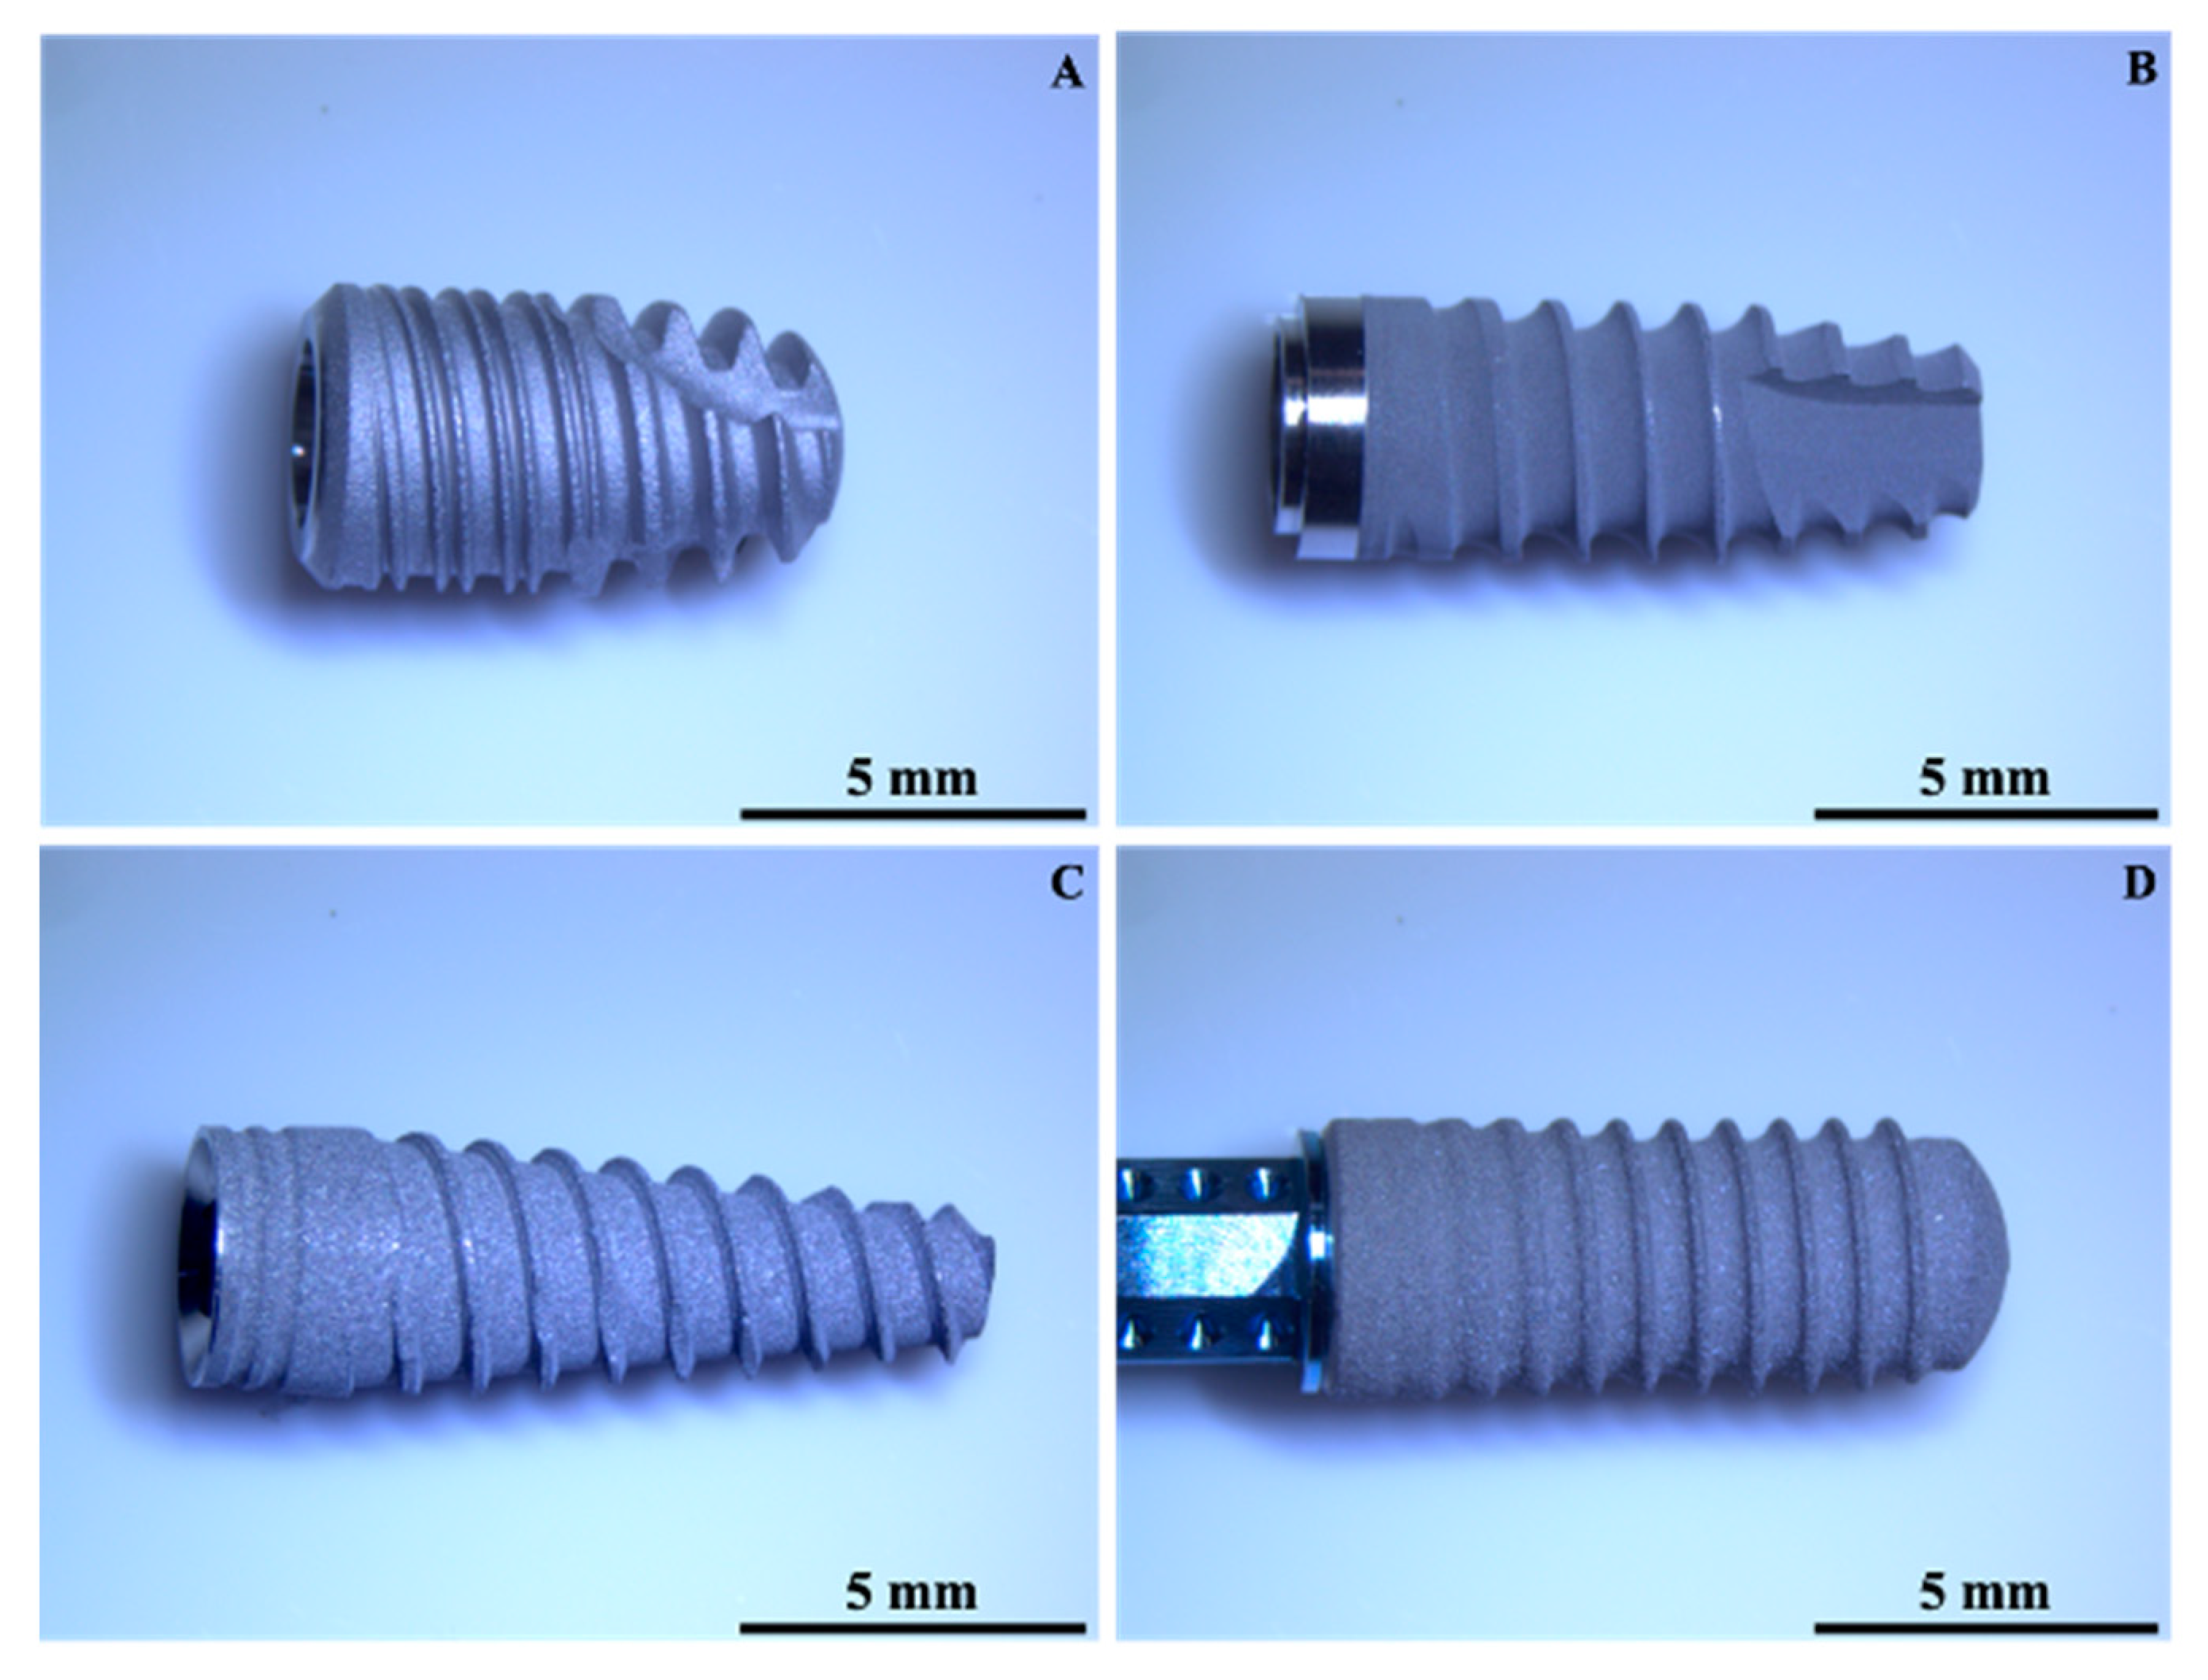
| Implant | Material | Surface Treatment | Length (mm) | Diameter (mm) |
|---|---|---|---|---|
| A | CP Ti | Sandblasting + double etching | 8.5 | 4.5 |
| B | Ti 6Al4V | Sandblasting + etching | 8.5 | 3.8 |
| C | Ti 6Al4V | Sandblasting + etching | 11.5 | 3.75 |
| D | Ti-Zr alloy | Sandblasting + etching | 12 | 3.3 |
| Material | UTS (MPa) | YS0.2 (MPa) | E (GPa) | EL (%) |
|---|---|---|---|---|
| CpTi | 660 | 590 | 105 | 20 |
| Ti6A14V | 950 | 880 | 113.8 | 14 |
| Sum of Squares | df | Mean Square | F | Sig. | ||
|---|---|---|---|---|---|---|
| Ra | Between Groups | 23.176 | 3 | 7.725 | 68.678 | 0.000 |
| Within Groups | 7.649 | 68 | 0.112 | |||
| Total | 30.824 | 71 | ||||
| Rz | Between Groups | 667.486 | 3 | 222.495 | 66.342 | 0.000 |
| Within Groups | 228.057 | 68 | 3.354 | |||
| Total | 895.543 | 71 | ||||
| Rp | Between Groups | 177.046 | 3 | 59.015 | 60.571 | 0.000 |
| Within Groups | 66.253 | 68 | 0.974 | |||
| Total | 243.299 | 71 | ||||
| Rv | Between Groups | 160.334 | 3 | 53.445 | 55.551 | 0.000 |
| Within Groups | 65.421 | 68 | 0.962 | |||
| Total | 225.755 | 71 | ||||
| Ra Mean (SD) | A 1.272 (0.3121) | B 0.550 (0.1098) | C 1.150 (0.2792) | D 2.139 (0.5124) |
|---|---|---|---|---|
| A Mean difference, p value | = | 0.7222, <0.001 | 0.1222, 1.00 | −0.8667, <0.001 |
| B Mean difference, p value | = | = | −0.6000, <0.001 | −1.5889, <0.001 |
| C Mean difference, p value | = | = | = | −0.9889, <0.001 |
| Rz Mean (SD) | A 6.339 (1.6807) | B 3.450 (0.7422) | C 6.317 (2.4120) | D 11.856 (2.4120) |
| A Mean difference, p value | = | 2.8889, <0.001 | 0.0222, 1.00 | −5.5167, <0.001 |
| B Mean difference, p value | = | = | −2.8667, <0.001 | −8.4056, <0.001 |
| C Mean difference, p value | = | = | = | −5.5389, <0.001 |
| Rp Mean (SD) | A 3.044 (0.7702) | B 1.756 (0.5055) | C 3.167 (1.0460) | D 6.044 (1.3980) |
| A Mean difference, p value | = | 1.2889, 0.001 | −0.1222, 1.00 | −3.0000, <0.001 |
| B Mean difference, p value | = | = | −1.4111, <0.001 | −4.2889, <0.001 |
| C Mean difference, p value | = | = | = | −2.8778, <0.001 |
| Rv Mean (SD) | A 3.272 (0.9940) | B 1.656 (0.3203) | C 3.161 (1.0689) | D 5.811 (1.2709) |
| A Mean difference, p value | = | 1.6167, <0.001 | 0.1111, 1.000 | −2.5389, <0.001 |
| B Mean difference, p value | = | = | −1.5056, <0.001 | −4.1556, <0.001 |
| C Mean difference, p value | = | = | = | −2.6500, <0.001 |
| Sum of Squares | df | Mean Square | F | Sig. | ||
|---|---|---|---|---|---|---|
| Rsk | Between Groups | 0.867 | 3 | 0.289 | 2.970 | 0.038 |
| Within Groups | 6.613 | 68 | 0.097 | |||
| Total | 7.480 | 71 | ||||
| Rku | Between Groups | 3.836 | 3 | 1.279 | 2.035 | 0.117 |
| Within Groups | 42.723 | 68 | 0.628 | |||
| Total | 46.559 | 71 | ||||
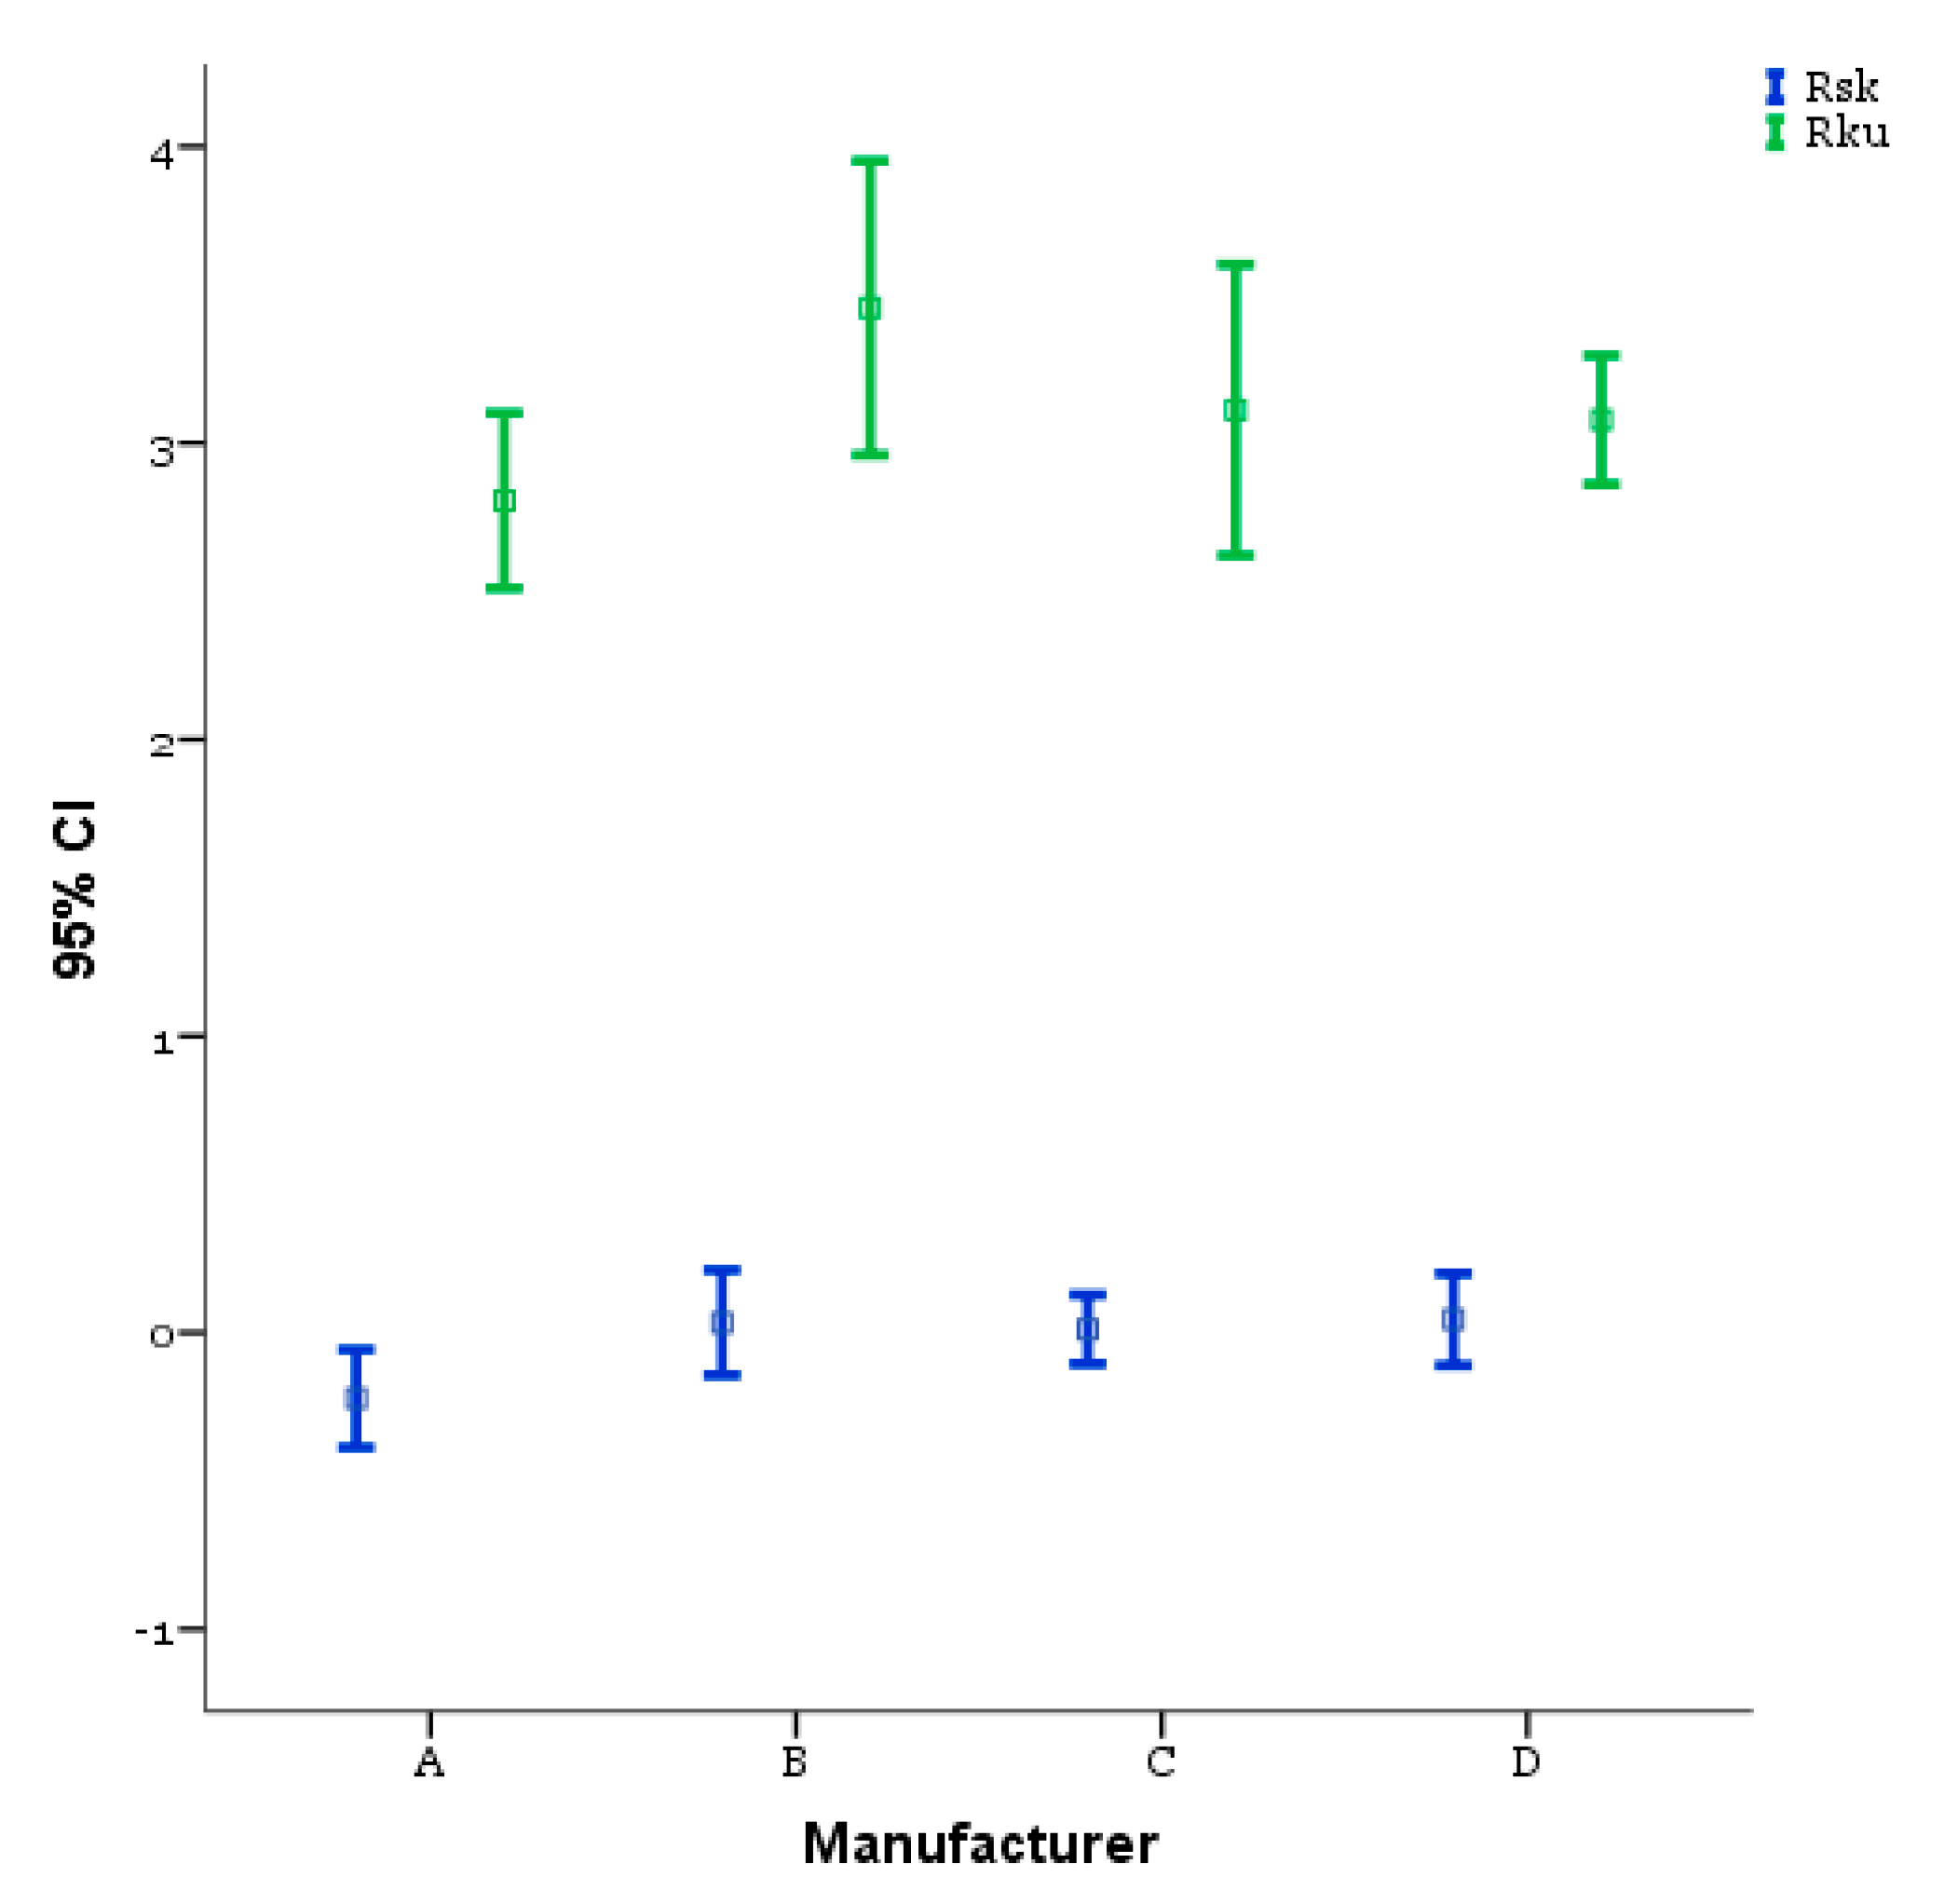
| Rsk Mean (SD) | A −0.222 (0.3318) | B 0.033 (0.3565) | C 0.011 (0.2349) | D 0.044 (0.3110) |
|---|---|---|---|---|
| A Mean difference, p value | = | −0.2556, 0.099 | −0.2333, 0.168 | −0.2667, 0.075 |
| B Mean difference, p value | = | = | 0.0222, 1.000 | −0.0111, 1.000 |
| C Mean difference, p value | = | = | = | −0.0333, 1.000 |
| Rku Mean (SD) | A 2.806 (0.5955) | B 3.456 (0.9972) | C 3.111 (0.9869) | D 3.078 (0.4360) |
| A Mean difference, p value | = | −0.6500, 0.099 | −0.3056, 1.000 | −0.2722, 1.000 |
| B Mean difference, p value | = | = | 0.3444, 1.000 | 0.3778, 0.944 |
| C Mean difference, p value | = | = | = | 0.0333, 1.000 |
| Test of Function(s) | Wilks’ Lambda | Chi-Square | df | Sig. |
|---|---|---|---|---|
| 1 through 2 | 0.198 | 110.283 | 6 | 0.000 |
| 2 | 0.816 | 13.794 | 2 | 0.001 |
| Eigenvalues | |||
|---|---|---|---|
| Function | Eigenvalue | % of Variance | Cumulative % |
| 1 | 3.133 | 93.3 | 93.3 |
| 2 | 0.225 | 6.7 | 100.0 |
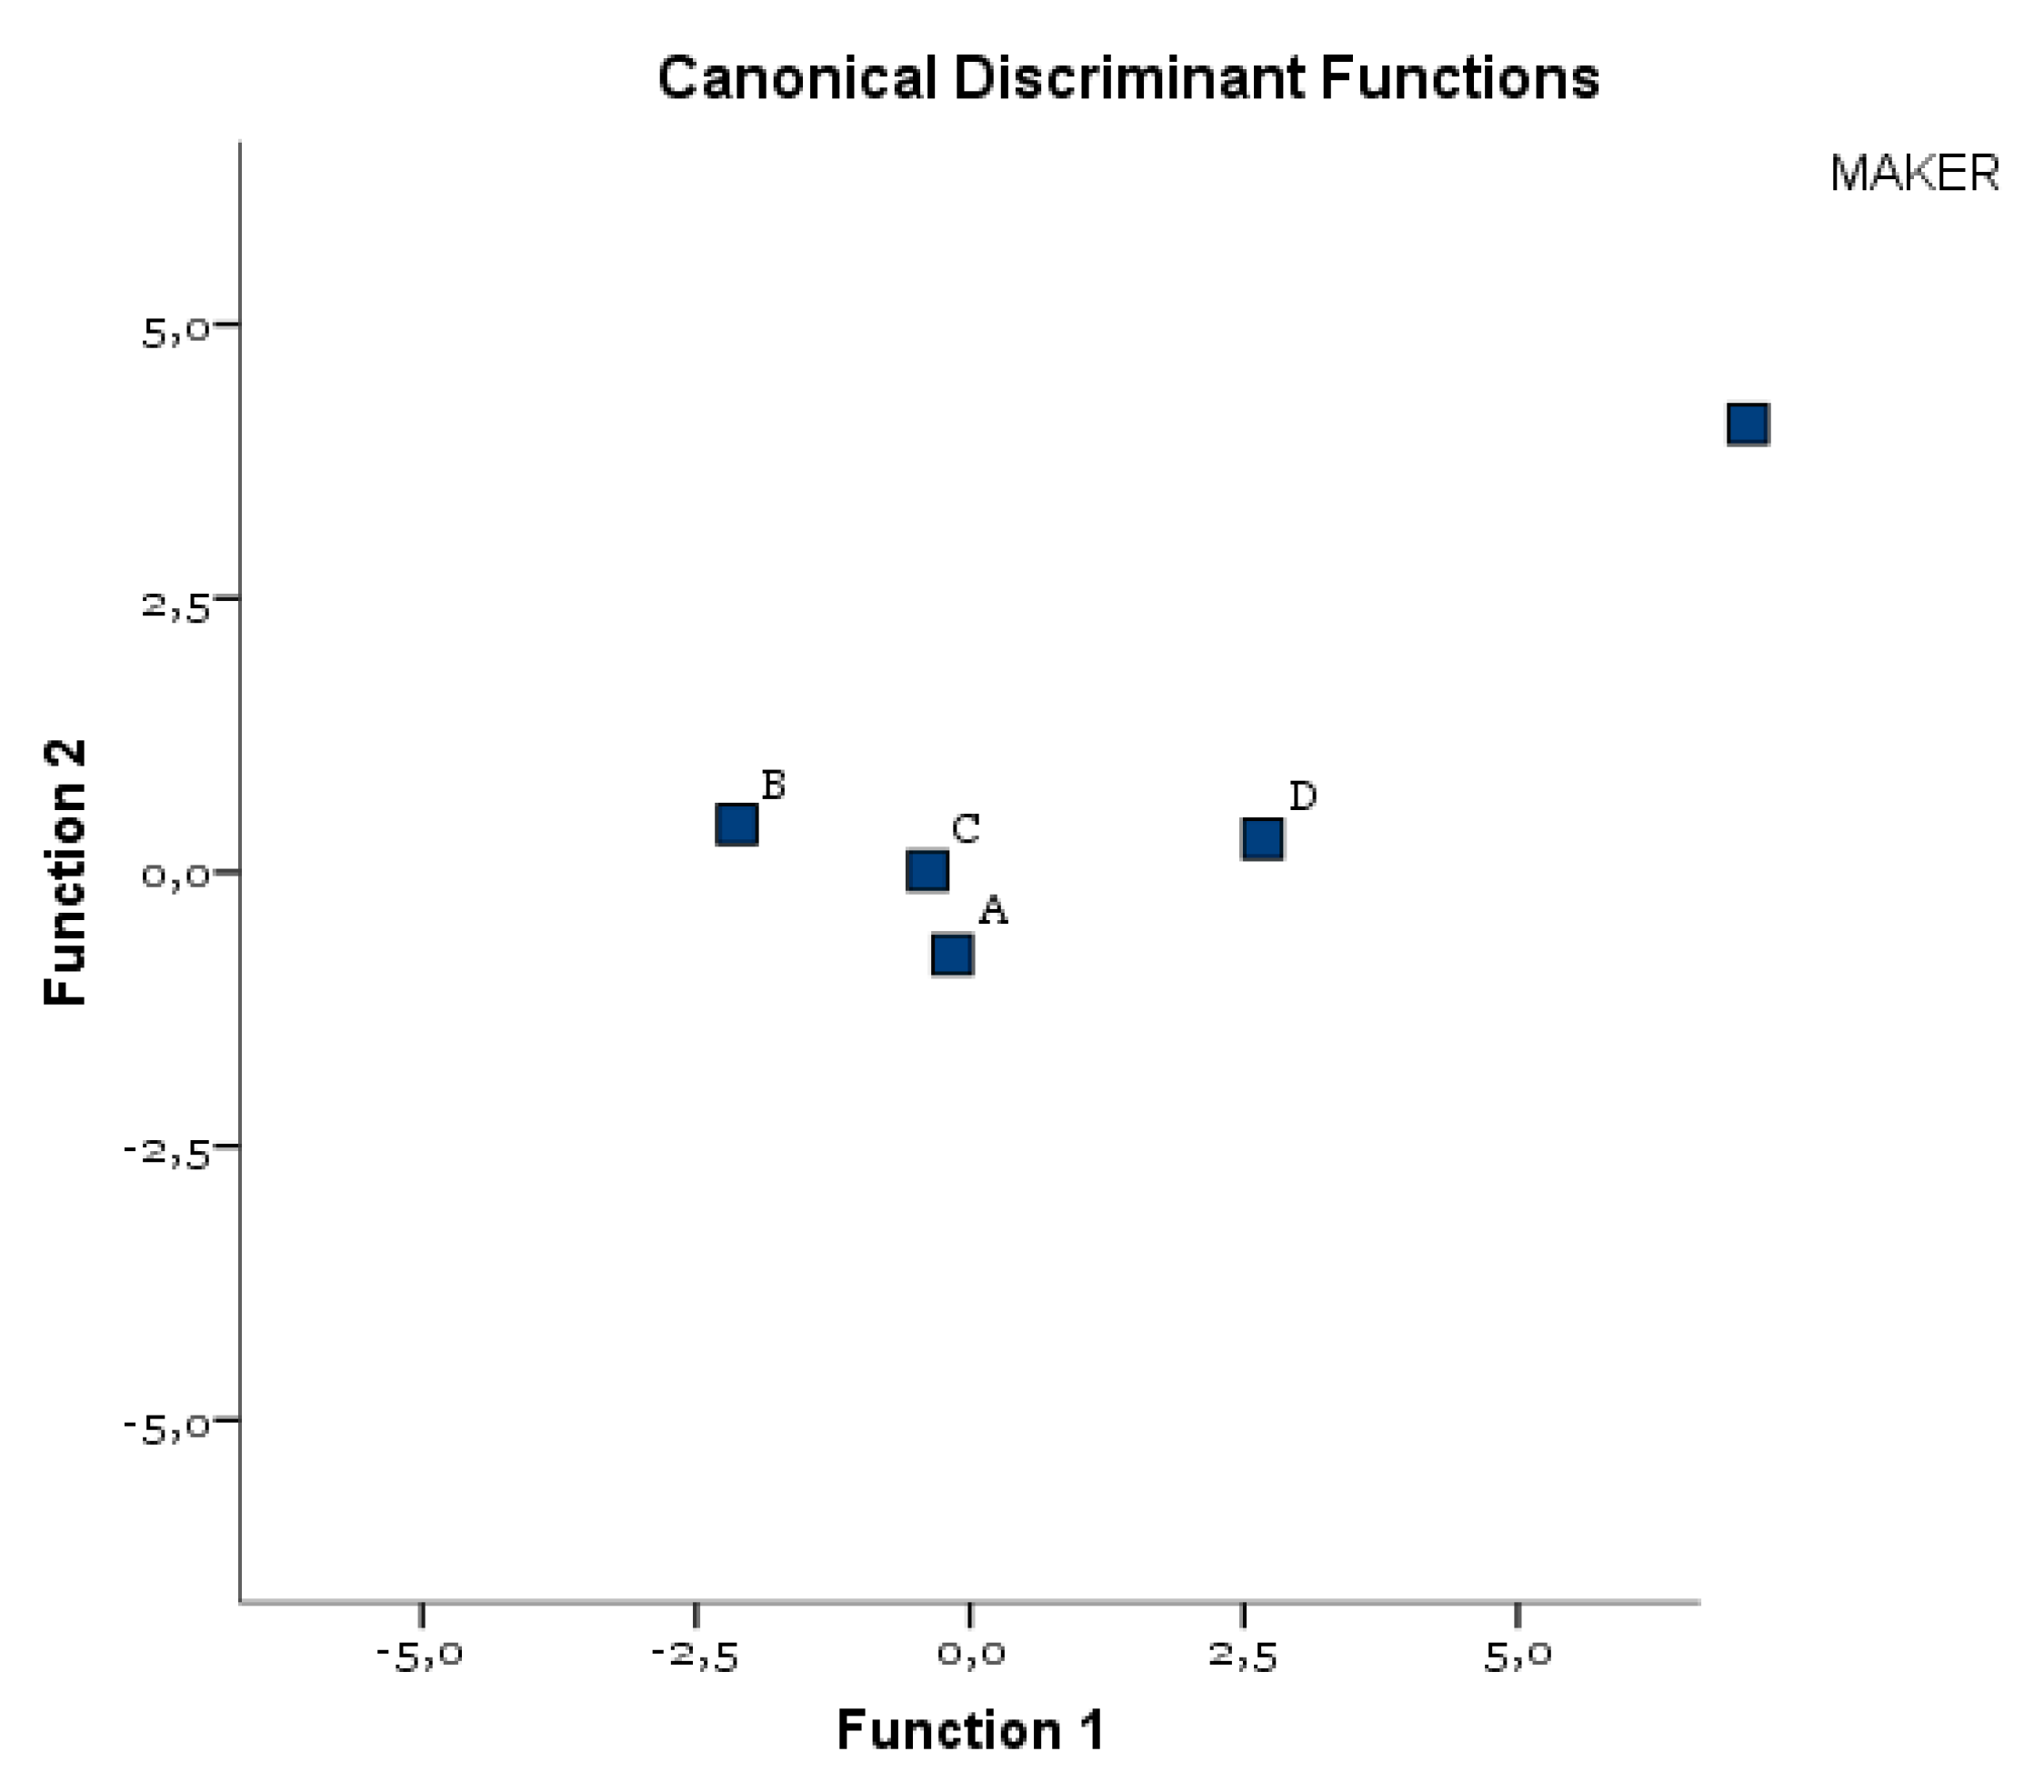
| Classification Results a | |||||||
|---|---|---|---|---|---|---|---|
| Manufacturer | Predicted Group Membership | Total | |||||
| A | B | C | D | ||||
| Original | Count | A | 11 | 2 | 4 | 1 | 18 |
| B | 0 | 18 | 0 | 0 | 18 | ||
| C | 5 | 3 | 8 | 2 | 18 | ||
| D | 2 | 0 | 1 | 15 | 18 | ||
| % | A | 61.1 | 11.1 | 22.2 | 5.6 | 100.0 | |
| B | 0.0 | 100.0 | 0.0 | 0.0 | 100.0 | ||
| C | 27.8 | 16.7 | 44.4 | 11.1 | 100.0 | ||
| D | 11.1 | 0.0 | 5.6 | 83.3 | 100.0 | ||
| Element (wt%) | A | B | C | D (Surface) | D (Particle) |
|---|---|---|---|---|---|
| Titanium | 72.9 | 90.0 | 76.9 | 79.3 | 3.5 |
| Aluminium | 8.7 | -- | -- | -- | 44.7 |
| Vanadium | 3.9 | -- | -- | -- | -- |
| Oxygen | 14.5 | 10.0 | 23.1 | 8.7 | 51.4 |
| Zirconium | -- | -- | -- | 12.0 | 0.6 |
Publisher’s Note: MDPI stays neutral with regard to jurisdictional claims in published maps and institutional affiliations. |
© 2021 by the authors. Licensee MDPI, Basel, Switzerland. This article is an open access article distributed under the terms and conditions of the Creative Commons Attribution (CC BY) license (https://creativecommons.org/licenses/by/4.0/).
Share and Cite
El Hassanin, A.; Quaremba, G.; Sammartino, P.; Adamo, D.; Miniello, A.; Marenzi, G. Effect of Implant Surface Roughness and Macro- and Micro-Structural Composition on Wear and Metal Particles Released. Materials 2021, 14, 6800. https://doi.org/10.3390/ma14226800
El Hassanin A, Quaremba G, Sammartino P, Adamo D, Miniello A, Marenzi G. Effect of Implant Surface Roughness and Macro- and Micro-Structural Composition on Wear and Metal Particles Released. Materials. 2021; 14(22):6800. https://doi.org/10.3390/ma14226800
Chicago/Turabian StyleEl Hassanin, Andrea, Giuseppe Quaremba, Pasquale Sammartino, Daniela Adamo, Alessandra Miniello, and Gaetano Marenzi. 2021. "Effect of Implant Surface Roughness and Macro- and Micro-Structural Composition on Wear and Metal Particles Released" Materials 14, no. 22: 6800. https://doi.org/10.3390/ma14226800