Article

Artificial Neural Network (ANN) and Finite Element (FEM) Models for GFRP-Reinforced Concrete Columns under Axial Compression

1
Department of Civil Engineering, Tsinghua University, Beijing 180004, China
2
Department of Civil Engineering, Faculty of Engineering, Islamic University of Gaza, Gaza P.O. Box 108, Palestine
3
Department of Civil and Environmental Engineering, Universiti Teknologi PETRONAS, Bandar Seri Iskandar, Tronoh 32610, Malaysia
4
Department of Civil Engineering, University of Engineering and Technology, Taxila 47050, Pakistan
*
Authors to whom correspondence should be addressed.
Materials 2021, 14(23), 7172; https://doi.org/10.3390/ma14237172
Submission received: 5 October 2021 / Revised: 27 October 2021 / Accepted: 29 October 2021 / Published: 25 November 2021

Abstract

:
In reinforced concrete structures, the fiber-reinforced polymer (FRP) as reinforcing rebars have been widely used. The use of GFRP (glass fiber-reinforced polymer) bars to solve the steel reinforcement corrosion problem in various concrete structures is now well documented in many research studies. Hollow concrete-core columns (HCCs) are used to make a lightweight structure and reduce its cost. However, the use of FRP bars in HCCs has not yet gained an adequate level of confidence due to the lack of laboratory tests and standard design guidelines. Therefore, the present paper numerically and empirically explores the axial compressive behavior of GFRP-reinforced hollow concrete-core columns (HCCs). A total of 60 HCCs were simulated in the current version of Finite Element Analysis (FEA) ABAQUS. The reference finite element model (FEM) was built for a wide range of test variables of HCCs based on 17 specimens experimentally tested by the same group of researchers. All columns of 250 mm outer diameter, 0, 40, 45, 65, 90, 120 mm circular inner-hole diameter, and a height of 1000 mm were built and simulated. The effects of other parameters cover unconfined concrete strength from 21.2 to 44 MPa, the internal confinement (center to center spiral spacing = 50, 100, and 150 mm), and the amount of longitudinal GFRP bars (ρv = 1.78–4.02%). The complex column response was defined by the concrete damaged plastic model (CDPM) and the behavior of the GFRP reinforcement was modeled as a linear-elastic behavior up to failure. The proposed FEM showed an excellent agreement with the tested load-strain responses. Based on the database obtained from the ABAQUS and the laboratory test, different empirical formulas and artificial neural network (ANN) models were further proposed for predicting the softening and hardening behavior of GFRP-RC HCCs.

1. Introduction

The use of glass fiber-reinforced polymer (GFRP) rebars as a replacement for the internal steel reinforcement is an excellent solution to have durable reinforced concrete (RC) structures in aggressive environments [1,2]. Therefore, many studies have concentrated on understanding and simulating the axial behavior of concrete members with internal FRP bars (i.e., [3,4,5,6,7,8,9,10,11,12,13,14]). Among them, hollow concrete-core columns (HCCs) are widely used in civil infrastructures including bridge piers, ground piles, and utility poles to minimize the total weight and reduce costs. HCCs are also considered in practice to increase the strength-to-mass ratio of structures compared with solid concrete columns [15,16,17,18]. Designing HCCs with adequate strength and ductility, however, requires careful consideration of important variables, such as the details of the hoop confinement and compressive strength of concrete [15,19,20,21]. HCCs tested in [15] with a larger spacing of hoop reinforcement result in brittle failure, premature buckling of vertical bars, and reduced deformation. Lee et al. [18] reported that decreasing the spacing of the lateral reinforcement from 80 mm to 40 mm enhanced the ductility by 20% and minimized the damage associated with the inner concrete core. In addition, Mo et al. [19] found that when the concrete compressive strength increased from 30 MPa to 50 MPa, it yielded stiffer resistance in compressed HCCs, but with up to a 50% reduction in deformation capacity because of faster crack propagation and concrete splitting. Based on these researches, the ductility capacity of HCCs is significantly influenced by hoop confinement details, and the failure mode depends largely on the grade of concrete compressive strength.
Moreover, one of the major aspects influencing the seismic capacity of HCCs is the aspect ratio (length to cross-section depth). The failure pattern and the mechanical performance of the hollow concrete-core columns depend on the effect of the amount of longitudinal reinforcement [22,23]. Various researches examine the mechanical performance of HCCs with internal steel bars under different loading conditions [18,19,22,23,24,25,26,27,28]. These studies concluded that the structural behavior of HCCs depends on the ratio of inner to the outer diameter of the HCCs (Di/D), axial-loading ratio, amount of longitudinal reinforcement, and the amount of the lateral confinement. Furthermore, when the Di/D was increased while keeping the other variables constant, the ductility of steel-reinforced HCCs was decreased. Due to the brittle failure of HCCs under shear stresses, a sudden decrease in the axial compressive strength capacity occurred at the ultimate condition [29,30]. The reduced axial compressive strength was more prominent for the HCCs with larger inner-to-outer concrete-core diameter ratios [18,20]. Due to buckling failure and limited axial strains of steel, the axial performance of HCCs was not examined in the post-loading stage. Instead, when the steel bars start to buckle, the crushing of concrete material occurs [16,31,32].
On the other hand, increasing the inner-to-outer concrete-core diameter ratio in the GFRP-RC HCCs changed the columns’ failure pattern from brittle to ductile as reported by AlAjarmeh et al. [6]. After spalling of concrete cover, the failure in the HCCs with inner-to-outer concrete-core diameter ratio of 0.16 or 0.26 was initiated by the vertical and lateral GFRP-reinforcing rebars, while the failure of the HCCs with inner-to-outer concrete-core diameter ratio of 0.36 was initiated by crushing of the hollow concrete part. AlAjarmeh et al. [6] found that the GFRP HCCs performed better than steel-reinforced HCCs with a higher inner-to-outer diameter ratio because of the higher contribution of GFRP bars to the overall stiffness of the column. The GFRP HCCs exhibited 11% higher axial capacity than the steel-reinforced HCCs. The GFRP-RC HCCs showed 22% and 54% higher ductility and confinement efficiency than the steel RC HCCs, respectively. In addition, AlAjarmeh et al. [5] found that the increase in the diameter and number of longitudinal GFRP bars increased the strength and ductility of the GFRP HCCs.
Many analytical models for predicting the strength and ductility of steel-confined concrete are now available in the literature [33,34,35]. However, designing concrete structures with GFRP bars is not straightforward by using steel-reinforced concrete design formulas and guidelines due to the different properties of FRP bars compared to steel. This is because concrete columns confined by steel hoops behave differently from columns confined by internal FRP hoops, and if these models are applied to columns with internal FRP reinforcement, the strength, strain, and structural response may be inaccurately estimated. One of the challenges that often face engineers is to estimate the maximum compressive strength and ductility capacities of FRP-reinforced concrete columns accurately. This can be achieved using destructive methods through laboratory tests or non-destructive methods such as analytical design models. A monotonic stress-strain model as an envelope response of the cyclic stress-strain model is also necessary for the seismic analysis of FRP-confined RC columns based on fiber approach [36] or finite element model [37,38].
Therefore, many researchers worked on the finite element modeling (FEM) of GFRP or CFRP confined solid concrete columns under different loading conditions [39,40,41,42,43,44,45,46]. These researches confirmed that the FEM simulation can capture the failure pattern and the structural performance of FRP-RC columns accurately. The FEM explicitly deals with all the deficiencies of the mathematical models. The FE simulations can save time and cost as compared with tests by creating suitable computational models that can simulate the complex damaging behavior of FRP composites accurately [47]. To simplify the FEM and to speed up the FE simulations, it is essential to make some assumptions, but it is also important to implement the actual experimental testing environments in FEM. It is suggested to overcome the model’s complexities by choosing the accurate types and sizes of elements to significantly reduce the simulation period and to improve the performance of the numerical findings. Therefore, as stated in Ref. [48] the FEM using ABAQUS software [49] with strong background knowledge is the most efficient tool to solve various engineering problems.
The recent work conducted in [50] consists of two aims: the first aim is to propose a new FEM model for predicting the axial structural performance of HCCs reinforced with GFRP bars, and the second aim is to propose the new empirical models for predicting the first and second peak loads of HCCs reinforced with GFRP rebar. To achieve the major goal of the present paper, a finite element model for HCCs reinforced with GFRP bars was constructed using the ABAQUS software [49]. This model was calibrated for various material and geometric parameters of the test specimens using experimental results from [5]. To date, all the available models regarding FRP-RC hollow columns have not yet, however, considered the effect of several test variables as discussed previously such as lateral spiral spacing, concrete compressive strength, and the ratio of inner to the outer diameter of the HCCs on the failure mode, load-displacement behavior, ductility, and strength of hollow concrete-core columns.
In addition, authors are now using the power of advanced learning methods in civil infrastructure systems, and many studies that successfully estimate the mechanical performance of steel- or FRP-confined concrete have been published (i.e., [51,52,53,54,55,56]). Among the studies, Oreta and Kawashima [51] have used artificial neural networks (ANN) to estimate the axial strength and strain of compressed steel-confined concrete columns of circular sections. An ANN model with input variables including the concrete‘s compressive strength, the concrete-core diameter, the column height, the longitudinal reinforcement ratio, and the effectiveness of hoop confinement was reported. The ANN models are shown to be very important in simulating physical processes. The ANN models are also found to provide better results compared with some Regression Analysis (RA) models.
The present paper aims to provide a full stress-strain model based on the available experiments and findings of GFRP-RC HCCs. The model consists of different approaches of ANN modeling and regression-based models. The database used in the analysis contains the experimental results of axial compression tests on 17 circular specimens reinforced with internal longitudinal GFRP rebars and spirals. It is to be noted that the available studies on GFRP HCCs [5,6,7] have considered a limited range of inner-to-outer core diameter ratios. These diameters were chosen based on commercially available PVC pipes and resulted in inner-to-outer concrete-core diameter ratios similar to those studied in [16,32,57,58]. This model was, therefore, calibrated for various material and geometric parameters of specimens using the load-strain results in [5,6,7] as well as new test specimens constructed with the help of ABAQUS software [49]. Due to limitations in the column tests, a full database of 60 FRP-reinforced concrete members was obtained using Finite Element Analysis (FEA) ABAQUS to secure several objectives of the present paper. An easy-to-use approach is then provided for predicting the compressive strength and strain of FRP-RC columns. The proposed models for the design of FRP-confined RC columns can guarantee a safe design in regards to new column parameters.

2. Research Significance

The design of FRP-reinforced concrete members under flexural loading has been documented in the literature [59,60,61]. However, it is recommended by these guidelines to ignore the axial capacity contributed by the longitudinal FRP bars in the section under compression. The use of FRP rebars as reinforcement in concrete members under compression is not suggested by the ACI code [59] due to uncertainty and inadequate information regarding the variation in properties of compressed FRP bars. CSA-S806-12 [60] suggests using the FRP bars in compression members without taking into account the compression contribution of FRP bars for designing. The reinforcing GFRP bars in concrete columns were investigated in several experimental studies in the last period (i.e., [60,62,63,64,65,66,67,68,69]), which led to the introduction of many theoretical and numerical models. Table 1 shows a summary of these models. The existing tests and proposed models confirmed that when the axial capacity of the longitudinal FRP rebars is ignored, the overall column capacity is underestimated [3,70]. According to Tobbi et al.’s [3] study on GFRP-RC columns, the contribution made by the longitudinal FRP rebars at the peak loading condition was 35% of their maximum strength in tension. Elmessalami et al. [71] have recently reviewed and analyzed the tests available on FRP-reinforced concrete columns and found that the GFRP rebars provide an enhancement of about 3 to 14% at peak load and that CFRP bars give 6 to 19% mainly based on the FRP reinforcement ratio. Considering these findings and determining the axial compression capacity of the column by taking the axial strain of the FRP rebars equal to that of the unconfined concrete at peak load (i.e., 0.003) reveals excellent agreement with the test findings [11].
However, it is to be noted that all of these experimental tests and theoretical investigations have been focused largely on solid FRP-reinforced concrete members. Furthermore, the proposed models mainly estimate the maximum peak axial capacity in the elastic region of the axial load-axial strain response. Compared with GFRP-reinforced solid concrete columns, the hollow columns with internal longitudinal and lateral GFRP reinforcement exhibited significantly different failure patterns and structural responses [6]. Due to the reduced effective concrete area, the hollow columns failed at a reduced axial load compared with that of the solid columns. In this paper, to gain sufficient knowledge on the effect of the published models on stress predictions, Table 1 provides clear comparisons between the estimated errors (AAE, MSE, SD) obtained by comparing the theoretical predictions with the results of 60 HCCs provided in the present paper.
Generally, the comparisons of Table 1 reveal that all models that consider the strain in FRP bars to be similar to the peak strain of unconfined concrete (i.e., 0.003) (i.e., [63]), provide lower AAE errors as compared with the other models. However, an inspection of the comparisons with the strengths at the columns’ failures indicates that the AAE errors of the models are almost three times higher than those calculated at the peak load. If the results of these models are incorporated into an axial stress-strain model, the overall structural response of the columns may be significantly different than the experimental one. In light of research demands, the goal of the following sections of the present paper is to develop a new axial compression model that can accurately predict the axial load-axial strain response of concrete columns of both solid and hollow cross-sections reinforced with longitudinal GFRP rebars and spirals.

3. Experimental Program

3.1. Tests Addressing the Effect of Longitudinal Reinforcement Ratio

The tests in Ref. [5] aimed at addressing the effect of reinforcement ratio as the main design and test parameter on the behavior of hollow concrete-core columns. To achieve this goal, six GFRP-reinforced concrete columns 250 mm in diameter and 1000 mm in height were cast and tested. All the tested columns were reinforced longitudinally with sand-coated and high-modulus GFRP bars of different diameters (12.7, 15.9, or 19.1 mm) and amounts of longitudinal reinforcement but with the same configuration of lateral GFRP spirals. The GFRP spirals were spaced at 100 mm center-to-center in the vertical direction along 500 mm at the column mid-height and to avoid a sudden premature failure caused by the stress concentration spiral spacing of 50 mm within the rest of the column’s region is chosen. The inner-to-outer diameter ratio was constant at 0.36. Figure 1 shows the cross-sections and reinforcement details of the tested columns, and Table 2 provides the details of column geometry, configuration and amount of GFRP reinforcement, and material properties. The specimens corresponding to their tests in Table 1 were designated with the C that indicates the grade of concrete (i.e., C25), followed by the spiral spacing (i.e., H100) and then the number and size of GFRP vertical reinforcement. The last code refers to the inner-hole diameter. For example, specimen C25-H100-6#4-90 is a hollow concrete-core column reinforced with six #4 GFRP bars and the diameter of the inner hole is 90 mm. All columns in these tests were made with ready-mix concrete and the average concrete compressive strength at 28 days was 25.0 MPa.

3.2. Tests Addressing the Effect of Inner Void’s Size

The goal of the tests in Ref. [6] is to evaluate the effect of the inner-to-outer concrete-core diameter ratio on the structural response and failure model of both GFRP and steel-reinforced hollow concrete-core columns. To achieve this goal, five concrete columns 250 mm in diameter and 1000 mm in height were cast and tested. Among them, four columns were constructed with GFRP bars and spirals, while only one column was constructed with longitudinal steel bars and GFRP spirals. It is to be noted that the present paper has not considered modeling steel-reinforced concrete columns. All the tested five columns were reinforced with six longitudinal rebars and GFRP spirals with a center-to-center spacing of 100 mm along 500 mm length at the column mid-height, and to avoid premature failure by stress concentration a vertical spacing of 50 mm within 250 mm in the other 250 mm regions of the columns was chosen. A total of 6 longitudinal GFRP and steel bars were used comprising the same reinforcement ratio of 2.79%, which is within the recommended range of 1–4%. To determine the effect of the inner hollow core size. The details of the reinforcement were kept similar for all tested columns. The inner-hole diameters were 40 mm, 65 mm, and 90 mm. A solid concrete column was also prepared and tested as a reference specimen. A concrete column with a maximum diameter of 250 mm was considered due to the limited capacity of the test equipment. A diameter of 90 mm for the inner core was selected for a sufficient concrete cover for the longitudinal rebars. Similarly, a hollow column with an inner diameter of 65 mm (Di/D ratio = 0.26) and reinforced with the same reinforcement details with six 16 mm steel bars was taken as a benchmark for comparison with the GFRP-reinforced columns. Figure 1 shows the cross-sections and reinforcement details of the tested columns, and Table 2 provides the full details of the specimens and reinforcement materials. Similarly, the specimens corresponding to their tests in Table 1 were designated with the C that indicates the grade of concrete (i.e., C31.8), followed by the spiral spacing (i.e., H100) and then the amount of vertical GFRP-reinforcing bars and their size. The last code refers to the inner-hole diameter. For example, specimen C31.8-H100-6#5-65 is a hollow concrete-core column reinforced with six #5 GFRP bars and the diameter of the inner hole is 65 mm. The average concrete compressive strength for all specimens at 28 days was around 31.8 MPa.

3.3. Tests Addressing the Effect of Varying Amount of Internal GFRP Confinement

The tests in Ref. [7] aimed at investigating the effectiveness of GFRP bars and spirals as internal reinforcement in HCCs. It focused on evaluating the effect of lateral spiral spacing and concrete compressive strength on the failure mode, load-displacement behavior, ductility, and confined strength of hollow concrete-core columns. To achieve these goals, seven concrete columns fully reinforced with GFRP bars with overall dimensions of 250 mm in diameter and 1000 mm in height were cast and tested. The column section and its maximum capacity were carefully determined to be successfully tested by the machine. All columns were longitudinally reinforced with six GFRP bars following the reinforcement details, and ratio recommended in the AS3600 code [58] for steel reinforcement. Consequently, the reinforcement ratio of 2.79% was similar for all test columns. The inner-to-outer diameter ratio was constant at 0.36. Among all tests, three columns were reinforced laterally with GFRP spirals with spacings of 50, 100, and 150 mm at the middle portion of the samples (500 mm). Another column without lateral reinforcement at the testing region (500 mm) was prepared to evaluate the effect of the lateral reinforcement. These lengths were chosen to ensure crushing failure in the bars with lengths of 50, 100, and 150 mm, and bar buckling failure in the last sample. The remaining specimens were cast with different concrete strengths (21.2, 26.8, 36.8, and 44.0 MPa) and tested. These levels of compressive strength were considered normal-strength concrete, as indicated in the ACI 318 code [59]. The details of the reinforcing bars for all tested columns were similar, in which the longitudinal reinforcement ratio was 2.79% and 100 mm spacing between lateral spirals was chosen to determine the effect of varying compressive strengths of unconfined concrete. Figure 1 shows the cross-sections and reinforcement details of the tested columns, and Table 2 provides the full details of the specimens and reinforcement materials. Similarly, the specimens corresponding to their tests in Table 1 were designated with the C that indicates the grade of concrete (i.e., C21.2, 26.8, 36.8, 44.0 MPa), followed by the spiral spacing (i.e., H100), and then the amount of GFRP rebars in the longitudinal direction and their size. The last code refers to the inner-hole diameter. For example, specimen C44.0-H100-6#5-90 is a hollow concrete-core column reinforced with six #5 GFRP bars and the diameter of the inner hole is 90 mm.

3.4. Tests with the Help of ABAQUS Software

The Finite Element (FE) experiments consist of 43 specimens with similar dimensions of 250 mm in diameter and 1000 mm in height. These specimens considered a new range of test parameters. An example is that Alajarmeh et al. [6] have focused on assessing the influence of the inner-to-outer diameter ratio on the structural performance of HCCs, while all their columns were reinforced and constructed with the same materials and reinforcement configurations. The present paper, therefore, expanded the range of investigated Di/D ratio from 0.16 to 0.48 (i.e., C44.0-H100-6#5-120, C31.8-H100-6#5-120, C26.8-H50-6#5-120, C26.8-H100-6#5-120, C26.8-H150-6#5-120, C21.2-H100-6#5-120) to overcome the limited sizes of PVC pipes that are available in the market. For a comprehensive development of an empirical axial stress-strain model, solid concrete columns were also provided (C31.8-H100-6#5-00, C26.8-H50-6#5-00, C26.8-H150-6#5-00, C21.2-H100-6#5-00, C44.0-H100-6#5-00, C26.8-H100-6#5-00). The detail of the columns’ cross-sections and the configuration and amount of the GFRP reinforcing rebars.

4. Finite Element Modeling

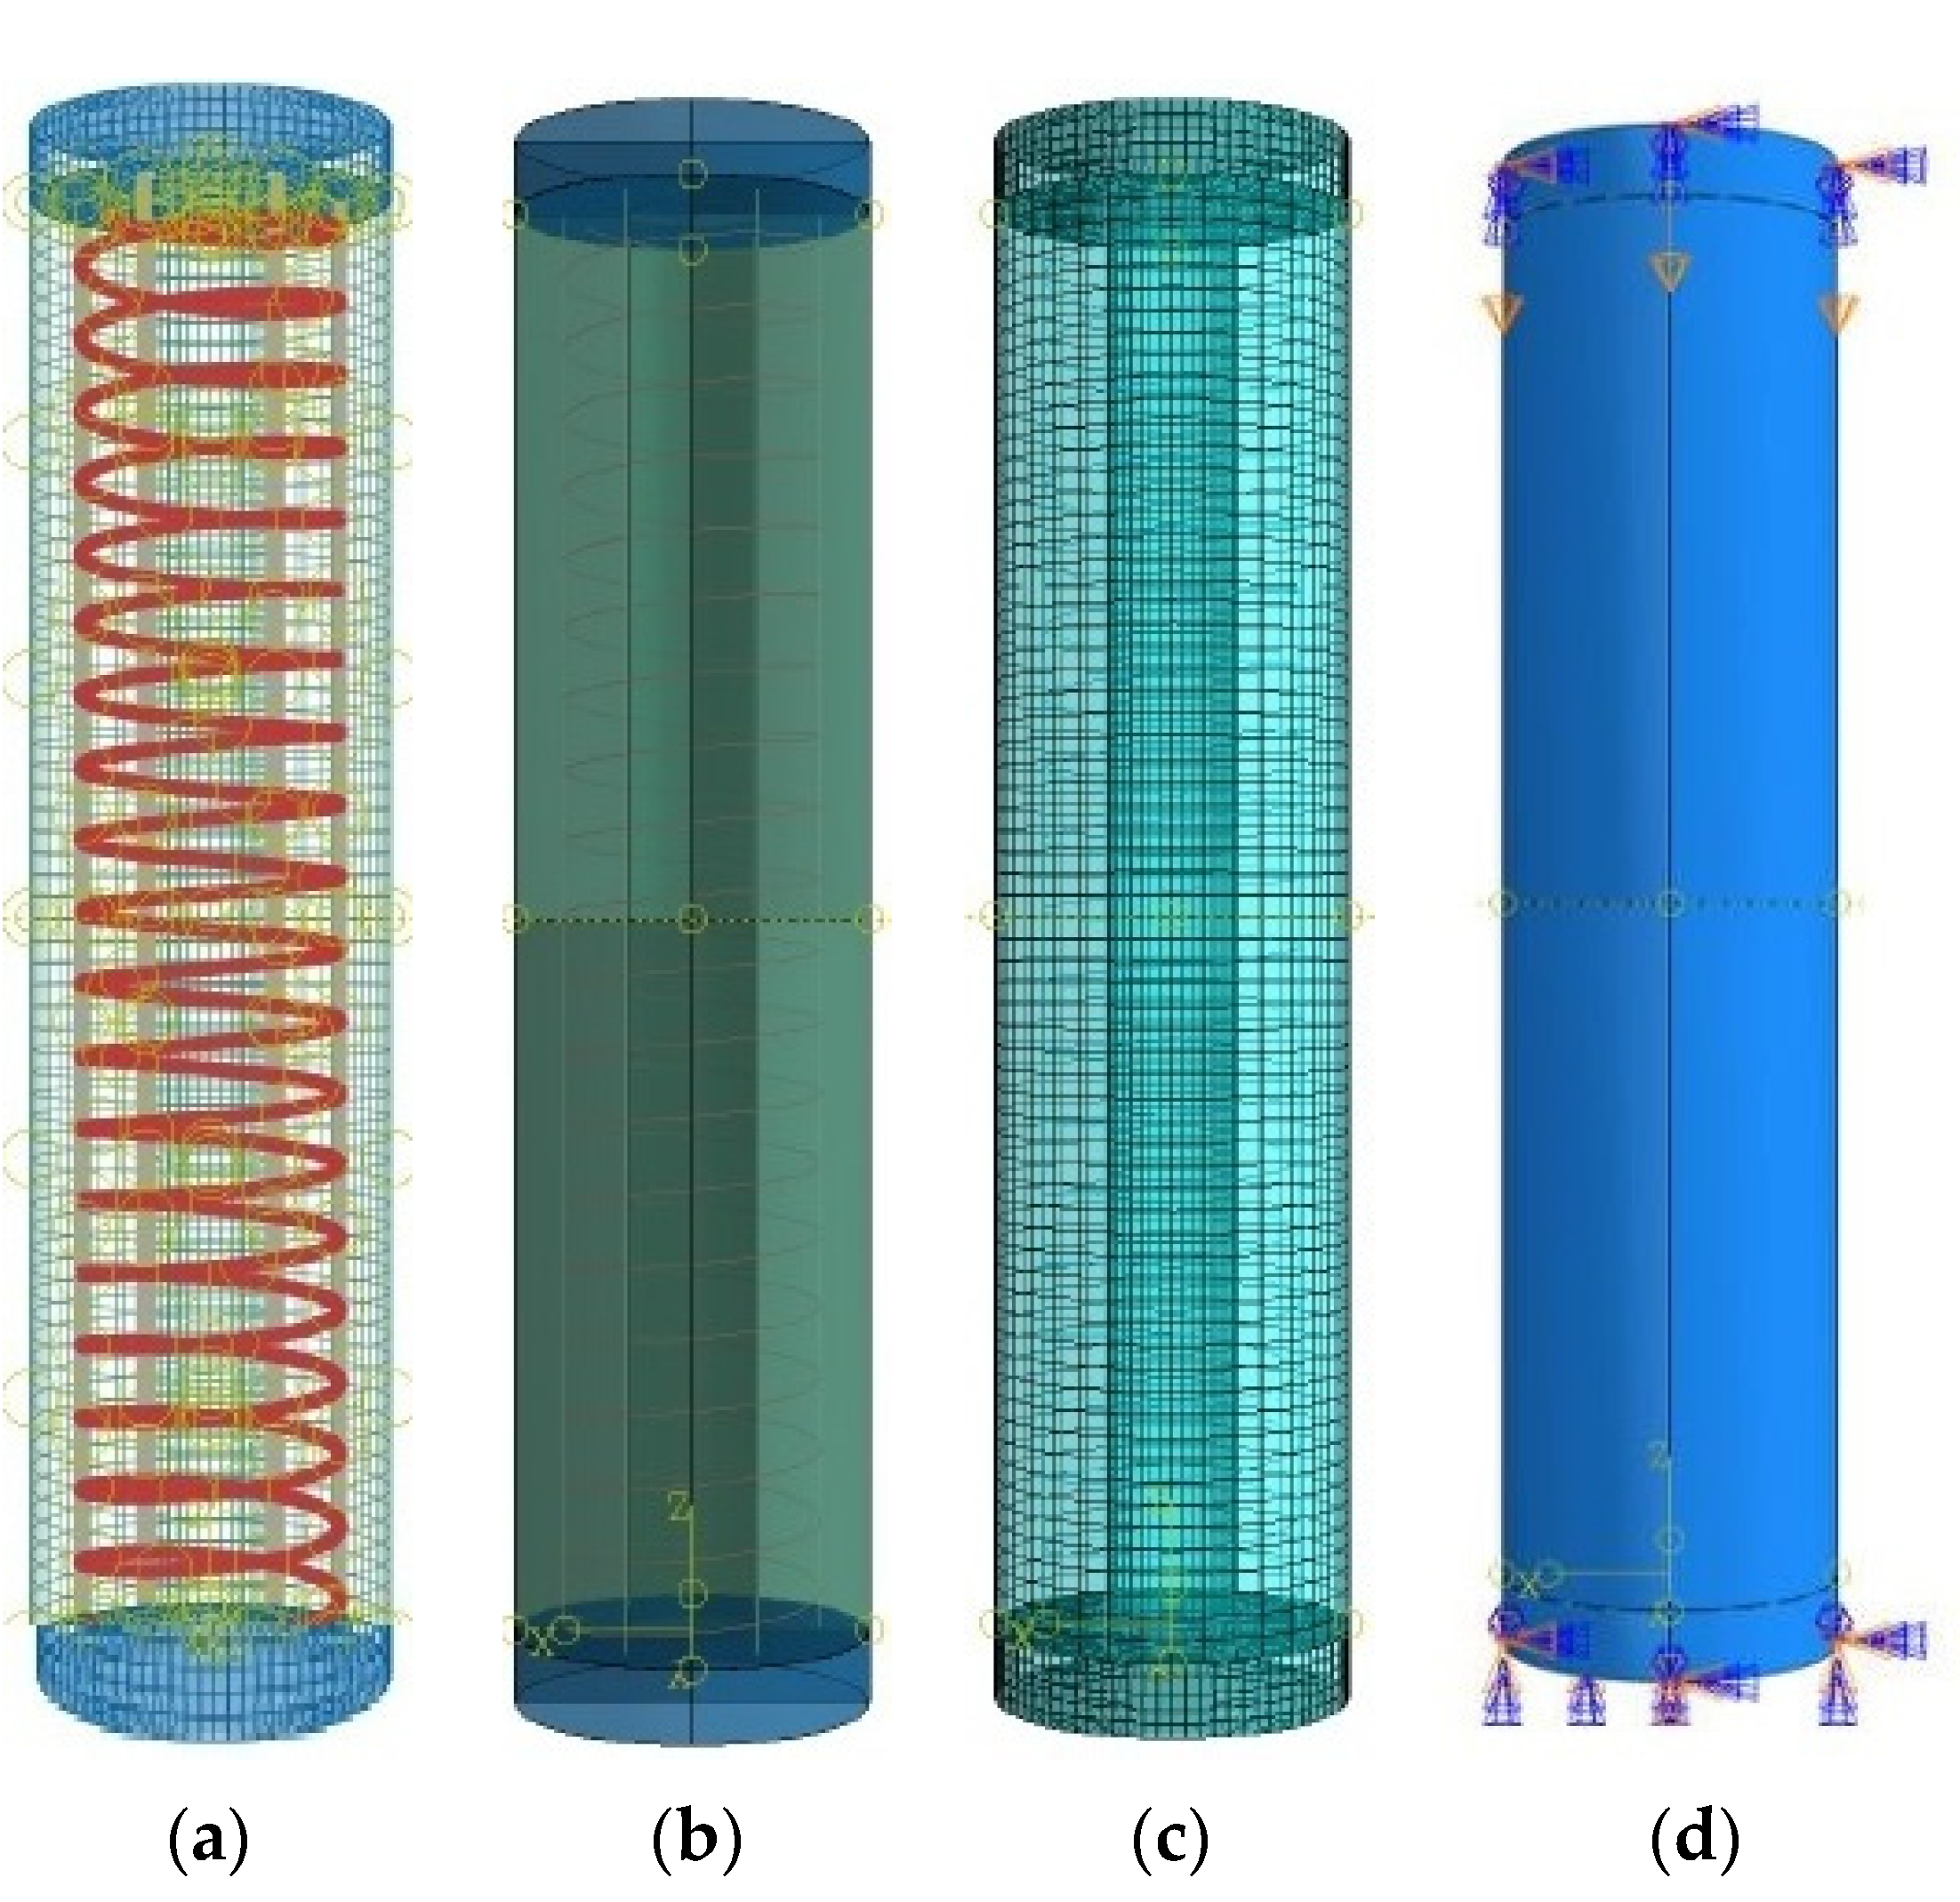
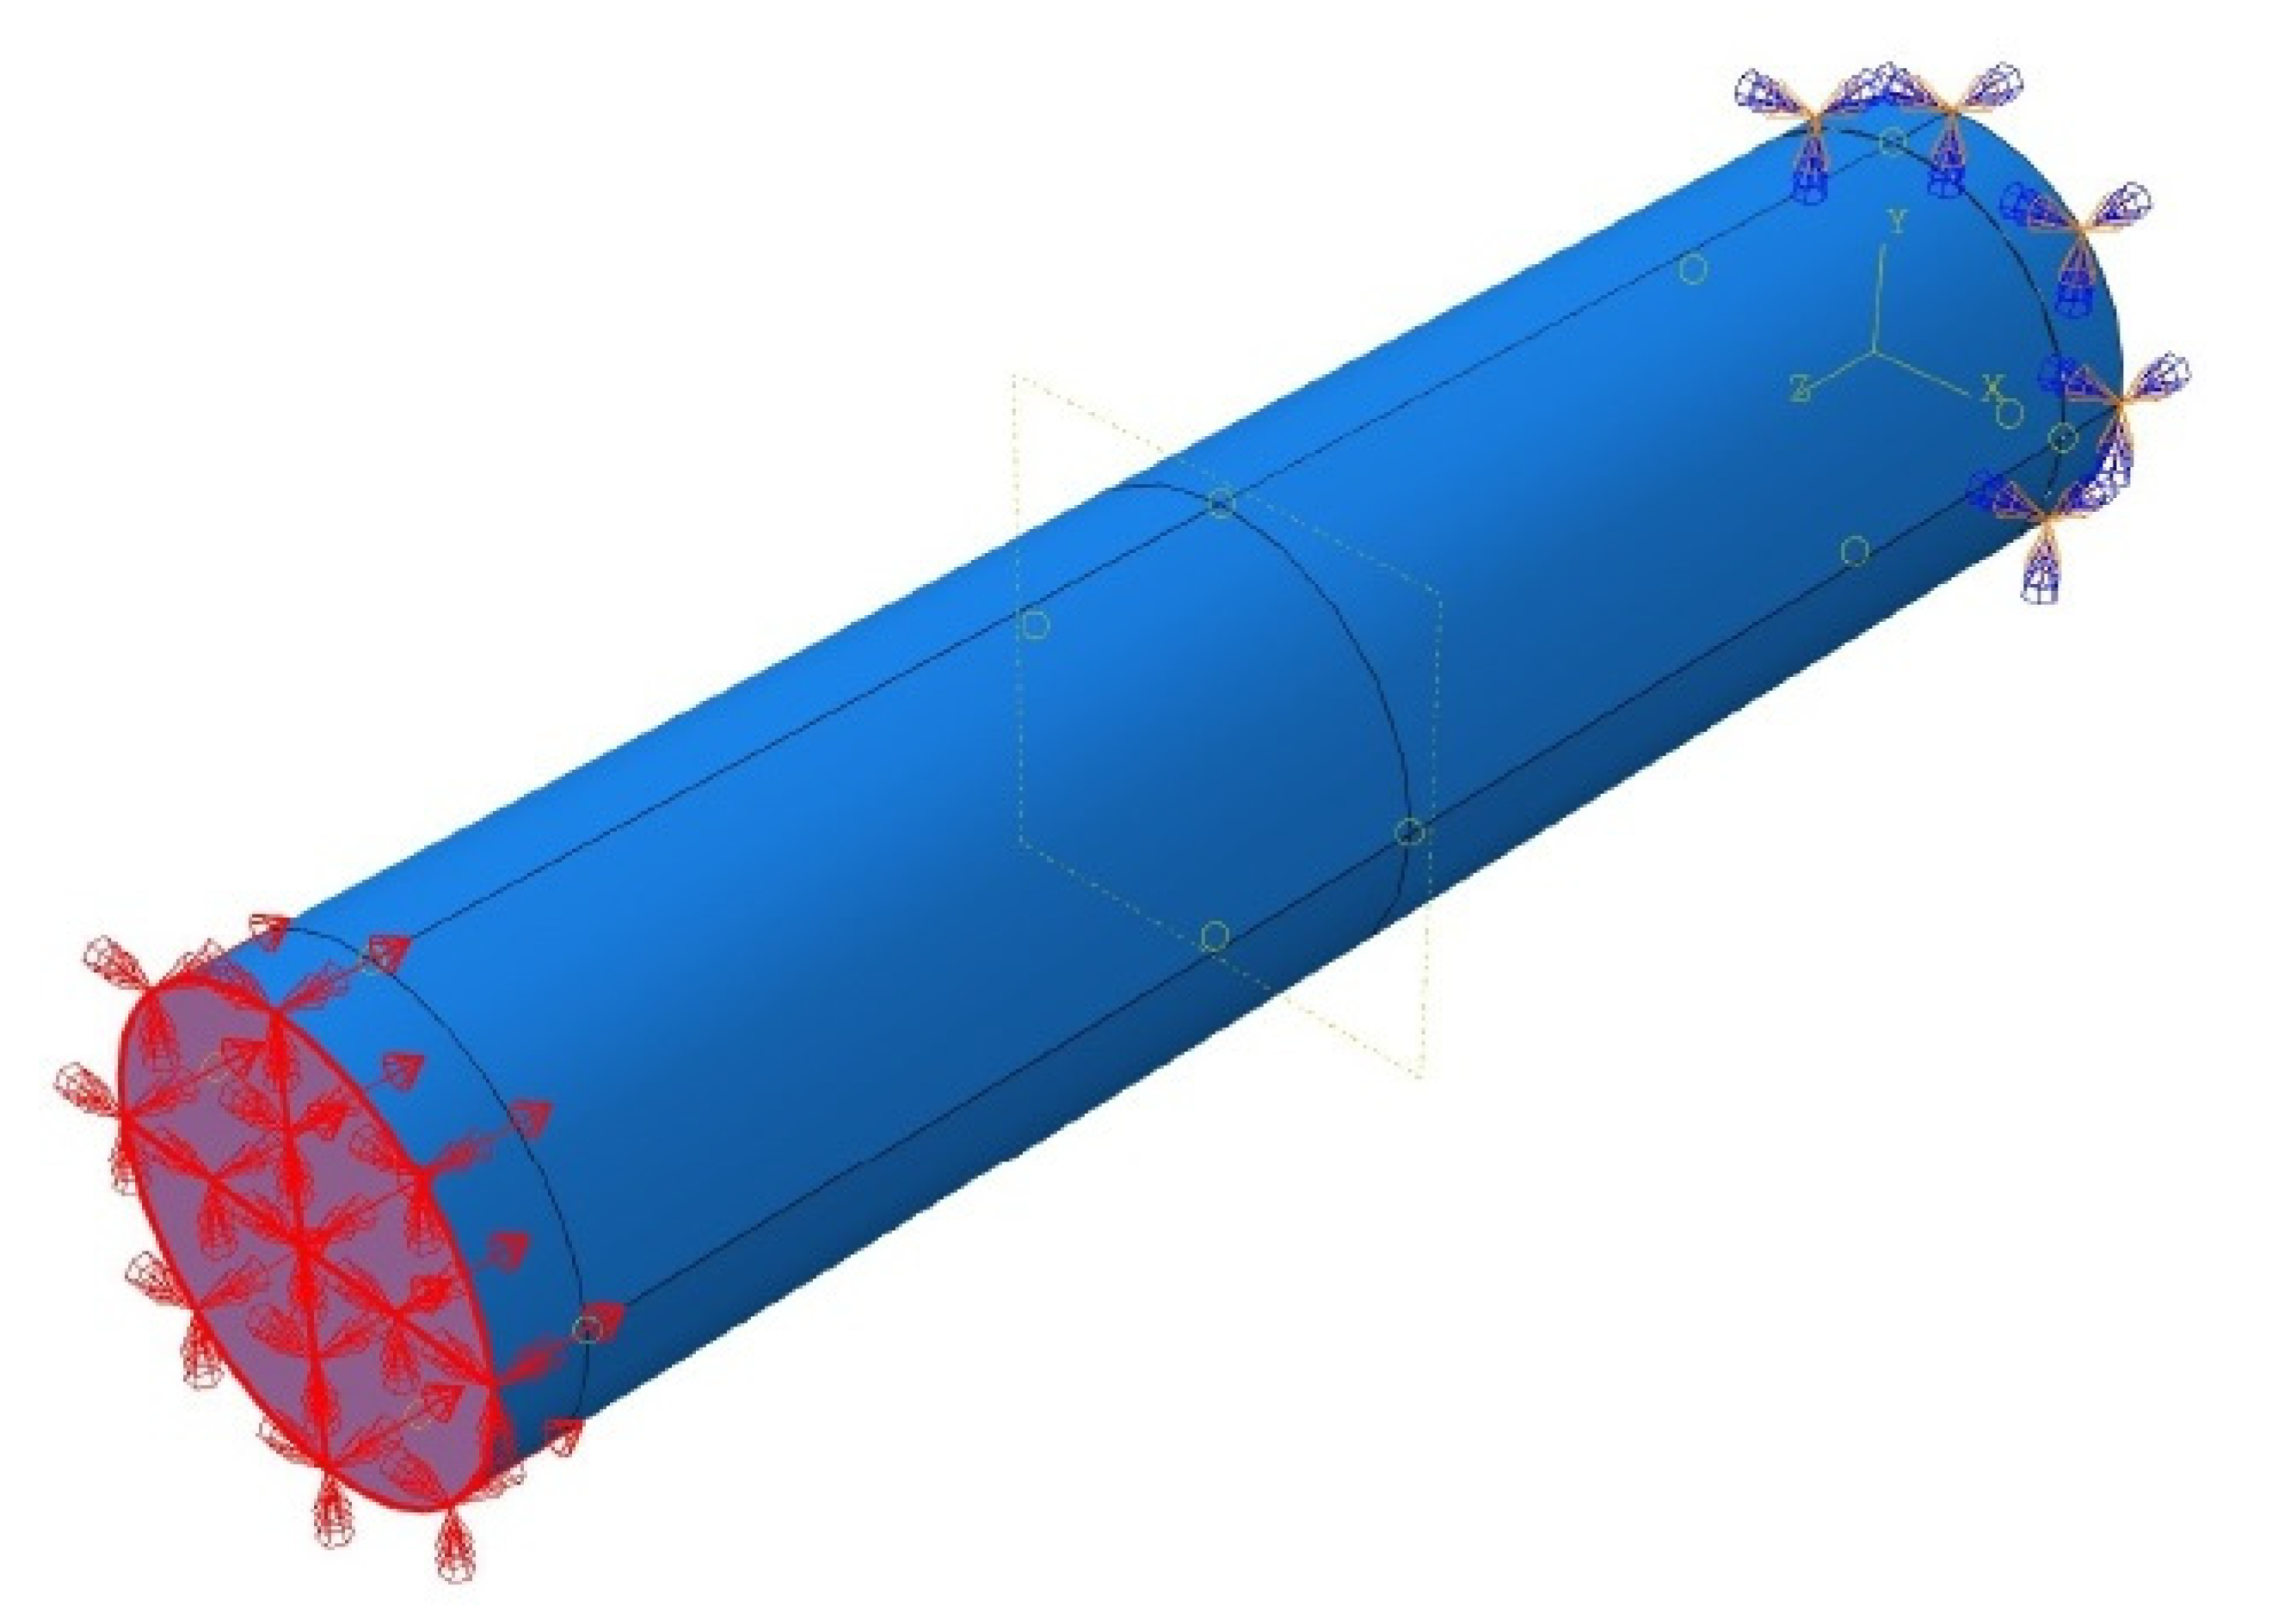
4.1. Model Geometry, Interaction, Loading, and Boundary Conditions

This sub-section provides the details of the finite element models for predicting the structural response of GFRP-reinforced HCCs tested under axial compression loads. The numerical simulations of HCCs were performed using the commercial ABAQUS software [49]. The initial stiffness, crack propagation behavior, peak load, post-peak stiffness, and failure mechanism of HCCs were considered by the proposed FEM model. The complexity in simulating the damage behavior of confined concrete was done by using a proposed damaged plastic model, and the behavior of GFRP rebars was modeled as linear elastic material up to failure. To check the performance of the proposed FEM model, the experimental results of 17 HCCs were compiled from [5,6,7].
The concrete and steel plates were modeled as homogenous 3-dimensional solid stress sections and were assigned C3D8R element types. The GFRP rebars were modeled as 3-dimensional deformable wire elements and were assigned T3D2 element types. The HCCs were fixed at the bottom and top ends, and only free to translate in the vertical direction at the top end (θx, θy, θz = 0; Ux and Uy = 0, Uz ≠ 0). The interaction between the concrete material and the GFRP-reinforcing rebars was defined using the ‘embedded region’ constraint provided by ABAQUS software [49] that connects the compatible degrees of freedom (DOF) of the truss elements of reinforcement bars to the required DOF of the 3-dimensional stress elements of concrete [71]. Using the displacement control method, a value of 50 mm was applied on the top end plate for all the specimens. The steel plates of 50 mm thickness to apply the boundary conditions and transfer the loads on column cross-section were connected using ‘tie’ constraint on the top and bottom ends of the columns for the application of the boundary conditions. While applying the ‘tie’ constraint between the steel plates and column, the bottom surface of the top steel plate was considered as a master surface and the top surface of the HCCs was considered as a slave surface. Similarly, the bottom surface of HCCs was taken as a slave surface and the top surface of the bottom steel plate was taken as a master surface. The geometry and modeling details of the simulated GFRP-reinforced concrete specimens with the applied boundary conditions are shown in Figure 2, whereas the key characteristics of the FE model are summarized in Table 3, in which the mesh size of 10 mm for the reinforcement bars provides good performance. Due to the earlier fracture of the longitudinal reinforcement and their insignificant effects on the column performance, the mesh size regarding different bar sizes shows no major impact. More tests with different spiral sizes, which possess a significant effect during the simulation period and, overall, the column response, should be investigated.

4.2. Material Simulations
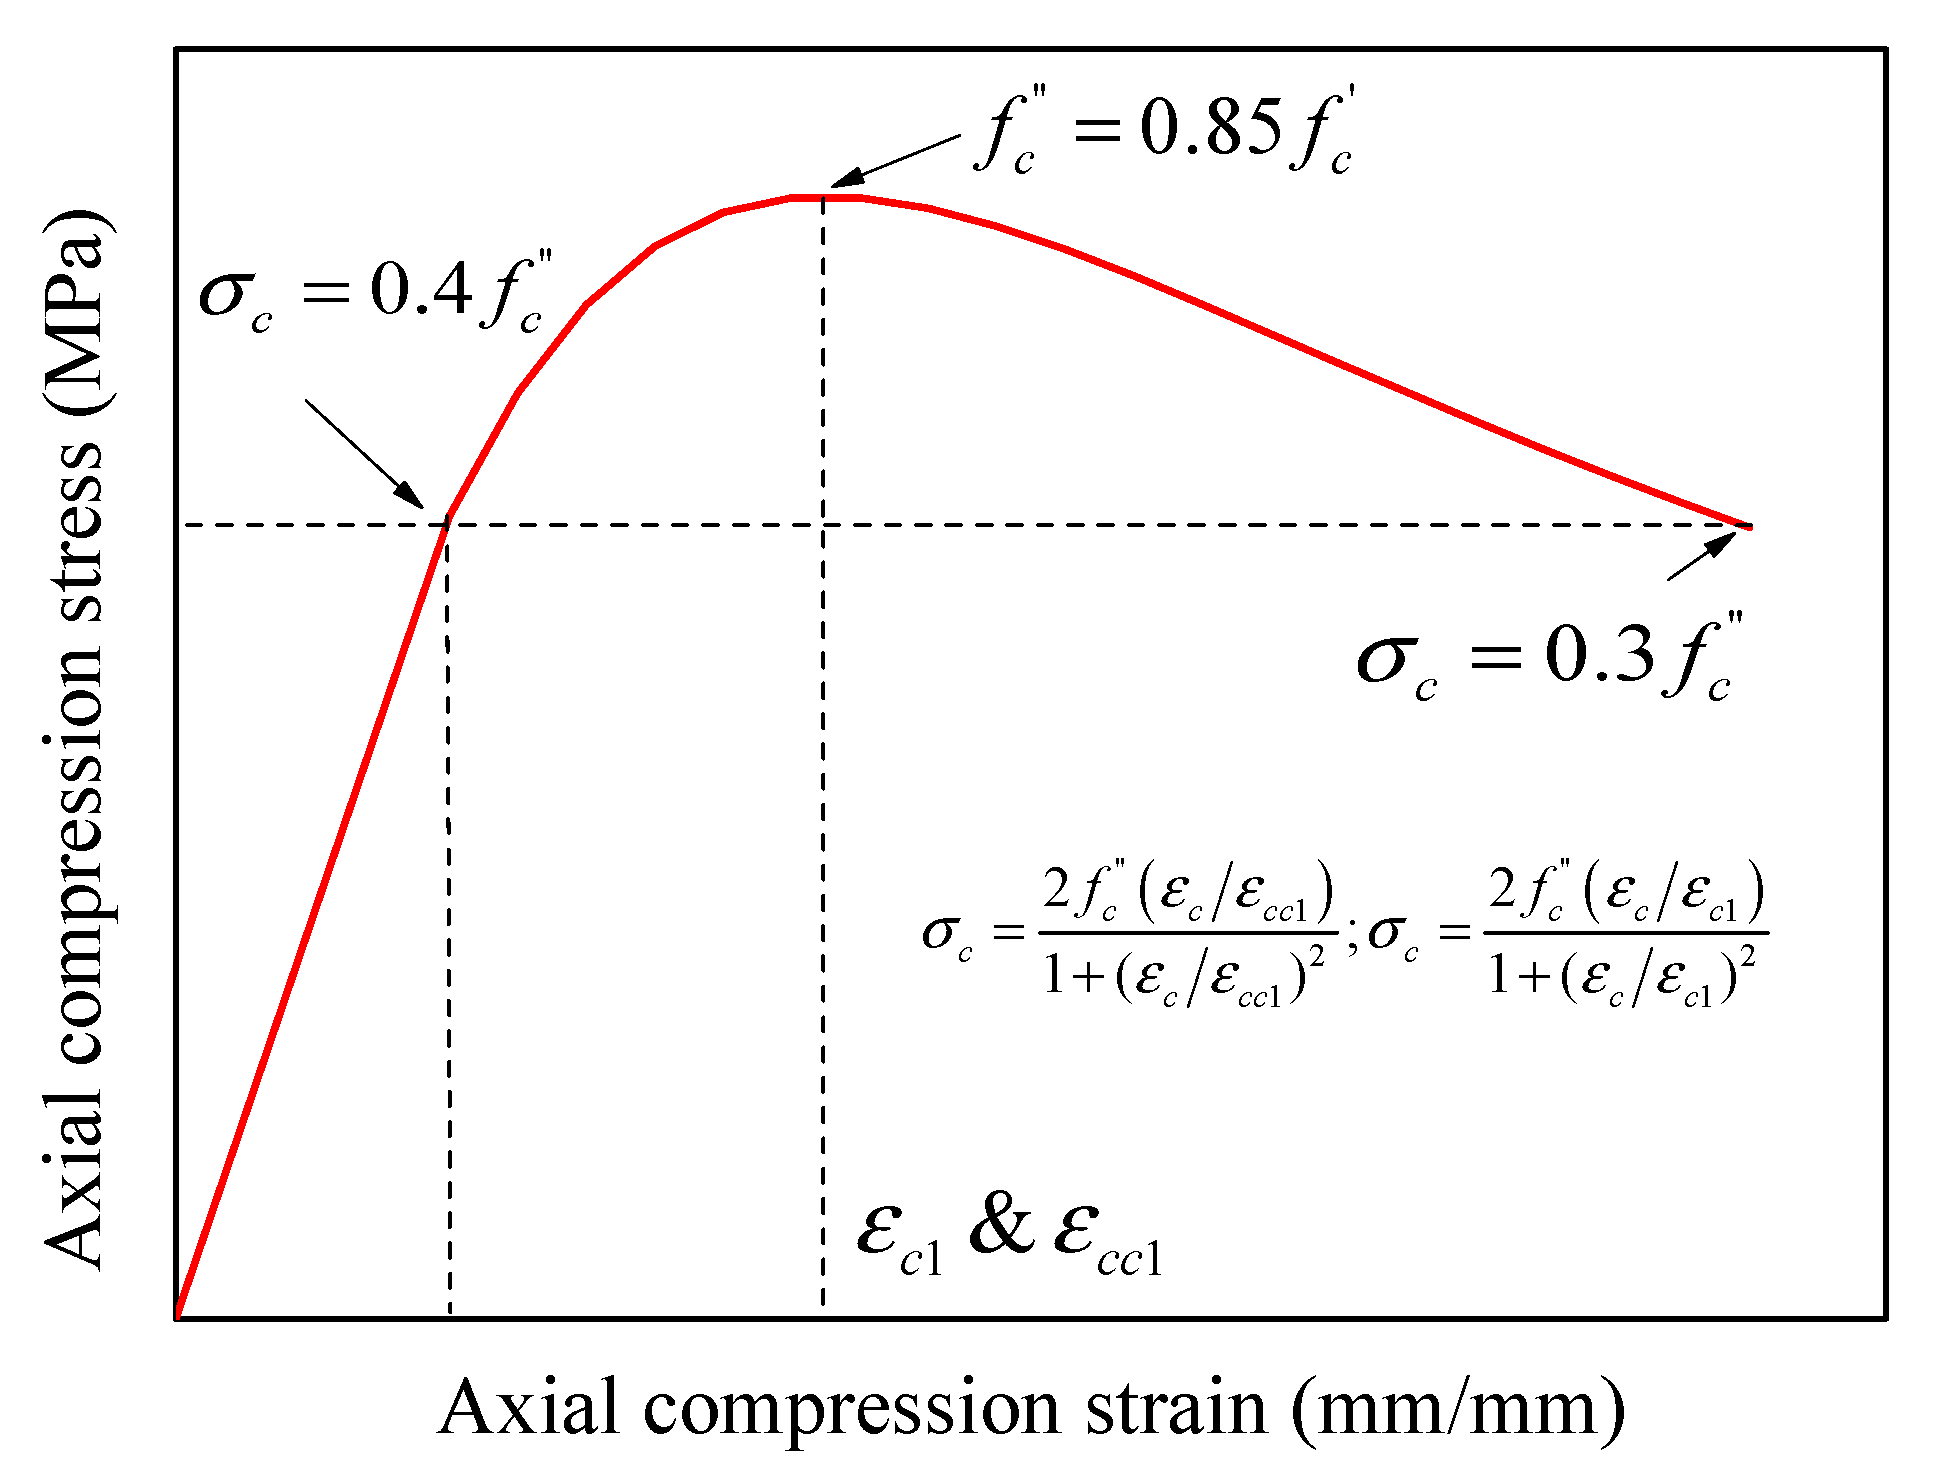
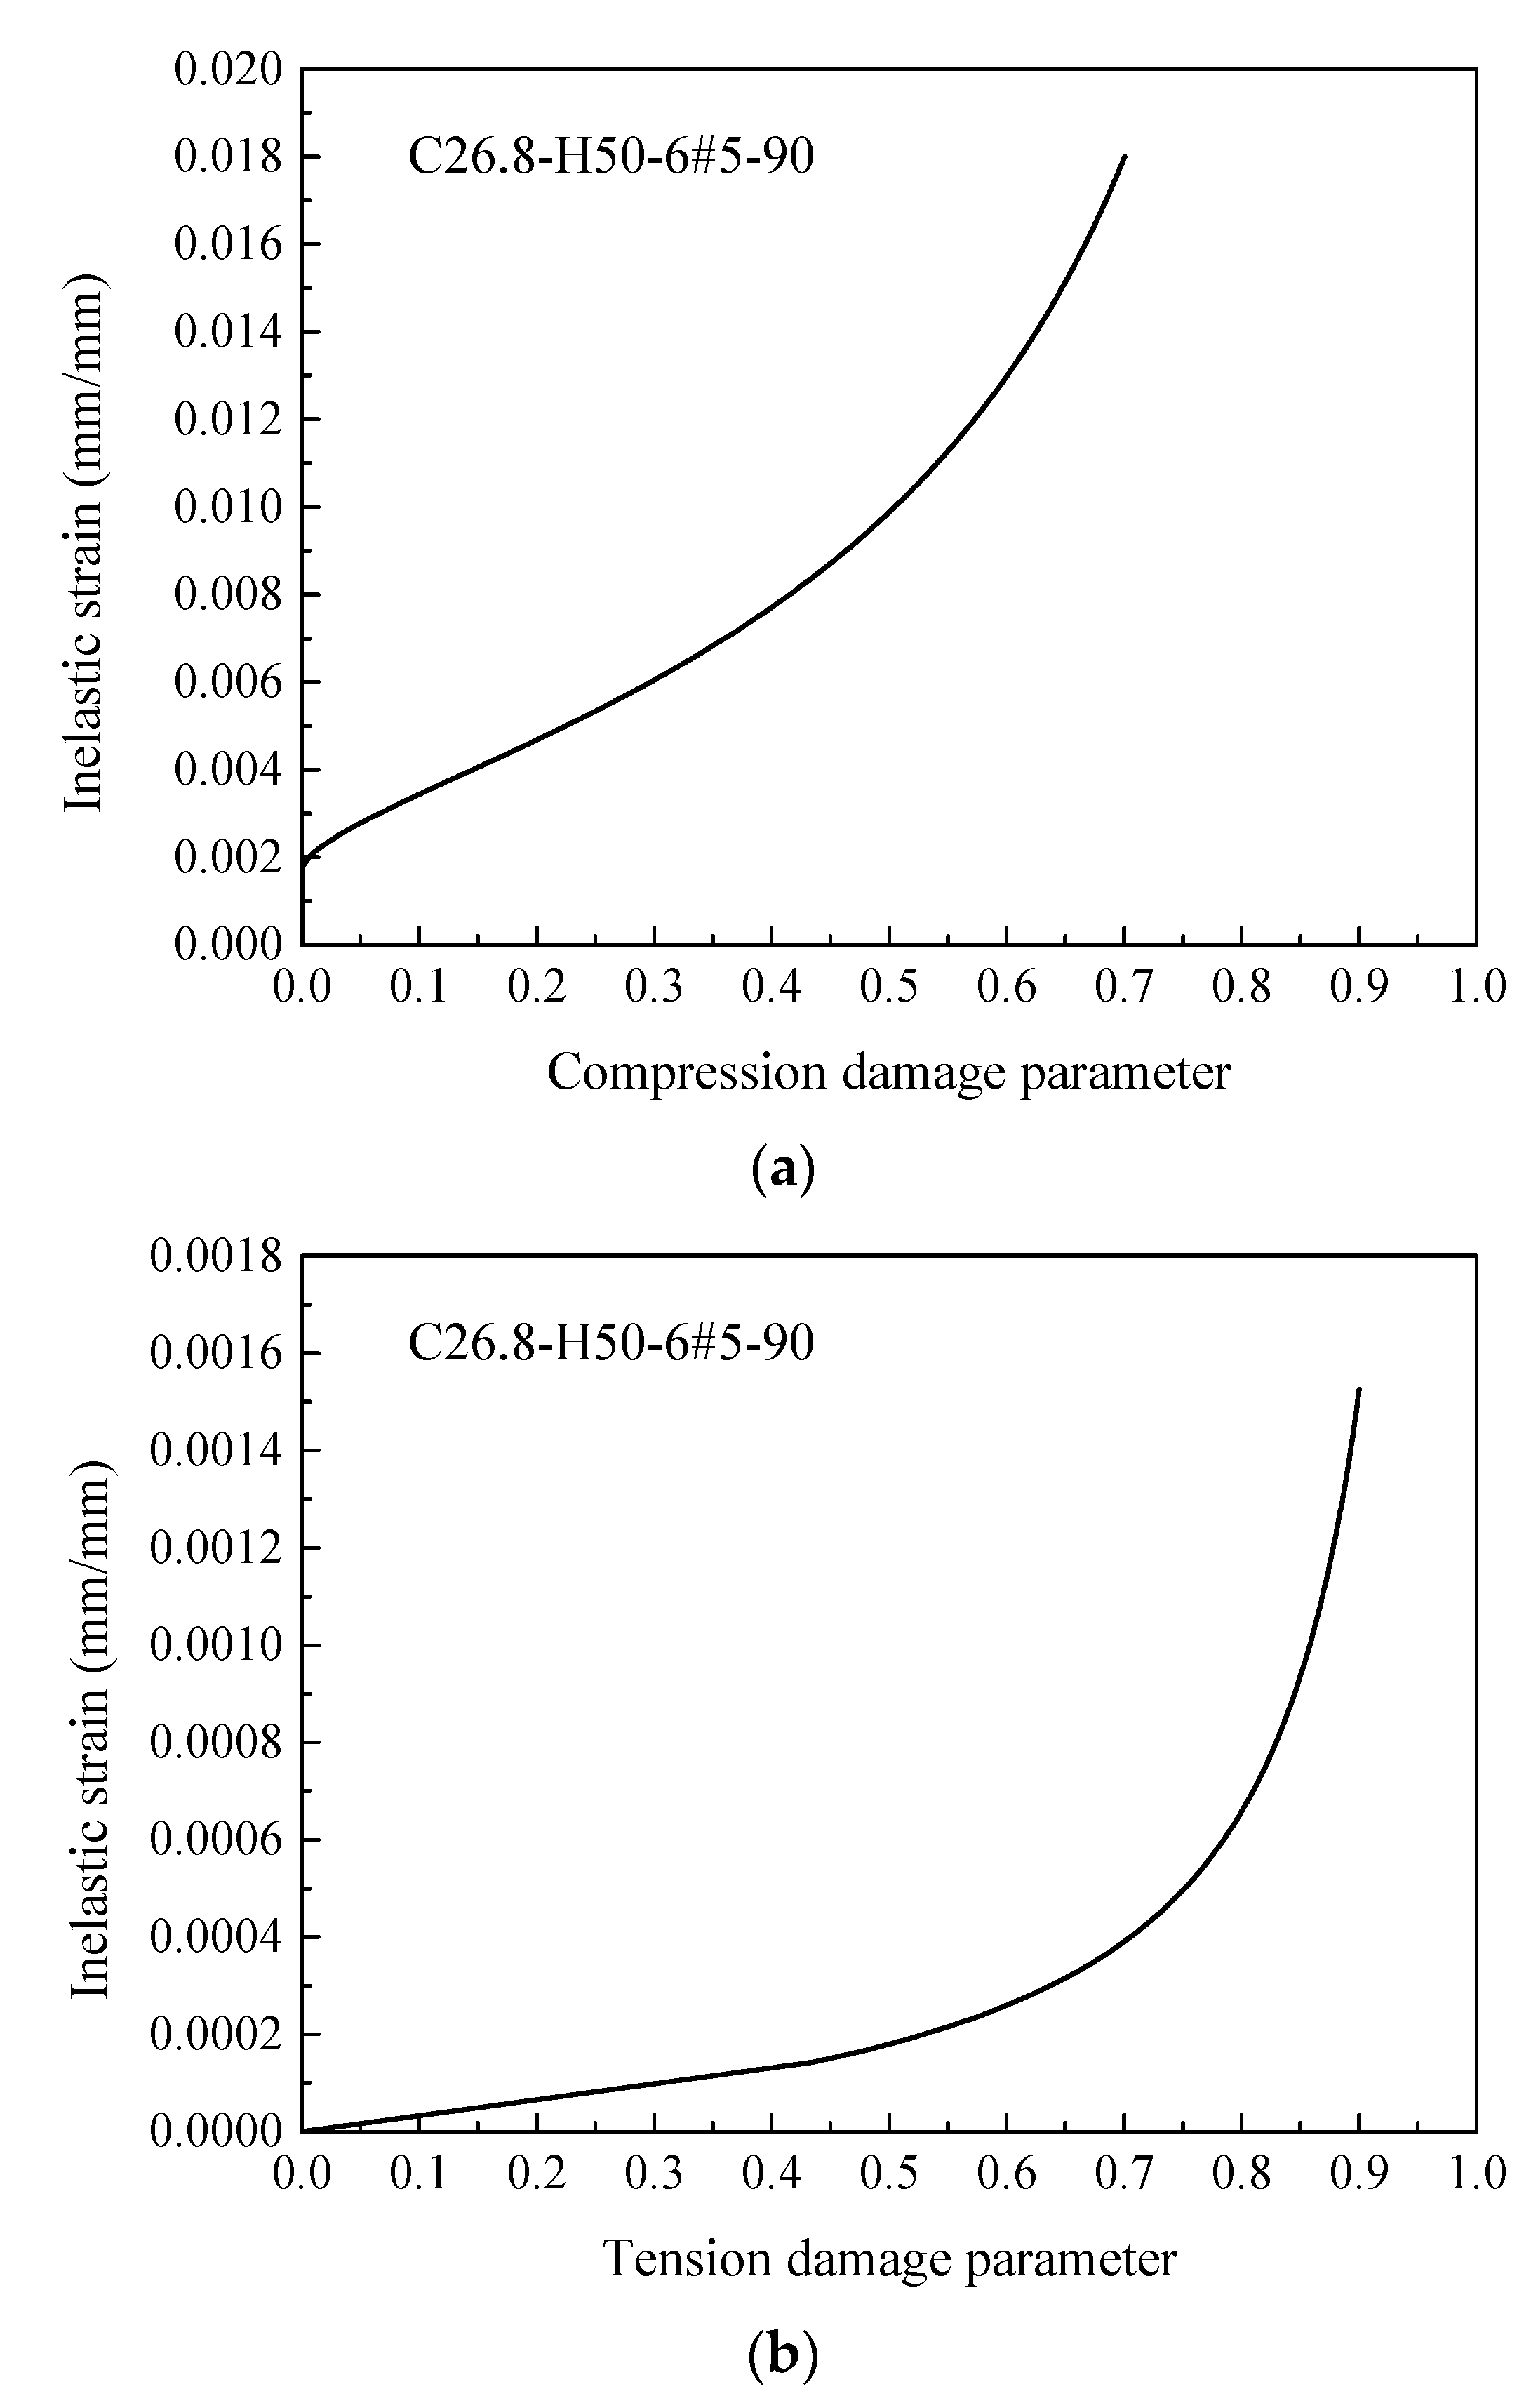
4.2.1. Concrete

The simulation of the behavior of concrete material is one of the challenging tasks due to its complex nature. The behavior of concrete was, in the reversible regime, defined by Young’s modulus and the Poisson’s ratio. The Young’s modulus value was provided by Equation (1) [72] and the Poisson’s ratio value was 0.2 [73]. The density of the normal weight concrete was commonly taken as 2400 kg/m3. For the definition of the irreversible regime of concrete, various models are available in ABAQUS such as the concrete damaged plastic model (CDPM), brittle crack model (BCM), smeared cracking model (SCM), and Drucker–Prager model (DPM). In the current work, CDPM was utilized to simulate the inelastic nature of concrete. This model can capture the complex nature of concrete material by considering the cracking and crushing of concrete. Therefore, it is commonly accepted while simulating the nonlinearity of concrete [74,75,76]. The CDPM considers the definition of various properties of concrete such as tensile behavior, compressive behavior, plastic behavior, and damaging behavior of concrete:
E c = 3320 f c + 6900
where fc is the compressive stress of concrete material tested at 28 days.
The plastic behavior of concrete as defined by ABAQUS User Manual 6.14 [49], considers five parameters of concrete as follows: the dilation angle (ψ), the viscosity parameter, the eccentricity (ε), the ratio of biaxial to uniaxial stresses (σbo/σco) [65], and the shape factor of yielding surface (Kc) (see Table 4). All these factors were calibrated to obtain the best results as compared with the test measurements. To calculate uniaxial compressive stresses of concrete (σc), Equation (2) was proposed in the current research, mainly based on models provided in the literature (i.e., [77]) but with some modifications to account for unconfined and confined concrete as reported by Zeng et al. [78] (i.e., Equation (4)). For the definition of compressive behavior of concrete, the compressive stiffening model (Equation (2)) is presented in Figure 3 for a selected specimen.
σ c = { 2 f c ( ε c / ε c c 1 ) 1 + ( ε c / ε c c 1 ) 2 ; 2 f c ( ε c / ε c 1 ) 1 + ( ε c / ε c 1 ) 2
where fc’’= 0.85 fc as considered in the [79] model. Respectively, the terms εc1 and εcc1 are the peak strains of unconfined and confined concrete (mm/mm), which are calculated using:
ε c 1 = 0.0014 [ 2 e 0.024 f c e 0.140 f c ]
ε c c 1 = ε c 1 + 800 ( I e ) 0.2 × 10 6
I e = ρ v f F R P f c
where Ie is the effective confinement index (non-dimensionless parameter); ρv is the volumetric ratio of GFRP spirals.
Similarly, the strains model (Equations (3) and (6)) proposed by Majewski [80] were used in the present research for the predictions of strains of GFRP-RC HCCs. The strain provided in Equation (6) was used to predict the ultimate strain of HCCs with no lateral confinement (spirals’ spacing = 500 mm in the present tests). It was assumed in the present model that the compressive concrete strength in these two expressions to be fc’’. The uniaxial compressive strength of unconfined concrete cylinders (100 mm × 200 mm as tested in [5,6,7]) is usually higher than that of standard cylinders (150 mm × 300 mm); therefore, the strength was multiplied by a conversion factor of 0.85 to consider column size effects in the models proposed based on standard cylinders:
ε c u = 0.004 0.0011 [ 1 e 0.0215 f c ]
The elastic portion of the stress-strain curve can be taken up to 40% of the ultimate compressive strength of concrete, and the stress in the post-peak branch was considered to be 30% of the ultimate compressive strength of concrete (i.e., [81,82]) (see Figure 3). The uniaxial compression and tension damage parameters of concrete in the CDP model were defined using Equations (7) and (8), respectively. Considering a selected specimen from Table 2, Figure 4a,b present the predicted relationships between these parameters and the inelastic strains:
d c = 1 ( σ c f c )
d t = 1 ( σ t f t )
where the maximum tensile strength of concrete (ft) was estimated using Equation (9), which was proposed in the present paper based on test data published in [83]:
f t = [ 11.954 exp ( 0.007 * f c ) / 100 ] f c
The cracking strain (εcr) corresponding to ft was determined as εcr = ft/Ec. The compression and tension strain of concrete in the inelastic region are respectively calculated by:
ε c i n = ε c ε o c e l
ε t i n = ε t ε o t e l
where εocel and εotel are the elastic strains of concrete under compression and tension stresses and calculated respectively as εocel = σc/Ec and εotel = σt/Ec. Figure 5 finally defines the behavior of unconfined concrete under tensile loads (Equation (12)) [84]:
σ t = f t ( ε c r ε t ) 0.85
The confinement made by the FRP spirals provides enhancements in the compressive strength and deformation of concrete [85]. This enhancement is usually higher at ultimate than that at peak condition resulting in a hardening stress-strain behavior for sufficiently confined concrete [86,87,88,89,90,91,92,93,94,95,96,97,98,99,100,101]. As the final failure was due to ruptures in the longitudinal GFRP bars and crushing of the concrete core at mid-height without damage to the lateral spirals [5,6,7], the confinement strength model proposed by Mander et al. [92] (represented by Equation (13)) was, therefore, used to exactly capture the compressive strength of confined concrete core (fcc) obtained from the FE simulations. In case of exceeding the range of test parameters that were used to build Mander et al.’s [92] model, Equation (14) was herein introduced to have a different form. Finally, an excellent calibration between these two expressions is revealed by Figure 6:
f c c = f c ( 2.254 1 + 7.94 f l f c 2 f l f c 1.254 )
f c c = f c + [ 191.17 ( f l f c ) 0.67 ( 1 + D i D s ) 0.71 8.52 ( f l f c ) ] ( 1 + D i D s ) 0.75
where fl (MPa) is the confinement stress due to FRP spirals that can be calculated using the following well-known expression used for confined concrete externally reinforced with FRP wraps (i.e., [86,87,88,89,90,91,92,93,94,95,96,97,98,99,100,101]). To account for the effectively confined concrete core of spirally reinforced HCCs as in this present paper, some modifications were also introduced in Equation (15) to use the proposed next form:
f l = 2 E F R P ε h , r u p t F R P D
f l = 2 f b e n t d h D s D i
where, in Equation (15), EFRP (MPa) = tensile elasticity modulus of FRP wraps; tFRP (mm) = thickness of all FRP wrapping layers; in Equation (16), the modifications are represented as follows: The total fiber sheets (tFRP) was replaced by the spiral diameter dh (mm). The diameter of a circular section wrapped with FRP (D) was replaced with the diameter of the effectively confined concrete core (DsDi) (mm). Finally, the EFRP × εh,rup (the tensile strength of the FRP wraps) was considered to account for the significantly reduced tensile capacity of the GFRP spirals at the bent portion when the straight FRP bar is bent to form the hoop reinforcement (i.e., [102,103,104,105]). In the present FEM model, the bent strength is found by Equation (17) as done by other researchers (i.e., [88]):
f b e n t = 0.5 f F R P
Similarly, the strain of confined concrete at ultimate can be determined using Mander et al.’s [92] model (Equation (18)). It is to be noted that the unconfined concrete strain of 0.002 in their model was taken in the current model to be equal to the predicted εc1 value (Equation (3)). Moreover, to account for the effective confined concrete core of spirally reinforced HCCs as in the present paper, Equation (19) was suggested, based on the test results of all 60 specimens provided in Table 2. The test results of the 17 specimens tested in [5,6,7] were taken as a major control in the model development. An excellent correlation was finally obtained between the existing and currently proposed expressions (see Figure 7):
ε c c u = ε c 1 [ 1 + 5 ( f c c / f c 1 ) ]
ε c c u = ε c 1 [ 1 + 5 ( f c c / f c 1 ) ] × M . S . R .
M . S . R . = 0.1061 e ( 0.2701 × 2 f b e n t d h ( D s D i ) f c )

4.2.2. GFRP Bars

The GFRP reinforcement (longitudinal rebars and spirals) were considered as 3D deformable wires. An isotropic linear elastic material up to failure model was considered for simulating the behavior of the GFRP reinforcement [41,42,71]. The mechanical properties of GFRP bars used for the FEM were presented in Table 2 [5,6,7]. The behavior of FRP bars and ties was defined in terms of density (2.1 × 10⁻⁹ ton/mm3), elastic tensile modulus, ultimate strength, and Poisson’s ratio (0.25) [41]. The contribution of the longitudinal GFRP bars in compression was considered to be 50% of their maximum strength as straight bars having the same elastic modulus [2]. The contact between the GFRP-reinforcing rebars and the surrounding concrete was defined using the ‘embedded region’ constraint.

4.2.3. Steel End Plates

The column specimens in the present simulations were tested with deformable 3D steel end plates. The boundary conditions chosen for these end plates are clearly shown in Figure 8. The material was considered steel with linear elastic behavior. The linear elastic behavior of the steel plates was, in the present paper, defined in terms of density (7.8 × 10⁻⁹ ton/mm3), elastic tensile modulus (Es = 200,000 MPa without any yield limit), and Poisson’s ratio of 0.30.

4.3. FEM Results and Discussions
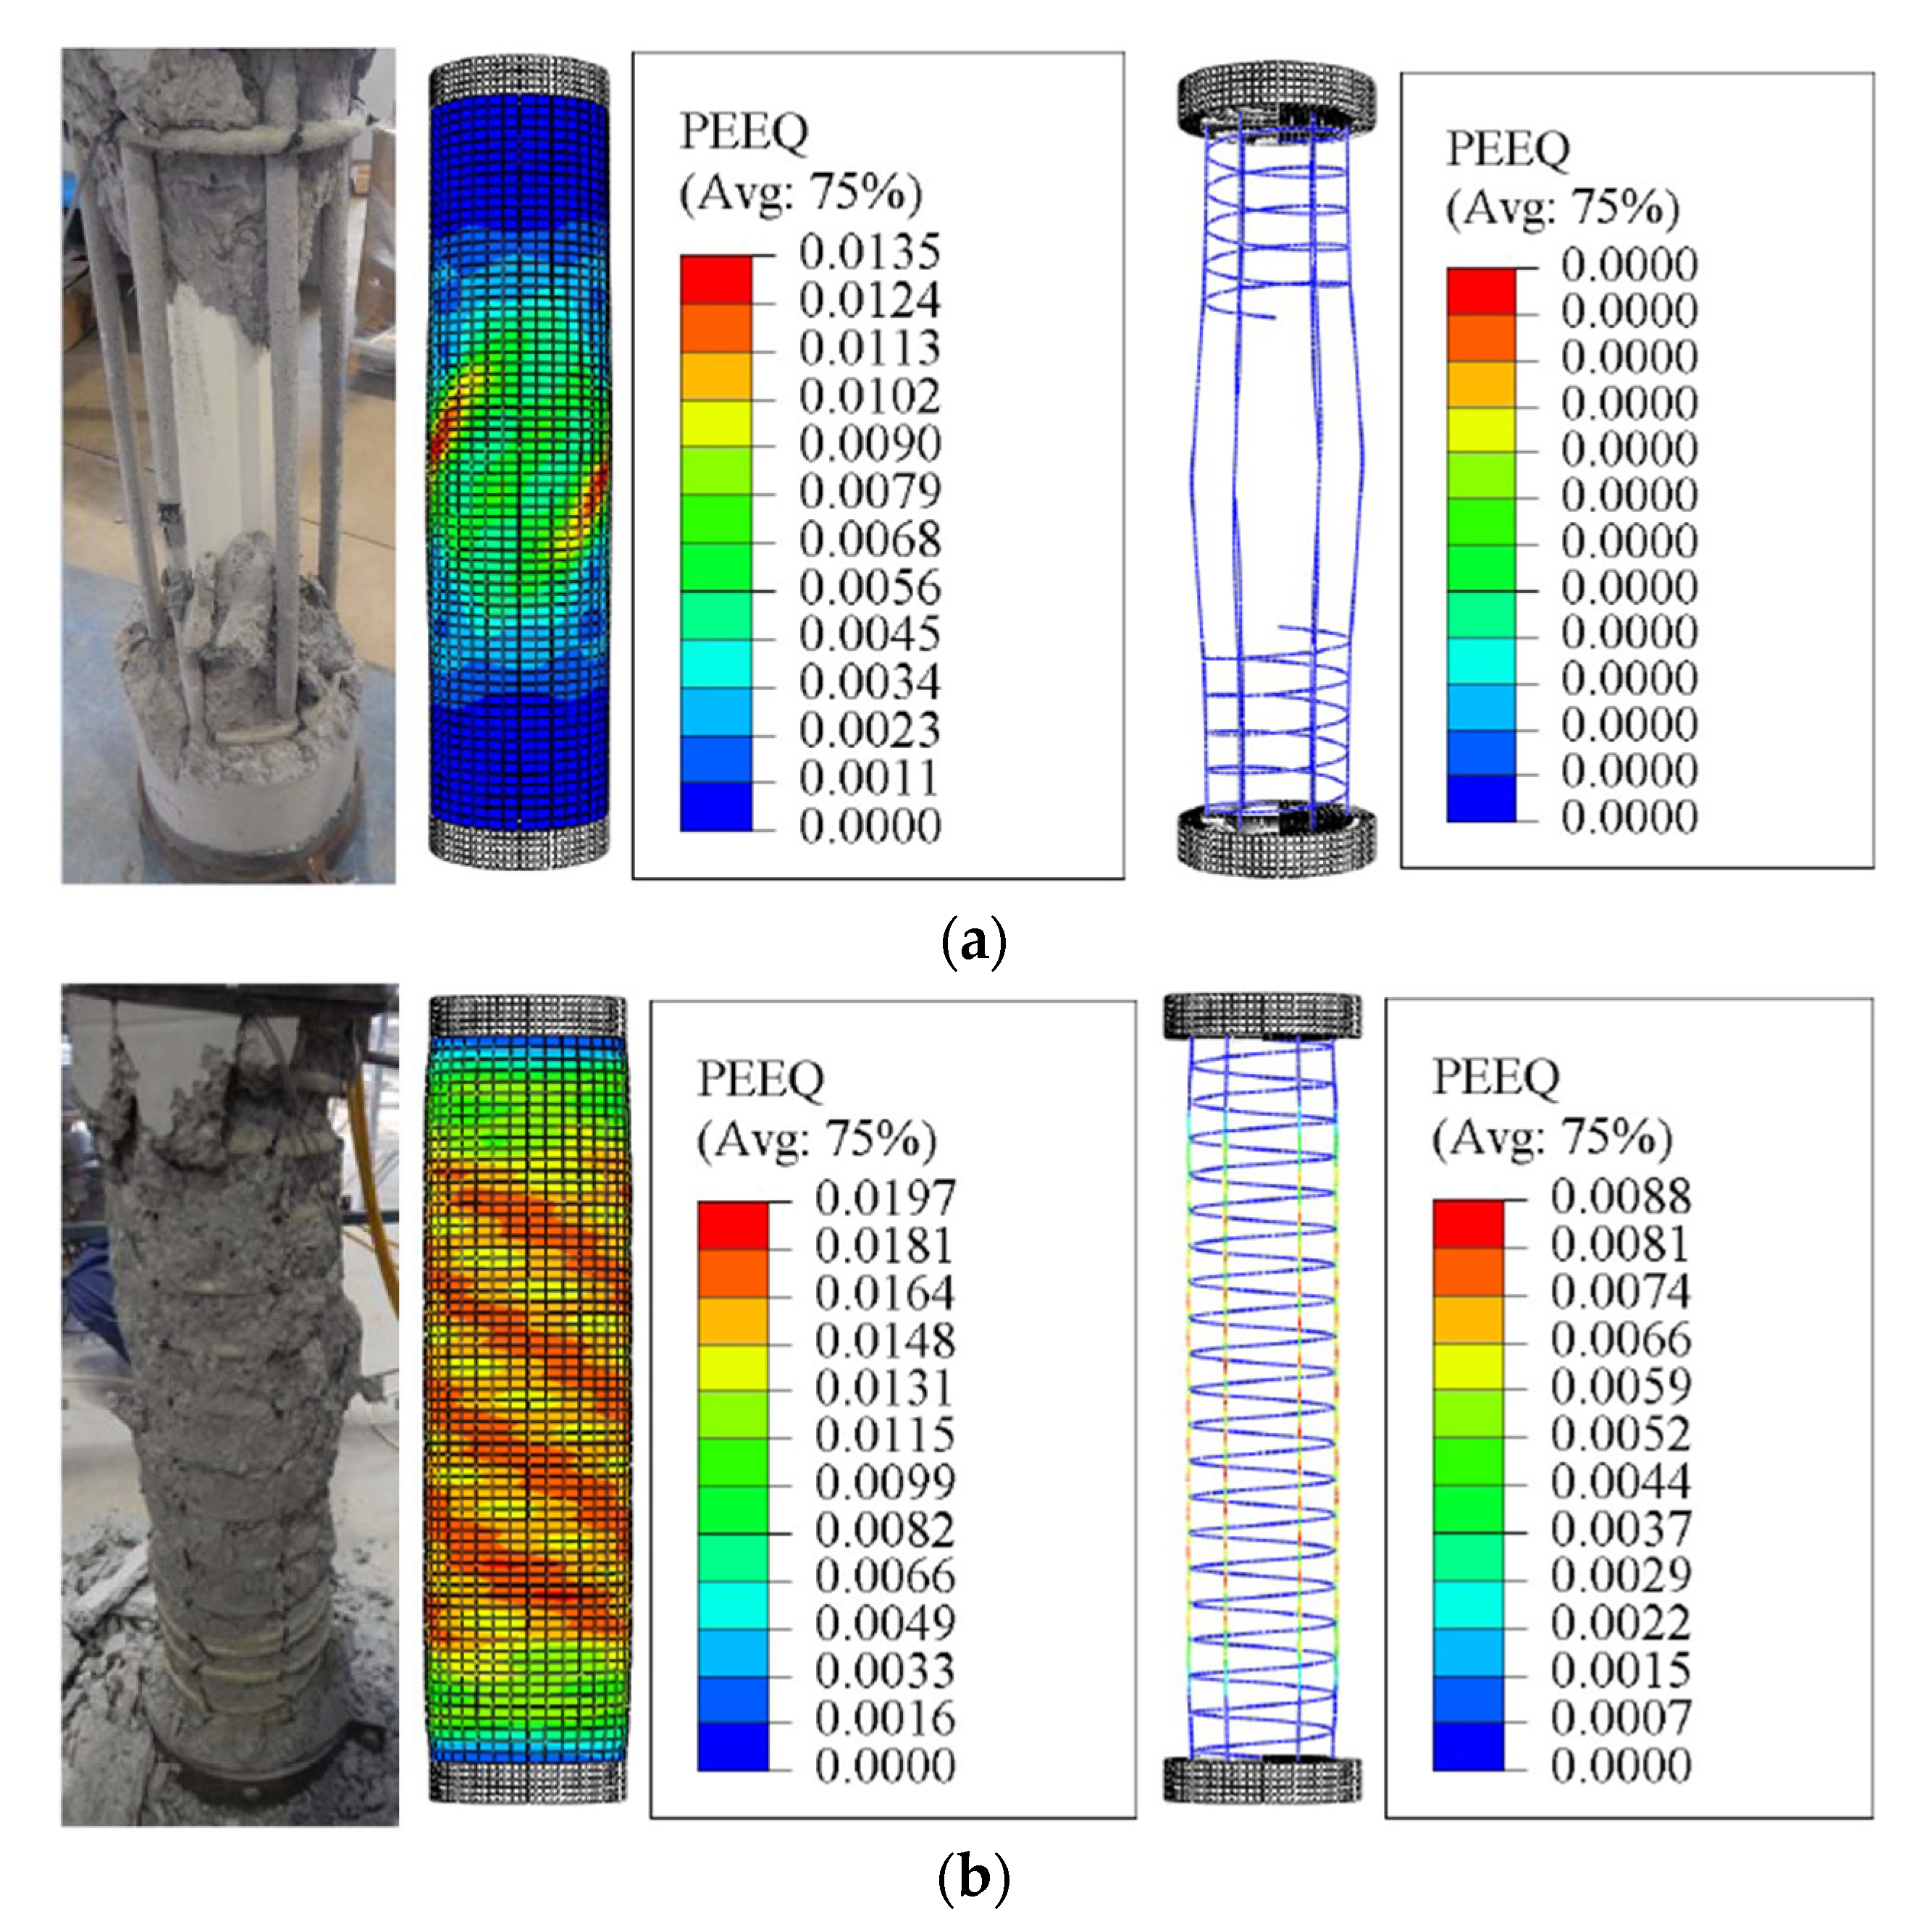
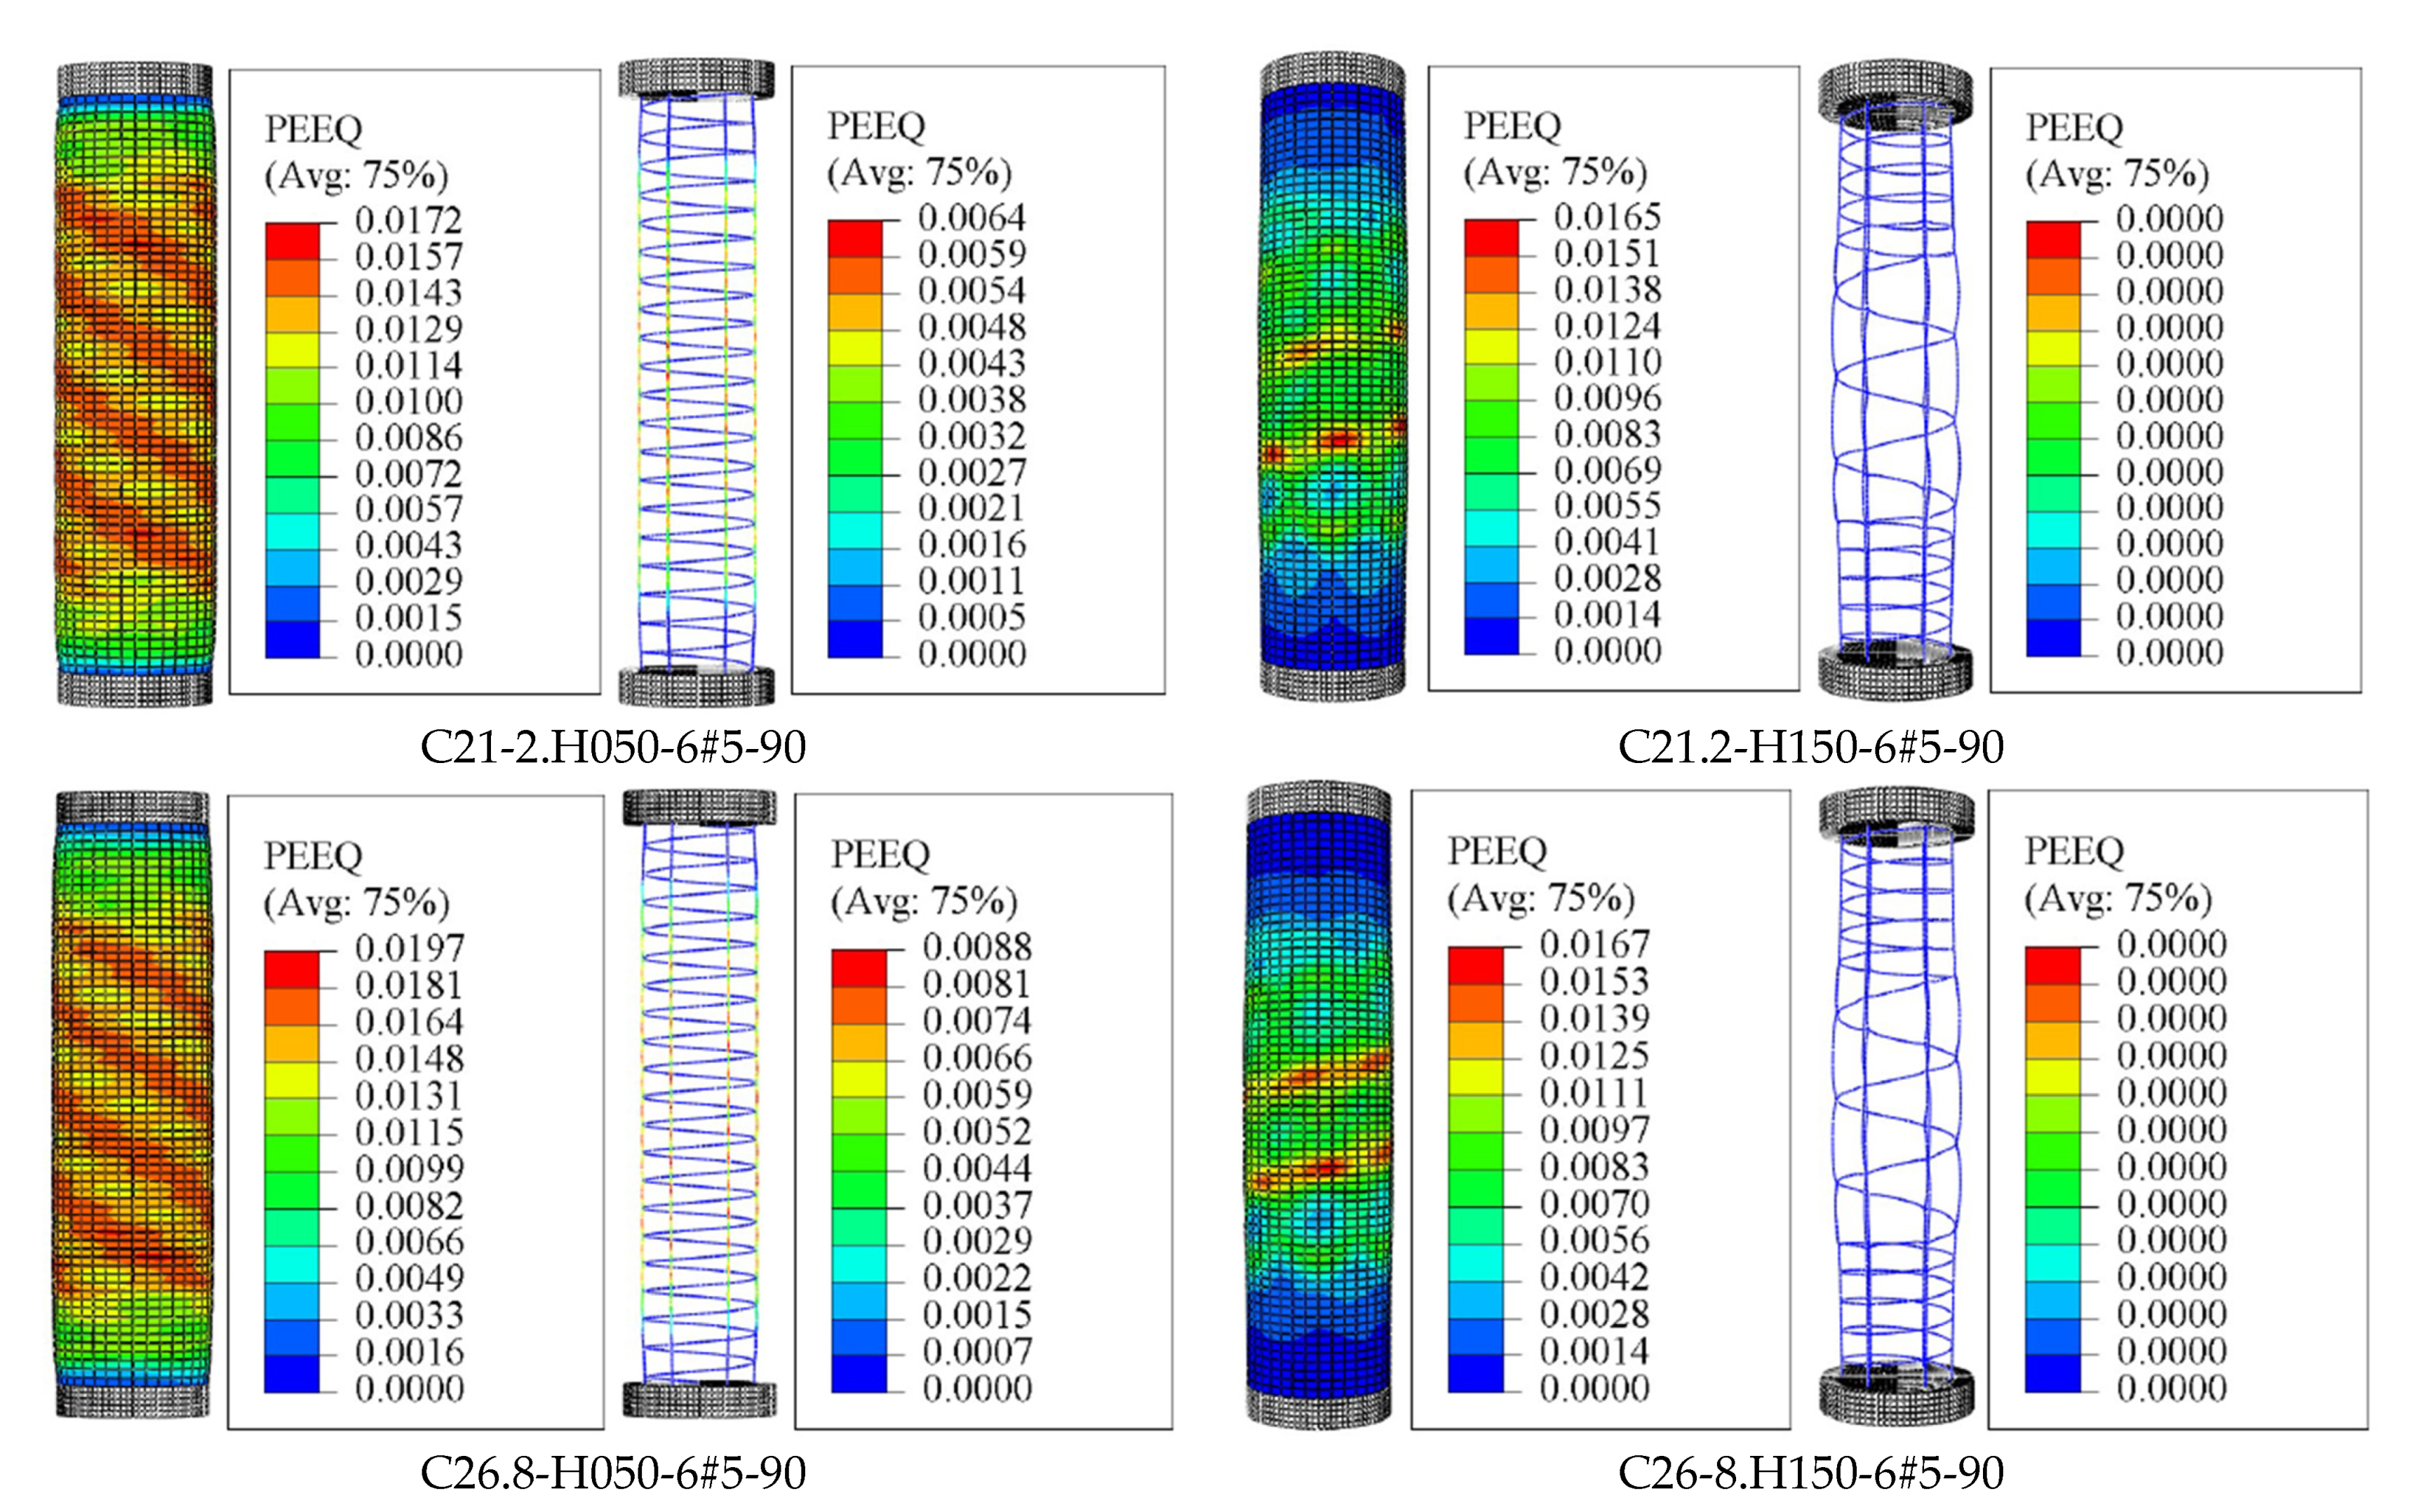
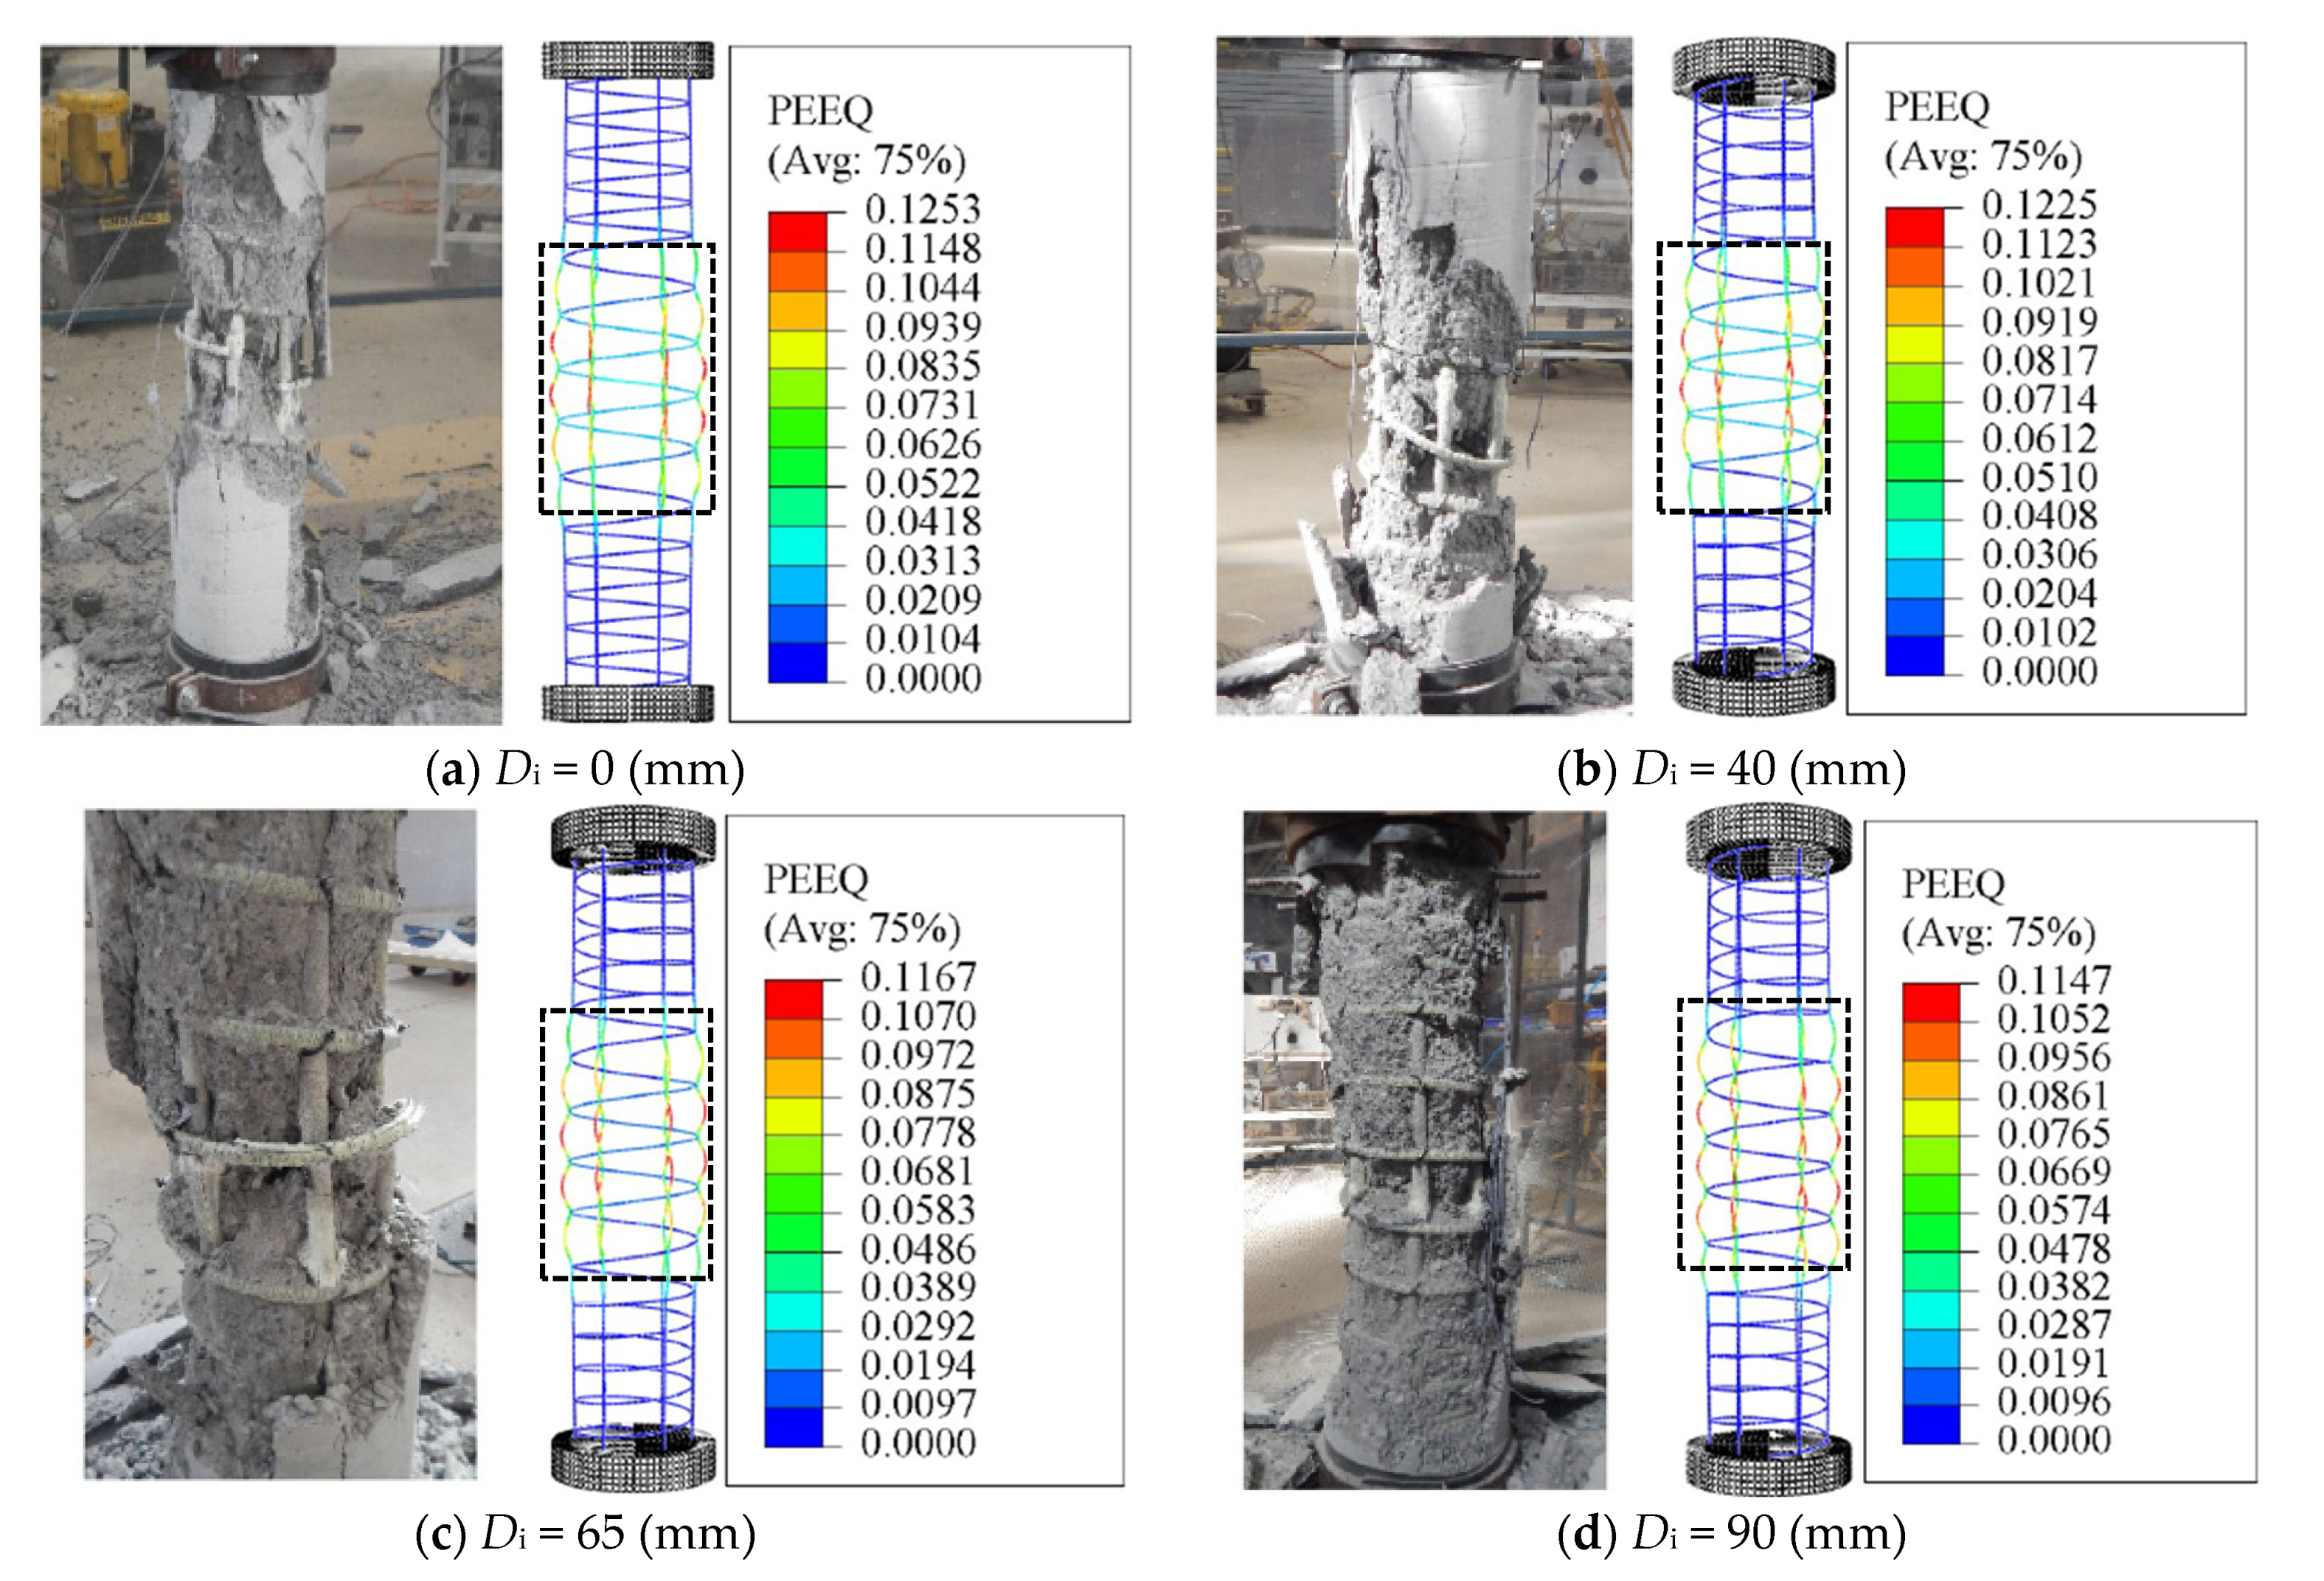
4.3.1. Failure Mode

According to the tests in [7], the failure in all columns started as vertically spreading hairline cracks appearing on the outer concrete surface at advanced loading levels. Once they appeared, the cracks propagated and widened, leading to different spalling features of the outer concrete cover, rupturing longitudinal GFRP bars, and damaging the concrete core. The different features of the column’s failure were mainly dependent on the effect of the column parameters. For example, specimen C26.8-H00-6#5-90 without internal GFRP confinement experimentally experienced explosive spalling and failing of both the concrete cover and core, causing large concrete pieces to fall from the specimen at column’s mid-height. Figure 9a reveals close agreement between the failed region and the global buckling of the longitudinal GFRP bars that obtained from the FEM as clearly indicated by the zero PEEQ value recorded at column’s mid-height: PEEQ values (the material’s inelastic deformation) are corresponding to the FEM failure of concrete. On the other hand, for confined specimen, gradual overall concrete-cover spalling was observed, followed by lateral expansion in the concrete core, which was confined by the GFRP spirals. The rupture of the longitudinal GFRP bars in different locations throughout the column’s height then occurs, i.e., C26.8-H50-6#5-90 in Figure 9b, in which the PEEG values are higher compared with the unconfined specimen.
Figure 10 shows the results of selected simulated specimens with different concrete compressive strength and spiral spacing. These presented results were recorded when the damage in the concrete starts to occur (i.e., in this regard, the dc result is close to 0.7 for all test specimens). The results of Figure 10 declare that the effectiveness of confinement of FRP is usually limited by the buckling of longitudinal GFRP rebars. The results show that constructing columns with a larger spacing of the lateral reinforcing bars reduced the efficiency of concrete-core confinement and cause a global buckling for the longitudinal bars, i.e., C21-2-H150-6#5-90 and C26-8-H150-6#5-90, which exhibited no inelastic deformation in the reinforcing bars. The smaller spiral spacing reveals greater inelastic deformation which results in fracture of the longitudinal rebars, i.e., C21.2-H050-6#5-90 and C26.8-H050-6#5-90. Moreover, the GFRP spirals remained without any damage in all the experimental tested columns [7], and this can be seen from the results of Figure 9 and Figure 10.
However, the mechanism and extent of rupture of the longitudinal and transverse GFRP reinforcement varied among the columns constructed with different inner diameters [6]. It was concluded that increasing the inner-to-outer diameter ratio (Di/D) in the hollow columns changed the failure behavior from brittle to pseudo ductile. After spalling of concrete cover, the failure in the hollow columns with a Di/D ratio of 0.16 and 0.26 was initiated by the longitudinal and spiral GFRP reinforcement, while the failure of columns with a Di/D ratio of 0.36 was initiated by crushing of the hollow concrete-core. It is seen in Figure 11a,b that both the longitudinal and spiral GFRP reinforcement in C31.8-H100-6#5-00, C31.8-H100-6#5-40 are subjected to stress and damage. To explore this effects up to the failure of the specimens, the results of Figure 11 are corresponding to the final increment of the analysis (i.e., applied displacement = 50 mm). Figure 11c shows only the rupture of the longitudinal GFRP bars in C31.8-H100-6#5-90 with no rupture of GFRP spirals even after the bar rupture. Moreover, a clear comparison of the specimens’ results provided in Figure 11 with those of Figure 9b (spiral spacing = 50 mm) indicates that the damage in concrete along the entire column height is more obvious than the damage shown by the specimens in Figure 11 due to smaller amount of confinement (i.e., spirals with spacing equals to 100 mm). From Figure 11a–d, it can be also seen that the inelastic deformation (PEEQ) exhibited by the lateral and longitudinal GFRP reinforcement slightly decreases as the inner-hole diameter increases. This is because the rupture of the longitudinal GFRP rebars is dominant in the case of HCCS with a larger inner-hole diameter. However, Figure 12 shows a slight enhancement in the PEEQ observations for the tested HCCs, noting that these results were recorded when the damage in concrete was initiated (i.e., in this regard, the dc result is close to 0.7 for all test specimens). Generally, the HCCs with larger Di/D ratio values, i.e., C31.8-H100-6#5-90, showed better deformation capacity (represented by the PEEQ index) than those with a low Di/D ratio, i.e., C31.8-H100-6#5-00. This is due to the increased contribution of the GFRP bars to overall column stiffness and strength after spalling the concrete cover [6].

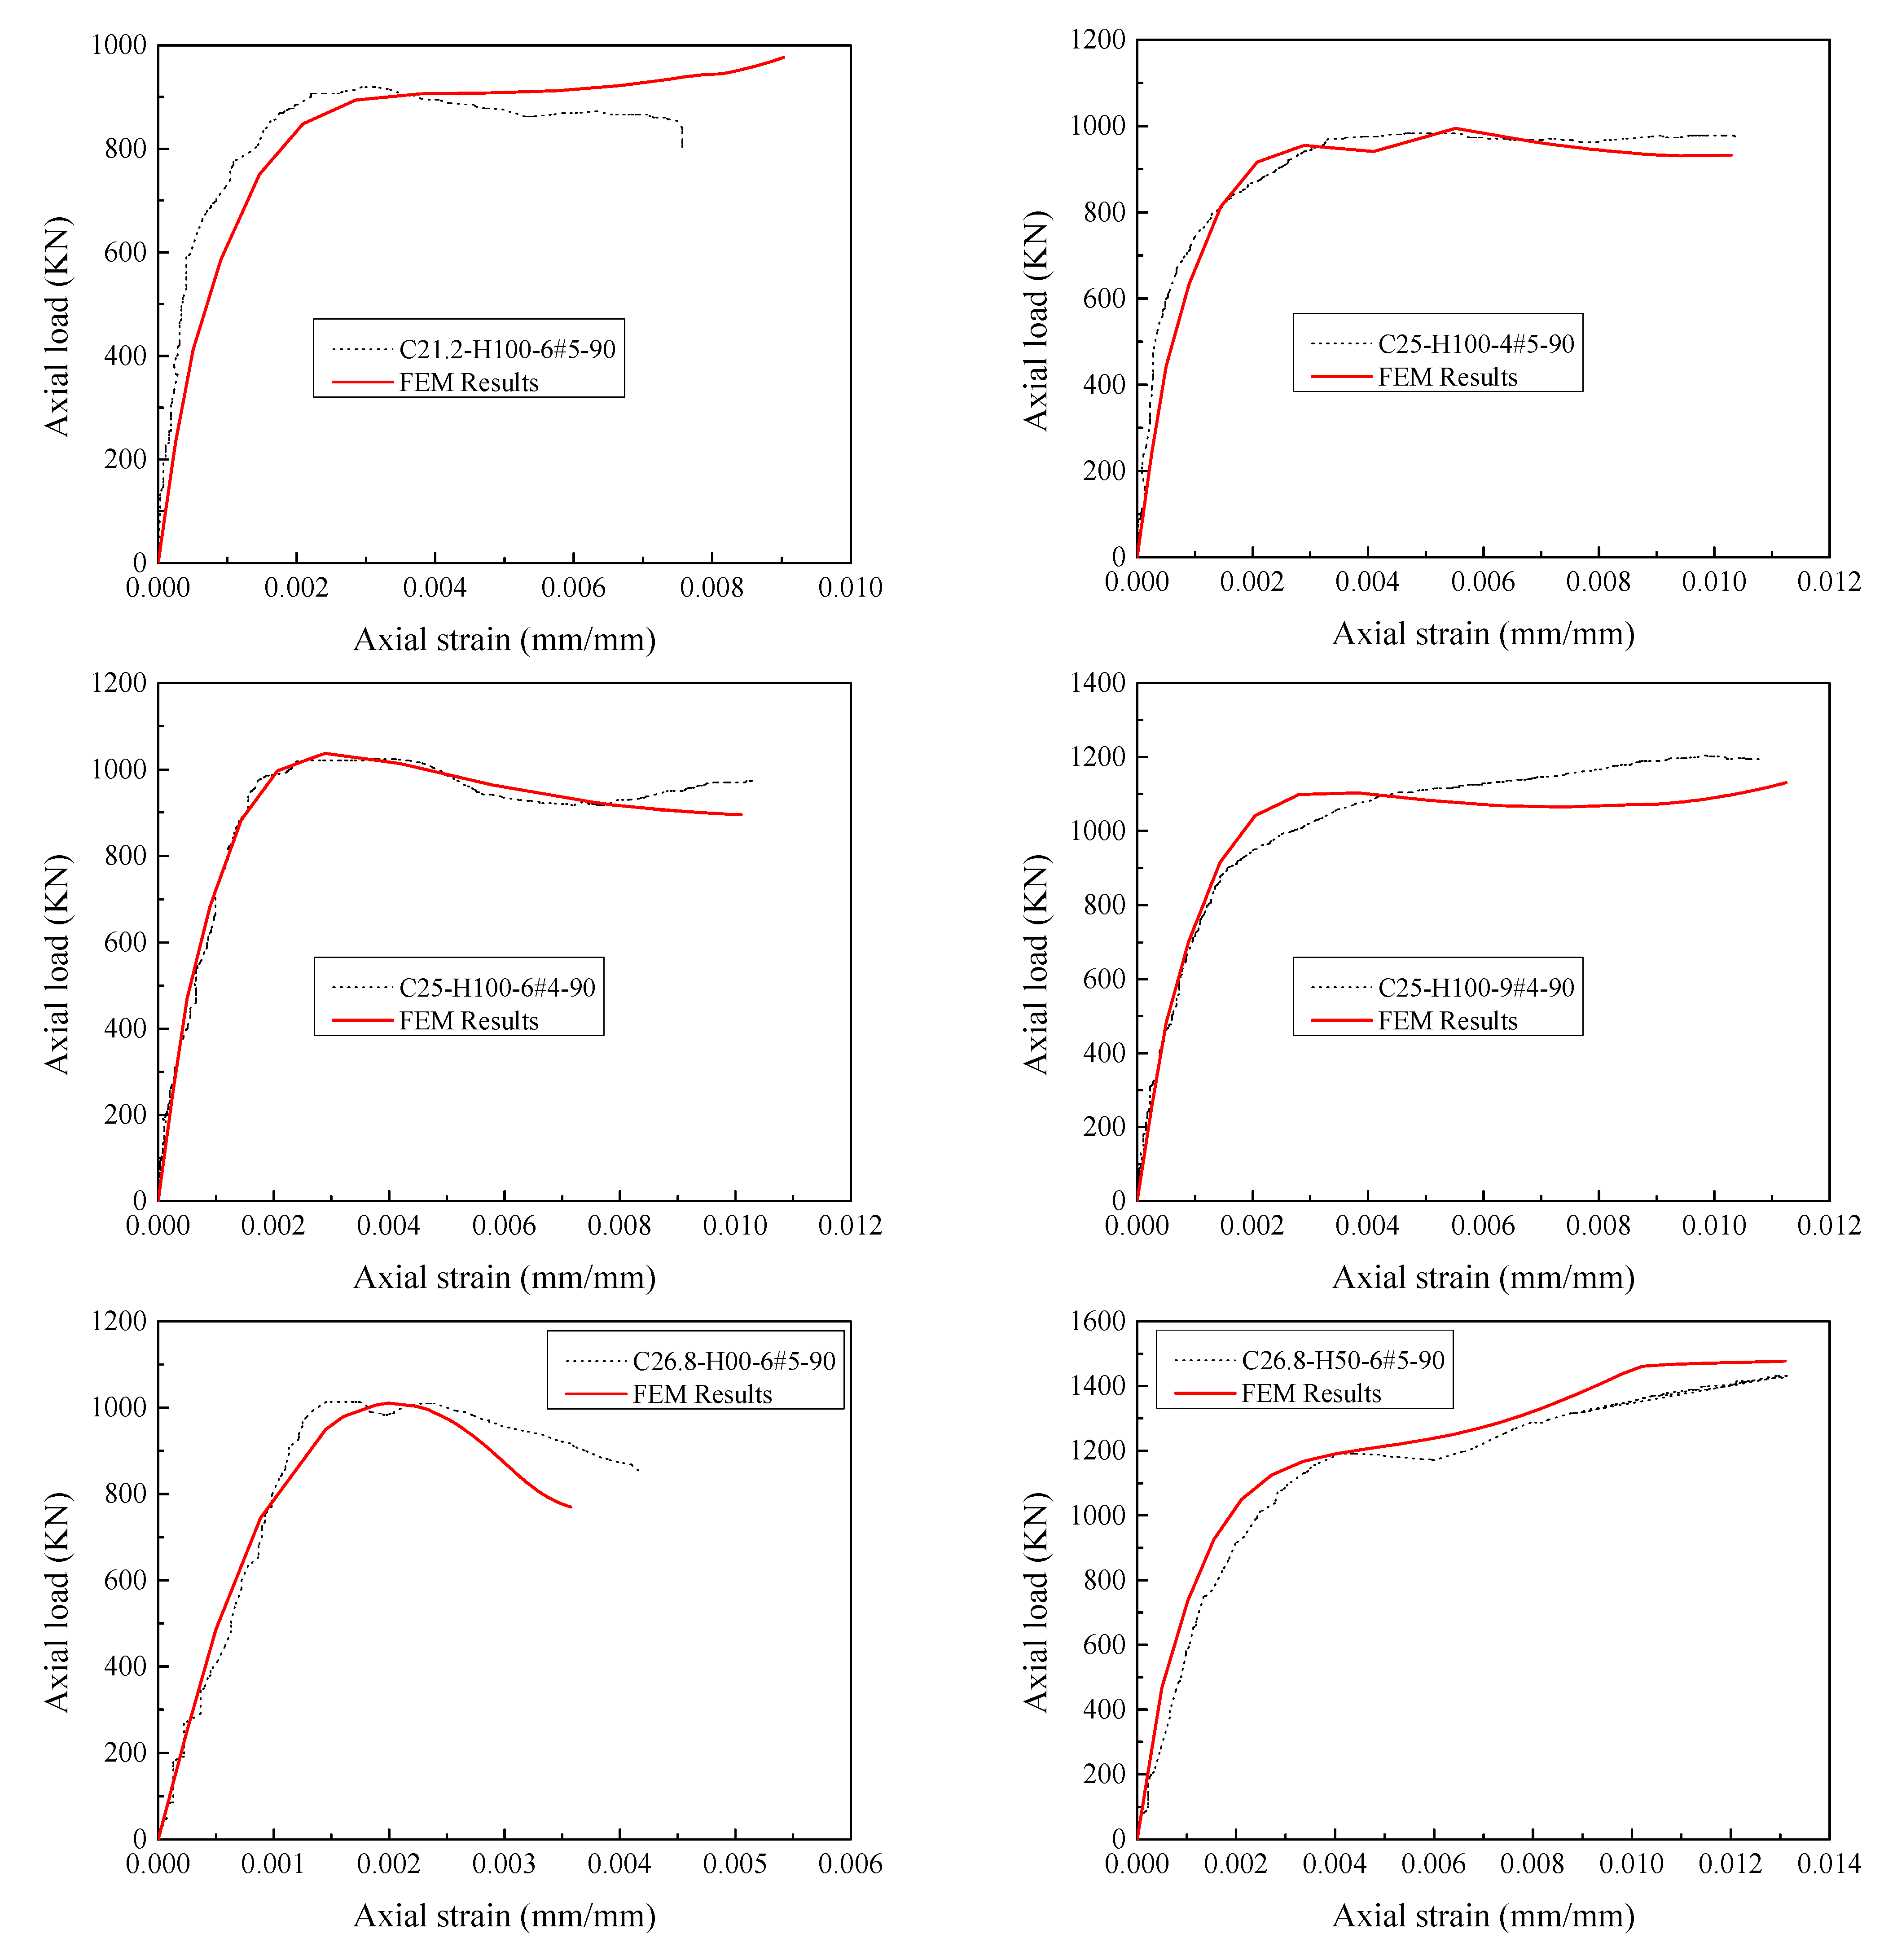
4.3.2. Load-Strain Response

Figure 13 represents the comparison of the complete load-strain responses of HCCs obtained from experimental and numerical results. The HCCs show different types of failure behavior: a softening behavior with one peak load (i.e., C26.8-H150-6#5-90) with a ductility factor of 1.5 and ductile behavior (i.e., C26.8-H50-6#5-90) with a two-peaks’ failure mode with a ductility factor of 2.1 comparing with the C26.8-H00-6#5-90 with no GFRP confinement. Overall, the axial load-strain responses of the finite element model agree well with the tested responses. Although there are some discrepancies between the experimental and numerical stress-strain responses (i.e., C25-H100-9#4-90), the comparison in Figure 14 showed a satisfactory correlation between the experimental and numerical axial capacities in pre-peak and post-peak zones.

5. Artificial Neural Network (ANN) Technique

5.1. Model Development

The ANN technique is used widely for many purposes such as classification, pattern recognition, and modeling. In particular, the use of ANN for predicting the compressive strength and strain of FRP-confined concrete has been studied (i.e., [52]). However, the use of ANN for GFRP HCCs has not yet been explored. In the aim of this, using the ANN toolbox provided in MATLAB R2020b [106], a model was developed to estimate the axial compressive load capacities for HCCs’ columns that exhibited softening and hardening behaviors. The number of experimental data used to construct and test the ANN model was 60 in total. In the development processes of the ANN model, an appropriate selection and reshaping of the input variables is a very important process. The axial load capacity of GFRP-reinforced HCCs should depend on the geometric dimensions and the properties of unconfined concrete and the confining material (i.e., GFRP spirals). As a result, the input variables, which appear to have significant effects on the axial load capacity [5,6,7], were taken into account with the following factors: (1) λvb represented by Equation (21) is a non-dimensional factor to account for the effect of the longitudinal GFRP rebars, (2) λlb represented by Equation (22) is a non-dimensional factor to account for the effect of the GFRP confinement by spirals, (3) fc is the compressive strength of concrete, (4) Ac is the effective concrete area without considering the longitudinal rebars, (5) Di/D is the inner-to-outer core diameter ratio.
λ v b = ρ e f F R P f c
λ l b = k e ρ v f F R P f c
k e = A c e A c c = π 4 ( ( D s s 4 ) 2 D i 2 ) π 4 ( D s 2 D i 2 ) ( 1 ρ e )
The database was randomly divided into training (70%), validation (15%), and test (15%). Using one layer of hidden nodes based on previous suggestions [98], the optimum model parameters (i.e., the number of the hidden nodes, the rate of learning) were found by a proposed training approach. This can be performed by various available approaches, in which the network was trained with a set of random initial weights, hidden nodes’ numbers varying from 0 to 10, and the learning rate from 1 × 10⁻² and 1 × 10⁻¹. The Levenberg–Marquardt denoted by Trainlm [106,107] was selected as the training function. The performance function is MSE, and the transfer functions in both hidden and output layers are Pureline transfer functions. It is to be noted that the default transfer functions in the ANN toolbox are Tansig [106,107]. By transforming the data in the first and last ANN layers using the log function (Equations (24) and (25)) and choosing Pureline transfer functions, the ANN model reveals an acceptable performance:
x = ( log 10 [ x 1 , x 2 + 1 , x 3 , x 4 , x 5 + 1 ] ) T
y = ( log 10 [ y 1 , y 2 ] ) T
Once the ANN model is built and the first and last data layers are chosen and normalized, the network can now be trained. Based on the overall model performance and the least mean square error achieved across a wide range of training parameters, the optimal number of hidden nodes was found to be 3 and the learning rate was close to the range of 0.005–0.01. Using these resulted parameters in a training approach, the most accurate results can then be obtained. Figure 15 clearly shows such a result for the train, validate, and test data, which have almost similar mean square errors. The predictions from the ANN model are practically generated following the Equations (26)–(32).
[ ( y y min y max y min 0.5 ) × 2 ] = 10 . ^ [ w ( ( x x min x max x min 0.5 ) × 2 ) + a ]
w = w 2 × w 1
a = w 2 × b 1 + b 2
w 1 = [ 0 . 0761 - 0 . 4257 0 . 7646   1 . 0214 0 . 4346 - 0 . 4925 - 1 . 0612 0 . 8116 0 . 0099 - 0 . 9388 - 0 . 7003 - 1 . 1121 - 0 . 0234 - 0 . 8322 0 . 3971 - 0 . 4369 0 . 4104 0 . 3133 - 0 . 4325 0 . 7582 0 . 0827 0 . 0960 - 1 . 0293 0 . 6293 - 0 . 2225 ]
w 2 = [ 0 . 3792 0 . 0417 - 0 . 4201 - 0 . 0688   - 0 . 6323 0 . 4938 - 0 . 2168 - 0 . 8262 - 0 . 2278 - 0 . 9131 ]
b 1 = [ - 0 . 8411 - 0 . 4814 - 0 . 6591 0 . 0193 - 0 . 2438 ]
b 2 = [ - 0 . 0381 - 0 . 2204 ]
where y in Equation (26) represents the predictions; the inputs (x) and outputs (y) data of the ANN model are scaled using the minimum and maximum values provided in Table 5; w1 and w2 are essential findings of the ANN network. These contain the weights utilized between the x data and the hidden layer, and the hidden layer and the y data, respectively. The b1 and b2 are the matrices containing the bias of the hidden and output layers (see Figure 16).

5.2. Performance of Proposed Axial Load Capacities

The performance of the proposed ANN (N5-5-2) models of peak axial load capacities of GFRP-reinforced HCCs is verified by the database used to develop these models. The default generated figures from ANN toolbox [106,107] show excellent correlation. Figure 17 shows the overall accuracy of the proposed N5-5-2 model. Figure 18a,b provide comparisons of the ANN results with the test data. Due to the unavailability of models that consider GFRP-reinforced columns, only the AlAjarmeh et al.’s [7] model was, in this assessment, studied. Generally, these comparisons show that the estimated errors of the proposed ANN models were significantly lower than those of other methods. More specifically, the predictions of the first peak load resulted in less error by the proposed and existing models. However, the predicted peak loads of HCCs exhibiting a hardening failure model exhibited significant errors. This approves that the five variables of the ANN model (i.e., λlb, Di/D) have a more significant effect on the second peak compared with their effects on the first peak load, which is well-taken into account by the ANN model with a high R2 of about 95.2%.

5.3. Complete Axial Load-Strain Model

First, the stress-strain monotonic curve drawn by Equation (33) is used as a control model for the tested GFRP-RC HCCs. The model details are shown in Equation (33). The first expression was firstly reported by Guo et al. [108] from results of tests on unreinforced rectangular concrete prisms, whereas the second one was used in many analytical studies:
{ f c = f c c 1 [ A ( ε c ε c c 1 ) + ( 3 2 A ) ( ε c ε c c 1 ) 2 + ( A 2 ) ( ε c ε c c 1 ) 3 ]                     ε c ε c c 1 f c = f c c 1 + E 2 ( ε ccu ε c c 1 )                                                                                                                           ε c c 1 ε c ε c c u
where E2 (MPa) is the slope of the post-peak linear portion of the stress-strain response and determined by Equation (34); the strain at the first peak εcc1 and second peak εccu can be obtained from Equations (4) and (19), respectively. The shape parameter A, which controls the polynomial portion, is derived from the boundary condition of dσc/dεc = Ec at εc = 0. The parameter A can be obtained as A = Ec/Ep by substituting the boundary value in Equation (33):
E 2 = f ccu f c c 1 ε ccu ε c c 1
where Ec (MPa) is predicted using Equation (1); Ep = fcc1/εcc1 (MPa) is the second modulus at the peak point; the terms fcc1 and fccu are calculated by dividing the first and second peak loads obtained using the ANN model over the effective concrete area without considering the longitudinal rebars. The fcc1 and fccu can be also predicted using Equations (35) and (36), additionally proposed in the present work with a correlation factor R2 of about 95.1 and 91.4% (see Figure 19). Overall, the comparison between the predictions made by this model and the ANN model as well as the test results shows that the accuracy is almost typical (ANN model’s R2 = 95.2% and RA model’s R2 = 93.5% (on average)).
p n 1 = α 1 f c ( A g A F R P ) + 0.0032 E F R P A F R P ( α 1 = 0.713 + 37 × 10 4 f c 0.798 )
p n 2 = A c f c ( 0.41 + 0.07 ( λ v b ) 2.65 + 0.91 exp ( λ l b 0.61 ) exp ( 1 + D i D ) 1.24 ) ( 1 + D i D ) 0.23
After predicting the stress-strain relationship of HCCs by Equations (33) and (34), the load-strain curve can be generated. To evaluate the proposed model in terms of significant effects of the key parameters considered in the present paper as respectively demonstrated in Figure 20, Figure 21, Figure 22 and Figure 23, comparisons between load-strain responses of the present model with selected experimental results of specimens with various test parameters from both the experiments provided in [5,6,7] and the FE simulations are provided in Figure 24. Inspection of the comparisons with the results demonstrates that the model can capture well the major features of the response such as the axial load capacities pn1 and pn2. Generally, the pre-peak and post-peak regions of the simulated response are also described in a good way.

6. Proposed Minimum Thresholds for Acceptable Performance

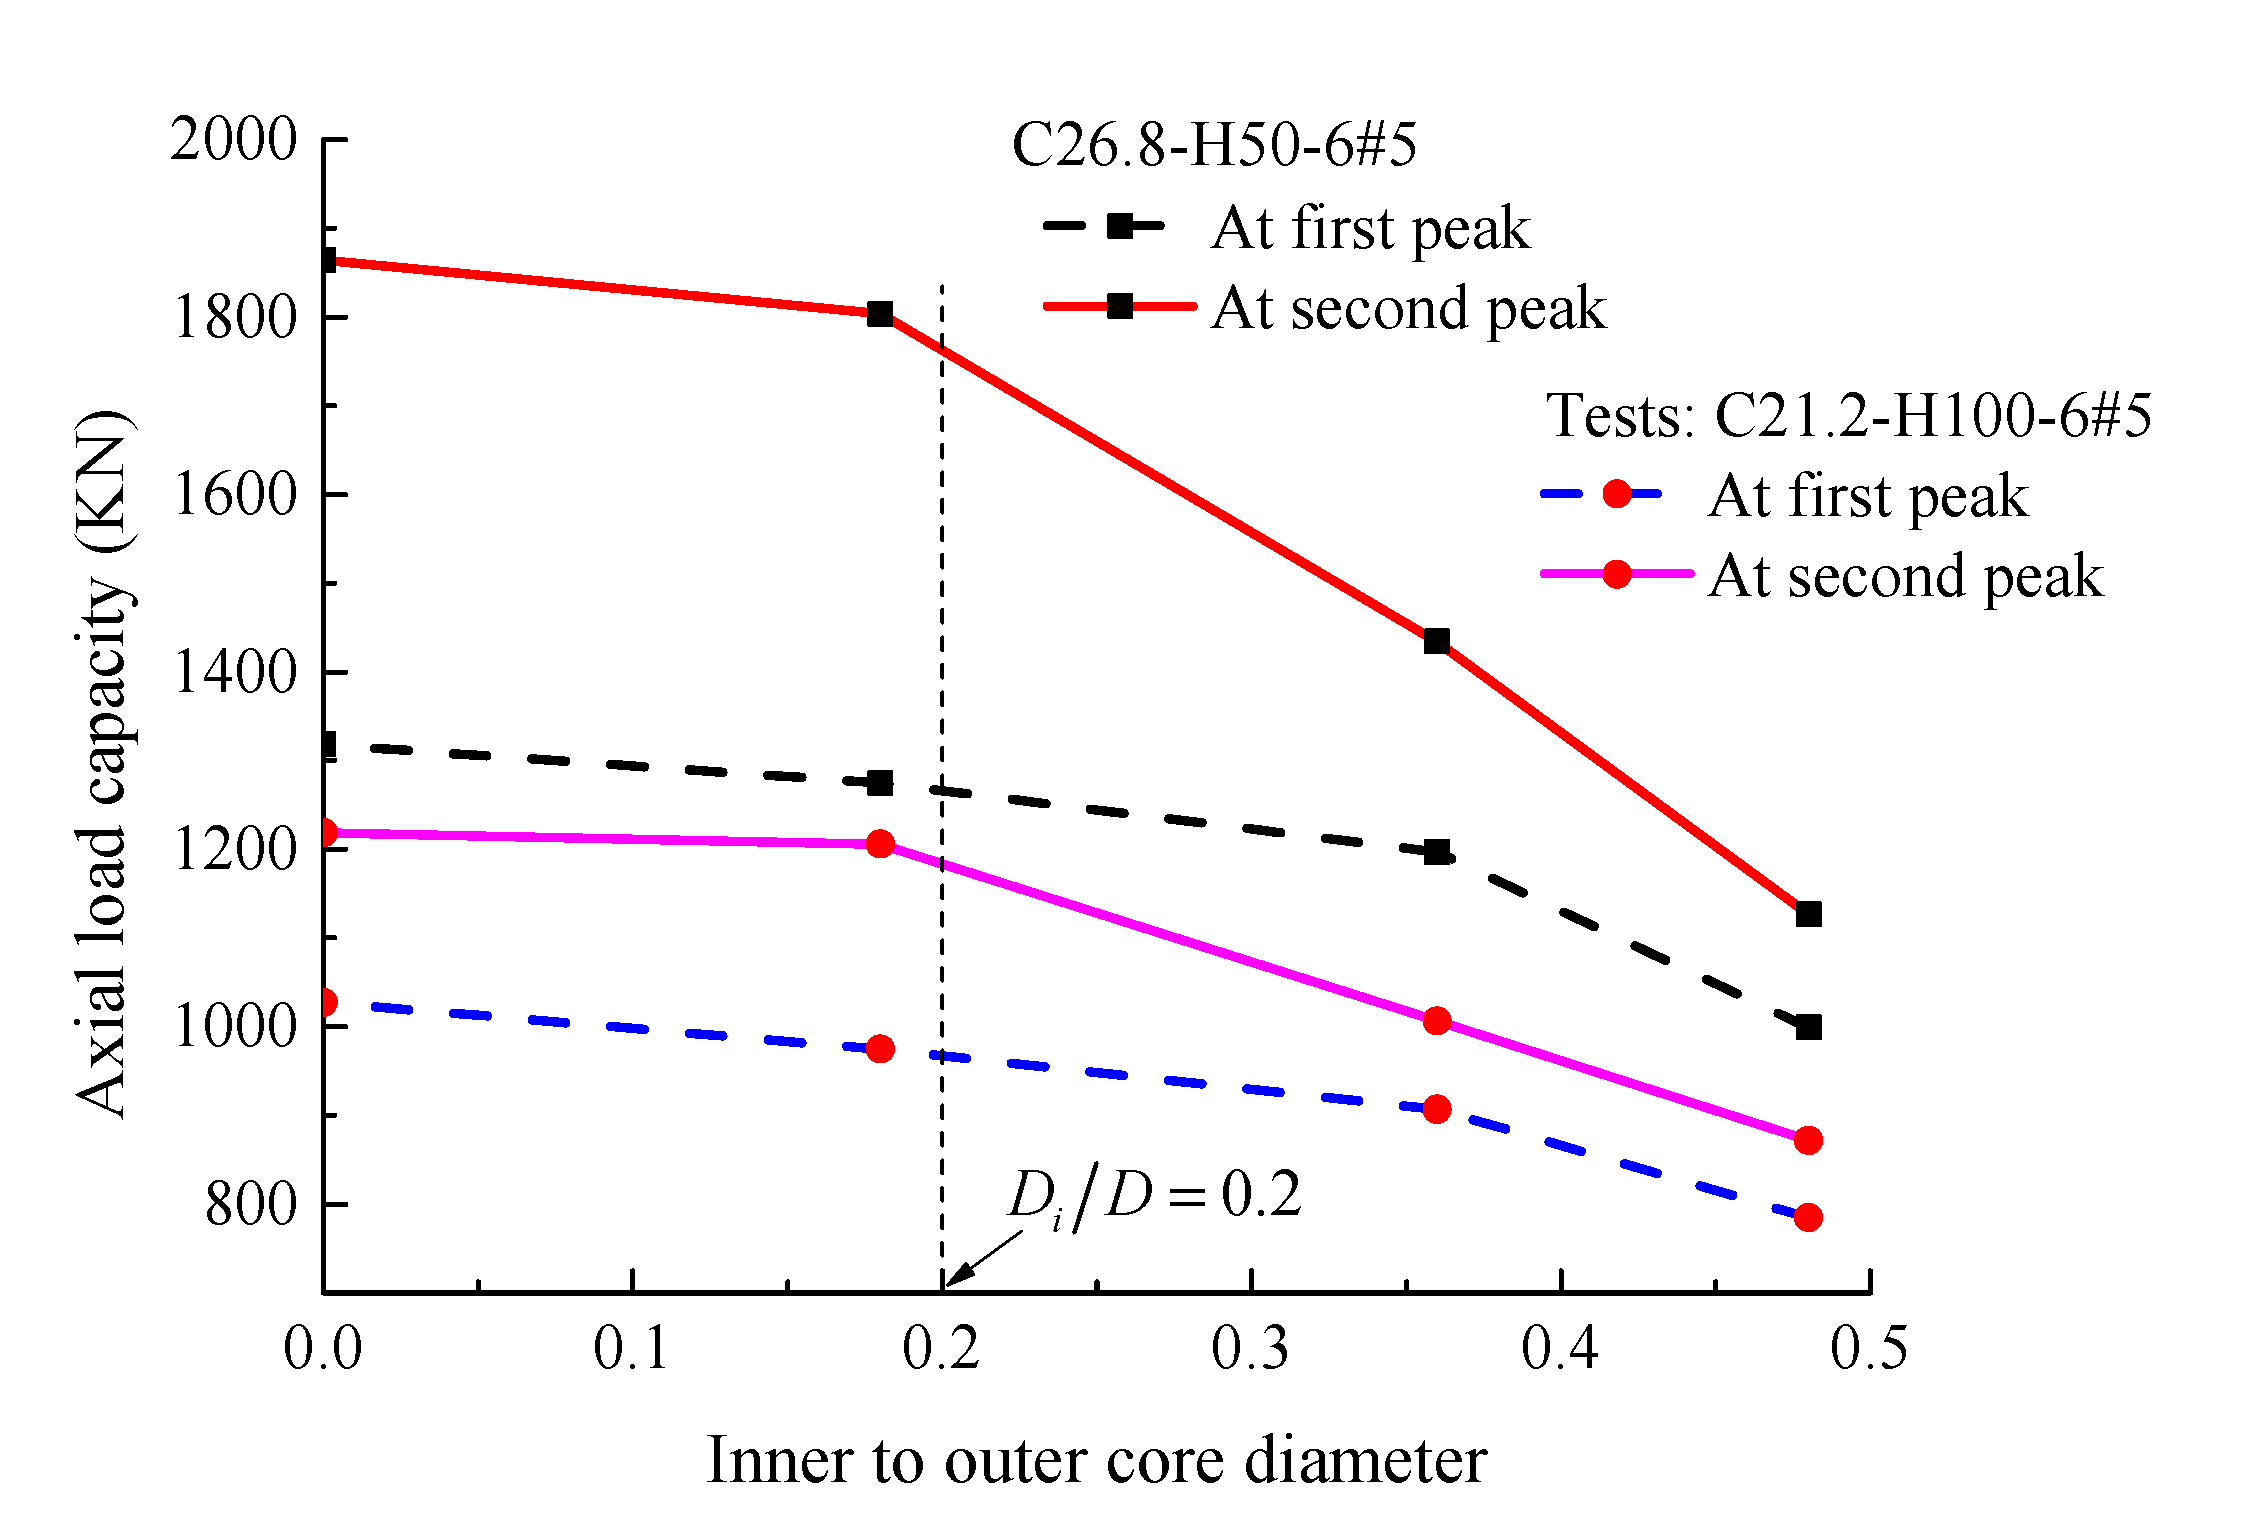
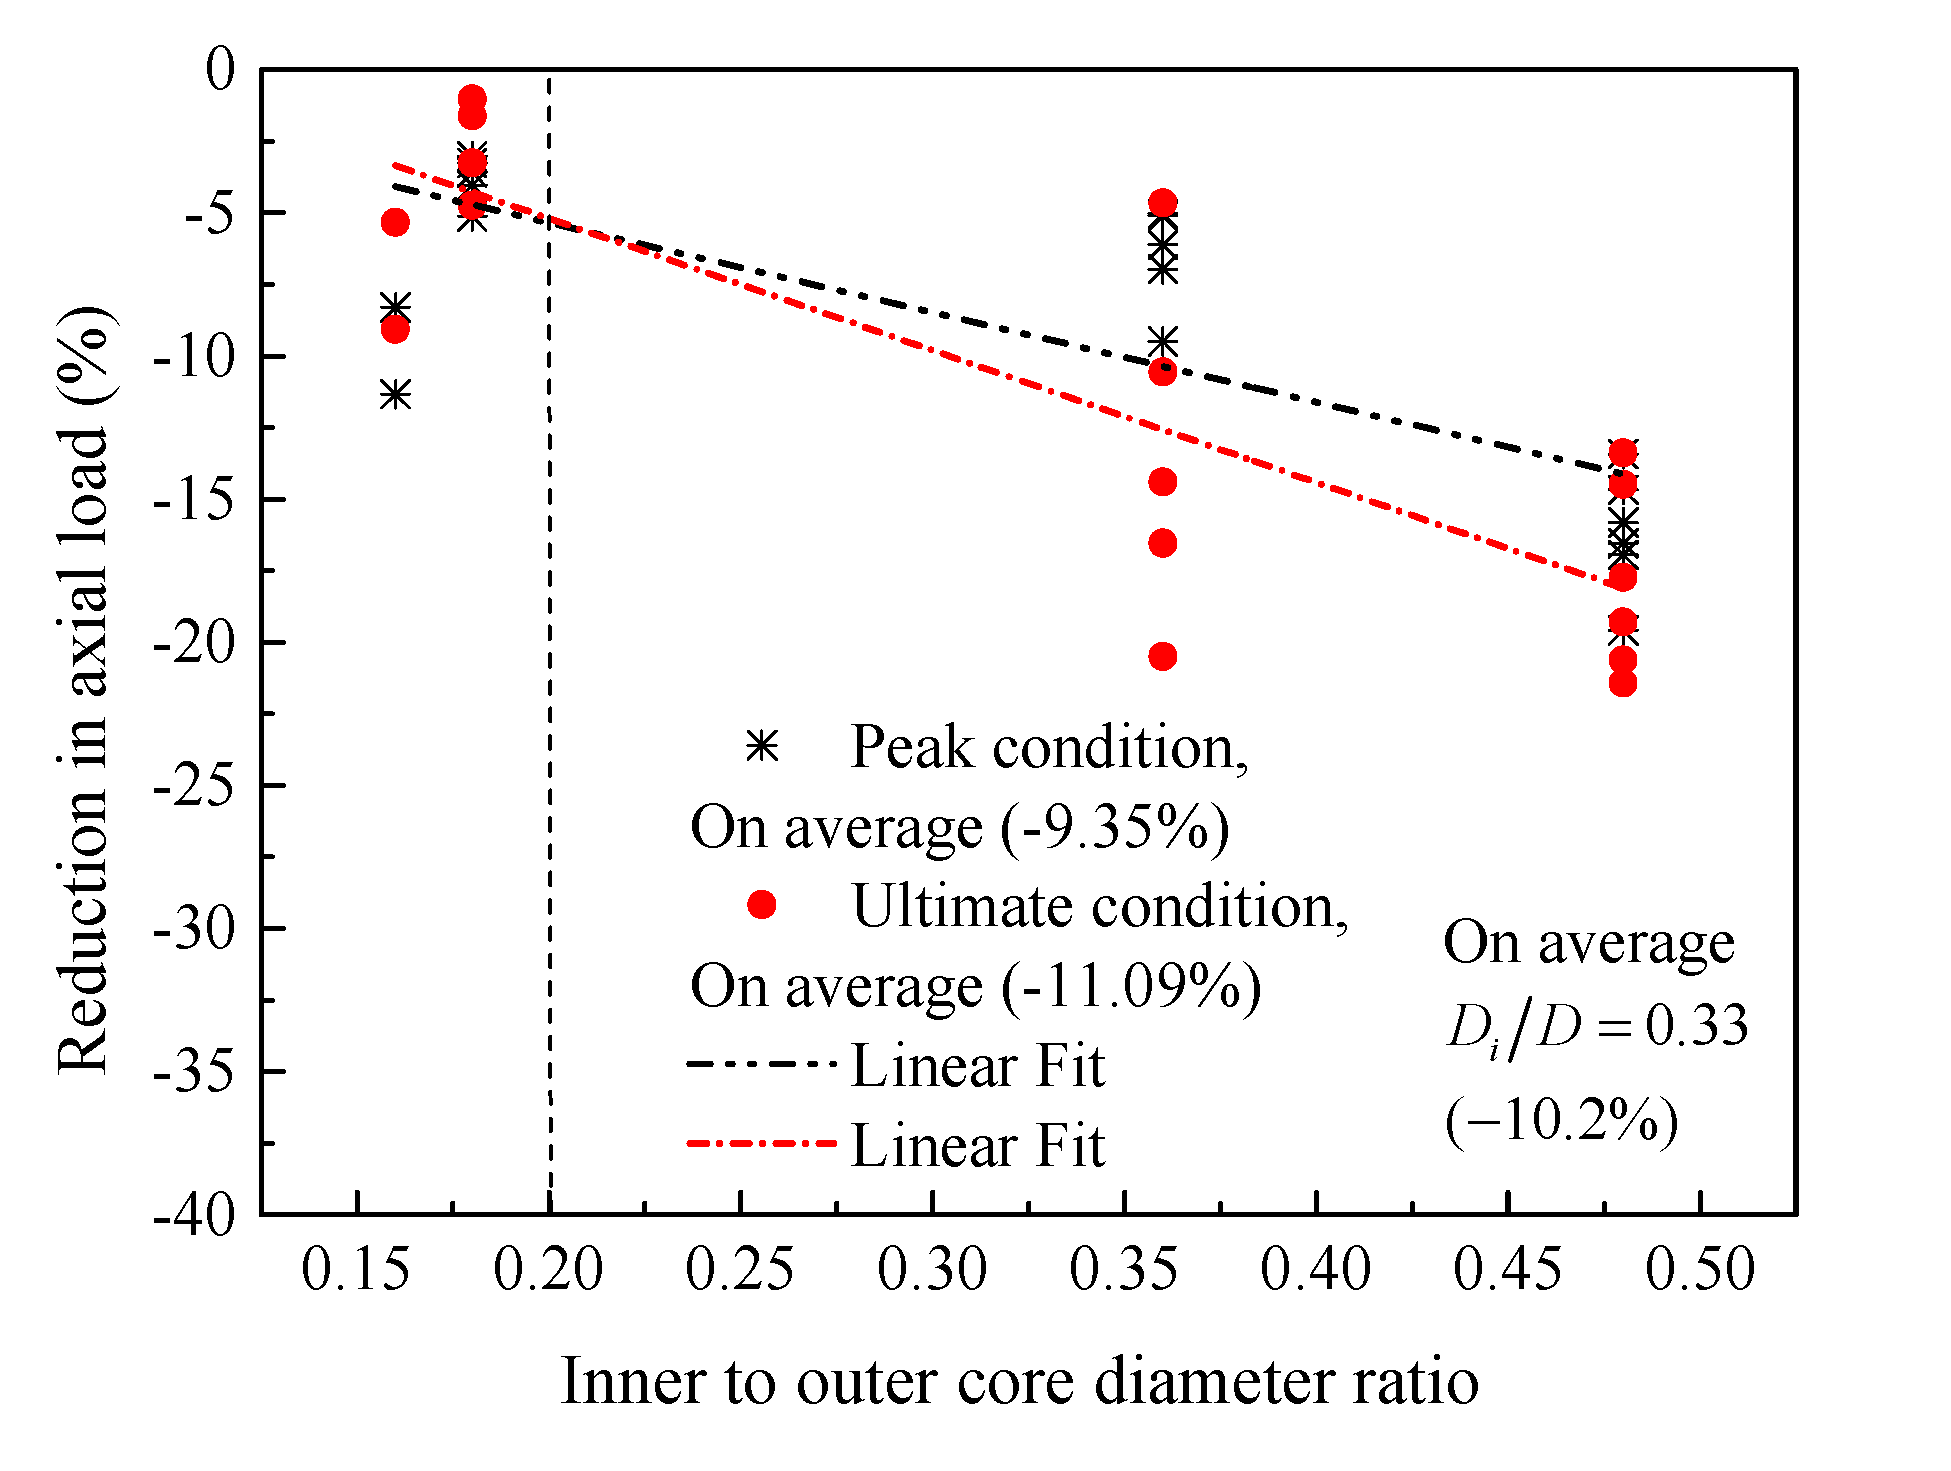
6.1. Thresholds of Inner-to-Outer Core Diameter (Di/D) Ratios

Tests [6] have confirmed that the hollow columns (Di/D > 0) failed at a lower load than the solid column (Di/D = 0) due to the reduced effective area. To gain sufficient understanding about this issue, Figure 25 presents the results of specimens C26.8-H50-6#5 and C21.2-H100-6#5 selected from Table 2. It is seen that when the Di/D ratio is being less than 0.2, the difference in concrete compressive loads of the hollow and solid columns is insignificant. As stated in previous discussions, the failure of the HCCs having an inner- to-outer concrete-core diameter ratio of 0.16 and 0.26 was initiated by the longitudinal reinforcement and spiral, while the failure of the HCCs having an inner-to-outer concrete-core diameter ratio of 0.36 was initiated by crushing of the inner concrete core. This also demonstrated that both the longitudinal and lateral GFRP reinforcement contributed to the load enhancement when the Di/D ratio is less than 0.26 since they appear to be subjected to stress up to column failure, while only the longitudinal reinforcement contributed to the improvement of the load capacity for columns with larger Di/D ratios (i.e., Di/D = 0.36), which ultimately resulted in lower loads than the solid sections. The hollow concrete-core C26.8-H50-6#5-120 with a Di/D ratio of 0.48 exhibited 24.2% and 39.6% lower axial capacities at the first and second peak loading conditions than the solid specimen C26.8-H50-6#5-00, respectively. The effect of increasing the Di/D ratio is more pronounced on the second peak load at a higher Di/D ratio. It is suggested in Figure 26 that the averaged Di/D ratio for all tests of the present paper that causes an averaged reduction of almost 10% in the load-carrying capacity is equal to 0.33. The reduced load can be compensated by sufficient confinement of GFRP as discussed next.

6.2. Minimum Amount of FRP for Adequate Confinement

A designed column needs a minimum amount of reinforcement materials for sufficient confinement [86,87,88,89,90,91,92,93,94,95,96,97,98,99,100,101,109]. In these cases, if the compression load ratio (i.e., pn2/pn1) is greater than one, the resulting threshold represents the sufficiently confined concrete [86,87,88,89,90,91,92,93,94,95,96,97,98,99,100,101,109]. Based on an analytical investigation by Pham and Hadi [109] on FRP-confined circular and non-circular columns under concentric compression, the minimum threshold value of effective confinement stress ratio was suggested to be 0.15. For GFRP-reinforced hollow concrete-core columns, the test results with different geometric and material characteristics were studied.
The response between the effective confining pressure ratio and the confined axial load ratio is given in Figure 27. Based on an averaged trend-line made between the experimental, FEM, and parametric data, when the load ratio is equal to 1.0, then the confinement pressure ratio (Equation (22)) should be over 0.66 for the present tests, and such a threshold is larger than that of FRP-confined circular columns due to the reduced effects caused by different material properties and that of the tensile strength of the bent GFRP rebars.

7. Conclusions

The present work aims to investigate the structural behavior of hollow concrete-core columns reinforced with GFRP bars by performing detailed numerical simulation, analytically provided in this work, and the key conclusions are summarized below.
During the calibration of the FEM model, it was found that the dilation angle of 30° and the concrete’s viscosity parameter of 5 × 10⁻⁵ gave a good performance while using the concrete damage plasticity model (CDPM). Moreover, the mesh size of 15 mm for C3D8R elements of concrete and 10 mm for both C3D8R and T3D2R elements of end plates and GFRP bars presented good performance for predicting load-strain behavior and failure patterns of HCCs.
  • The proposed FEM model captured the structural response of GFRP-reinforced HCCs with high accuracy. The average correlated R2 value between the available testing results and numerical data was 88% for both the peak and ultimate loads.
  • The failure modes of the HCCs were numerically obtained and compared with the tested ones. Both the experimentally tested and numerically obtained patterns were in a good match. The influence of varying test parameters (i.e., amount of longitudinal and lateral reinforcement) on these patterns can be seen.
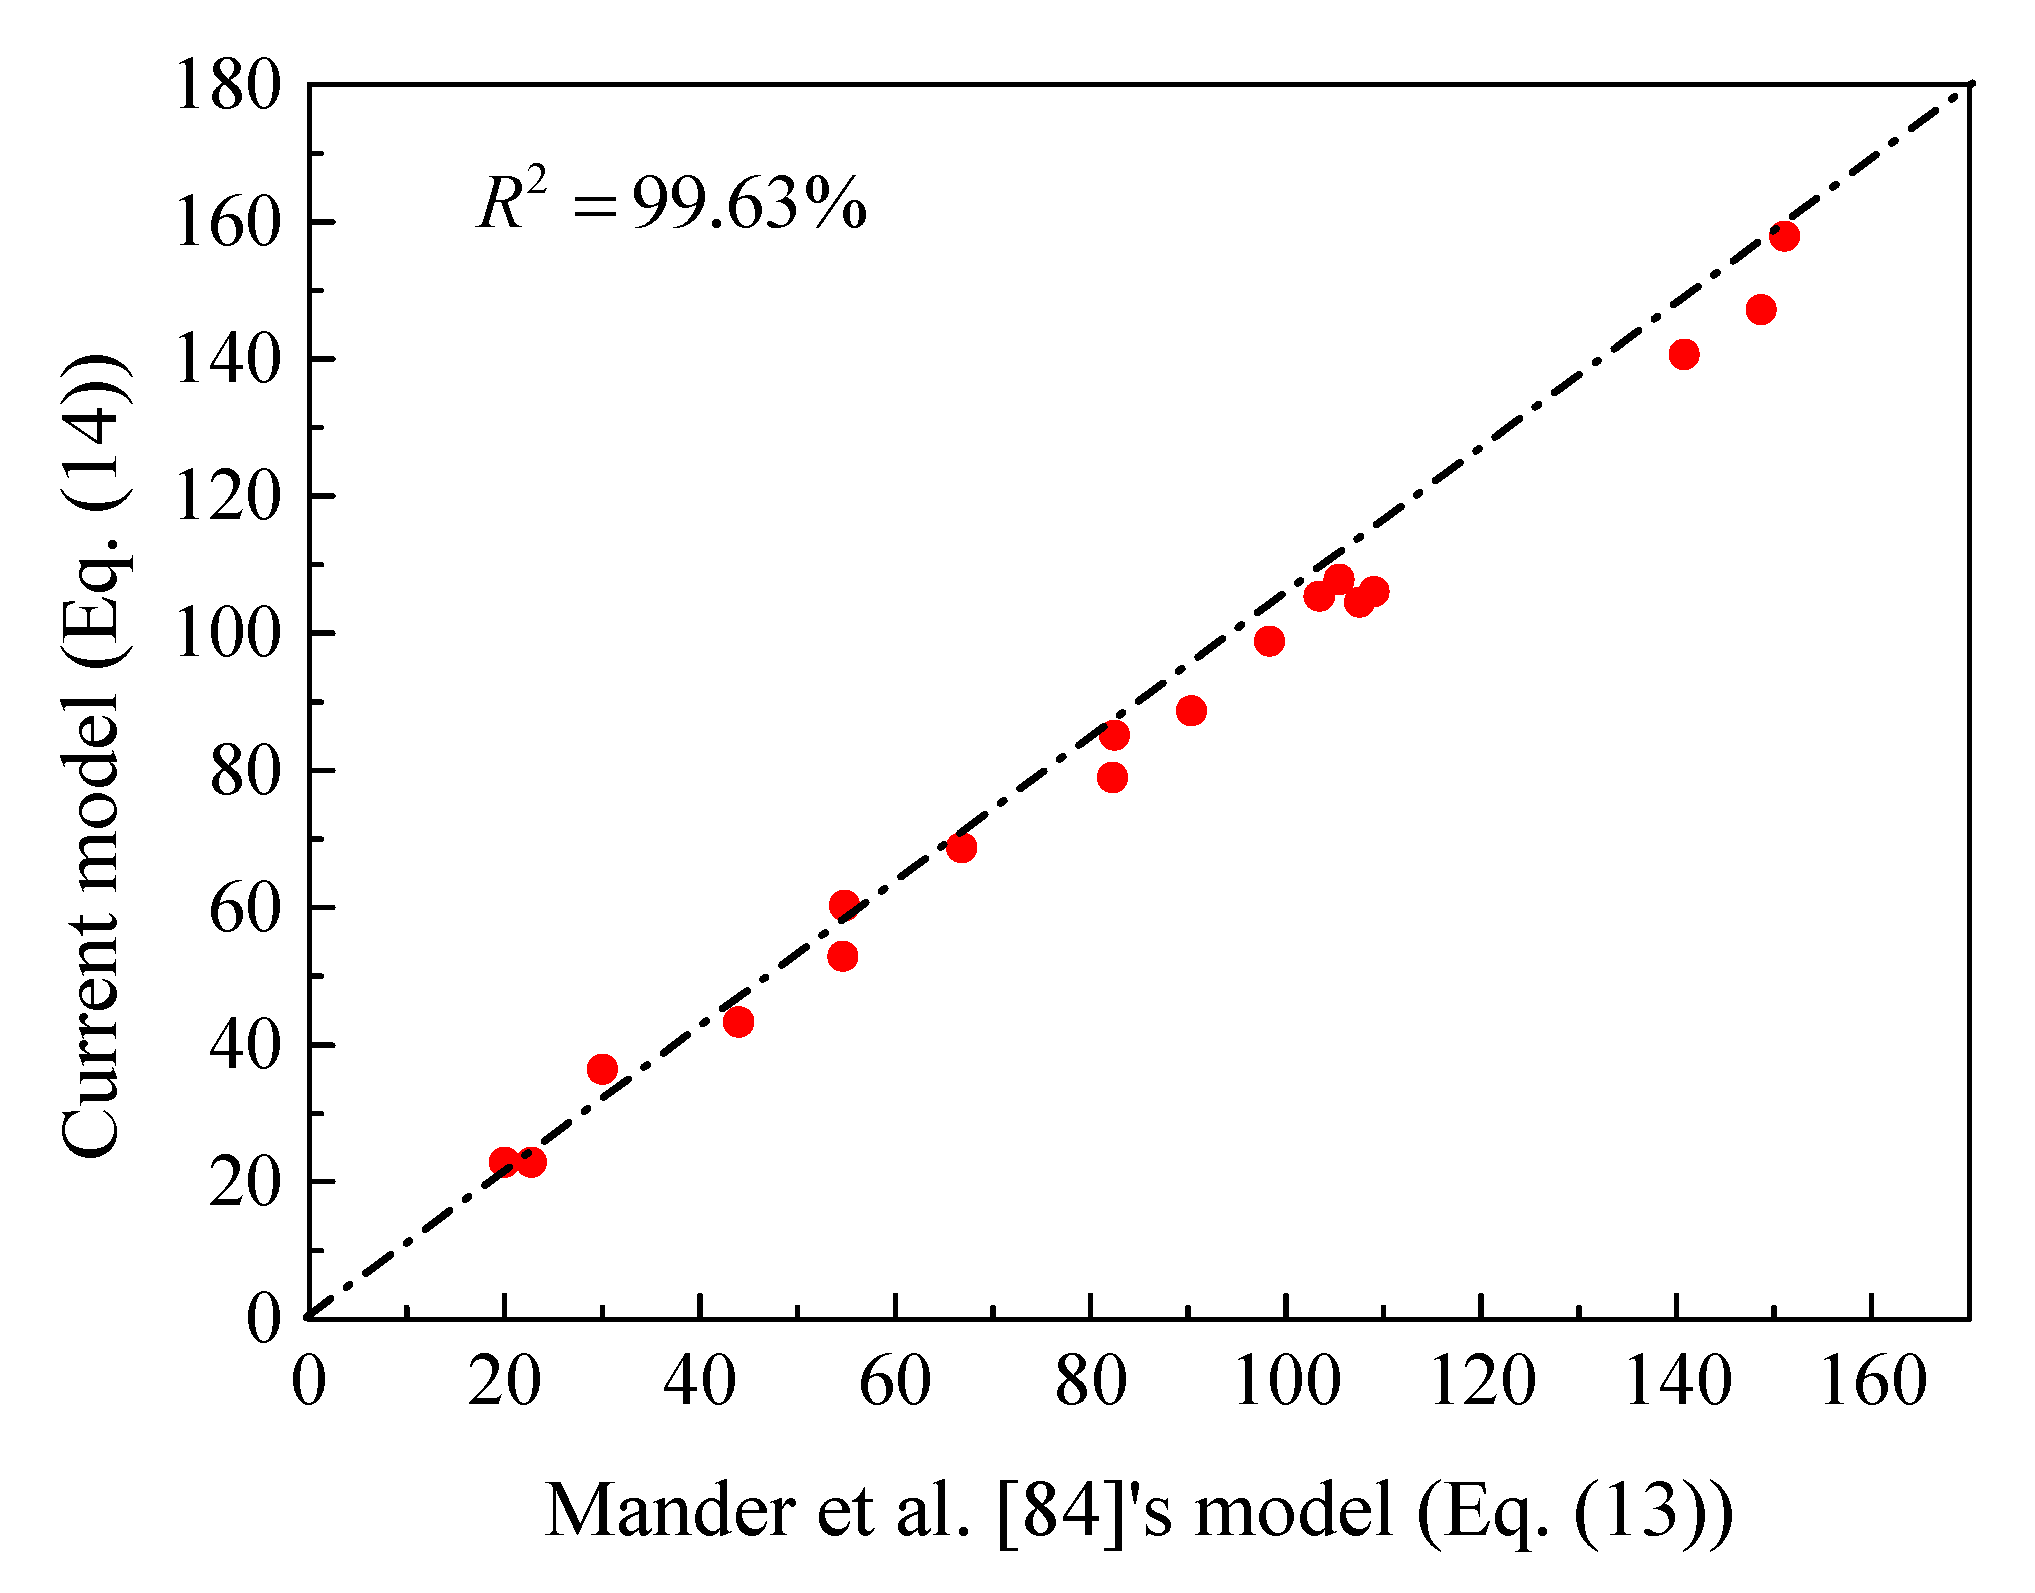
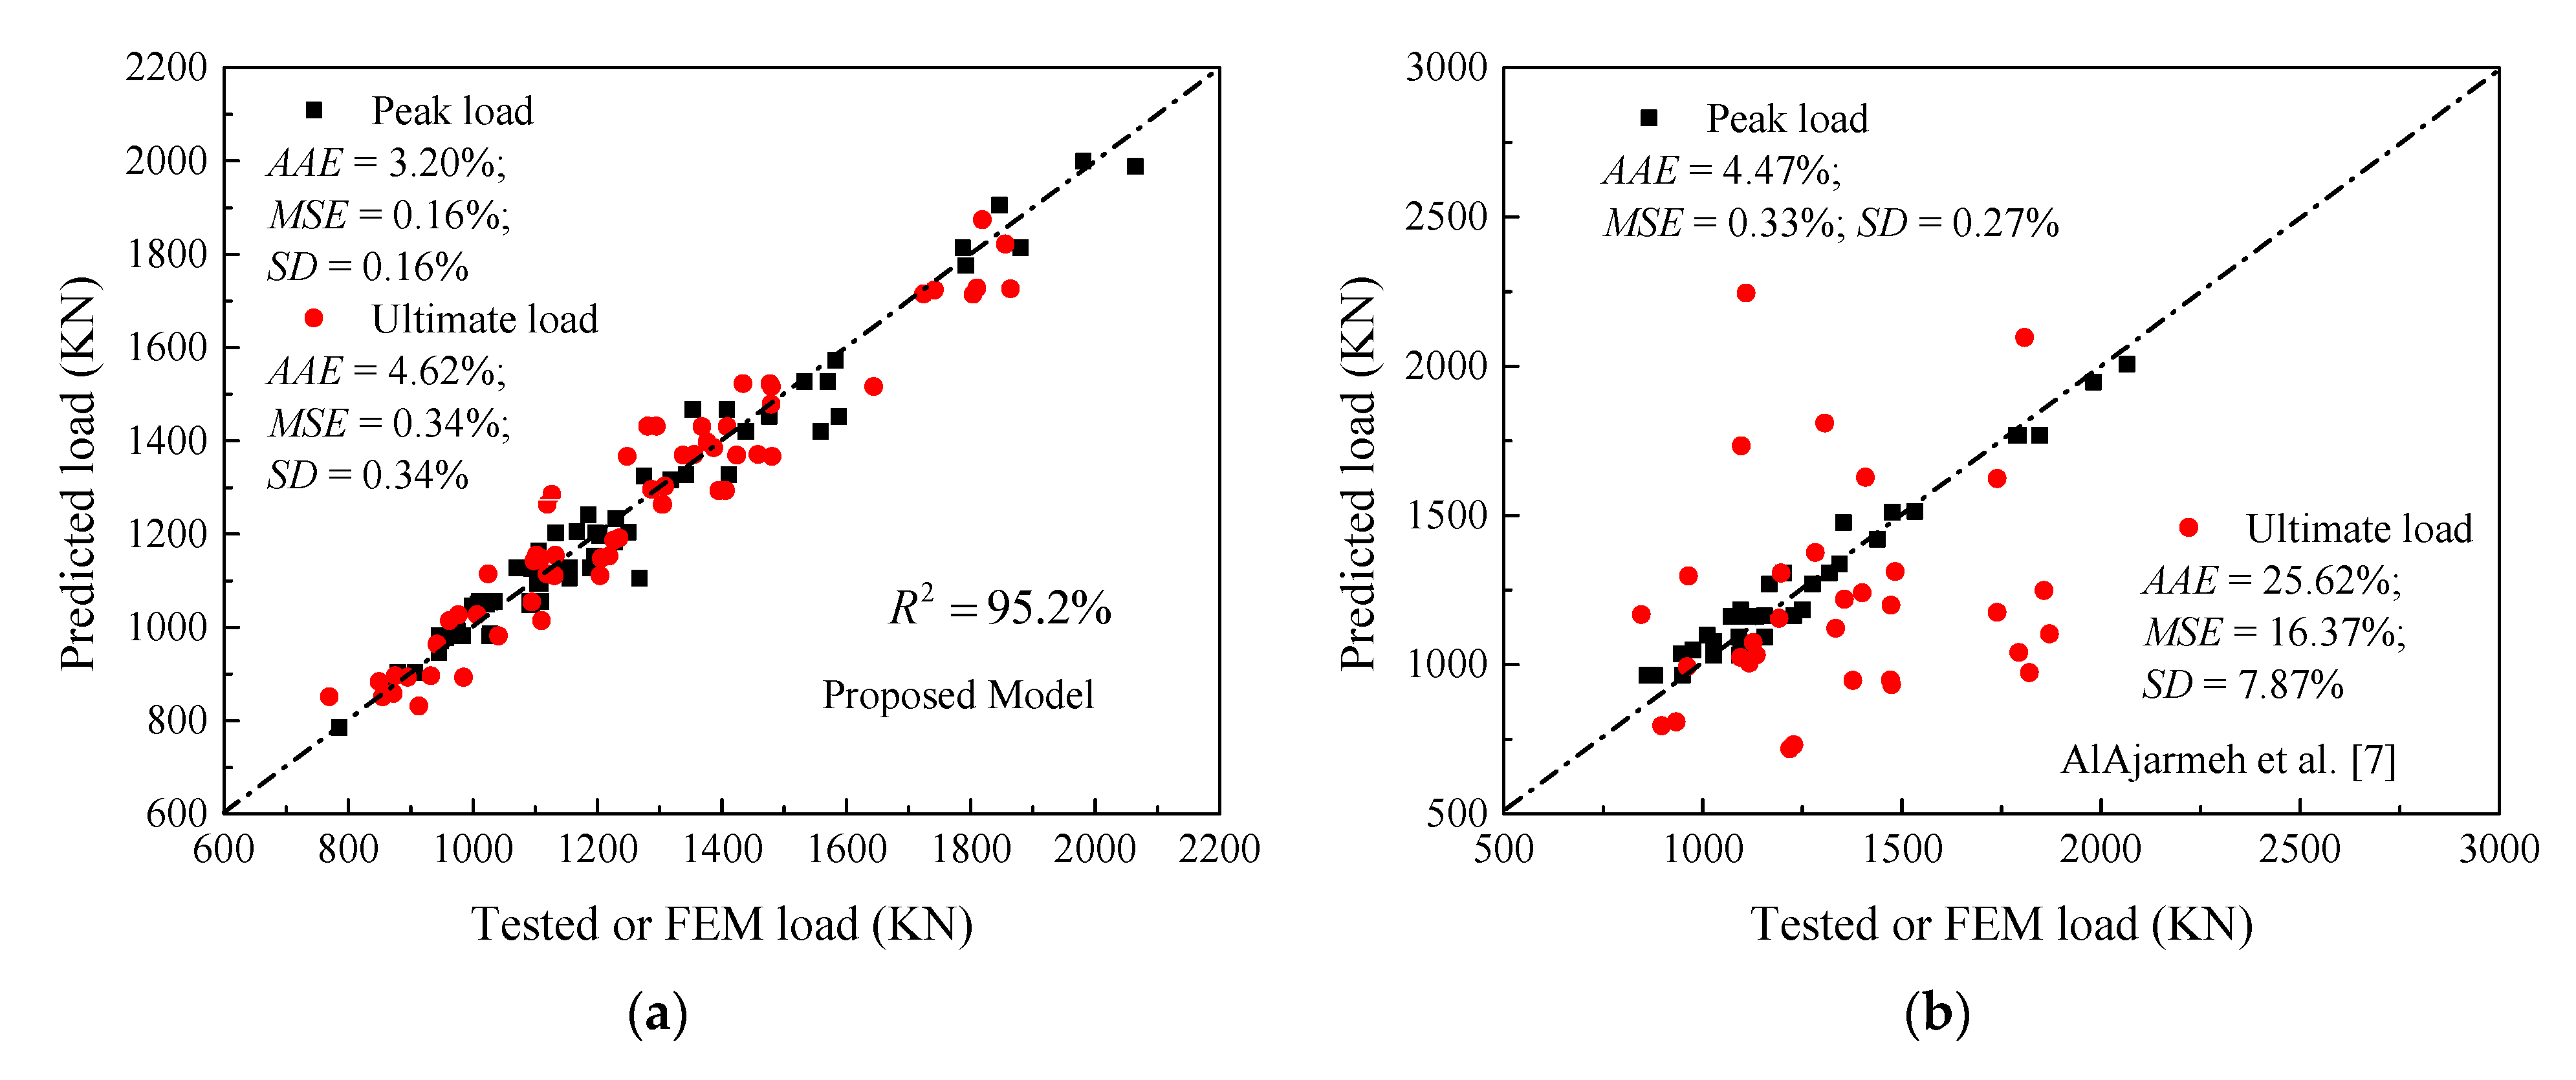
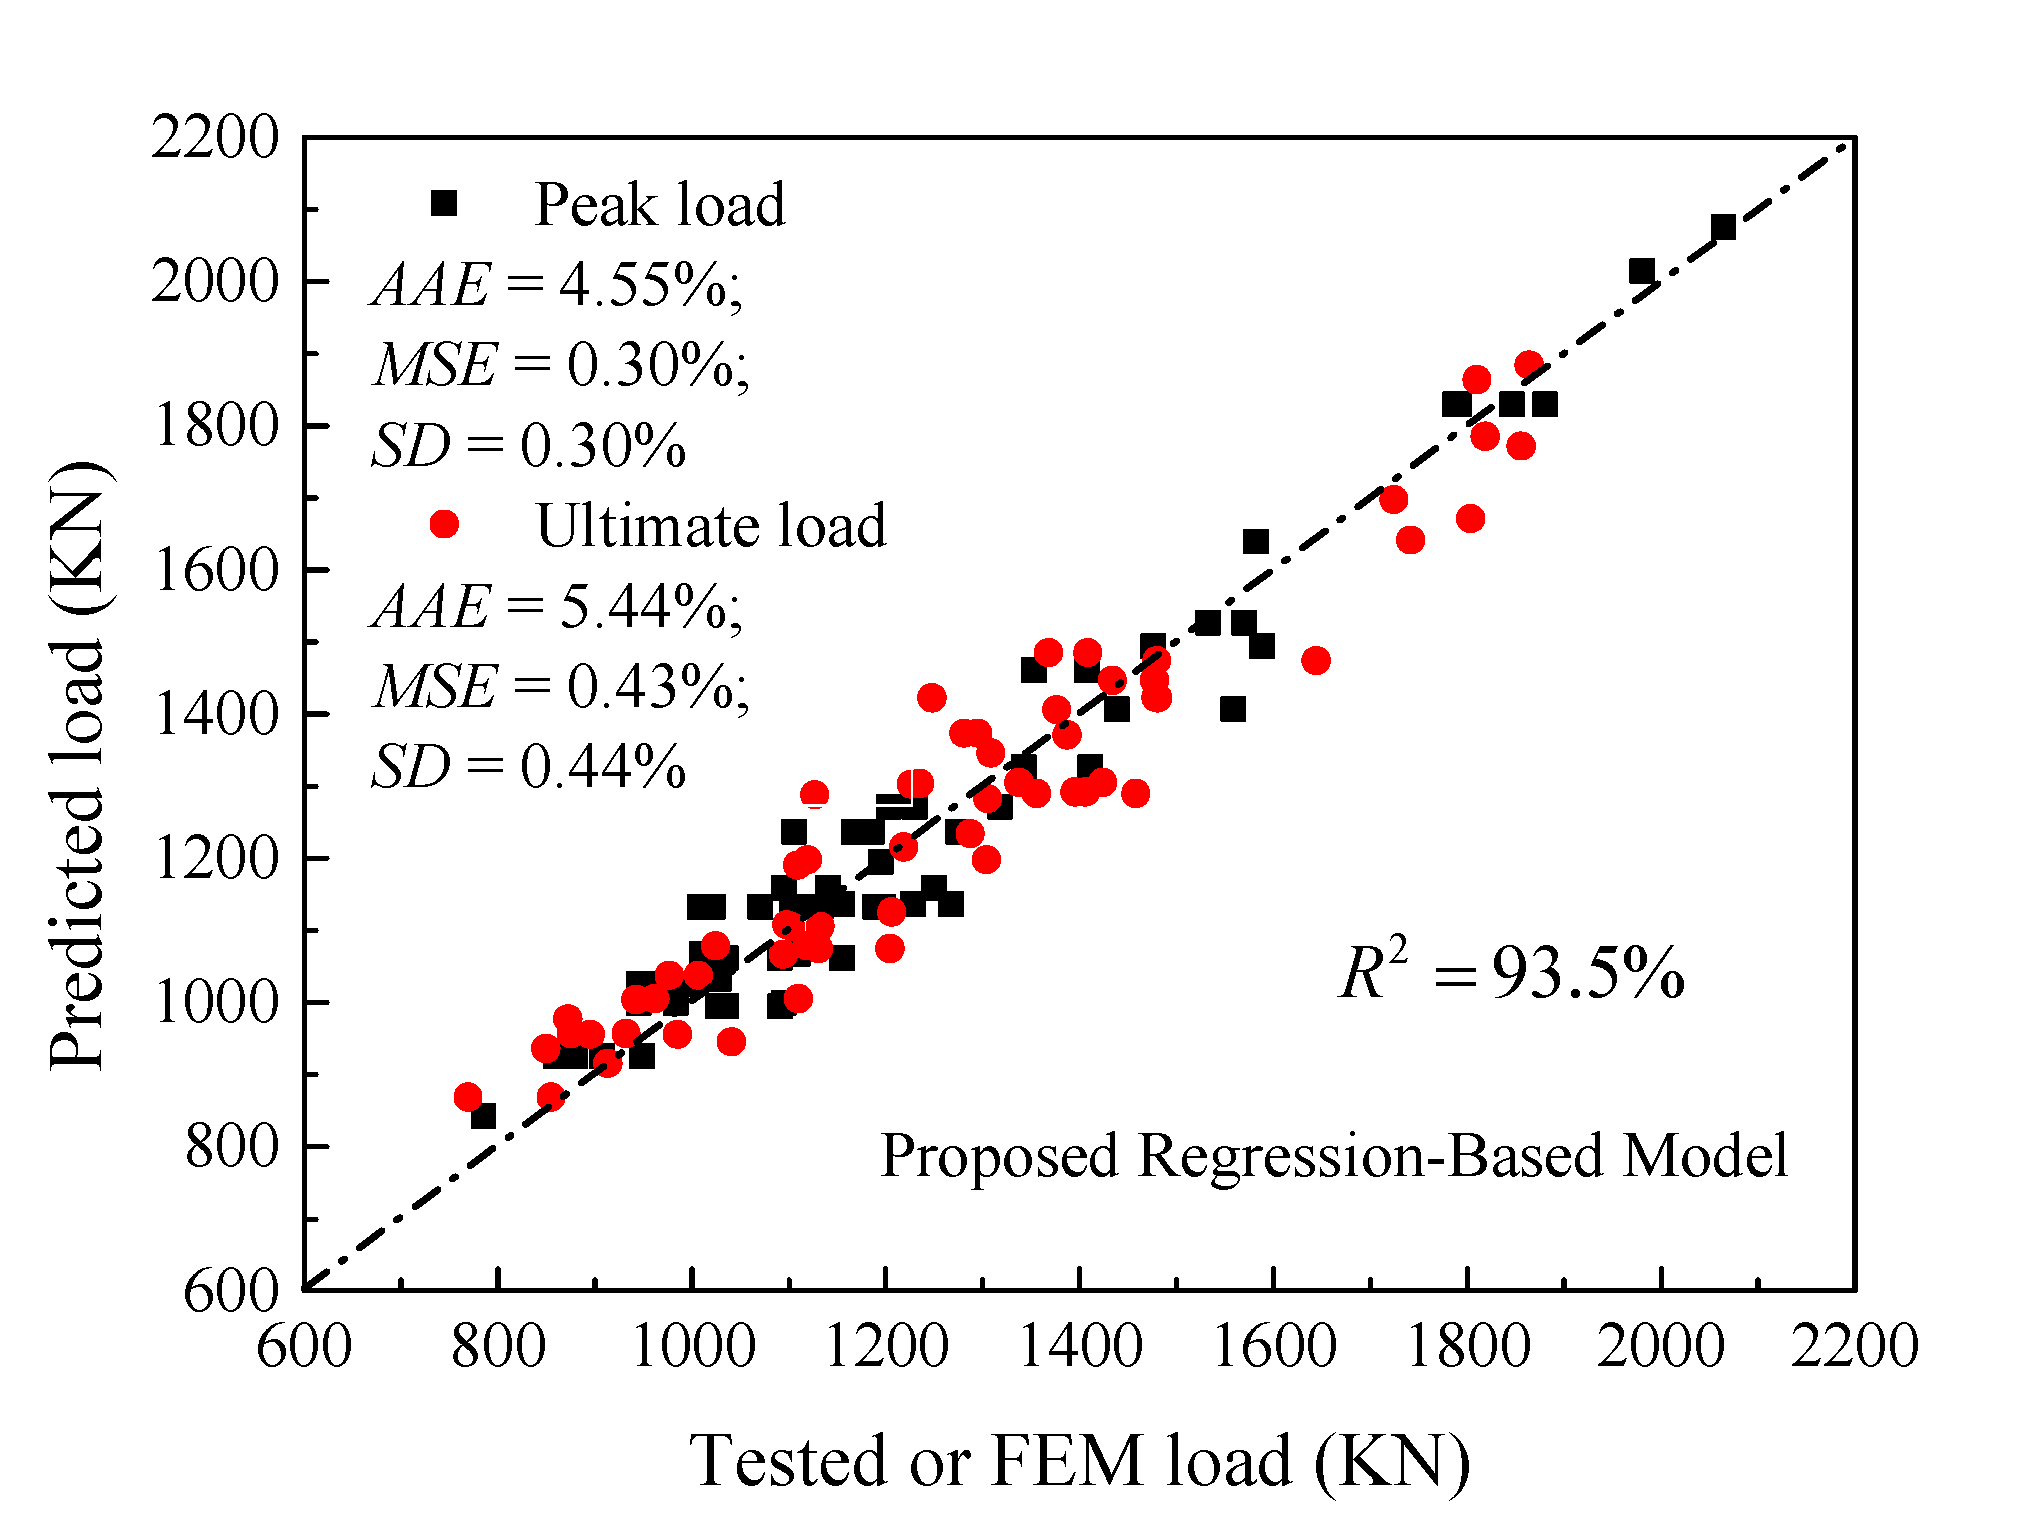
  • To estimate the maximum axial load capacity of GFRP-RC HCCs, the contribution of the reinforcement is necessary. The authors proposed a new model for predicting the peak axial load capacity of GFRP-RC HCCs based on a database of 60 FRP-reinforced columns with R2 = 0.95.
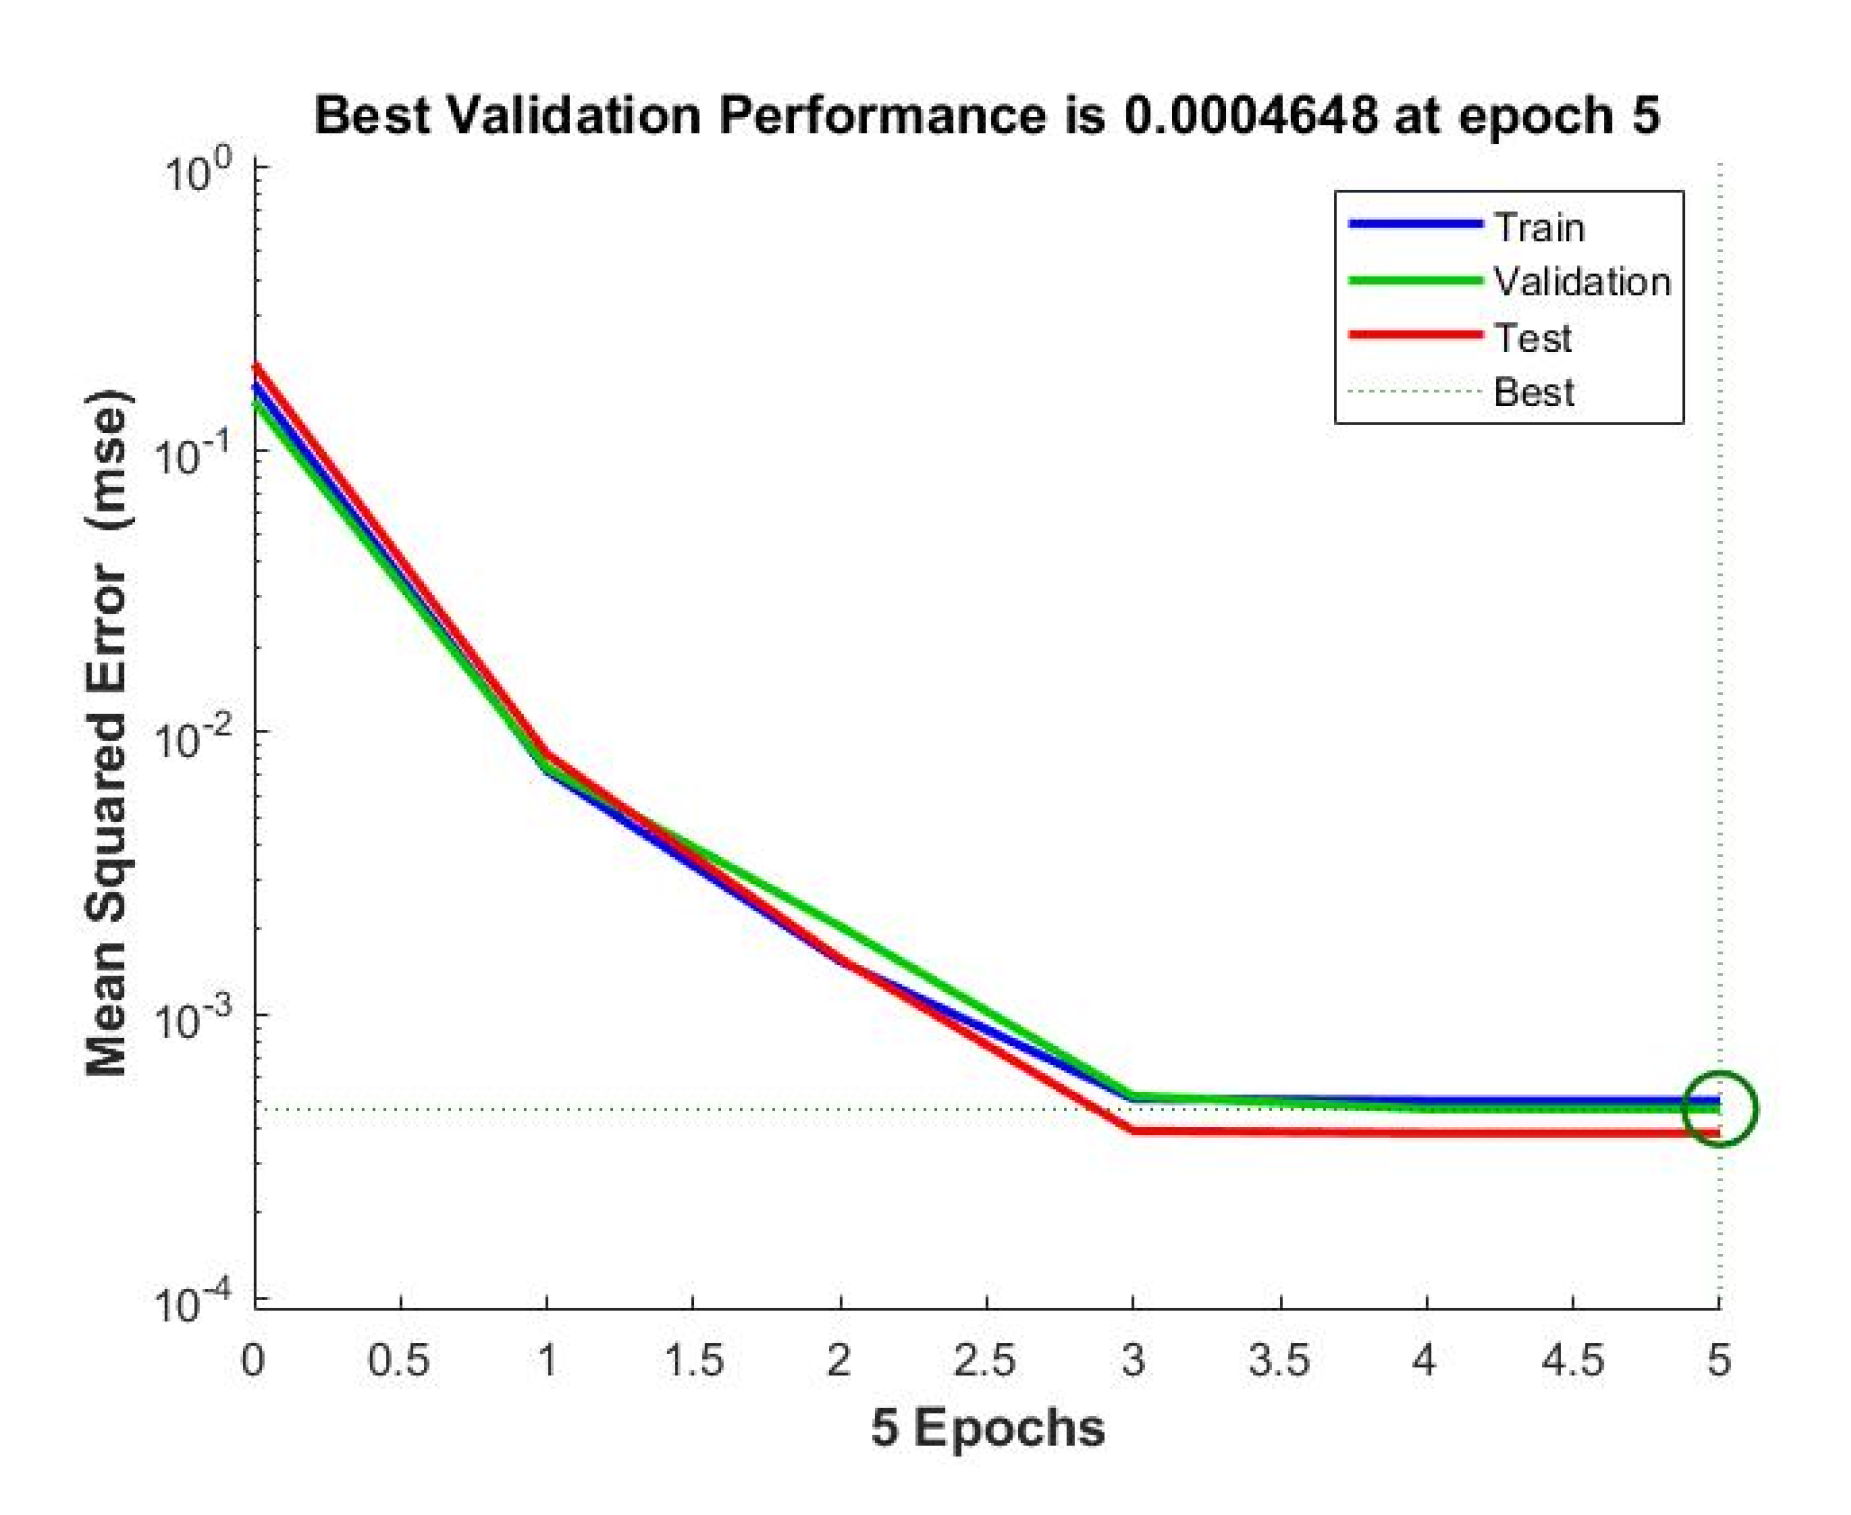
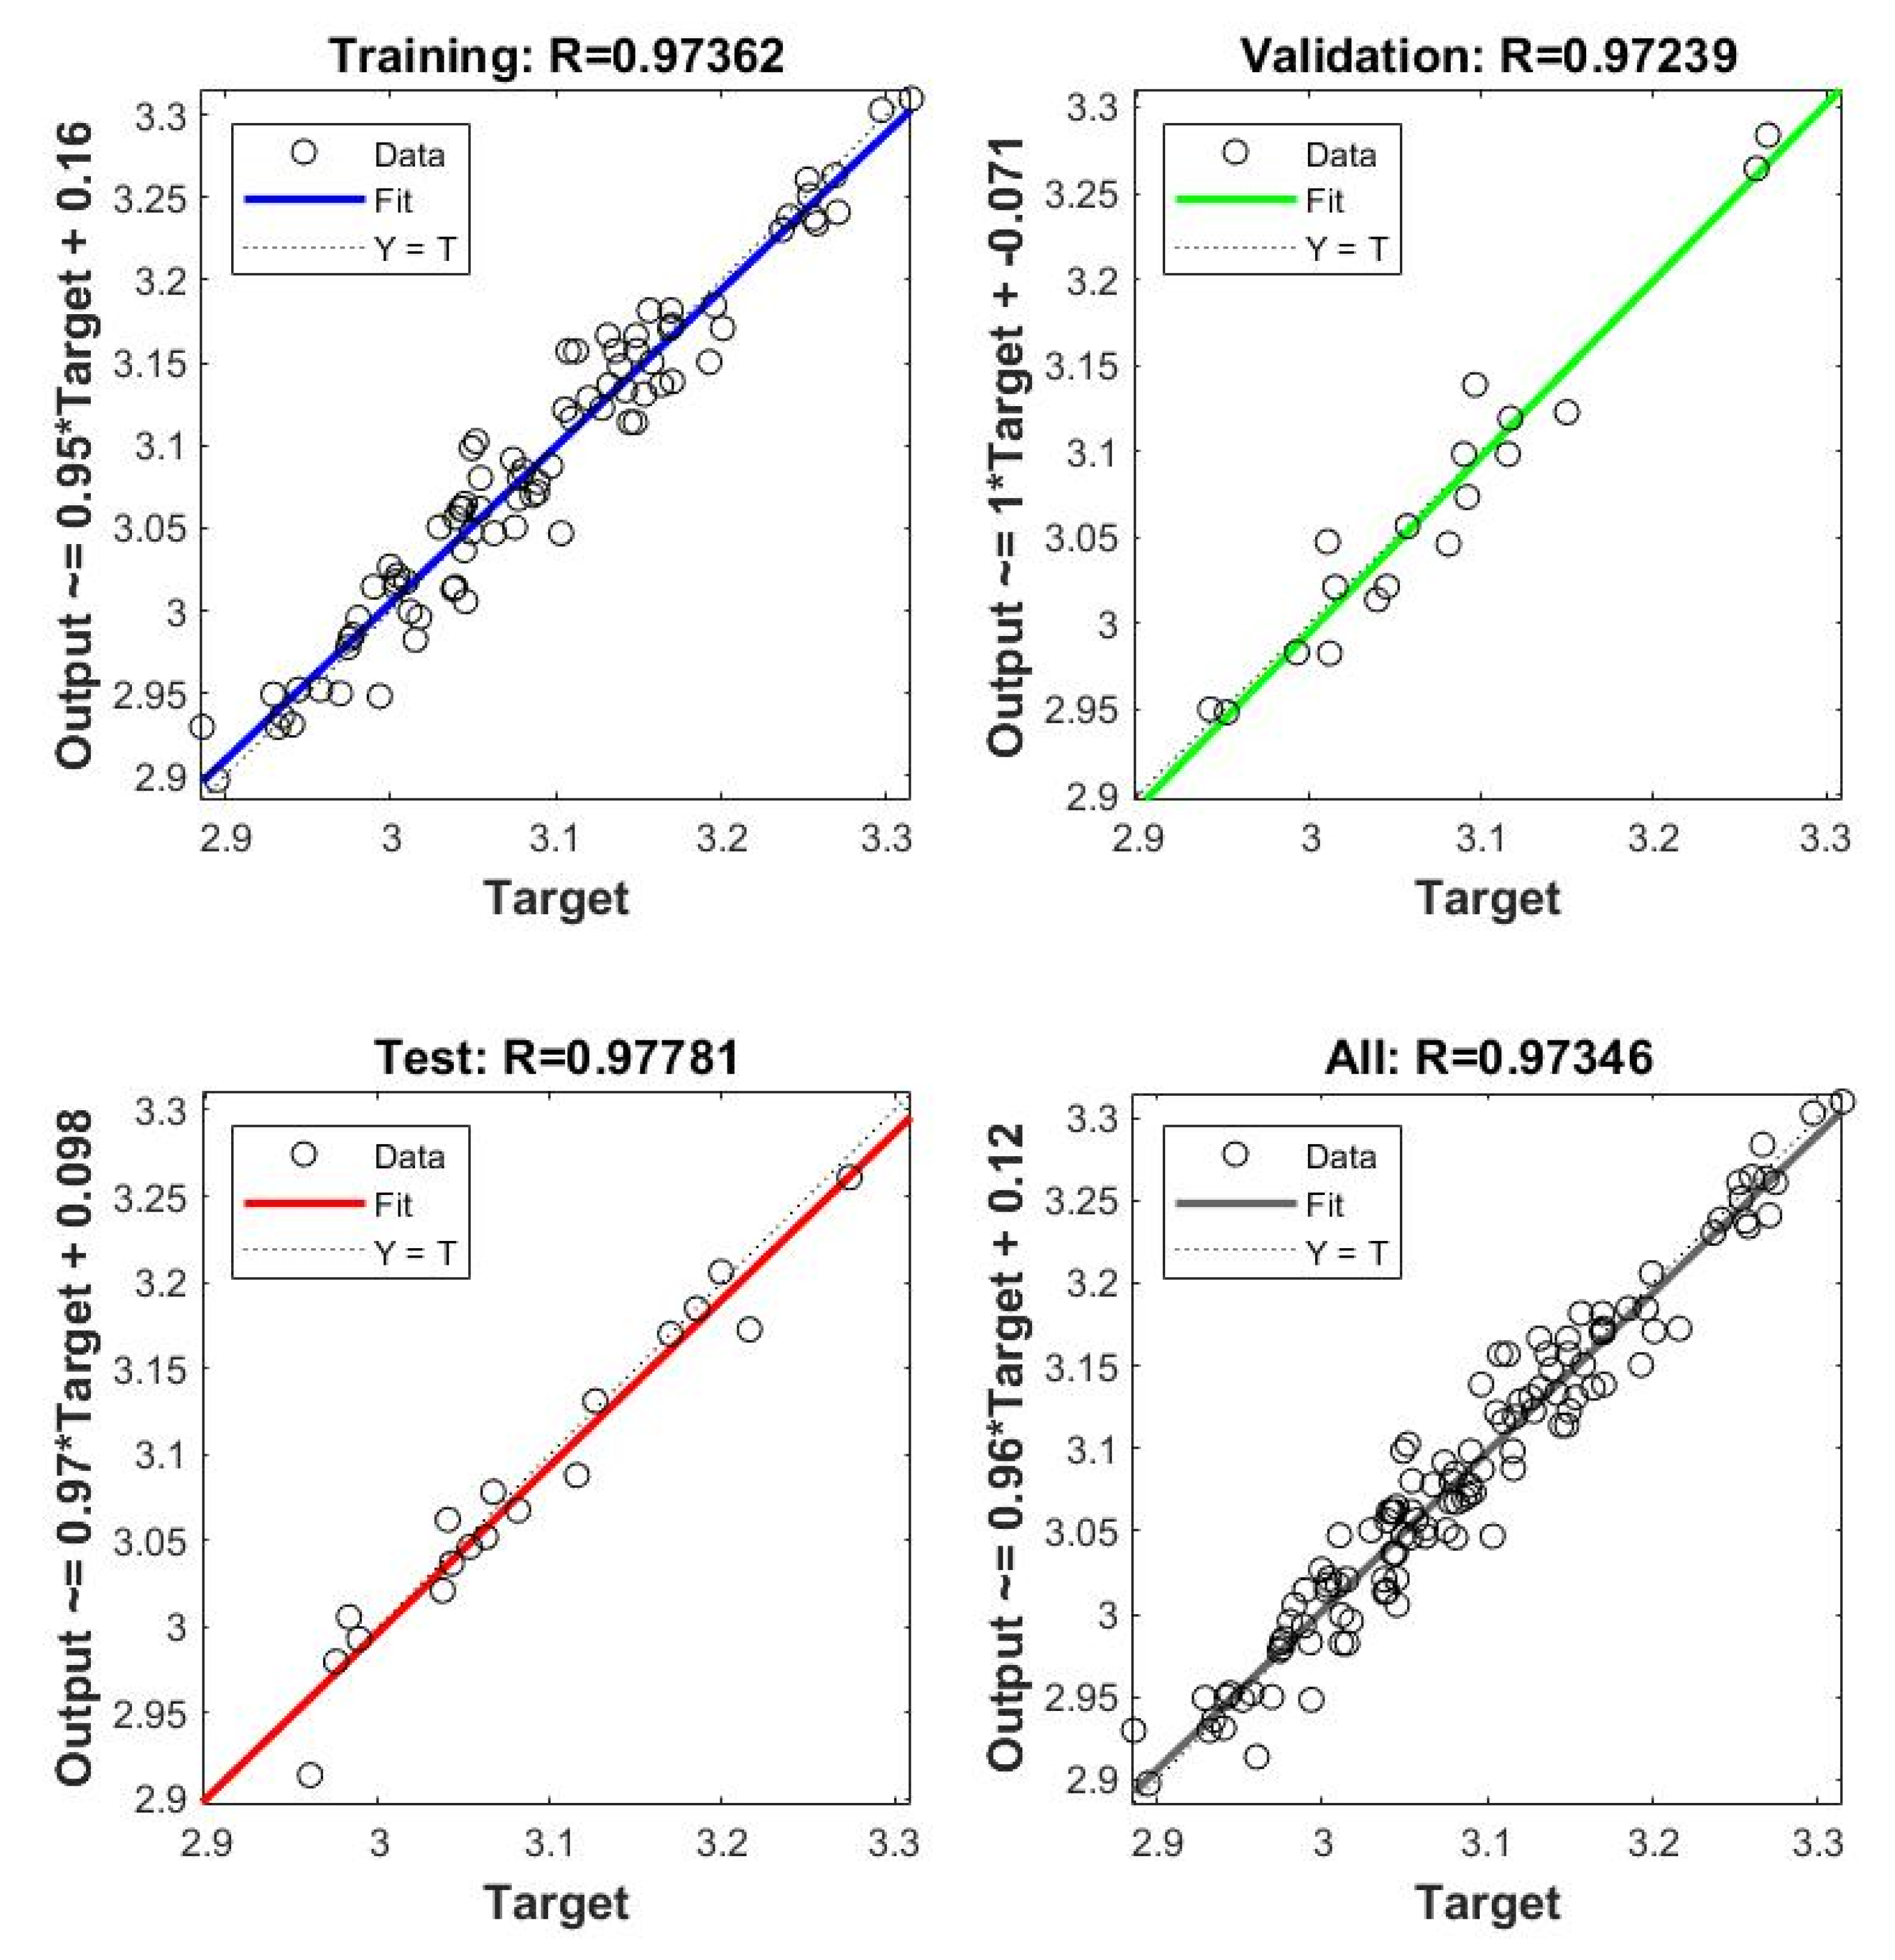
  • To capture the overall stress-strain response of FRP-reinforced columns, artificial neural network (ANN) models are proposed to estimate both the axial compressive loads at the first and second peak conditions. The effects of different amounts of longitudinal reinforcement, volumetric radios of GFRP confinement, inner-to-outer diameter ratios, and compressive strengths of the standard cylinder were all considered in the model. Besides, several RA (Regression Analytical) models to predict the different components of the axial strength and strains have been introduced and some of them are compared with the ANN models. For this purpose, the proposed ANN models have been successfully applied using transformed easy-to-use equations rather than using their complex computational models. The predicted results of the proposed analytical model agree well with the tested and numerically obtained results. They yield better results with marginal errors as compared with the existing analytical models.
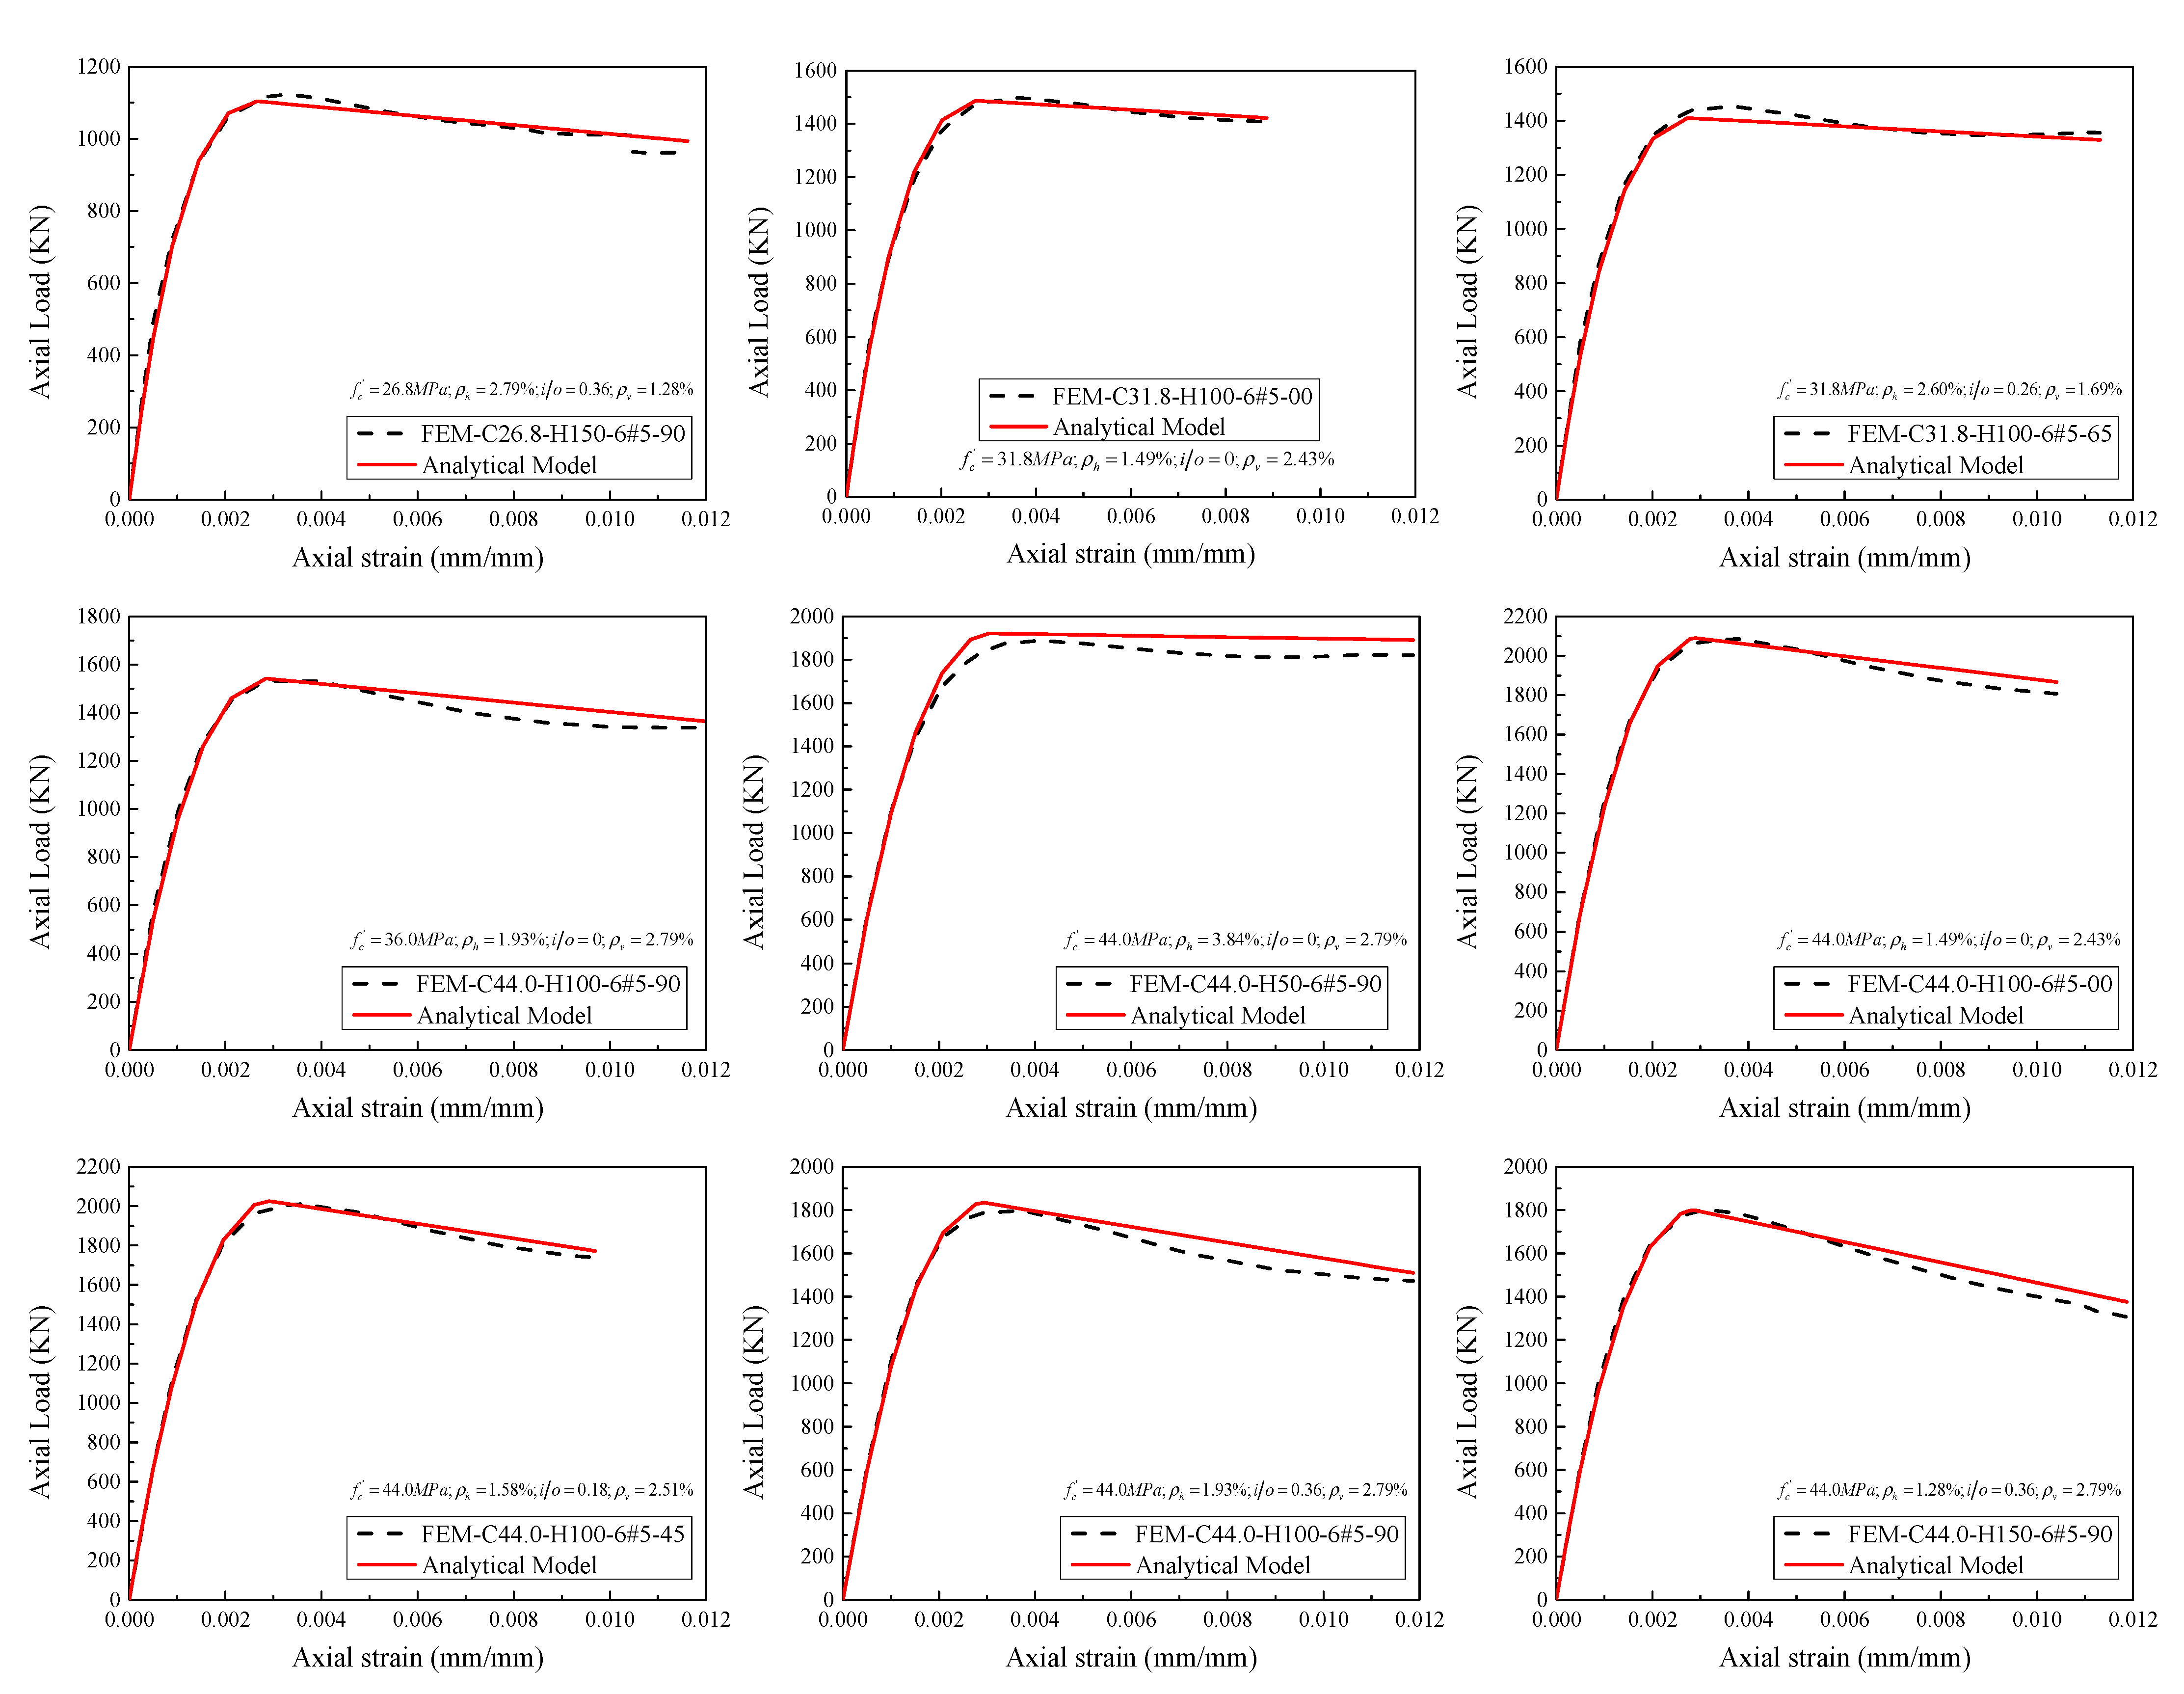
  • A design-oriented stress-strain model that can capture the softening and hardening behaviors of GFRP-reinforced HCCs was suggested. The model features and the test parameters appeared to be accurately considered when the experimental and analytical load-strain responses matched closely.
  • Based on parametric, experimental, and numerical data, the sufficiently confined concrete threshold of FRP-reinforced columns was proposed to be at least 0.66. This guarantees a safe and good design for HCCs resulting in a hardening behavior.

Author Contributions

Conceptualization, H.F.I.; Formal analysis, H.F.I.; Funding acquisition, H.F.I., B.A.T., M.A.M., W.S.A. and A.R.; Investigation, H.F.I., B.A.T., M.A.M., W.S.A. and A.R.; Project administration, H.F.I.; Resources, H.F.I., B.A.T., M.A.M., W.S.A. and A.R.; Software, H.F.I.; Writing—review and editing, H.F.I., B.A.T., M.A.M., W.S.A. and A.R. All authors have read and agreed to the published version of the manuscript.

Funding

This research received no external funding.

Institutional Review Board Statement

Not applicable.

Informed Consent Statement

Not applicable.

Data Availability Statement

The data presented in this study are available on request from the corresponding author.

Acknowledgments

The authors would like to appreciate the Shale Gas Research Group (SGRG) in UTP and Shale PRF project (cost center # 0153AB-A33) awarded to E. Padmanabhan for the support.

Conflicts of Interest

The authors declare no conflict of interest.

Abbreviations

Acconcrete section area (without taking into account the longitudinal GFRP bars) (Ag-AFRP) (mm2):
Accconcrete-core area (without taking into account the longitudinal GFRP bars) (Acore-AFRP) (mm2);
Acearea of the concrete core (mm2);
Aggross cross-sectional area of concrete column (mm2);
Acoreeffective core area denoted by the center-to-center spacing of the GFRP spirals (mm2);
AFRPthe total cross-sectional area of the vertical GFRP bars (mm2);
Ahthe cross-sectional area of GFRP spiral (mm2);
Didiameter of the inner hole (mm);
Dsdiameter of the GFRP spirals (center-to-center of spirals) (mm);
Ddiameter of the whole concrete column section (mm);
EFRPelastic modulus of the GFRP rebars (MPa);
fccompressive strength of concrete cylinder (MPa);
fccconfined concrete stress (MPa);
fc’’unconfined concrete strength considering size effects (MPa);
fllateral confining stress (MPa);
fleffective lateral confining stress (MPa);
fFRPultimate tensile strength of the GFRP reinforcements (MPa);
εFRPultimate tensile strain of the GFRP reinforcements (mm/mm);
kereduction factor regarding the vertical unconfined area between spirals (mm/mm);
Pn1peak load in the elastic region (kN);
Pn2peak load in the post-peak region (kN);
Pfload at column’s failure (kN);
scenter-to-center vertical spacing of spirals (mm);
sclear vertical spacing between spirals (mm);
α1influence factor for the concrete compressive strength;
ρeeffective longitudinal reinforcement ratio concerning the effective core area;
L.S.R.hoop confinement stiffness ratio;
ψdilation angle of concrete;
Kcthe shape factor of yielding surface;
Ecelastic modulus of unconfined concrete (MPa);
σcthe axial compressive stress of concrete (MPa);
εcinthe inelastic strain of concrete in compression (mm/mm);
εcplthe plastic strain of concrete in compression (mm/mm);
ftmaximum tensile strength of concrete (MPa);
dccompression damage parameter;
dttension damage parameter;
εc1peak strain of unconfined concrete (mm/mm);
εcc1peak strain of confined concrete (mm/mm);
d h diameter of GFRP spiral (mm);
εcuultimate strain of unconfined concrete (mm/mm);
εccuultimate strain of confined concrete (mm/mm);
fbenttensile strength of the bent GFRP bars ACI (2015) (MPa);
εc1axial strain of concrete (mm/mm);
εocelelastic strain of compressed unconfined concrete (mm/mm);
εotelelastic tensile strain of unconfined concrete (mm/mm);
εcrcrack strain of unconfined concrete (mm/mm);
ρvratio of GFRP spirals.

References

  1. Hasan, H.A.; Karim, A.; Sheikh, M.N.; Hadi, M.N.S. Moment-curvature behavior of glass fiber-reinforced polymer bar-reinforced normal-strength concrete and high-strength concrete columns. ACI Struct. J. 2019, 116, 65–75. [Google Scholar] [CrossRef]
  2. Hadi, M.N.S.; Youssef, J. Experimental Investigation of GFRP-Reinforced and GFRP-Encased Square Concrete Specimens under Axial and Eccentric Load, and Four-Point Bending Test. J. Compos. Constr. 2016, 20, 04016020. [Google Scholar] [CrossRef] [Green Version]
  3. Tobbi, H.; Farghaly, A.S.; Benmokrane, B. Concrete columns reinforced longitudinally and transversally with glass fiber-reinforced polymer bars. ACI Struct. J. 2012, 109, 551–558. [Google Scholar]
  4. Afifi, M.Z.; Mohamed, H.M.; Benmokrane, B. Axial capacity of circular concrete columns reinforced with GFRP bars and spirals. J. Compos. Constr. 2014, 18, 04013017. [Google Scholar] [CrossRef]
  5. AlAjarmeh, O.S.; Manalo, A.C.; Benmokrane, B.; Karunasena, W.; Mendis, P. Axial performance of hollow concrete columns reinforced with GFRP composite bars with different reinforcement ratios. Compos. Struct. 2019, 213, 153–164. [Google Scholar] [CrossRef]
  6. AlAjarmeh, O.; Manalo, A.; Benmokrane, B.; Karunasena, W.; Mendis, P.; Nguyen, Q.T. Compressive behavior of axially loaded circular hollow concrete columns reinforced with GFRP bars and spirals. Constr. Build. Mater. 2018, 194, 12–23. [Google Scholar] [CrossRef]
  7. AlAjarmeh, O.S.; Manalo, A.C.; Benmokrane, B.; Karunasena, W.; Mendis, P. Effect of Spiral Spacing and Concrete Strength on Behavior of GFRP-Reinforced Hollow Concrete Columns. J. Compos. Constr. 2020, 24, 04019054. [Google Scholar] [CrossRef]
  8. Karim, H.; Sheikh, M.N.; Hadi, M.N. Axial load-axial deformation behaviour of circular concrete columns reinforced with GFRP bars and helices. Constr. Build. Mater. 2016, 112, 1147–1157. [Google Scholar] [CrossRef] [Green Version]
  9. Hadi, M.N.S.; Ali, S.; Sheikh, M.N. Experimental Study of GFRP-Reinforced Geopolymer Concrete Columns under Different Loading Conditions. J. Compos. Constr. 2021, 25, 04021052. [Google Scholar] [CrossRef]
  10. Hadhood, A.; Mohamed, H.M.; Benmokrane, B. Experimental Study of Circular High-Strength Concrete Columns Reinforced with GFRP Bars and Spirals under Concentric and Eccentric Loading. J. Compos. Constr. 2017, 21, 04016078. [Google Scholar] [CrossRef]
  11. Hadhood, A.; Mohamed, H.M.; Ghrib, F.; Benmokrane, B. Efficiency of glass-fiber reinforced-polymer (GFRP) discrete hoops and bars in concrete columns under combined axial and flexural loads. Compos. Part B Eng. 2017, 114, 223–236. [Google Scholar] [CrossRef]
  12. Hasan, H.A.; Sheikh, M.N.; Hadi, M.N. Performance evaluation of high strength concrete and steel fibre high strength concrete columns reinforced with GFRP bars and helices. Constr. Build. Mater. 2017, 134, 297–310. [Google Scholar] [CrossRef] [Green Version]
  13. Youssef, J.; Hadi, M.N. Axial load-bending moment diagrams of GFRP reinforced columns and GFRP encased square columns. Constr. Build. Mater. 2017, 135, 550–564. [Google Scholar] [CrossRef] [Green Version]
  14. Salah-Eldin, A.; Mohamed, H.M.; Benmokrane, B. Structural performance of high-strength-concrete columns reinforced with GFRP bars and ties subjected to eccentric loads. Eng. Struct. 2019, 185, 286–300. [Google Scholar] [CrossRef]
  15. Lignola, G.P.; Prota, A.; Manfredi, G.; Cosenza, E. Experimental Performance of RC Hollow Columns Confined with CFRP. J. Compos. Constr. 2007, 11, 42–49. [Google Scholar] [CrossRef]
  16. Kusumawardaningsih, Y.; Hadi, M. Comparative behaviour of hollow columns confined with FRP composites. Compos. Struct. 2010, 93, 198–205. [Google Scholar] [CrossRef]
  17. Hsu, H.L.; Liang, L.L. Performance of hollow composite members subjected to cyclic eccentric loading. Earthq. Eng. Struct. Dyn. 2003, 32, 443–461. [Google Scholar] [CrossRef]
  18. Lee, J.-H.; Choi, J.-H.; Hwang, D.-K.; Kwahk, I.-J. Seismic performance of circular hollow RC bridge columns. KSCE J. Civ. Eng. 2014, 19, 1456–1467. [Google Scholar] [CrossRef]
  19. Mo, Y.; Wong, D.C.; Maekawa, K. Seismic Performance of Hollow Bridge Columns. ACI Struct. J. 2003, 100, 337–348. [Google Scholar] [CrossRef]
  20. Zahn, F.; Park, R.; Priestley, M. Flexural strength and ductility of circular hollow reinforced concrete columns without confinement on inside face. Struct. J. 1990, 87, 156–166. [Google Scholar]
  21. Liang, X.; Beck, R.; Sritharan, S. Understanding the Confined Concrete Behavior on the Response of Hollow Bridge Columns; A Final Report to the California Department of Transportation; Department of Civil, Construction and Environmental Engineering Iowa State University: Ames, IA, USA, 2005. [Google Scholar]
  22. Hoshikuma, J.; Priestley, M.J.N. Flexural Behavior of Circular Hollow Columns with a Single Layer of Reinforcement under Seismic Loading; Technical Report SSRP 2000/13; University of California: San Diego, CA, USA, November 2000. [Google Scholar]
  23. Paolino, C. Seismic Performance of Existing Hollow Reinforced Concrete Bridge Columns. Ph.D. Thesis, University of Naples Federico II, Naples, Italy, April 2017. [Google Scholar]
  24. Yeh, Y.; Mo, Y.L.; Yang, C.Y. Seismic performance of hollow circular bridge piers. Struct. J. 2001, 98, 862–871. [Google Scholar]
  25. Yeh, Y.-K.; Mo, Y.L.; Yang, C.Y. Seismic Performance of Rectangular Hollow Bridge Columns. J. Struct. Eng. 2002, 128, 60–68. [Google Scholar] [CrossRef]
  26. Pavese, A.; Bolognini, D.; Peloso, S. Frp Seismic Retrofit of Rc Square Hollow Section Bridge Piers. J. Earthq. Eng. 2004, 8, 225–250. [Google Scholar] [CrossRef]
  27. Osada, K.; Yamaguchi, T.; Ikeda, S. Seismic Performance and the Strengthening of Hollow Circular RC Piers Having Reinforcement Cut-off Planes and Variable Wall Thickness. Concr. Res. Technol. 1999, 10, 13–24. [Google Scholar] [CrossRef]
  28. Pinto, A.V.; Molina, J.; Tsionis, G. Cyclic tests on large-scale models of existing bridge piers with rectangular hollow cross-section. Earthq. Eng. Struct. Dyn. 2003, 32, 1995–2012. [Google Scholar] [CrossRef]
  29. Cassese, P.; De Risi, M.T.; Verderame, G.M. A degrading shear strength model for R.C. columns with hollow circular cross-section. Int. J. Civ. Eng. 2018, 17, 1241–1259. [Google Scholar] [CrossRef]
  30. Turmo, J.; Ramos, G.; Aparicio, A. Shear truss analogy for concrete members of solid and hollow circular cross section. Eng. Struct. 2009, 31, 455–465. [Google Scholar] [CrossRef]
  31. Hadi, M.; Le, T. Behaviour of hollow core square reinforced concrete columns wrapped with CFRP with different fibre orientations. Constr. Build. Mater. 2013, 50, 62–73. [Google Scholar] [CrossRef] [Green Version]
  32. Yazici, V. Strengthening hollow reinforced concrete columns with fibre reinforced polymers. CI Struct. J. 2001, 98, 395–406. [Google Scholar]
  33. Bing, L.; Park, R.; Tanaka, H. Stress-strain behavior of high-strength concrete confined by ultra-high- and normal-strength transverse reinforcement. ACI Struct. J. 2001, 98, 395–406. [Google Scholar]
  34. Bousalem, B.; Chikh, N. Development of a confined model for rectangular ordinary reinforced concrete columns. Mater. Struct. 2006, 40, 605–613. [Google Scholar] [CrossRef]
  35. Chung, H.-S.; Yang, K.-H.; Lee, Y.-H.; Eun, H.-C. Stress–strain curve of laterally confined concrete. Eng. Struct. 2002, 24, 1153–1163. [Google Scholar] [CrossRef]
  36. Valipour, H.R.; Foster, S.J. Nonlinear static and cyclic analysis of concrete-filled steel columns. J. Constr. Steel Res. 2010, 66, 793–802. [Google Scholar] [CrossRef]
  37. Konstantinidis, D.; Kappos, A.; Izzuddin, B.A. Analytical Stress–Strain Model for High-Strength Concrete Members under Cyclic Loading. J. Struct. Eng. 2007, 133, 484–494. [Google Scholar] [CrossRef]
  38. Mazzoni, S.; McKenna, F.; Fenves, G.L. Open System for Earthquake Engineering Simulations User Manual; PEER, Univ. of California: Berkeley, CA, USA, 2003. [Google Scholar]
  39. Chen, R.P.; Ma, Q.L.; Zhang, Y.; Wu, H.N.; Liu, Y.; Lu, L. Experimental study on the mechanical behaviour of eccentric compression short column strengthened by ultra-high-performance fibre-reinforced concrete. Structures 2021, 33, 508–522. [Google Scholar] [CrossRef]
  40. Turvey, G.; Zhang, Y. A computational and experimental analysis of the buckling, postbuckling and initial failure of pultruded GRP columns. Comput. Struct. 2006, 84, 1527–1537. [Google Scholar] [CrossRef]
  41. Elchalakani, M.; Karrech, A.; Dong, M.; Ali, M.S.M.; Yang, B. Experiments and finite element analysis of GFRP reinforced geopolymer concrete rectangular columns subjected to concentric and eccentric axial loading. Structures 2018, 14, 273–289. [Google Scholar] [CrossRef]
  42. Ibrahim, A.M.; Fahmy, M.F.; Wu, Z. 3D finite element modeling of bond-controlled behavior of steel and basalt FRP-reinforced concrete square bridge columns under lateral loading. Compos. Struct. 2016, 143, 33–52. [Google Scholar] [CrossRef]
  43. Chellapandian, M.; Prakash, S.; Rajagopal, A. Analytical and finite element studies on hybrid FRP strengthened RC column elements under axial and eccentric compression. Compos. Struct. 2018, 184, 234–248. [Google Scholar] [CrossRef]
  44. Piscesa, B.; Attard, M.M.; Samani, A.K. 3D Finite element modeling of circular reinforced concrete columns confined with FRP using a plasticity based formulation. Compos. Struct. 2018, 194, 478–493. [Google Scholar] [CrossRef]
  45. Hany, N.; Hantouche, E.G.; Harajli, M.H. Finite element modeling of FRP-confined concrete using modified concrete damaged plasticity. Eng. Struct. 2016, 125, 1–14. [Google Scholar] [CrossRef]
  46. Dong, M.; Lokuge, W.; Elchalakani, M.; Karrech, A. Modelling glass fibre-reinforced polymer reinforced geopolymer concrete columns. Structures 2019, 20, 813–821. [Google Scholar] [CrossRef]
  47. Shi, Y.; Swait, T.; Soutis, C. Modelling damage evolution in composite laminates subjected to low velocity impact. Compos. Struct. 2012, 94, 2902–2913. [Google Scholar] [CrossRef]
  48. Matthews, F.L.; Davies, G.; Hitchings, D.; Soutis, C. Finite Element Modelling of Composite Materials and Structures; Elsevier: Amsterdam, The Netherlands, 2000. [Google Scholar]
  49. Abaqus Unified FEA, Complete Solutions for Realistic Simulation. Available online: http://www.3ds.com/products-services/simulia/products/abaqus/ (accessed on 12 January 2021).
  50. Google ScholarRaza, A.; Ali, B.; Masood, B.; Rehman, A.U. Axial performance of GFRP composite bars and spirals in circular hollow concrete columns. Structures 2020, 29, 600–613. [Google Scholar] [CrossRef]
  51. Oreta, A.W.C.; Kawashima, K. Neural network modeling of confined compressive strength and strain of circular concrete columns. J. Struct Eng. 2003, 129, 554–561. [Google Scholar] [CrossRef]
  52. Cascardi, A.; Micelli, F.; Aiello, M.A. An Artificial Neural Networks model for the prediction of the compressive strength of FRP-confined concrete circular columns. Eng. Struct. 2017, 140, 199–208. [Google Scholar] [CrossRef]
  53. Mansouri, I.; Ozbakkaloglu, T.; Kisi, O.; Xie, T. Predicting behavior of FRP-confined concrete using neuro fuzzy, neural network, multivariate adaptive regression splines and M5 model tree techniques. Mater. Struct. 2016, 49, 4319–4334. [Google Scholar] [CrossRef]
  54. Mansouri, I.; Kisi, O.; Sadeghian, P.; Lee, C.-H.; Hu, J.W. Prediction of Ultimate Strain and Strength of FRP-Confined Concrete Cylinders Using Soft Computing Methods. Appl. Sci. 2017, 7, 751. [Google Scholar] [CrossRef] [Green Version]
  55. Ghanem, S.Y.; Elgazzar, H. Predicting the behavior of reinforced concrete columns confined by fiber reinforced polymers using data mining techniques. SN Appl. Sci. 2021, 3, 170. [Google Scholar] [CrossRef]
  56. Lim, J.C.; Karakus, M.; Ozbakkaloglu, T. Evaluation of ultimate conditions of FRP-confined concrete columns using genetic programming. Comput. Struct. 2016, 162, 28–37. [Google Scholar] [CrossRef]
  57. Fam, A.Z.; Rizkalla, S.H. Confinement model for axially loaded concrete confined by circular fiber reinforced polymer tubes. Struct. J. 2001, 98, 451–461. [Google Scholar]
  58. Micelli, F.; Modarelli, R. Experimental and analytical study on properties affecting the behaviour of FRP-confined concrete. Compos. Part B Eng. 2013, 45, 1420–1431. [Google Scholar] [CrossRef]
  59. ACI. Guide for the Design and Construction of Structural Concrete Reinforced with Fiber-Reinforced Polymer (FRP) Bars; ACI: Farmington Hills, MI, USA, 2015. [Google Scholar]
  60. CSA S806–12. Design and Construction of Building Components with Fiber-Reinforced Polymers; Canadian Standards Association: Mississauga, ON, Canada, 2012. [Google Scholar]
  61. FIB. FRP Reinforcement in RC Structures; Technical Report; International Federation for Structural Concrete: Lausanne, Switzerland, September 2007. [Google Scholar] [CrossRef]
  62. ACI 318-14. Building Code Requirements for Structural Concrete and Commentary. ACI: Farmington Hills, MI, USA, 2014. [Google Scholar]
  63. Hadhood, A.; Mohamed, H.M.; Benmokrane, B. Axial Load–Moment Interaction Diagram of Circular Concrete Columns Reinforced with CFRP Bars and Spirals: Experimental and Theoretical Investigations. J. Compos. Constr. 2017, 21, 04016092. [Google Scholar] [CrossRef]
  64. Hadhood, A.; Mohamed, H.M.; Benmokrane, B. Strength of circular HSC columns reinforced internally with carbon-fiber-reinforced polymer bars under axial and eccentric loads. Constr. Build. Mater. 2017, 141, 366–378. [Google Scholar] [CrossRef]
  65. Afifi, M.Z.; Mohamed, H.M.; Benmokrane, B. Strength and Axial Behavior of Circular Concrete Columns Reinforced with CFRP Bars and Spirals. J. Compos. Constr. 2014, 18, 04013035. [Google Scholar] [CrossRef]
  66. Mohamed, H.M.; Afifi, M.Z.; Benmokrane, B. Performance Evaluation of Concrete Columns Reinforced Longitudinally with FRP Bars and Confined with FRP Hoops and Spirals under Axial Load. J. Bridg. Eng. 2014, 19, 04014020. [Google Scholar] [CrossRef]
  67. Maranan, G.; Manalo, A.; Benmokrane, B.; Karunasena, W.; Mendis, P. Behavior of concentrically loaded geopolymer-concrete circular columns reinforced longitudinally and transversely with GFRP bars. Eng. Struct. 2016, 117, 422–436. [Google Scholar] [CrossRef]
  68. Xue, W.; Peng, F.; Fang, Z. Behavior and design of slender rectangular concrete columns longitudinally reinforced with fibre-reinforced polymer bars. ACI Struct. J. 2018, 115, 311–322. [Google Scholar] [CrossRef]
  69. Choo, C.C.; Harik, I.E.; Gesund, H. Strength of rectangular concrete columns reinforced with fiber-reinforced polymer bars. ACI Struct. J. 2006, 103, 452. [Google Scholar]
  70. Elmessalami, N.; El Refai, A.; Abed, F. Fiber-reinforced polymers bars for compression reinforcement: A promising alternative to steel bars. Constr. Build. Mater. 2019, 209, 725–737. [Google Scholar] [CrossRef]
  71. Raza, A.; Khan, Q.U.Z.; Ahmad, A. Numerical Investigation of Load-Carrying Capacity of GFRP-Reinforced Rectangular Concrete Members Using CDP Model in ABAQUS. Adv. Civ. Eng. 2019, 2019, 1745341. [Google Scholar] [CrossRef] [Green Version]
  72. ACI 363. State-of-the-Art Report on High-Strength Concrete (ACI 363R-92). ACI J. Proc. 1984, 81, 364–411. [Google Scholar]
  73. Hassan, A.; Arif, M.; Shariq, M. Use of geopolymer concrete for a cleaner and sustainable environment-A review of mechanical properties and microstructure. J. Clean. Prod. 2019, 223, 704–728. [Google Scholar] [CrossRef]
  74. Prakash, S.; Belarbi, A.; You, Y.-M. Seismic performance of circular RC columns subjected to axial force, bending, and torsion with low and moderate shear. Eng. Struct. 2010, 32, 46–59. [Google Scholar] [CrossRef]
  75. Alfarah, B.; L´opez-Almansa, F.; Oller, S. New methodology for calculating damage variables evolution in Plastic Damage Model for RC structures. Eng. Struct. 2017, 132, 70–86. [Google Scholar] [CrossRef] [Green Version]
  76. Youssf, O.; ElGawady, M.; Mills, J.; Ma, X. Finite element modelling and dilation of FRP-confined concrete columns. Eng. Struct. 2014, 79, 70–85. [Google Scholar] [CrossRef]
  77. Papanikolaou, V.K.; Kappos, A. Confinement-sensitive plasticity constitutive model for concrete in triaxial compression. Int. J. Solids Struct. 2007, 44, 7021–7048. [Google Scholar] [CrossRef] [Green Version]
  78. Desayi, P.; Krishnan, S. Equation for the stress-strain curve of concrete. J. Proc. 1964, 61, 345–350. [Google Scholar]
  79. Zeng, X. Finite element modelling and analysis of concrete confined by stirrups in square RC columns. Civil. Eng. J. 2016, 17, 1–11. [Google Scholar] [CrossRef]
  80. Majewski, S. The Mechanics of Structural Concrete in Terms of Elasto-Plasticity; Publishing House of Silesian University of Technology: Gliwice, Poland, 2003. [Google Scholar]
  81. Kmiecik, P.; Kamiński, M. Modelling of reinforced concrete structures and composite structures with concrete strength degradation taken into consideration. Arch. Civ. Mech. Eng. 2011, 11, 623–636. [Google Scholar] [CrossRef]
  82. Hsu, L.S.; Hsu, C.-T.T. Complete stress—Strain behaviour of high-strength concrete under compression. Mag. Concr. Res. 1994, 46, 301–312. [Google Scholar] [CrossRef]
  83. International Code Council. Concrete Manual Based on the 2015 IBC & And ACI 318–14. Available online: https://shop.iccsafe.org/media/wysiwyg/material/9090S15-TOC.pdf (accessed on 4 October 2015).
  84. Aslani, F.; Jowkarmeimandi, R. Stress–strain model for concrete under cyclic loading. Mag. Concr. Res. 2012, 64, 673–685. [Google Scholar] [CrossRef] [Green Version]
  85. Hu, H.-T.; Huang, C.-S.; Wu, M.-H.; Wu, Y.-M. Nonlinear Analysis of Axially Loaded Concrete-Filled Tube Columns with Confinement Effect. J. Struct. Eng. 2003, 129, 1322–1329. [Google Scholar] [CrossRef]
  86. Isleem, H.F.; Wang, Z.; Wang, D.; Smith, S.T. Monotonic and Cyclic Axial Compressive Behavior of CFRP-Confined Rectangular RC Columns. J. Compos. Constr. 2018, 22, 04018023. [Google Scholar] [CrossRef]
  87. Isleem, H.F.; Wang, D.Y.; Wang, Z.Y. Modeling the axial compressive stress-strain behavior of CFRP-confined rectangular RC columns under monotonic and cyclic loading. Compos. Struct. 2018, 185, 229–240. [Google Scholar] [CrossRef]
  88. Isleem, H.F.; Wang, D.; Wang, Z. Axial stress–strain model for square concrete columns internally confined with GFRP hoops. Mag. Concr. Res. 2018, 70, 1064–1079. [Google Scholar] [CrossRef]
  89. Isleem, H.F.; Wang, D.Y.; Wang, Z.Y. A new numerical model for polymer-confined rectangular concrete columns. Proc. Inst. Civil. Eng. (ICE) Struct. Build. 2019, 172, 528–544. [Google Scholar] [CrossRef]
  90. Wang, Z.; Wang, D.; Smith, S.T.; Lu, D. CFRP-Confined Square RC Columns. II: Cyclic Axial Compression Stress-Strain Model. J. Compos. Constr. 2012, 16, 161–170. [Google Scholar] [CrossRef]
  91. Isleem, H.F.; Wang, Z.; Wang, D. A new model for reinforced concrete columns strengthened with fibre-reinforced polymer. Proc. Inst. Civ. Eng.-Struct. Build. 2020, 173, 602–622. [Google Scholar] [CrossRef]
  92. Mander, J.B.; Priestley, M.J.N.; Park, R. Theoretical Stress-Strain Model for Confined Concrete. J. Struct. Eng. 1988, 114, 1804–1826. [Google Scholar] [CrossRef] [Green Version]
  93. Isleem, H.F.; Tahir, M.; Wang, Z. Axial stress–strain model developed for rectangular RC columns confined with FRP wraps and anchors. Structures 2020, 23, 779–788. [Google Scholar] [CrossRef]
  94. Tahir, M.; Isleem, H.F.; Wang, Z. Axial compressive stress–strain model for hybrid-reinforced concrete columns with FRP ties. Proc. Inst. Civ. Eng.-Struct. Build. 2021, 1–15. [Google Scholar] [CrossRef]
  95. Wang, Z.Y.; Wang, D.Y.; Smith, S.T.; Lu, D.G. CFRP-confined square RC columns. I: Experimental investigation. J. Compos. Constr. 2012, 16, 150–160. [Google Scholar] [CrossRef]
  96. Wang, Z.; Isleem, H.F. A Stress-Strain Model Considering Bilinear and PostPeak Softening Behaviors for FRP-Confined RC Columns. Indian J. Sci. Technol. 2019, 12, 1–8. [Google Scholar] [CrossRef]
  97. Abid, M.; Isleem, H.F.; Shah, M.K.; Zeb, S. Analytical Review on Eccentric Axial Compression Behavior of Short and Slender Circular RC Columns Strengthened Using CFRP. Polymers 2021, 13, 2763. [Google Scholar] [CrossRef] [PubMed]
  98. Isleem, H.F.; Peng, F.; Tayeh, B.A. Confinement model for LRS FRP-confined concrete using conventional regression and artificial neural network techniques. Compos. Struct. 2021, 279, 114779. [Google Scholar] [CrossRef]
  99. Yang, J.Q.; Feng, P. Analysis-oriented model for FRP confined high-strength concrete: 3D interpretation of path dependency. Compos. Struct. 2021, 278, 114695. [Google Scholar] [CrossRef]
  100. Yang, J.Q.; Feng, P. Analysis-oriented models for FRP-confined concrete: 3D interpretation and general methodology. Eng. Struct. 2020, 216, 110749. [Google Scholar] [CrossRef]
  101. Dang, Z.; Feng, P.; Yang, J.Q.; Zhang, Q. Axial compressive behavior of engineered cementitious composite confined by fiber-reinforced polymer. Compos. Struct. 2020, 243, 112191. [Google Scholar] [CrossRef]
  102. El-Sayed, A.K.; El-Salakawy, E.; Benmokrane, B. Mechanical and Structural Characterization of New Carbon FRP Stirrups for Concrete Members. J. Compos. Constr. 2007, 11, 352–362. [Google Scholar] [CrossRef]
  103. Ishihara, K.; Obara, T.; Sato, Y.; Ueda, T.; Kakuta, Y. Evaluation of ultimate strength of FRP rods at bent-up portion. In Non-Metallic (FRP) Reinforcement for Concrete Structures, Proceedings of the Third International Symposium; Sapporo, Japan, 14–16 October 1997, Japan Concrete Institute: Tokyo, Japan, 1997; pp. 27–34. [Google Scholar]
  104. Maruyama, T.; Honama, M.; Okmura, H. Experimental study on tensile strength of bent portion of FRP rods. In Fiber Reinforced Plastic Reinforcement for Concrete Structures; Nanni, A., Dolan, C.W., Eds.; ACI Special Publication SP; American Concrete Institute: Detroit, MI, USA, 1993; Volume 138, pp. 163–176. [Google Scholar]
  105. Shehata, E.; Morphy, R.; Rizkalla, S. Fiber reinforced polymer shear reinforcement for concrete members: Behavior and design guidelines. Can. J. Civ. Eng. 2000, 27, 859–872. [Google Scholar] [CrossRef]
  106. MATLAB and Statistics Toolbox Release 2012b; The MathWorks, Inc.: Natick, MA, USA, 2012.
  107. Beale, M.H.; Hagan, M.T.; Demuth, H.B. Neural Network Toolbox TM 7. User’s Guide; The MathWorks, Inc.: Natick, MA, USA, 2020. [Google Scholar]
  108. Guo, Z.H.; Zhang, X.Q.; Zhang, D.C.; Wang, R.Q. Experimental investigation of the complete stress-strain curve of concrete. J. Build Struct. 1982, 3, 1–12. (In Chinese) [Google Scholar]
  109. Pham, T.; Hadi, M. Stress Prediction Model for FRP Confined Rectangular Concrete Columns with Rounded Corners. J. Compos. Constr. 2014, 18, 04013019. [Google Scholar] [CrossRef] [Green Version]
Figure 1. Cross-sectional and GFRP reinforcement details.
Materials 14 07172 g001
Figure 2. Simulated model of HCCs showing GFRP reinforcement (a); Material sections (b); Element meshing (c), and Boundary condition (d). To be able to describe relationships between the elements of the structures, the figure also shows a three-dimensional coordinate axis system.
Materials 14 07172 g002
Figure 3. Stress-strain models for unconfined and confined concrete.
Materials 14 07172 g003
Figure 4. Relationship between the damage parameter and the inelastic strain of concrete for specimen C26.8-H50-6#5-90: (a) Represents the compression behavior; (b) Represents the tension behavior.
Materials 14 07172 g004
Figure 5. Model for the definition of tension stiffening of concrete.
Materials 14 07172 g005
Figure 6. Correlation between the present confined strength model and that proposed by Mander et al. [92] for confined concrete.
Materials 14 07172 g006
Figure 7. Correlation between the present confined strain model and that proposed by Mander et al. [92] for confined concrete.
Materials 14 07172 g007
Figure 8. Proposed boundary conditions for GFRP-RC HCCs tested in the current paper.
Materials 14 07172 g008
Figure 9. Experimental and finite element (FE) failure patterns of specimens (a) C26.8-H00-6#5-90; (b) C26.8-H50-6#5-90: Considering the effect of varying amounts of GFRP confinement. Note: PEEQ = Equivalent plastic strain.
Materials 14 07172 g009
Figure 10. Finite element (FE) failure patterns: Considering the effect of varying amounts of GFRP confinement. Note: PEEQ = Equivalent plastic strain.
Materials 14 07172 g010
Figure 11. Experimental and finite element (FE) failure patterns of specimens: (a) C31.8-H100-6#5-00; (b) C31.8-H100-6#5-40; (c) C31.8-H100-6#5-65; (d) C31.8-H100-6#5-90: Considering the effect of different inner diameters. Note: PEEQ = Equivalent plastic strain.
Materials 14 07172 g011
Figure 12. Finite element (FE) failure patterns: Considering the effect of different inner diameters.
Materials 14 07172 g012
Figure 13. Comparison of tested and numerically obtained load-strain responses of HCCs.
Materials 14 07172 g013aMaterials 14 07172 g013b
Figure 14. Comparison of tested and numerically obtained first and second axial peak capacities of HCCs.
Materials 14 07172 g014
Figure 15. MSE errors in the train, validate, and test data.
Materials 14 07172 g015
Figure 16. ANN architecture of the proposed first and second peak load capacities of HCCs.
Materials 14 07172 g016
Figure 17. Overall performance of the proposed ANN model (N5-5-2).
Materials 14 07172 g017
Figure 18. Performance of the proposed and existing models of HCCs: (a) Current ANN model; (b) AlAjarmeh et al.’s [7] analytical model.
Materials 14 07172 g018
Figure 19. Performance of the proposed analytical model of HCCs.
Materials 14 07172 g019
Figure 20. Effect of varying compressive strengths of concrete on the load-strain response of HCCs.
Materials 14 07172 g020
Figure 21. Effect of varying confinement ratios of GFRP spirals on the load-strain response of HCCs.
Materials 14 07172 g021
Figure 22. Effect of different amounts of longitudinal reinforcement on the load-strain response of HCCs.
Materials 14 07172 g022
Figure 23. Effect of different inner-to-outer (Di/D) diameter ratios on the load-strain response of HCCs.
Materials 14 07172 g023
Figure 24. Comparison between predictions of proposed concrete axial load-axial strain curves, and experimental and numerical results.
Materials 14 07172 g024aMaterials 14 07172 g024b
Figure 25. Effect of increasing the Di/D ratio on the axial load capacity.
Materials 14 07172 g025
Figure 26. Relationship between varying Di/D ratios and reduction in peak loads.
Materials 14 07172 g026
Figure 27. Relationship between confinement pressure ratio and confined load ratio.
Materials 14 07172 g027
Table 1. Summary of the design equations available in the literature for FRP-RC columns.
ReferenceProposed EquationFRPPredicted Condition Estimated Errors
AAE (%)MSE (%)SD (%)
CSA-S806-12 [60] p n 1 = 0.85 f c ' ( A g A F R P ) Peak
Ultimate
15.74
18.01
2.78
5.27
0.31
2.78
ACI318-14 [62] p n 1 = 0.85 f c ' ( A g A F R P ) Peak
Ultimate
15.74
18.01
2.78
5.27
0.31
2.78
Tobbi et al. [3] p n 1 = 0.85 f c ' ( A g A F R P ) + 0.35 f F R P A F R P GPeak
Ultimate
28.10
28.65
9.06
11.07
1.22
4.19
Afifi et al. [4] p n 1 = 0.85 f c ' ( A g A F R P ) + 0.35 f F R P A F R P GPeak
Ultimate
28.10
28.65
9.06
11.07
1.22
4.19
Afifi et al. [65] p n 1 = 0.85 f c ' ( A g A F R P ) + 0.25 f F R P A F R P CPeak
Ultimate
15.57
19.92
3.10
5.55
0.70
3.61
Mohamed et al. [66] p n 1 = 0.85 f c ' ( A g A F R P ) + 0.002 E F R P A F R P GPeak
Ultimate
5.44
13.75
0.43
3.09
0.31
3.00
Maranan et al. [67] p n 1 = 0.9 f c ' ( A g A F R P ) + 0.002 E F R P A F R P GPeak
Ultimate
4.77
14.70
0.35
3.25
0.34
3.34
Hadhood et al. [63] p n 1 = α 1 f c ' ( A g A F R P ) + 0.0035 E F R P A F R P ( α 1 = 0.85 0.0015 f c ' 0.67 ) CPeak
Ultimate
6.02
13.04
0.48
2.77
0.49
2.87
Hadhood et al. [63] p n 1 = 0.85 f c ' ( A g A F R P ) + 0.003 E F R P A F R P CPeak
Ultimate
5.31
14.16
0.43
3.09
0.38
3.16
Hadhood et al. [64] p n 1 = 0.85 f c ' ( A g A F R P ) + 0.0024 E F R P A F R P CPeak
Ultimate
4.99
13.77
0.34
3.00
0.34
3.06
Xue et al. [68] p n 1 = 0.85 f c ' ( A g A F R P ) + 0.002 E F R P A F R P GPeak
Ultimate
5.44
13.75
0.43
3.09
0.31
3.00
Note: AFRP = area of FRP longitudinal reinforcement; Ag = gross area of column section; EFRP = tensile Young’s modulus of the FRP bars; fc = compressive strength of unconfined concrete; fFRP = FRP tensile strength; Pn1 = nominal capacity corresponding to first peak load.
Table 2. Test database of GFRP-RC columns.
Coded Columns with Geometry and Concrete TypeReinforcement DetailsLongitudinal ReinforcementHoop Reinforcement Key Experimental Results
CodeD (mm)Di (mm)fc (MPa)ρFRP (%)Reinforcement
Hoop/Longitudinal
fFRP
(MPa)
EFRP
(GPa)
εFRP
(%)
fFRP
(MPa)
EFRP
(MPa)
εFRP
(%)
Pn1
(KN)
Pn2 (KN)εcu (%)
AlAjarmeh et al. [7]
C26.8-H00-6#5-902509026.80.000-6ϕ15.9123760,0002.1131562,5002.31022.0854.60.387
C26.8-H50-6#5-902509026.83.8409.5ϕ506ϕ15.9123760,0002.1131562,5002.31197.01434.01.233
C26.8-H100-6#5-902509026.81.9309.5ϕ1006ϕ15.9123760,0002.1131562,5002.31189.01102.01.110
C26.8-H150-6#5-902509026.81.2809.5ϕ1506ϕ15.9123760,0002.1131562,5002.31108.01110.01.102
C21.2-H100-6#5-902509021.21.9309.5ϕ1006ϕ15.9123760,0002.1131562,5002.3907.01006.70.743
C36.8-H100-6#5-902509036.81.9309.5ϕ1006ϕ15.9123760,0002.1131562,5002.31570.01424.01.347
C44.0-H100-6#5-902509044.01.9309.5ϕ1006ϕ15.9123760,0002.1131562,5002.31880.01644.01.128
AlAjarmeh et al. [5]
C25-H100-6#4-902509025.01.9309.5ϕ1006ϕ12.7128261,3002.1131562,5002.31035.3985.11.058
C25-H100-6#5-902509025.01.9309.5ϕ1006ϕ15.9123760,5002.1131562,5002.31109.21024.41.069
C25-H100-6#6-902509025.01.9309.5ϕ1006ϕ19.1127060,5002.1131562,5002.31140.01247.91.148
C25-H100-4#5-902509025.01.9309.5ϕ1004ϕ15.9123760,5002.1131562,5002.3983.3875.51.062
C25-H100-8#5-902509025.01.9309.5ϕ1008ϕ15.9123760,5002.1131562,5002.31267.91406.11.106
C25-H100-9#4-902509025.01.9309.5ϕ1009ϕ12.7128261,3002.1131562,5002.31035.01204.21.077
AlAjarmeh et al. [6]
C31.8-H100-6#5-00250031.81.4909.5ϕ1006ϕ15.9123760,0002.1131562,5002.31588.01368.0-
C31.8-H100-6#5-402504031.81.5609.5ϕ1006ϕ15.9123760,0002.1131562,5002.31408.01295.0-
C31.8-H100-6#5-652506531.81.6909.5ϕ1006ϕ15.9123760,0002.1131562,5002.31559.01458.0-
C31.8-H100-6#5-902509031.81.9309.5ϕ1006ϕ15.9123760,0002.1131562,5002.31411.01304.0-
Finite Element (FE) experiments [49]
C26.8-H00-6#5-902509026.80.000-6ϕ15.9123760,0002.1131562,5002.31007.8769.20.357
C26.8-H50-6#5-902509026.83.8409.5ϕ506ϕ15.9123760,0002.1131562,5002.31133.21477.51.310
C26.8-H100-6#5-902509026.81.9309.5ϕ1006ϕ15.9123760,0002.1131562,5002.31070.21132.31.143
C26.8-H150-6#5-902509026.81.2809.5ϕ1506ϕ15.9123760,0002.1131562,5002.31103.6962.01.059
C21.2-H100-6#5-902509021.21.9309.5ϕ1006ϕ15.9123760,0002.1131562,5002.3879.5976.70.903
C36.8-H100-6#5-902509036.81.9309.5ϕ1006ϕ15.9123760,0002.1131562,5002.31532.41337.61.144
C44.0-H100-6#5-902509044.01.9309.5ϕ1006ϕ15.9123760,0002.1131562,5002.31787.41479.81.104
C25-H100-6#4-902509025.01.9309.5ϕ1006ϕ12.7128261,3002.1131562,5002.31027.3895.21.010
C25-H100-6#5-902509025.01.9309.5ϕ1006ϕ15.9123760,5002.1131562,5002.31010.01119.21.113
C25-H100-6#6-902509025.01.9309.5ϕ1006ϕ19.1127060,5002.1131562,5002.31094.61480.61.315
C25-H100-4#5-902509025.01.9309.5ϕ1004ϕ15.9123760,5002.1131562,5002.3945.2932.21.029
C25-H100-8#5-902509025.01.9309.5ϕ1008ϕ15.9123760,5002.1131562,5002.31155.01395.11.270
C25-H100-9#4-902509025.01.9309.5ϕ1009ϕ12.7128261,3002.1131562,5002.31090.61130.71.124
C25-H50-6#4-902509025.03.8409.5ϕ506ϕ12.7128261,3002.1131562,5002.31091.41226.51.194
C25-H50-6#6-902509025.03.8409.5ϕ506ϕ19.1127060,5002.1131562,5002.31249.71855.81.512
C25-H50-4#5-902509025.03.8409.5ϕ504ϕ15.9123760,5002.1131562,5002.31094.71234.91.199
C25-H50-8#5-902509025.03.8409.5ϕ508ϕ15.9123760,5002.1131562,5002.31228.01741.81.456
C25-H50-9#4-902509025.03.8409.5ϕ509ϕ12.7128261,3002.1131562,5002.31155.21478.91.323
C31.8-H100-6#5-00250031.81.4909.5ϕ1006ϕ15.9123760,0002.1131562,5002.31476.01408.60.940
C31.8-H100-6#5-402504031.81.5609.5ϕ1006ϕ15.9123760,0002.1131562,5002.31353.51280.80.977
C31.8-H100-6#5-652506531.81.6909.5ϕ1006ϕ15.9123760,0002.1131562,5002.31438.61355.91.097
C31.8-H100-6#5-902509031.81.9309.5ϕ1006ϕ15.9123760,0002.1131562,5002.31342.81119.41.116
C26.8-H50-6#5-00250026.83.4029.5ϕ506ϕ15.9123760,0002.1131562,5002.31317.91864.21.175
C26.8-H50-6#5-452504526.83.4869.5ϕ506ϕ15.9123760,0002.1131562,5002.31275.01803.61.305
C26.8-H150-6#5-00250026.80.8429.5ϕ1506ϕ15.9123760,0002.1131562,5002.31203.11109.20.921
C26.8-H150-6#5-452504526.80.9269.5ϕ1506ϕ15.9123760,0002.1131562,5002.31166.71097.91.015
C21.2-H100-6#5-00250021.21.4929.5ϕ1006ϕ15.9123760,0002.1131562,5002.31027.41218.71.134
C21.2-H100-6#5-452504521.21.5769.5ϕ1006ϕ15.9123760,0002.1131562,5002.3974.91206.21.224
C21.2-H50-6#5-902509021.23.8409.5ϕ506ϕ15.9123760,0002.1131562,5002.3948.51376.31.077
C21.2-H150-6#5-902509021.21.2809.5ϕ1506ϕ15.9123760,0002.1131562,5002.3860.1849.20.876
C44.0-H100-6#5-00250044.01.4929.5ϕ1006ϕ15.9123760,0002.1131562,5002.32064.51810.11.031
C44.0-H100-6#5-452504544.01.5769.5ϕ1006ϕ15.9123760,0002.1131562,5002.31981.11724.21.055
C44.0-H50-6#5-902509044.03.8409.5ϕ506ϕ15.9123760,0002.1131562,5002.31846.51818.81.206
C44.0-H150-6#5-902509044.01.2809.5ϕ1506ϕ15.9123760,0002.1131562,5002.31792.31387.11.033
C26.8-H100-6#5-00250026.81.4929.5ϕ1006ϕ15.9123760,0002.1131562,5002.31229.71308.41.036
C26.8-H100-6#5-452504526.81.5769.5ϕ1006ϕ15.9123760,0002.1131562,5002.31185.61287.41.137
C44.0-H100-6#5-12025012044.02.3619.5ϕ1006ϕ15.9123760,0002.1131562,5002.31582.51305.11.220
C31.8-H100-6#5-12025012031.82.3619.5ϕ1006ϕ15.9123760,0002.1131562,5002.31194.91094.31.000
C26.8-H00-6#5-452504526.80.000-6ϕ15.9123760,0002.1131562,5002.31105.81041.00.357
C26.8-H50-6#5-12025012026.84.2719.5ϕ506ϕ15.9123760,0002.1131562,5002.3999.01126.80.783
C26.8-H100-6#5-12025012026.82.3619.5ϕ1006ϕ15.9123760,0002.1131562,5002.3956.1942.40.744
C26.8-H150-6#5-12025012026.81.7119.5ϕ1506ϕ15.9123760,0002.1131562,5002.3945.4913.20.737
C21.2-H100-6#5-12025012021.22.3619.5ϕ1006ϕ15.9123760,0002.1131562,5002.3785.2872.00.929
Table 3. Properties of finite element (FE) simulations.
PropertyValue
Mesh size of concrete material (mm)15/Element Shape: Hex-Structured
Mesh size of steel end plates (mm)10/Element Shape: Hex-Sweep
Mesh size of GFRP rebars and spirals (mm)10
Minimum step size1 × 10−8
Initial step size0.005
Maximum step size0.01
Concrete and steel end plate element typeStandard C3D8R/Geometric Order: Linear/Family: 3D Stress
GFRP rebars and spiral element typeStandard T3D2/Geometric Order: Linear/Family: Truss
Interaction constraint of FRP reinforcement to concrete Embedded Region
Applied displacement (mm)50
Step-1 type Static, General
Equation solver Direct
Automatic stabilization Use damping factors from previous general steps
Table 4. Plasticity parameters of concrete for CDP.
ParameterValue
Dilatation angle (ψ), Degrees30
Plastic potential eccentricity (ε)0.1
σbo/σco [77]1.5(fc)−0.075
The shape factor of yielding surface (Kc)0.6667
Viscosity parameter (𝜇)5 × 10⁵
Table 5. Data to scale the inputs’ data.
Input/OutputMaximumMinimumMeanStandard Deviation
λvb2.040.681.190.35
λlb2.090.000.680.51
fcMPa44.0021.2026.806.57
Acmm247,916.1436,601.8641,551.863138.02
Di/D(mm/mm)0.480.000.360.14
pn1Kn2064.49785.211155.13291.75
pn2Kn1864.16769.171241.42279.56
Publisher’s Note: MDPI stays neutral with regard to jurisdictional claims in published maps and institutional affiliations.

