
Resistance of Polymeric Laminates Reinforced with Fabrics against the Growth of Delaminations


Abstract
:1. Introduction
2. Materials and Methods
2.1. Materials
2.2. Method
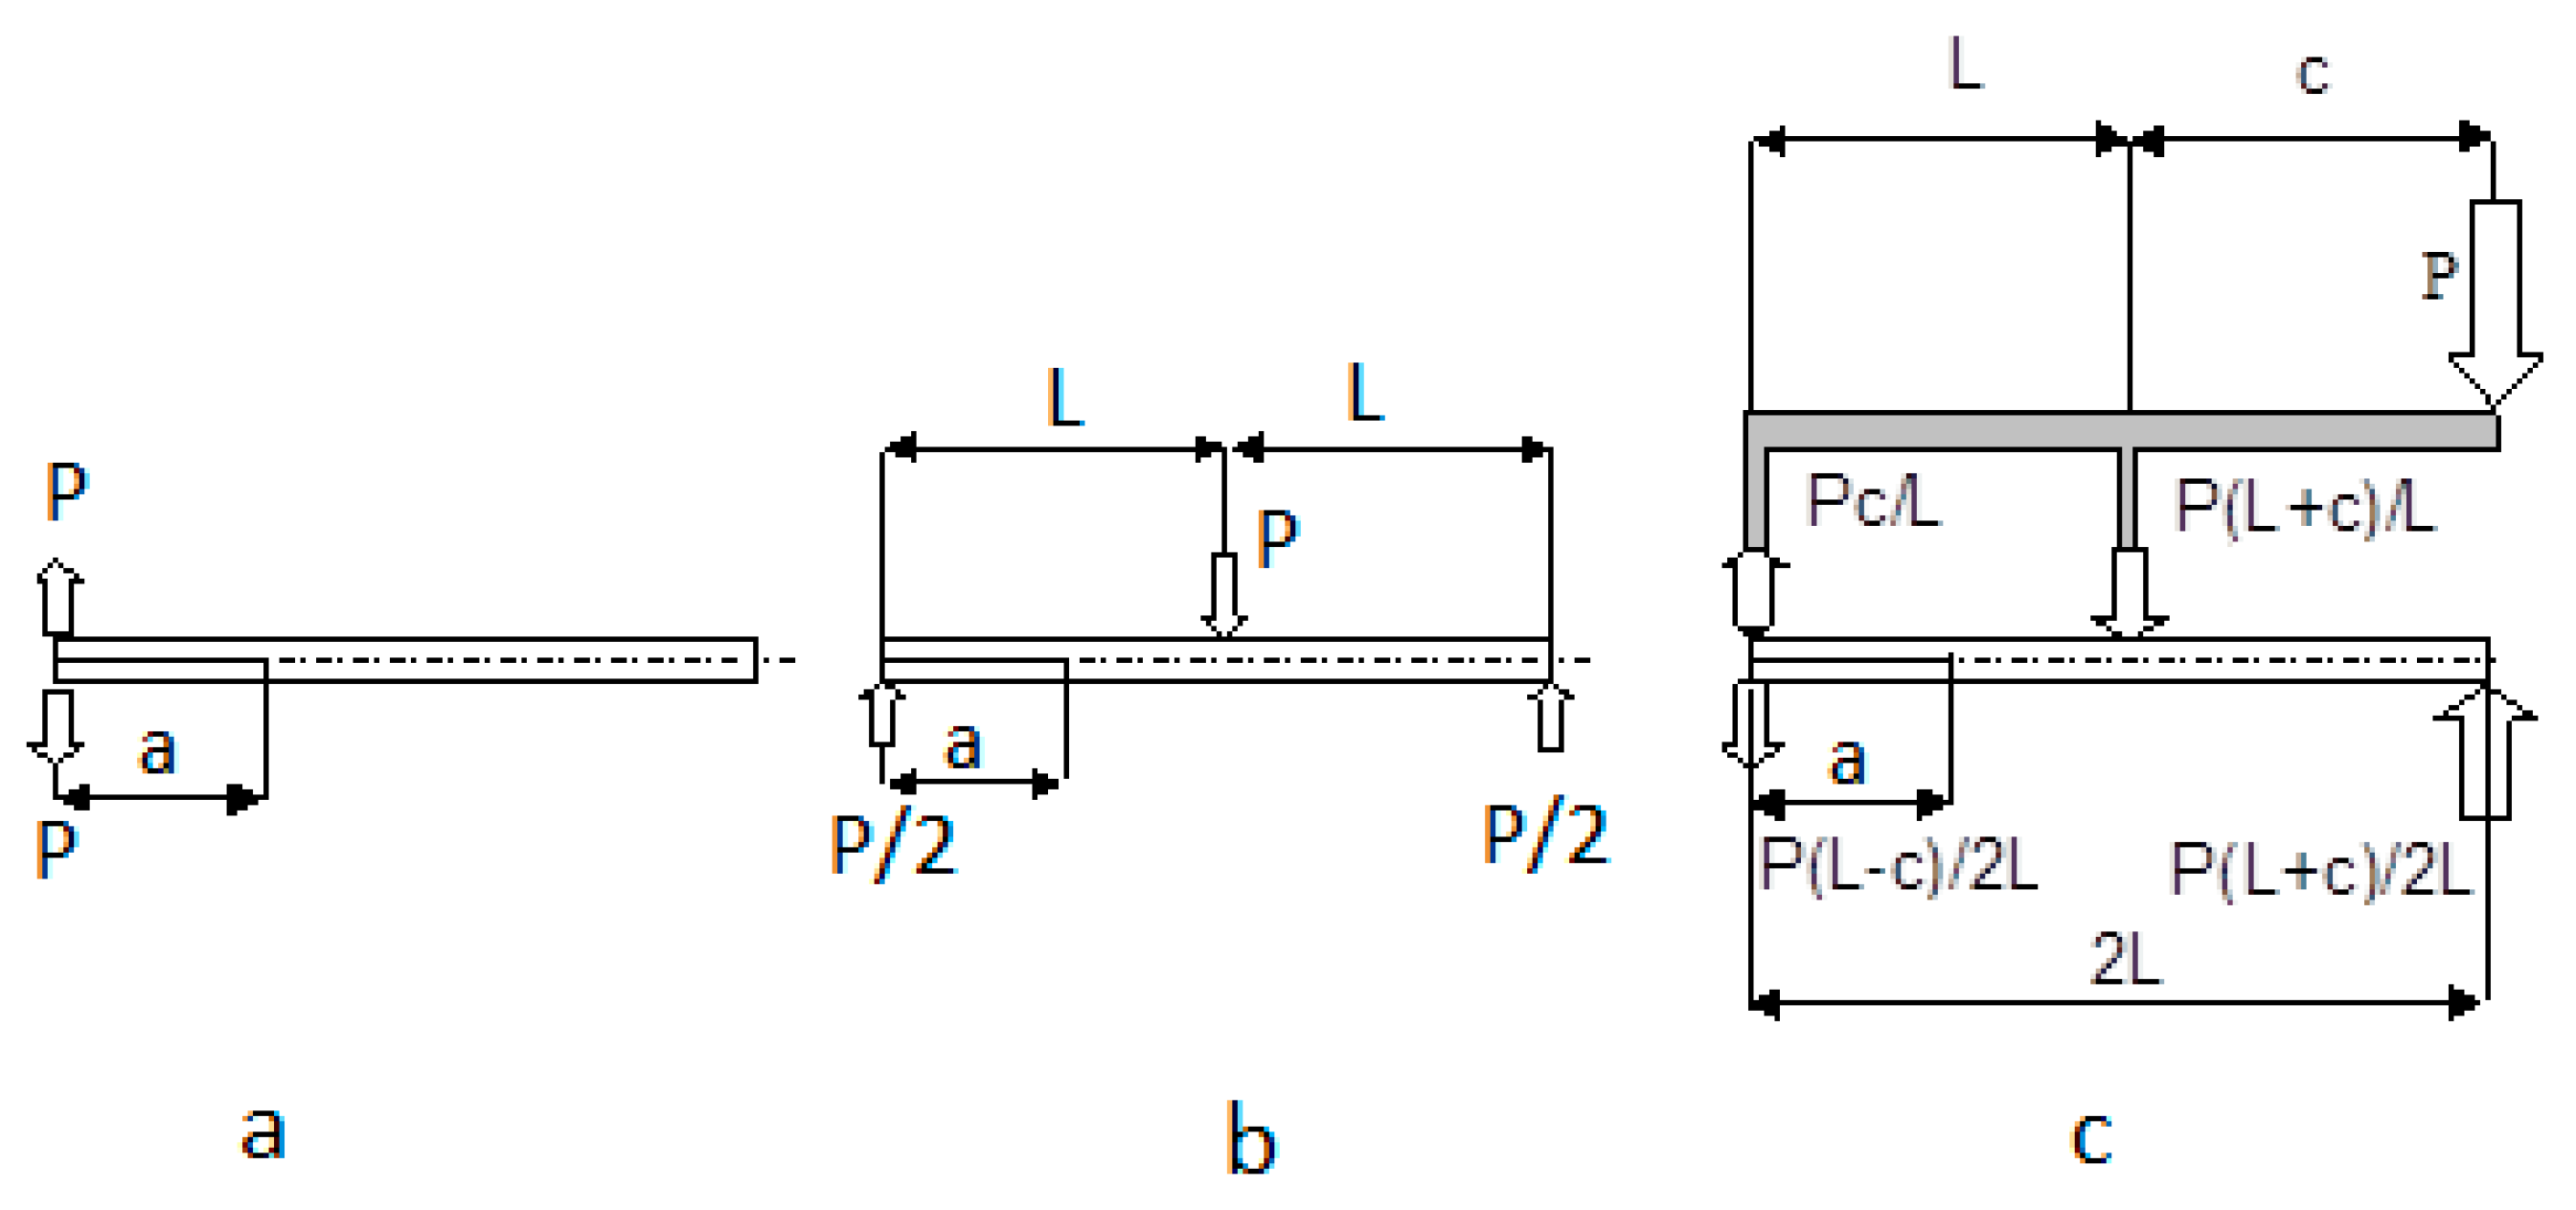
2.2.1. Issue of the Specimen Design
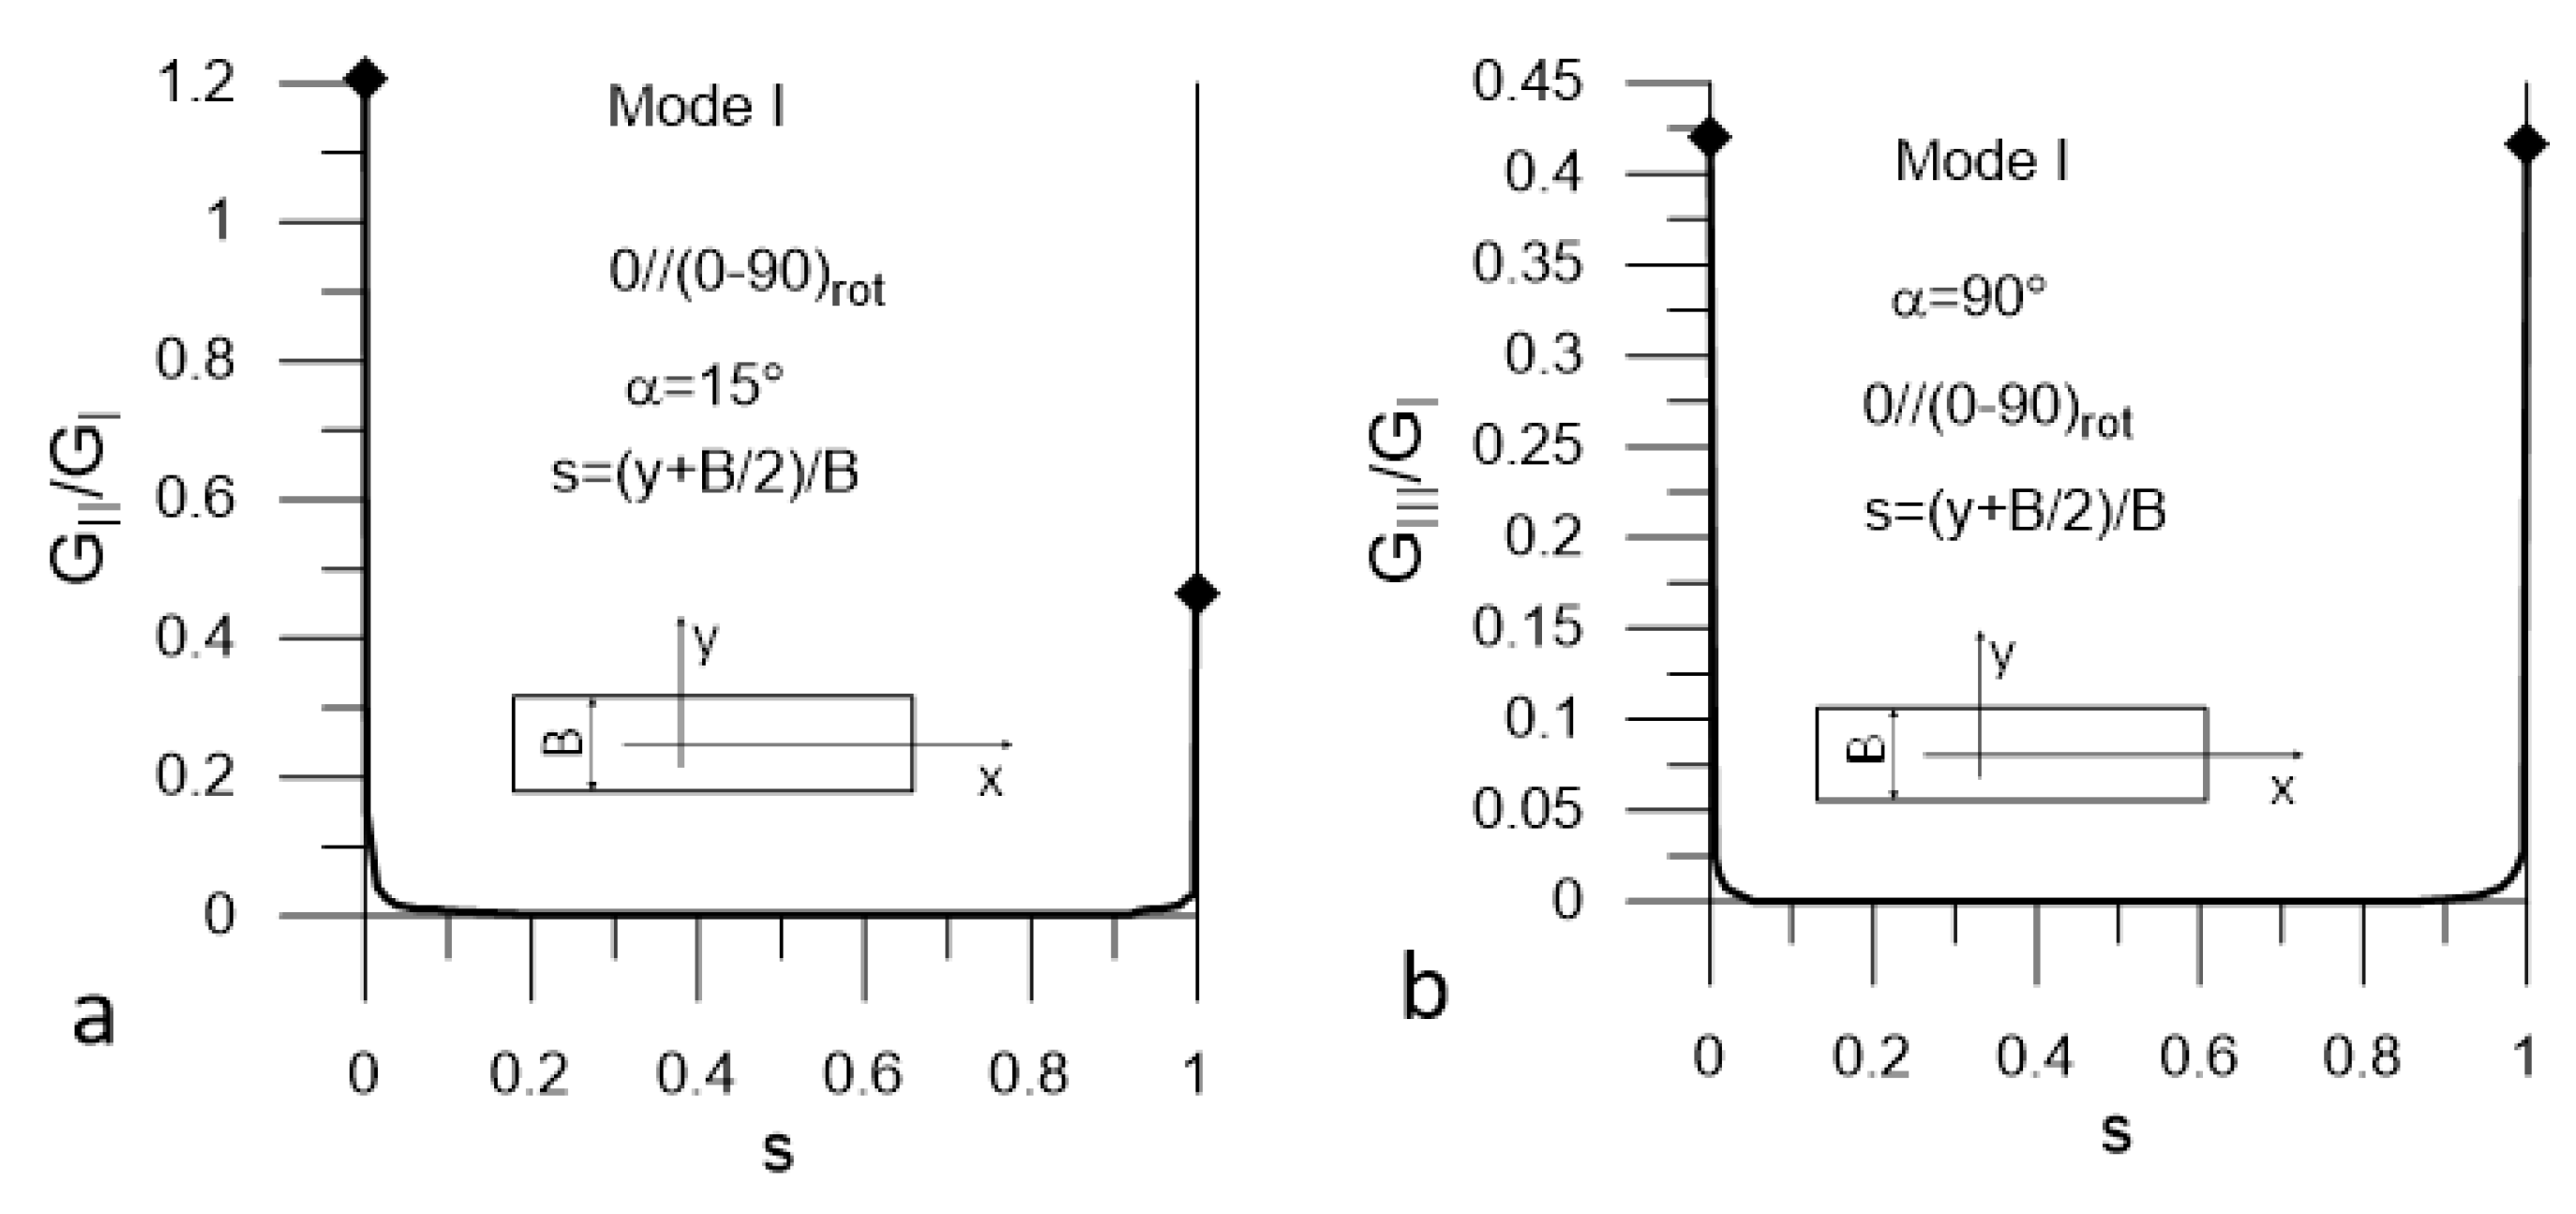
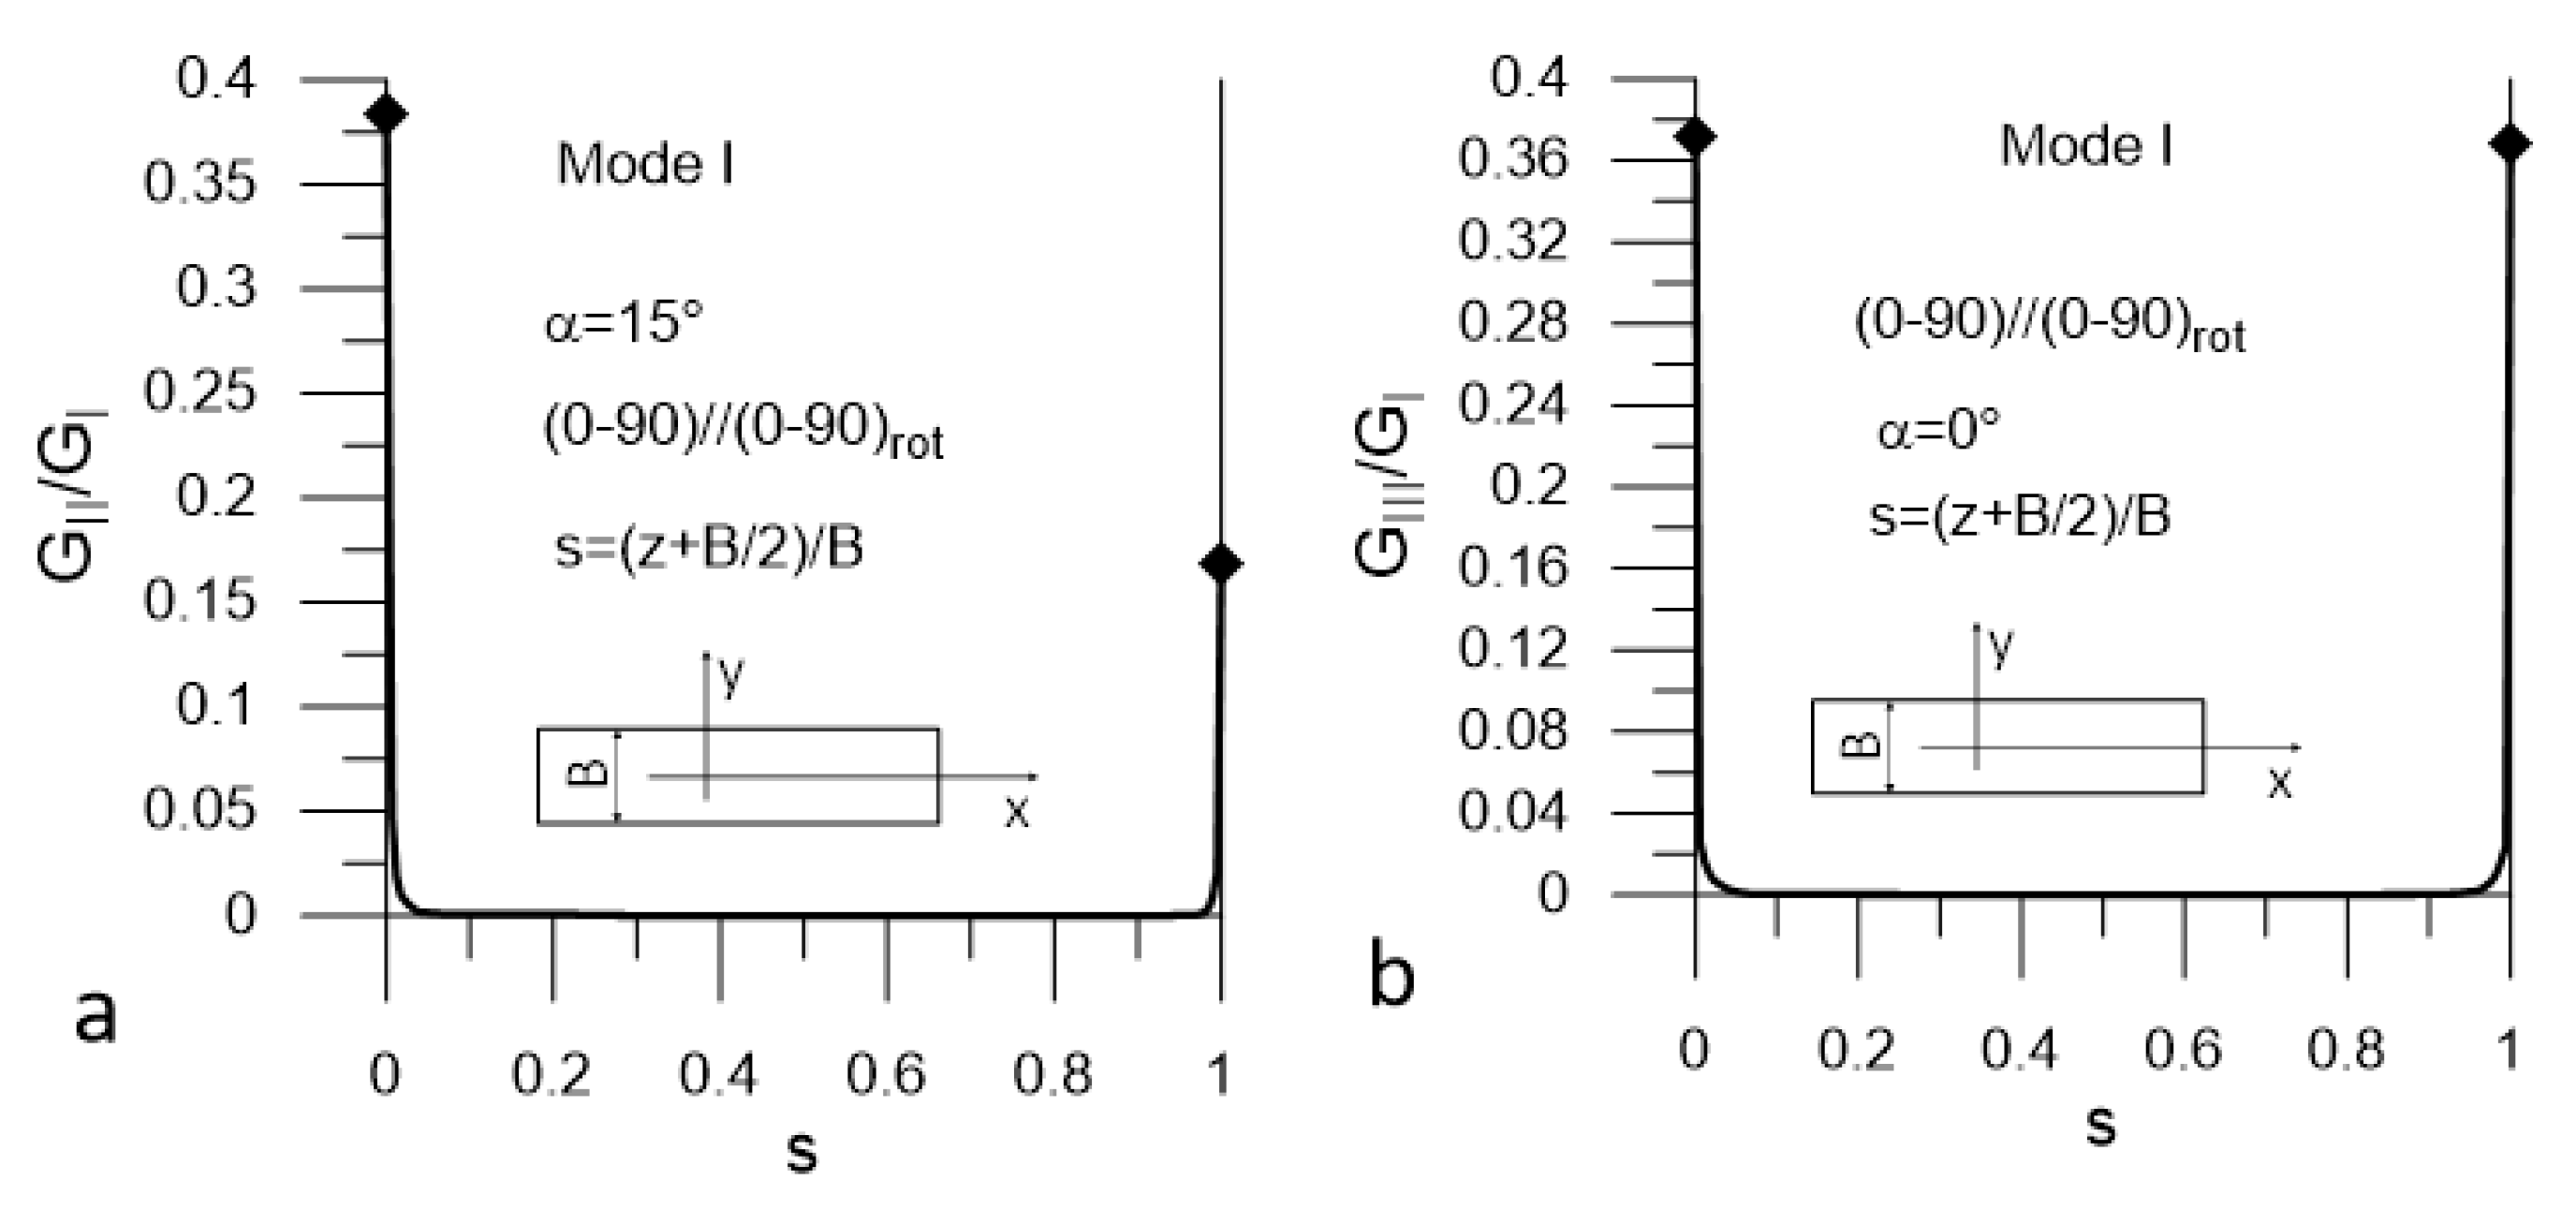
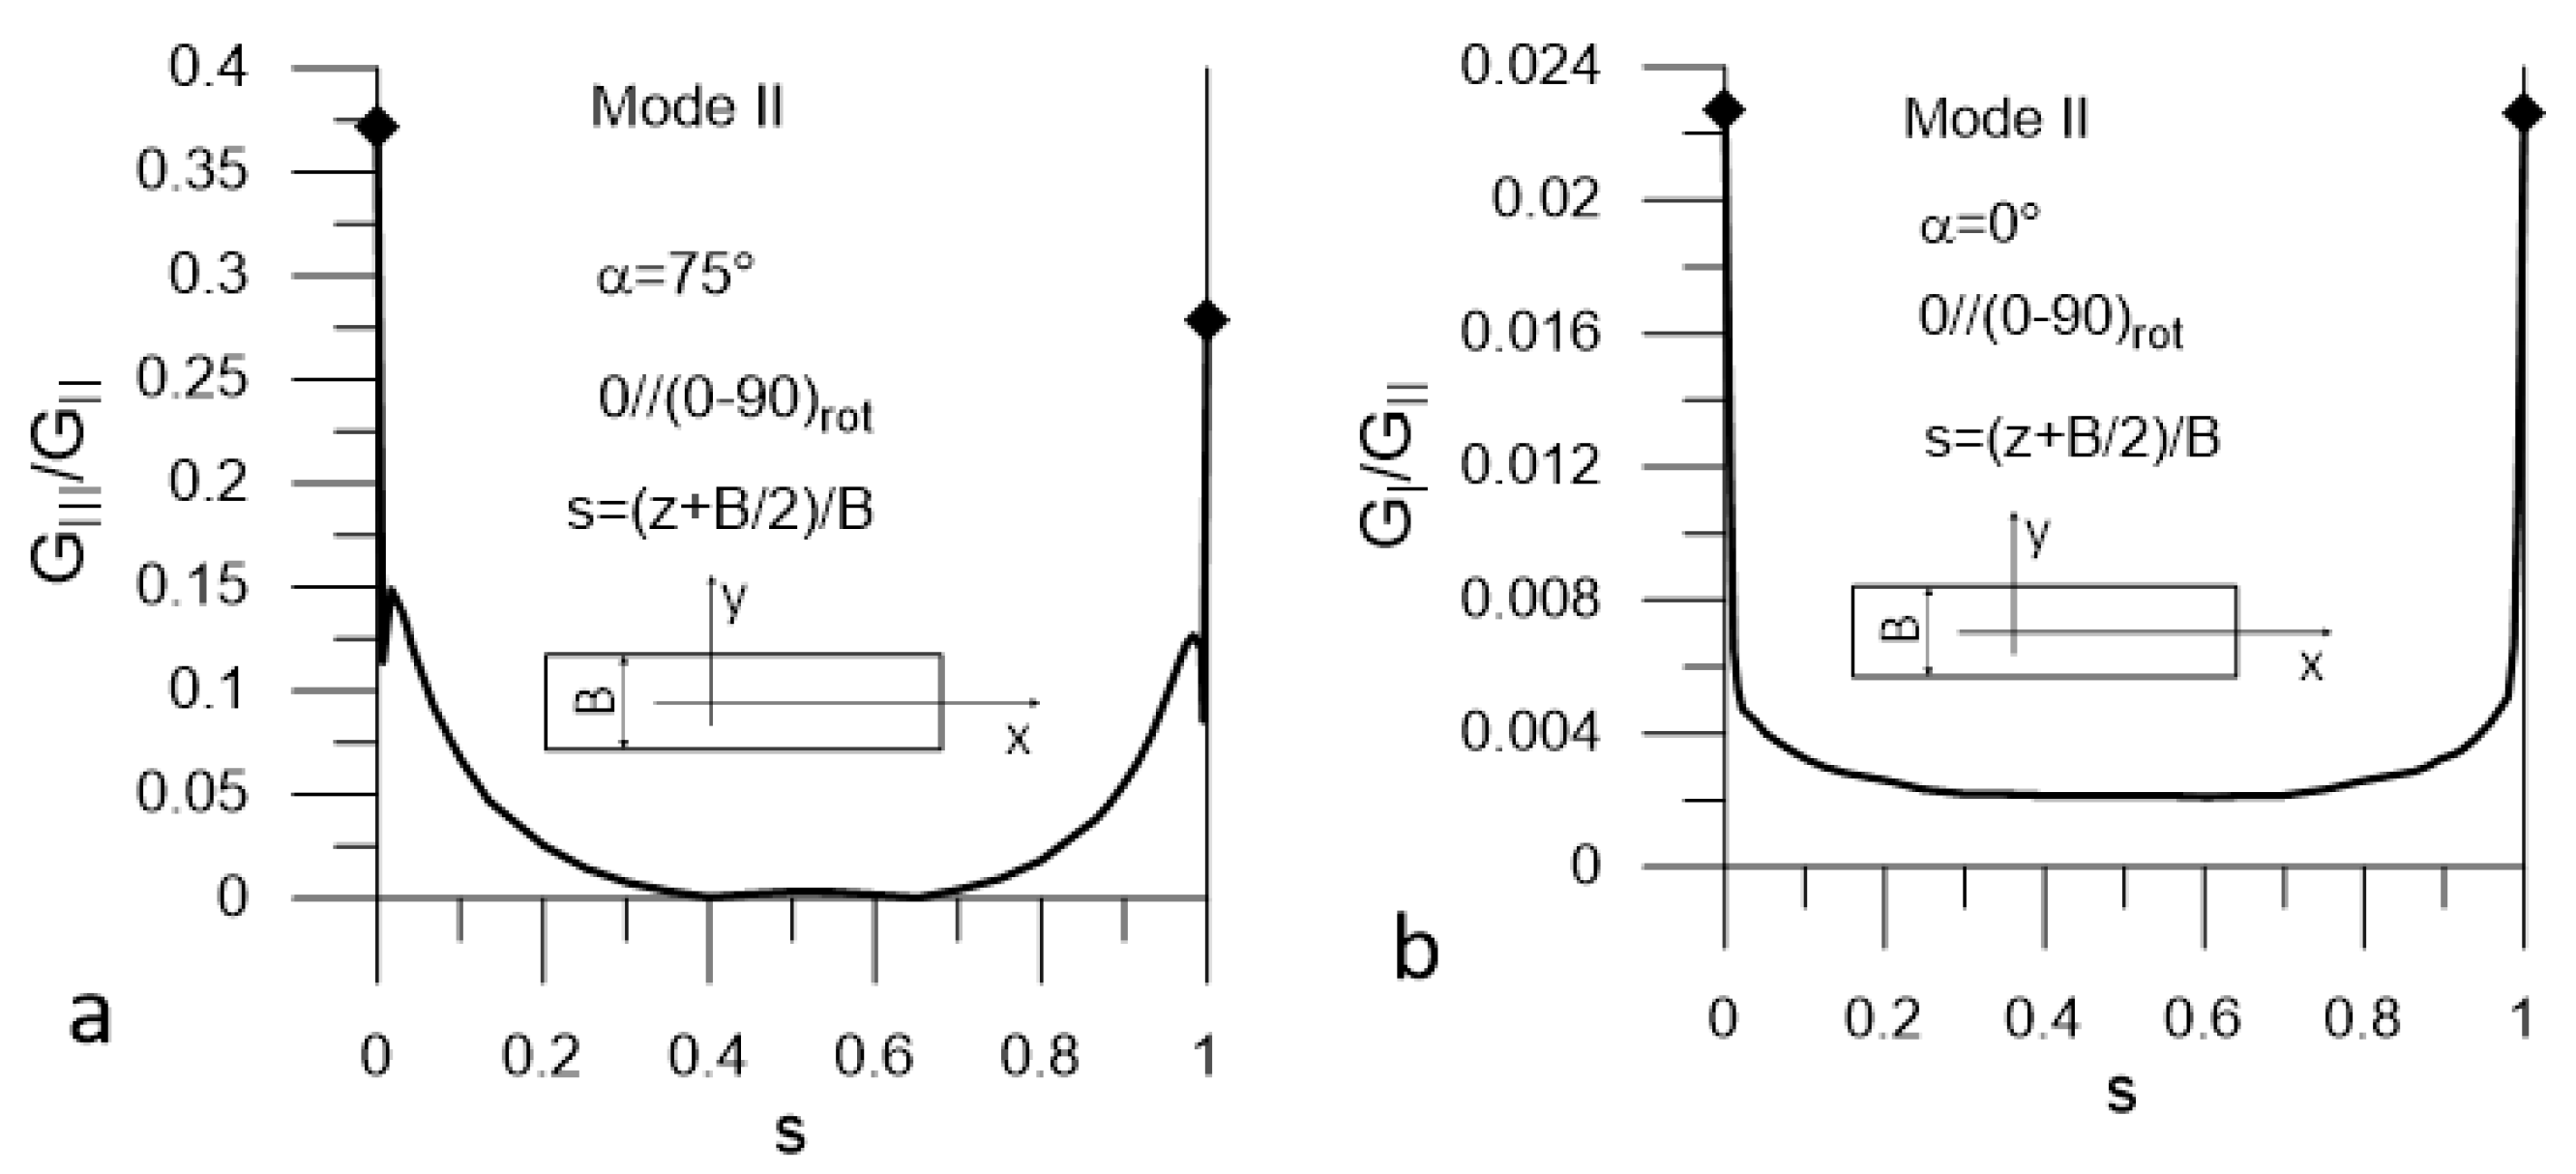
Analysis of Coupling Coefficients
Finite Element Analysis of the Hybrid Specimens
2.2.2. Specimen Manufacturing
2.2.3. Testing
3. Results
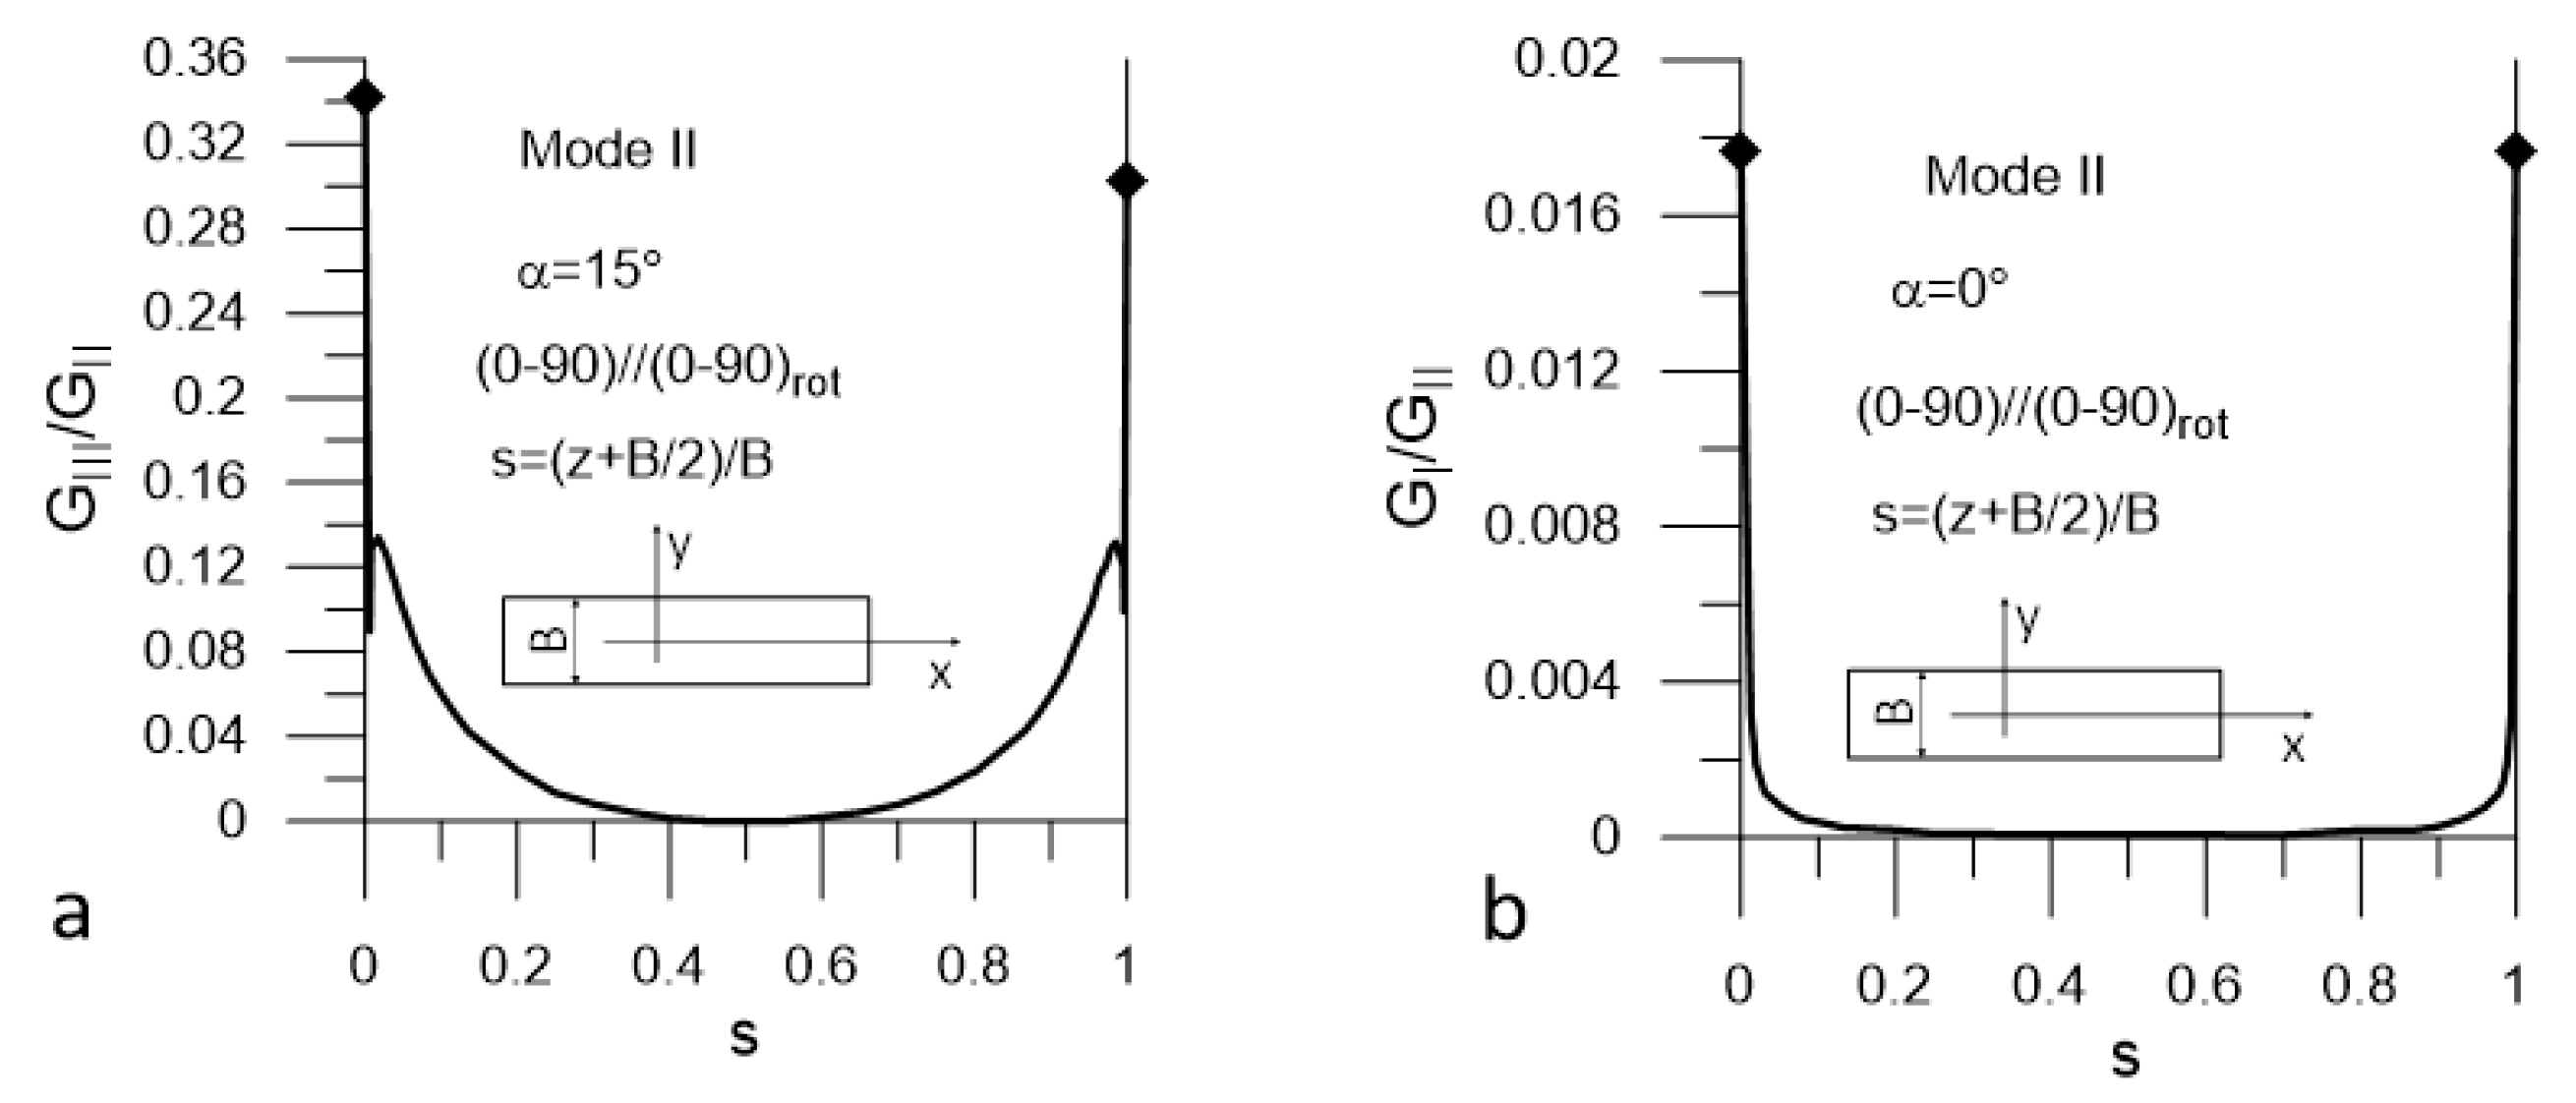
3.1. Results of the FE Analysis
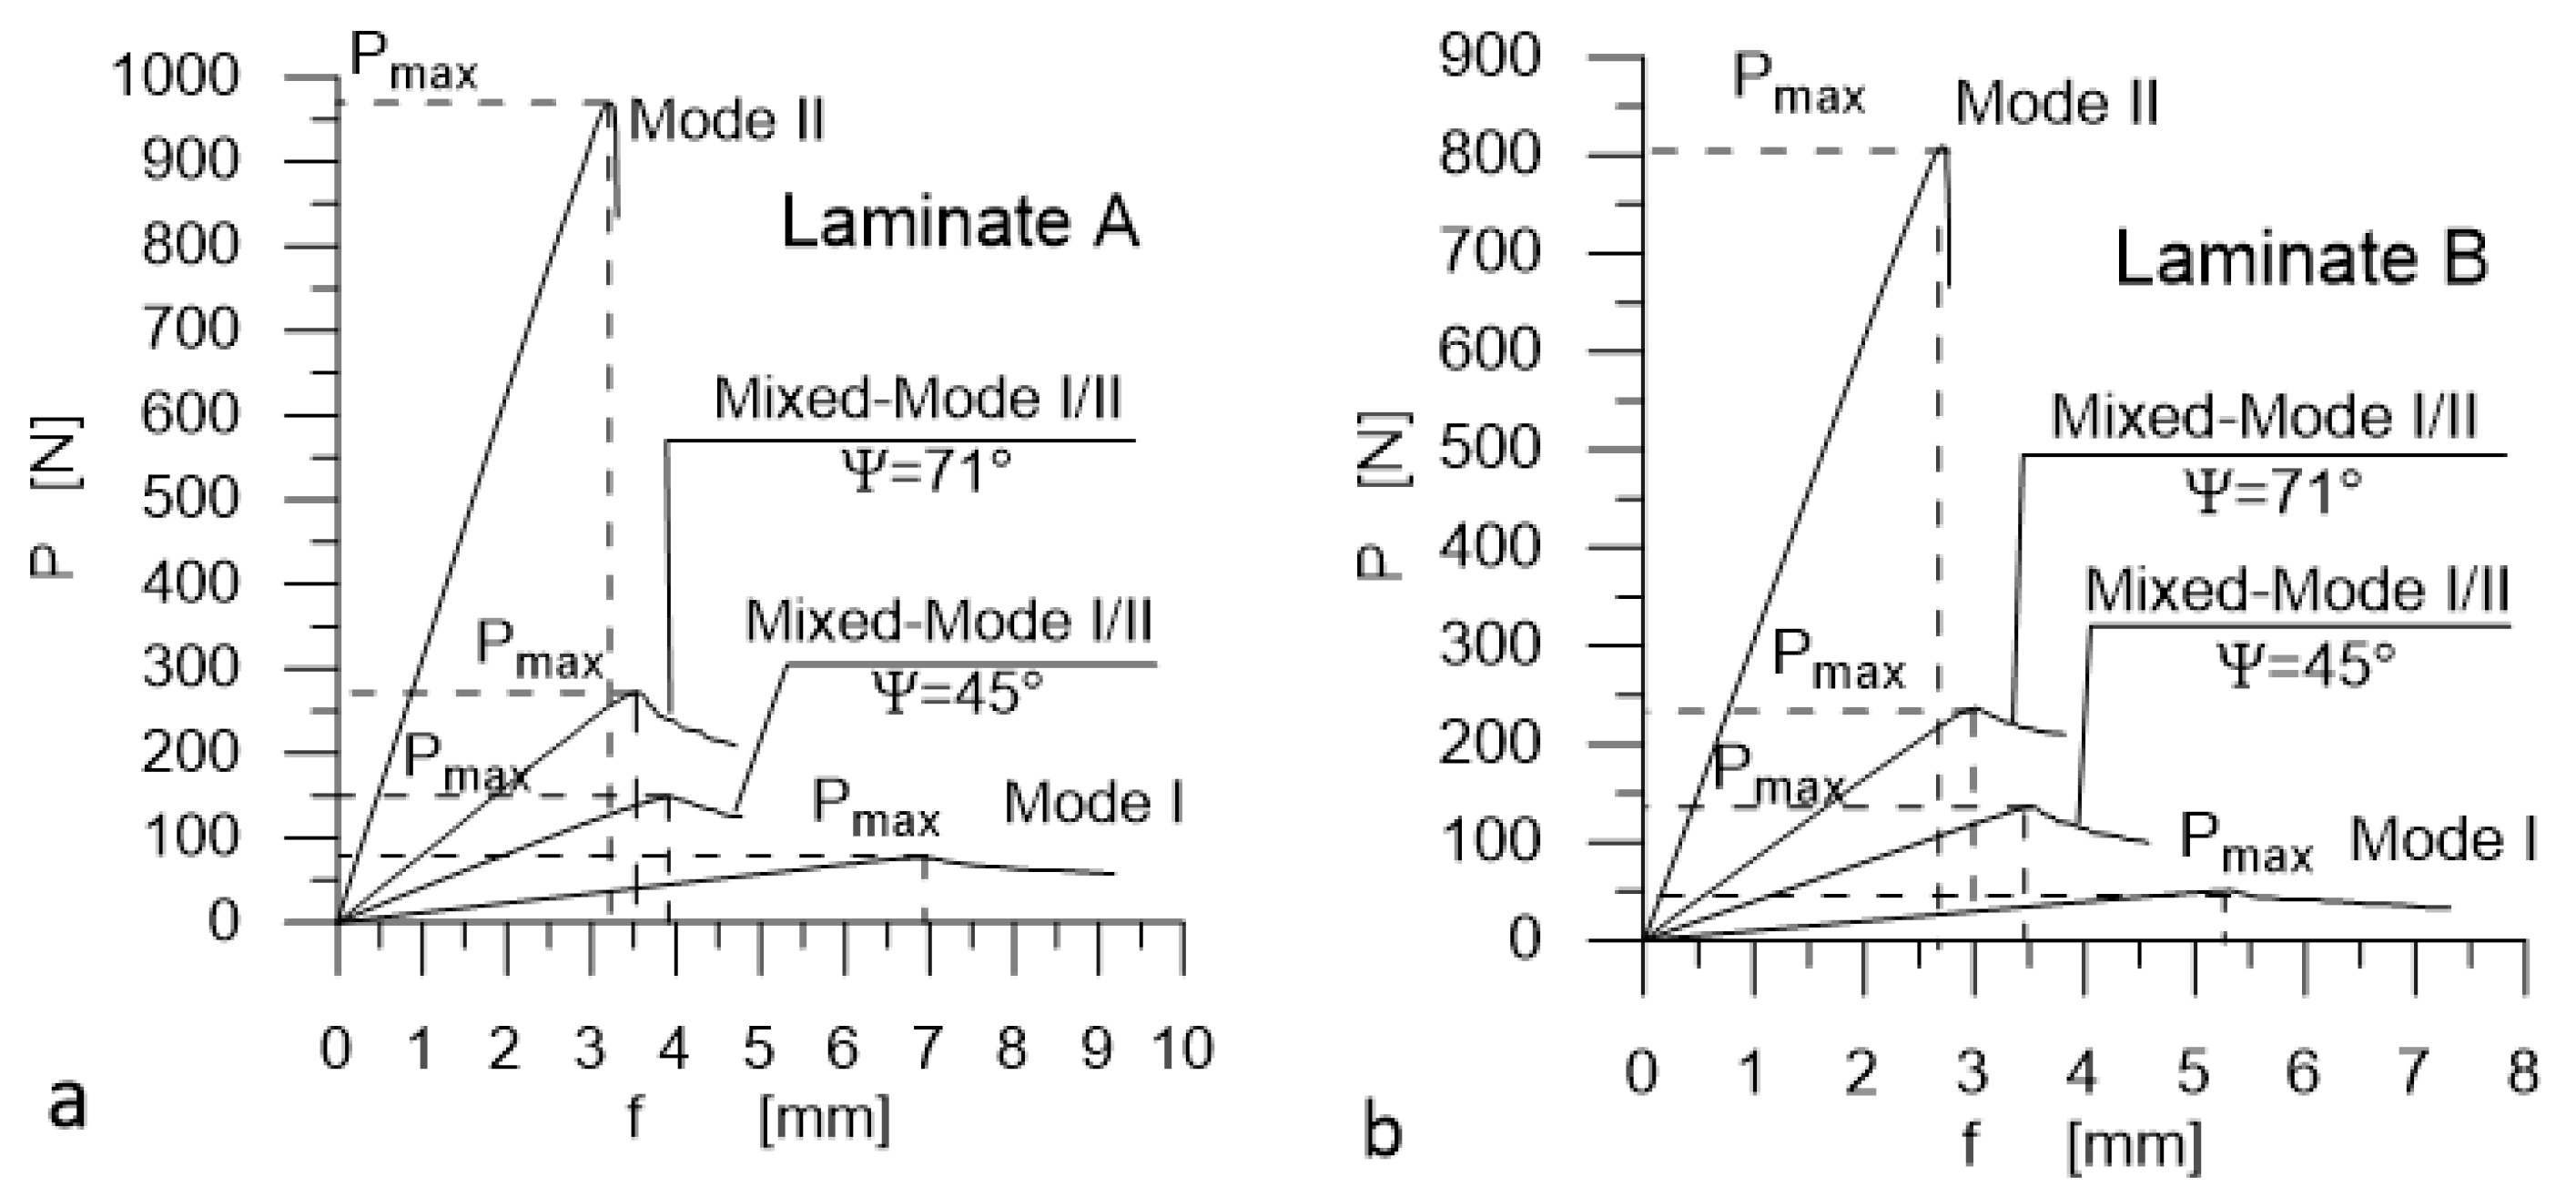
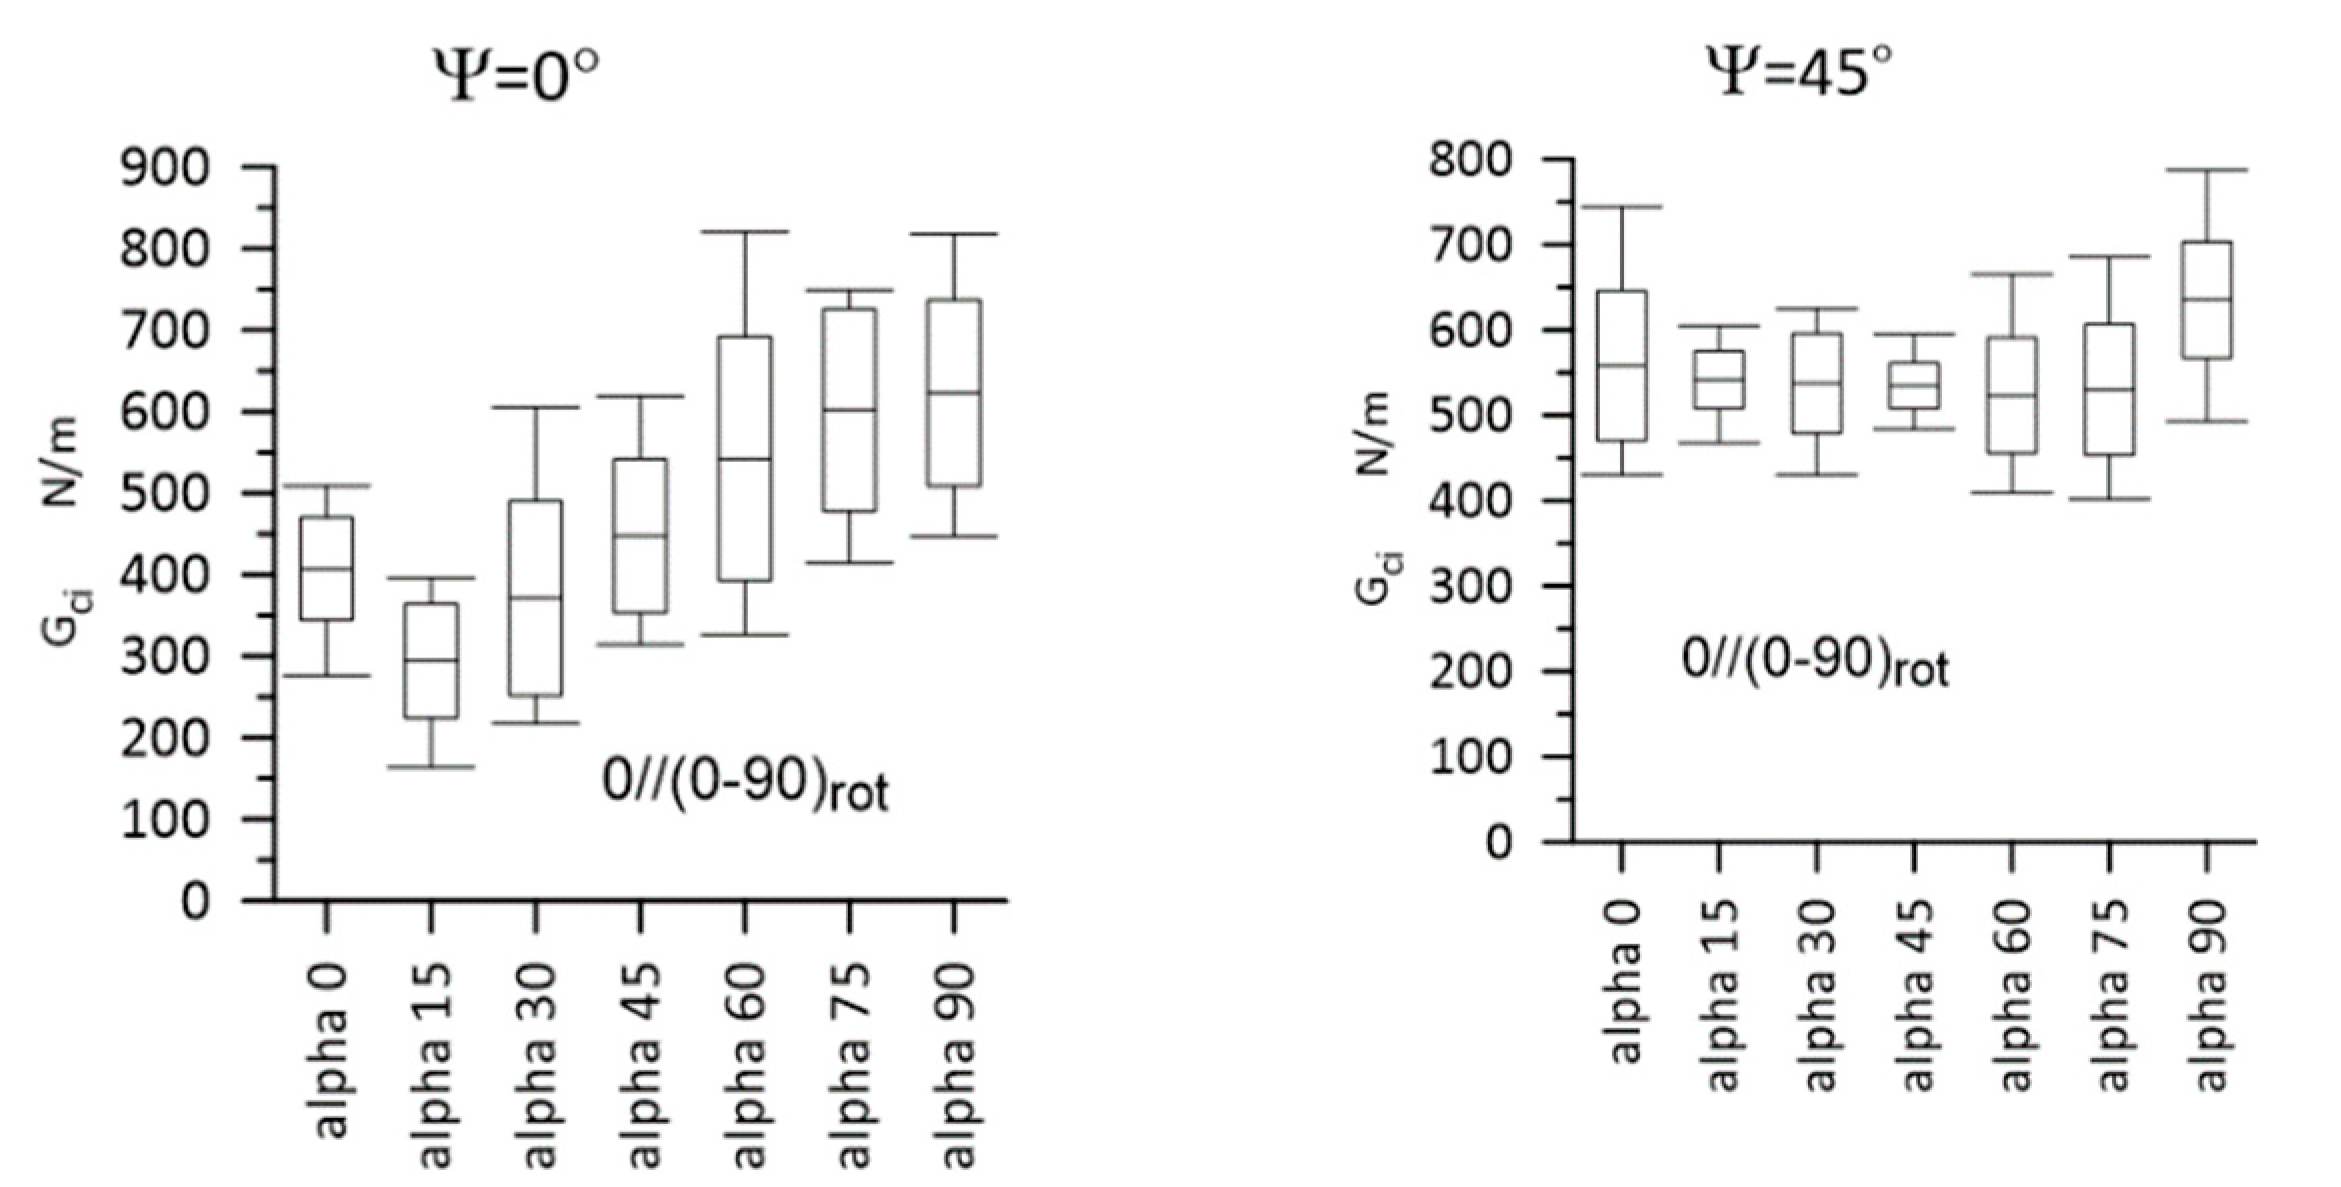
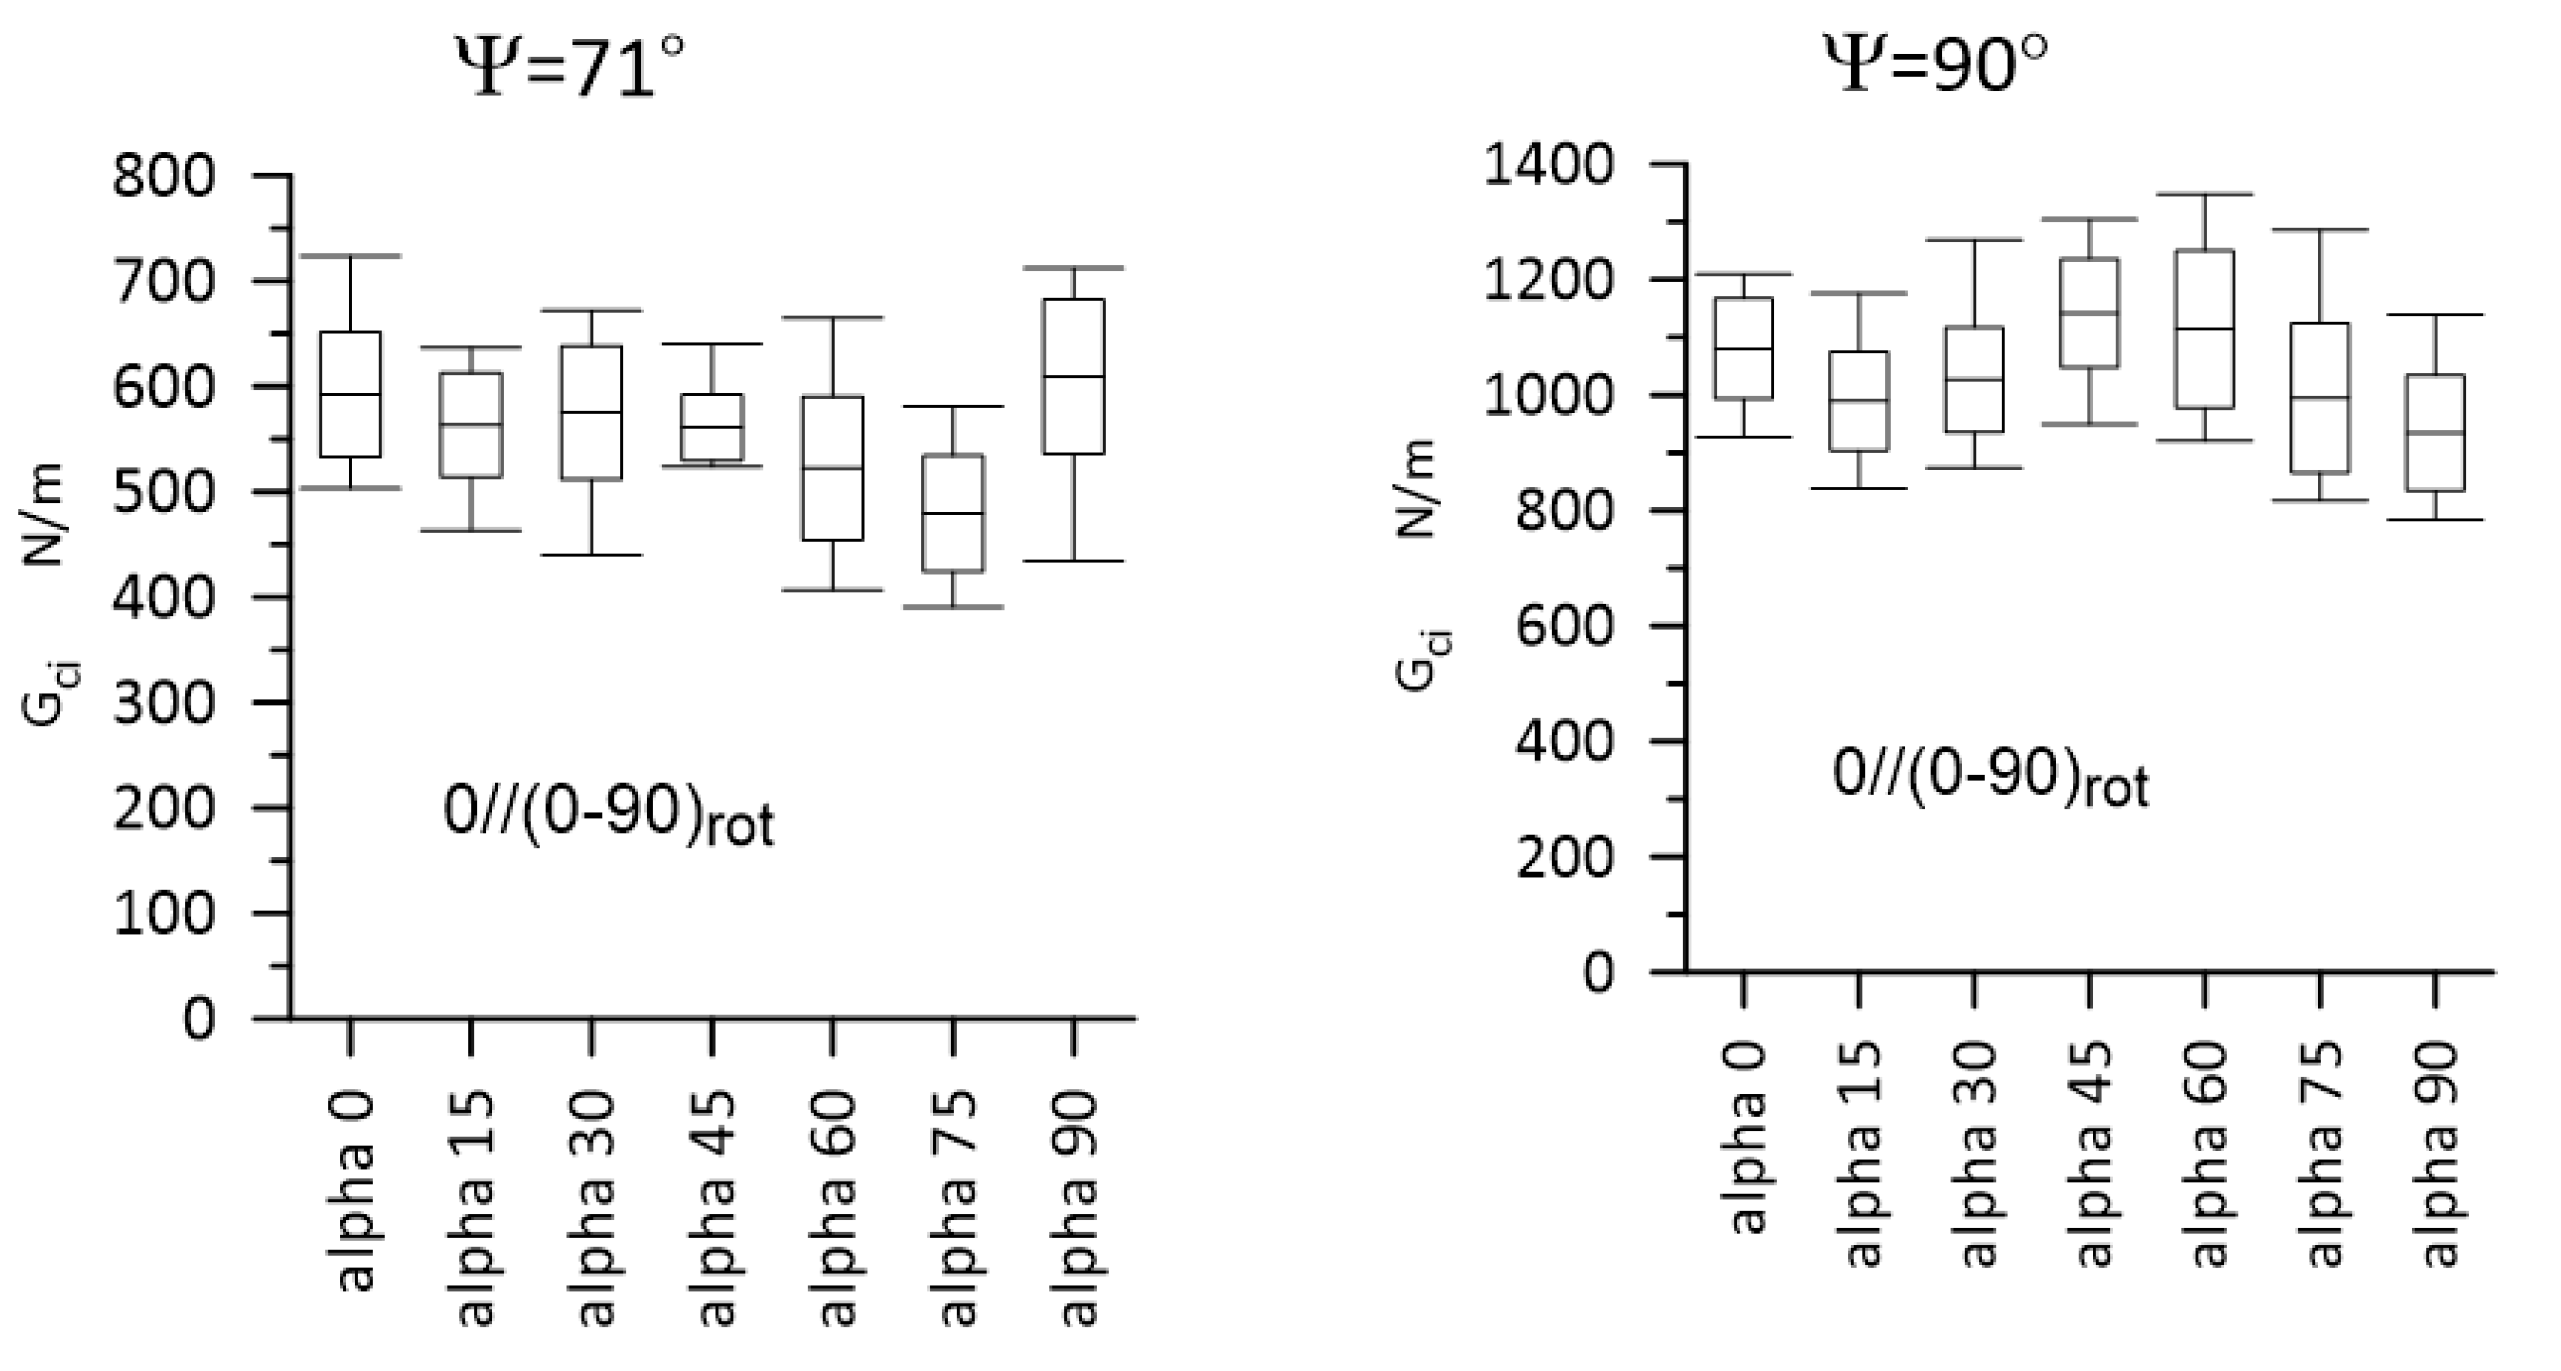
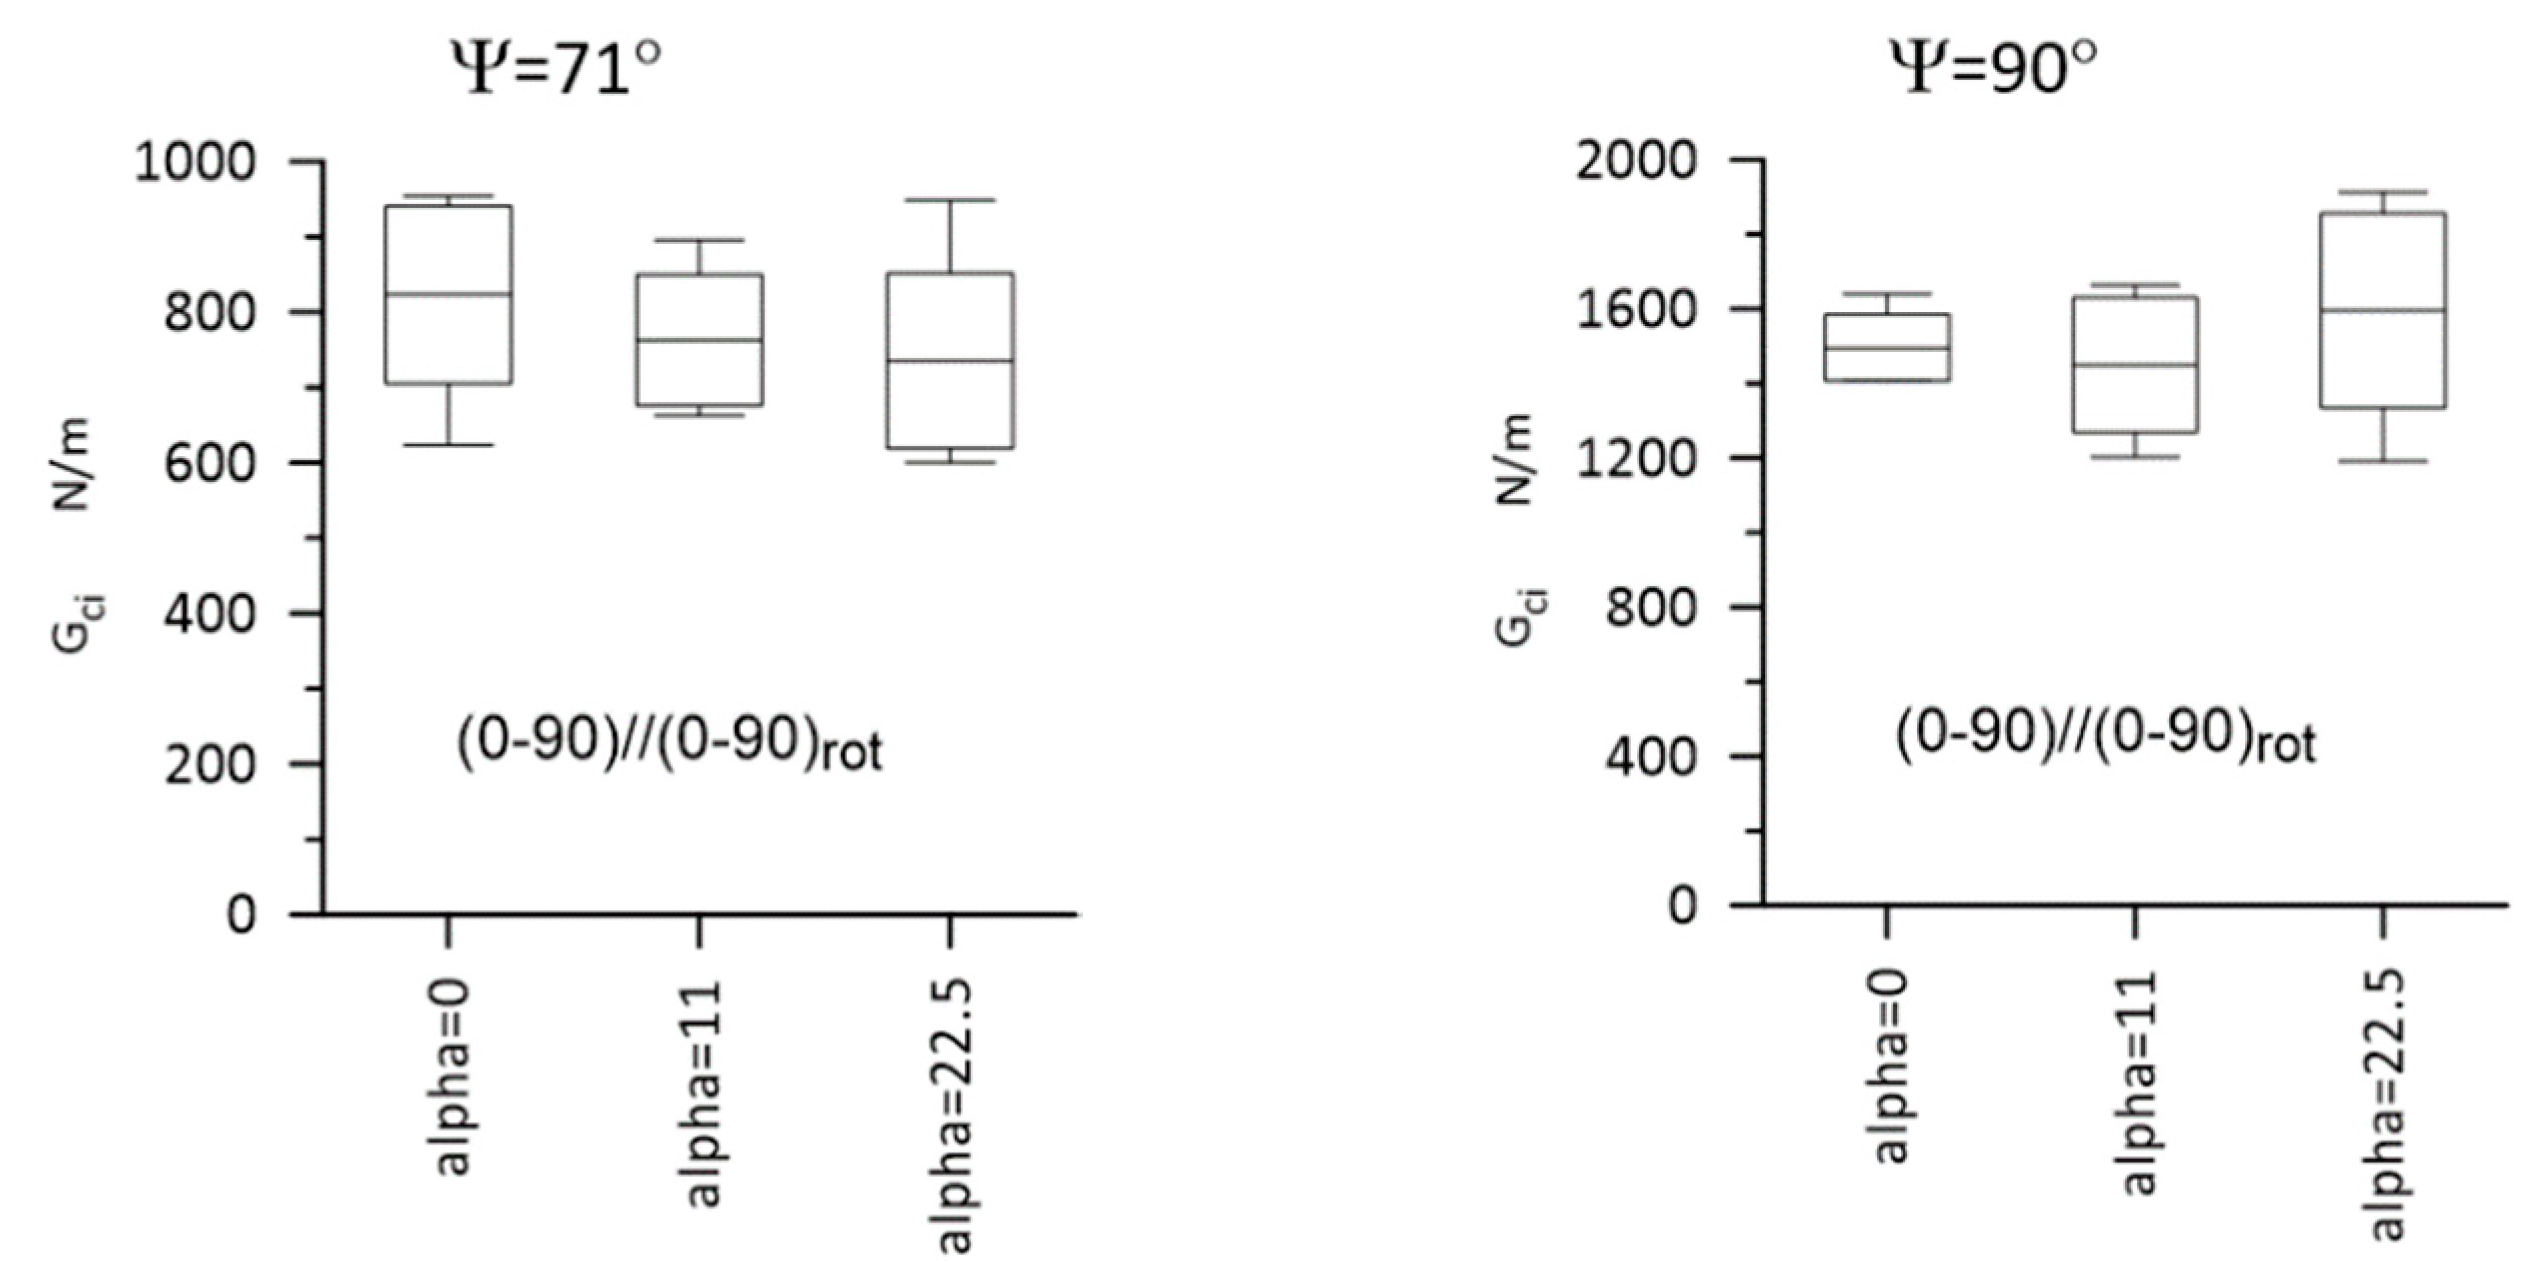
3.2. Experimental Results
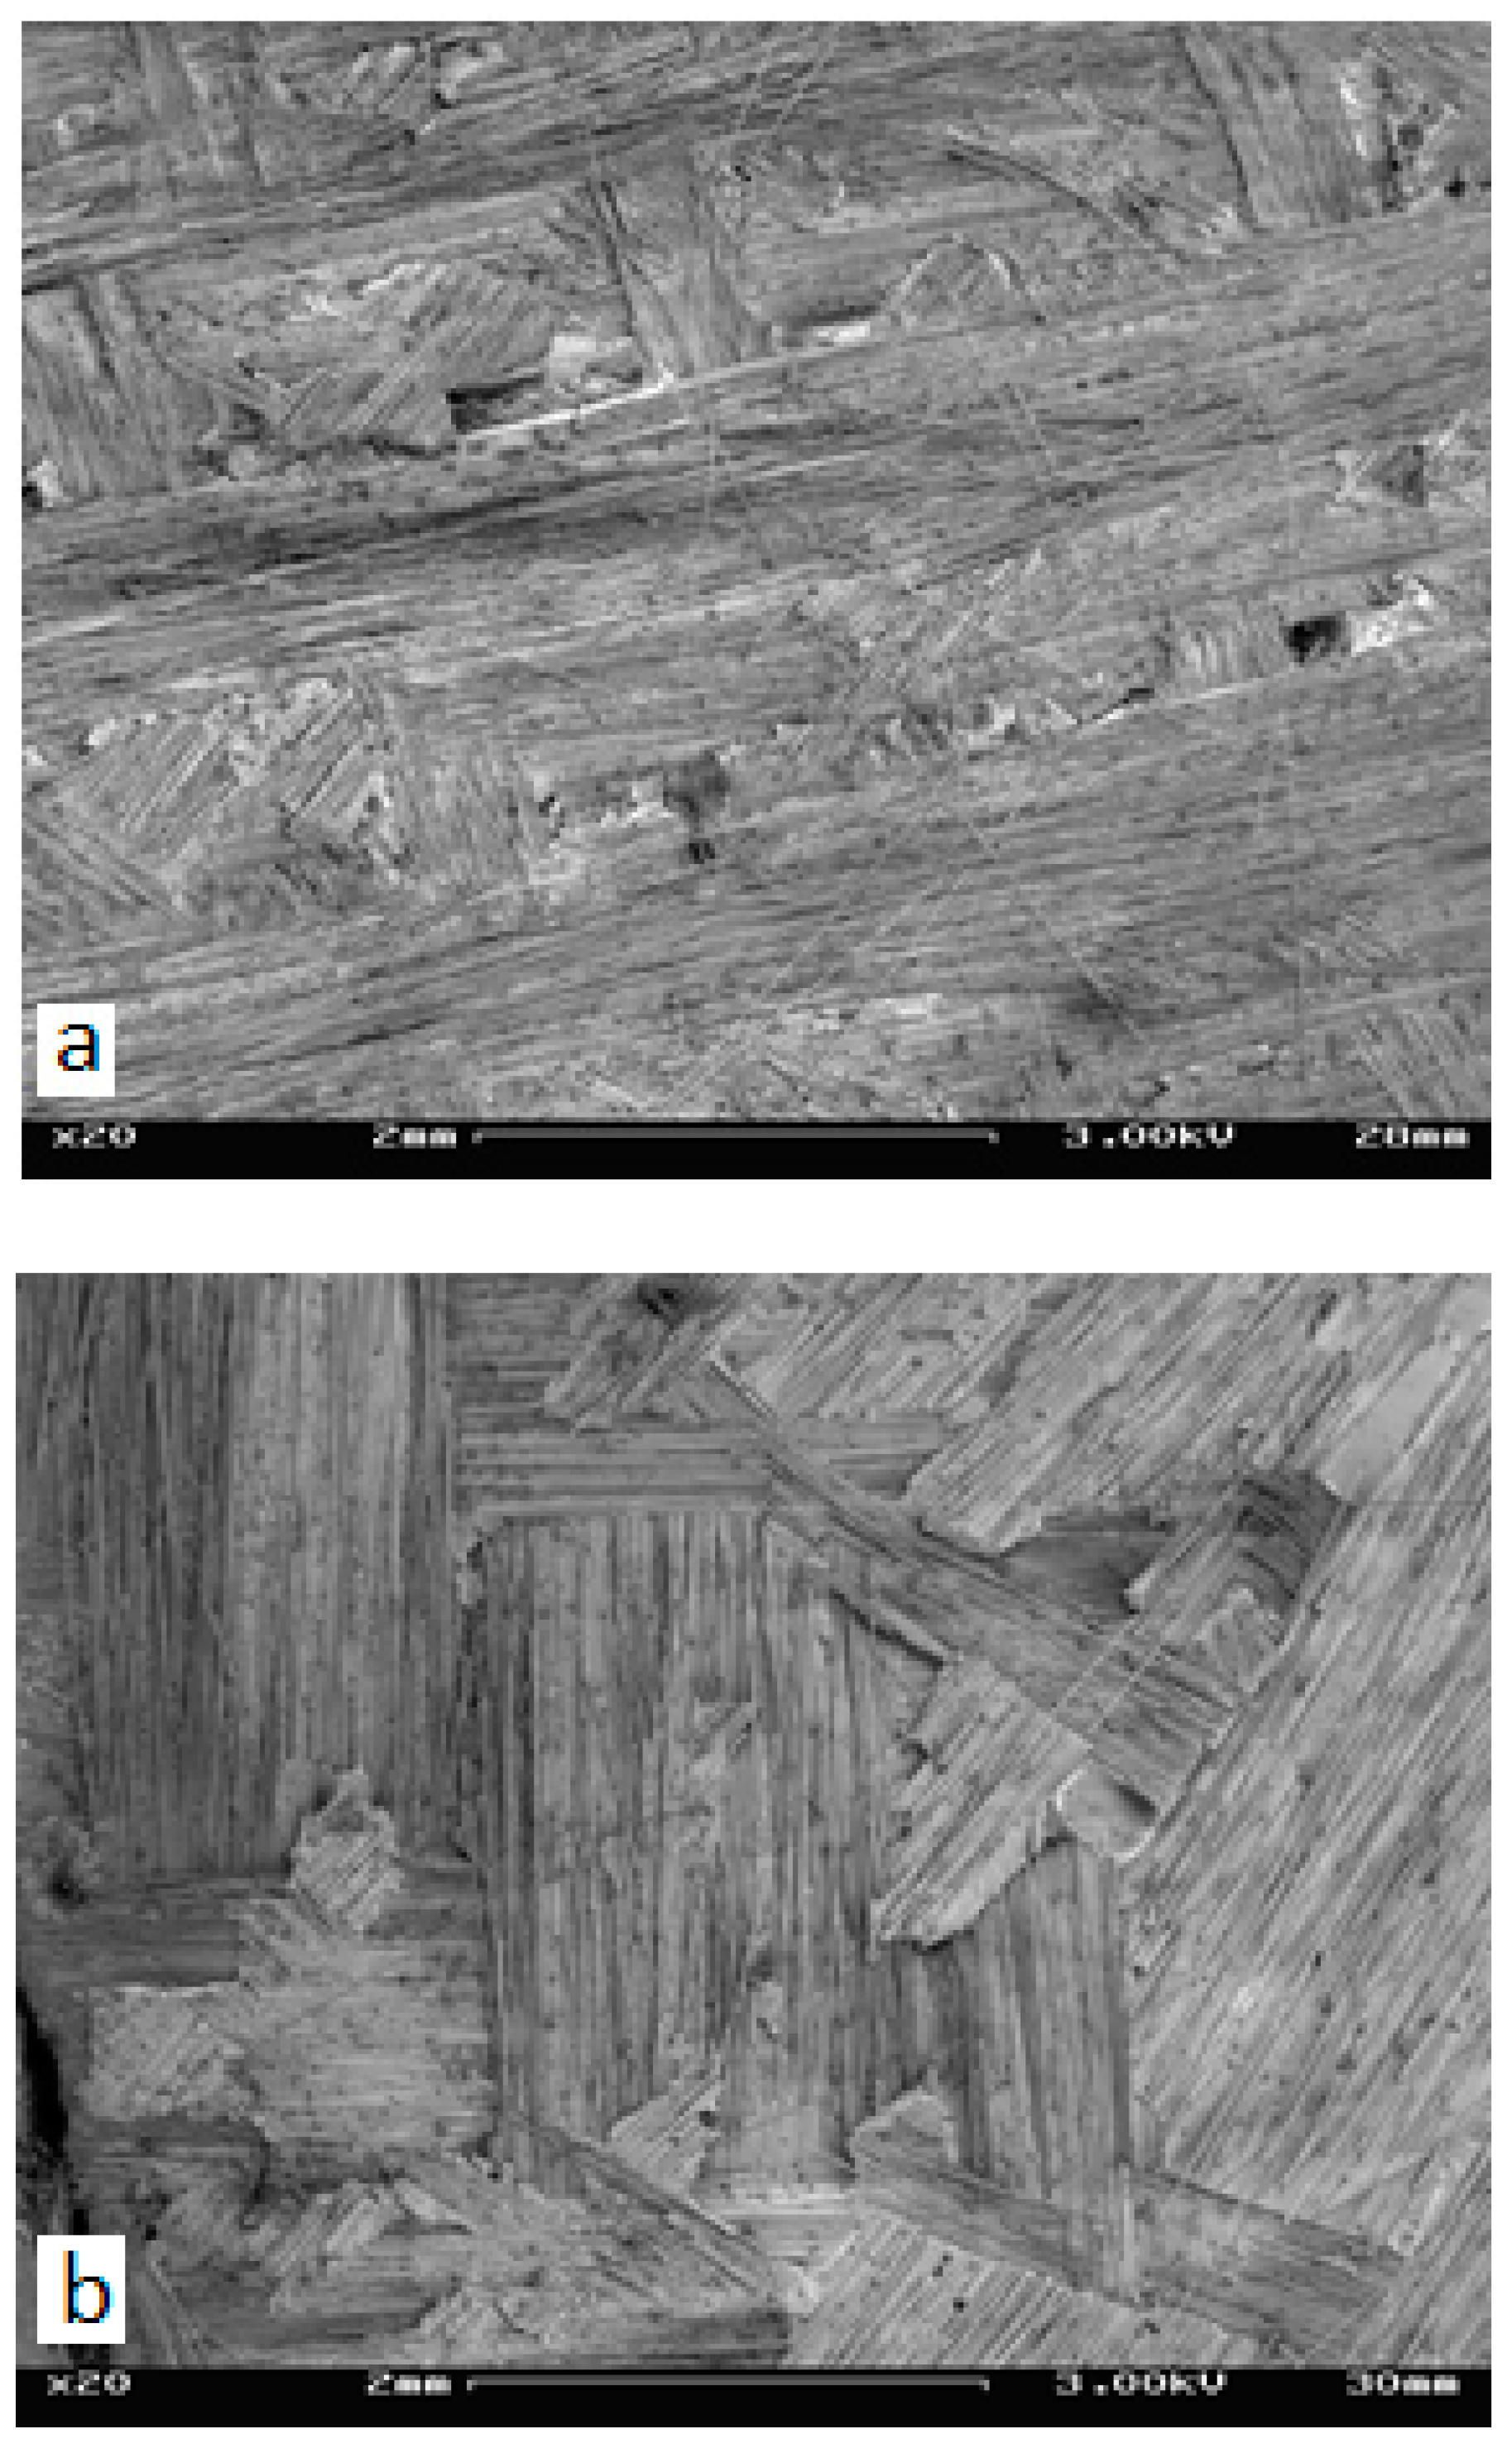
4. Discussion
5. Conclusions
Funding
Data Availability Statement
Conflicts of Interest
References
- Allix, O.; Leveque, D.; Perret, L. Identification and forecast of delamination in composite laminates by an interlaminar interface model. Compos. Sci. Technol. 1998, 58, 671–678. [Google Scholar] [CrossRef]
- Chou, I.; Kimpara, I.; Kageyama, K.; Ohsawa, I. Mode I and Mode II Fracture Toughness Measured between Differently Oriented Plies in Graphite/Epoxy Composites, Composite Materials: Fatigue and Fracture; ASTM STP 1230; Martin, R.H., Ed.; American Society for Testing and Materials: West Conshohocken, PA, USA, 1995; Volume 5, pp. 132–151. [Google Scholar]
- Ozdil, F.; Carlsson, L.A.; Davis, P. Beam analysis of angle-ply laminate end-notched flexure specimens. Compos. Sci. Technol. 1998, 58, 1929–1938. [Google Scholar] [CrossRef]
- Ozdil, F.; Carlsson, L.A. Beam analysis of angle-ply laminate DCB specimens. Compos. Sci. Technol. 1999, 59, 305–315. [Google Scholar] [CrossRef]
- Polaha, J.J.; Davidson, B.D.; Hudson, R.C.; Piera, C.A. Effects of Mode Ratio, Ply Orientation and Precracking on the Delamination Toughness of a Laminated Composite. J. Reinf. Plast. Compos. 1996, 15, 141–173. [Google Scholar] [CrossRef]
- Pereira, A.B.; de Morais, A.B. Mode I interlaminar fracture of carbon/epoxy multidirectional laminates. Compos. Sci. Technol. 2004, 64, 2261–2270. [Google Scholar] [CrossRef] [Green Version]
- Pereira, A.B.; de Morais, A.B. Mode II interlaminar fracture of glass/epoxy multidirectional laminates. Compos. Part A 2004, 35, 265–272. [Google Scholar] [CrossRef]
- Pereira, A.B.; de Morais, A.B. Mixed mode I + II interlaminar fracture of glass/epoxy multidirectional laminates—Part 2: Experiments. Compos. Sci. Technol. 2006, 66, 1896–1902. [Google Scholar] [CrossRef]
- Bin Mohamed Rehan, M.S.; Rousseau, J.; Fontaine, S.; Gong, X.J. Experimental study of the influence of ply orientation on DCB mode-I delamination behavior by using multidirectional fully isotropic carbon/epoxy laminates. Compos. Struct. 2017, 161, 1–7. [Google Scholar] [CrossRef]
- Rzeczkowski, J.; Samborski, S.; De Moura, M. Experimental Investigation of Delamination in Composite Continuous Fiber-Reinforced Plastic Laminates with Elastic Couplings. Materials 2020, 13, 5146. [Google Scholar] [CrossRef]
- Banks-Sills, L.; Ishbir, C.H.; Fourman, V.; Rogel, L.; Eliasi, R. Interface fracture toughness of a multi-directional woven, Composite. Int. J. Fract. 2013, 182, 187–207. [Google Scholar] [CrossRef]
- Chocron, T.; Banks-Sills, L. Nearly Mode I Fracture Toughness and Fatigue Delamination Propagation in a Multidirectional Laminate Fabricated by Wet Layup. Phys. Mezomech. 2019, 22, 103–134. [Google Scholar] [CrossRef]
- Banks-Sills, L.; Simon, I. Comparison of calculations of energy release rates for DCB multi-directional laminate specimens. Int. J. Fract. 2021, 231, 137–146. [Google Scholar] [CrossRef]
- Pichler, N.; Herraez, M.; Botsis, J. Mixed-mode fracture response of anti-symmetric laminates: Experiments and modeling. Compos. Part B 2020, 197, 108089. [Google Scholar] [CrossRef]
- Triki, E.; Zouari, B.; Jarraya, A.; Dammak, F. Ply Orientations Effect in the Fracture Toughness of Mixed Mode Delamination in E-Glass/Polyester Woven Fabrics. Des. Modeling Mech. Syst. 2013, 469–476. [Google Scholar] [CrossRef]
- Bican, I.E.; Mete Onur Kaman, M.O.; Erdem, S. Effect of fiber orientation on interfacial fracture toughness for adhesively bonded composite plates. J. Mech. Sci. Technol. 2020, 34, 757–764. [Google Scholar] [CrossRef]
- Rzeczkowski, J.; Samborski, S.; Paśnik, J. Experimental Investigation of Mechanically Coupled Composite Specimens in the ENF Test Configuration. In Proceedings of the IOP Conference Series: Materials Science and Engineering, 2018; IOP Publishing: Bristol, UK, 2018; Volume 416, p. 012041. [Google Scholar] [CrossRef]
- Ramji, A.; Xu, Y.; Grasso, M.; Yasaee, M.; Webb, P. Effect of interfacial fibre orientation and PPS veil density on delamination resistance of 5HS woven CFRP laminates under mode II loading. Compos. Sci. Technol. 2021, 207, 108735. [Google Scholar] [CrossRef]
- Raimondo, A.; Urcelay Oca, I.; Bisagni, C. Influence of interface ply orientation on delamination growth in composite laminates. J. Compos. Mater. 2021, 55, 3955–3972. [Google Scholar] [CrossRef]
- Blondeau, C.; Pappas, G.; Botsis, J. Influence of ply-angle on fracture in antisymmetric interfaces of CFRP Laminates. Compos. Struct. 2019, 216, 464–476. [Google Scholar] [CrossRef]
- Gong, Y.; Zhang, B.; Zhao, L.; Zhang, J.; Hua, N.; Zhang, C. R-curve behaviour of the mixed-mode I/II delamination in carbon/epoxy laminates with unidirectional and multidirectional interfaces. Compos. Struct. 2019, 223, 110949. [Google Scholar] [CrossRef]
- Hudișteanu, I.; Țăranu, N.; Isopescu, D.N.; Ungureanu, D.; Axinte, A.; Ghiga, D.A. The influence of fibre orientation and of the adjacent layers on the delamination of laminated composites. In Proceedings of the IOP Conference Series: Materials Science and Engineering, 2020; IOP Publishing: Bristol, UK, 2020; Volume 916, p. 012045. [Google Scholar] [CrossRef]
- Rubbrecht, P.H.; Verpoest, I. The development of two new test methods to determine the mode I and mode II fracture toughness for varying fibre orientation at the interface. In Proceedings of the 38th International SAMPE Symposium and Exhibition, Anaheim, CA, USA, 10–13 May 1993; pp. 875–887. [Google Scholar]
- Hwang, J.H.; Lee, C.S.; Hwang, W. Effect of Crack Propagation Directions on the Interlaminar Fracture Toughness of Carbon/Epoxy Composite Materials. Appl. Compos. Mater. 2001, 8, 411–433. [Google Scholar] [CrossRef]
- Czarnocki, P. Effect of reinforcement arrangement on distribution of GI, GII and GIII along fronts of circular delaminations in orthotropic composite plates. Eur. Struct. Integr. Soc. 2000, 27, 49–60. [Google Scholar] [CrossRef]
- ASTM. D5528-01. Standard Test Method for Mode I Interlaminar Fracture Toughness of Unidirectional Fiber-Reinforced Polymer Matrix Composites; ASTM International: West Conshohocken, PA, USA, 2017. [Google Scholar]
- ASTM. D6671-01. Standard Test Method for Mixed Mode I—Mode II Interlaminar Fracture Toughness of Unidirectional Fiber-Reinforced Polymer Matrix Composites; ASTM International: West Conshohocken, PA, USA, 2017. [Google Scholar]
- ASTM. D7905. Standard Test Method for Determination of the Mode II Interlaminar Fracture Toughness of Unidirectional Fiber-Reinforced Polymer Matrix Composites; ASTM International: West Conshohocken, PA, USA, 2017. [Google Scholar]
- Vannucci, P.; Verchery, G. A new method for generating fully isotropic laminates. Compos. Struct. 2002, 58, 75–82. [Google Scholar] [CrossRef]
- Davidson, B.D.; Schapery, R.A. Effect of Finite Width on Deflection and Energy Release Rate of an Orthotropic Double Cantilever Beam Specimen. J. Compos. Mater. 1988, 22, 640–656. [Google Scholar] [CrossRef]
- Davidson, B.D. An Analytical of Delamination Front Curvature in Double Cantilever Beam Specimens. J. Compos. Mater. 1990, 24, 1124–1137. [Google Scholar] [CrossRef]
- Jones, R.J. Mechanics of Composite Materials; Script Book Company: Washington, DC, USA, 1975; p. 53. [Google Scholar]
- Davidson, B.D.; Krüger, R.; König, M. Effect of Stacking Sequence on Energy Release Rate Distributions in Multidirectional DCB and ENF Specimens. Eng. Fract. Mech. 1996, 55, 557–569. [Google Scholar] [CrossRef]
- Ansys©. Release 15.0. Available online: https://dokumen.tips/documents/ansys-mechanical-apdl-theory-reference-15pdf.html (accessed on 26 May 2021).
- Rybicki, E.F.; Kanninen, M.F. A finite element calculations of stress intensity factors by a Modified Crack Closure Integral. Eng. Fract. Mech. 1977, 9, 931–938. [Google Scholar] [CrossRef]
- Available online: https://www.easycalculation.com/statistics/fishers-lsd-calculator.php.com/statistics/fishers-lsd-calculator.phphttps://www.easycalculation.com/statistics/fishers-lsd-calculator.php (accessed on 20 August 2021).
- Available online: https://www.statskingdom.com/320ShapiroWilk.html (accessed on 20 August 2021).
- Available online: https://www.statskingdom.com/230var_levenes.html (accessed on 20 August 2021).
- Pruslow, D. Some fundamental aspects of composite fractography. Composites 1981, 12, 241–247. [Google Scholar] [CrossRef]
- Pruslow, D. Matrix fractography of fibre-reinforced epoxy composites. Composites 1986, 17, 289–303. [Google Scholar] [CrossRef]
- Czarnocki, P. Fractography of interlaminar fracture of gf/epoxy laminates, reinforced with fabrics. Compos. Theory Pract. 2017, 17, 156–161. [Google Scholar]


| Material | E11 N/mm2 | E22 N/mm2 | G12 N/mm2 | ν12 |
|---|---|---|---|---|
| Laminate reinforced with Interglas 92125 | 23,000 * | 23,000 * | 4200 ** | 0.13 * |
| Laminate reinforced with Interglas 92145 | 32,000 * | 8400 * | 3500 ** | 0.33 * |
| Al 2024 ta | E11 = E22 = E = 72,000 | 27,700 | 0.3 | |
 | Ex N/mm2 | Ey N/mm2 | Gxy N/mm2 | νxy | |
|---|---|---|---|---|---|
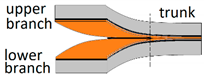
| Beam specimen encapsulating Laminate A | Trunk | 63,870 | 62,950 | 2400 | 0.3 |
| Upper branch | 59,930 | 59,930 | 2314 | 0.3 | |
| Lower branch | 62,680 | 59,230 | 2200 | 0.29 | |
| Beam specimen encapsulating Laminate B | Trunk | 63,520 | 63,520 | 2403 | 0.3 |
| Upper branch | 59,930 | 59,930 | 2314 | 0.3 | |
| Lower branch | 61,440 | 61,440 | 2214 | 0.28 | |
| average | 61,895 | 61,167 | 2308 | 0.295 | |
| Ψ | αi vs. αj | DBM | LSD |
|---|---|---|---|
| 0° | α = 0° vs. α = 60° | 135 | 131 |
| α = 0° vs. α = 75° | 195 | 131 | |
| α = 0° vs. α = 90° | 216 | 131 | |
| α = 15° vs. α = 45 ° | 153 | 131 | |
| α = 15° vs. α = 60 ° | 248 | 131 | |
| α = 15° vs. α = 75 ° | 307 | 131 | |
| α = 15° vs. α = 90° | 329 | 131 | |
| α = 30° vs. α = 60° | 171 | 131 | |
| α = 30° vs. α = 75° | 231 | 131 | |
| α = 30° vs. α = 90° | 252 | 131 | |
| α = 45° vs. α = 75° | 155 | 131 | |
| α = 45° vs. α = 90° | 176 | 131 | |
| 45° (GII/GI = 1) | α = 15° vs. α = 90° | 94 | 78 |
| α = 30° vs. α = 90° | 98 | 78 | |
| α = 45° vs. α = 90° | 101 | 78 | |
| α = 60° vs. α = 90° | 112 | 78 | |
| α = 75° vs. α = 90° | 105 | 78 | |
| 71° (GII/GI = 1.7) | α = 0° vs. α = 75° | 113 | 72 |
| α = 15° vs. α = 75° | 84 | 72 | |
| α = 30° vs. α = 75° | 96 | 72 | |
| α = 45° vs. α = 75° | 82 | 72 | |
| α = 60° vs. α = 90° | 87 | 72 | |
| α = 75° vs. α = 90° | 130 | 72 | |
| 90° | α = 0° vs. α = 90° | 146 | 130 |
| α = 15° vs. α = 45° | 152 | 130 | |
| α = 45° vs. α = 75° | 147 | 130 | |
| α = 45° vs. α = 90° | 208 | 130 | |
| α = 60° vs. α = 90° | 180 | 130 |
| Ψ | αi vs. αj | DBM | LSD |
|---|---|---|---|
| 0° | α = 0° vs. α = 22.5° | 155 | 102 |
| 45° (GII/GI = 1) | α = 0° vs. α = 15° | 52.4 | 52.3 |
Publisher’s Note: MDPI stays neutral with regard to jurisdictional claims in published maps and institutional affiliations. |
© 2021 by the author. Licensee MDPI, Basel, Switzerland. This article is an open access article distributed under the terms and conditions of the Creative Commons Attribution (CC BY) license (https://creativecommons.org/licenses/by/4.0/).
Share and Cite
Czarnocki, P. Resistance of Polymeric Laminates Reinforced with Fabrics against the Growth of Delaminations. Materials 2021, 14, 7367. https://doi.org/10.3390/ma14237367
Czarnocki P. Resistance of Polymeric Laminates Reinforced with Fabrics against the Growth of Delaminations. Materials. 2021; 14(23):7367. https://doi.org/10.3390/ma14237367
Chicago/Turabian StyleCzarnocki, Piotr. 2021. "Resistance of Polymeric Laminates Reinforced with Fabrics against the Growth of Delaminations" Materials 14, no. 23: 7367. https://doi.org/10.3390/ma14237367
APA StyleCzarnocki, P. (2021). Resistance of Polymeric Laminates Reinforced with Fabrics against the Growth of Delaminations. Materials, 14(23), 7367. https://doi.org/10.3390/ma14237367