
Thermal Characterization of Medium-Temperature Phase Change Materials (PCMs) for Thermal Energy Storage Using the T-History Method


Abstract
:
1. Introduction
2. Materials, Methods and Experimental Set-Up
2.1. Materials
2.2. T-History Method
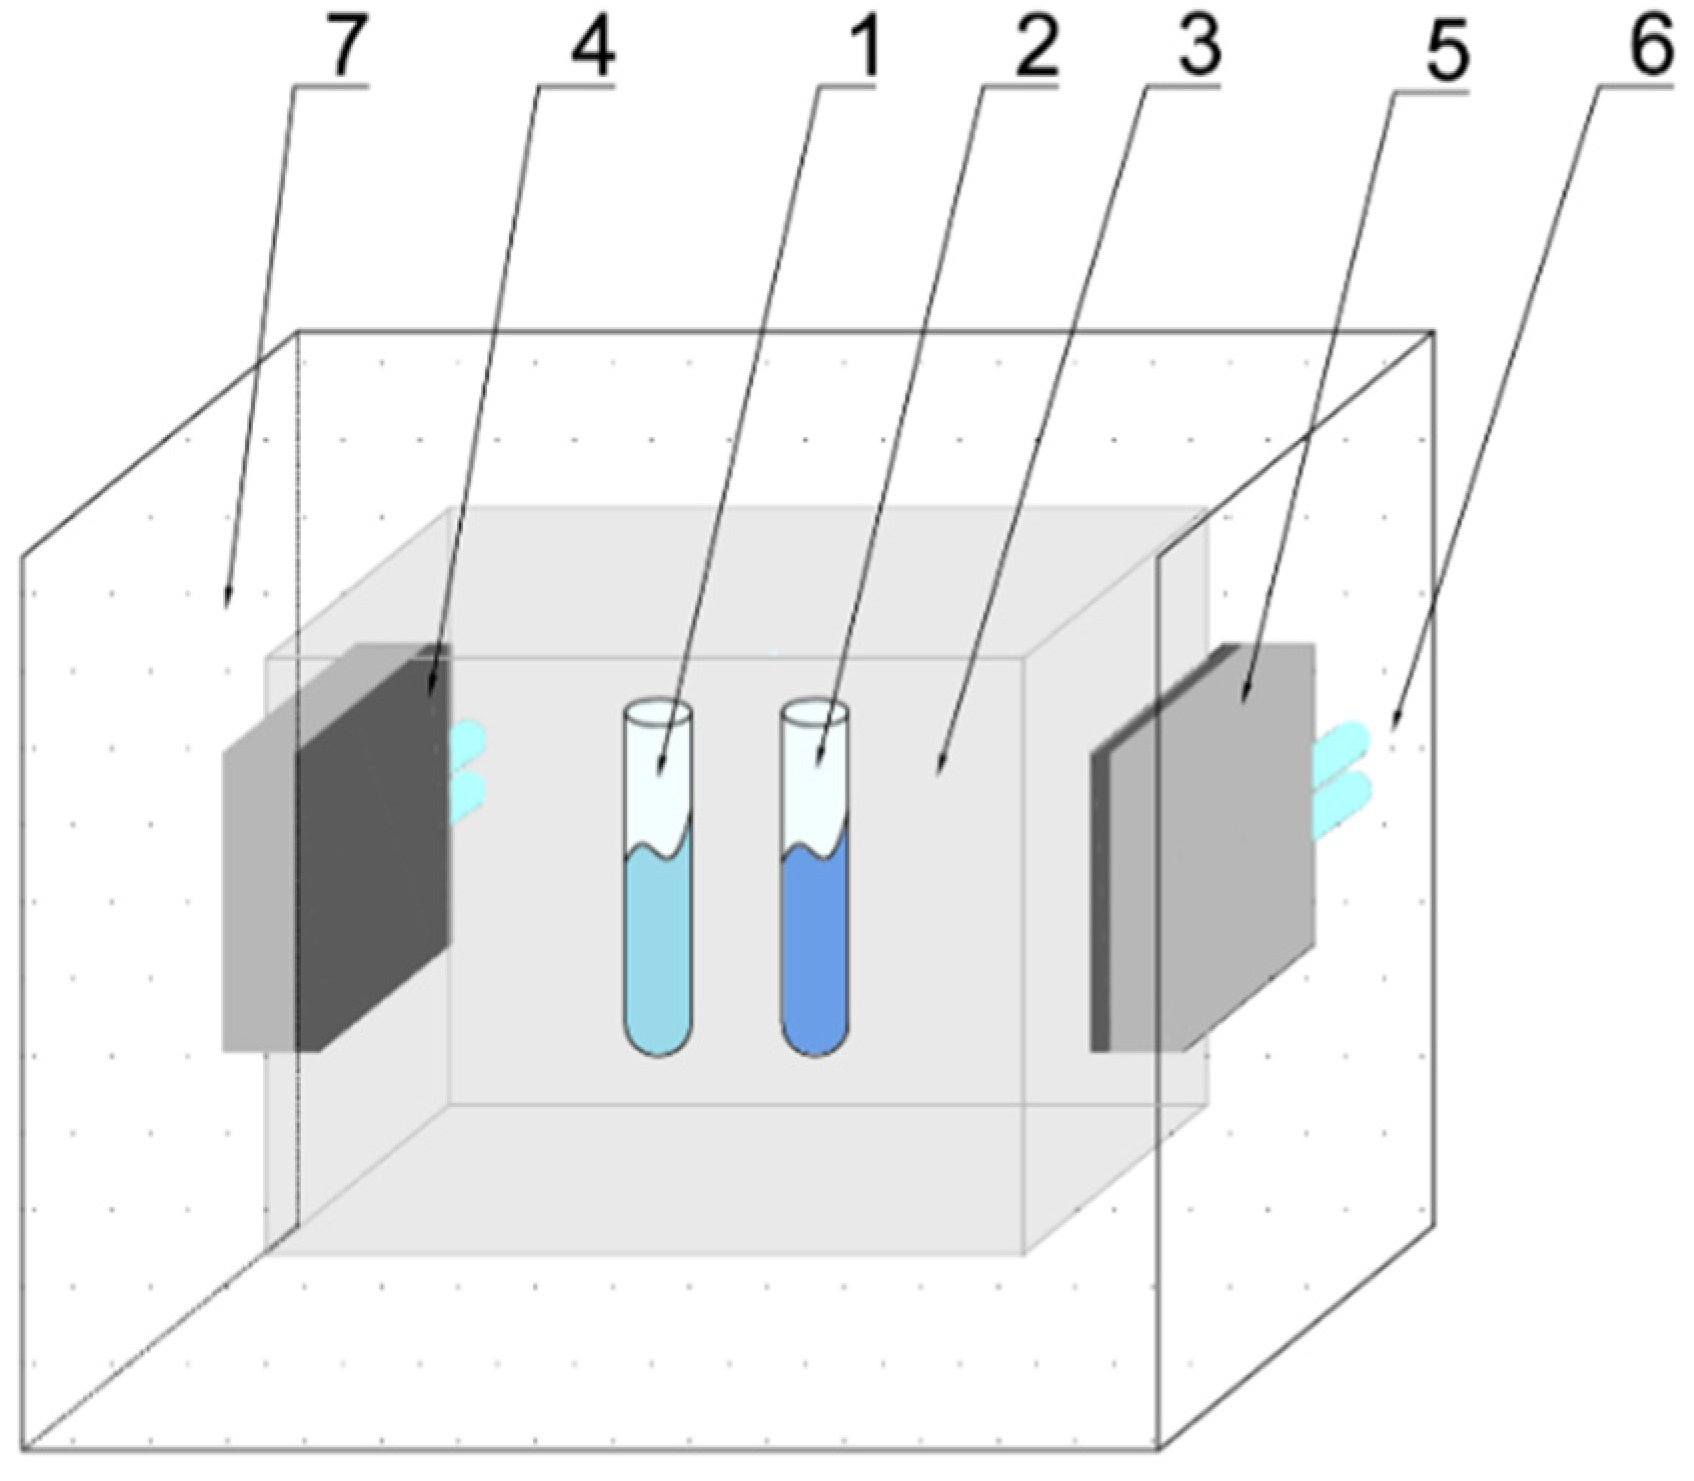
2.3. Experimental Set-Up for T-History Method
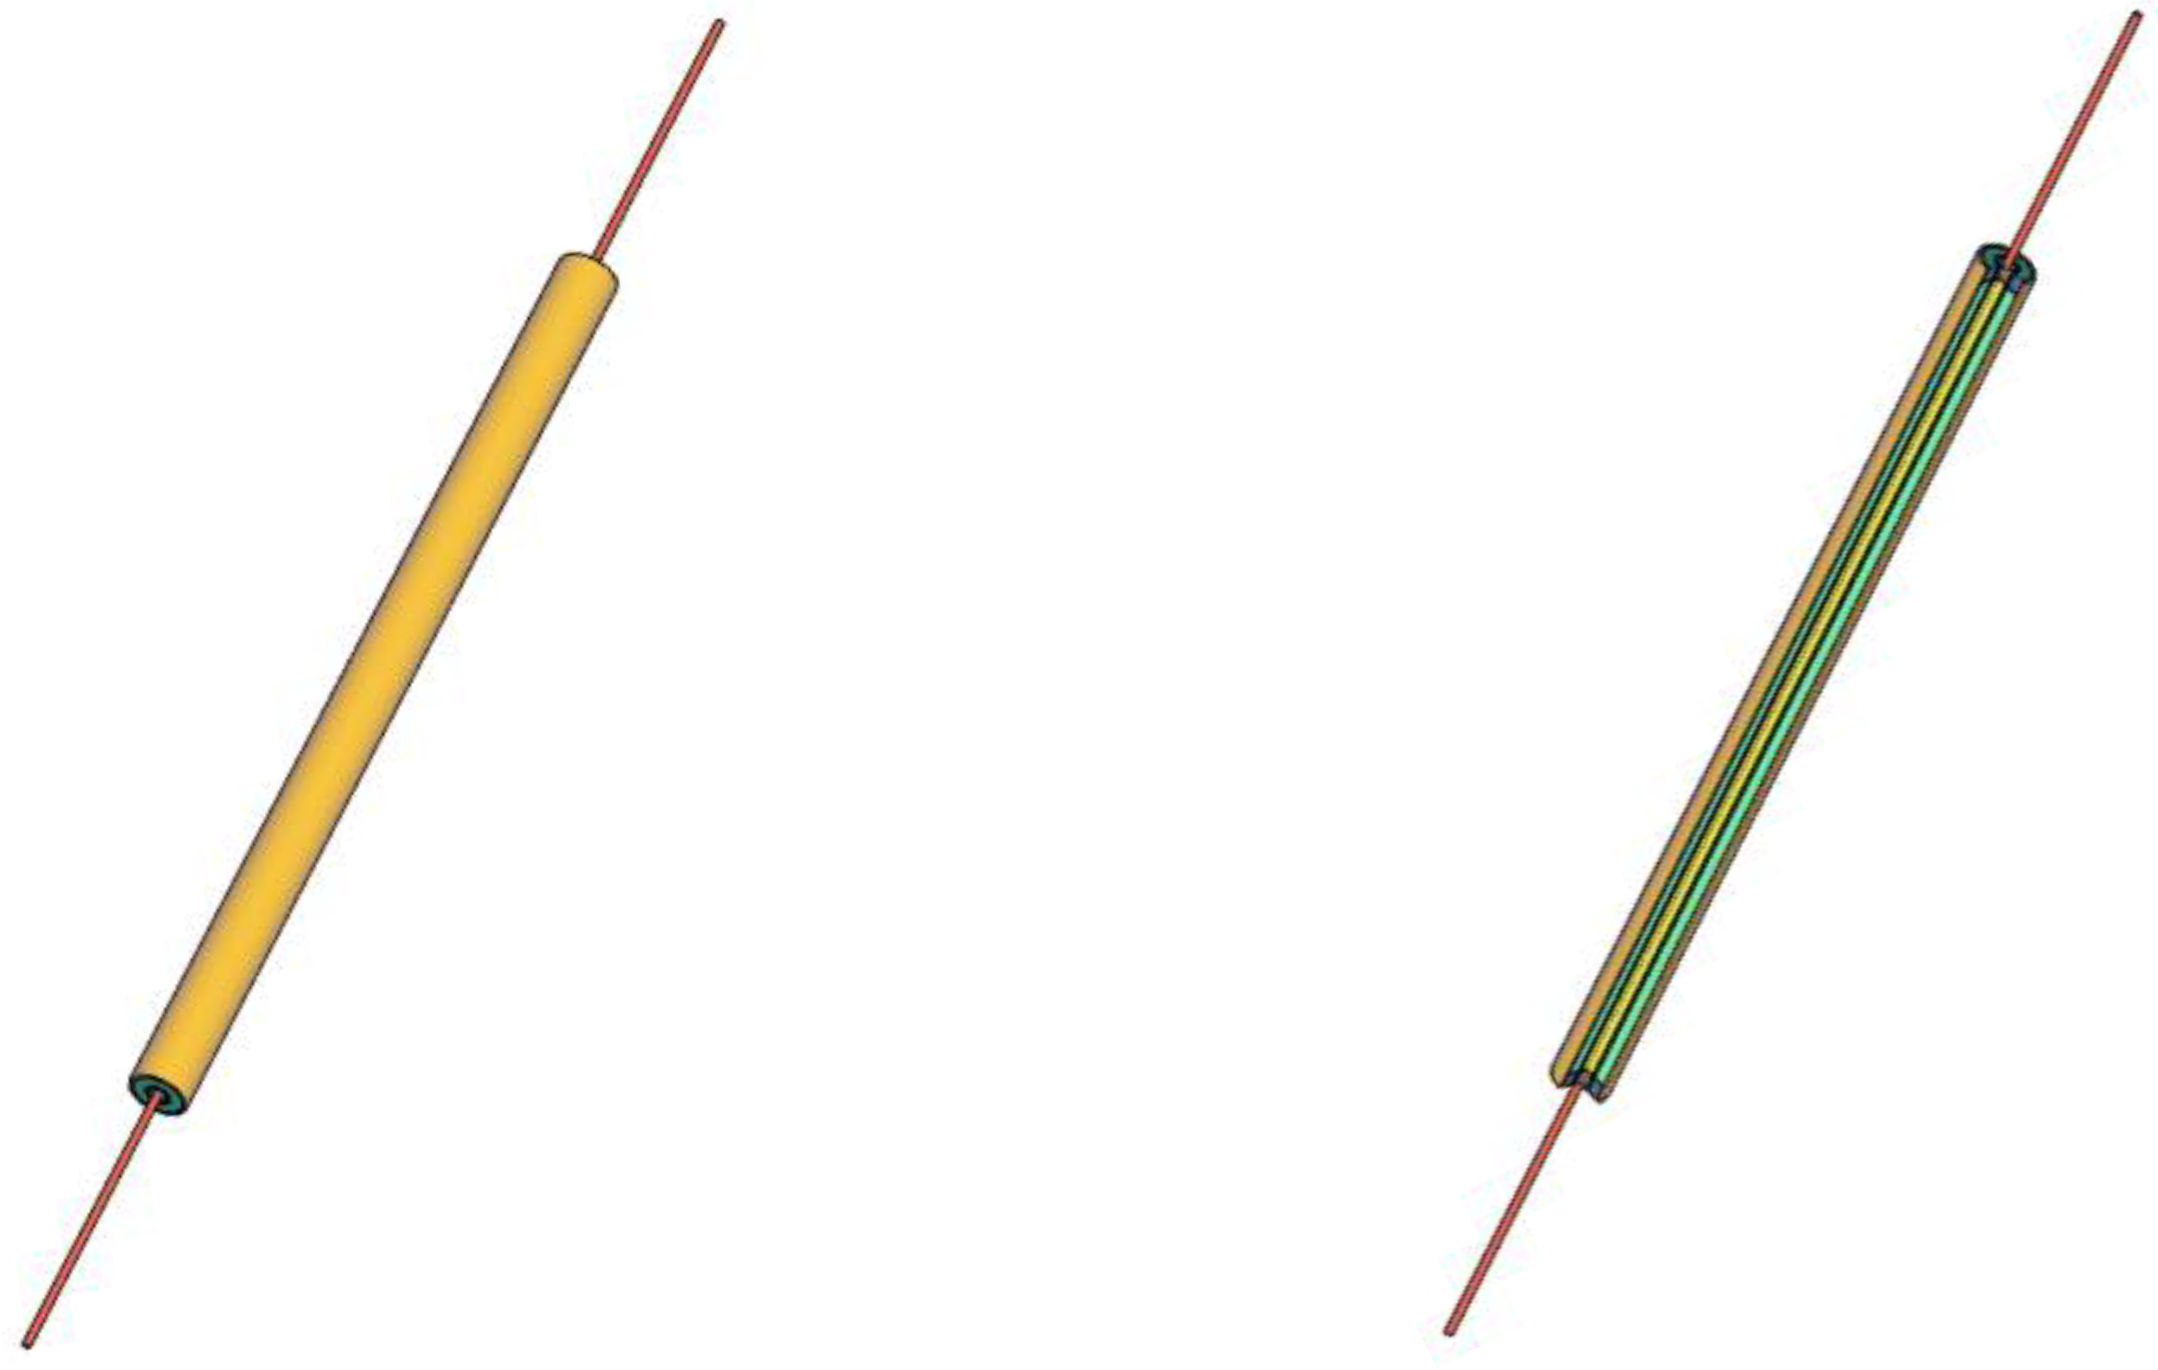
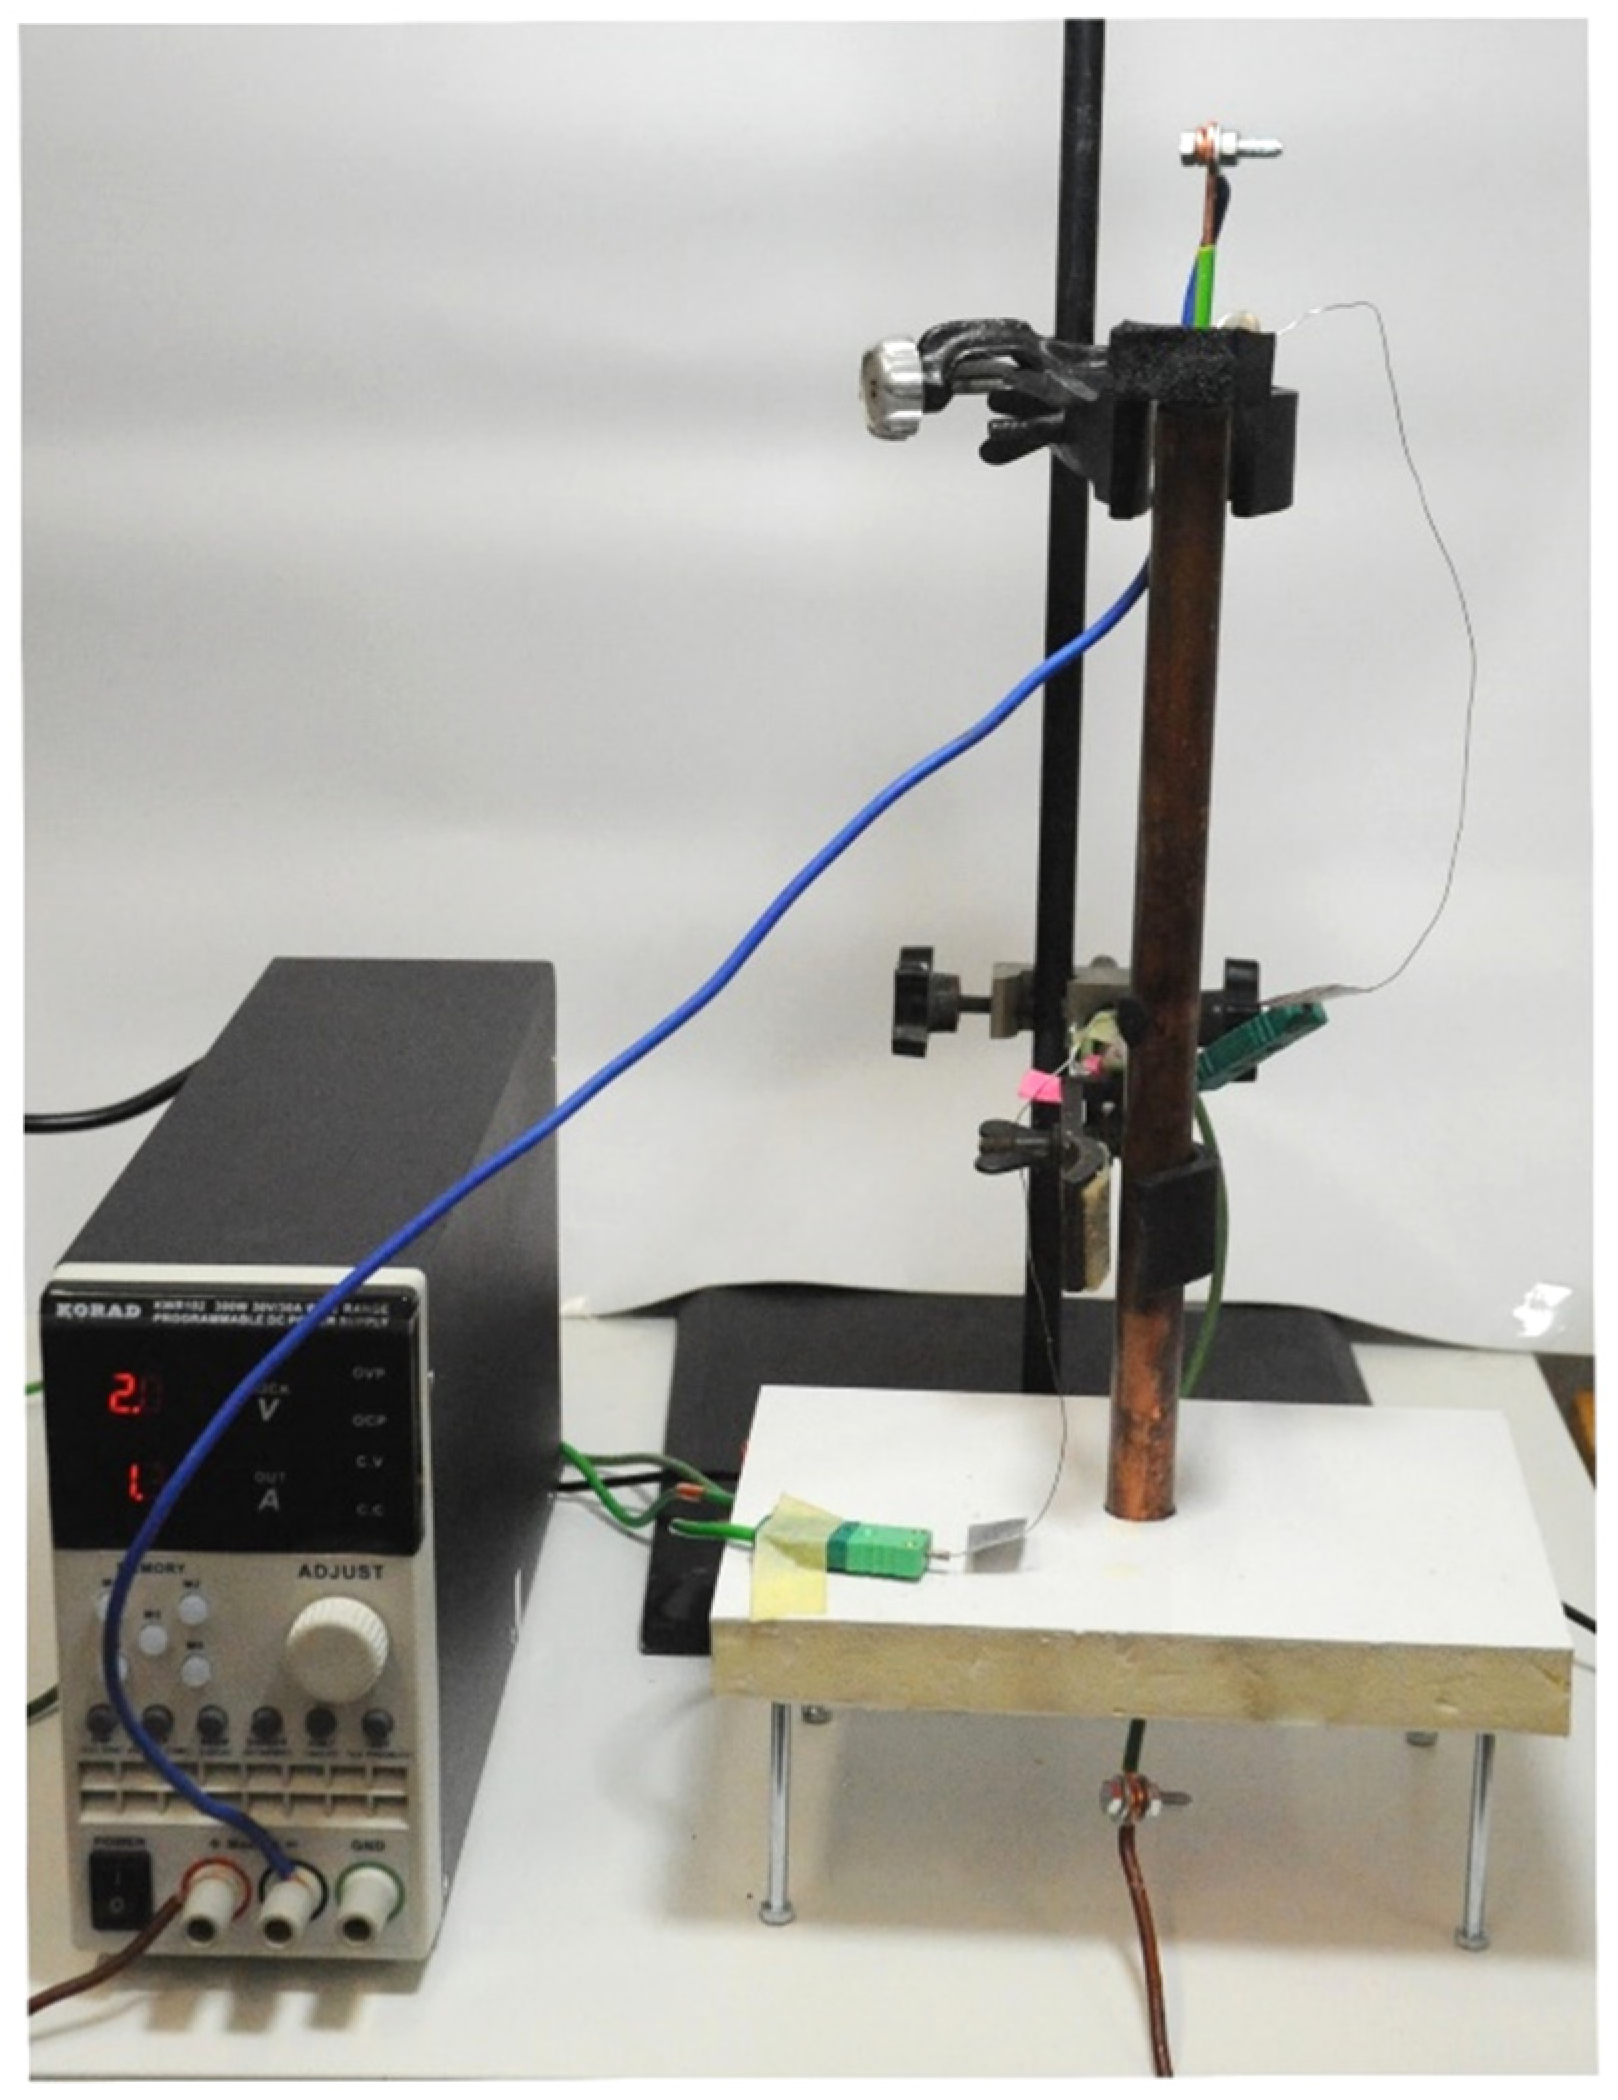
2.4. Thermal Conductivity of PCMs—Measurement Method and Device
2.5. Measurement Uncertainty
3. Results
3.1. OM65
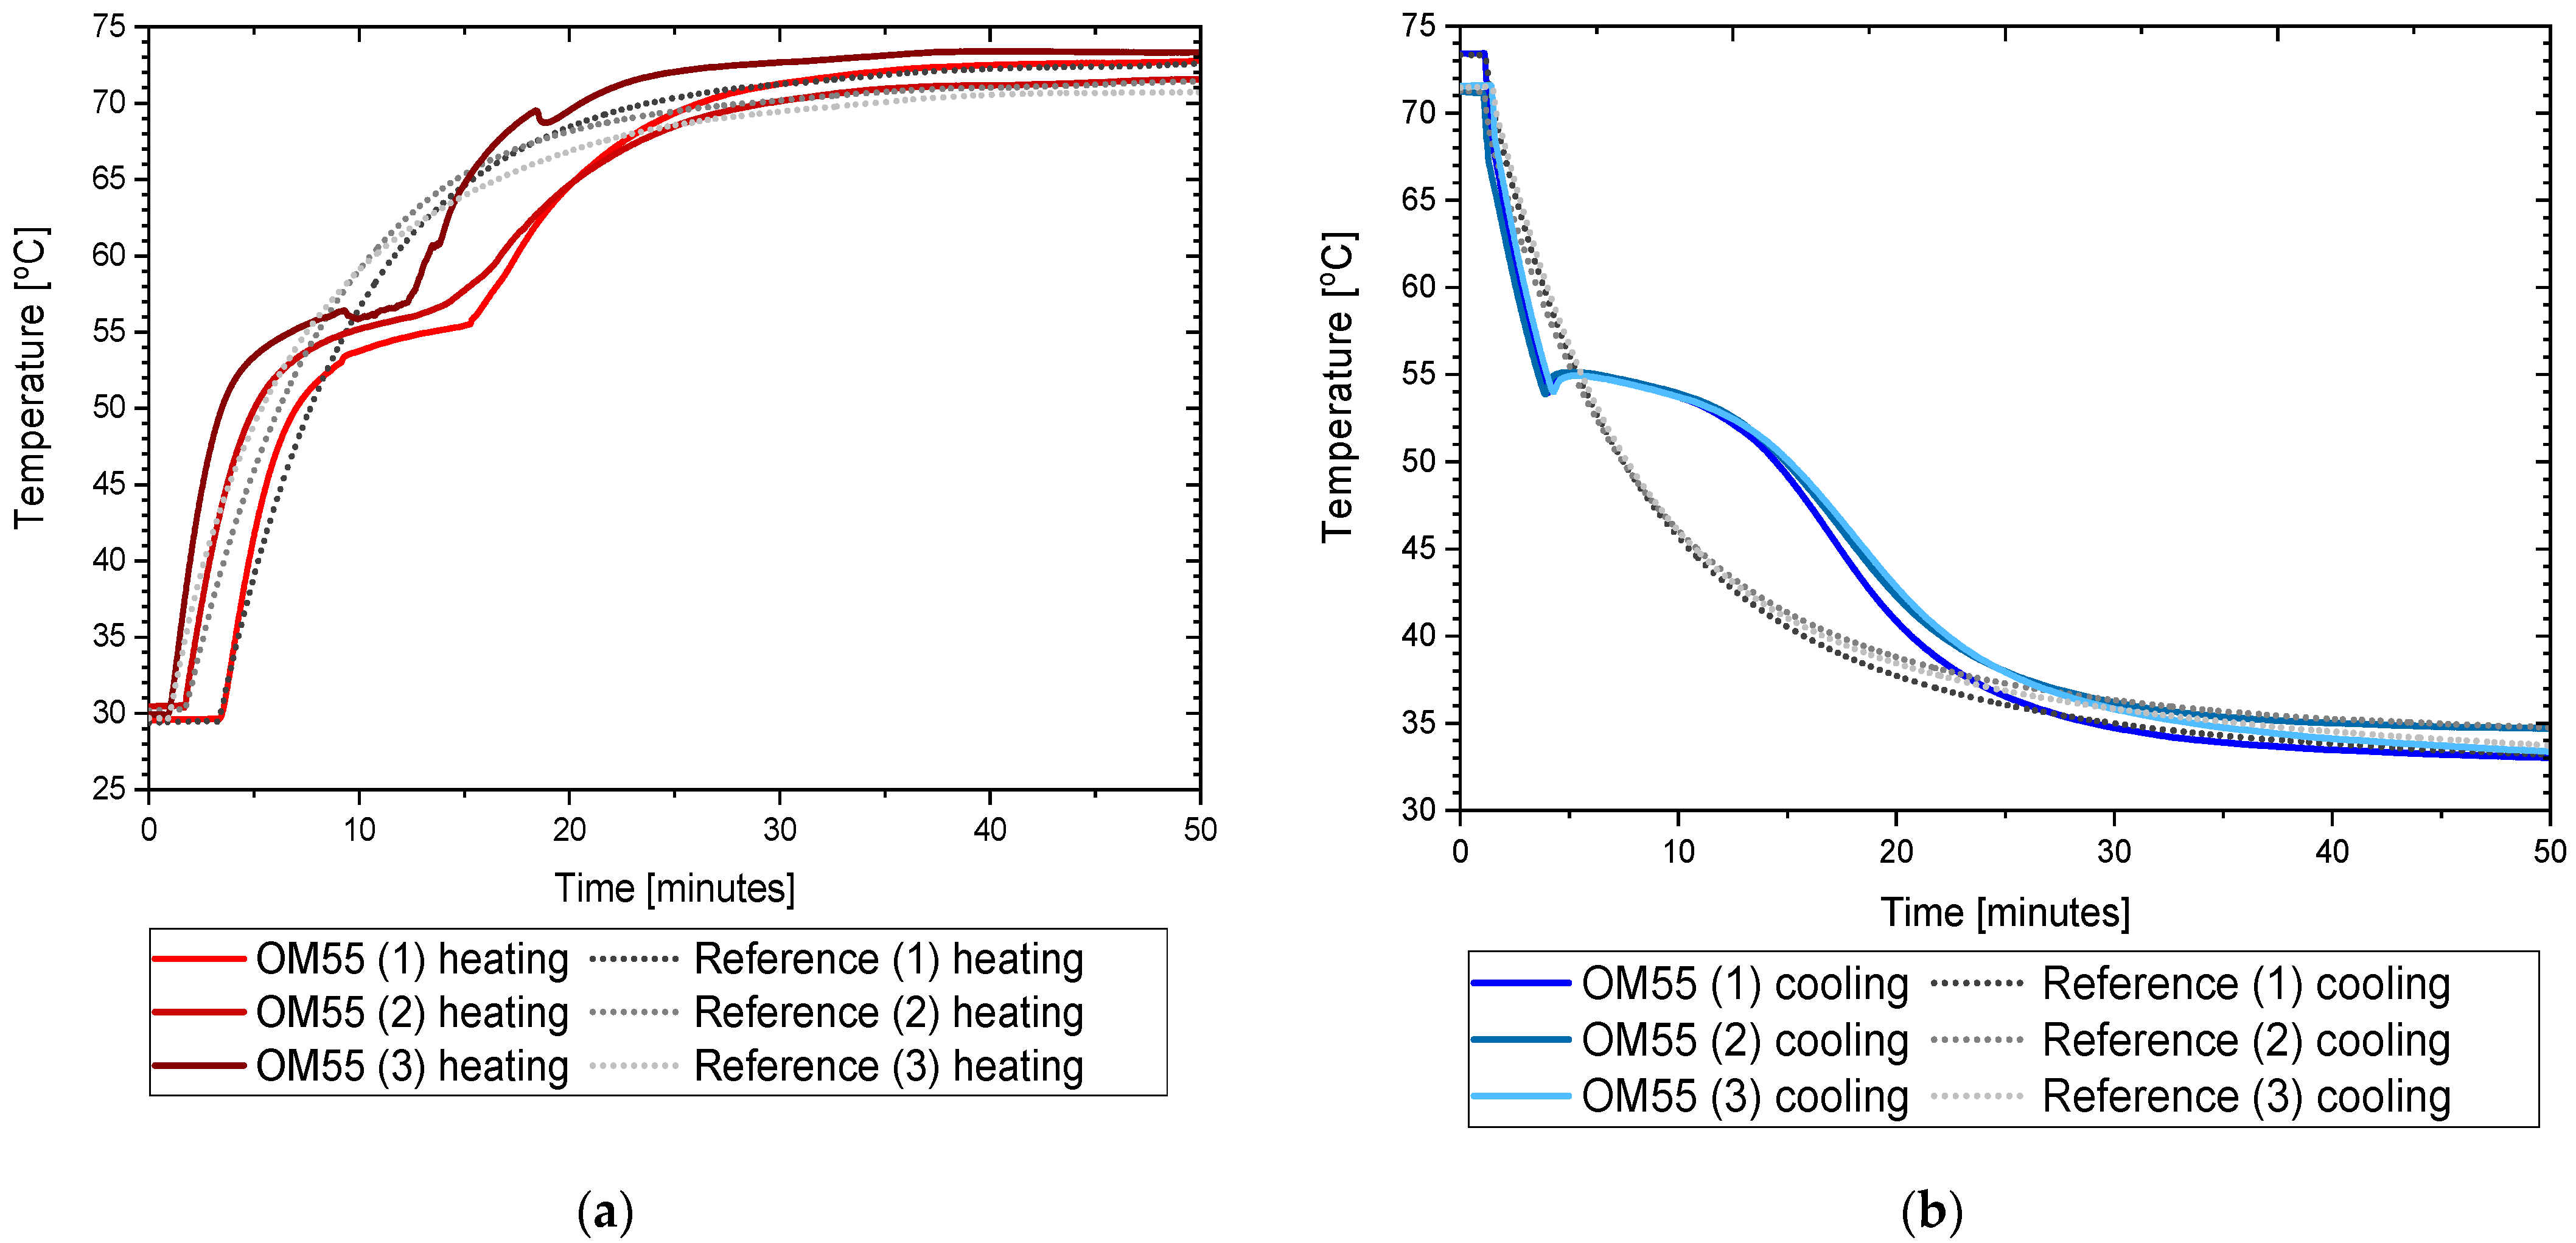
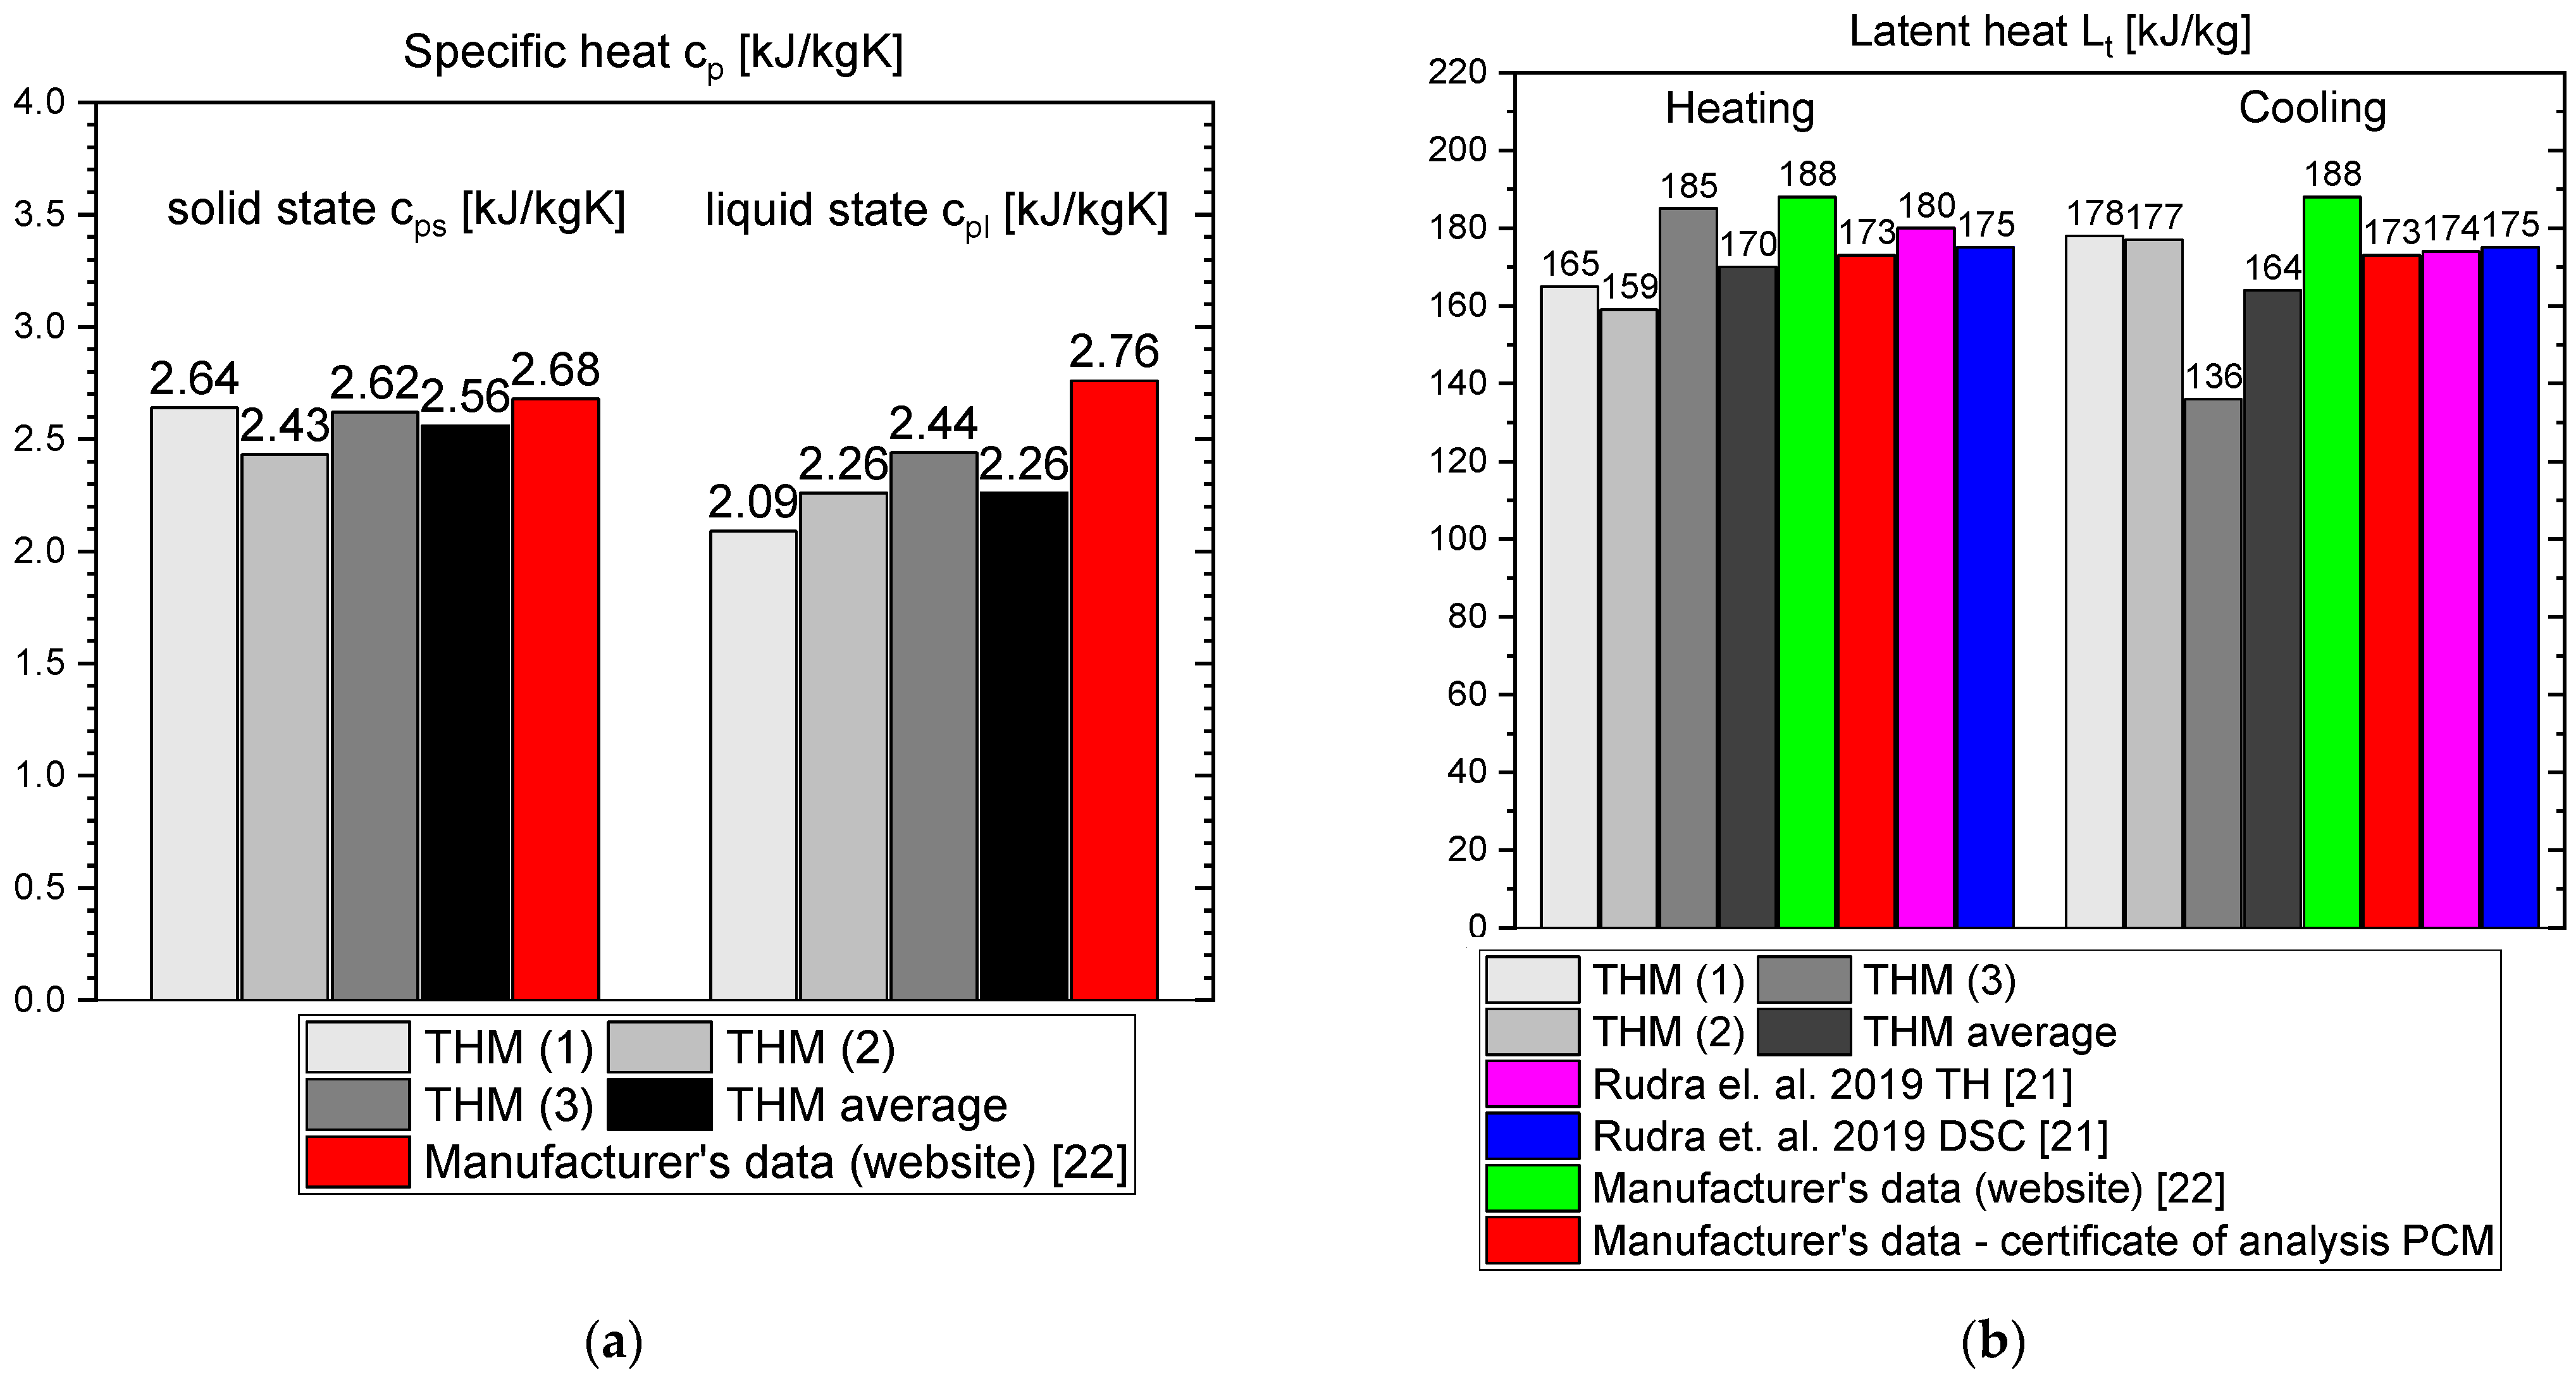
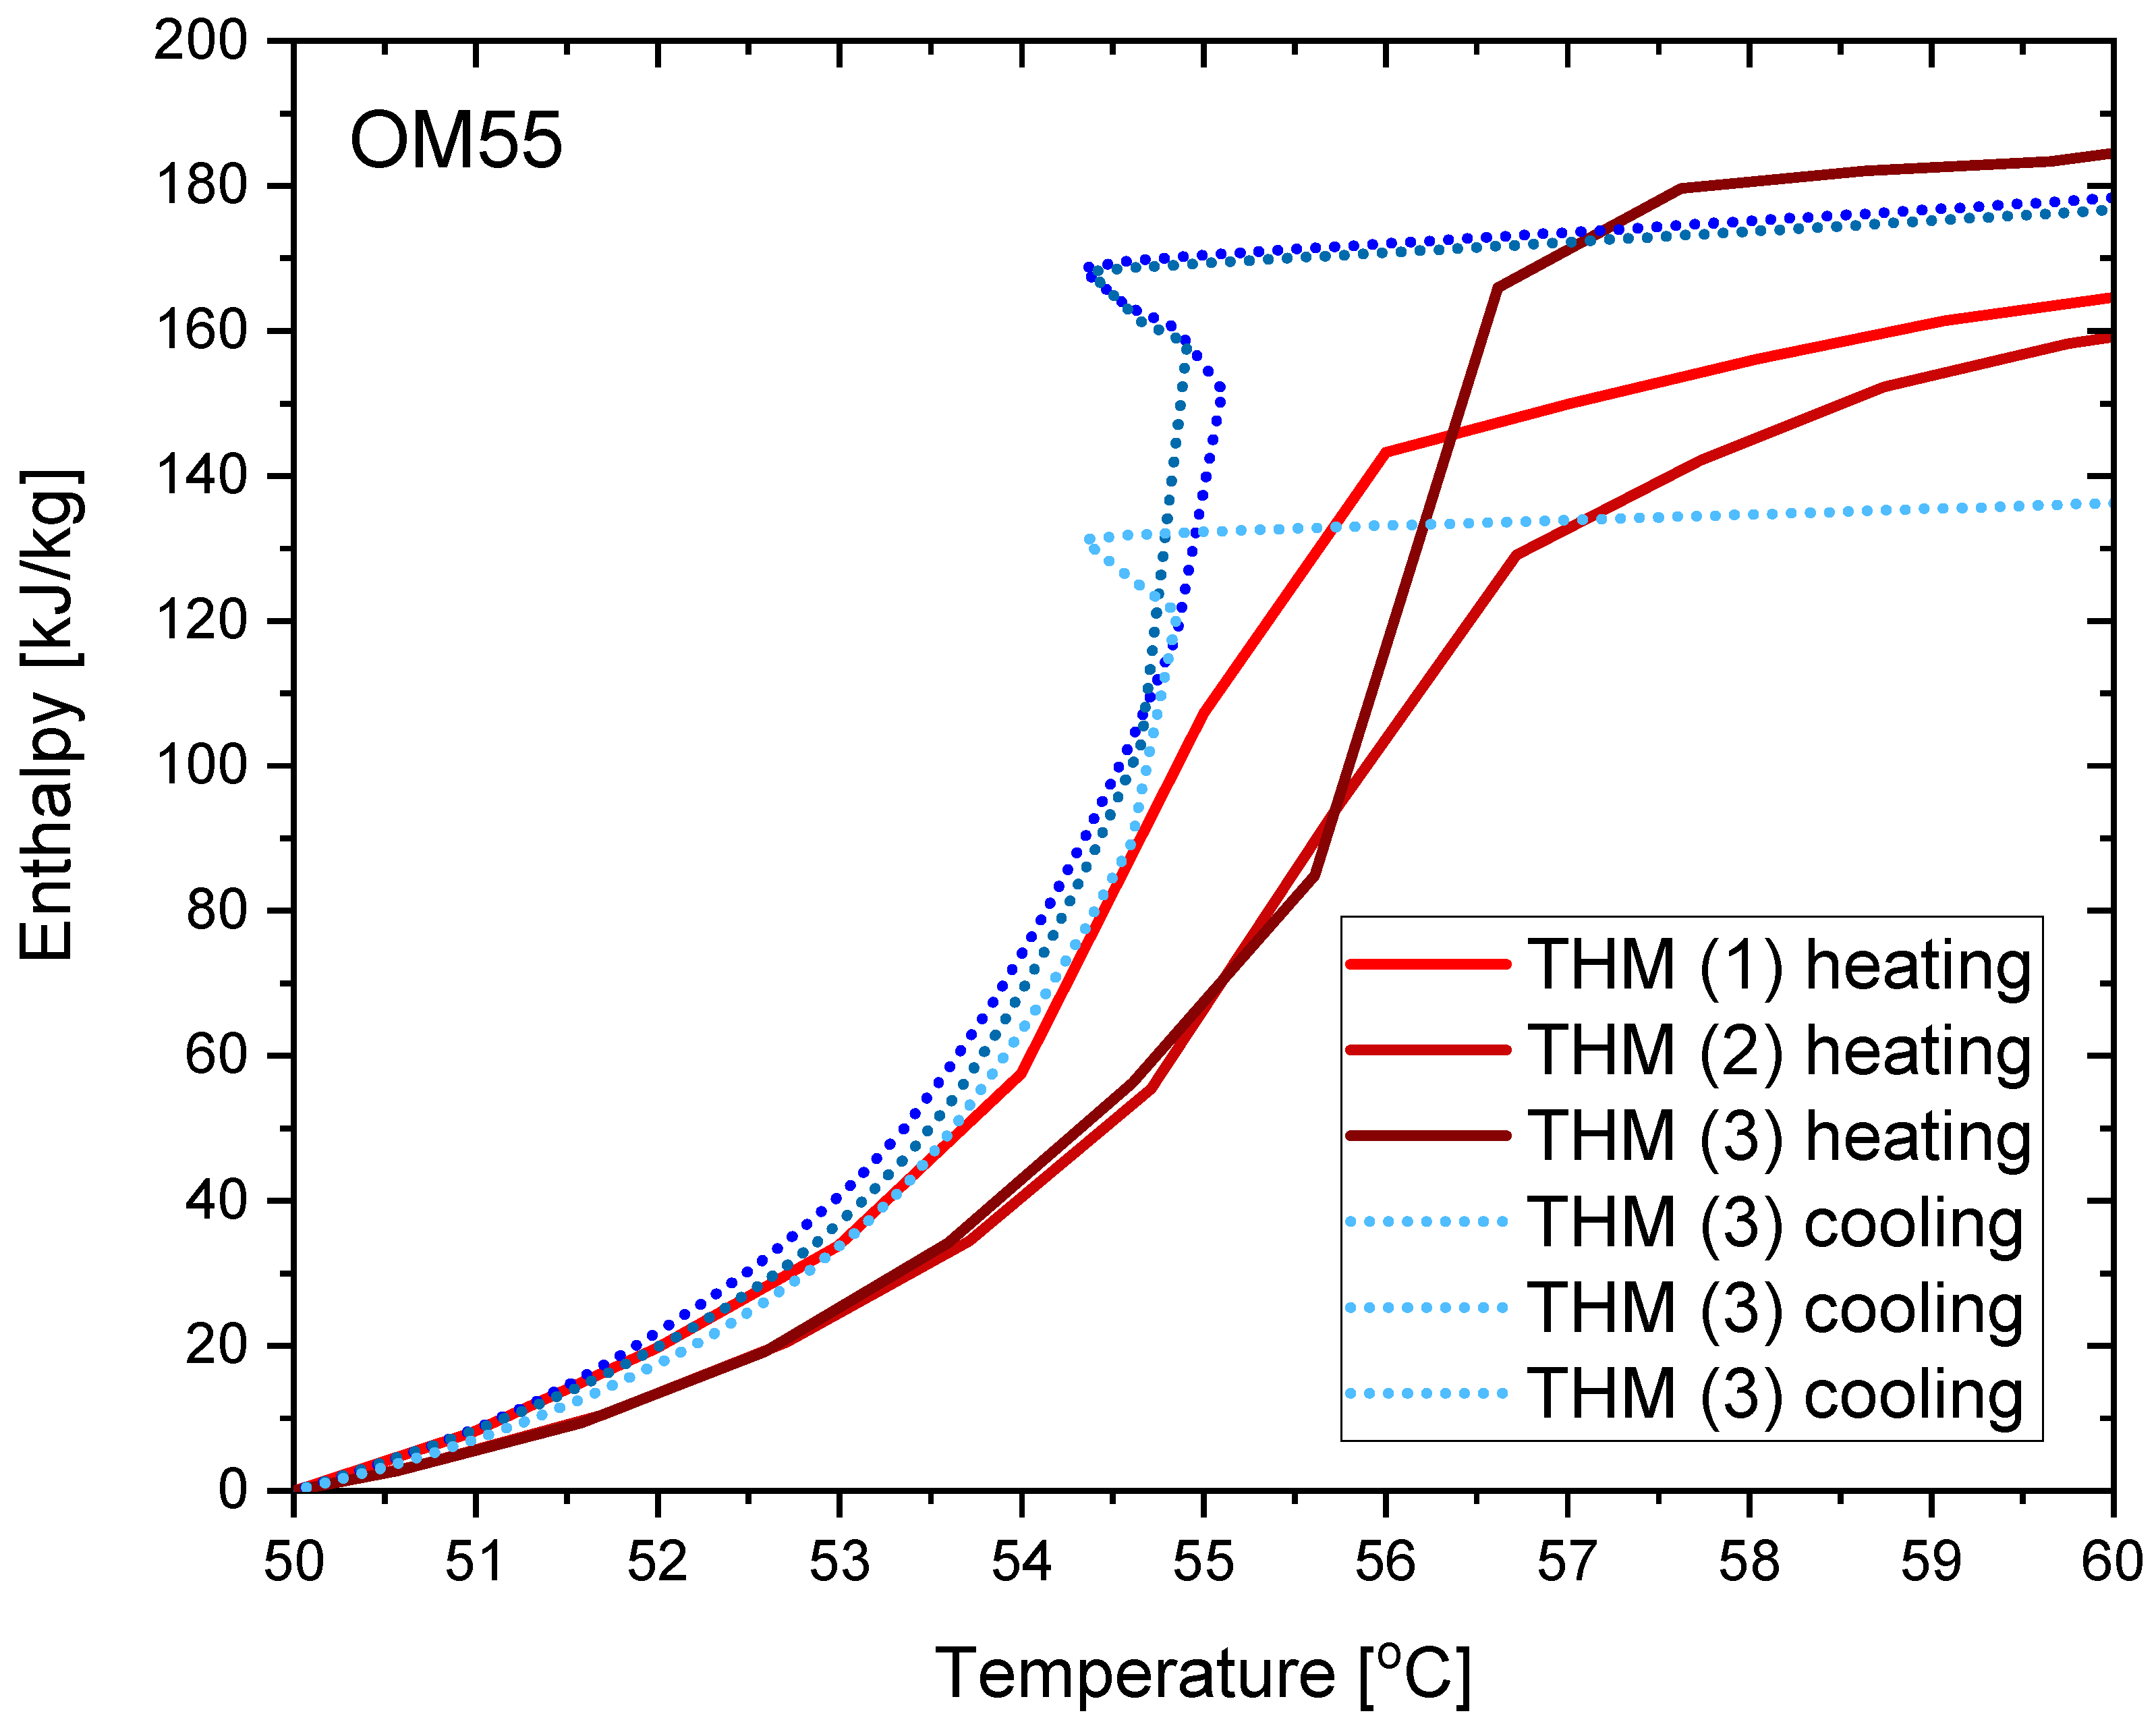
3.2. OM55
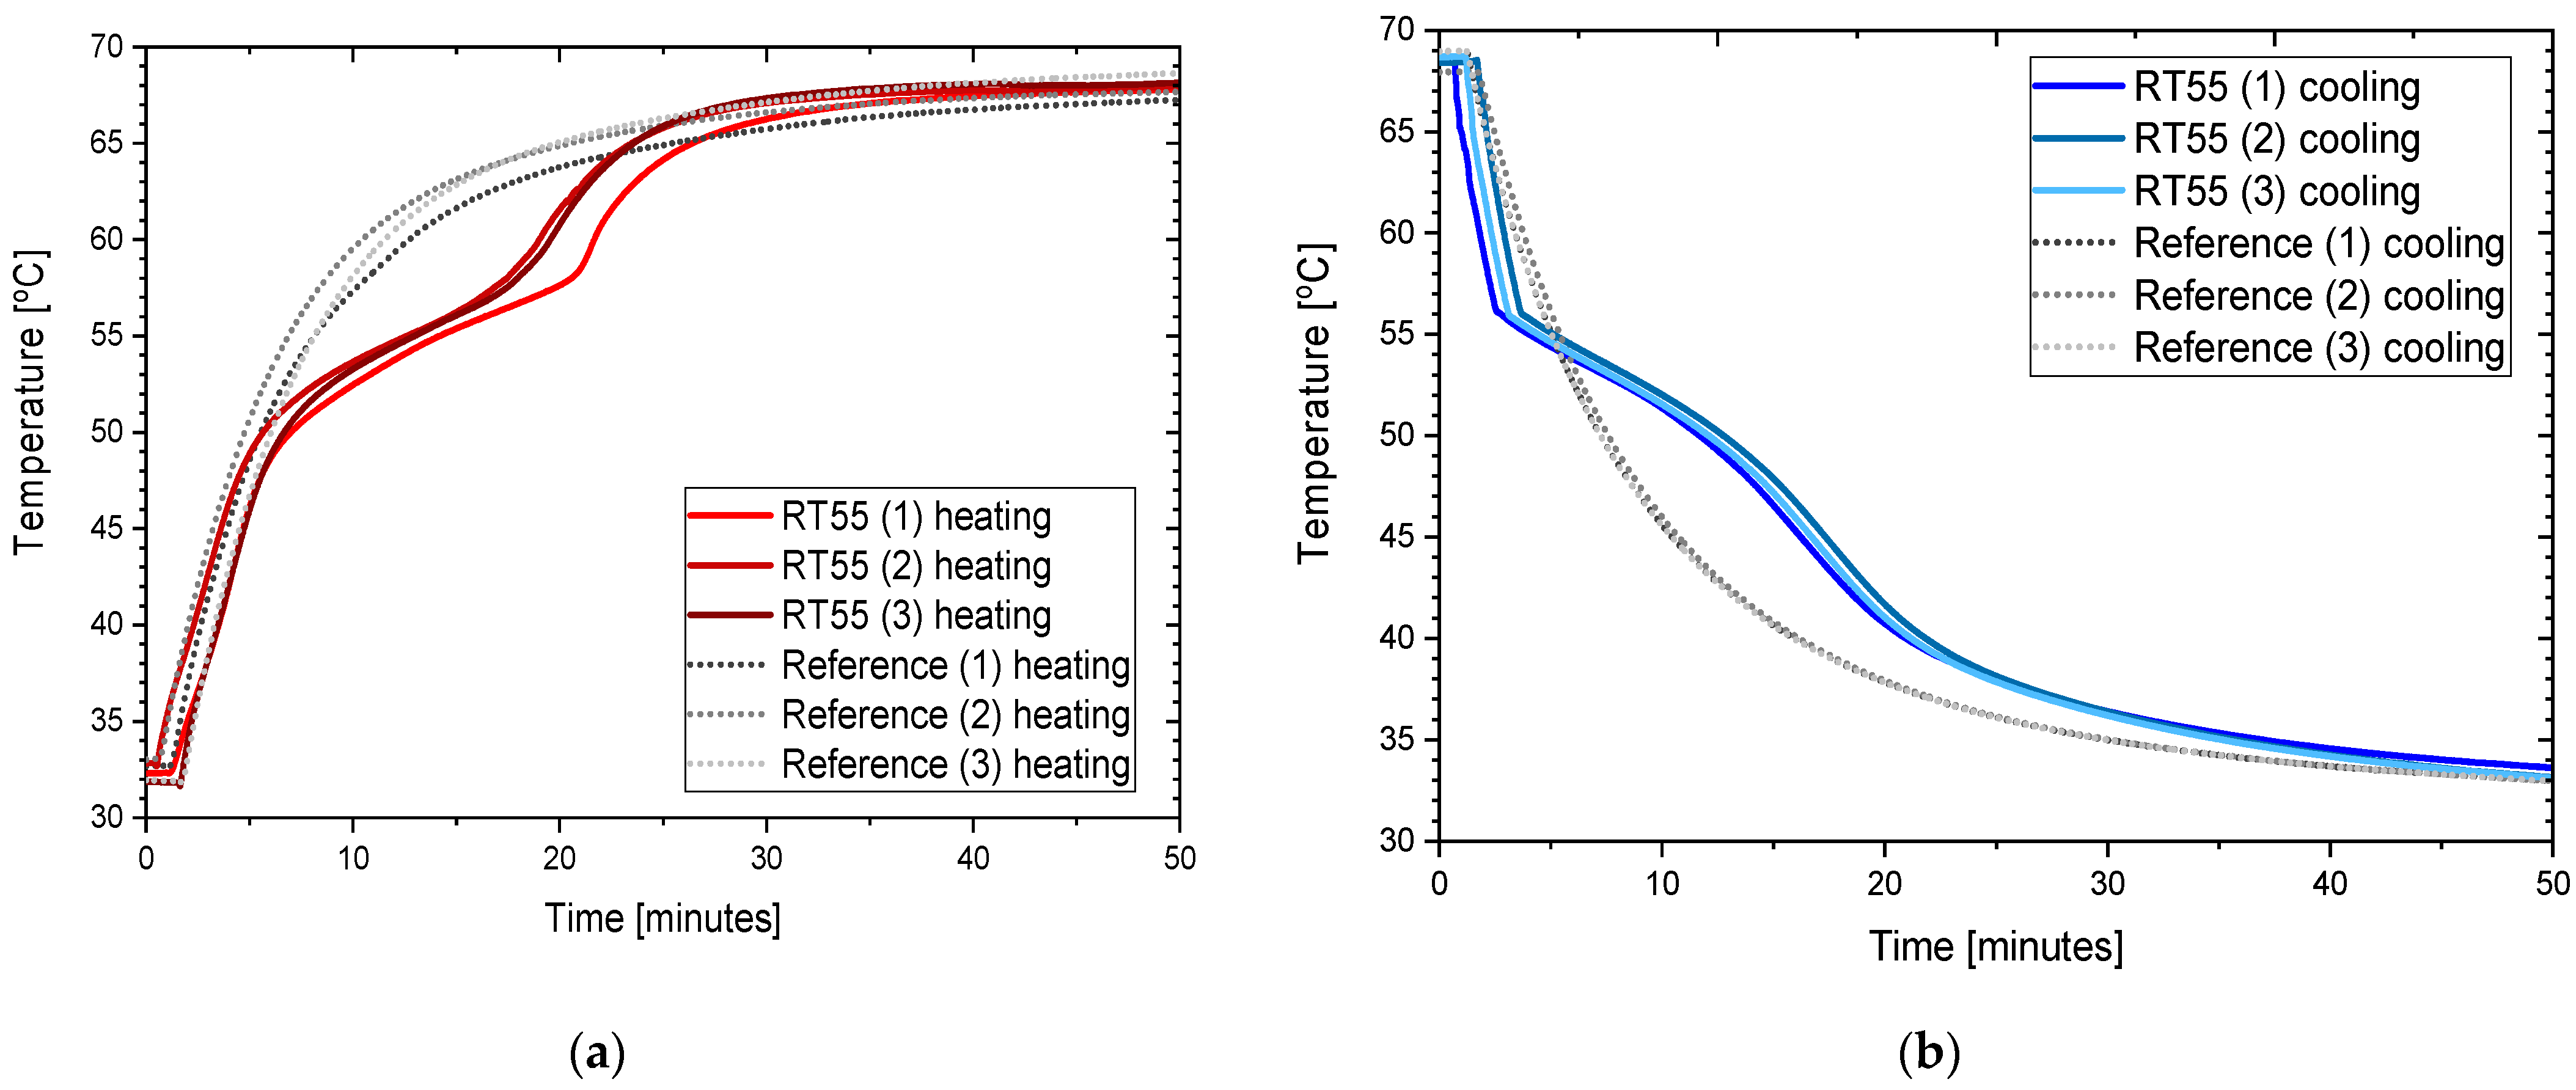
3.3. RT55
4. Discussion
5. Conclusions
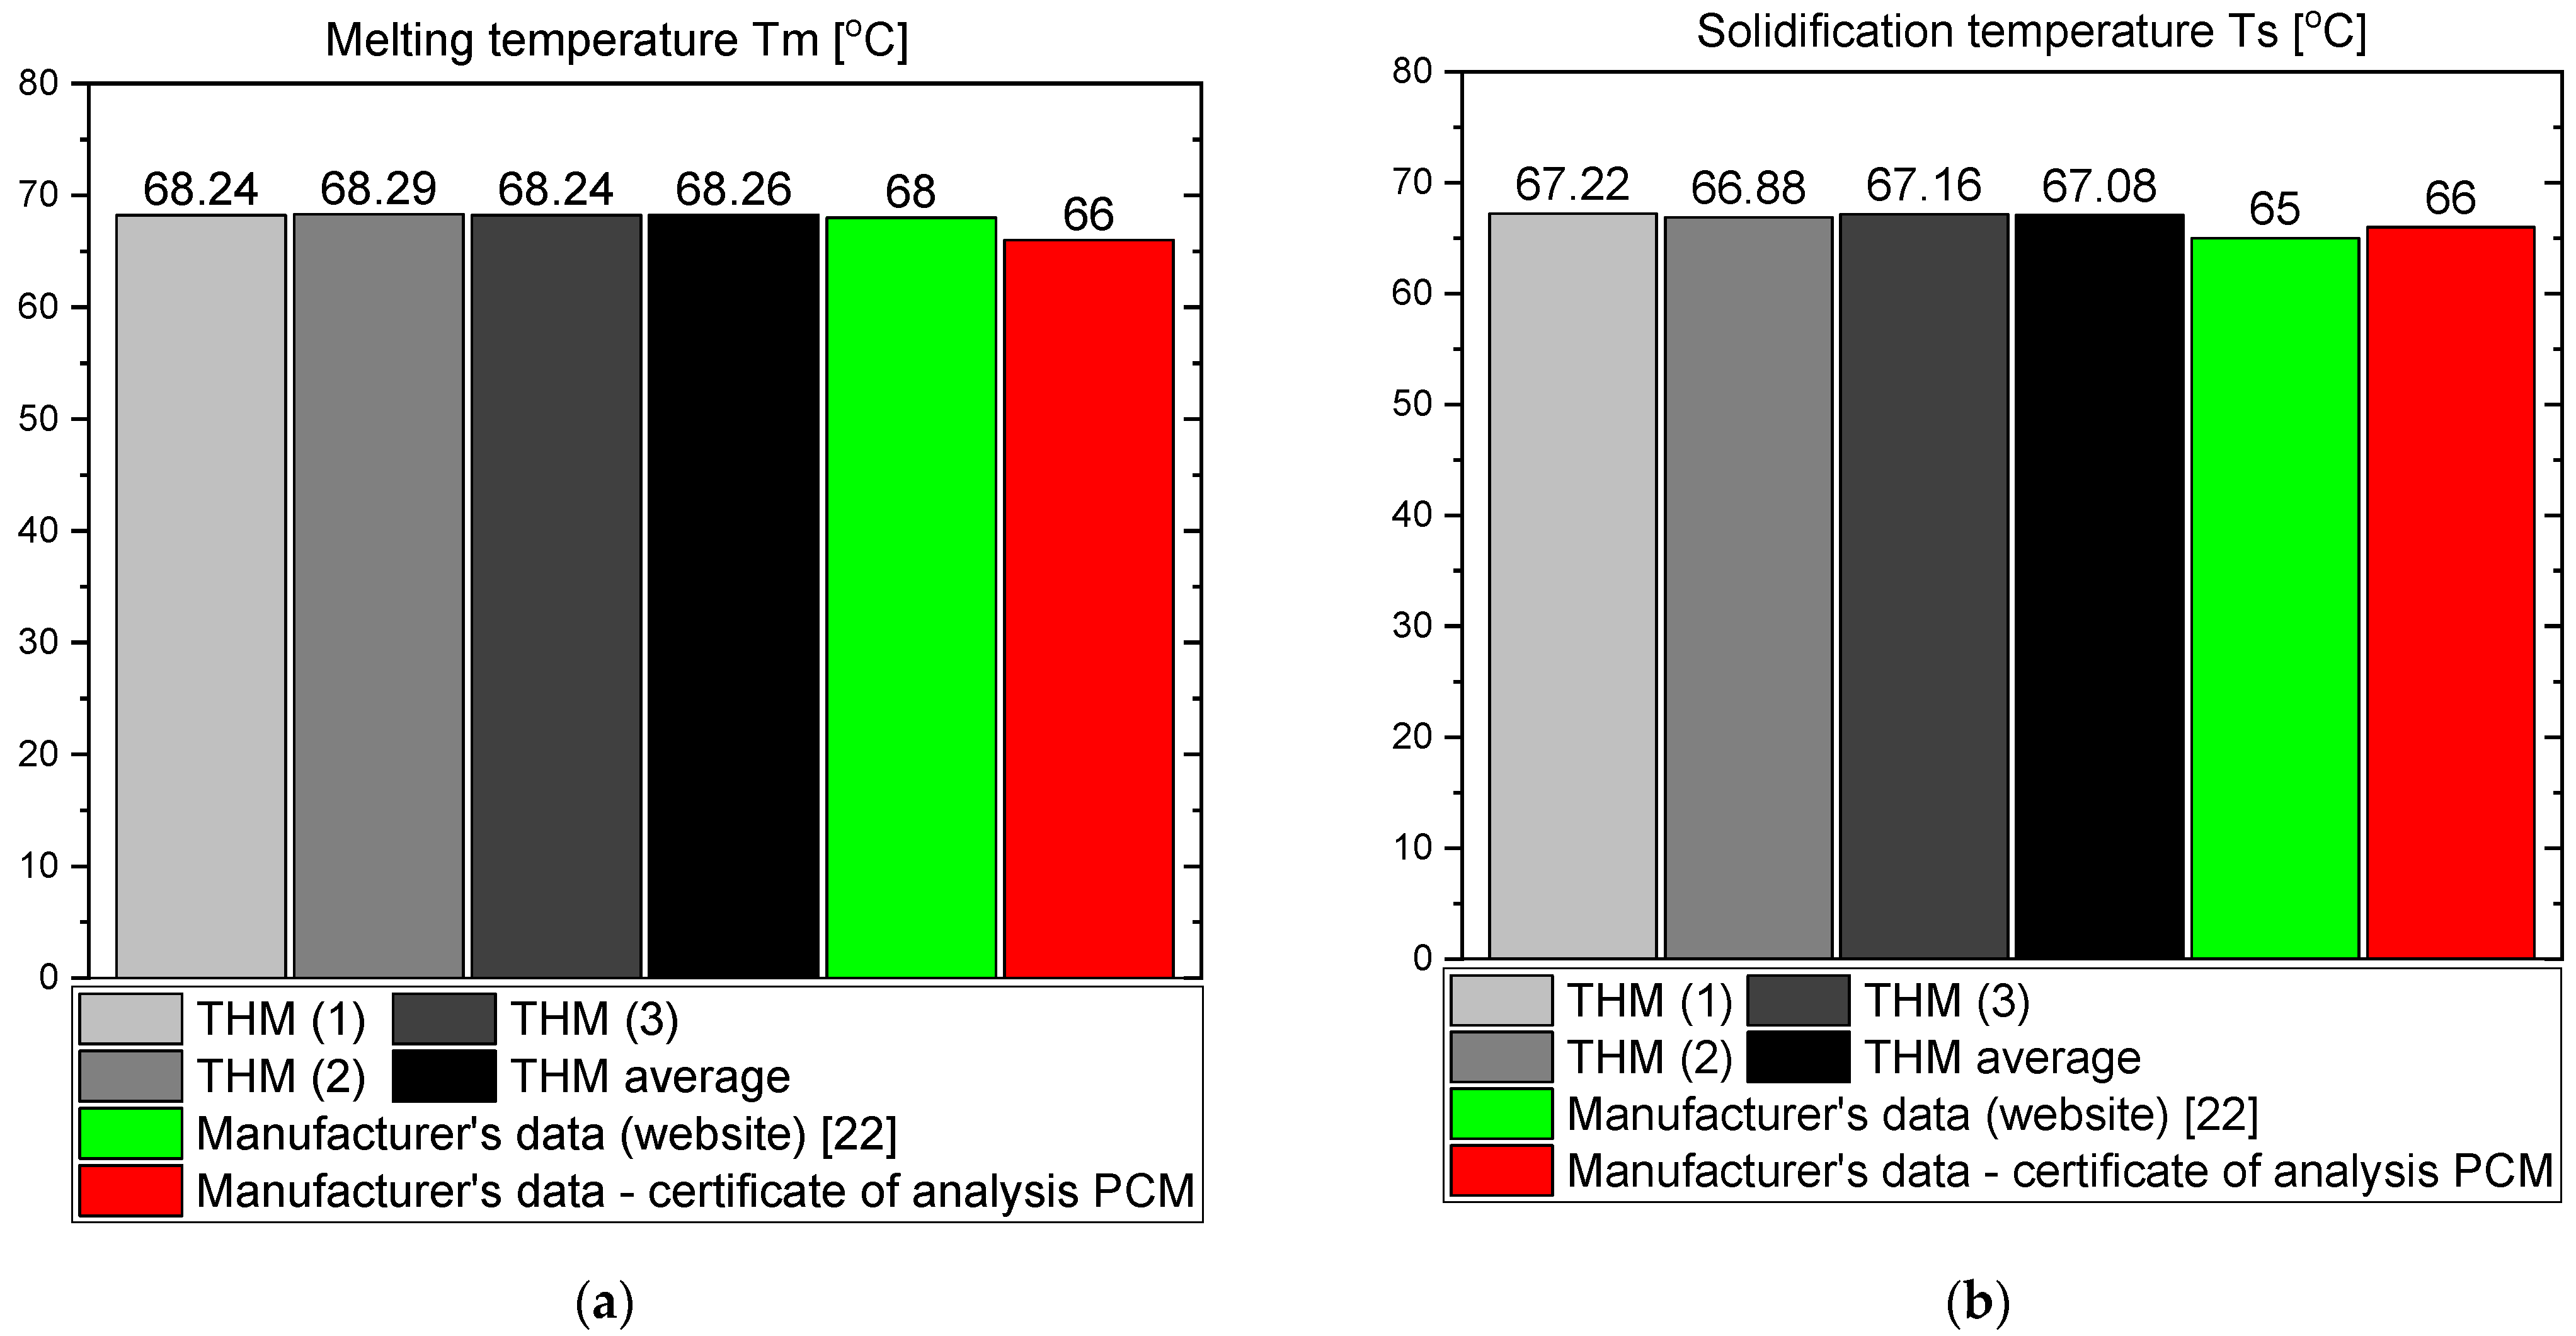
- The phase transition takes place over the temperature range of 66–67 °C for OM65, 54–55 °C for OM55 and in approximately 55 °C for RT55, and these values are similar to results provided by the respective manufacturers and other researchers who used different methods of measurement (and often expensive instruments).
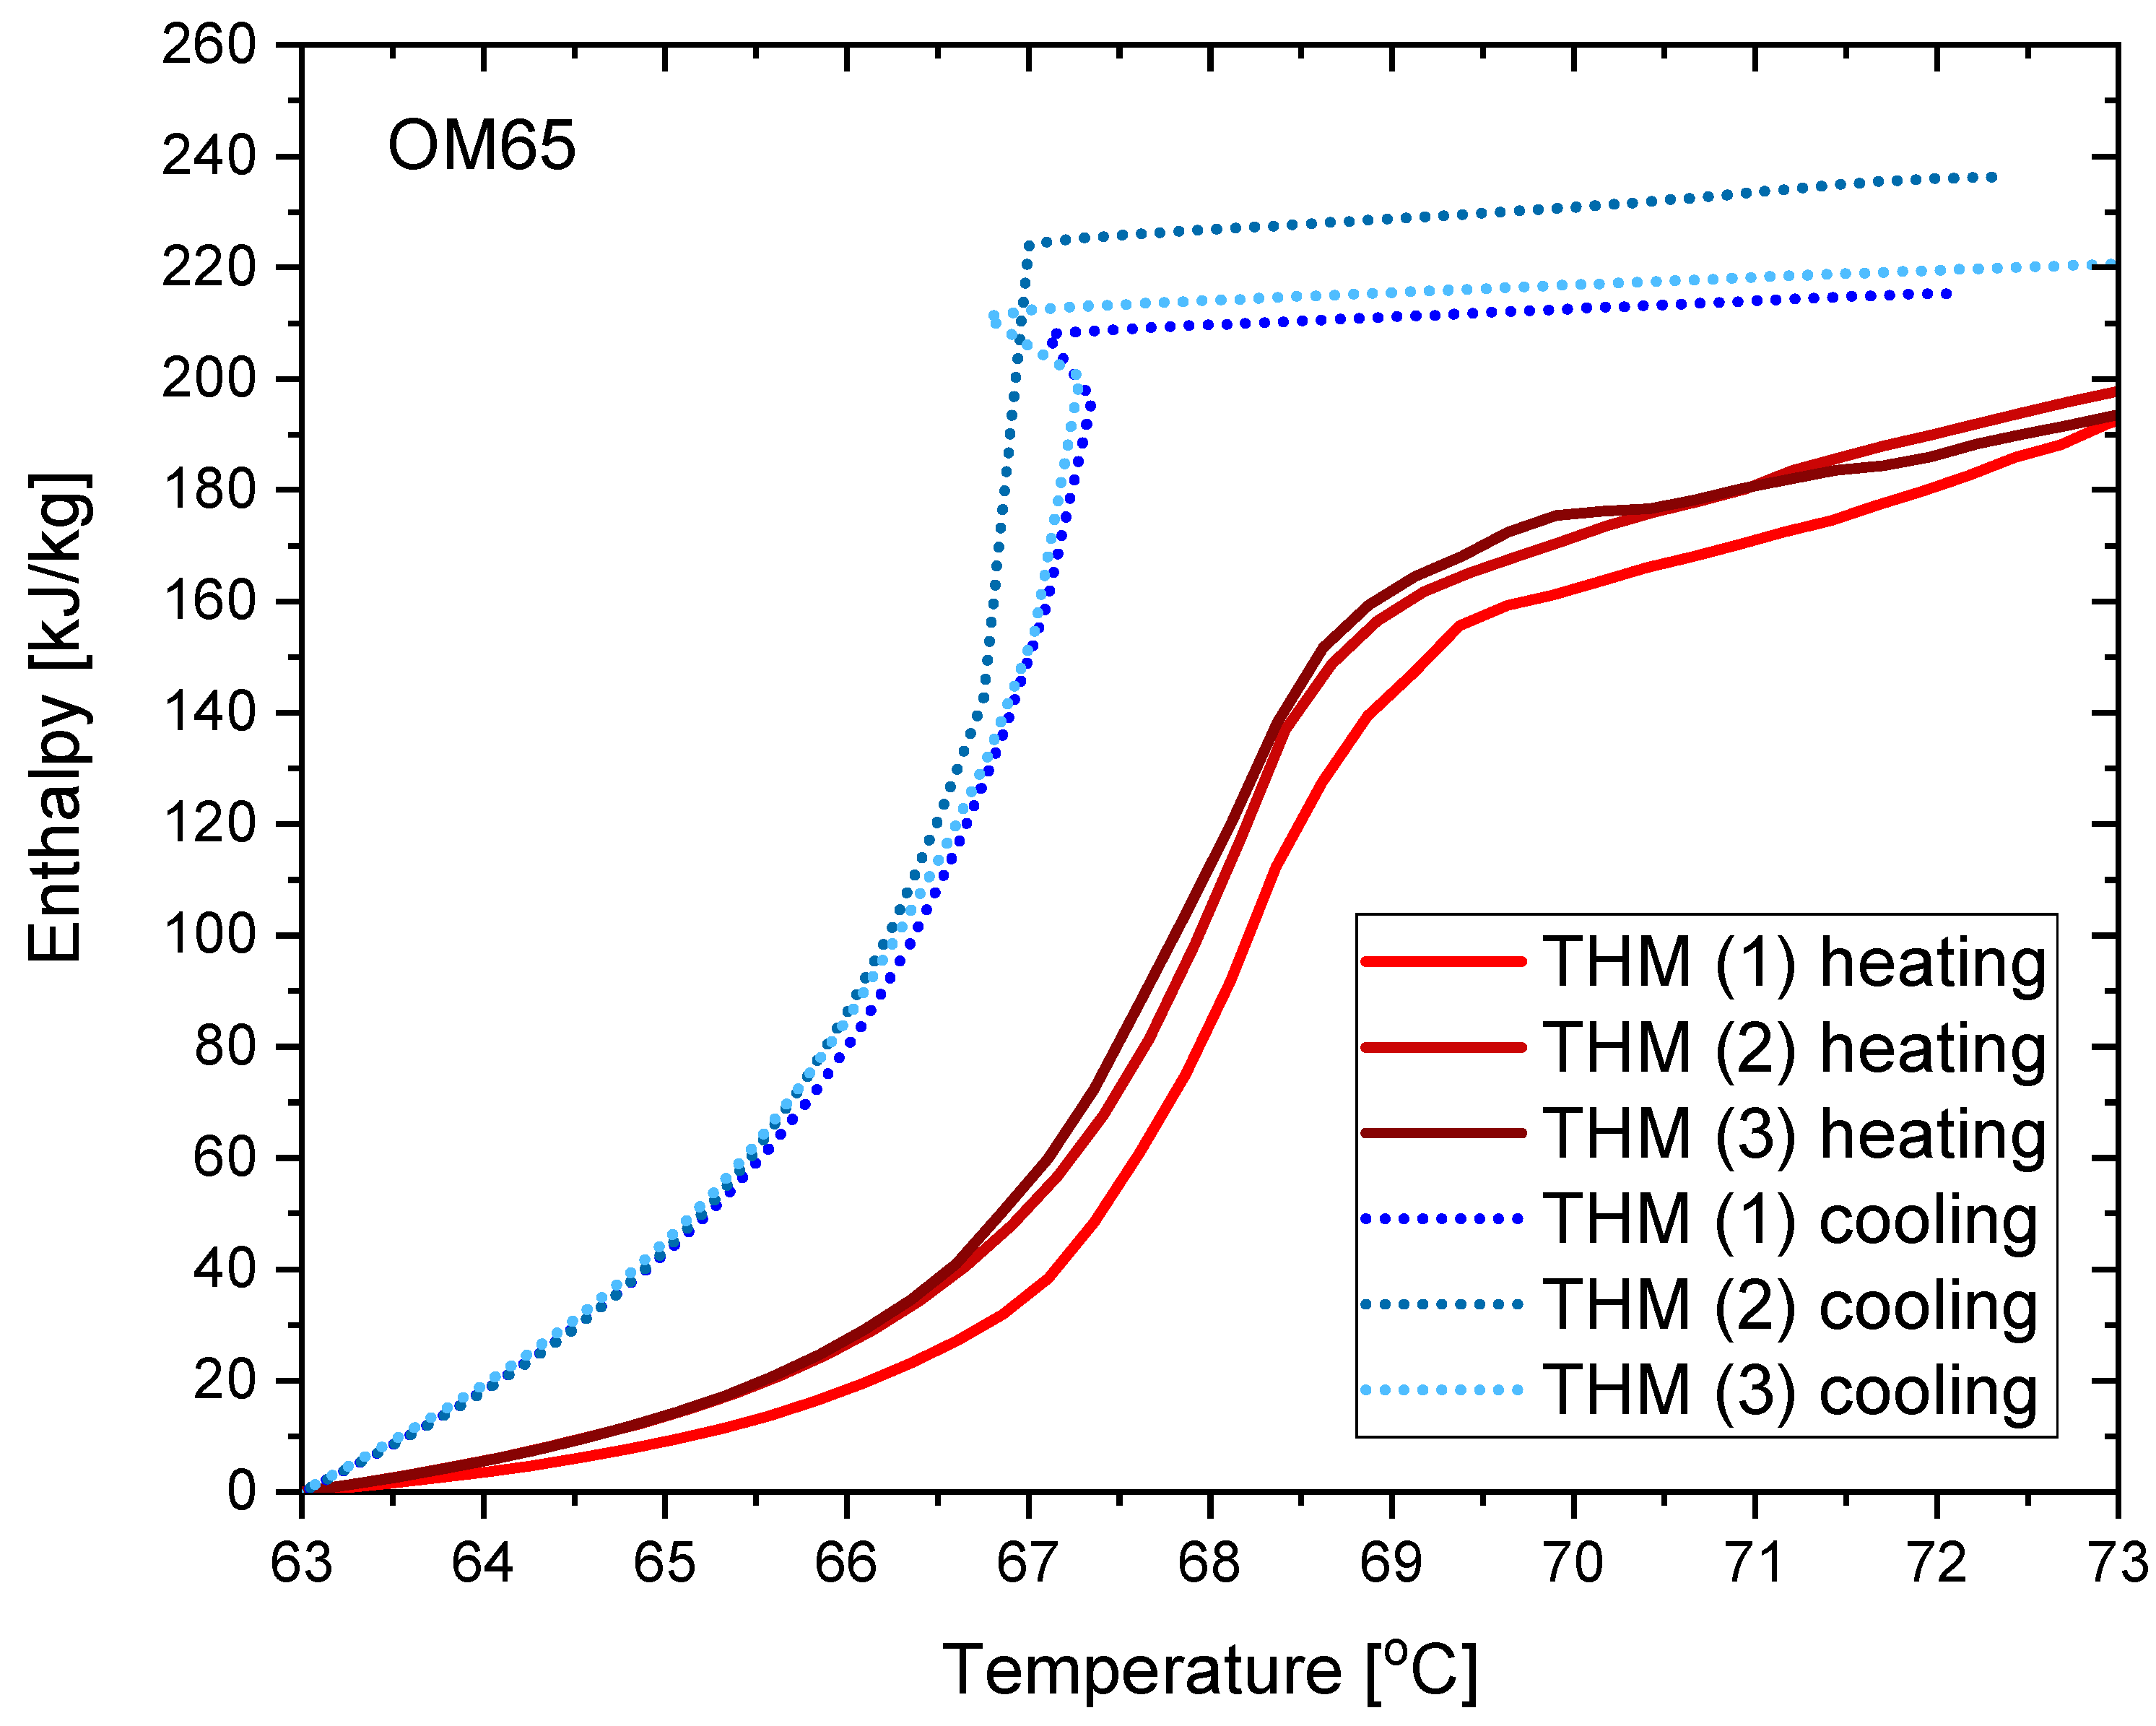
- The values of latent heat in the heating/cooling process obtained with the use of our calorimeter are 182/186 kJ/kg for OM65, 176/181 kJ/kg for OM55 and 177/178 kJ/kg for OM55, and are consistent with the values reported by the manufacturers and other researchers.
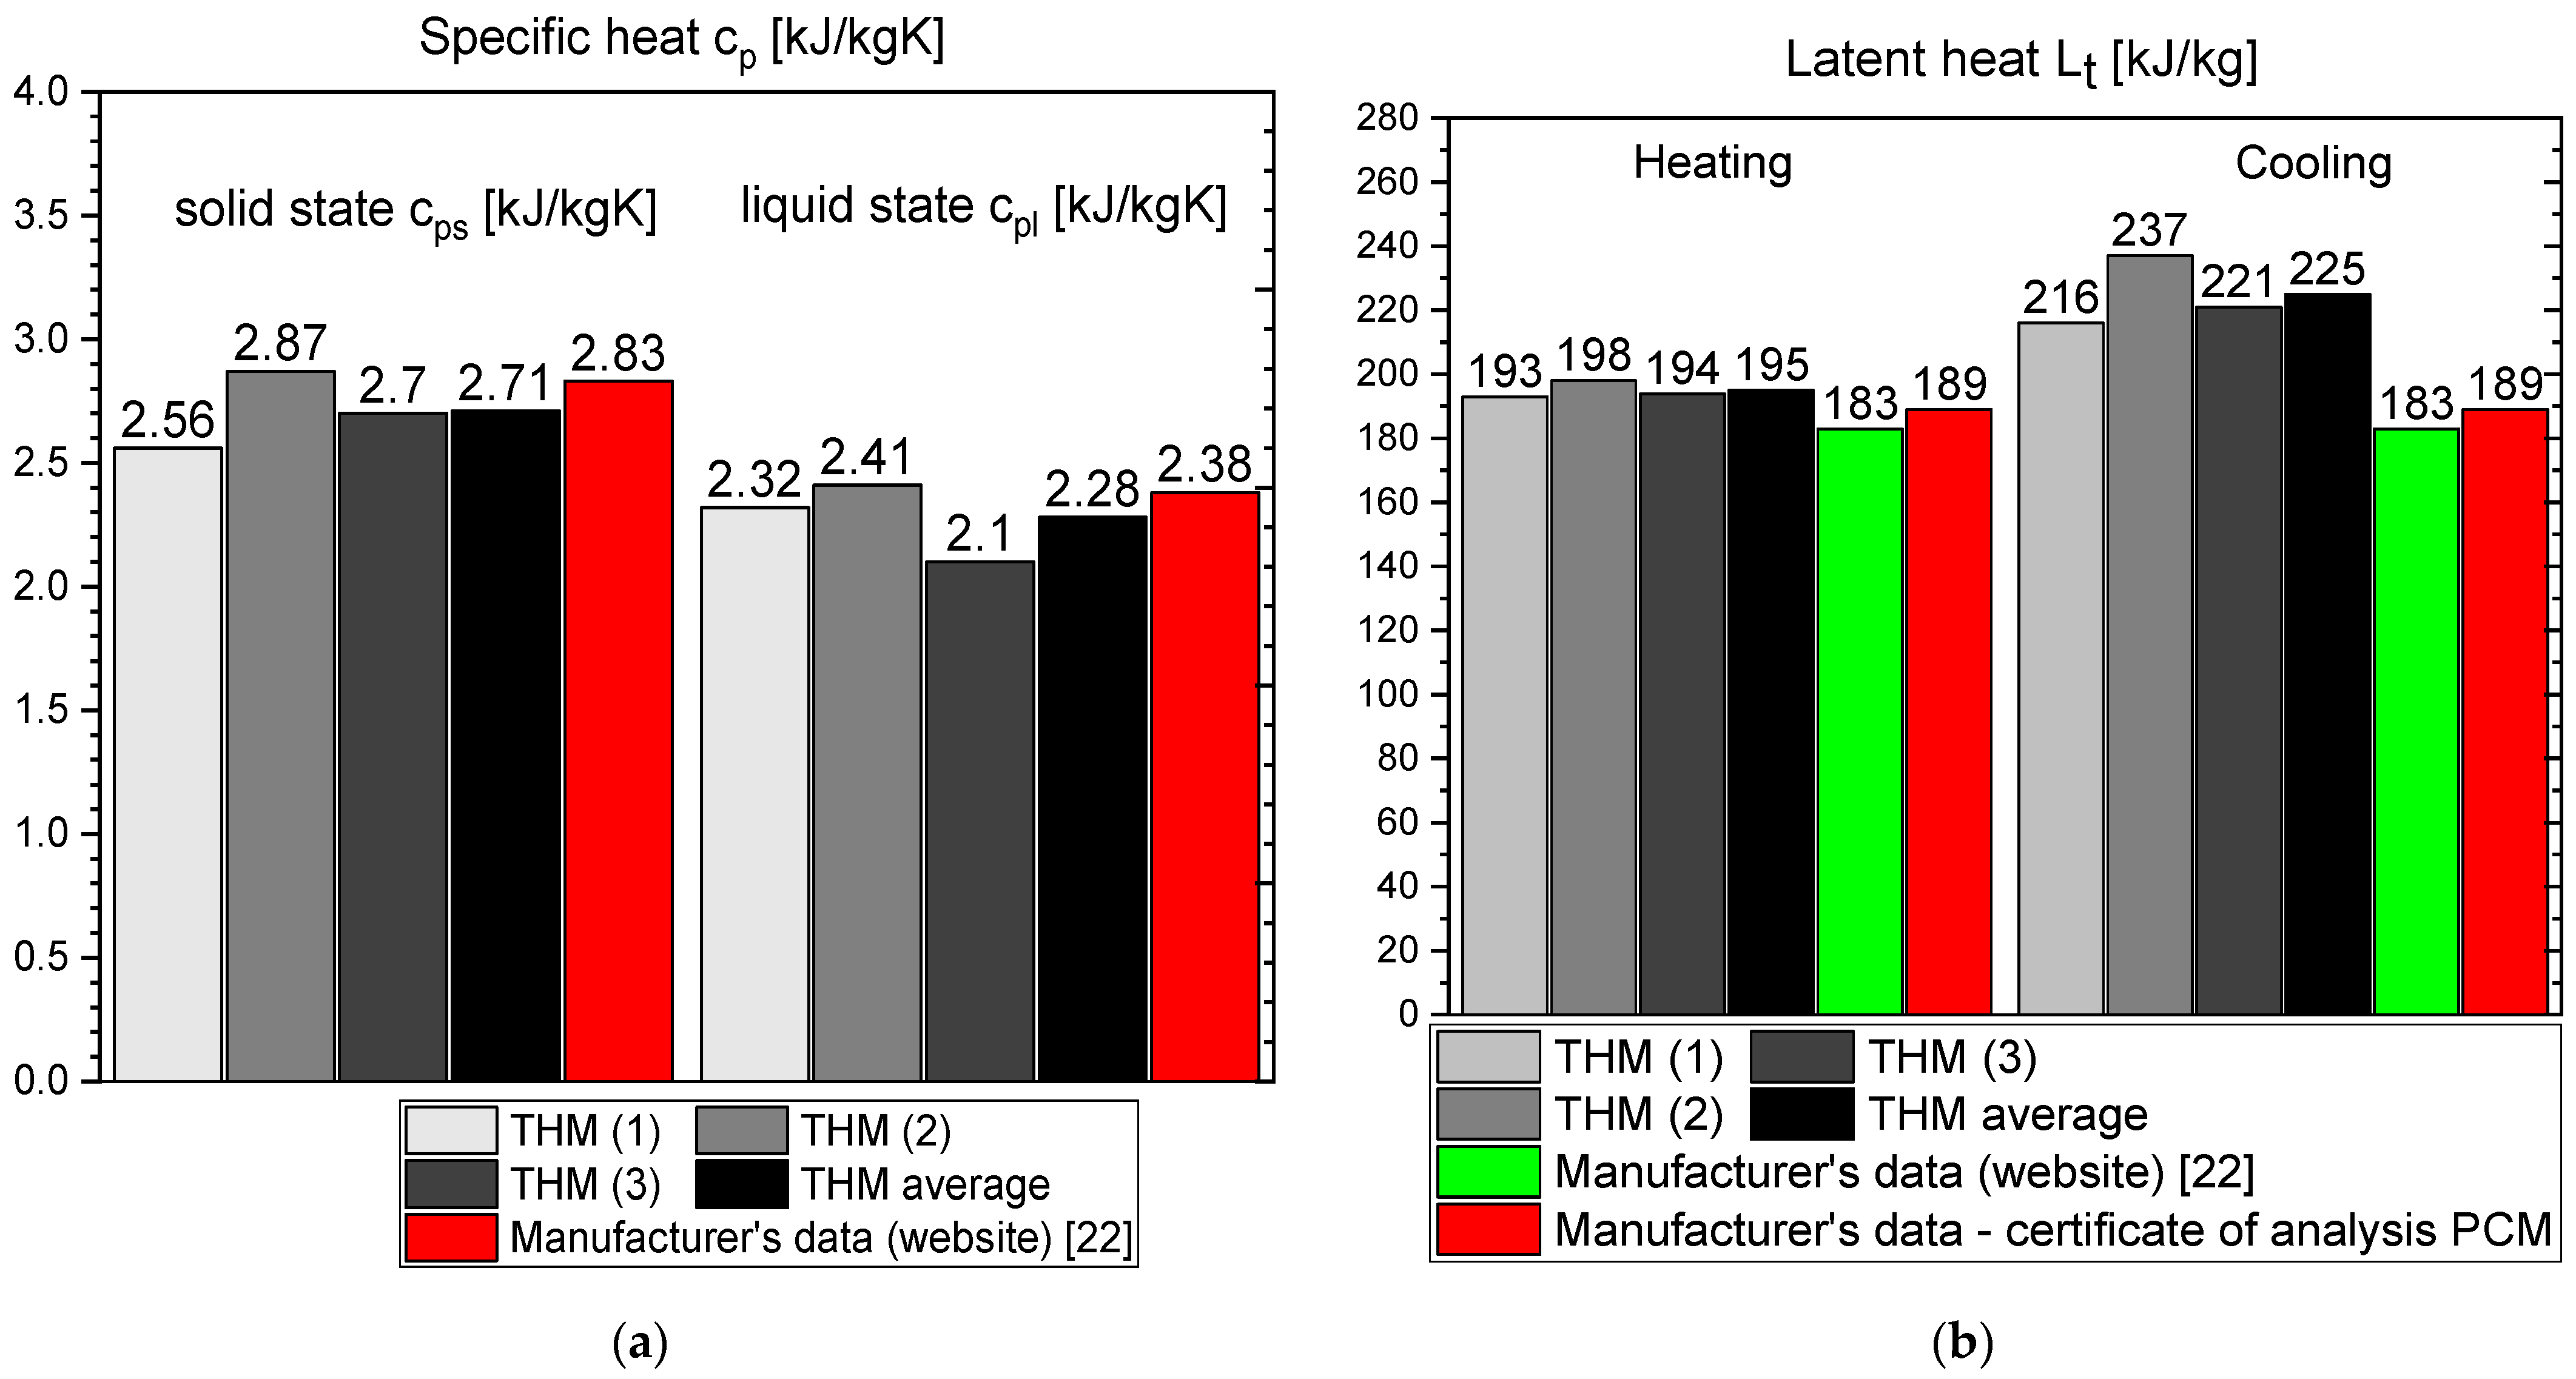
- Differences between different measurement methods were observed for the values of a single-phase specific heat. However, they are generally limited to the range of 0.12–0.6 kJ/kgK, except for RT55 that shows differences up to 2.5 kJ/kgK for the solid state.
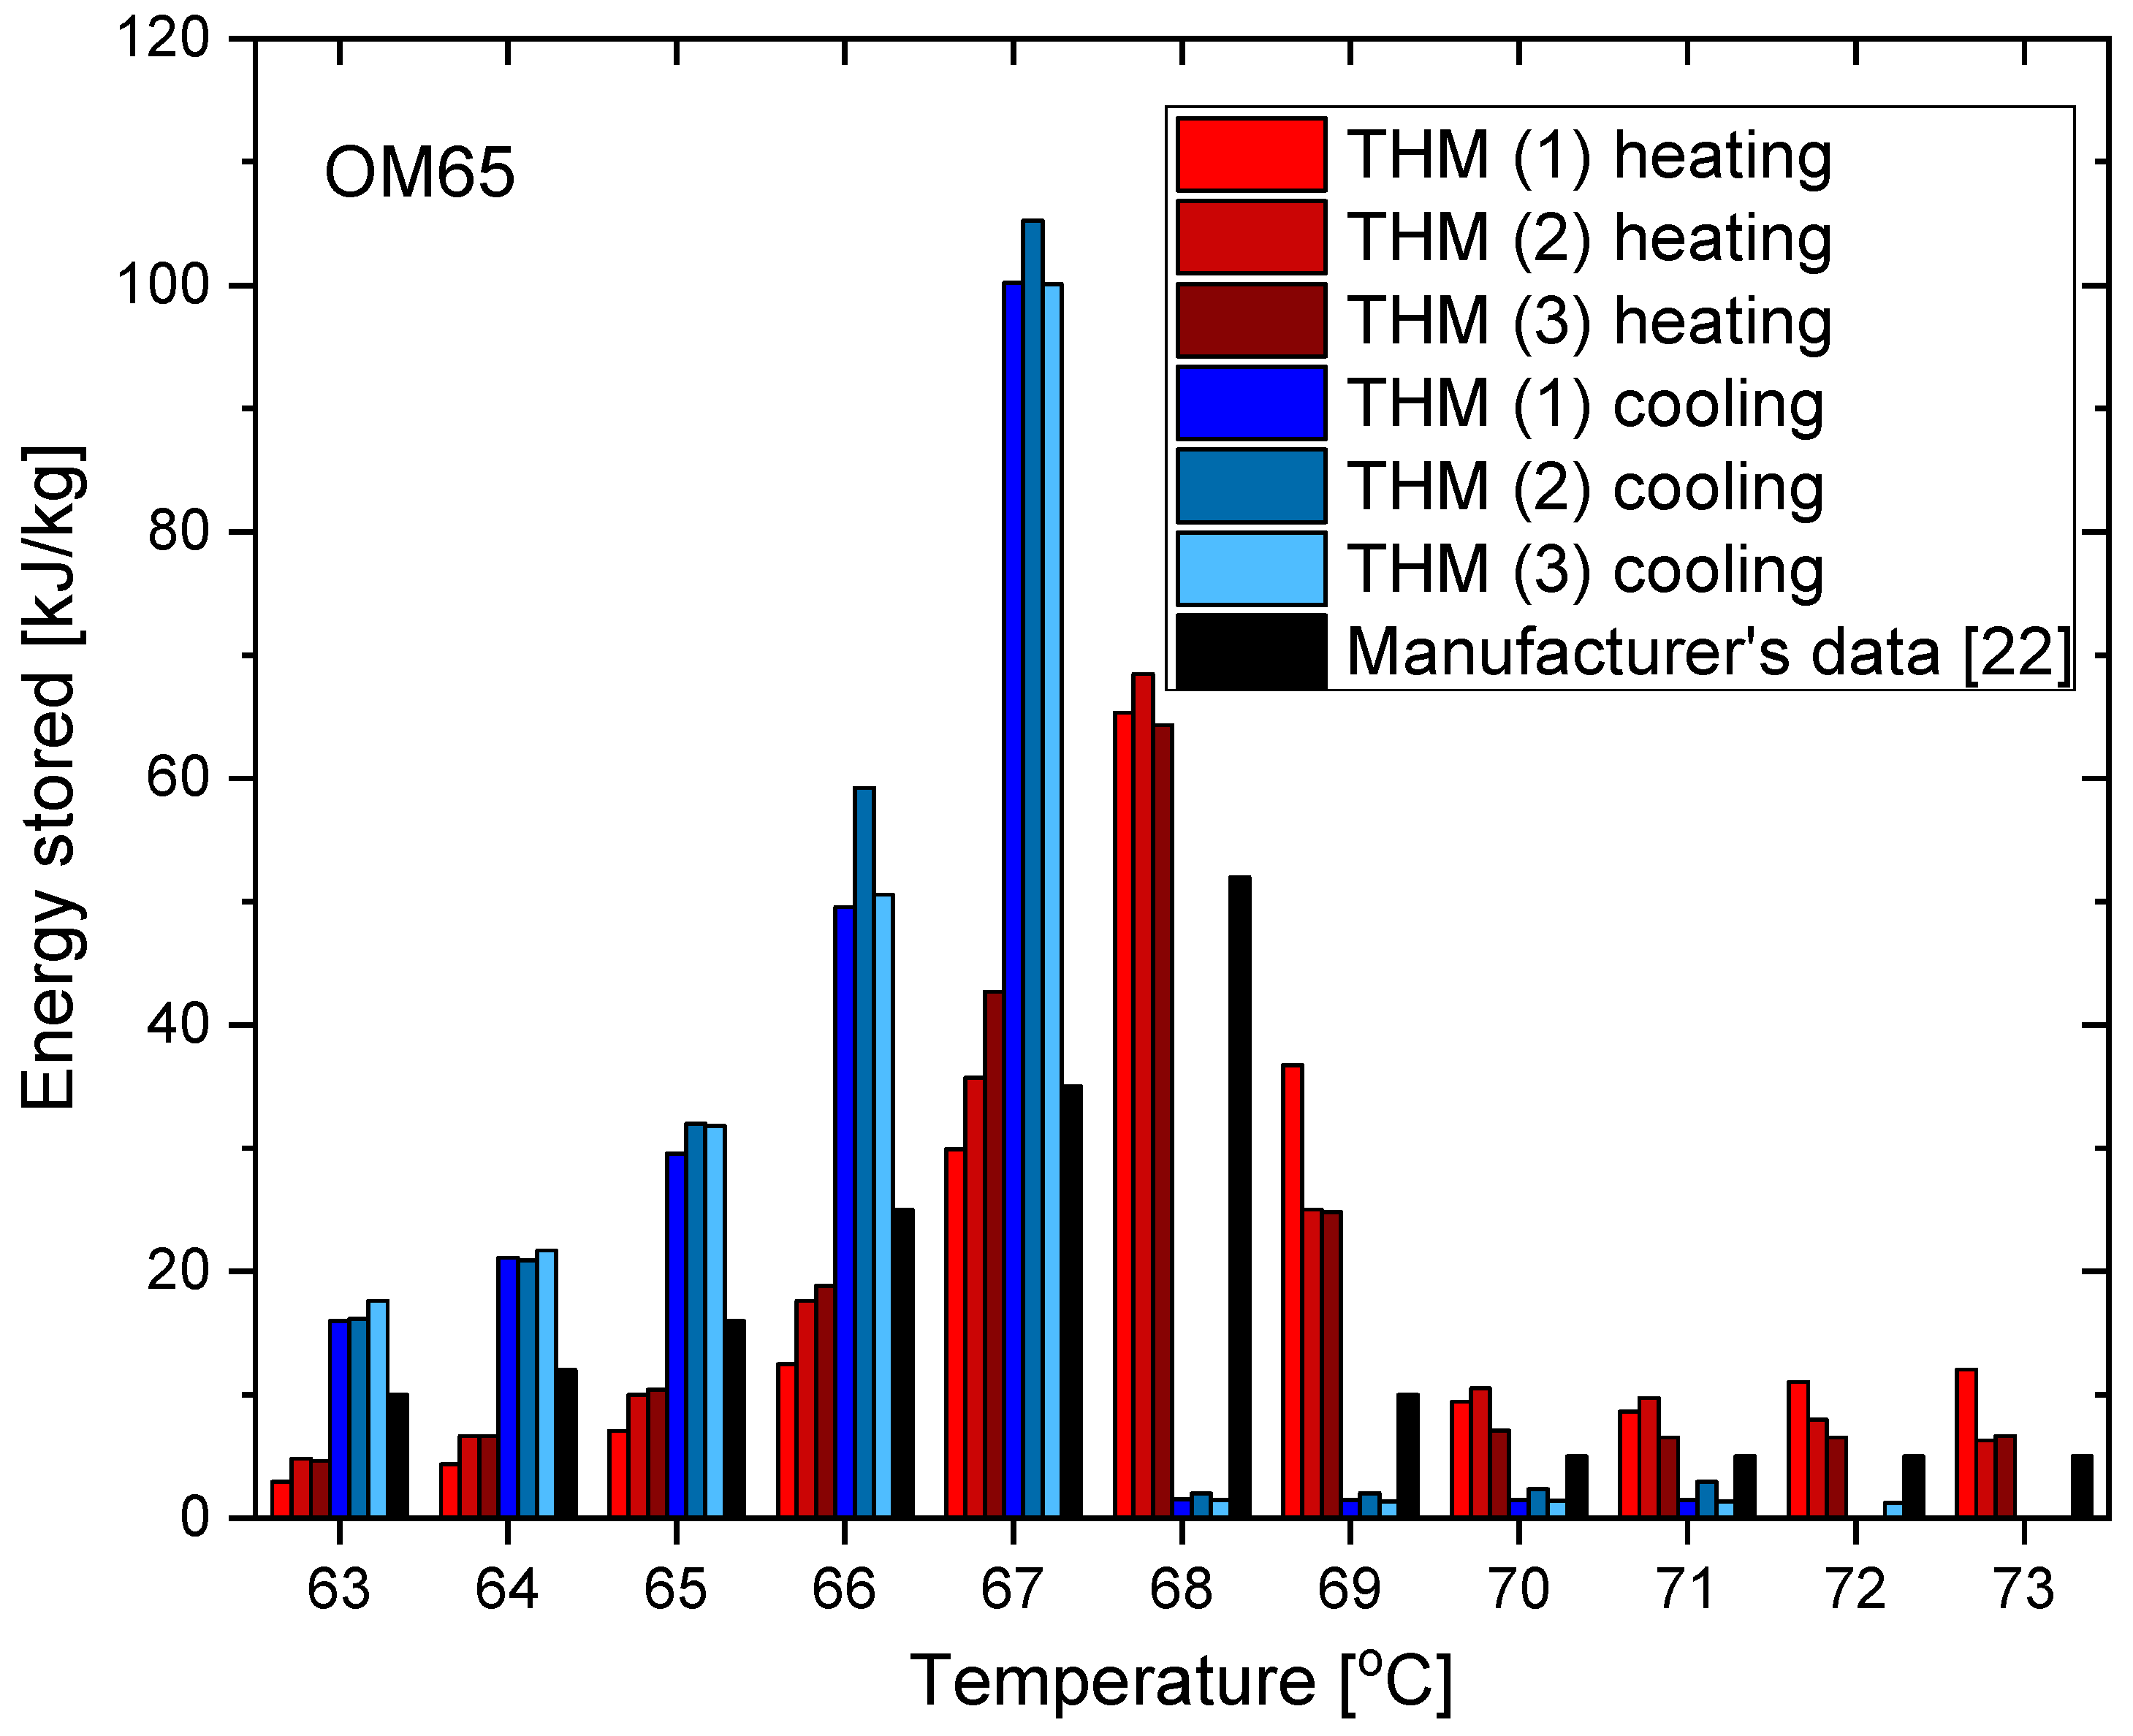
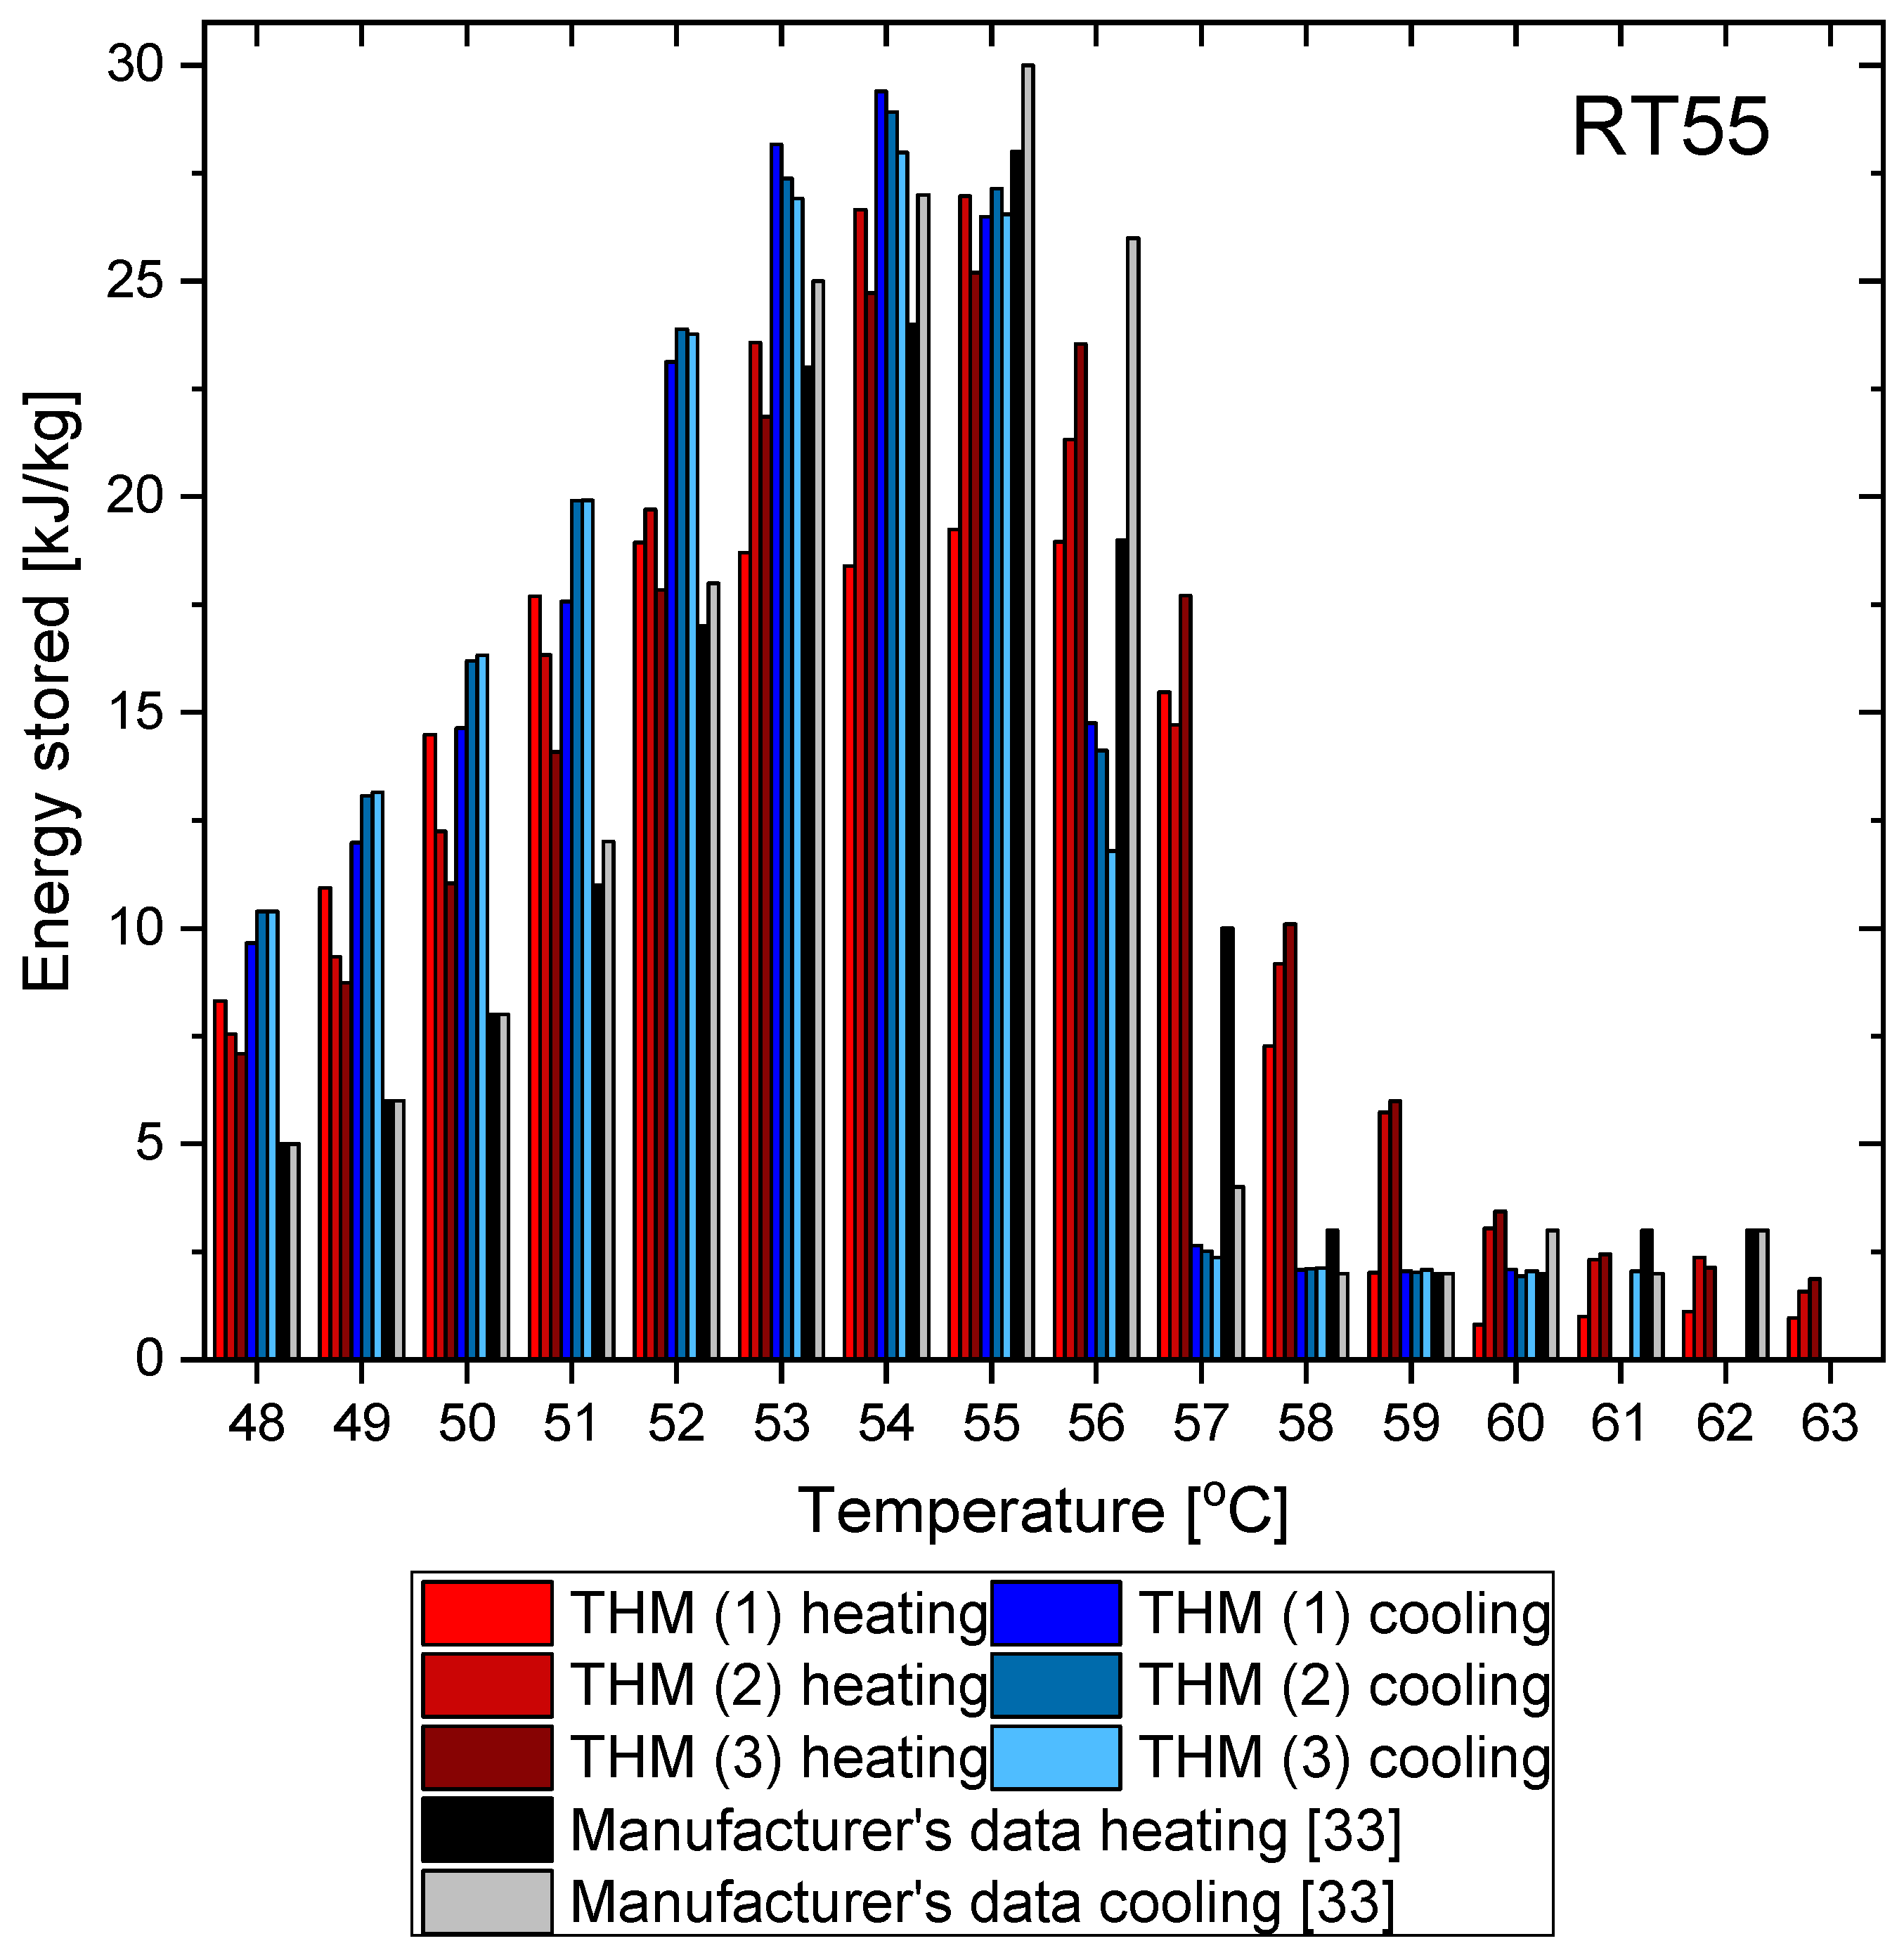
- The distribution of partial enthalpy (stored energy) in the case of RT55 is spread over a temperature range of about 10–11 K and the energy stored or released over a 1 K temperature interval ranges from 7 to 30 kJ/kg (see Figure 23). On the another hand, the partial enthalpy distribution of OM55 and OM65 (see Figure 11 and Figure 17) is more concentrated in a narrower temperature range of 6–7 K and most of the energy is stored or released at the phase change peak (about 80 kJ/kg for OM55 and 110 kJ/kg for OM65).
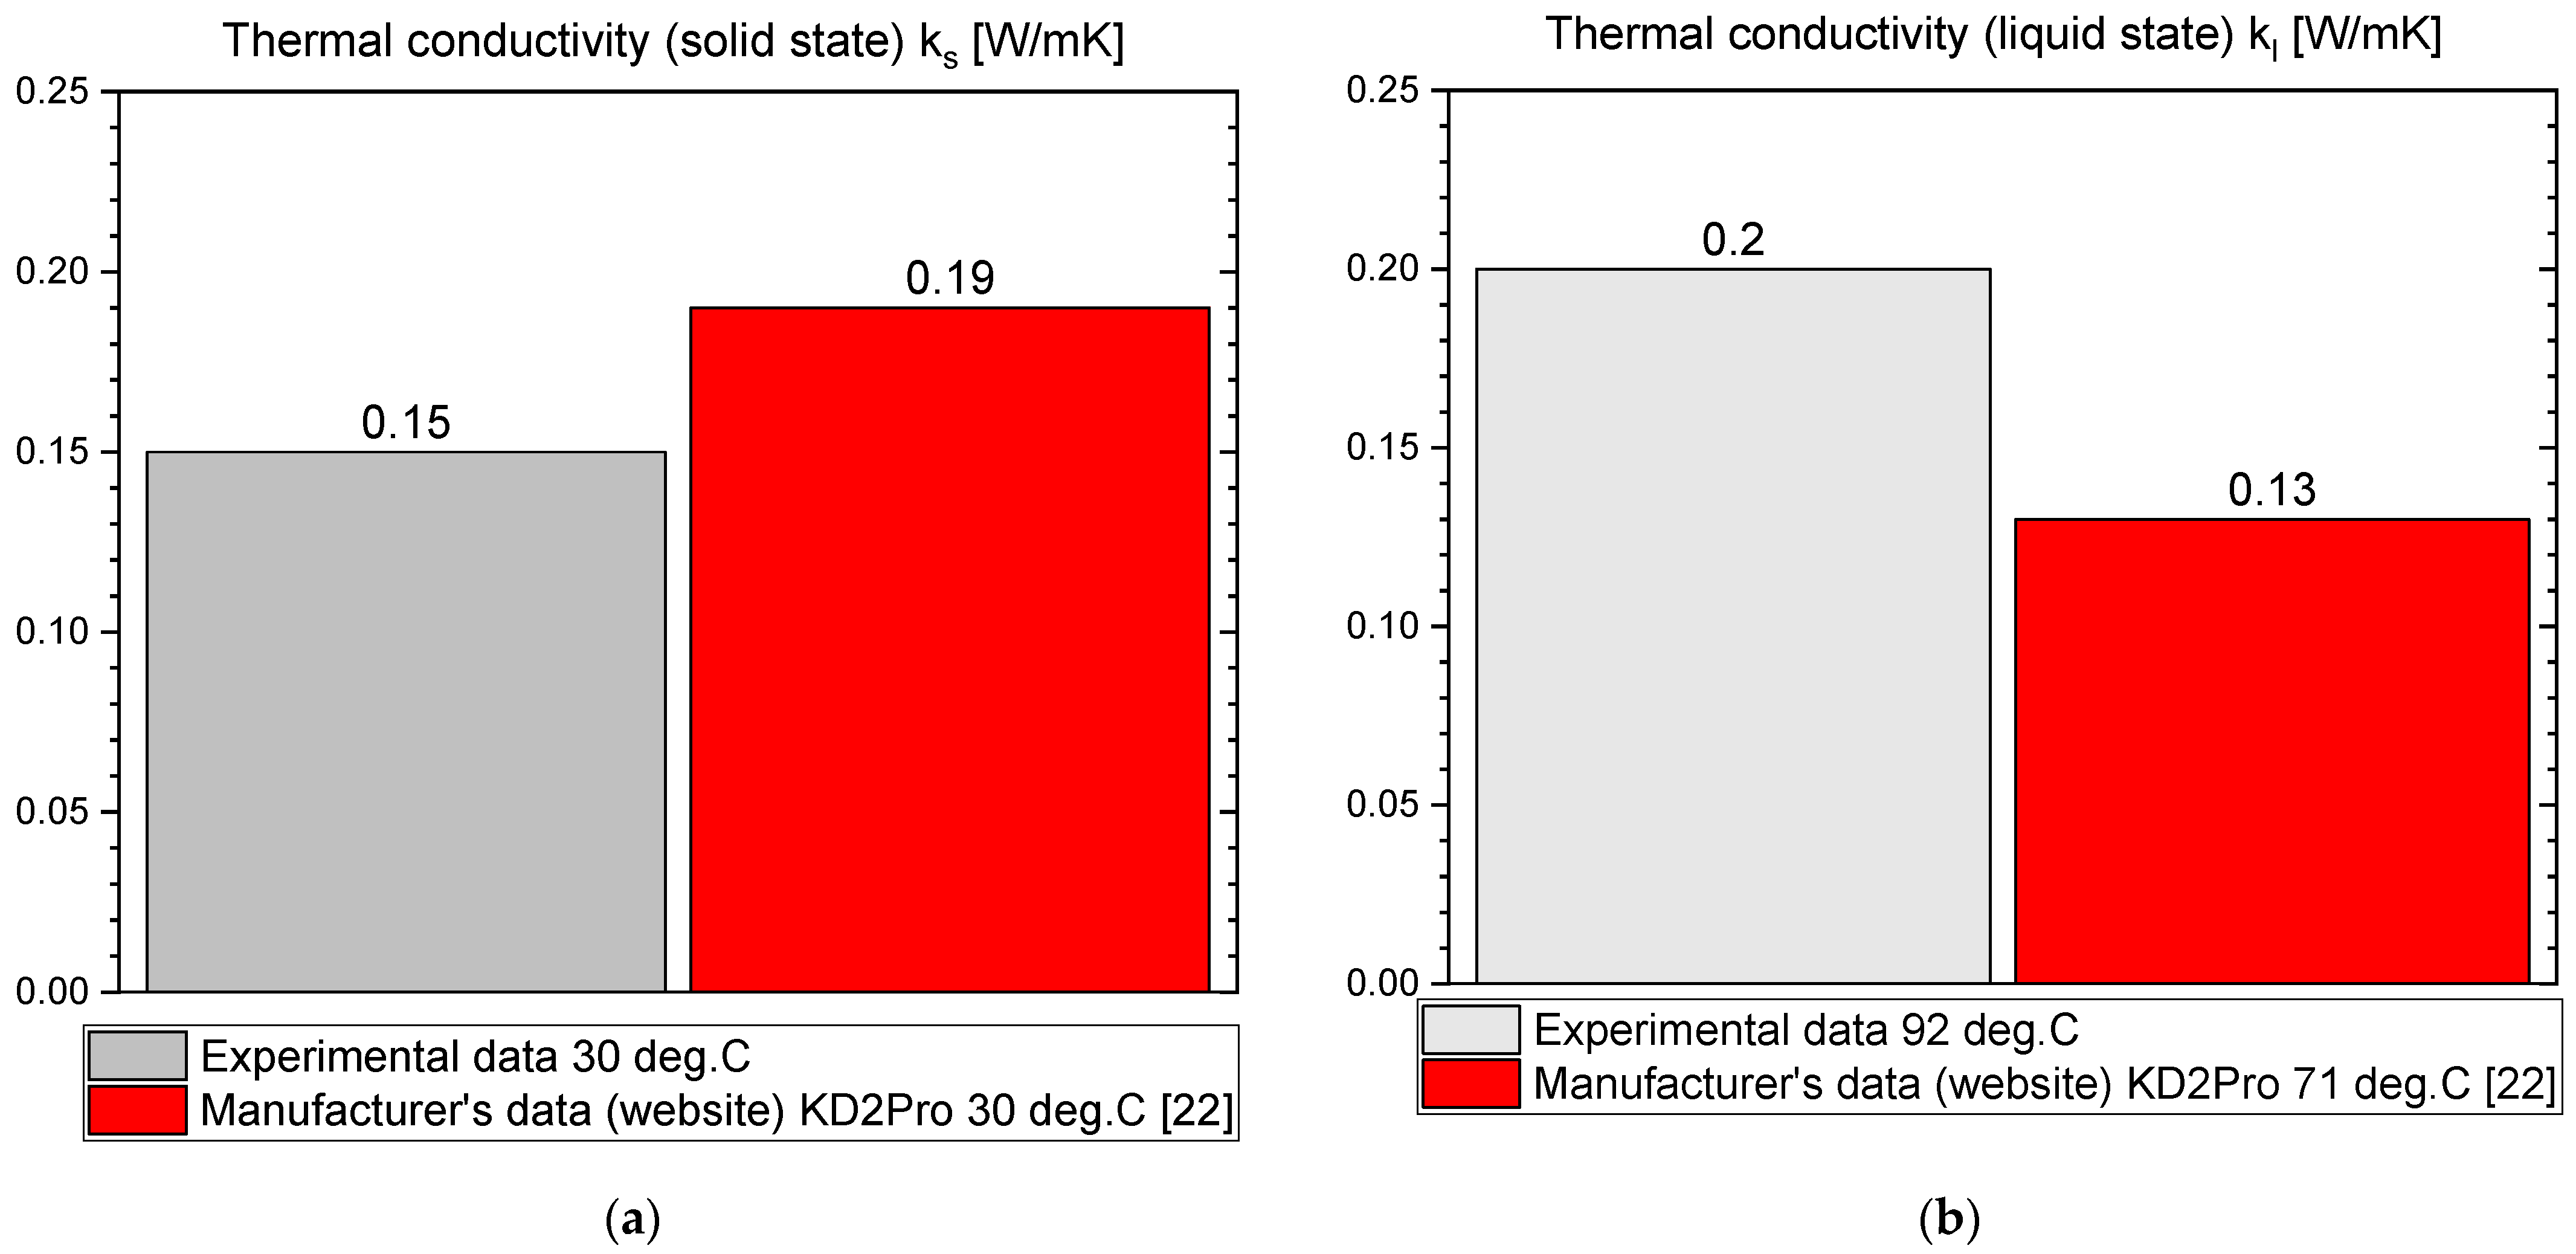
- OM65 is 0.15 W/m·K in solid state and 0.19 W/m·K in liquid.
- OM55 is 0.16 W/m·K in solid state and 0.20 W/m·K in liquid.
- RT55 is 0.15 W/m·K in solid state and 0.18 W/m·K in liquid.
- Comparison of the values of specific heat, latent heat and phase transition temperatures from the T-history method with the results from large-scale thermal energy stores (in which the mass of PCMs is several or several dozen kilograms) in order to determine the scale effect.
- Comparison of the PCMs thermal conductivity measurements at the same conditions using different measurement methods to better evaluate the measurement uncertainties.
- Carrying out research works aimed at increasing the thermal conductivity of PCMs by adding, for example, metal nanoparticles and determining their influence on the thermo-physical properties of PCMs.
Author Contributions
Funding
Institutional Review Board Statement
Informed Consent Statement
Data Availability Statement
Acknowledgments
Conflicts of Interest
Nomenclature
| cp | specific heat |
| Δhp | partial enthalpy |
| dw | inner pipe outer diameter |
| dz | outer pipe inner diameter |
| I | current, Equations (6), (7) and (11) |
| I | corresponding area under the PCM temperature curve, Equations (1)–(3) |
| I’ | corresponding area under the reference temperature curve |
| m | mass |
| λ | thermal conductivity |
| L | pipe length |
| Lt | latent heat |
| PCM | Phase Change Material |
| heat flow rate | |
| T | temperature |
| Tm | melting temperature of PCM |
| Tw | temperature of the outer wall of the inner pipe |
| Tz | temperature of the inner wall of the outer pipe |
| U | voltage |
| Subscripts | |
| a | ambient |
| l | liquid |
| p | PCM |
| s | solid |
| t | tube |
| w | water |
| 0 | initial value |
| 1 | before phase transition |
| 2 | during phase change |
| 3 | after phase transition |
References
- Boquera, L.; Castro, J.R.; Pisello, A.L.; Cabeza, L.F. Research progress and trends on the use of concrete as thermal energy storage material through bibliometric analysis. J. Energy Storage 2021, 38, 102562. [Google Scholar] [CrossRef]
- Nazari Sam, M.; Caggiano, A.; Mankel, C.; Koenders, E. A Comparative Study on the Thermal Energy Storage Performance of Bio-Based and Paraffin-Based PCMs Using DSC Procedures. Materials 2020, 13, 1705. [Google Scholar] [CrossRef] [PubMed] [Green Version]
- Mahfuz, M.H.; Anisur, M.R.; Kibria, M.A.; Saidur, R.; Metselaar, I.H.S.C. Performance investigation of thermal energy storage system with Phase Change Material (PCM) for solar water heating application. Int. Commun. Heat Mass Transf. 2014, 57, 132–139. [Google Scholar] [CrossRef]
- Shirinbakhsh, M.; Mirkhani, N.; Sajadi, B. A comprehensive study on the effect of hot water demand and PCM integration on the performance of SDHW system. Sol. Energy 2018, 159, 405–414. [Google Scholar] [CrossRef]
- Kapica, P. Storage of energy from household wind power plant in heat using a buffer tank with PCM (Magazynowanie energii z prosumenckiej siłowni wiatrowej w cieple z wykorzystaniem zasobnika buforowego z PCM). Rynek Energii 2020, 3, 47–53. (In Polish) [Google Scholar]
- Khan, M.; Saidur, R.; Al-Sulaiman, F. A review for phase change materials (PCMs) in solar absorption refrigeration systems. Renew. Sustain. Energy 2017, 76, 105–137. [Google Scholar] [CrossRef]
- Karwacki, J. Cooling System with PCM Storage for an Office Building: Experimental Investigation Aided by a Model of the Office Thermal Dynamics. Materials 2021, 14, 1356. [Google Scholar] [CrossRef] [PubMed]
- Moreno, P.; Solé, C.; Castell, A.; Cabeza, L.F. The use of phase change materials in domestic heat pump and air-conditioning systems for short term storage: A review. Renew. Sustain. Energy Rev. 2014, 39, 1–13. [Google Scholar] [CrossRef]
- Turski, M.; Nogaj, K.; Sekret, R. The use of a PCM heat accumulator to improve the efficiency of the district heating substation. Energy 2019, 187, 115885. [Google Scholar] [CrossRef]
- Nogaj, K.; Turski, M.; Sekret, R. The use of substations with PCM heat accumulators in district heating system. MATEC Web Conf. ECCE 2018, 174, 01002. [Google Scholar] [CrossRef] [Green Version]
- Nasef, H.A.; Nada, S.A.; Hassan, H. Integrative passive and active cooling system using PCM and nanofluid for thermal regulation of concentrated photovoltaic solar cells. Energy Convers. Manag. 2019, 199, 112065. [Google Scholar] [CrossRef]
- Kuznik, F.; Virgone, J.; Noel, J. Optimization of a phase change material wallboard for building use. Appl. Therm. Eng. 2008, 28, 1291–1298. [Google Scholar] [CrossRef] [Green Version]
- Kuznik, F.; Virgone, J.; Roux, J.J. Energetic efficiency of room wall containing PCM wallboard: A full-scale experimental investigation. Energy Build. 2008, 40, 148–156. [Google Scholar] [CrossRef]
- Castell, A.; Martorell, I.; Medrano, M.; Pérez, G.; Cabeza, L.F. Experimental study of using PCM in brick constructive solutions for passive cooling. Energy Build. 2010, 42, 534–540. [Google Scholar] [CrossRef]
- Li, S.; Sun, G.; Zou, K.; Zhang, X. Experimental research on the dynamic thermal performance of a novel triple-pane building window filled with PCM. Sustain. Cities Soc. 2016, 27, 15–22. [Google Scholar] [CrossRef]
- Pasupathy, A.; Velraj, R. Effect of double layer phase change material in building roof for year round thermal management. Energy Build. 2008, 40, 193–203. [Google Scholar] [CrossRef]
- Solé, A.; Miró, L.; Barreneche, C.; Martorell, I.; Cabeza, L.F. Review of the T -history method to determine thermophysical properties of phase change materials (PCM). Renew. Sustain. Energy Rev. 2013, 26, 425–436. [Google Scholar] [CrossRef]
- Rolka, P.; Przybylinski, T.; Kwidzinski, R.; Lackowski, M. The heat capacity of low-temperature phase change materials (PCM) applied in thermal energy storage systems. Renew. Energy 2021, 172, 541–550. [Google Scholar] [CrossRef]
- Xu, T.; Gunasekara, S.N.; Chiu, J.N.; Palm, B.; Sawalha, S. Thermal behavior of a sodium acetate trihydrate-based PCM: T-history and full-scale tests. Appl. Energy 2020, 261, 114432. [Google Scholar] [CrossRef]
- Zhang, Y.; Zhang, X.; Xu, X.; Lu, M. Derivation of thermal properties of phase change materials based on T-history method. J. Energy Storage 2020, 27, 101062. [Google Scholar] [CrossRef]
- Rudra, M.; Gumtapure, V. Thermal property study of fatty acid mixture as bio-phase change material for solar thermal energy storage usage in domestic hot water application. J. Energy Storage 2019, 25, 100870. [Google Scholar] [CrossRef]
- Manufacturer’s Data PLUSS. Available online: https://www.pluss.co.in/product-range-PCM.php (accessed on 28 November 2021).
- Palacios, A.; Cong, L.; Navarro, M.E.; Ding, Y.; Barreneche, C. Thermal conductivity measurement techniques for characterizing thermal energy storage materials—A review. Renew. Sustain. Energy Rev. 2019, 108, 32–52. [Google Scholar] [CrossRef]
- Zhang, Y.; Jiang, Y.; Jiang, Y. A simple method, the T-history method, of determining the heat of fusion, specific heat and thermal conductivity of phase-change materials. Meas. Sci. Technol. 1999, 10, 201–205. [Google Scholar]
- Hong, H.; Kim, S.K.; Kim, Y.-S. Accuracy improvement of T-history method for measuring heat of fusion of various materials. Int. J. Refrig. 2004, 27, 360–366. [Google Scholar] [CrossRef]
- Sandnes, B.; Rekstad, J. Supercooling salt hydrates: Stored enthalpy as a function of temperature. Sol. Energy 2006, 80, 616–625. [Google Scholar] [CrossRef]
- Kravvaritis, E.D.; Antonopoulos, K.A.; Tzivanidis, C. Improvements to the measurement of the thermal properties of phase change materials. Meas. Sci. Technol. 2010, 21, 045103. [Google Scholar] [CrossRef]
- Rady, M.A.; Arquis, E.; Le Bot, C. Characterization of granular phase changing composites for thermal energy storage using the T-history method. Int. J. Energy Res. 2010, 34, 333–344. [Google Scholar] [CrossRef]
- Martínez, A.; Carmona, M.; Cortés, C.; Arauzo, I. Characterization of Thermophysical Properties of Phase Change Materials Using Unconventional Experimental Technologies. Energies 2020, 13, 4687. [Google Scholar] [CrossRef]
- He, F.; Zou, J.; Meng, X.; Gao, W.; Ai, L. Effect of copper foam fin (CFF) shapes on thermal performance improvement of the latent heat storage units. J. Energy Storage 2021, 103520, in press. [Google Scholar] [CrossRef]
- Kravvaritis, E.D.; Antonopoulos, K.A.; Tzivanidis, C. Experimental determination of the effective thermal capacity function and other thermal properties for various phase change materials using the thermal delay method. Appl. Energy 2011, 88, 4459–4469. [Google Scholar] [CrossRef]
- Rathgeber, C.; Schmit, H.; Miró, L.; Cabeza, L.F.; Gutierrez, A.; Ushak, S.N.; Hiebler, S. Enthalpy-temperature plots to compare calorimetric measurements of phase change materials at different sample scales. J. Energy Storage 2018, 15, 32–38. [Google Scholar] [CrossRef] [Green Version]
- Manufacturer’s Data Rubitherm. Available online: https://www.rubitherm.eu/produktkategorien.html (accessed on 28 November 2021).
- Marín, J.M.; Zalba, B.; Cabeza, L.F.; Mehling, H. Determination of enthalpy-temperature curves of phase change materials with the temperature-history method: Improvement to temperature dependent properties. Meas. Sci. Technol. 2003, 14, 184–189. [Google Scholar] [CrossRef]
- Kapica, P.; Karwacki, J.; Bykuć, S. The use of the T-history method to estimate thermal capacity and latent heat for RT15 and RT18 materials. E3S Web Conf. 2018, 70, 01008. [Google Scholar] [CrossRef]
- Sobieski, W. Thermodynamics in Experiments; University of Warmia and Mazury: Olsztyn, Poland, 2015. (In Polish) [Google Scholar]
- Rabinovich, S.G. Evaluating Measurement Accuracy. In A Practical Approach, 3rd ed.; Springer International Publishing: Berlin/Heidelberg, Germany, 2017. [Google Scholar] [CrossRef] [Green Version]
- Patil, M.D.; Khanwalkar, P.M.; Kapatkar, V.N. Experimental Investigation of Heat Exchanger Using Phase Change Material. Int. Eng. Res. J. (IERJ) 2016, 649–655. [Google Scholar]


| Method | Advantages | Disadvantages |
|---|---|---|
| DSC method |
|
|
| T-history method |
|
|
| PCM Name | Manufacturer | Tm [°C] | Ts [°C] | Lsl [kJ/kg] | Cps [kJ/kgK] | Cpl [kJ/kgK] | ks [W/mK] | kl [W/mK] | THM | DSC | M | Ref. |
|---|---|---|---|---|---|---|---|---|---|---|---|---|
| RT45 | Rubitherm | 44.33 | 35.95 | 166.72 | 4.35 | 2.22 | 0.23 | X | [29] | |||
| RT45 | Rubitherm | 46 | 40 | 160 | 2 | 2 | 0.2 | 0.2 | X | [29] | ||
| Na2S2O35H2O | - | 48.0 | - | 206 | - | 3.83 | - | - | X | [24] | ||
| GR41 | Rubitherm | 31–45 | 31–45 | 65.9 | 2.784 | 2.745 | - | - | X | [28] | ||
| GR41 | Rubitherm | 33–48 | 33–48 | 64 | - | - | - | - | X | [28] | ||
| 37.5 wt% NH4NO3+62:5wt% Mg(NO3)26H2O | - | 48.7 | - | 118 | 2.60 | 2.56 | 0.34 | - | X | [24] | ||
| Myristic acid | - | 49.7–52.7 | - | 201 | 2.91 | 3.67 | 0.17 | - | X | [24] | ||
| Lauric acid | - | 52.5 | - | 160 | 1.75 | 0.17 | - | X | [24] | |||
| Lauric acid | - | - | 186 ± 10 | 2.81 ± 0.60 | 2.14 ± 0.46 | - | - | X | [25] | |||
| Hexacosane | - | 54.60–57.69 | - | 216 | 3.89 | 2.94 | 0.22 | - | X | [24] | ||
| Greek market paraffin | - | 58 56 | 50 51 | 136.5 ± 6126.9 ± 6.5 | - | - | - | - | X | [27] | ||
| Greek market paraffin | - | 146.5 | X | [27] | ||||||||
| CH3COONa3H2O | - | 58.0 | - | 248 | 2.26 | 3.33 | - | - | [24] | |||
| sodium acetate CH3COONaH2O | - | - | - | 245 ± 9 | 2.26 ± 0.13 | 3.74 ± 0.59 | - | - | [25] | |||
| Sodium acetate trihydrate, CH3COONa3H2O (SAT) | - | 40–55 | - | 243 | 3.13 | 3.28 | - | - | [26] | |||
| SAT | - | 49.8–54.6 | 49.8–54.6 | 253.7 | 3.23 | 3.23 | 0.6349 | 0.6349 | X | [20] | ||
| SAT | - | 48.3–53.5 | 48.3–53.5 | 252.1 | - | - | 0.6326 | 0.6326 | X | [20] | ||
| OM55 | PLUSS | 55 | 54.3 | 180–209 | 2.3 | 2.6 | - | - | X | [21] | ||
| OM55 | PLUSS | 54.8 | 53.9 | 175–201 | 2.7 | 3.1 | 0.21 | 0.19 | X | [21] | ||
| RT55 | Rubitherm | 54.51 | 42.82 | 168.30 | 5.36 | 2.43 | 0.2 | X | [29] | |||
| RT55 | Rubitherm | 54.1 | 35.7 | 223–226 | - | - | - | - | X | [30] | ||
| RT55 | Rubitherm | 57 | 56 | 170 | 2 | 2 | 0.2 | 0.2 | X | [29] | ||
| C58 | Climsel | 57–61 | 55–50 | 216 ± 13 | - | - | - | - | X | [19] | ||
| C58 | Climsel | 58 | 55 | 260 | - | - | 0.57 | 0.47 | X | [19] | ||
| 58.7 wt% Mg(NO3)2 6H2O +41:3 wt% MgCl26H2O | - | 58.3 | 120 | 1.94 | 2.57 | 0.61 | - | [24] | ||||
| RT58 | Rubitherm | - | - | 176 | 1.9 | 2.6 | - | - | X | [31] | ||
| RT58 | Rubitherm | - | - | 178 | - | - | - | - | X | [33] | ||
| RT58 | Rubitherm | 52–62 | 52–62 | 162–167 | - | - | - | - | X | [32] | ||
| RT58 | Rubitherm | 52–62 | 52–62 | 162–167 | - | - | - | - | X | [32] | ||
| RT58 | Rubitherm | 52–62 | 52–62 | 167–170 | - | - | - | - | X | [32] | ||
| Mg(NO3)26H2O | - | 89.0 | - | 175 | 1.92 | 2.39 | - | - | [24] | |||
| Bischofite | - | 75–115 | 75–115 | 227–228 | - | - | - | - | X | [32] | ||
| Bischofite | - | 90–115 | 90–115 | 183–186 | - | - | - | - | X | [32] | ||
| d-mannitol | - | 115–165 | 115–165 | 396–400 | - | - | - | - | X | [32] | ||
| d-mannitol | - | 131–171 | 115–165 | 375–389 | - | - | - | - | X | [32] | ||
| Hydroquinone | - | 150–180 | 150–180 | 307–333 | - | - | - | - | X | [32] | ||
| Hydroquinone | - | 160–180 | 160–180 | 278–292 | - | - | - | - | X | [32] |
Publisher’s Note: MDPI stays neutral with regard to jurisdictional claims in published maps and institutional affiliations. |
© 2021 by the authors. Licensee MDPI, Basel, Switzerland. This article is an open access article distributed under the terms and conditions of the Creative Commons Attribution (CC BY) license (https://creativecommons.org/licenses/by/4.0/).
Share and Cite
Rolka, P.; Kwidzinski, R.; Przybylinski, T.; Tomaszewski, A. Thermal Characterization of Medium-Temperature Phase Change Materials (PCMs) for Thermal Energy Storage Using the T-History Method. Materials 2021, 14, 7371. https://doi.org/10.3390/ma14237371
Rolka P, Kwidzinski R, Przybylinski T, Tomaszewski A. Thermal Characterization of Medium-Temperature Phase Change Materials (PCMs) for Thermal Energy Storage Using the T-History Method. Materials. 2021; 14(23):7371. https://doi.org/10.3390/ma14237371
Chicago/Turabian StyleRolka, Paulina, Roman Kwidzinski, Tomasz Przybylinski, and Adam Tomaszewski. 2021. "Thermal Characterization of Medium-Temperature Phase Change Materials (PCMs) for Thermal Energy Storage Using the T-History Method" Materials 14, no. 23: 7371. https://doi.org/10.3390/ma14237371
APA StyleRolka, P., Kwidzinski, R., Przybylinski, T., & Tomaszewski, A. (2021). Thermal Characterization of Medium-Temperature Phase Change Materials (PCMs) for Thermal Energy Storage Using the T-History Method. Materials, 14(23), 7371. https://doi.org/10.3390/ma14237371