
Effect of Rod-like Structure on Fatigue Life, Short Surface Crack Initiation and Growth Characteristics of Extruded Aluminum Alloy A2024 (Analysis via Modified Linear Elastic Fracture Mechanics)


Abstract
:1. Introduction
2. Microscopic Structure of Test Material
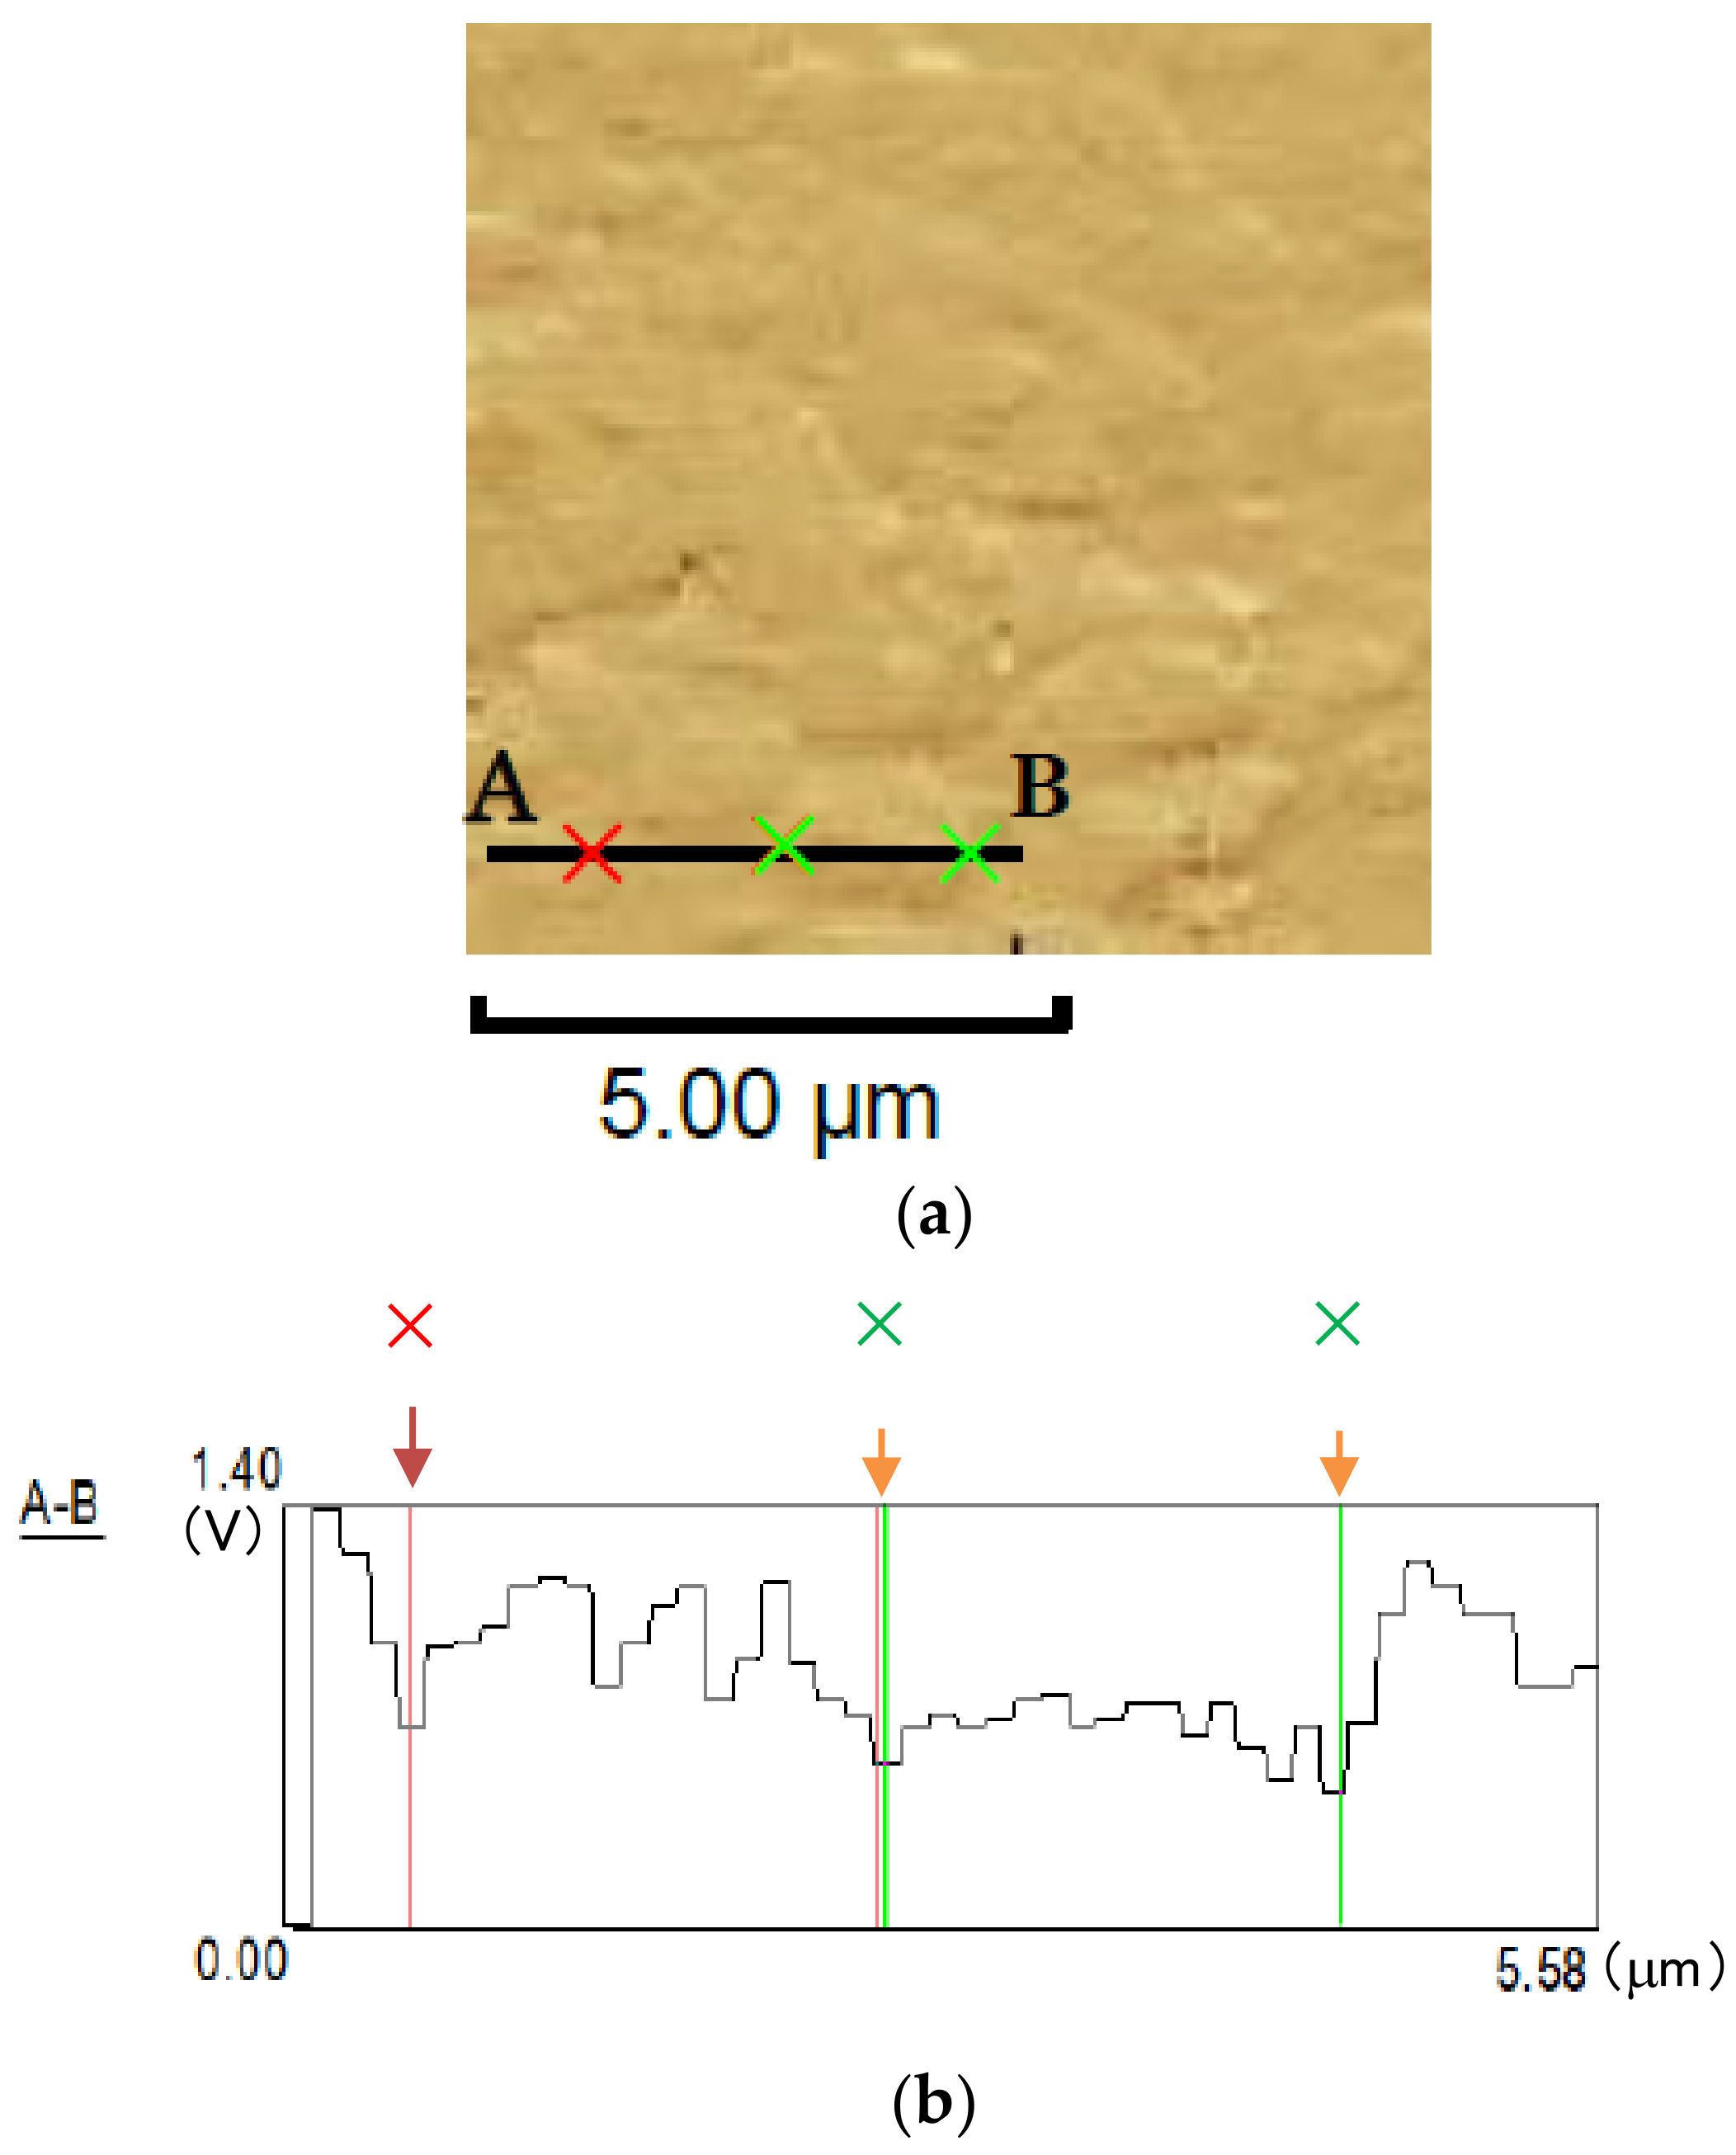
2.1. Identification of Microscopic Structure
2.2. Microhardness
2.3. Crystal Grain Size
3. Specimen and Experimental Methods
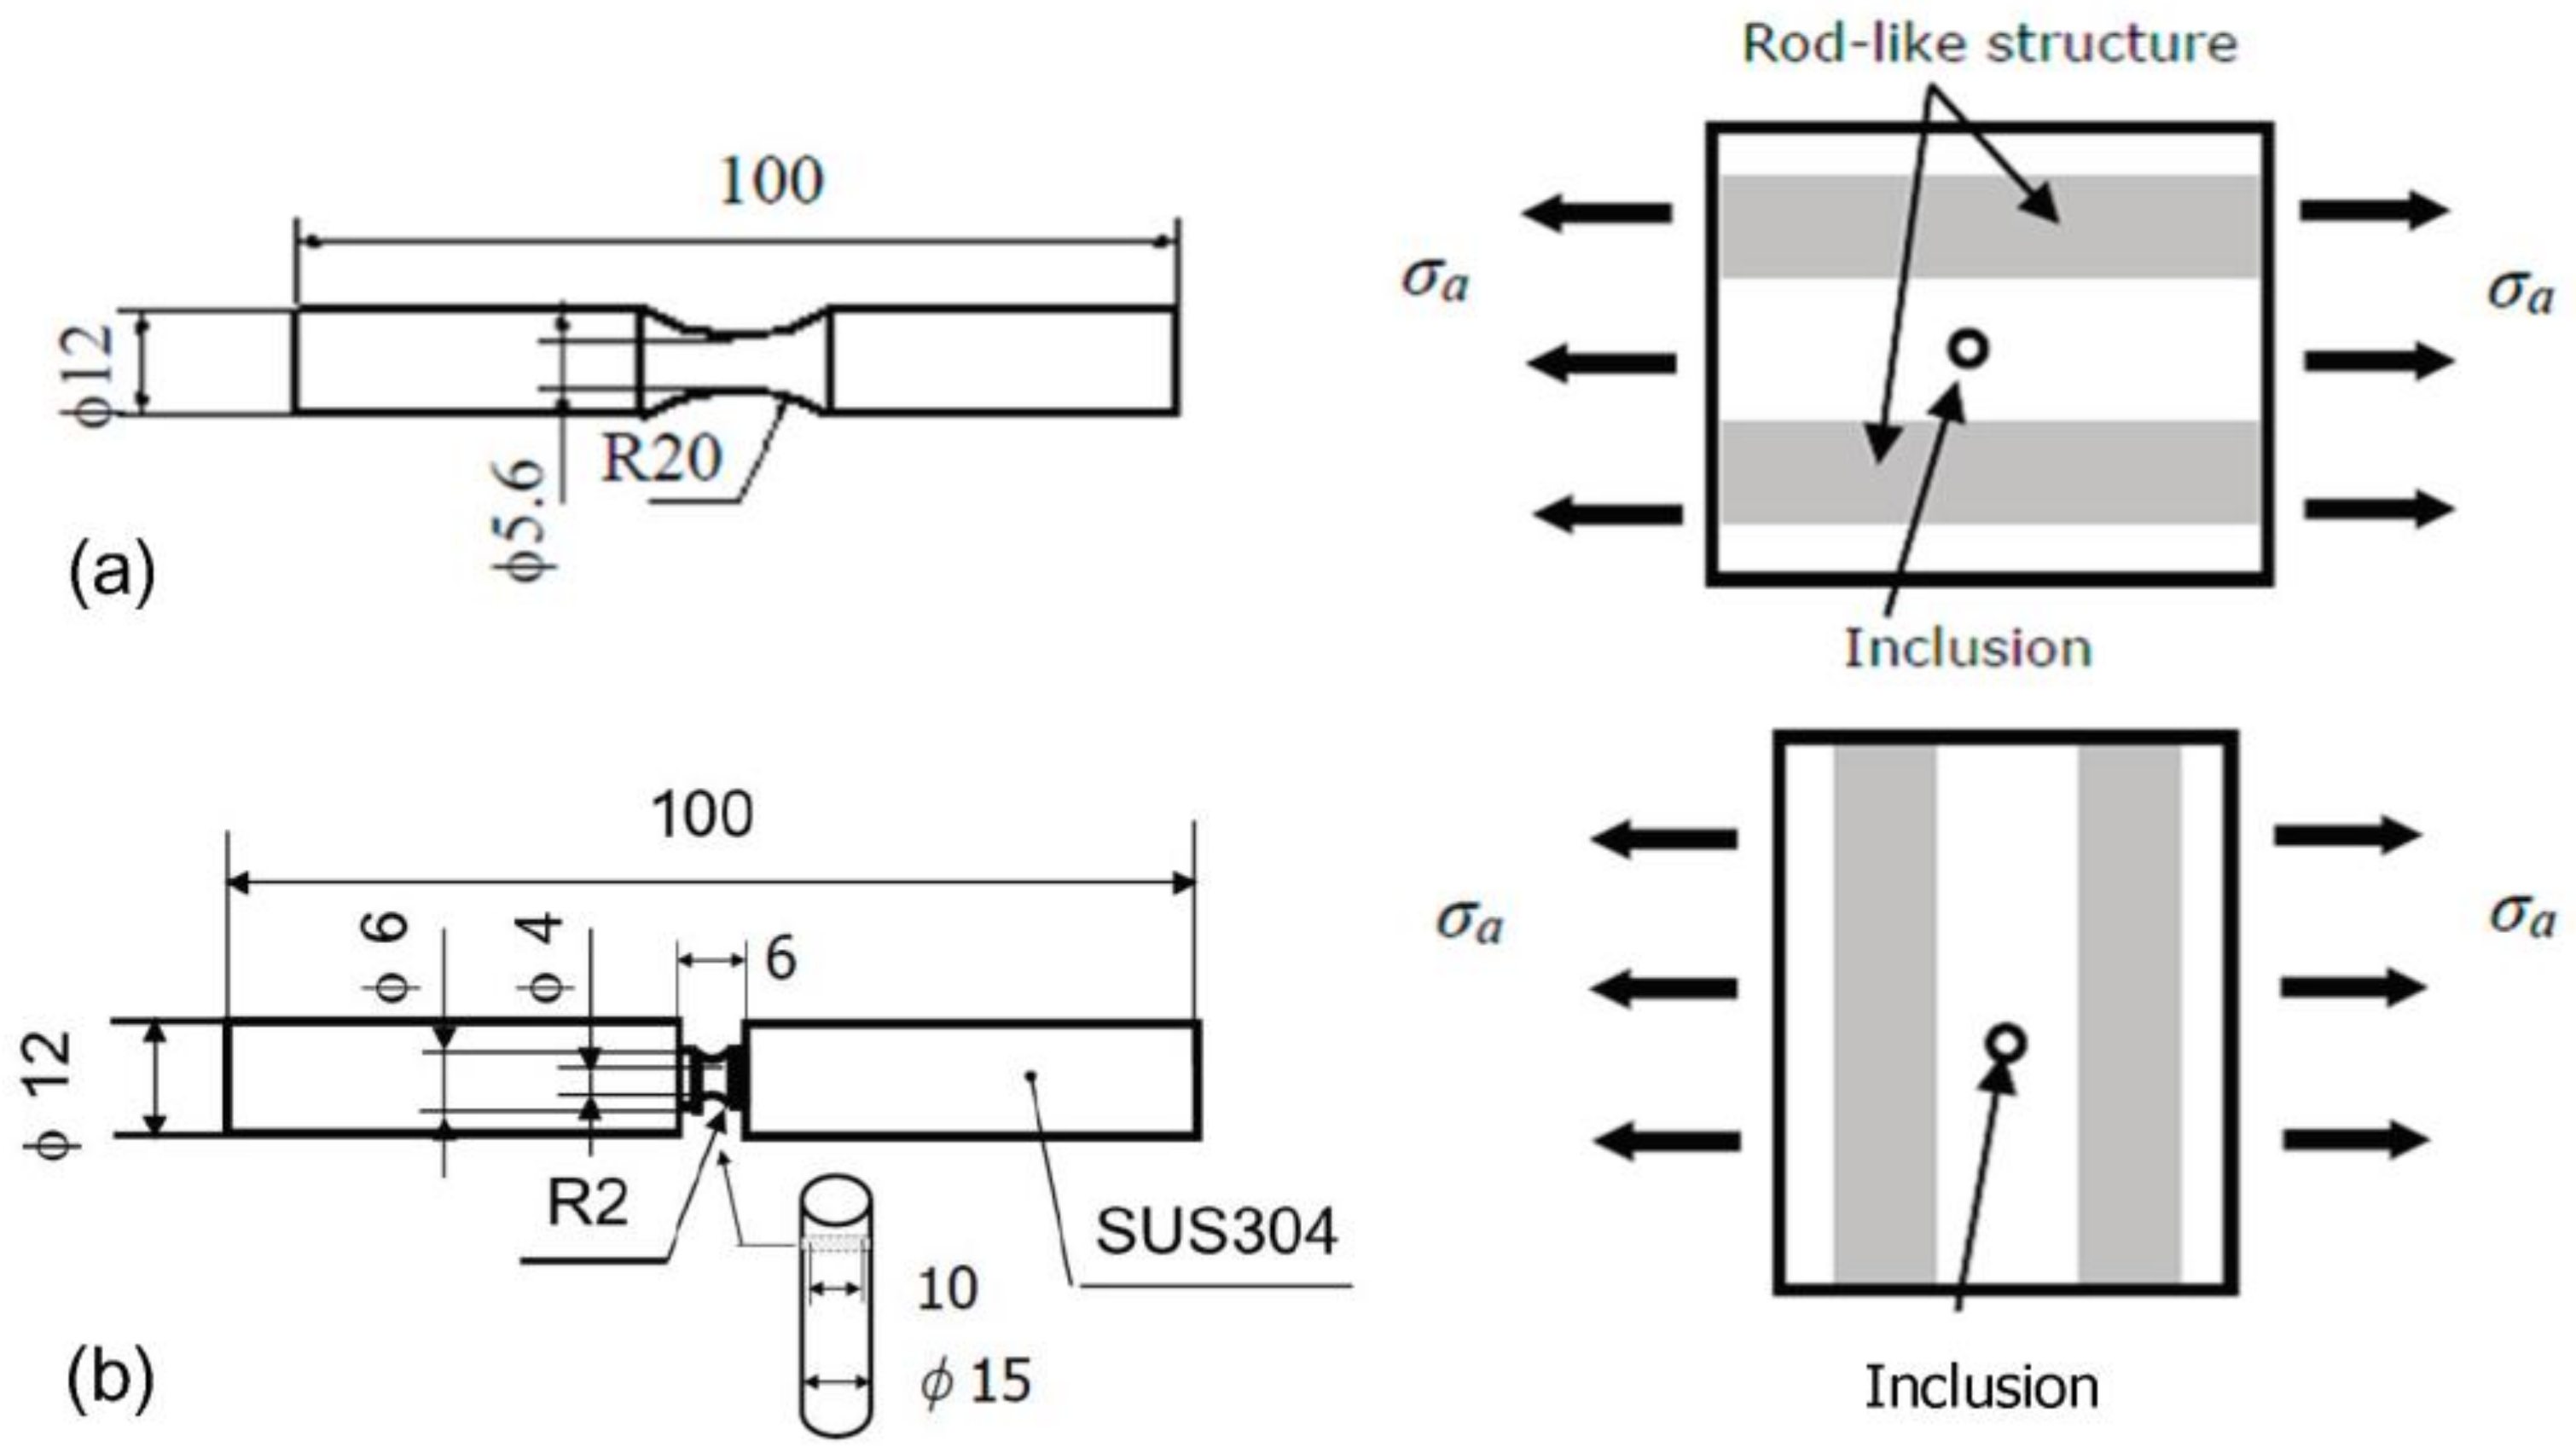
3.1. Specimen
3.2. Experimental Methods
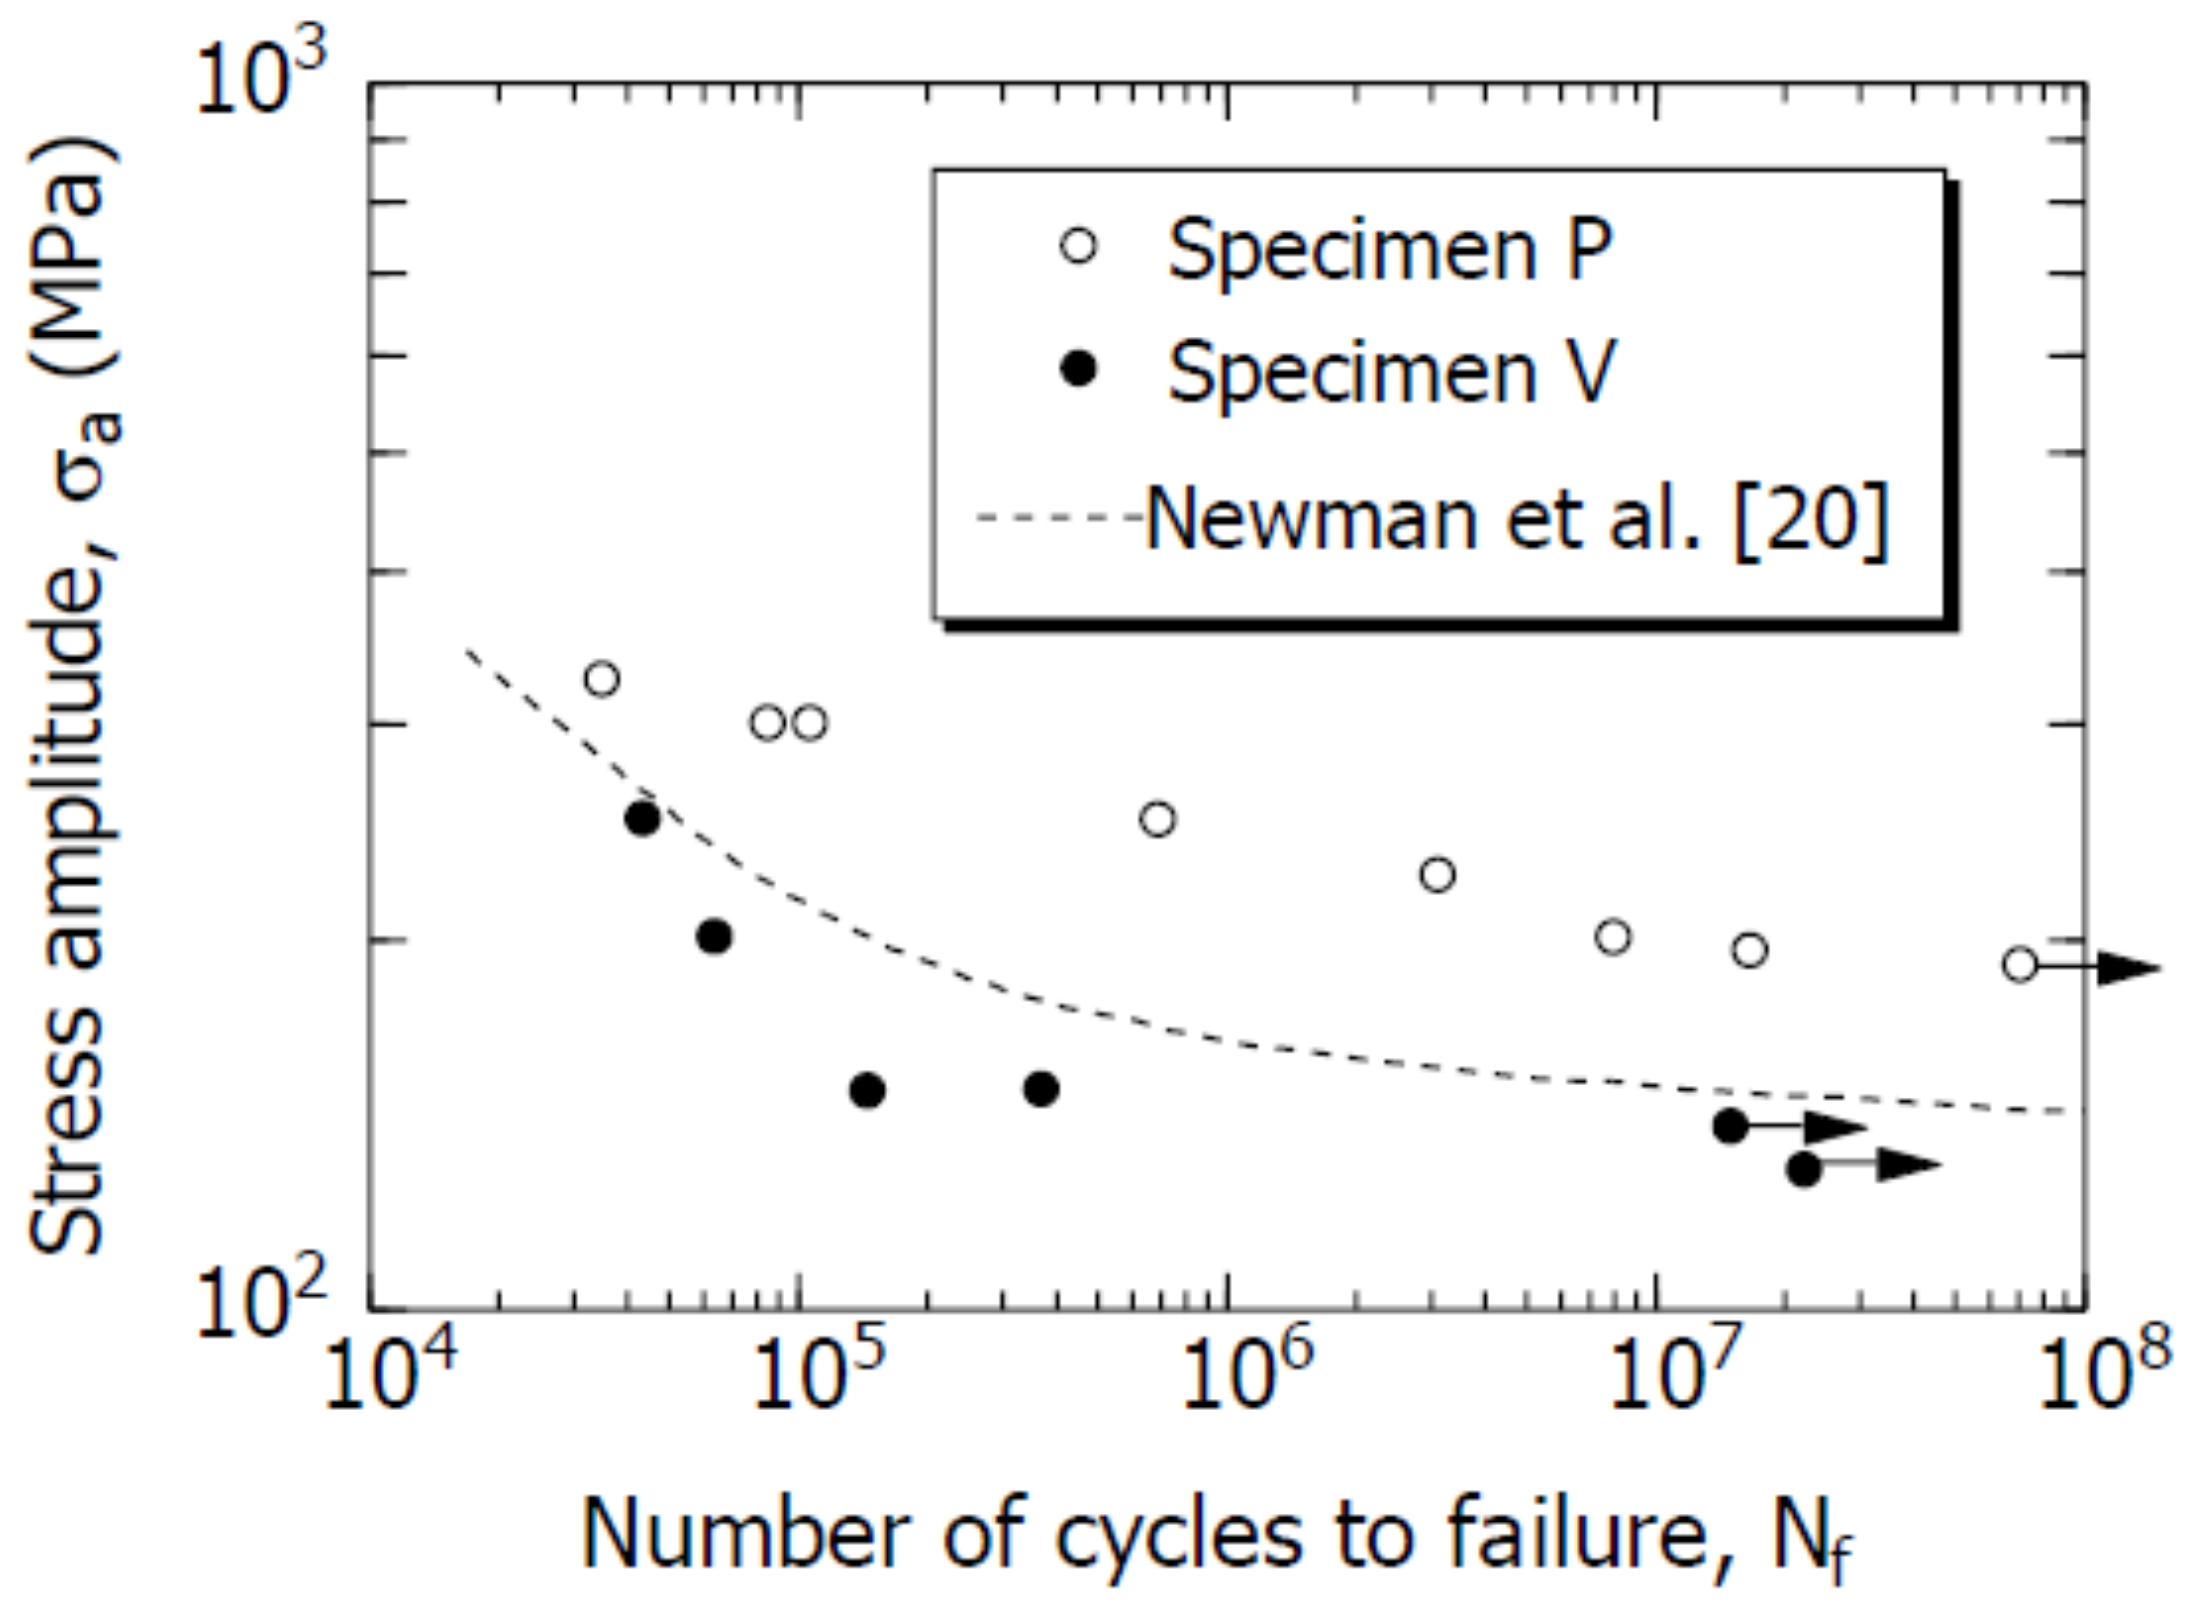
3.2.1. S–N Curve
3.2.2. FCI and FCG Experiments
Constant σa Experiment
Constant ΔK experiment
4. Experimental Results
4.1. S–N Curves
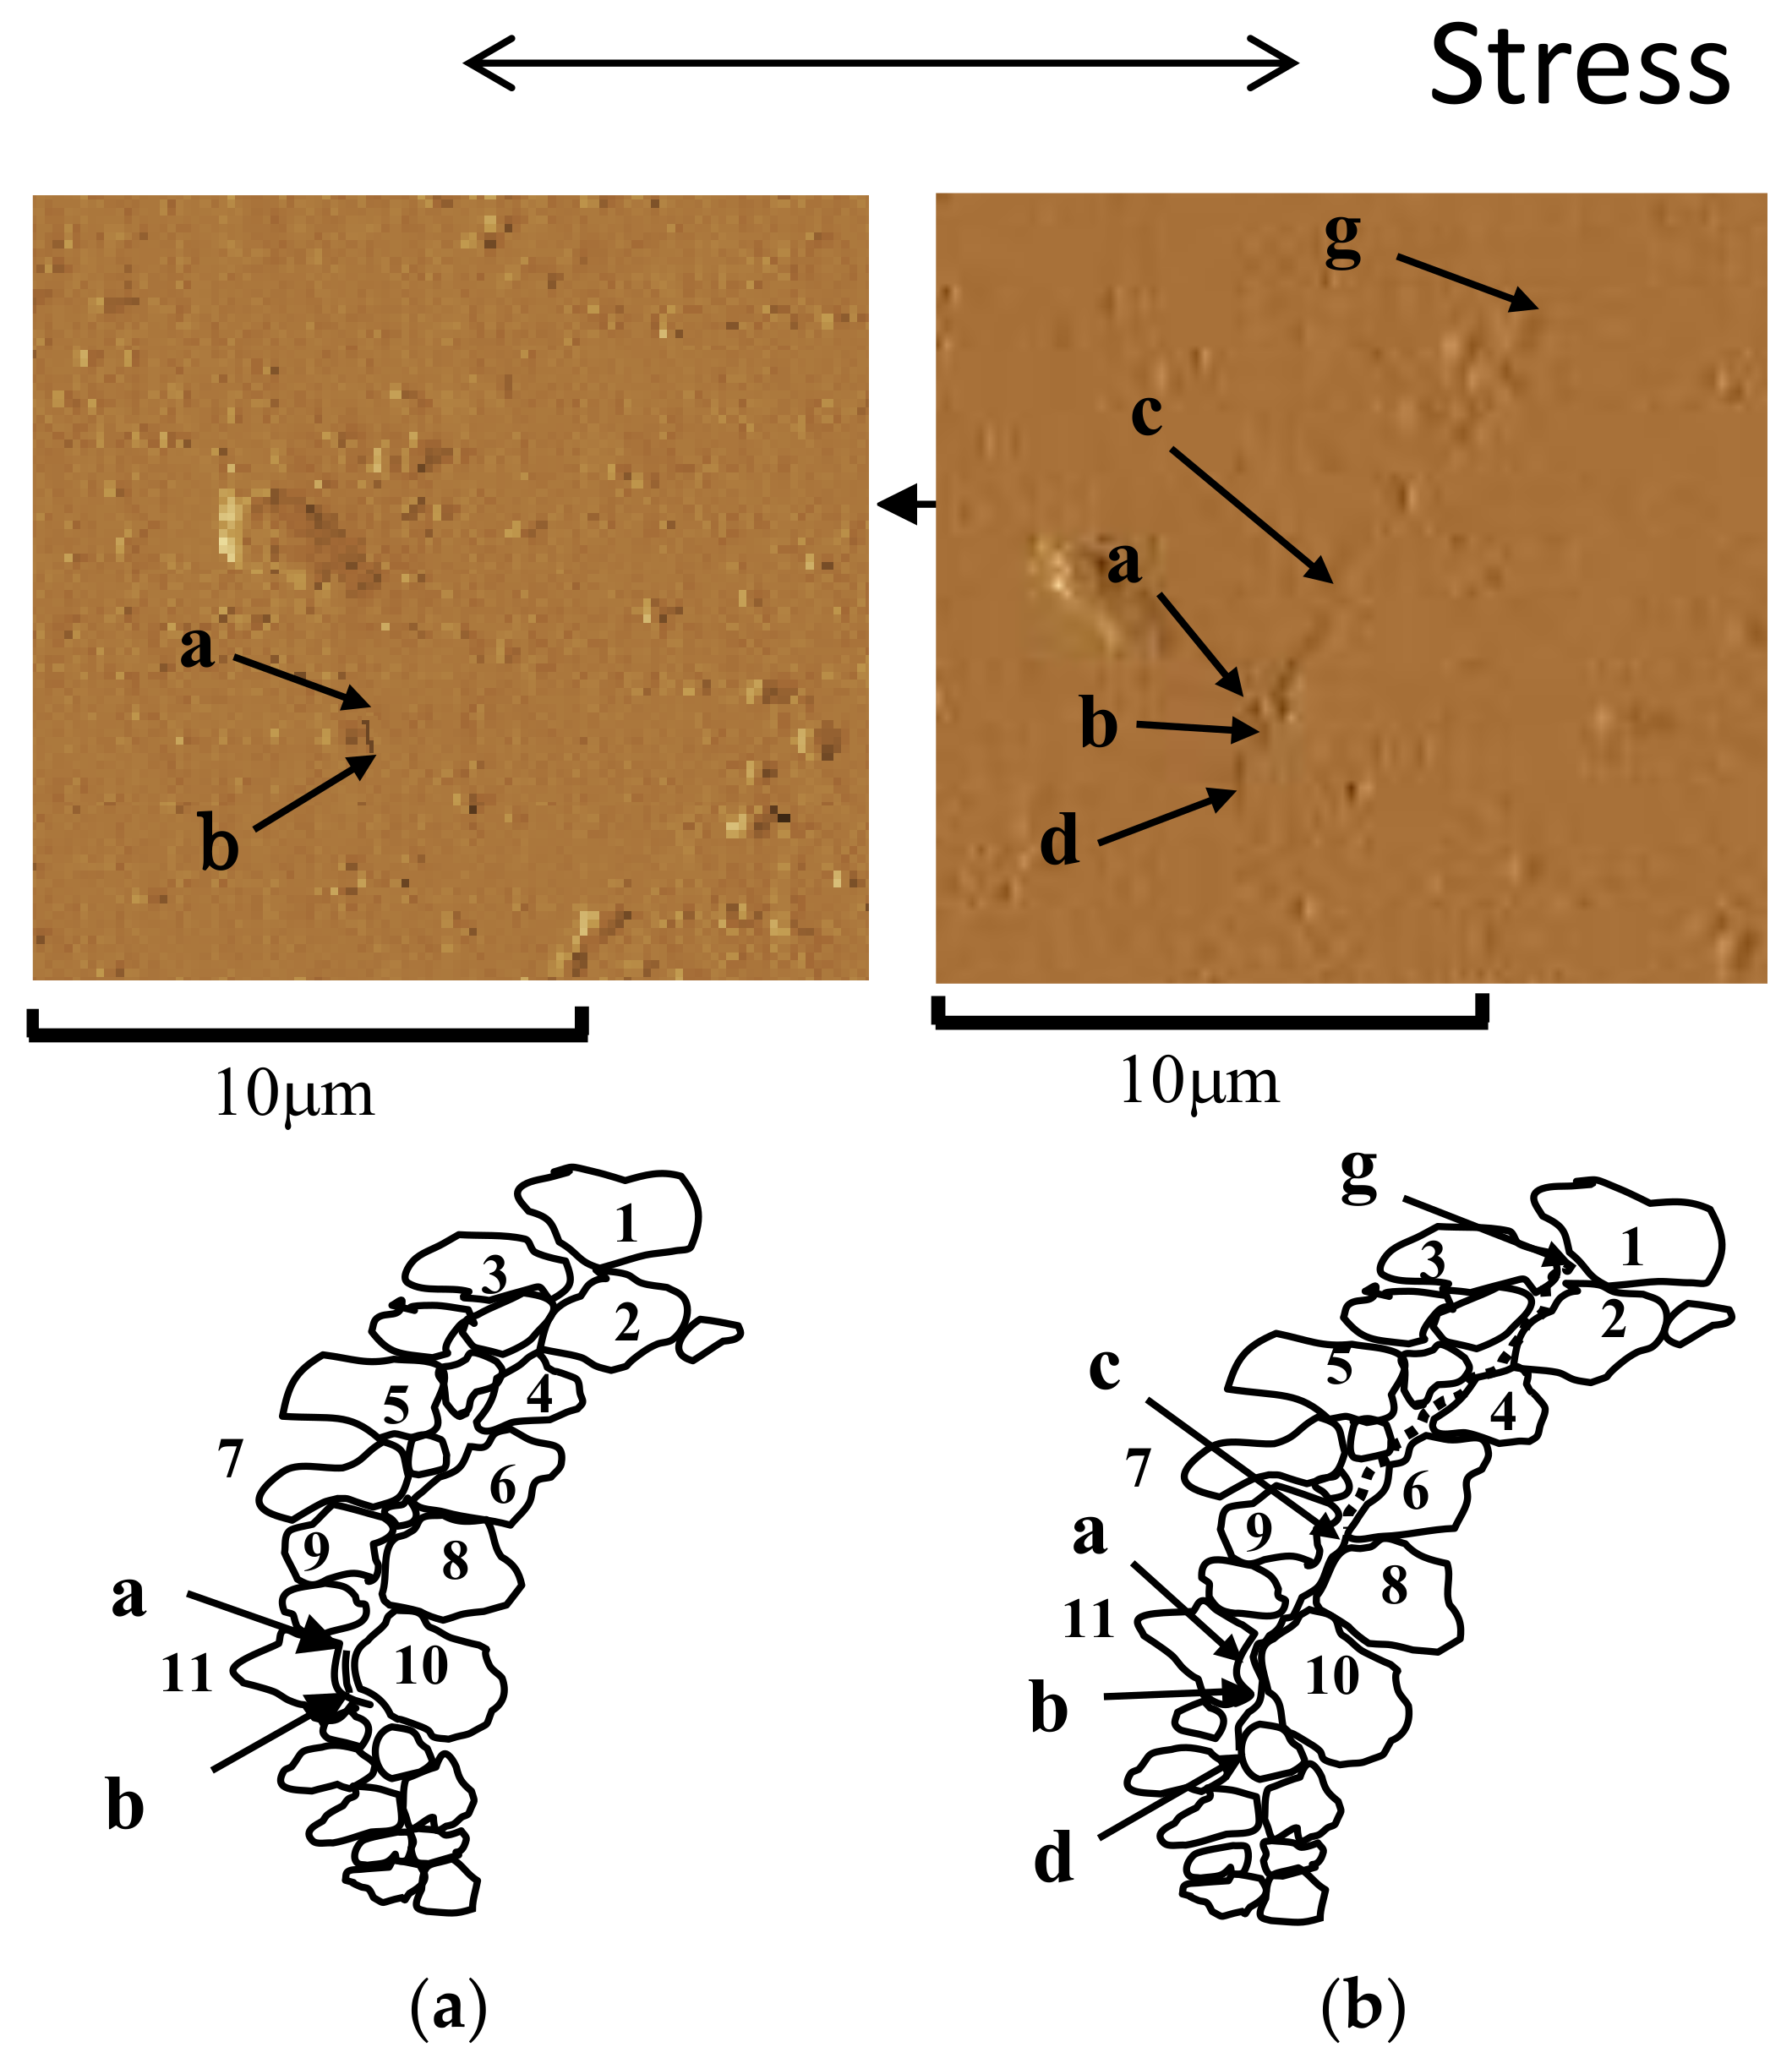
4.2. FCI and FCG Behavior of Short Surface Cracks
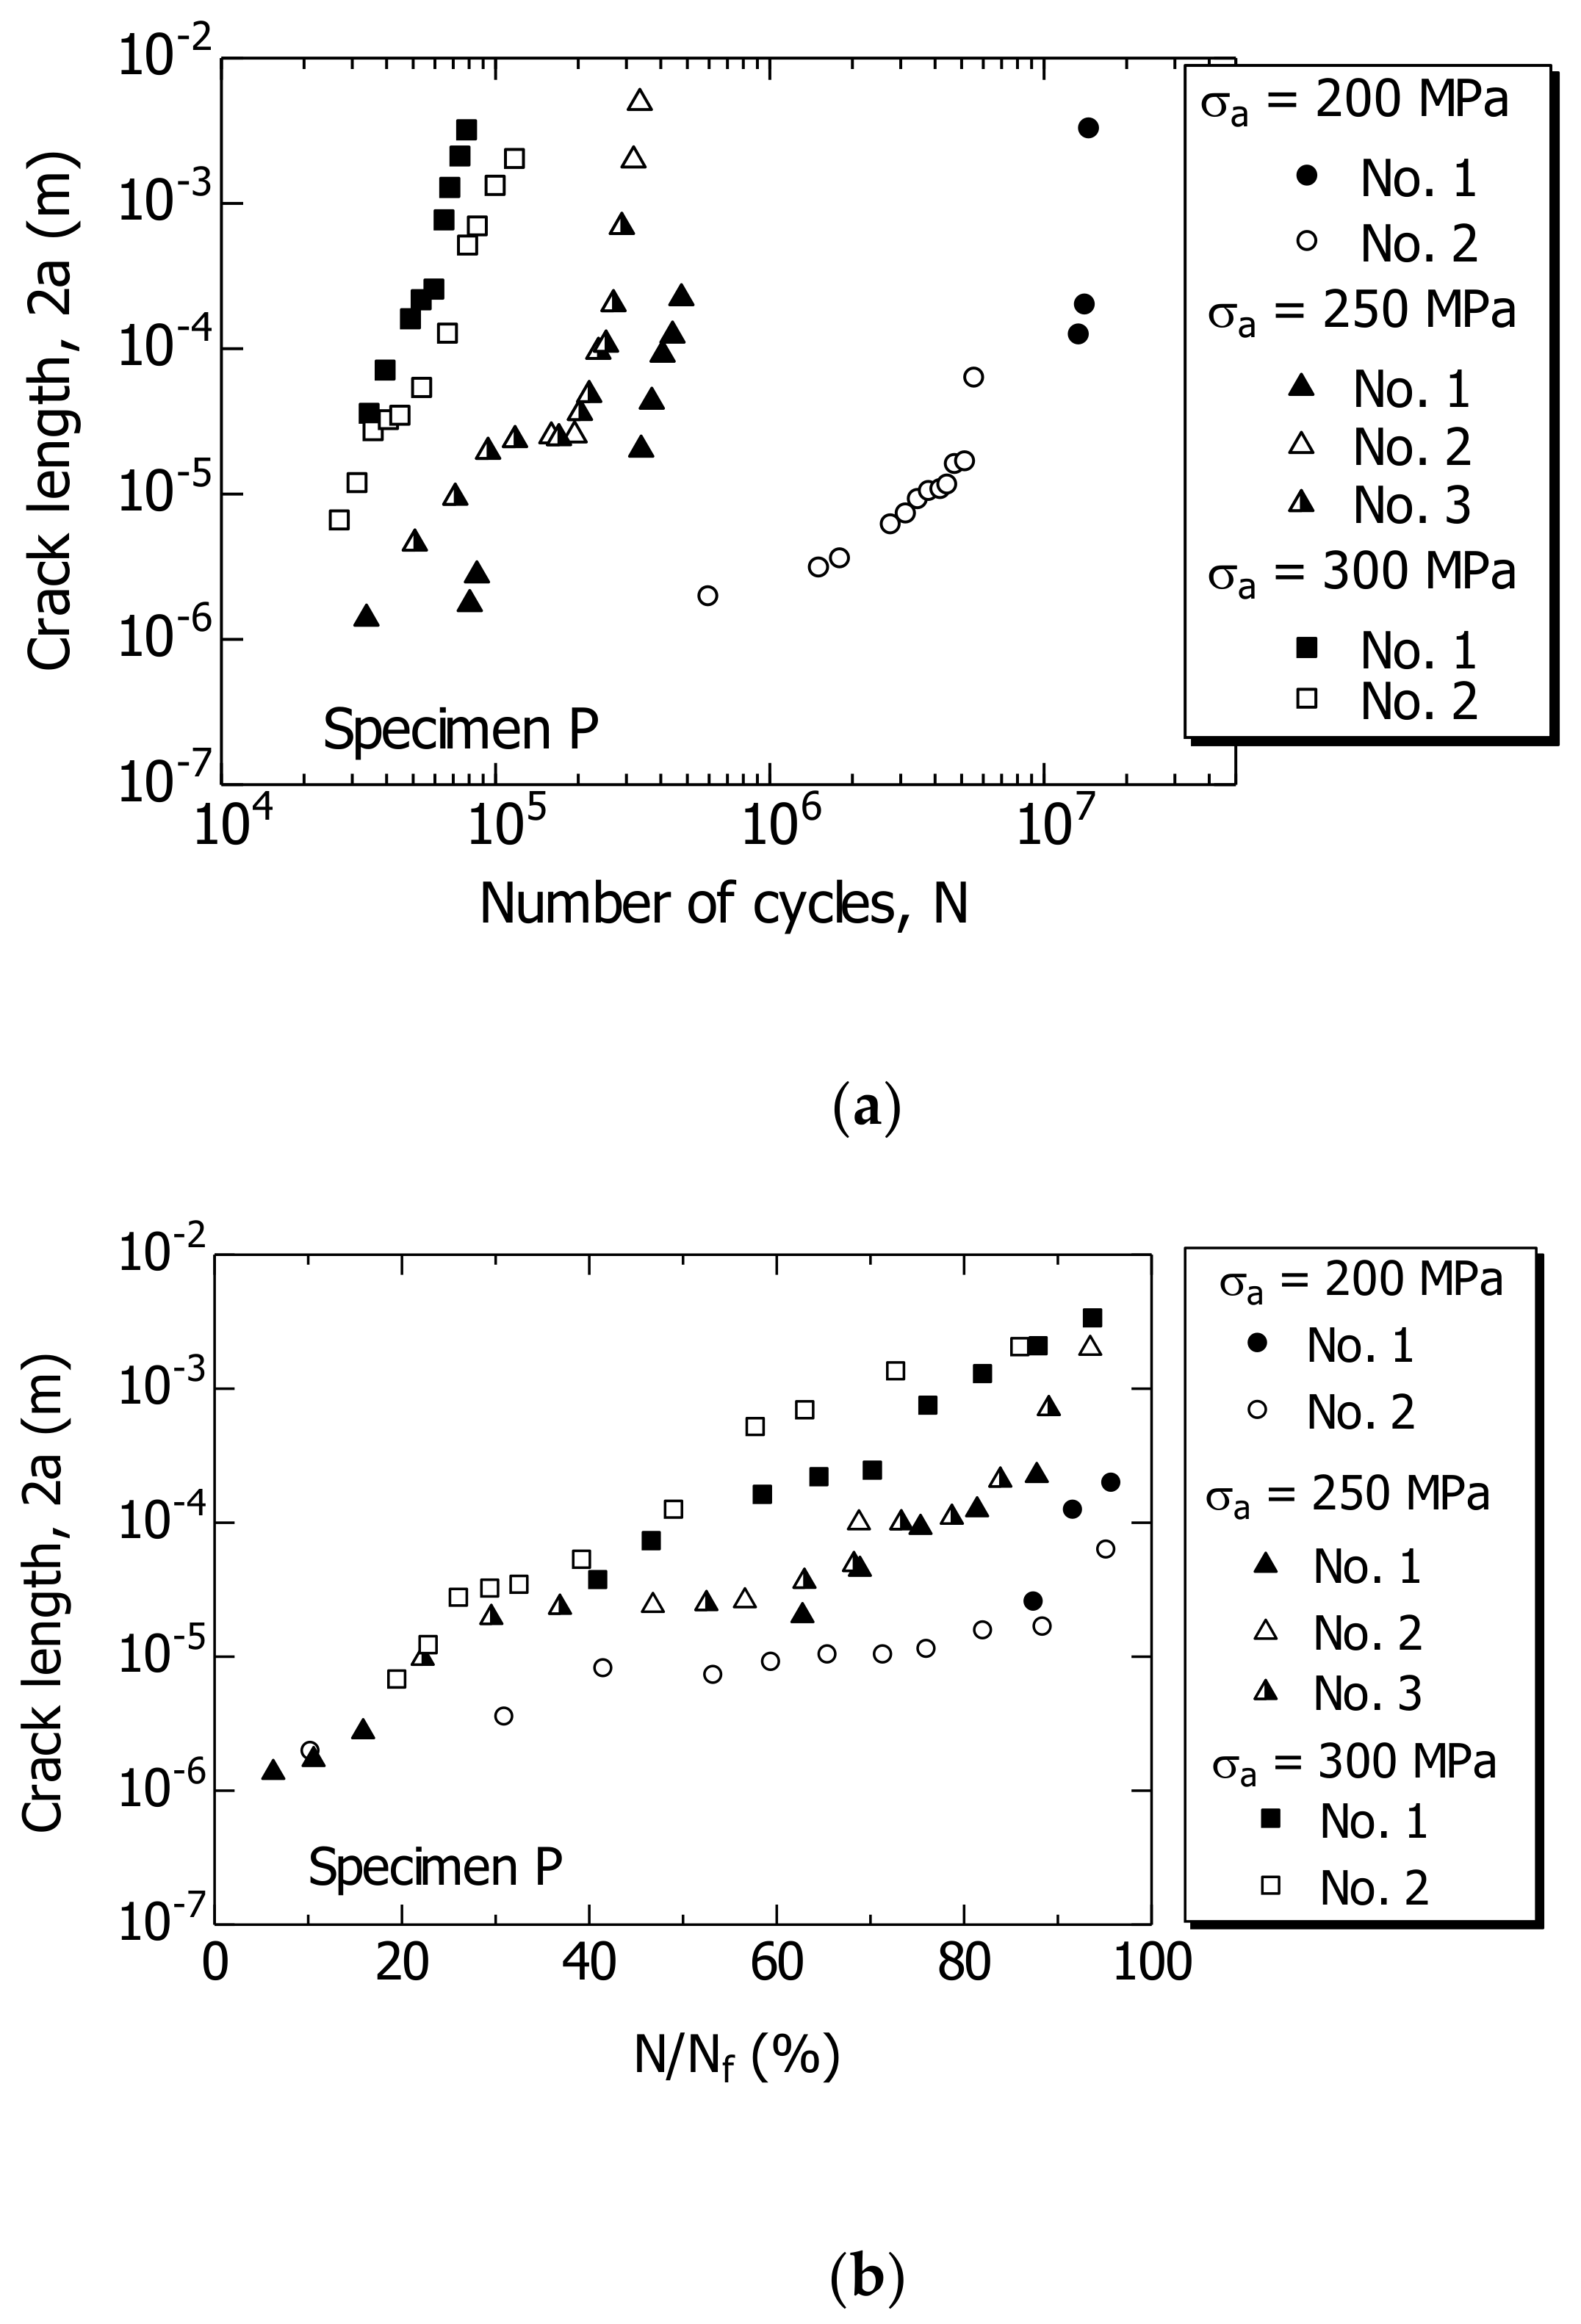
4.2.1. Specimen P
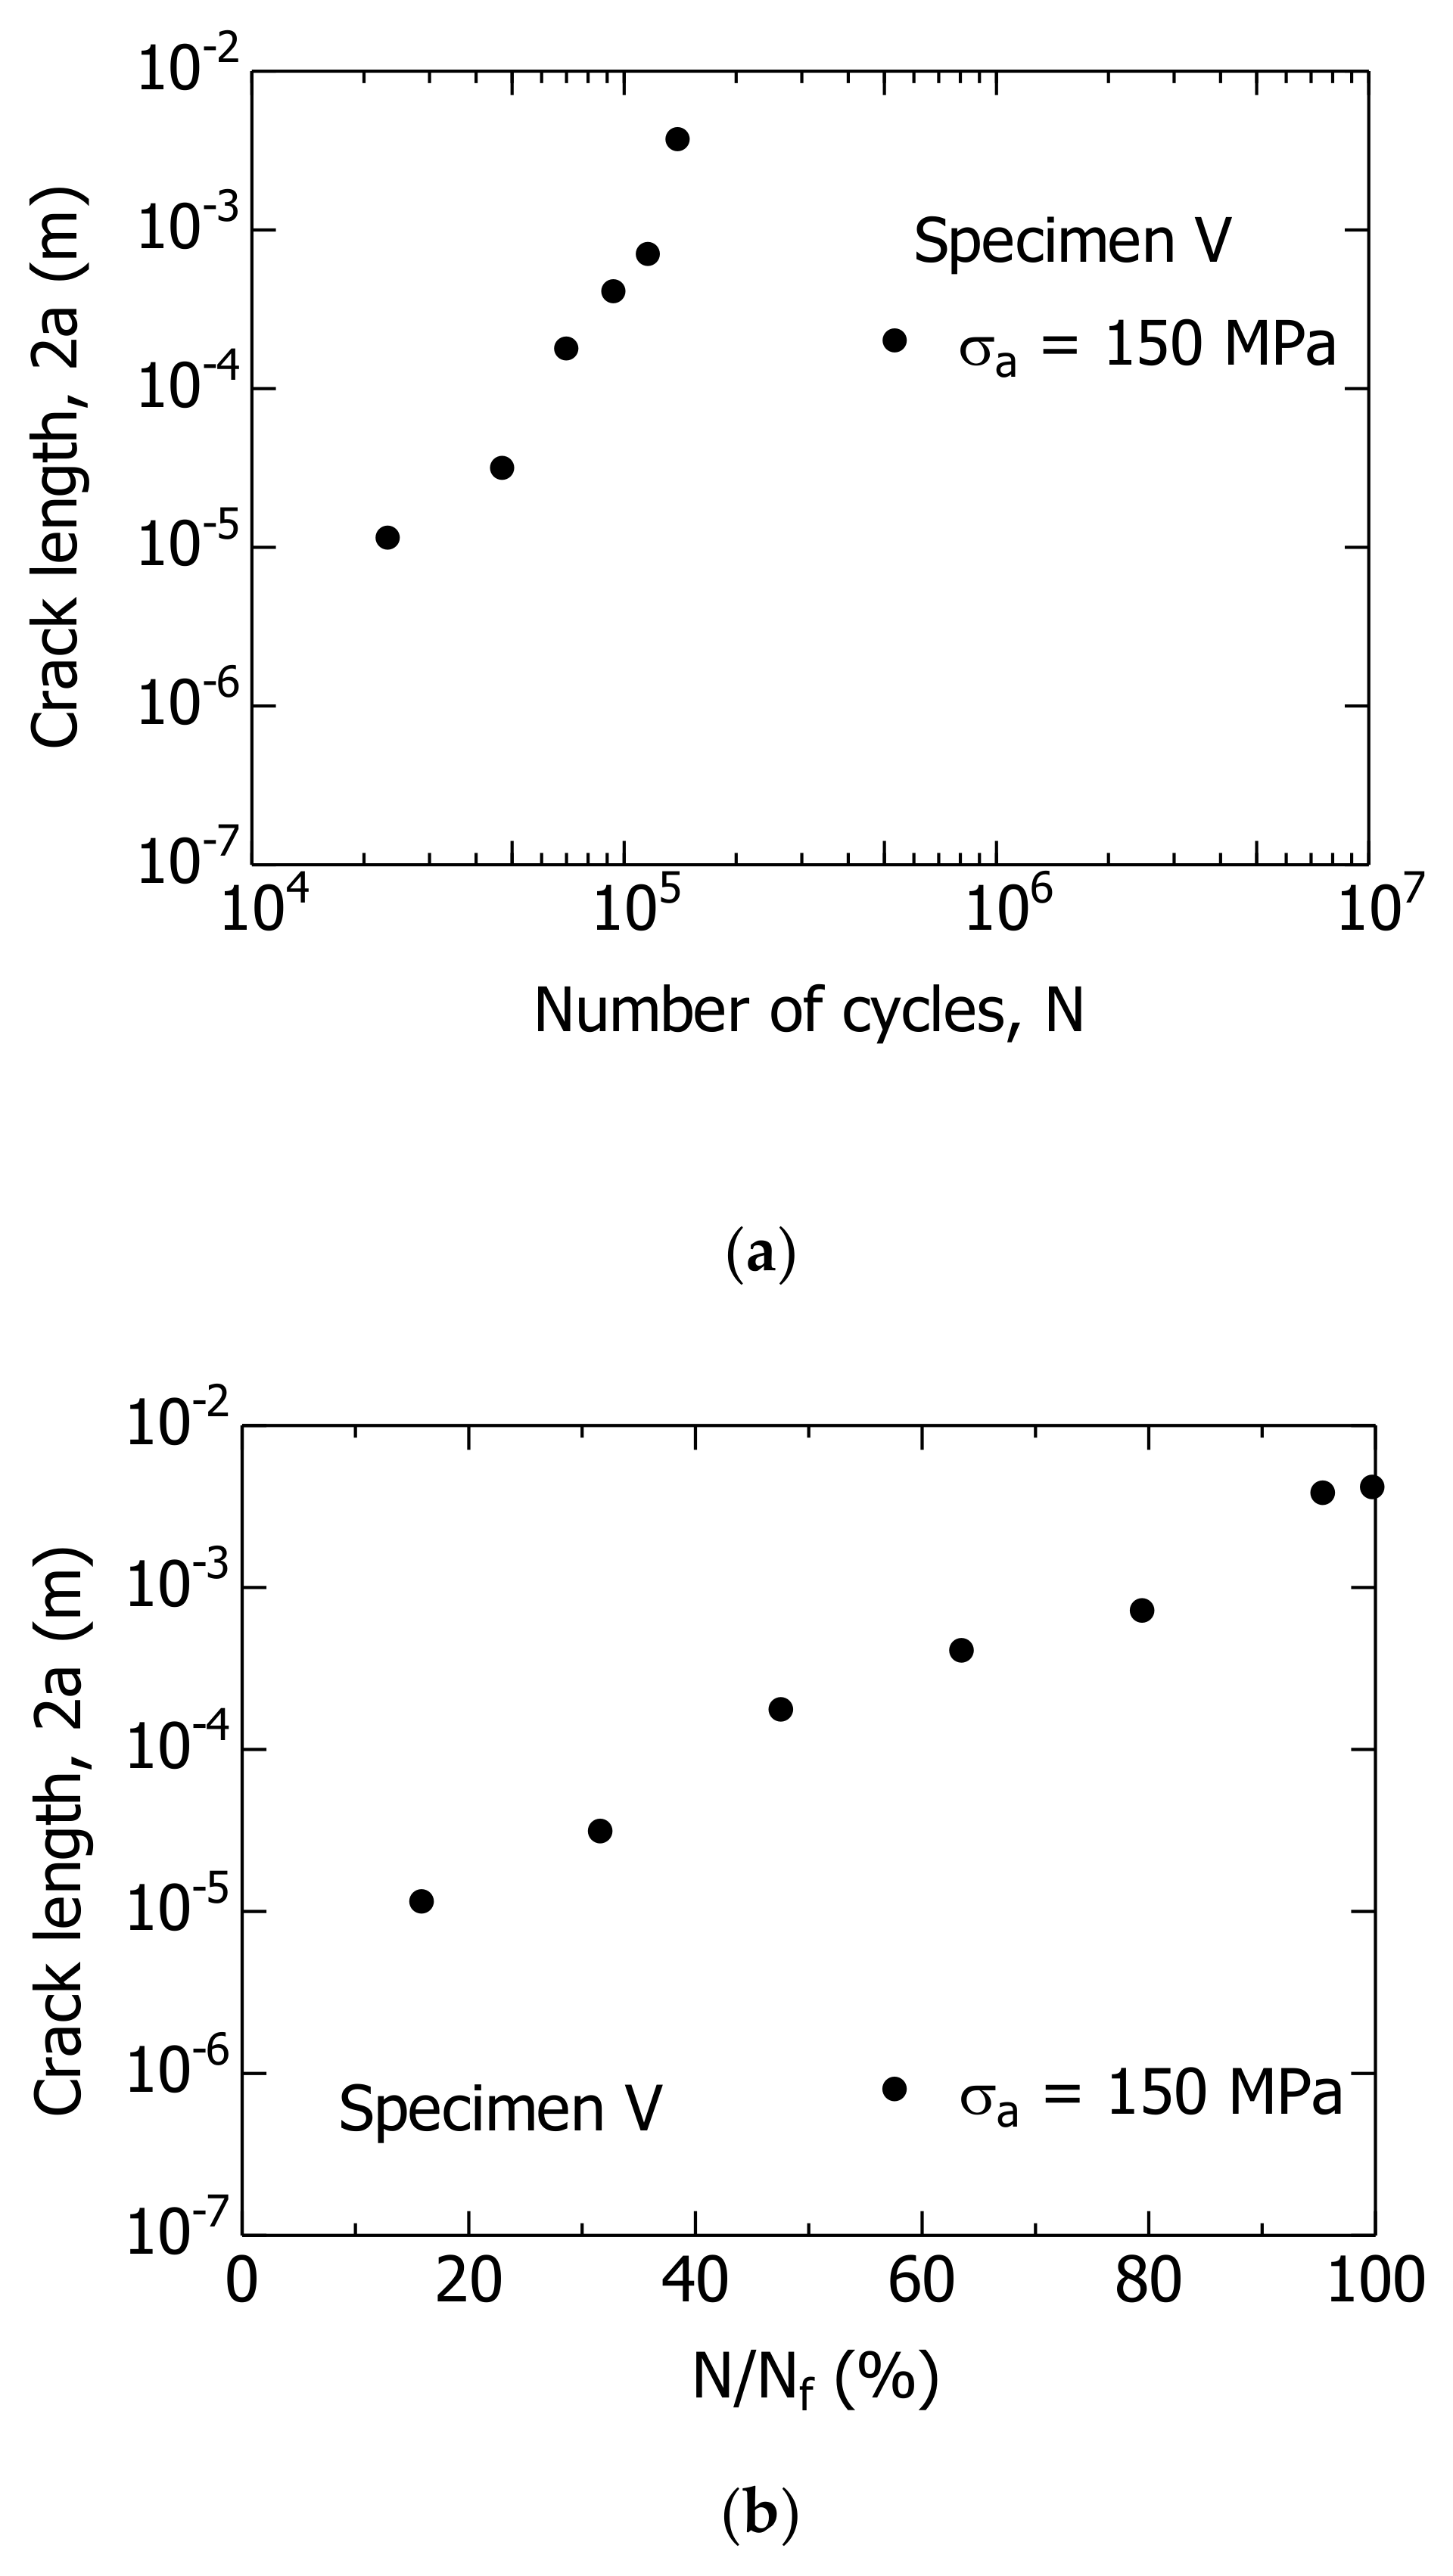
4.2.2. Specimen V
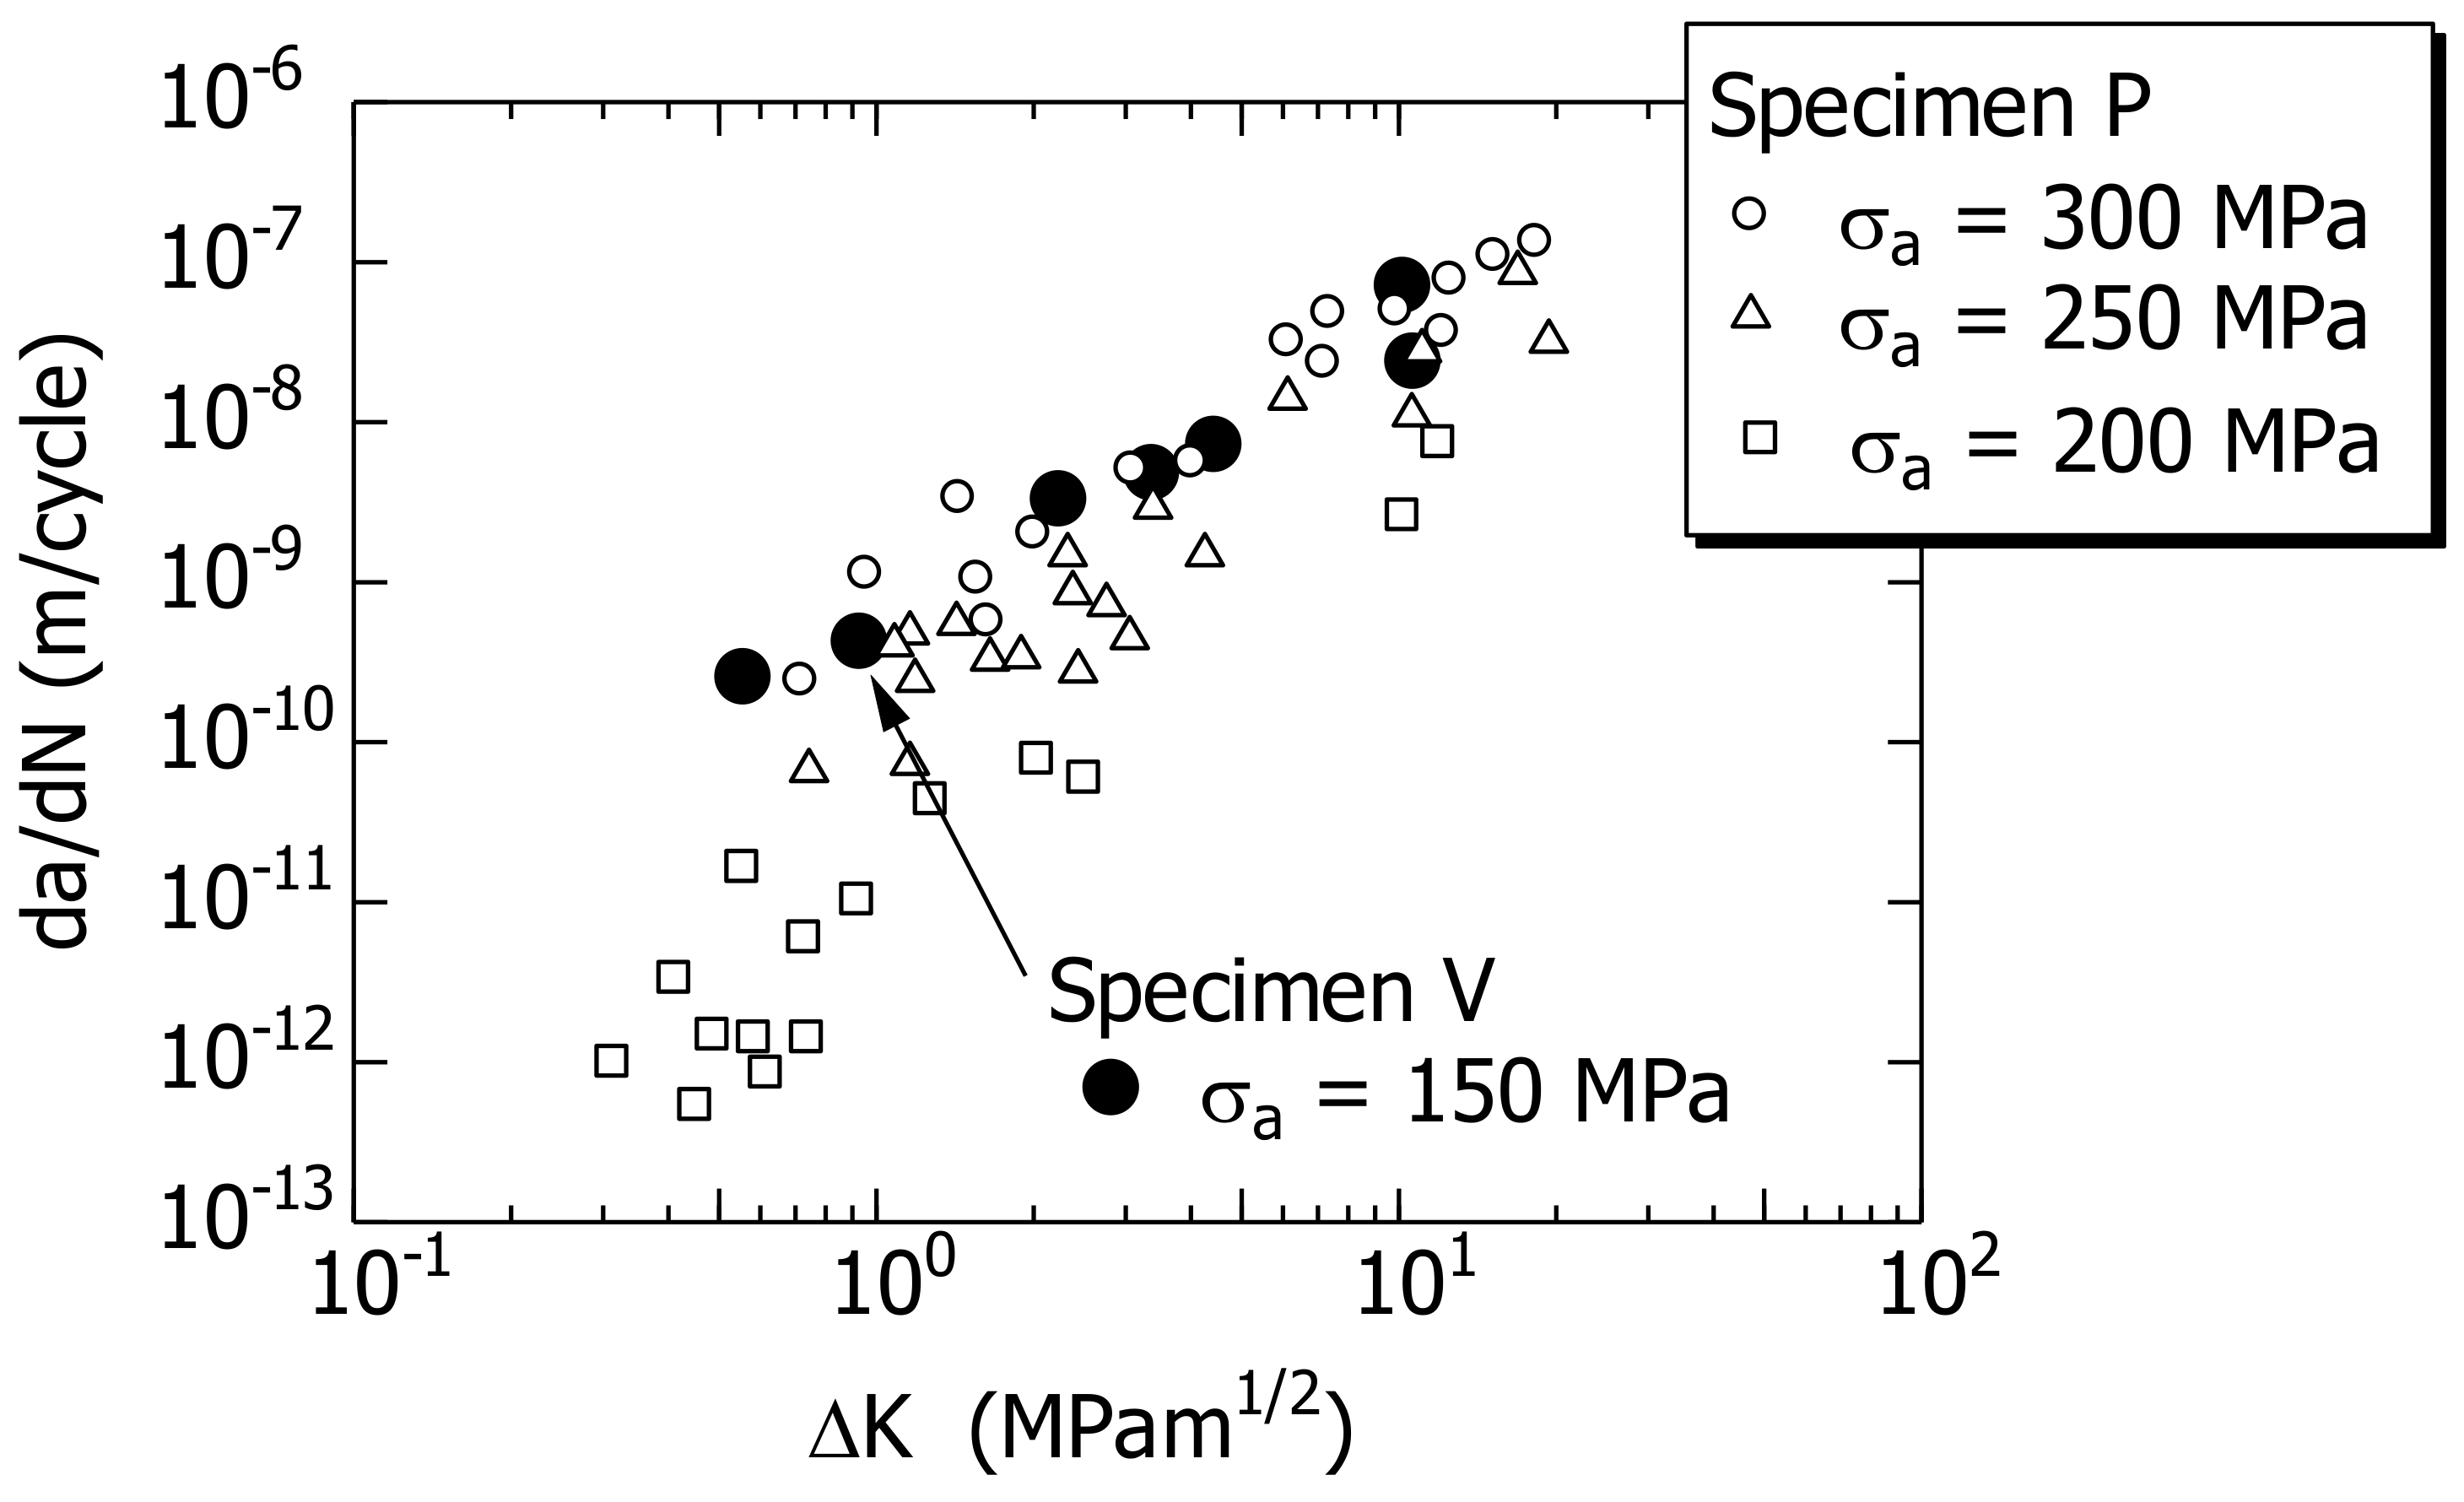
4.3. FCG Behavior of Short Surface Cracks
5. Discussion
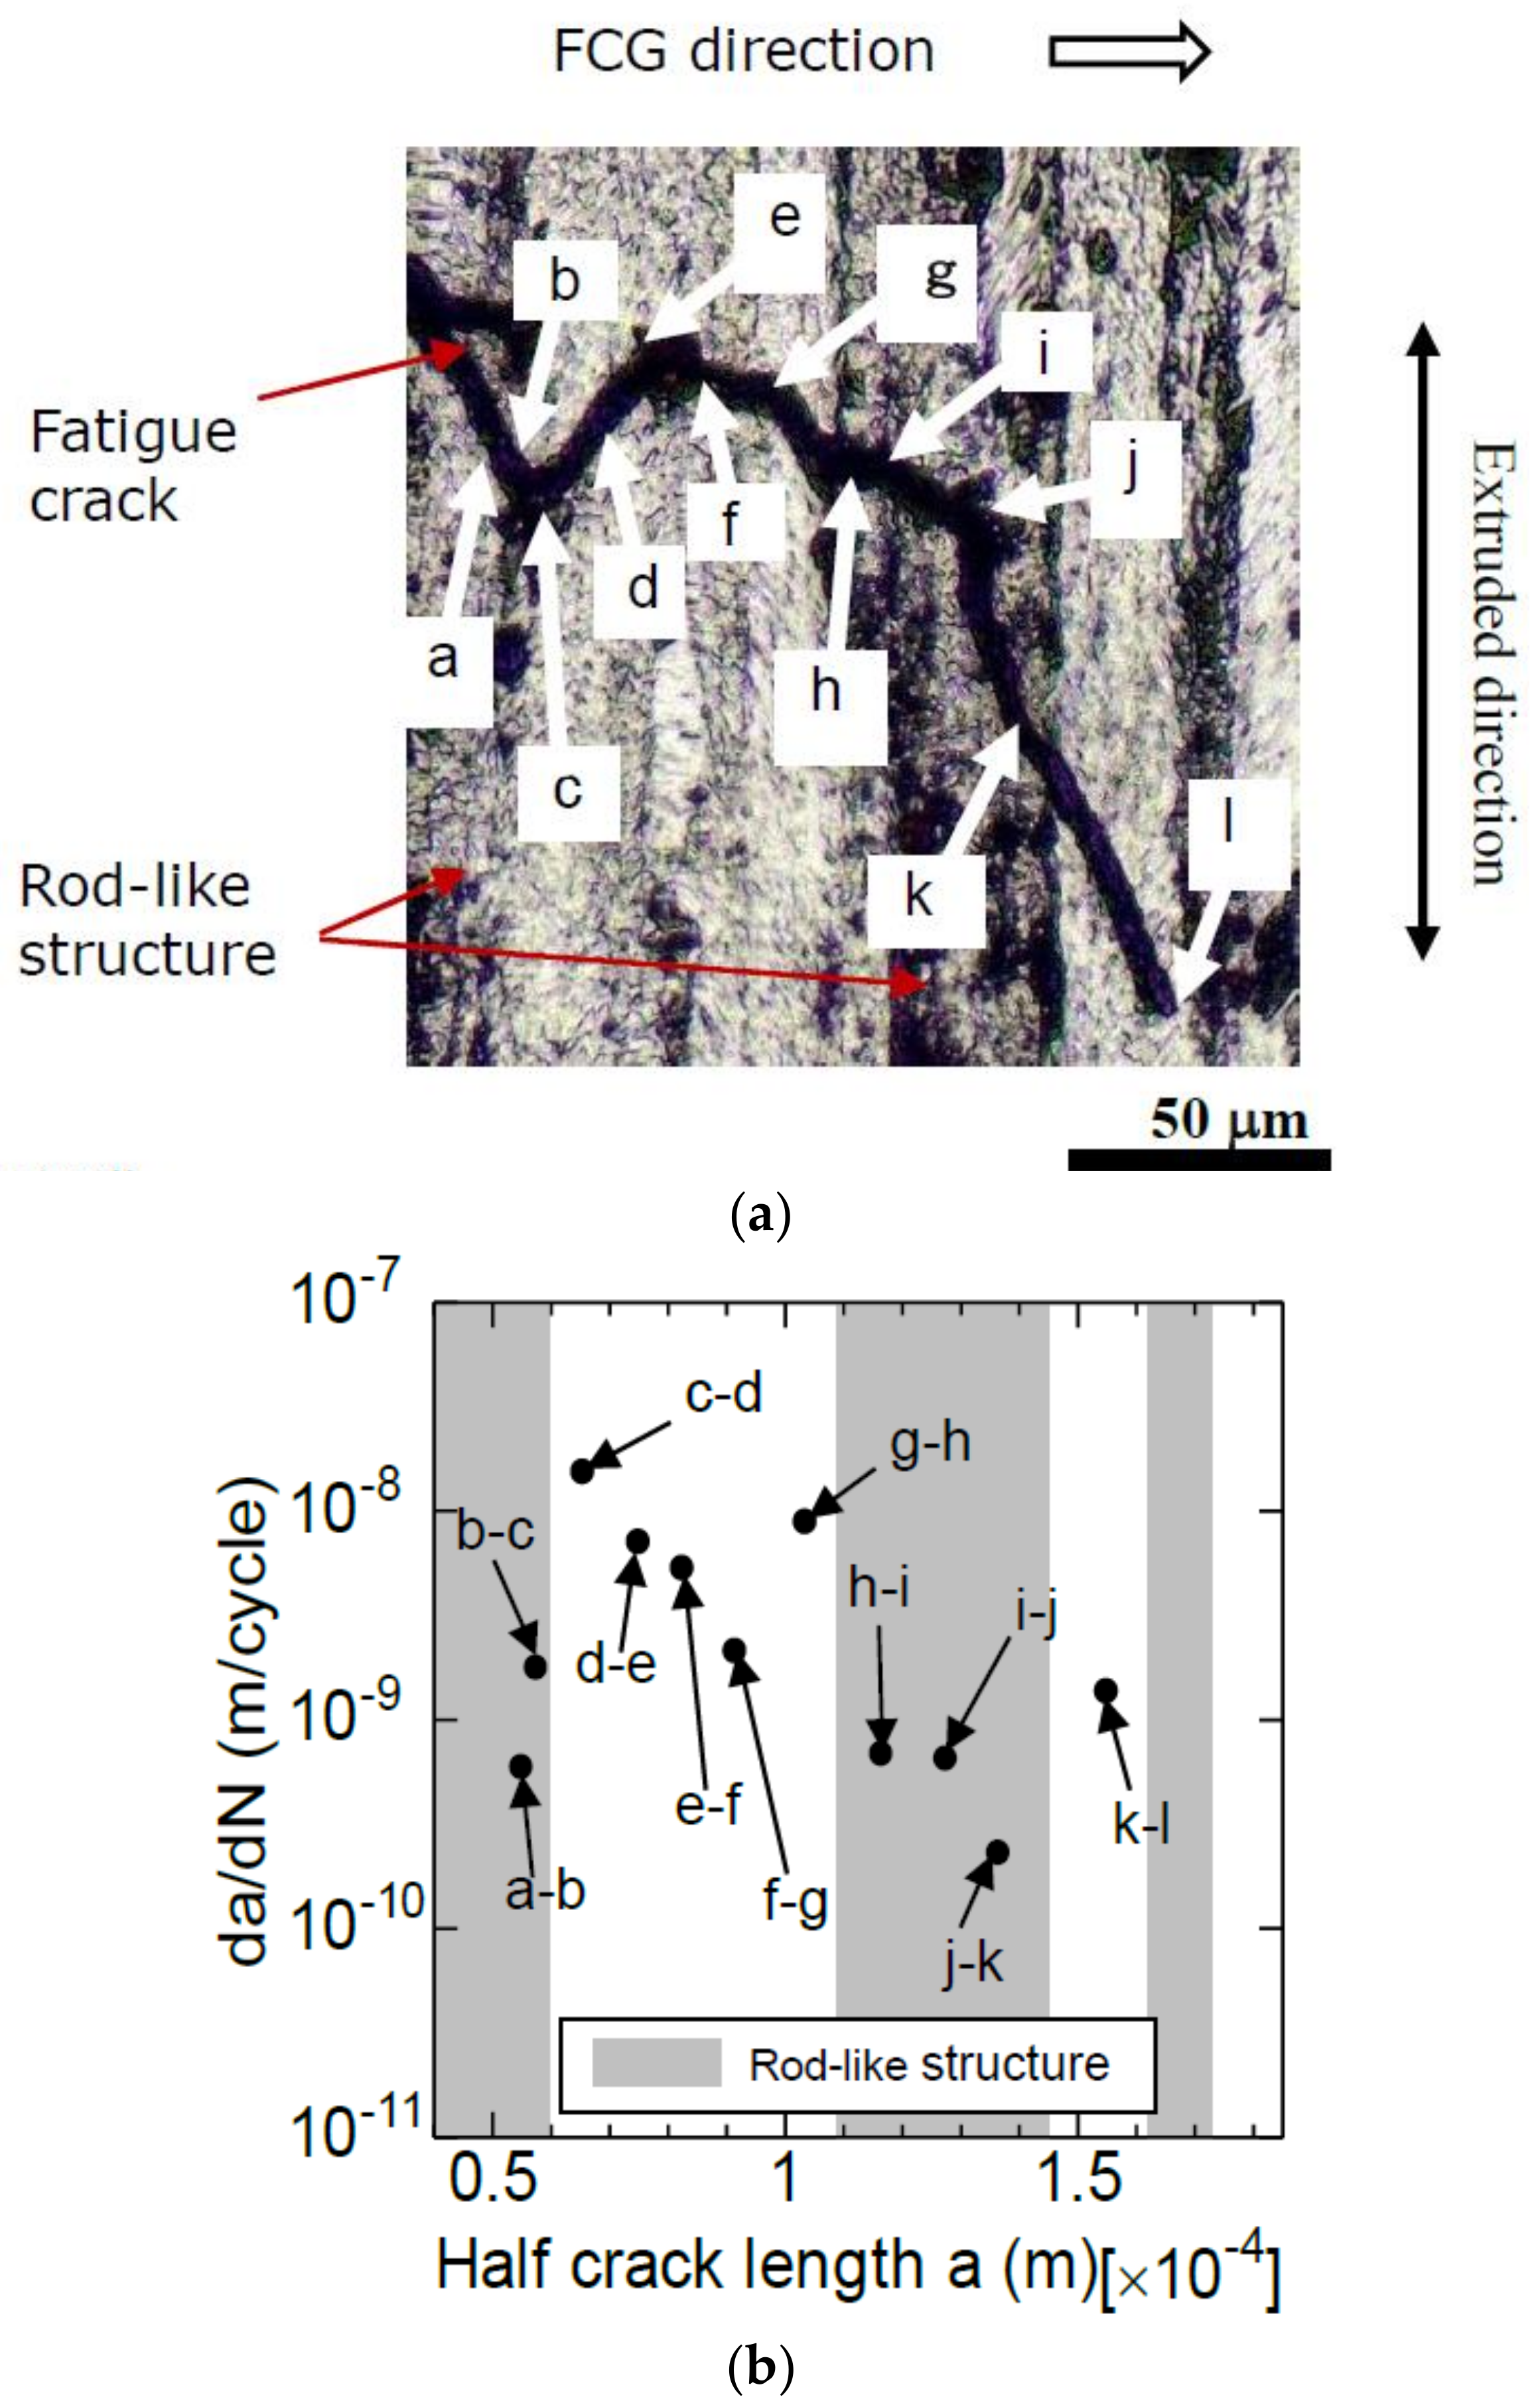
5.1. Effect of Rod-Like Structure on FCG Behavior
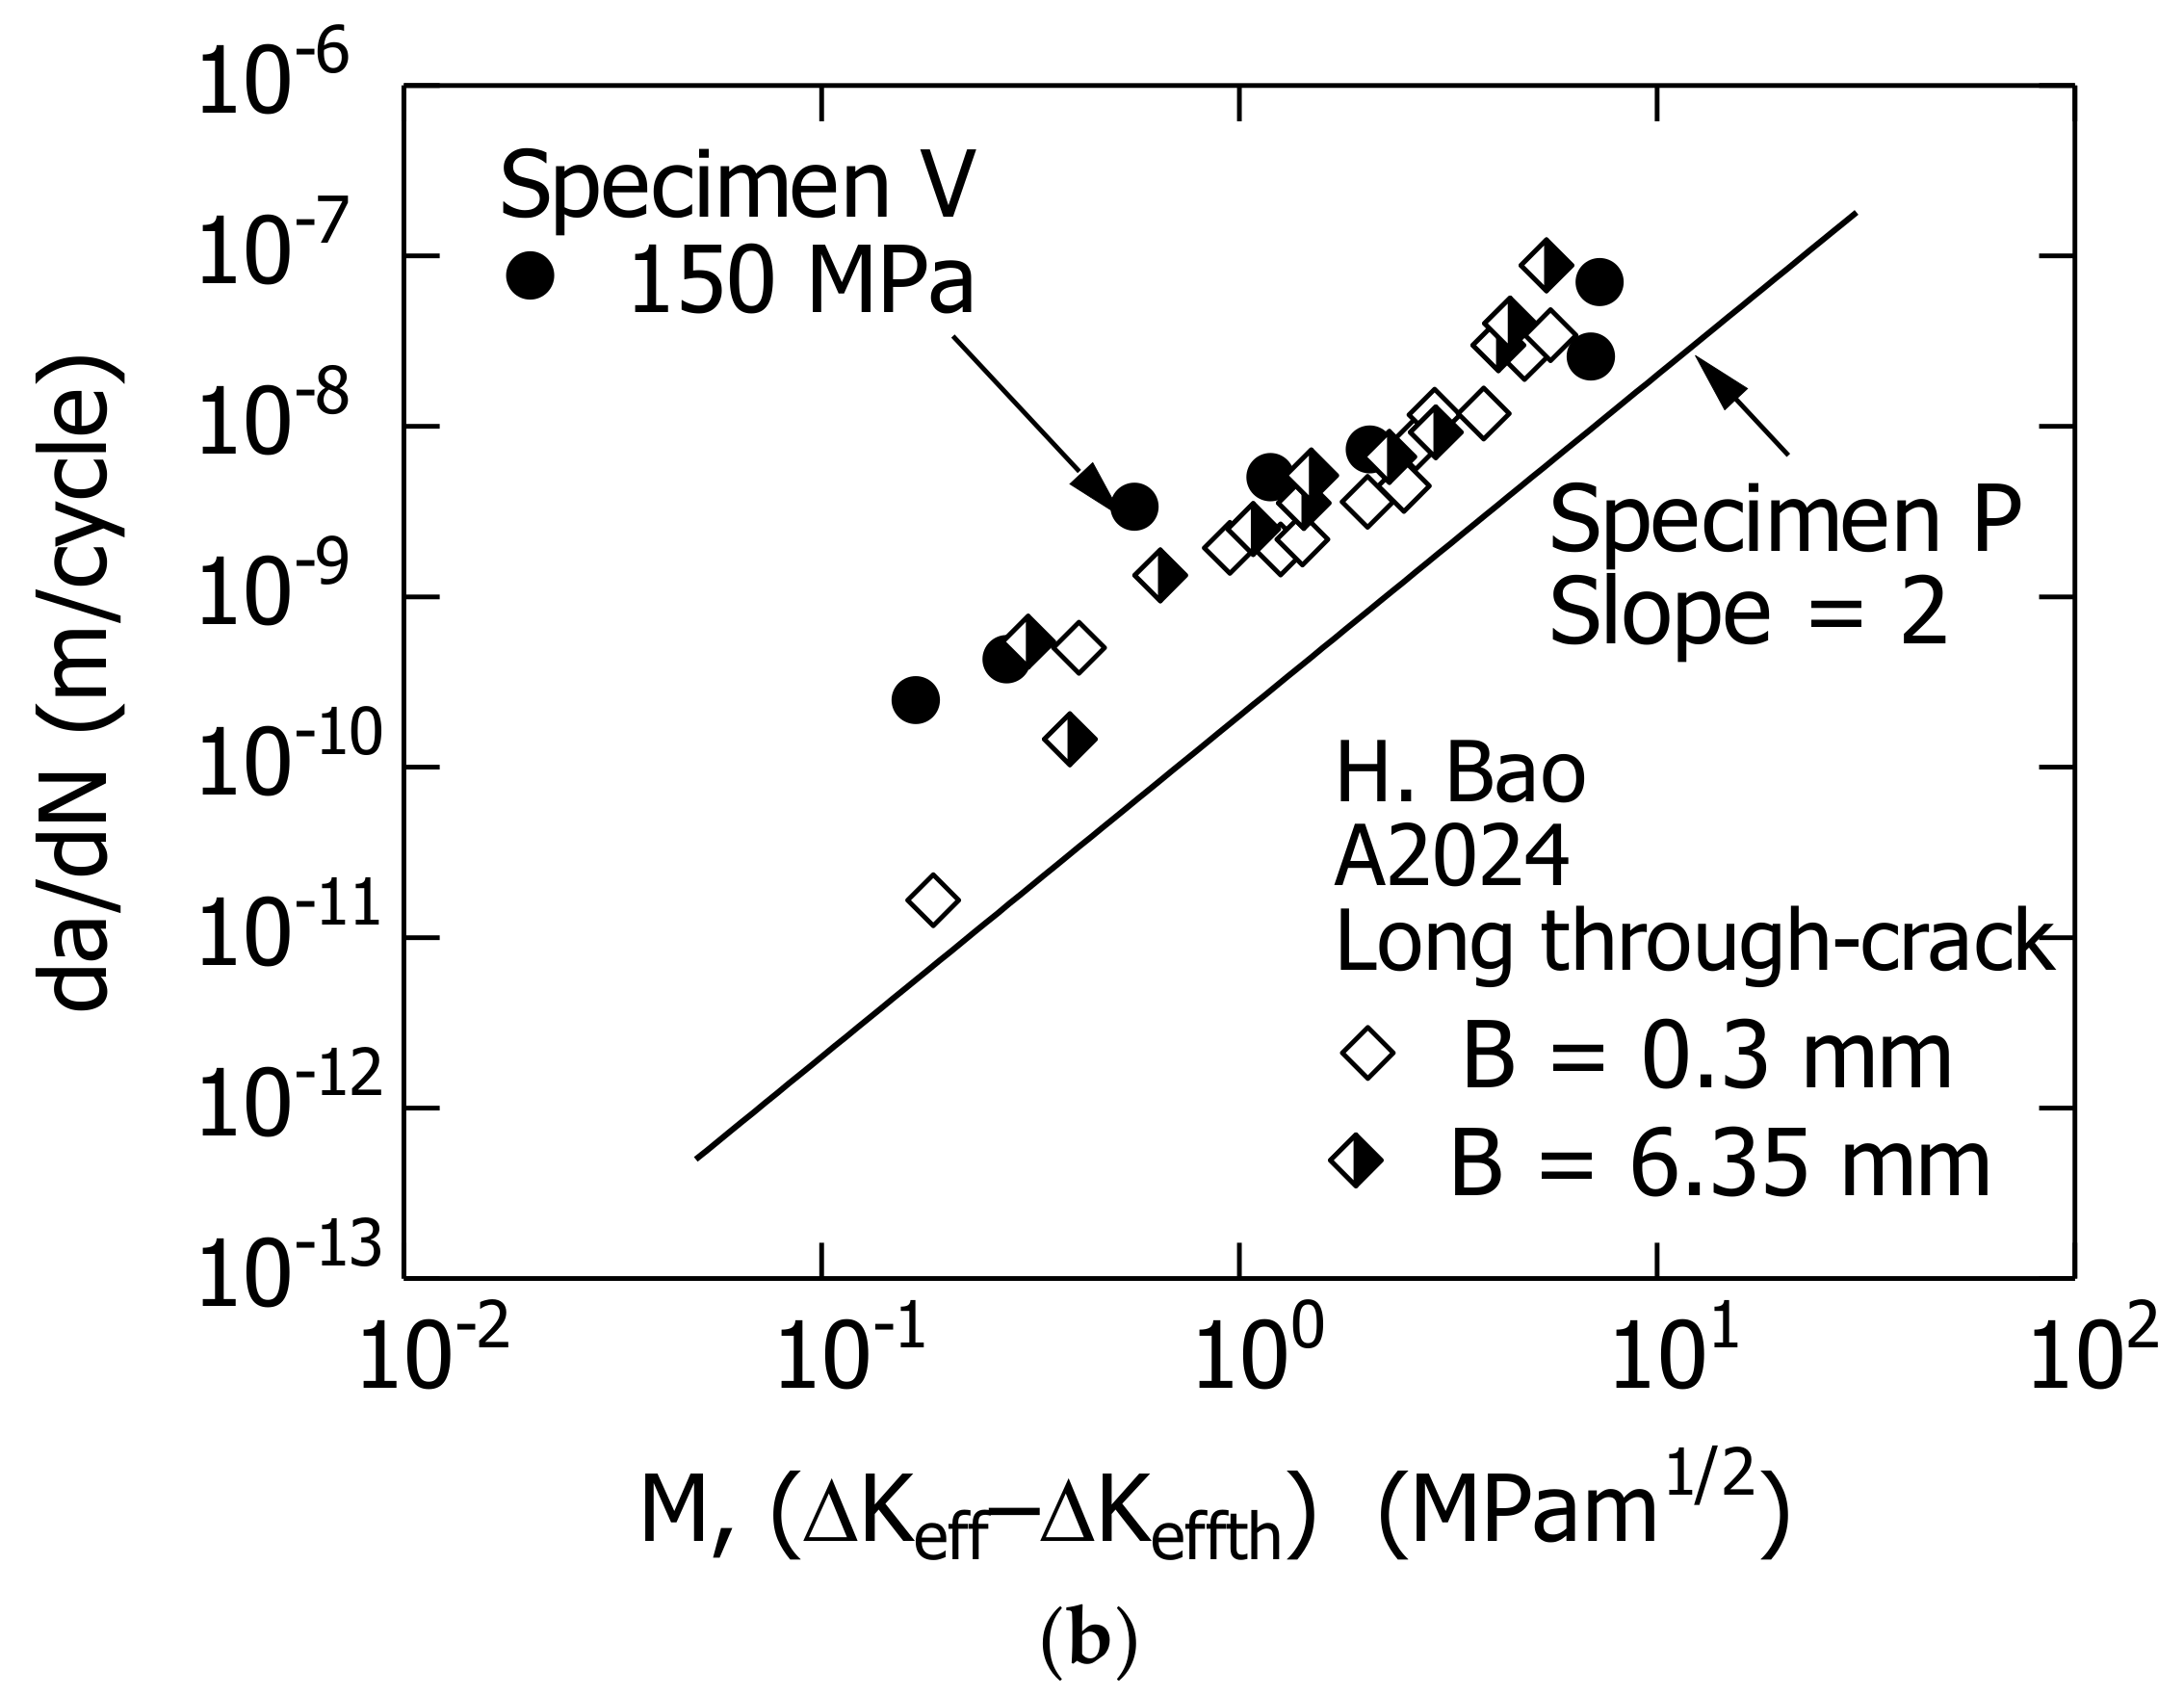
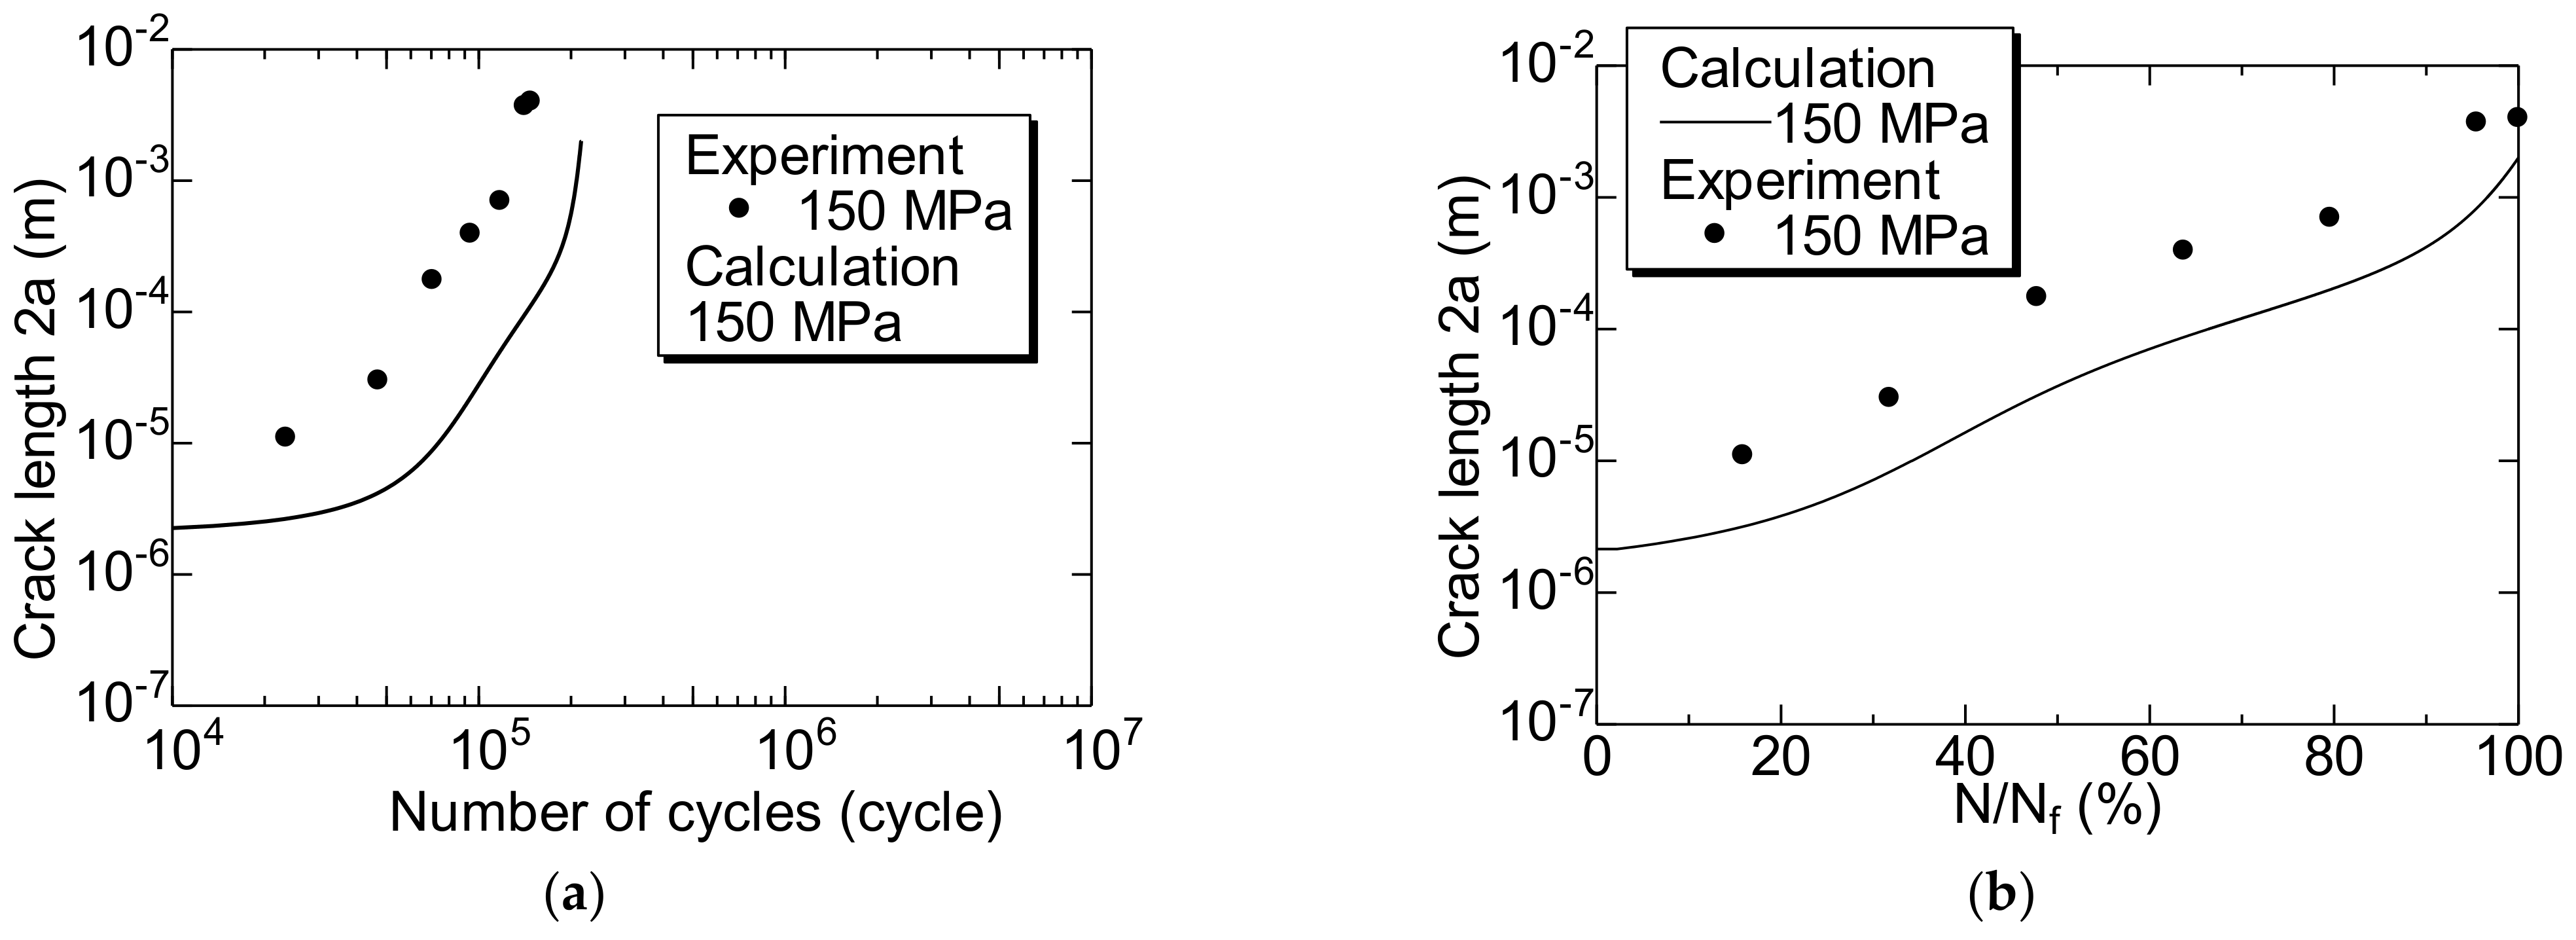
5.2. Estimating S–N Curves and FCG Behavior Using MLEFM Parameter M
6. Conclusions
- (1)
- In the extruded A2024-T3 alloy, a rod-like structure (Al–Cu–Mn-based intermetallic compound) was formed parallel to the extrusion direction;
- (2)
- The Nf of specimen P was longer than that of specimen V. The fatigue resistance of specimen P increased owing to the rod-like structure;
- (3)
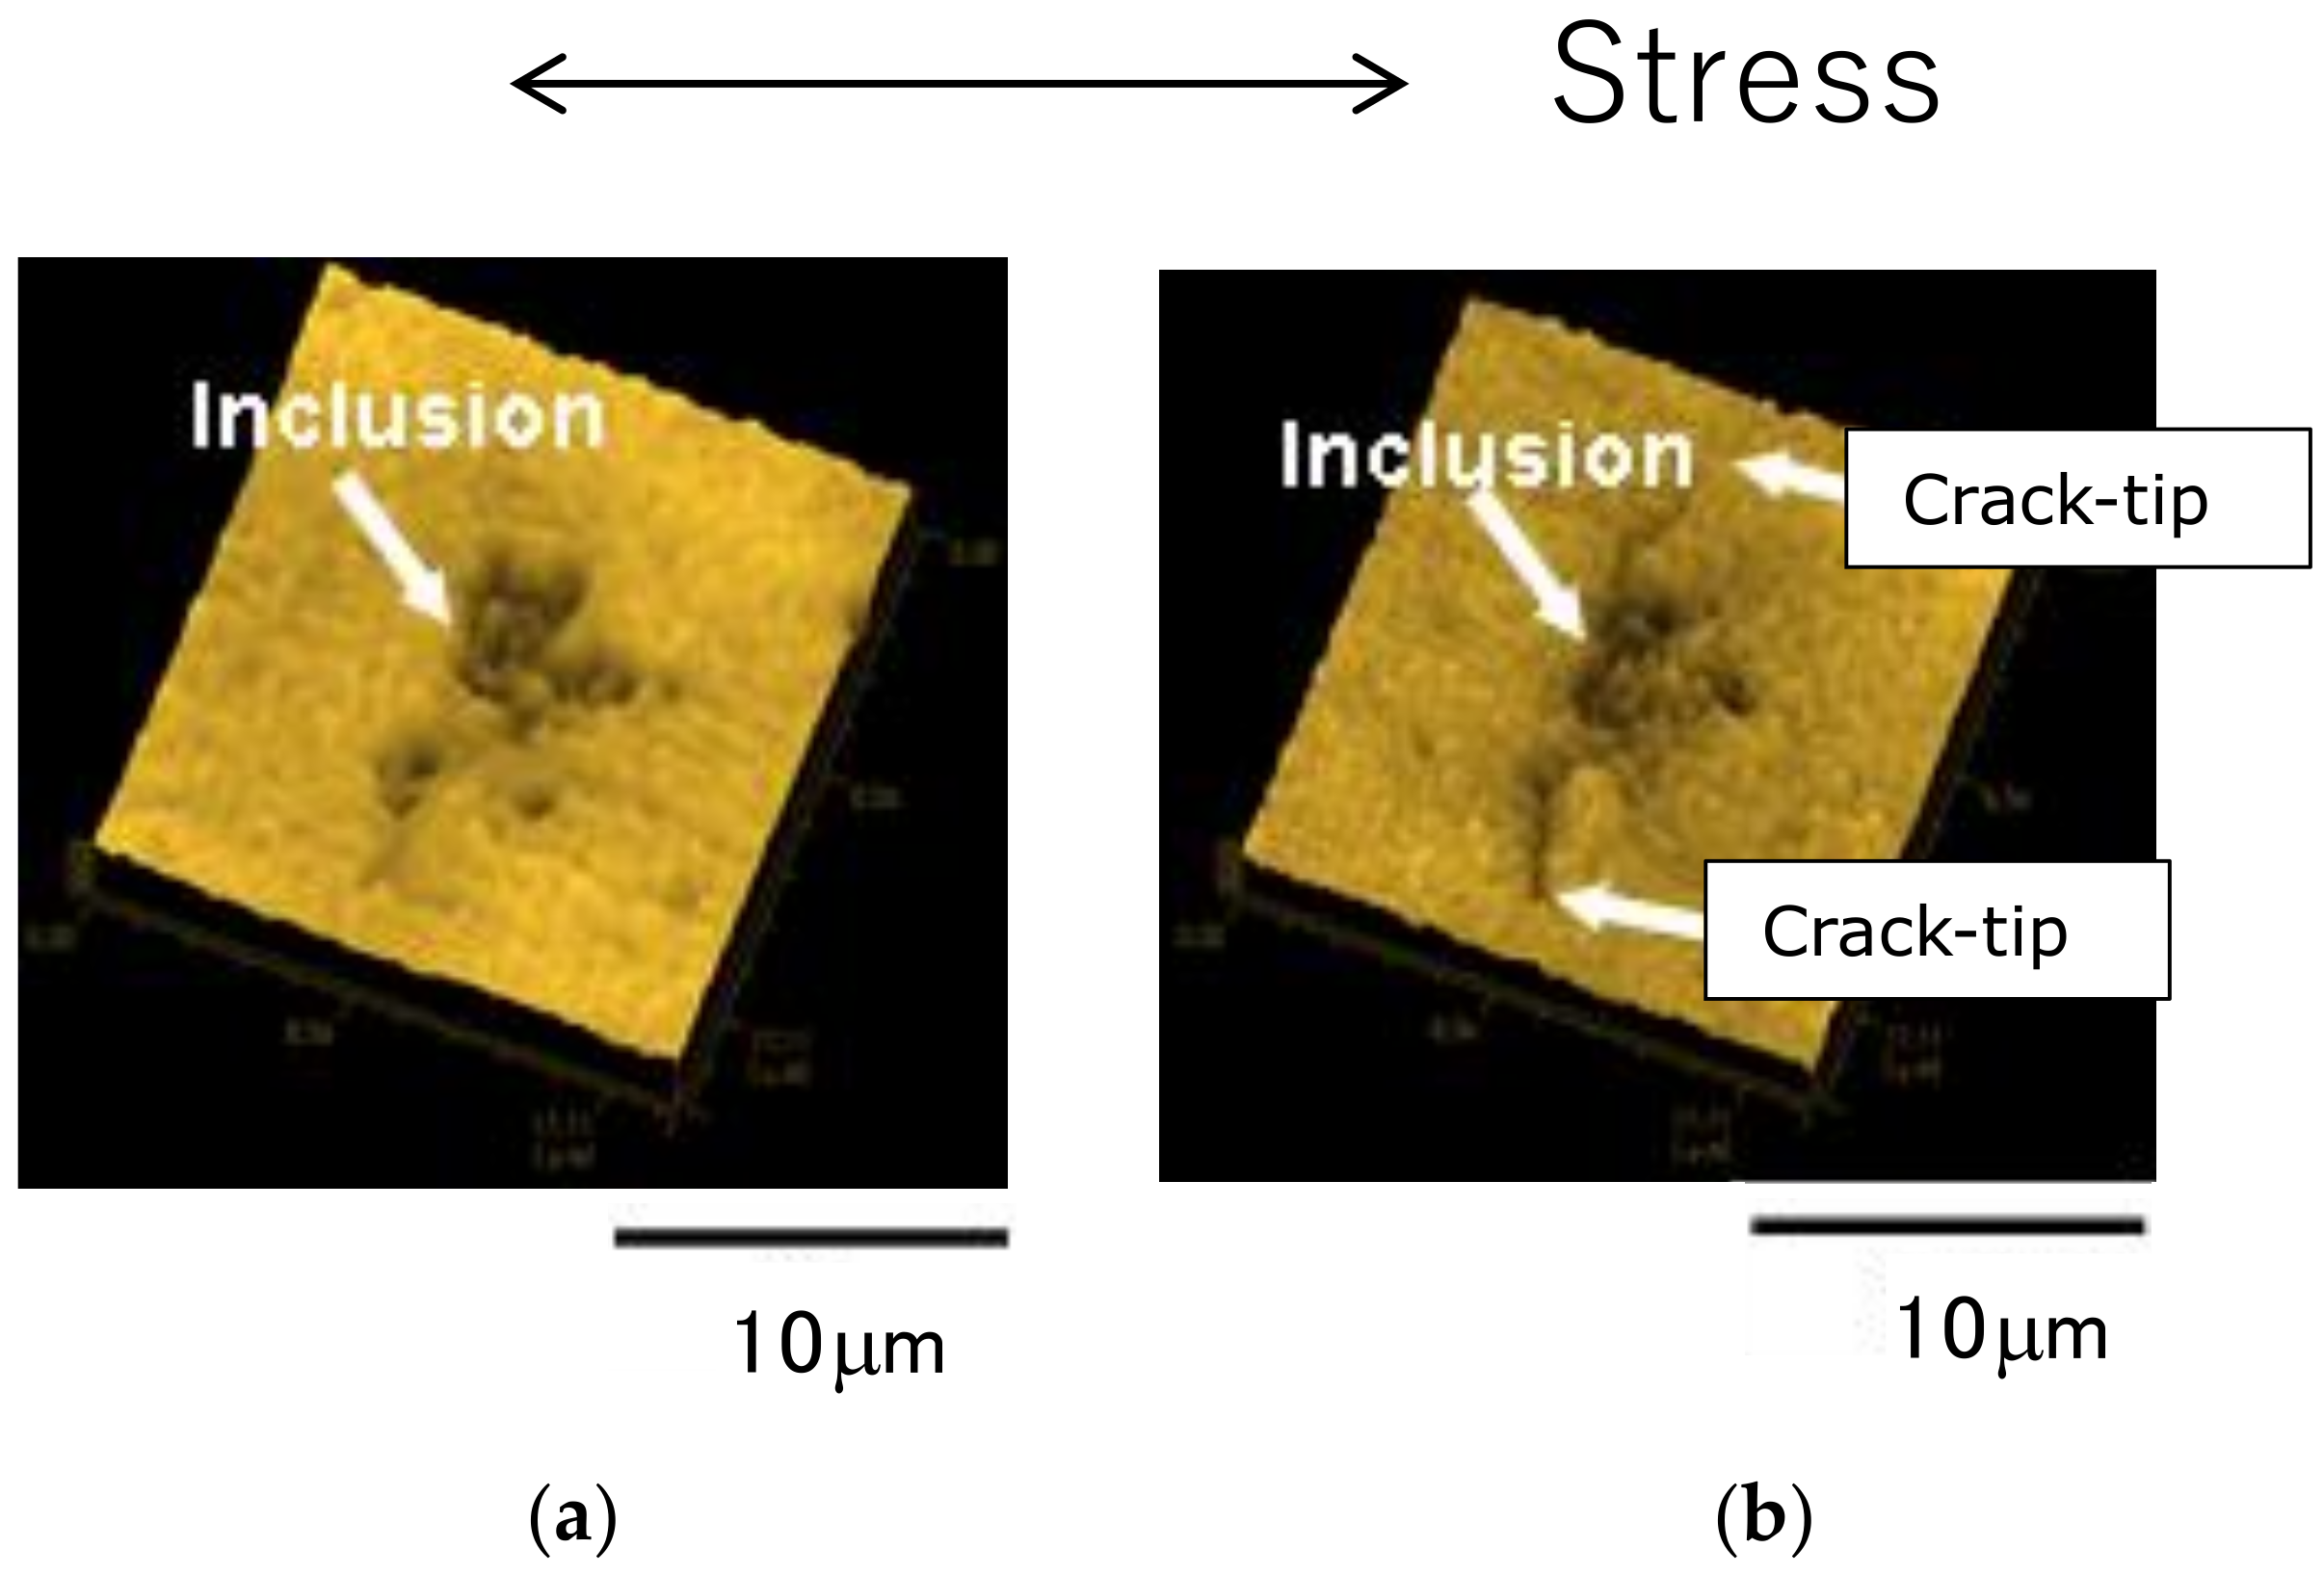
- In specimen P, fatigue cracks were initiated from the grain boundaries of the Al matrix. By contrast, in specimen V, cracks were initiated from a Cu–Mg-based intermetallic compound with a high hardness in the Al matrix;
- (4)
- Based on the FCG experiment under constant ΔK conditions, in specimen P, the FCG velocity decreased when the fatigue crack passed through the rod-like structure. This is because the hardness of the rod-like structure (HV182) was greater than that of the Al matrix (HV142); hence, the former was difficult to deform and adversely affected the FCG behavior.
- (5)
- Using the da/dN–M relationship, the S–N curve and FCG behavior could be calculated. The calculated results agreed well with the experimental results.
- (6)
- By combining the replica method with a scanning atomic force microscope, fatigue cracks with a length of several microns were continuously observed, and it was determined that fatigue cracks occurred in the early stages of the fatigue process.
Author Contributions
Funding
Institutional Review Board Statement
Informed Consent Statement
Data Availability Statement
Acknowledgments
Conflicts of Interest
References
- Stanzl-Tschegg, S.; Mayer, H.R.; Tschegg, E.K. The influence of air humidity on near-threshold fatigue crack growth of 2024-T3 aluminum alloy. Mater. Sci. Eng. 1991, A147, 45–54. [Google Scholar] [CrossRef]
- Van der Walde, K.; Brockenbrough, J.R.; Craig, B.A.; Hillberrya, B.M. Multiple fatigue crack growth in pre-corroded 2024-T3 aluminum. Int. J. Fatigue 2005, 27, 1509–1518. [Google Scholar] [CrossRef]
- Menan, F.; Henaff, G. Influence of frequency and exposure to a saline solution on the corrosion fatigue crack growth behavior of the aluminum alloy 2024. Int. J. Fatigue 2009, 31, 1684–1695. [Google Scholar] [CrossRef]
- Liljedahl, C.D.M.; Brouard, J.; Zanellato, O.; Lin, J.; Tan, M.L.; Ganguly, S.; Irving, P.E.; Fitzpatrick, M.E.; Zhang, X.; Edwards, L. Weld residual stress effects on fatigue crack growth behaviour of aluminium alloy 2024-T351. Int. J. Fatigue 2009, 31, 1081–1088. [Google Scholar] [CrossRef]
- Nejad, R.M.; Tohidi, M.; Darbandi, A.J.; Saberd, A.; Shariati, M. Experimental and numerical investigation of fatigue crack growth behavior and optimizing fatigue life of riveted joints in Al-alloy 2024 plates. Theor. Appl. Fract. Mech. 2020, 108, 102669. [Google Scholar] [CrossRef]
- Samaei, M.; Zehsaz, M.; Chakherlou, T.N. Experimental and numerical study of fatigue crack growth of aluminum alloy 2024-T3 single lap simple bolted and hybrid (adhesive/bolted) joints. Eng. Fail. Anal. 2016, 59, 253–268. [Google Scholar] [CrossRef]
- Halliday, M.D.; Cooper, C.; Poole, P.; Bowen, P. On predicting small fatigue crack growth and fatigue life from long crack data in 2024 aluminum alloy. Int. J. Fatigue 2003, 25, 709–718. [Google Scholar] [CrossRef]
- Zhang, J.Z.; Zhang, J.Z.; Meng, Z.X. Direct high resolution in situ SEM observations of very small fatigue crack growth in the ultra-fine grain aluminum alloy IN905. Scr. Mater. 2004, 50, 825–828. [Google Scholar] [CrossRef]
- Donnelly, E.; Nelson, D. A study of small crack growth in aluminum alloy 7075-T6. Int. J. Fatigue 2002, 24, 1175–1189. [Google Scholar] [CrossRef]
- Ishihara, S.; McEvily, A.J. Analysis of short fatigue crack growth in cast aluminum alloys. Int. J. Fatigue 2002, 24, 1169–1174. [Google Scholar] [CrossRef]
- McEvily, A.J.; Ishihara, S. On the History and Application of the Fatigue Crack Growth Relation, Macro and Microscopic Approach to Fracture; Nishida, S.-I., Ed.; Wessex Institute of Technology Press: Southampton, UK, 2003; pp. 91–116. [Google Scholar]
- McEvily, A.J.; Ishihara, S.; Makabe, C. The Influence of the Baseline R Value on the Extent of Retardation after an Overload, Mechanisms and Mechanics of Fracture: The John Knott Symposium; Soboyejo, W.O., Lewandowski, J.J., Ritchie, R.O., Eds.; The Minerals, Metals & Materials Society: Pittsburgh, PA, USA, 2003; pp. 37–42. [Google Scholar]
- Ishihara, S.; Yoshifuji, S.; McEvily, A.J.; Kawamoto, M.; Sawai, M.; Takata, M. Study on fatigue lifetimes and crack propagation behaviour of high-speed steel as a function of the R value. Fatigue Fract. Eng. Mater. Struct. 2010, 33, 294–302. [Google Scholar] [CrossRef]
- McEvily, A.J.; Ishihara, S. On the Dependence of the Rate of Fatigue Crack Growth on the Parameter. Int. J. Fatigue 2001, 23, 115–120. [Google Scholar] [CrossRef]
- Nan, Z.Y.; Ishihara, S.; Goshima, T.; Nakanishi, R. Scanning probe microscope observations of fatigue process in magnesium alloy AZ31 near the fatigue limit. Scr. Mater. 2004, 50, 429. [Google Scholar] [CrossRef]
- Nan, Z.Y.; Ishihara, S.; Goshima, T.; Nakanishi, R. Fatigue Behavior of AZ31 Extruded Magnesium Alloy in Laboratory Air. Trans. Jpn. Soc. Mech. Eng. Ser. A 2004, 70, 1146. [Google Scholar] [CrossRef] [Green Version]
- Ishihara, S.; Nan, Z.Y.; Goshima, T. Effect of microstructure on fatigue behavior of AZ31 magnesium alloy. Mater. Sci. Eng. A 2007, 468, 214–222. [Google Scholar] [CrossRef]
- Ishihara, S.; McEvily, A.J. On the early initiation of fatigue cracks in the high cycle regime. In Proceedings of the 12th International Conference on Fracture, Ottawa, ON, Canada, 12–17 July 2009. [Google Scholar]
- Murakami, Y. Stress Intensity Factors Handbook; Pergamon Press: Oxford, UK, 1987. [Google Scholar]
- Newman, J.C., Jr.; Phillips, E.P.; Swain, M.H. Fatigue-life prediction methodology using small-crack theory. Int. J. Fatigue 1999, 21, 109. [Google Scholar] [CrossRef] [Green Version]
- Ishihara, S.; Taneguchi, S.; Shibata, H.; Goshima, T.; Saiki, A. Anisotropy of the fatigue behavior of extruded and rolled magnesium alloys. Int. J. Fatigue 2013, 50, 94–100. [Google Scholar] [CrossRef]
- Nisitani, H.; Goto, M. A Small Crack Growth Law and Its Application to the Evaluation of Fatigue Life, the Behavior of Short Fatigue Cracks: The Behaviour of Short Fatigue Cracks; Miller, K.J., de los Rios, E.R., Eds.; Mechanical Engineering Publications: London, UK, 1986; pp. 461–478. [Google Scholar]
- Irwin, G.R. Fracture, Elasticity and Plasticity; Springer: Berlin/Heidelberg, Germany, 1958; pp. 551–590. [Google Scholar]
- Dugdale, D.S. Yielding of steel sheets containing slits. J. Mech. Phys. Solids 1960, 8, 100–104. [Google Scholar] [CrossRef]
- McEvily, A.J.; Minakawa, K. Crack closure and the growth of short and long fatigue cracks. Scr. Metall. 1984, 18, 71. [Google Scholar] [CrossRef]
- Ishihara, S.; Sugai, Y.; McEvily, A.J. On the distinction between plasticity- and roughness-induced fatigue crack closure. Metall. Mater. Trans. A 2012, 43A, 3086–3096. [Google Scholar] [CrossRef] [Green Version]
- Kitagawa, H.; Takahashi, S. Applicability of fracture mechanics to very small cracks or cracks in the early stage. In Proceedings of the Second International Conference on Mechanical Behavior of Materials, Boston, MA, USA, 16–20 August 1976; ASM: Boston, MA, USA, 1976; pp. 627–631. [Google Scholar]
- De Matos, P.F.P.; McEvily, A.J.; Moreira, P.M.G.P.; de Castro, P.M.S.T. Analysis of the effect of cold-working of rivet holes on the fatigue life of an aluminum alloy. Int. J. Fatigue 2007, 29, 575–586. [Google Scholar] [CrossRef]
- Bao, H. Fatigue Crack Growth under Plane Stress Conditions. Ph. D. Thesis, University of Connecticut, Storrs, CT, USA, 1994. [Google Scholar]


| Cu | Mg | Mn | Zn | Fe | Al |
|---|---|---|---|---|---|
| 4.25 | 1.32 | 0.56 | 0.25 | 0.12 | Bal. |
| Yield Strength | Tensile Strength | Elongation |
|---|---|---|
| 420 MPa | 570 MPa | 17.0% |
| Location | Phase A (Rod-Like Structure) | Phase B (Black Area within A Phase) | Phase C | Phase D (Inclusion within C Phase) |
|---|---|---|---|---|
| Identification of microscopic tissue | Al–Cu–Mn intermetallic compound | Local segregation of Al–Cu–Mn intermetallic compounds | Al matrix | Cu–Mg-based intermetallic compound |
| Hardness, HV | 182 | 207 | 142 | 213 |
| Specimen | ΔKopmax MPa | ΔKeffth MPa | k m−1 | re μm |
|---|---|---|---|---|
| P | 4 | 1.4 | 13,000 | 0.58 |
| V | 4 | 1.4 | 13,000 | 1.02 |
Publisher’s Note: MDPI stays neutral with regard to jurisdictional claims in published maps and institutional affiliations. |
© 2021 by the authors. Licensee MDPI, Basel, Switzerland. This article is an open access article distributed under the terms and conditions of the Creative Commons Attribution (CC BY) license (https://creativecommons.org/licenses/by/4.0/).
Share and Cite
Masuda, K.; Ishihara, S.; Shibata, H.; Oguma, N. Effect of Rod-like Structure on Fatigue Life, Short Surface Crack Initiation and Growth Characteristics of Extruded Aluminum Alloy A2024 (Analysis via Modified Linear Elastic Fracture Mechanics). Materials 2021, 14, 7538. https://doi.org/10.3390/ma14247538
Masuda K, Ishihara S, Shibata H, Oguma N. Effect of Rod-like Structure on Fatigue Life, Short Surface Crack Initiation and Growth Characteristics of Extruded Aluminum Alloy A2024 (Analysis via Modified Linear Elastic Fracture Mechanics). Materials. 2021; 14(24):7538. https://doi.org/10.3390/ma14247538
Chicago/Turabian StyleMasuda, Kenichi, Sotomi Ishihara, Hiroshi Shibata, and Noriyasu Oguma. 2021. "Effect of Rod-like Structure on Fatigue Life, Short Surface Crack Initiation and Growth Characteristics of Extruded Aluminum Alloy A2024 (Analysis via Modified Linear Elastic Fracture Mechanics)" Materials 14, no. 24: 7538. https://doi.org/10.3390/ma14247538