Article

Predicting Workability of a Low-Cost Powder Metallurgical Ti–5Al–2Fe–3Mo Alloy Using Constitutive Modeling and Processing Map

1
State Key Laboratory of Powder Metallurgy, Central South University, Changsha 410083, China
2
Hunan Provincial Key Laboratory of High Efficiency and Precision Machining of Difficult-to-Cut Material, Hunan University of Science and Technology, Xiangtan 411201, China
3
Hunan Provincial Key Laboratory of Advanced Materials for New Energy Storage and Conversion, Hunan University of Science and Technology, Xiangtan 411201, China
4
Hunan Gold-Sky Aluminum Industry High-Tech Co., Ltd., Luxi 416100, China
*
Authors to whom correspondence should be addressed.
Materials 2021, 14(4), 836; https://doi.org/10.3390/ma14040836
Submission received: 2 January 2021 / Revised: 31 January 2021 / Accepted: 3 February 2021 / Published: 9 February 2021

Abstract

:
A low-cost titanium alloy (Ti–5Al–2Fe–3Mo wt.%) was designed and fabricated by blended elemental powder metallurgy (BEPM) process. The high-temperature deformation behavior of the powder metallurgical Ti–5Al–2Fe–3Mo wt.% (PM-TiAlFeMo) alloy was investigated by hot compression tests at temperatures ranging from 700 to 1000 °C and strain rates ranging from 0.001 to 10 s−1. The flow curves were employed to develop the Arrhenius-type constitutive model in consideration of effects of deformation temperature, strain rate, and flow stress. The value of activation energy (Q) was determined as 413.25 kJ/mol. In order to describe the workability and predict the optimum hot processing parameters of the PM-TiAlFeMo alloy, the processing map has been established based on the true stress–true strain curves and power dissipation efficiency map. Moreover, microstructure observations match well with the analyses about deformation mechanisms, revealing that dynamic recovery and dynamic recrystallization are dominant softening mechanisms at relatively high temperatures. However, the kinking and breaking of microstructure prefer to occur at relatively low temperatures.

1. Introduction

Titanium alloys are important structural materials applied widely in aerospace, biomedical, and energy fields because of the characteristics of lightweight, excellent mechanical performance, good corrosion resistance, and biocompatibility [1,2]. However, the high cost of raw materials and complex manufacturing processes limit the further application of titanium alloys [3,4,5,6,7].
It is known that the powder metallurgy (PM) technique is relatively cost-effective because of its near-net-shape characteristic. Cost reduction in raw materials in titanium alloys mainly focuses on using cheaper substitution for those conventional expensive BCC phase stabilizers (i.e., V, Ta, and Nb). Some researchers consider Fe a promising substitution for V in α + β titanium alloys due to its relatively low cost and strong BCC phase stablishing ability [8,9]. It was reported that the addition of Fe could also help to enhance the sinterability of PM titanium components, thanks to its high diffusion rate in Ti [10,11,12]. On the other hand, the local segregation of Fe particles and the formation of a brittle TiFe phase could be prevented in the solid sintering process [13]. Recent literature [14] reported that higher yield strength (~1067 MPa) could be obtained by adding Fe in PM titanium alloy. Mo is also a cost-effective (compared with V) BCC phase stabilizer in titanium alloys [15]. Some references [16,17] indicated Mo could help obtain fine-grain microstructure during the sintering process and increase the strength, ductility, and creep resistance of titanium alloys. Furthermore, a relatively desirable combination of strength and ductility could be obtained in PM Ti–Mo binary alloys when the amount of Mo was 3 wt.% [11]. As a type of low-cost titanium alloys, TiAlFeMo series alloys have recently attracted more attention. Previous studies [18,19] of our research group have reported that 30% of the cost could be reduced in this series of alloys (compared with T–6Al–4V alloy). Furthermore, relatively high tensile strength (~1422 MPa) could be obtained in the hot rolled + annealed PM Ti–5Al–2Fe–3Mo alloy, and the elongation is measured as 8.5%, which showed a better coordination of strength and ductility [20].
However, previous works mainly focused on the improvement of mechanical properties of the TiAlFeMo series alloys. Systematic studies about the prediction of workability of this alloy have never been performed. Since the good plastic deformation ability of metal materials is the basis of their wide industrial applications, it is indispensable to reveal the deformation mechanism and optimize the thermomechanical parameter/process of this alloy during hot deformation.
In this work, a low-cost Ti–5Al–2Fe–3Mo (wt.%) alloy was fabricated using the blended elemental powder metallurgy (BEPM) technique. The flow behavior of the PM-TiAlFeMo alloy was investigated by hot compression tests using different thermomechanical processing parameters. A constitutive equation is a significant method that has been widely used to model the flow behaviors of metallic materials, helping to predict appropriate processing parameters using processing maps. Therefore, the Arrhenius-type constitutive model was established, and the processing map was also drawn to assess and predict the workability of the PM-TiAlFeMo alloy. The effects of the hot deformation parameters (testing temperature, deformation strain rate) on the flow behavior of the PM-TiAlFeMo alloy were discussed in detail, and microstructure observations were also performed before/after hot compression tests.

2. Materials and Methods

Raw alloy (Ti–5Al–2Fe–3Mo wt.%) was fabricated using pure-elemental powders (the details of these pure-elemental powders are listed in Table 1). The powders were blended in the correspondent wt.% and mixed in a double-cone powder mixer for 6 h (under argon as the protective gas). Then the uniformly blended powders were molded in a cold isostatic pressing system (180 MPa), followed by sintering at the temperature of 1300 °C for 2 h (in a vacuum of 10−3 Pa). The phase transformation temperature (Tβ) of this alloy is about 915 °C, calculated by the simulation software (Thermo-calc) [20] and determined by metallographic examination.
As shown in Figure 1, the microstructure of the as-sintered PM-TiAlFeMo alloy mainly consists of α phase (dark region in Figure 1a) and β phase (bright region in Figure 1a), and the α + β phase shows a nearly lamellar structure. The chemical composition of the as-sintered alloy measured by EDS (FEI, Hillsboro, OR, USA) (Figure 1b) was in agreement with the composition design. Some small pores can also be observed (marked by arrows in Figure 1a,c), the porosity of the as-sintered PM-TiAlFeMo alloy is about 9.8 % (measured by volume density and specific gravity). According to the EBSD result shown in Figure 1c, no distinct preferred orientation could be observed in the as-sintered alloy.
Cylindrical specimens of 8 mm × 12 mm (diameter × height) were cut from the as-sintered PM-TiAlFeMo alloy bar using a wire electrical discharge machine, then sanded by SiC abrasive sandpaper up to 2000 grit and polished with OPS–H2O2 diluent. Hot compression tests were performed on Gleeble-3500 thermal simulation testing system (DSI, New York, NY, USA). In order to homogenize the heat distribution, the specimens were heated at a rate of 3 °C/min and preserved for 3 min after target temperature. In addition, a thin graphite paper was placed between the specimen and holder to reduce the friction force. Water-quenching was performed for all the specimens to reserve the post-deformed microstructure after hot compression tests. The samples of microstructure observation were cut along the compressive axis (Marked as CA in figures). Microstructure observations of backscatter scanning in E-beam (BSE) and electron backscattered diffraction (EBSD) for the as-sintered and post-deformed PM-TiAlFeMo alloy were performed by FEI Helios NanoLab G3 UC Dual-Beam field emission scanning electron microscope (FEI, Hillsboro, OR, USA).

3. Results and Discussion
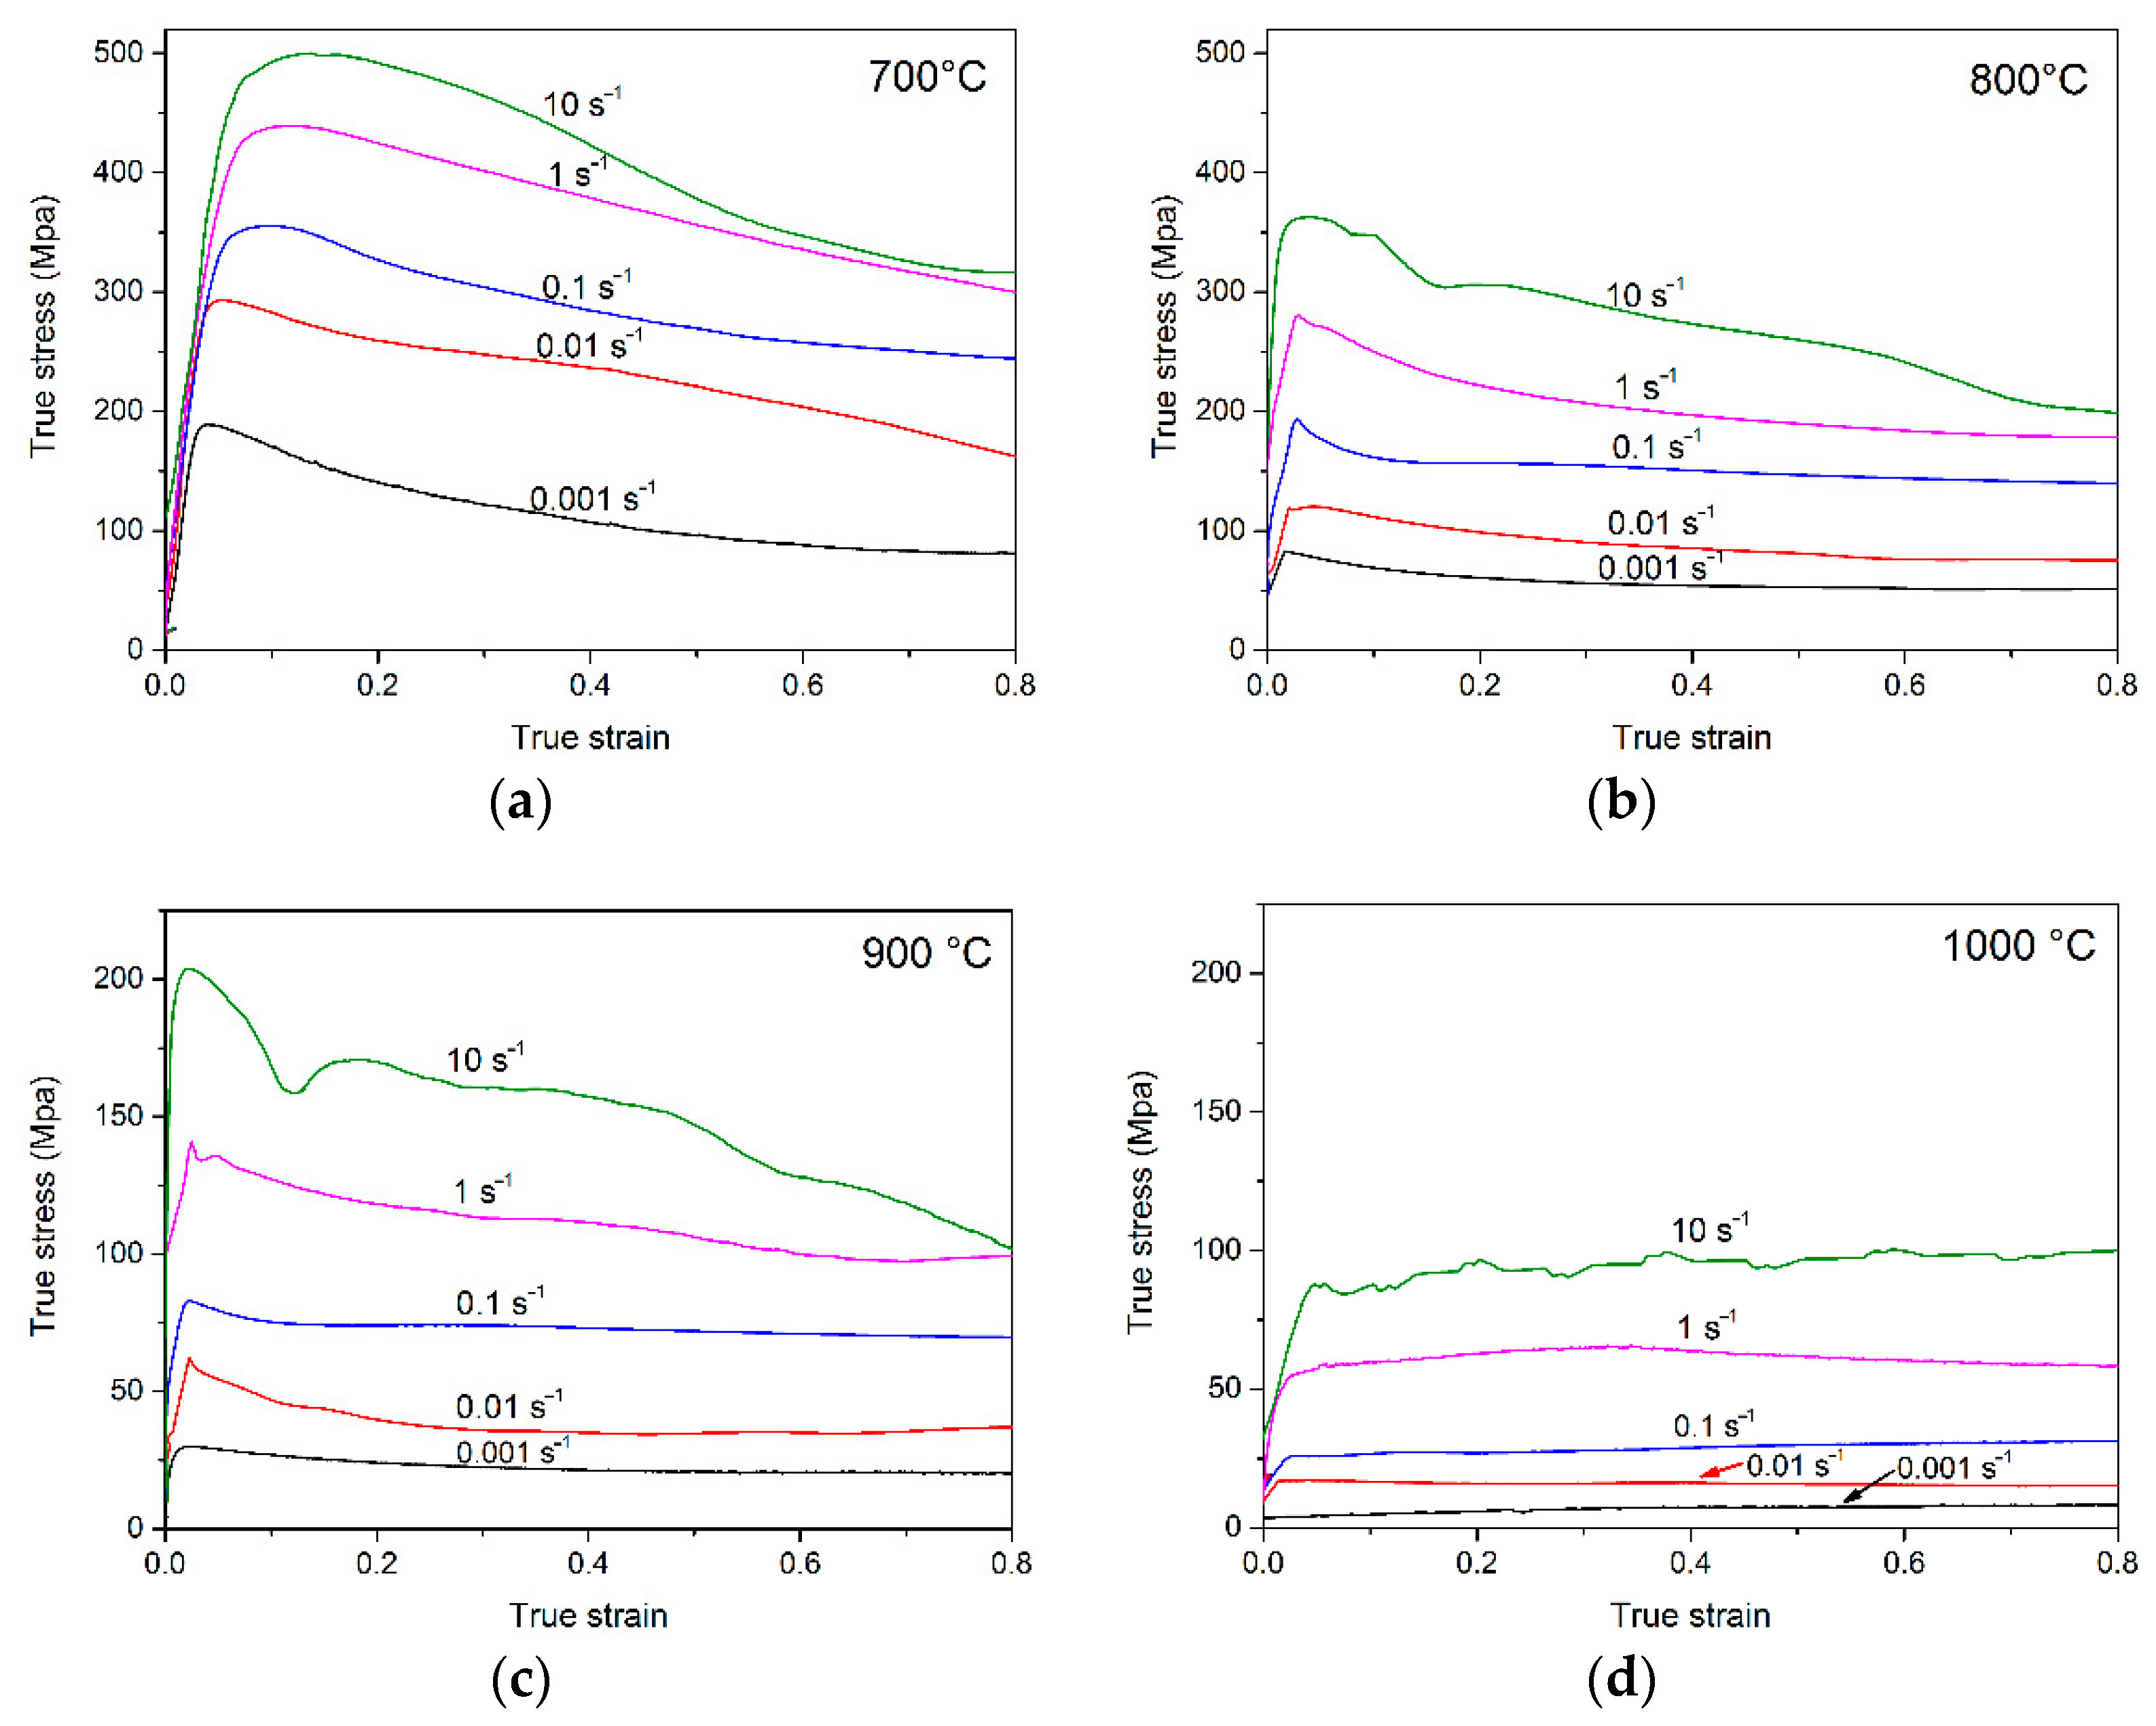
3.1. Flow Curves

3.1.1. Flow Stress Characterization

The true stress–true strain curves at various deformation conditions are presented in Figure 2. Similar regularity could be observed at the temperatures below Tβ (Figure 2a–c): the flow stress rises rapidly as the true strain increases before an obvious peak at the initial stage of hot compression (as the true strain ≤0.15). After the peak value, true stress exhibits a gradual falling with the increase in true strain, which is usually considered as a typical flow softening during compression. The rapid increase in flow stress may result from the formation of a huge number of dislocations at the beginning of the deformation, followed by the proliferation and tangles of dislocation [21]. The decrease in flow stress may be due to the dynamic recovery, dynamic recrystallization and dynamic globularization, which often occur as the true strain exceeds 0.15 and leads to the flow softening at the later stage of compression tests [22]. When the testing temperature increases beyond Tβ (Figure 2d), no obvious peak value could be observed in the flow curves, the value of true stress tends to be steady. A similar result was obtained in the Ti600 alloy [23] and Ti-6242S alloy [24], which was considered as a typical steady-state flow. It was reported that the mechanisms of plastic deformation mainly depend on the crystal structure and the stacking fault energy [25]. In general, the steady-state flow is associated with dynamic recovery [23]. Hajari et al. [24] proposed that dynamic recovery always prefers to occur in materials of relatively high stacking fault energy. For titanium alloys, the β phase has higher stacking fault energy and diffusivity than the α phase, dynamic recovery is easier to occur when the testing temperature exceeds Tβ, which benefits the occurrence of steady-state flow at relatively high testing temperature. In addition, the deformation is mainly controlled by dislocation slipping for BCC Ti. When the compression tests were performed above the Tβ, the dislocations accumulated during deformation will be rearranged by the slipping and climbing of dislocations. Then, a dynamic balance could be reached between the work hardening and softening, where dynamic recovery and recrystallization often occur under this condition [26,27].
As shown in Figure 2, the peak values of true stress at a constant strain rate are negatively correlated with the testing temperatures. The average kinetic energy of atoms and strengthened function of thermal activation will increase when the deformation temperature rises, followed by the decrease in critical slip shear stress. Hence, the dislocation movement occurs more easily, leading to the decrease in peak value when the temperature rises. Meanwhile, the dislocation density will reduce, the structure softening of BCC Ti and grain coarsening will aggravate as the temperature increases, which also serves to weaken the work hardening during hot deformation.
Except for the testing temperature, the strain rate of hot compression is another factor of the flow behavior. The peak value increases as the strain rate increases from 0.001 s−1 to 10 s−1 at a given temperature. The main reason is the rapid work hardening resulting from the formation of a huge number of dislocations in the alloy when the strain rate increases. As shown in Figure 2b–d, a steady-state flow could be observed at relatively low strain rates, which means dynamic recovery/dynamic recrystallization may occur at these conditions. Distinct oscillation could be observed at the strain rate of 10 s−1, and a similar phenomenon was observed in relevant work [23,28]. The main reason may be the occurrence of flow localization between the α/β phase at relatively high strain rates. It is worth noting that the flow curve at the strain rate of 10 s−1 in Figure 2d shows a rise with the strain increases, which means the work hardening process may still exist at a relatively high temperature and strain rate.
Notably, the peak values of flow stress of the PM-TiAlFeMo alloy in the present work are 20–50 MPa lower than similar titanium alloys [29,30,31] (e.g., Ti60, IMI834, Ti-1100) at the same deformation conditions. Moreover, the difference between these alloys shows more distinct at high strain rates. It may be interpreted as the addition of an Mo element, which could bring in a modified balance of α and β phase in titanium alloys [32], also brings in the favorable workability of PM-TiAlFeMo alloy.

3.1.2. Flow Softening Behavior

According to Figure 2, it is worth noting that the flow softening degree varies with strain rate and testing temperature. The flow softening degree [21] could be described by Equation (1):
∆σ = σm − σs
where the σm is the peak value of the flow stress, σs is a relatively steady-state value of stress in the later stage of deformation. According to Figure 2, the relatively steady-state value could be observed near the true strain of 0.65. Hence, the flow softening degree could be obtained by calculating the value of (σm − σ0.65). Figure 3 shows the flow softening degree calculated from the flow curves at various deformation conditions. The flow softening at low temperatures (700, 800 °C) shows more distinct than high temperature (900 °C). Furthermore, the flow softening degree increases with the increase in the strain rate. In general, the dynamic recrystallization and flow localization are the dominant reasons for the flow softening phenomenon during hot deformation in dual-phase titanium alloys [33]. Relevant studies [24,34,35] also suggested that flow softening is mainly due to the rotation of the α phase to the direction perpendicular to the compression axis (CA) in lamellar titanium alloys. Platelet bending/kinking and dynamic globularization are also correlative reasons for flow softening [23,34]. Those factors could be determined in the microstructure observation section.

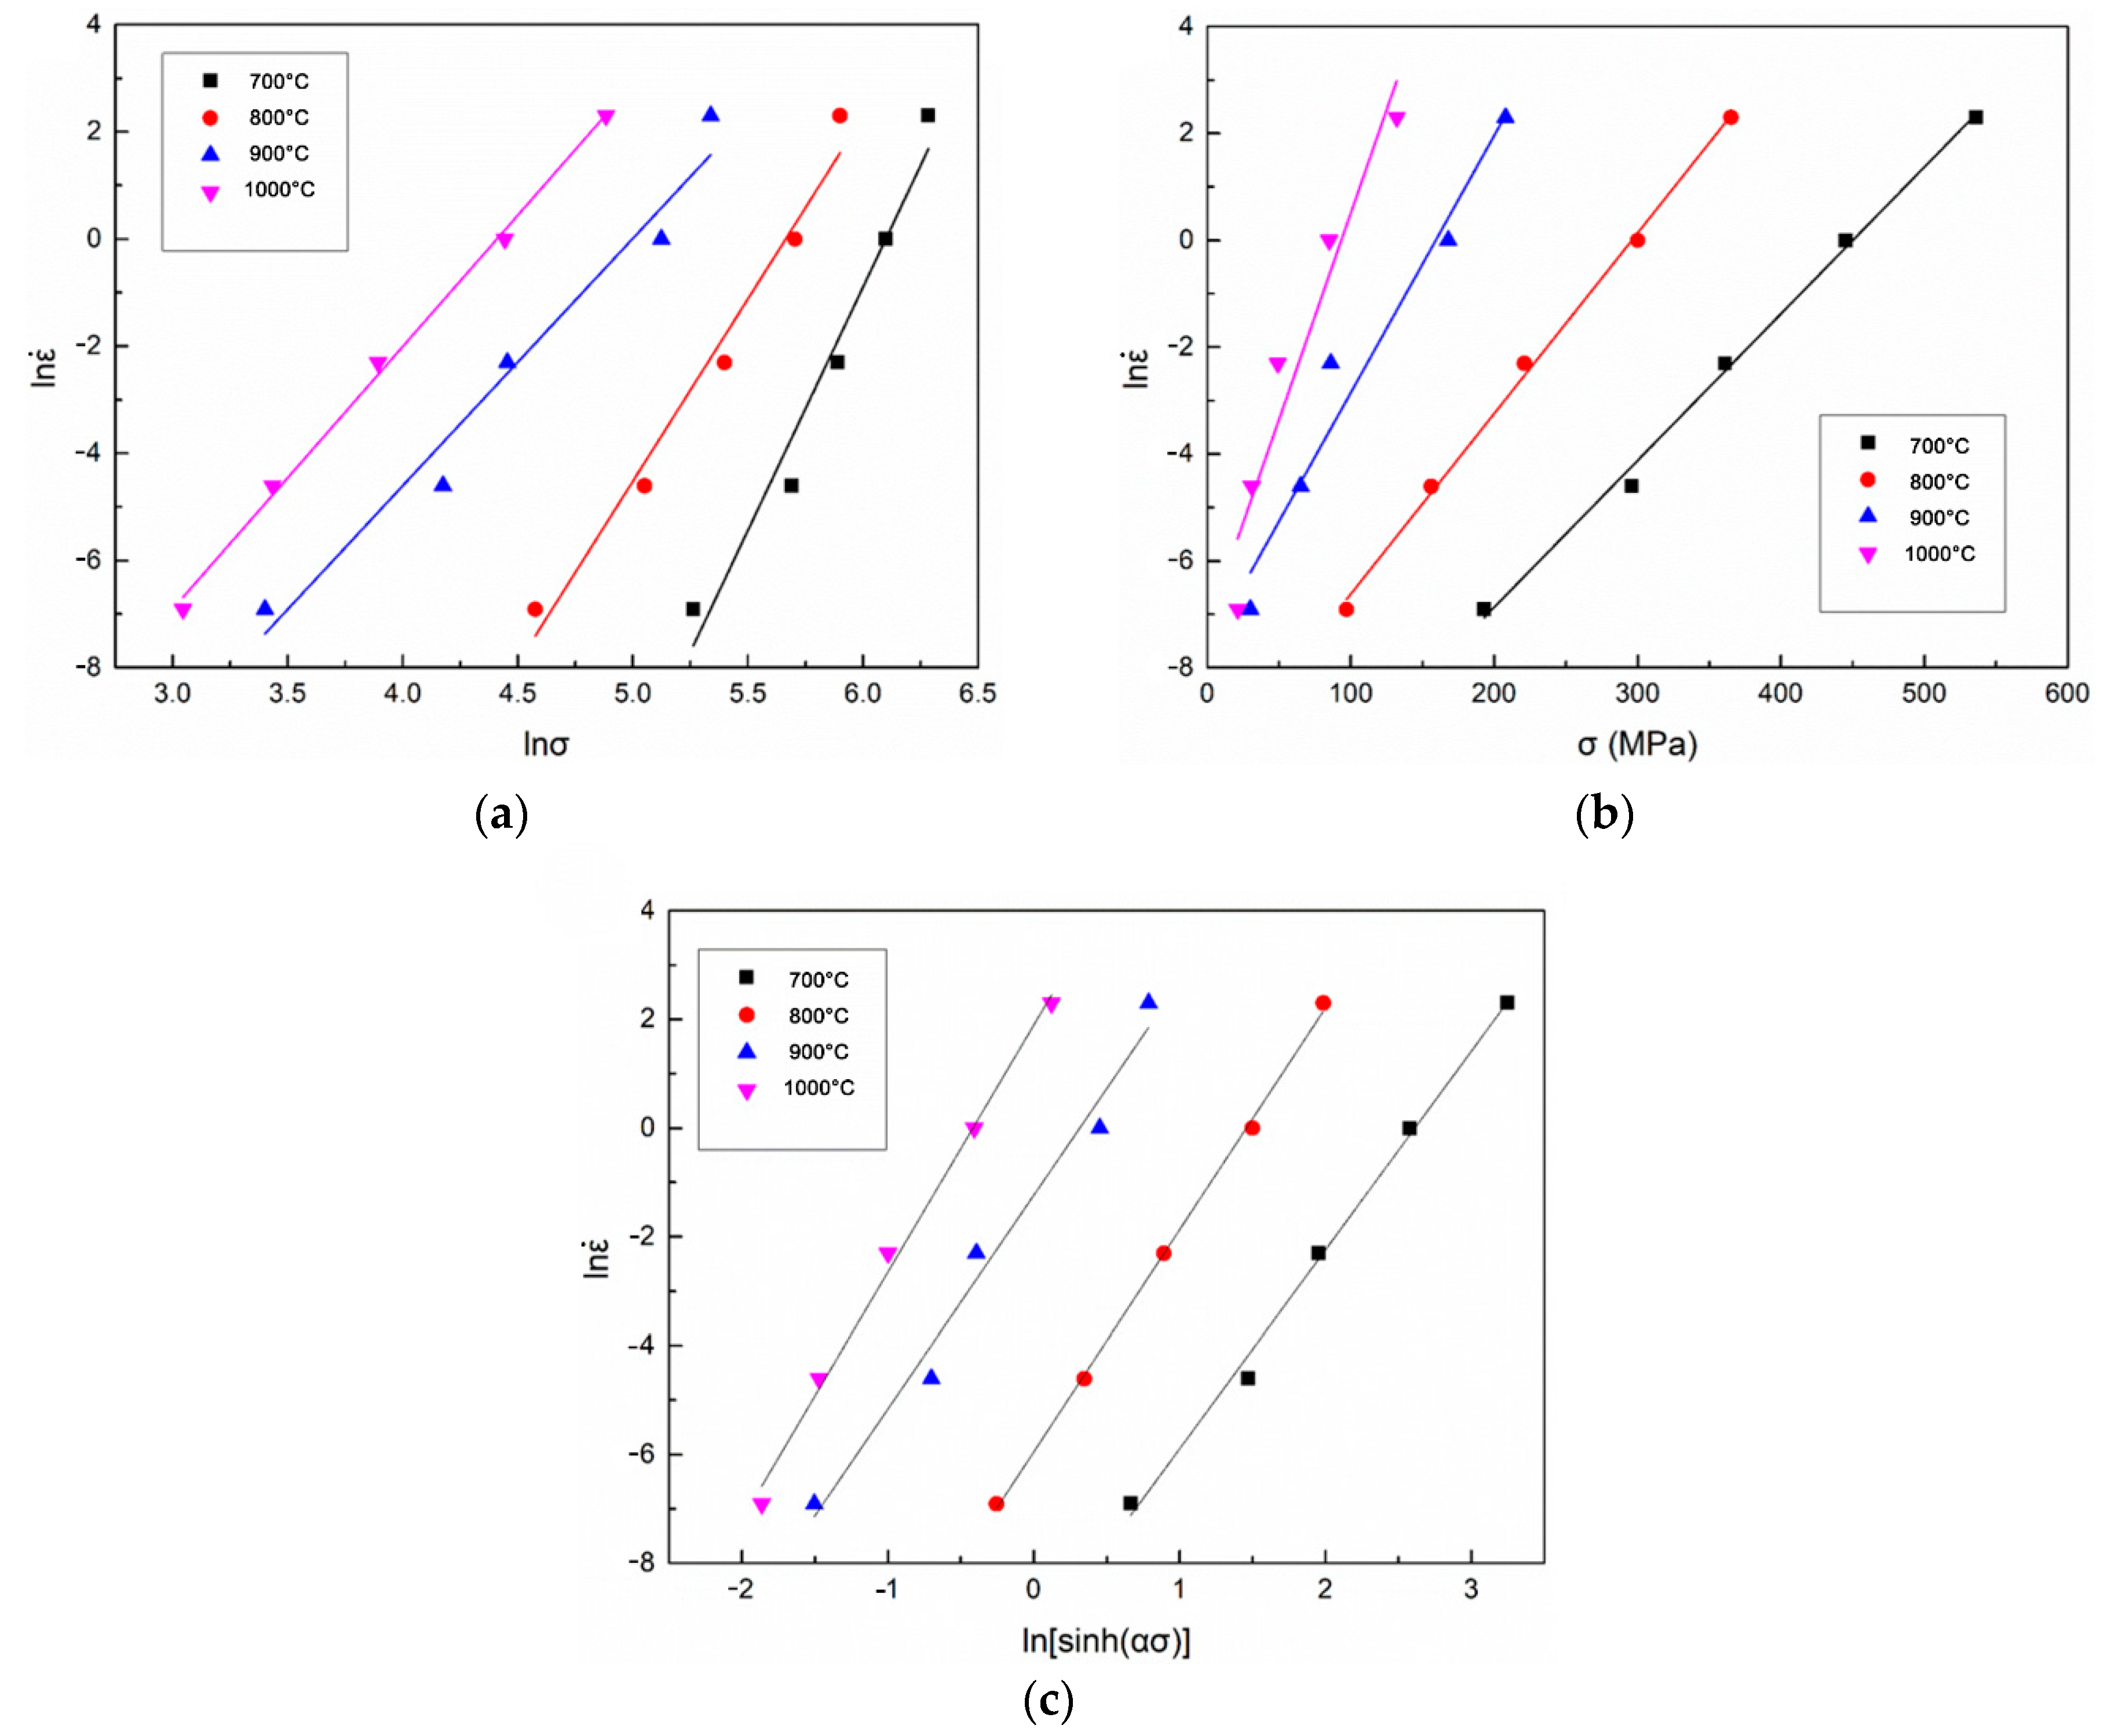
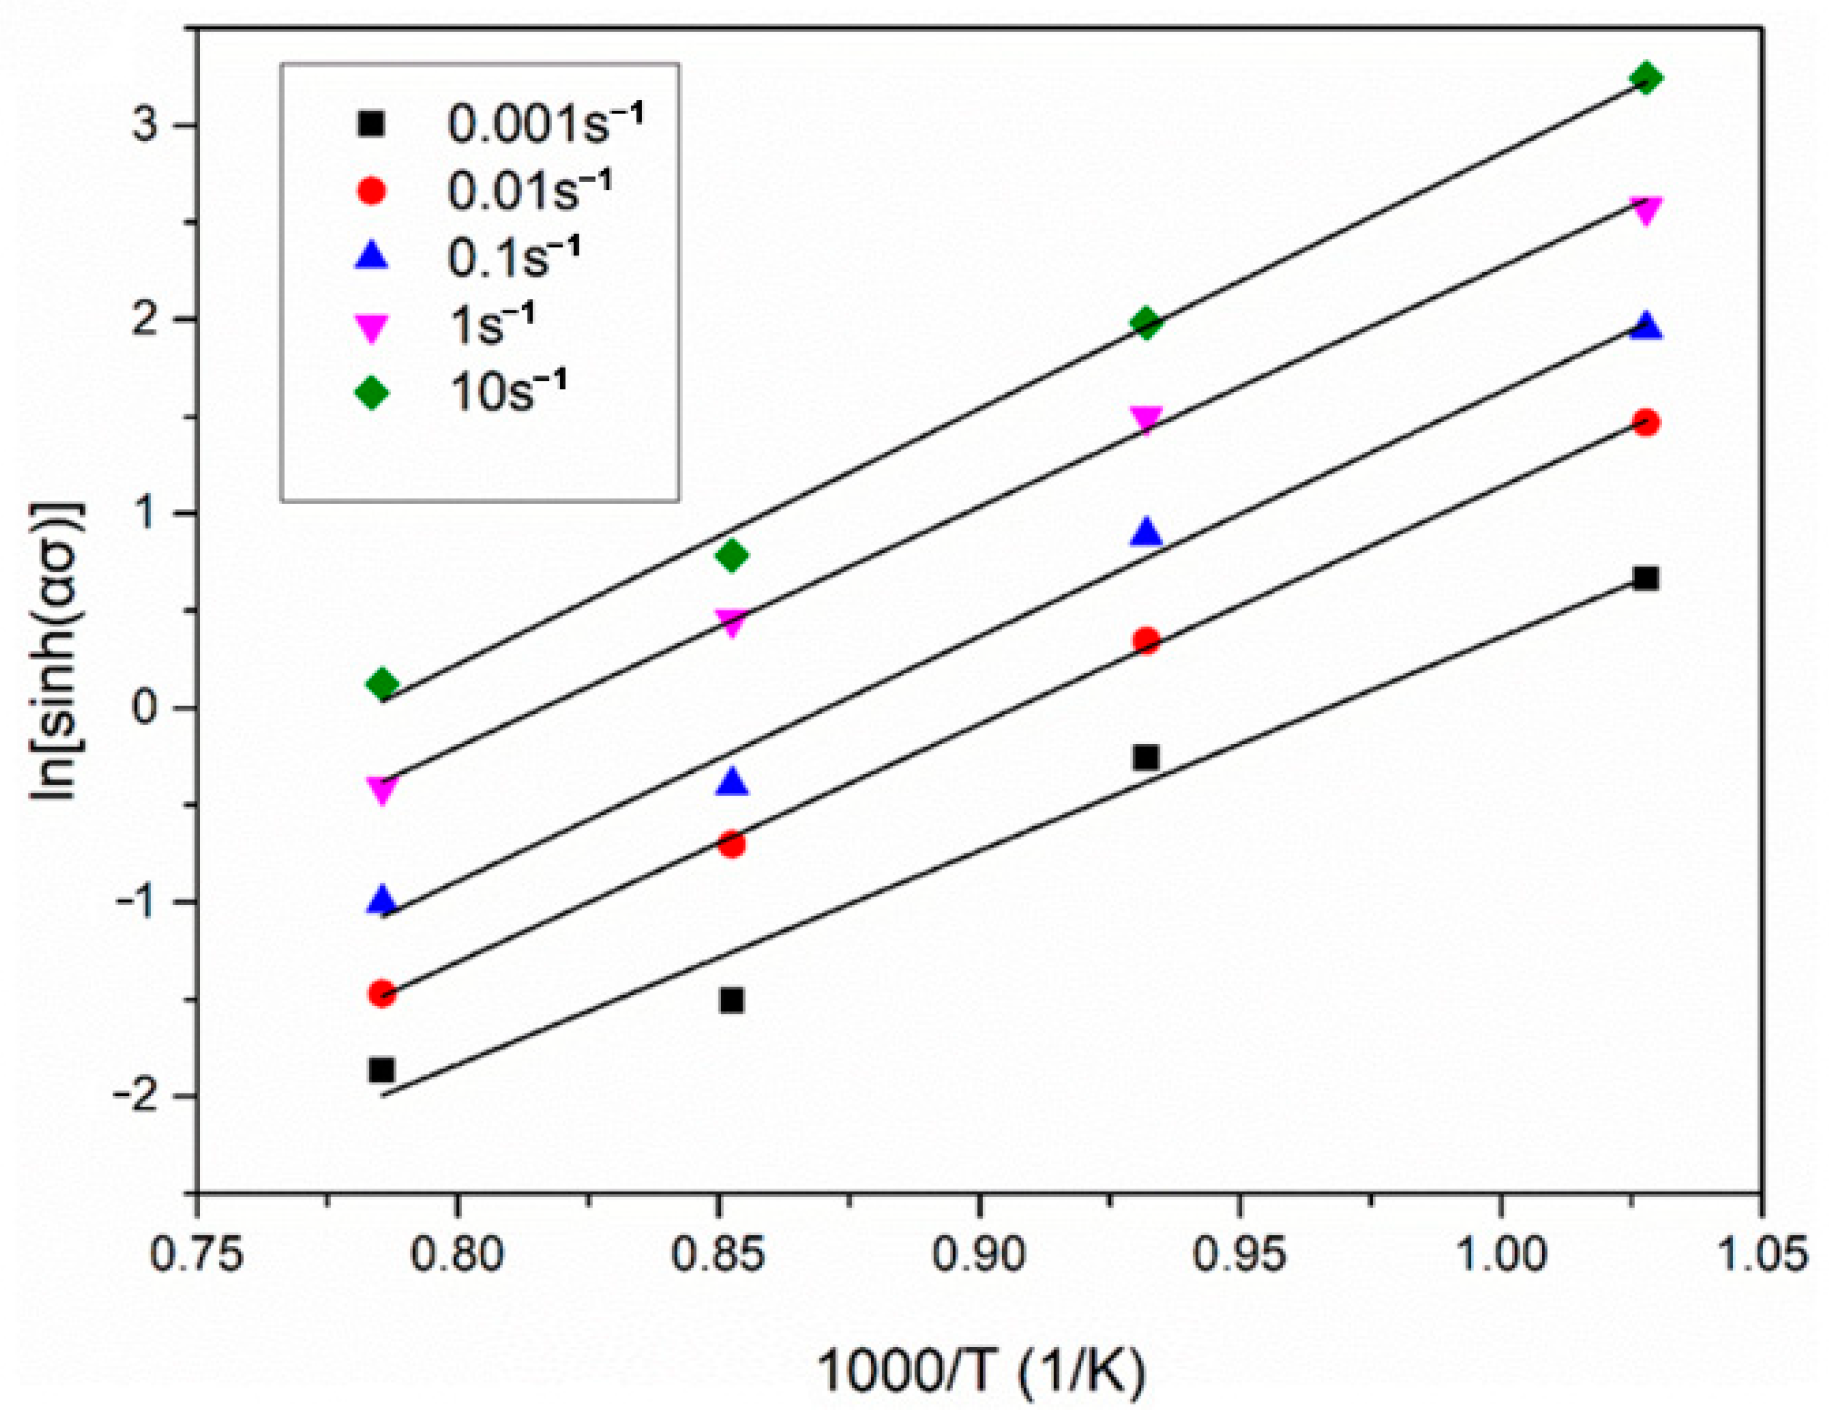
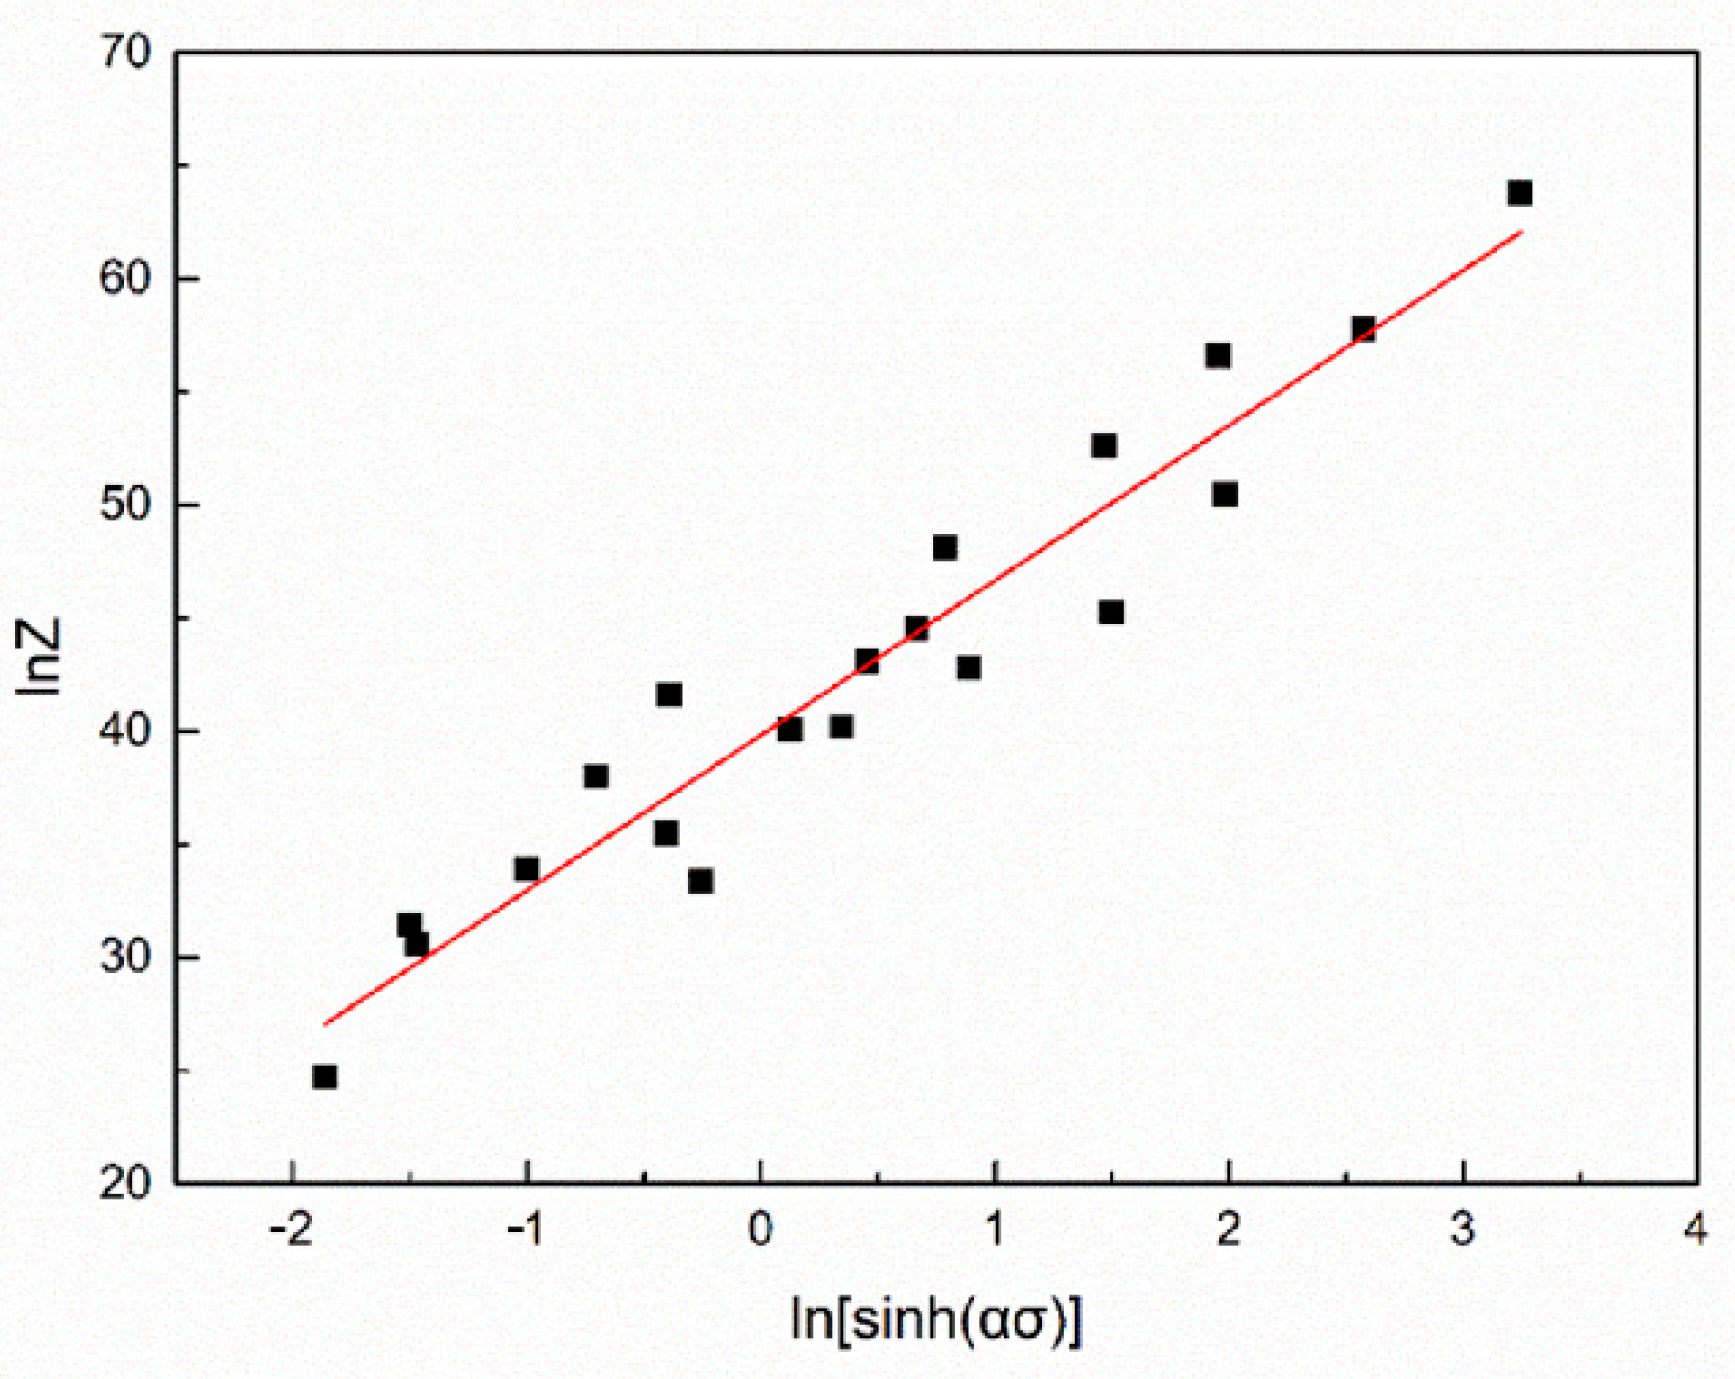
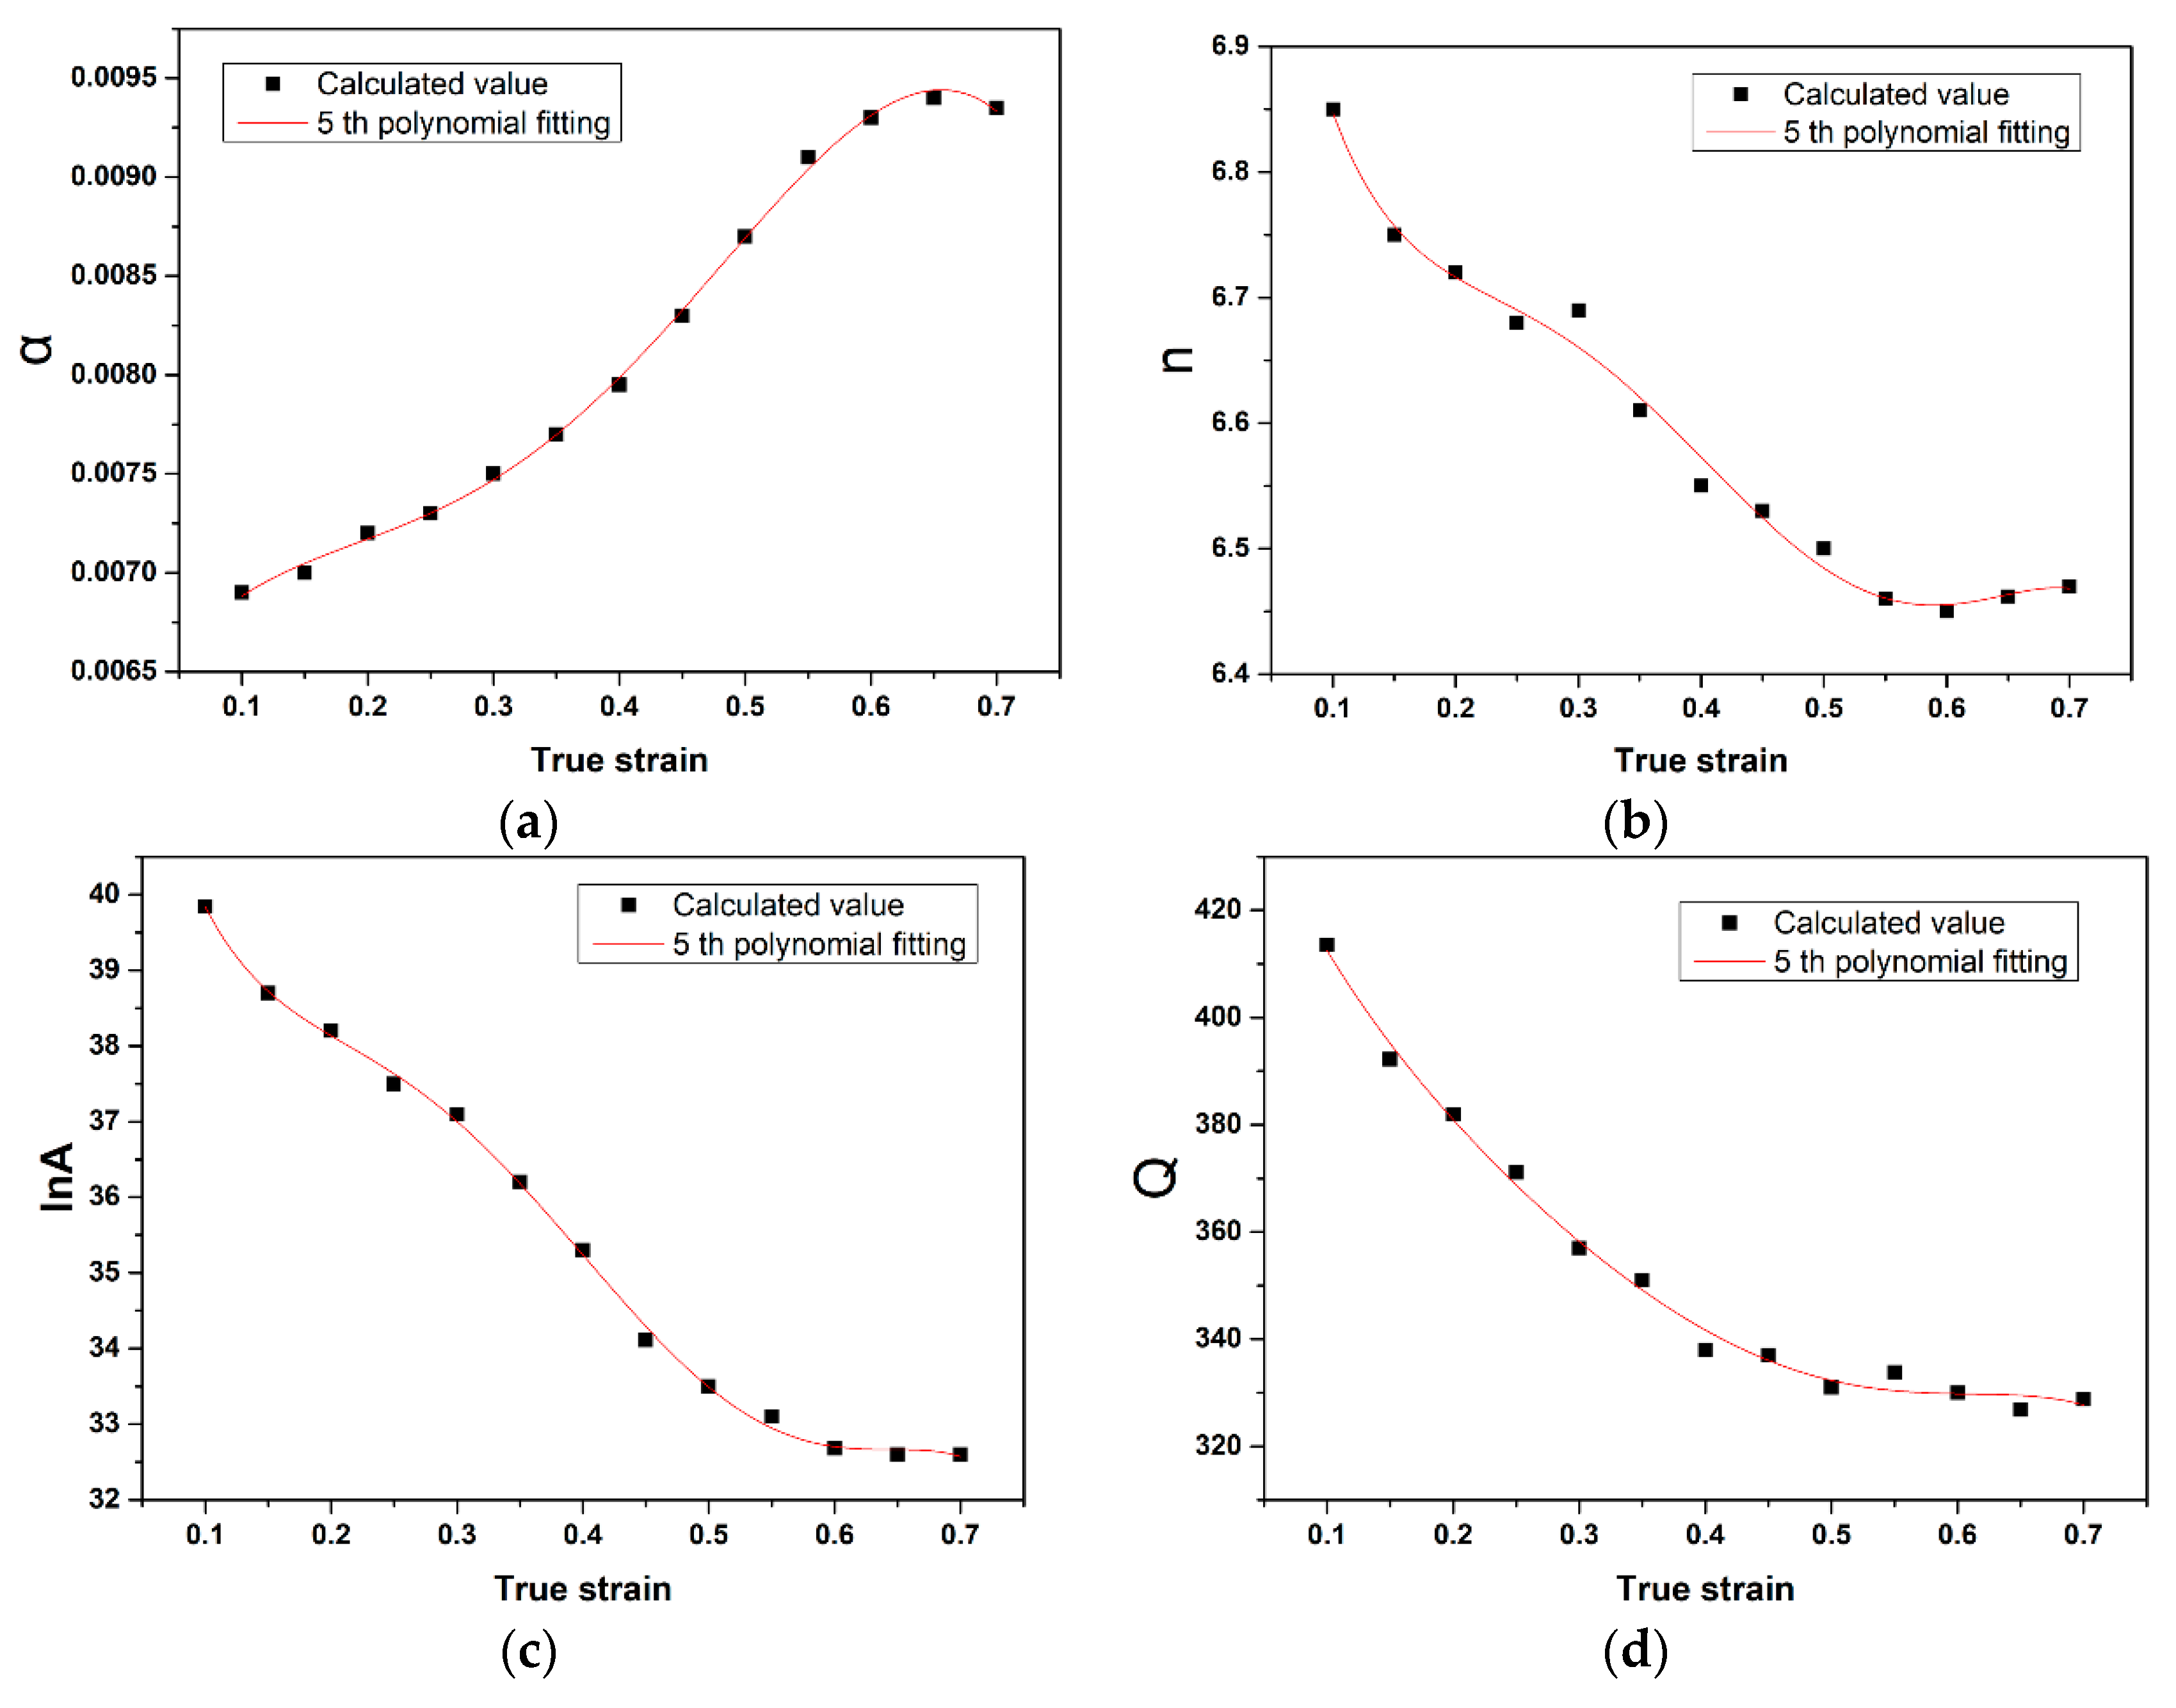
3.2. Arrhenius-Type Constitutive Modeling
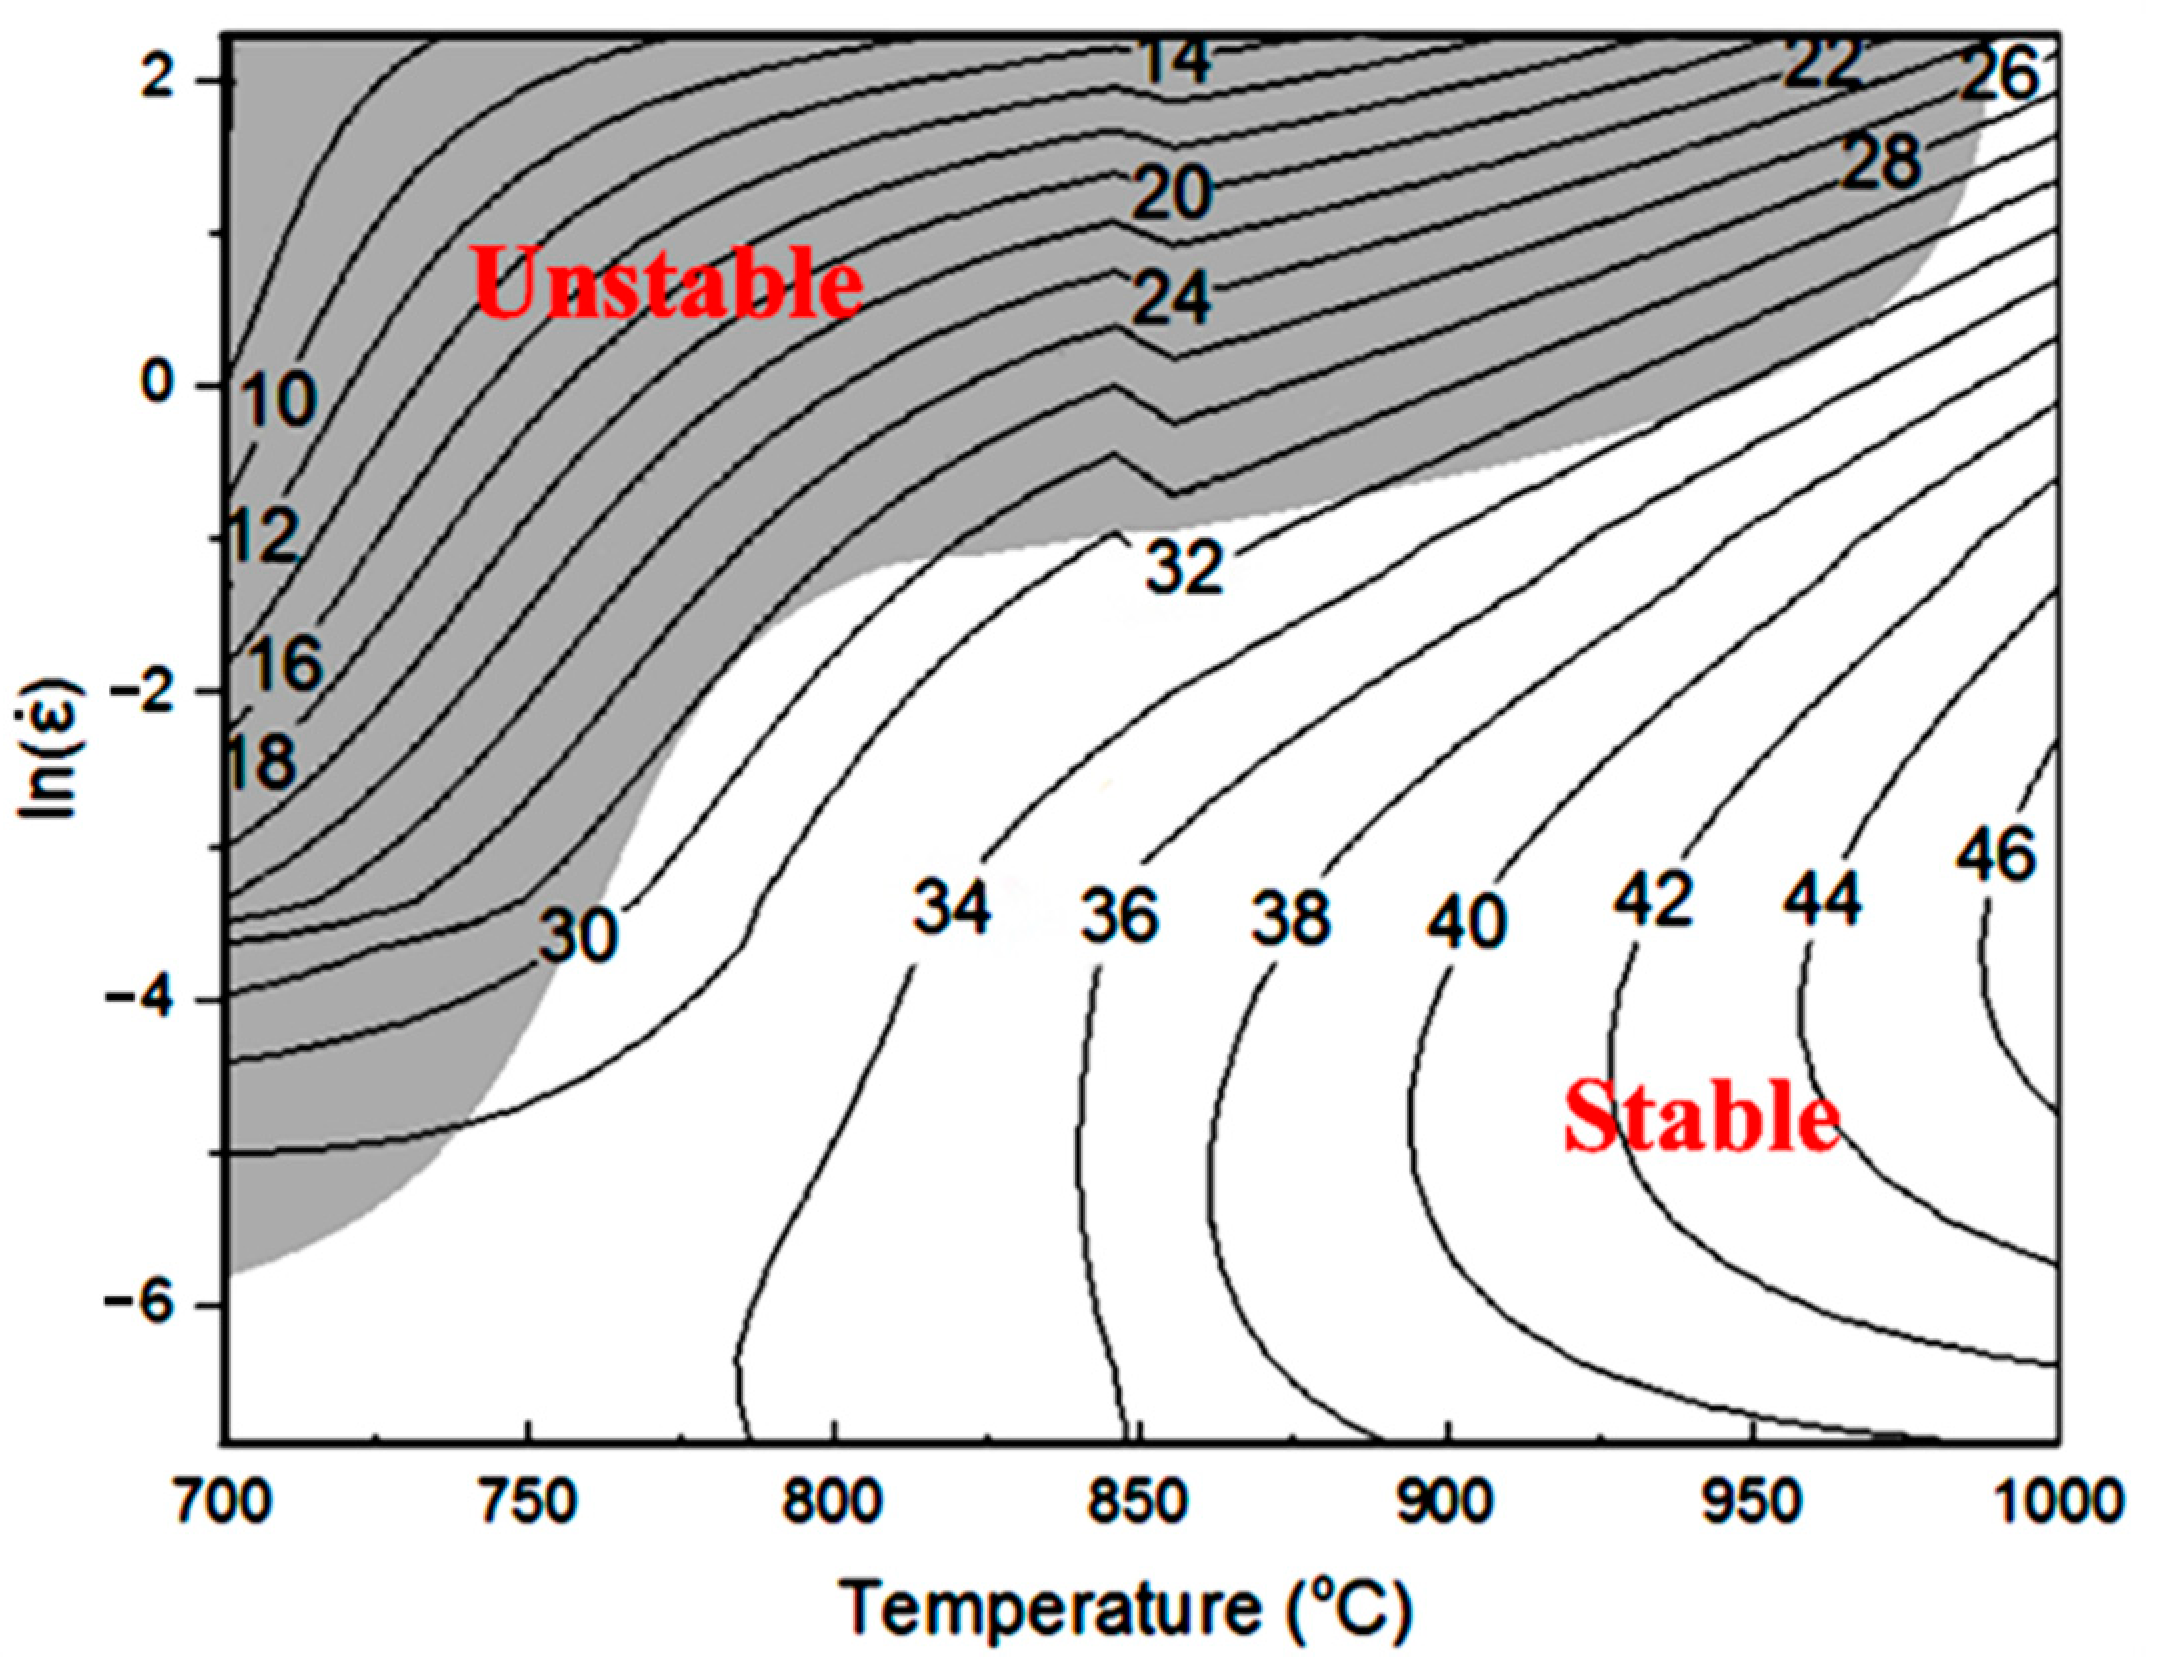
Based on the analysis above, it can be found that the flow behavior of the PM-TiAlFeMo alloy is significantly affected by the deformation temperature and strain rate during hot compression. Constitutive modeling is an important method to model the hot deformation behavior of metallic materials, which could help in predicting and selecting appropriate processing parameters by combining the utilization of processing maps [3]. The Arrhenius-type equation like Equations (2)–(4) are widely used to describe the relationship between flow behavior and deformation parameters [36]:
ε   ˙ =   A   σ n 1   exp [ Q / R T ]   ( at   low - stress   conditions )
ε   ˙ =   A   exp   ( β σ )   exp [ Q / R T ]   ( at   high - stress   conditions )
ε   ˙ =   A [ sin h ( α σ ) n ] exp [ Q / R T ]   ( at   all   conditions )  
where the A, n1, n, α, and β are constants of materials. Q is the thermal activation energy (kJ/mol) of a certain alloy, T is the testing temperature (absolute temperature, K), and R is a universal constant of molar gas. In addition, the value of α in Equation (4) is a variable constant, which varies from the deformation parameters. The relevant literature [37,38] proposed that the value of α satisfies the equation: α = β/n1, which has been applied widely in the Ti–6Al–4V, IMI834, and other titanium alloys.
Taking the natural logarithm of both sides of Equations (2)–(4), respectively, yields:
ln ε   ˙   =   ln A 1   +   n 1 ln σ Q / R T
ln ε   ˙   =   ln A 2   +   β σ   -   Q / R T
ln [ sin h ( α σ ) ]   =   ln ε   ˙ n   +   Q n R T     ln   A n
It is clear that a linear correlation could be built between (ln ε ˙ –lnσ), (ln ε ˙ – σ) and (ln ε ˙ –ln[sinh(ασ)]). The value of n1, β and n could be represented, respectively, by the slope values of these curves at constant temperatures. Figure 4 demonstrates the quantitative correlation of (ln ε ˙ –lnσ), (ln ε ˙ –σ) and (ln ε ˙ –ln[sinh(ασ)]) of the PM-TiAlFeMo alloy. A slight deviation can be observed at relatively high temperature (1000 °C), it may be associated with the phase transformation under this condition. The phase transformation temperature of this alloy is determined as 915 °C. When the testing temperature reached this point, the α phase would transfer to the β phase with the temperature rises. The deformation mechanisms of β (BCC) phase and α (HCP) phase are different, so the phase transformation at relatively high temperature may affect the fit of a constitutive relationship. Based on the slope values of the curves in Figure 4, the value of n1 and β could be obtained. Therefore, the corresponding value of α under different conditions could be calculated (α = β/n1), and the average value of α was calculated as 0.0068.
In order to compare the accuracies of those three equations, the correlation coefficient (R or R2) [24,30,39] was employed to verify the correlation between (ln ε ˙ –lnσ), (ln ε ˙ –σ) and (ln ε ˙ –ln[sinh(ασ)]). The average values of R2 of (ln ε ˙ –lnσ), (ln ε ˙ –σ) and (ln ε ˙ –ln[sinh(ασ)]) are 0.9213, 0.9327 and 0.9681, respectively. This means that the hyperbolic sinh equation (Equation (7)) has better accuracy than the power series equations (Equations (5) and (6)). In addition, Chen et al. [29] introduced the parameter of RSD (relative standard deviation) to quantitatively depict the dispersion of a materials constant in order to reduce the adverse effect of the deformation temperature on the material constants. According to the equation provided in their literature, the RSD values of (ln ε ˙ –lnσ), (ln ε ˙ –σ) and (ln ε ˙ –ln[sinh(ασ)]) were calculated: 12.7%, 11.9% and 3.2%, which are consistent with the results of the coefficient of R2.
Based on the analysis of accuracy above, Equation (7) was employed to calculate the value of Q of the PM-TiAlFeMo alloy. Taking the partial differentiation of Equation (7) yields:
Q   =   R { ln ε   ˙ ln [ sin   h ( α σ ) ] } T ×   { ln [ sin h ( α σ ) ] ( 1 / T ) } ε   ˙
where the ln ε   ˙ / ln [ sin h ( α σ ) ] (as the value of n) is the slope value of ln ε ˙ –ln[sinh(ασ)] linear regression line at a given deformation temperature (Figure 4c). The ln [ sin h ( α σ ) ] / ( 1 / T ) is the slope value of the ln[sinh(ασ)]–1/T linear regression line (Figure 5).
The thermal activation energy (Q) of the alloy under various hot deformation parameters could be calculated based on plotting the diagram of the relationship above. Meanwhile, the value of the constant A could be calculated from the intercept of the linear regression line of ln ε ˙ –ln[sinh(ασ)]. By means of multiple iterations, value of A, n and Q are calculated: exp (39.84), 6.85 and 413.25 kJ/mol.
In general, the workability of a certain metals relates to the thermal activation energy (Q), where a lower value of Q is favorable for the hot processing of an alloy. Table 2 shows the Q values of several similar titanium alloys. Compared with other similar alloys, the thermal activation energy of the PM-TiAlFeMo alloy in the present work is 100–200 kJ/mol lower than others, which shows better workability. Moreover, the thermal activation energy values of nearly single phased titanium alloys are higher than the dual-phased alloys. A similar result was obtained in Dehghan’s research [40]. Relevant studies [41,42,43] try to explain the difference in activation energy between titanium alloys, which suggest it may be related to the phase composition of the alloy. The high activation energy of a single phased titanium alloy may be due to the high flow stress of the hard phase (α-Ti) [43]. On the contrary, the α + β phase always corresponds to relatively low thermal activation energy [44]. Furthermore, the appropriate porosity and homogeneous structure in PM materials are beneficial to decrease the deformation resistance and activation energy due to the elimination of pores at the initial stage of hot compression. Peng et al. [45] proposed that the addition of elemental Mo could help improve the workability of titanium alloys, which could also be considered the reason for the relatively low thermal activation energy of the PM-TiAlFeMo alloy.
Based on the calculations above, the constitutive equation of the PM-TiAlFeMo alloy could be obtained as follows:
ε   ˙   =   exp ( 39 . 84 ) [ sin h ( 0 . 0068 σ ) ] 6 . 85 exp ( - 413 . 25 / R T )
Furthermore, the Zener–Hollomon (Z) parameter [47] is another important factor which is employed to describe the effects of the deformation parameters on the flow behavior of metallic materials, as presented in Equation (10):
Z   =   ε   ˙ exp ( Q R T )   =   A [ sin h ( α σ ) ] n
Taking the logarithm of both sides of Equation (10), which yields:
lnZ   =   lnA   +   n ln [ sin h ( α σ ) ]
The linear regression curve between lnZ and ln[sinh(ασ)] is illustrated in Figure 6, the calculated value of the R2 between lnZ and ln[sinh(ασ)] is 0.9765, which means that the linear fitting correlation between the two factors is good and the hyperbolic sinh equation is reliable to be employed.
Generally, the effect of strain on the hot deformation behavior of a certain alloy is assumed as insignificant and the factor of strain has not been taken into consideration in Equations (2)–(4). Conversely, the material constants (i.e., lnA, n, α and Q) are significantly affected by the condition of strain. The prediction of the flow stress and workability of a material is directly affected by the accuracy of the calculation of material constants. Hence, it is significant to improve the accuracy of the calculating process by considering the influence of strain. In the present work, those material constants under different strains were calculated by multiple iterations from 0.1–0.7 with an interval of 0.05, then plot these points in Figure 7. Previous studies [38,48] suggested that the correlations of ε and α, n, lnA, Q could be described by multi-order polynomial functions. Ma et al. [49] built a 4th order polynomial function to describe the material constant of a Ti–15Mo–3Al–2.7Nb–0.2Si alloy, and Ghavam et al. [38] created a 7th order polynomial function to describe the material constants of the IMI834 alloy. However, Cai et al. [50] proposed that the polynomial function with too high an order would overfit and lose the ability of true representation. In order to set an appropriate order for the polynomial functions, the method of trial and error was employed by trying the order from 1 to 8. Consequently, polynomial functions with an order of 5 like Equation (12) were built, which shows good correlation (R2 = 0.9761) and low dispersion with the calculated scattered data points in Figure 7. The fitting results for the coefficients of the polynomial functions are shown in Table 3:
{ α   =   E 0 + E 1 ε   +   E 2 ε 2   +   E 3 ε 3 +   E 4 ε 4   + E 5 ε 5   n   =   F 0 + F 1 ε   + F 2 ε 2 + F 3 ε 3 + F 4 ε 4 + F 5 ε 5 ln   A   =   M 0 + M 1 + M 2 ε 2 + M 3 ε 3 + M 4 ε 4 + M 5 ε 5 Q   =   N 0 + N 1 ε + N 2 ε 2 + N 3 ε 3 + N 4 ε 4 + N 5 ε 5
Once the coefficients are revealed by the 5th polynomial fitting, the material constants could be calculated by Equation (12). Then, the predicted value of flow stress (σp) could be obtained by Equation (13). The value of Z could be calculated by Equation (10):
σ p   =   1 α ln { ( Z A ) 1 n + [ ( Z A ) 2 n +   1 ] 1 2 }
As shown in Figure 8, the predicted values of flow stress under various deformation conditions were calculated and compared with the experimental data. The predicted values coincide well with the experimental data in most deformation parameters. Only a slight deviation can be observed at 700 and 900 °C/10 s−1. This may come from the unstable flow, micro-cracks, and flow localization at the relatively high strain rates.
Relevant literature [24,51] suggested that the predictability of the constitutive equation could be verified by the parameter of average absolute error (AARE%). In general, the AARE% is considered as an unbiased statistical parameter. The value of AARE% could be calculated by Equation (14):
AARE %   =   1 M i = 1 M | σ e   -   σ p σ e | × 100
where σe, σp is the experimental and predicted value of flow stress, and M is the number of data points, which is 260 in the present work. The AARE% of the PM-TiAlFeMo alloy is calculated: 5.21%. Ideally, the value of AARE% is “0”. In practice, a smaller AARE% represents a better correlation between experimental and predicted data. A comparison between the present work and relevant literature is shown in Table 4, it can be confirmed that the Arrhenius-type model shows better predictability to estimate the flow stress of the PM-TiAlFeMo alloy compared with similar titanium alloys. Wang et al. [51] introduced a modified parameter (ζ) into the original constitutive model to reduce the error of prediction. By introducing the modified parameter, the AARE% of the Ti-10-2-3 alloy in their research decreased from 5.61% to 2.81%. However, the AARE% of the PM-TiAlFeMo alloy in the present work only changed from 5.21 to 5.198% using the parameter (ζ), which indicates the modified parameter shows a better accuracy for the specific alloy in Wang’s study rather than the PM-TiAlFeMo alloy in our work.

3.3. Processing Map

A processing map is an important tool that is always employed to predict the hot forming process and flow behavior of metallic materials by analyzing the deformation instability information during hot deformation. Generally, a processing map could be drawn by combining the flow instability information and power dissipation diagram. Equation (15) is widely employed to calculate the value of power dissipation efficiency (η) based on the dynamic materials model (DMM) established by Prasad et al. [53]:
η   =   2 m m   +   1
The m is the strain rate sensitivity, which represents the energy input during hot deformation is consumed by microstructure evolution rather than heat dissipation. The value of m could be defined by Equation (16):
m   =   l n σ l n ε   ˙
Figure 9 shows the 3D power dissipation efficiency map of the PM-TiAlFeMo alloy. It is clear that the value of η changes insignificantly with temperature but significantly with the strain rate. The η ranges from 5.8 to 47.8%, the minimum value and maximum value appears at the condition of 700 and 1000 °C/0.01 s−1, respectively. In general, the relatively higher value of η represents the better workability of an alloy. As shown in Figure 9, the ranges marked by blue bars along the x and y axes are relatively secure processing regions, and in opposition, the red bars are insecure.
On the other hand, a few unpredictable defects (e.g., micro-cracks, flow localization) may cause unstable flow during the hot process, which significantly affects the secure region in the processing map. Prasad et al. [53] proposed the criterion for the flow instability, as shown in Equation (17):
ξ ( ε   ˙ )   =   ln [ m / ( m   +   1 ) ] l n ε   ˙   +   m
when the value of ξ < 0, it is considered as the unstable flow.
By superimposing the unstable zone determined by Equation (17) on the power dissipation diagram, the processing map could be drawn considering the strain rate, deformation temperature and power dissipation efficiency (as shown in Figure 10). The dark region with a relatively low η is identified as flow instability zone, and the white region means flow stability zone. The range of 900–1000 °C/0.001 s−1–0.1 s−1 is a relatively secure zone that could be chosen in practical processing. Sen et al. [54] suggest that the high-temperature deformation mechanism under various deformation parameters is closely related to the power dissipation efficiency. The peak value of η often corresponds to the favorable deformation mechanisms, where dynamic recovery, dynamic recrystallization and super-plasticity are dominant mechanisms for these areas [27]. Conversely, unstable flow (e.g., kinking, breaking, and flow localization) may occur at a low strain rate/low temperature (0.01–10 s−1/700–850 °C) with a relatively low η value, which needs to be avoided during hot processing.

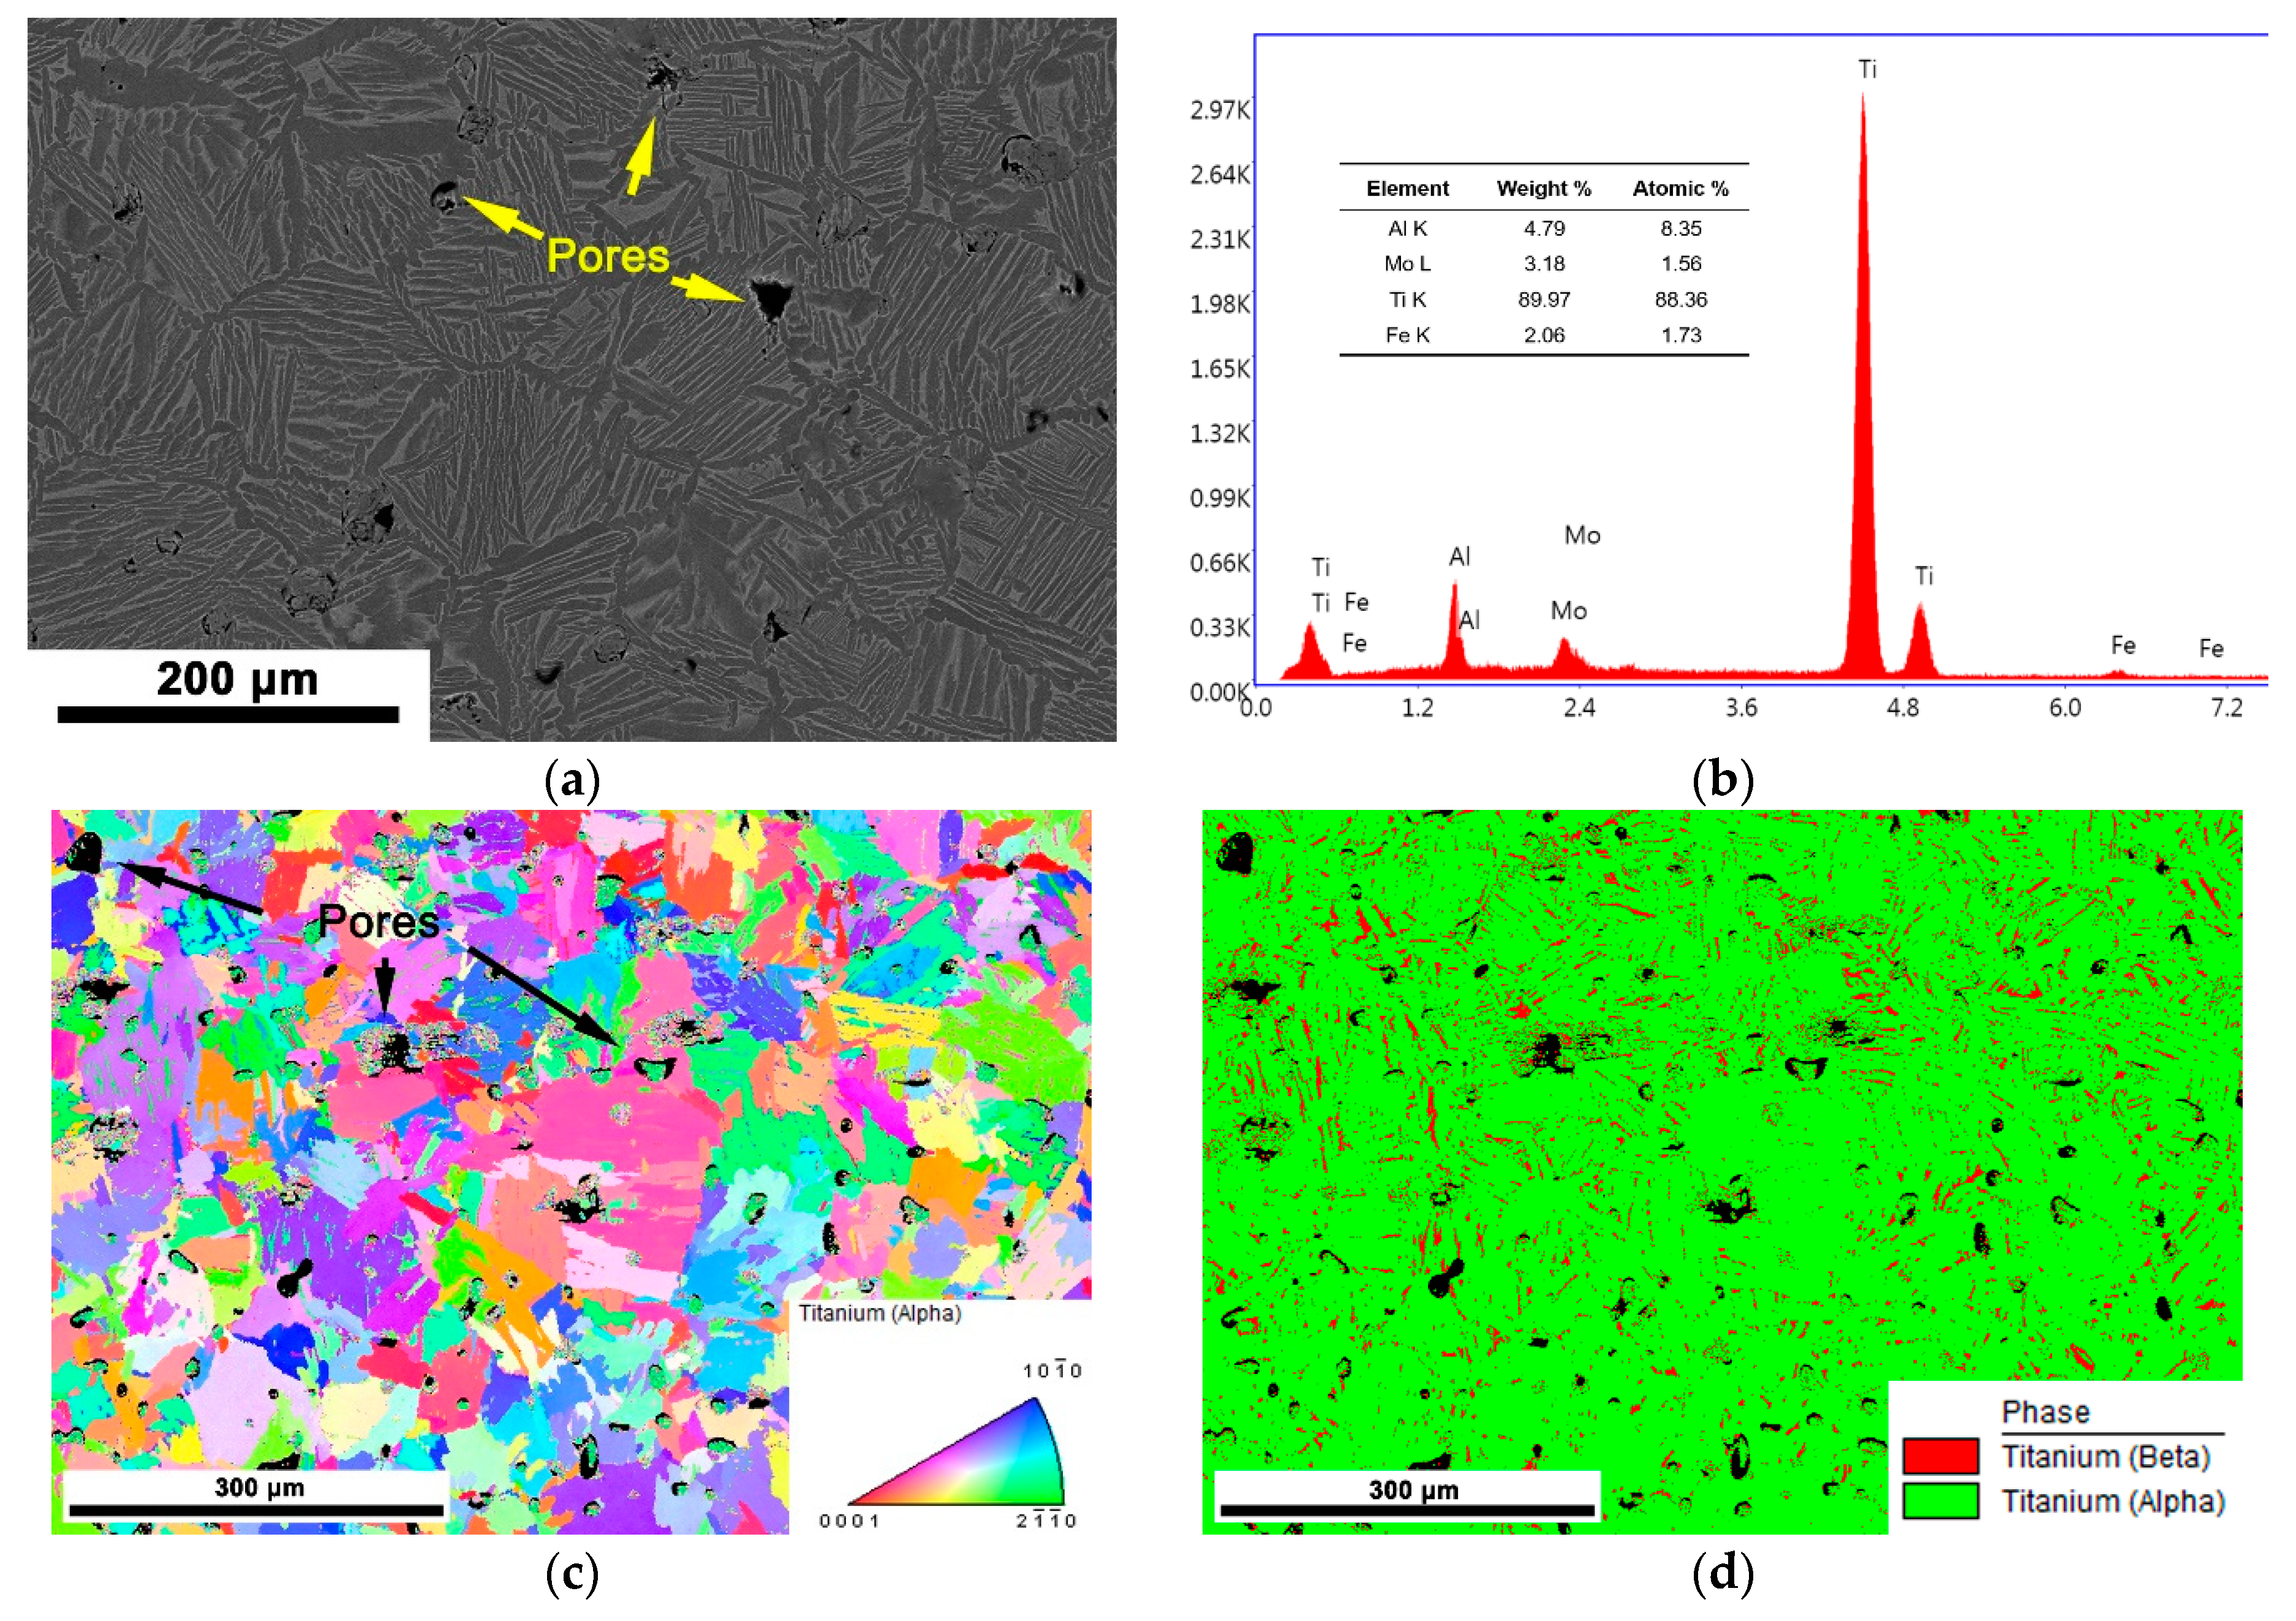
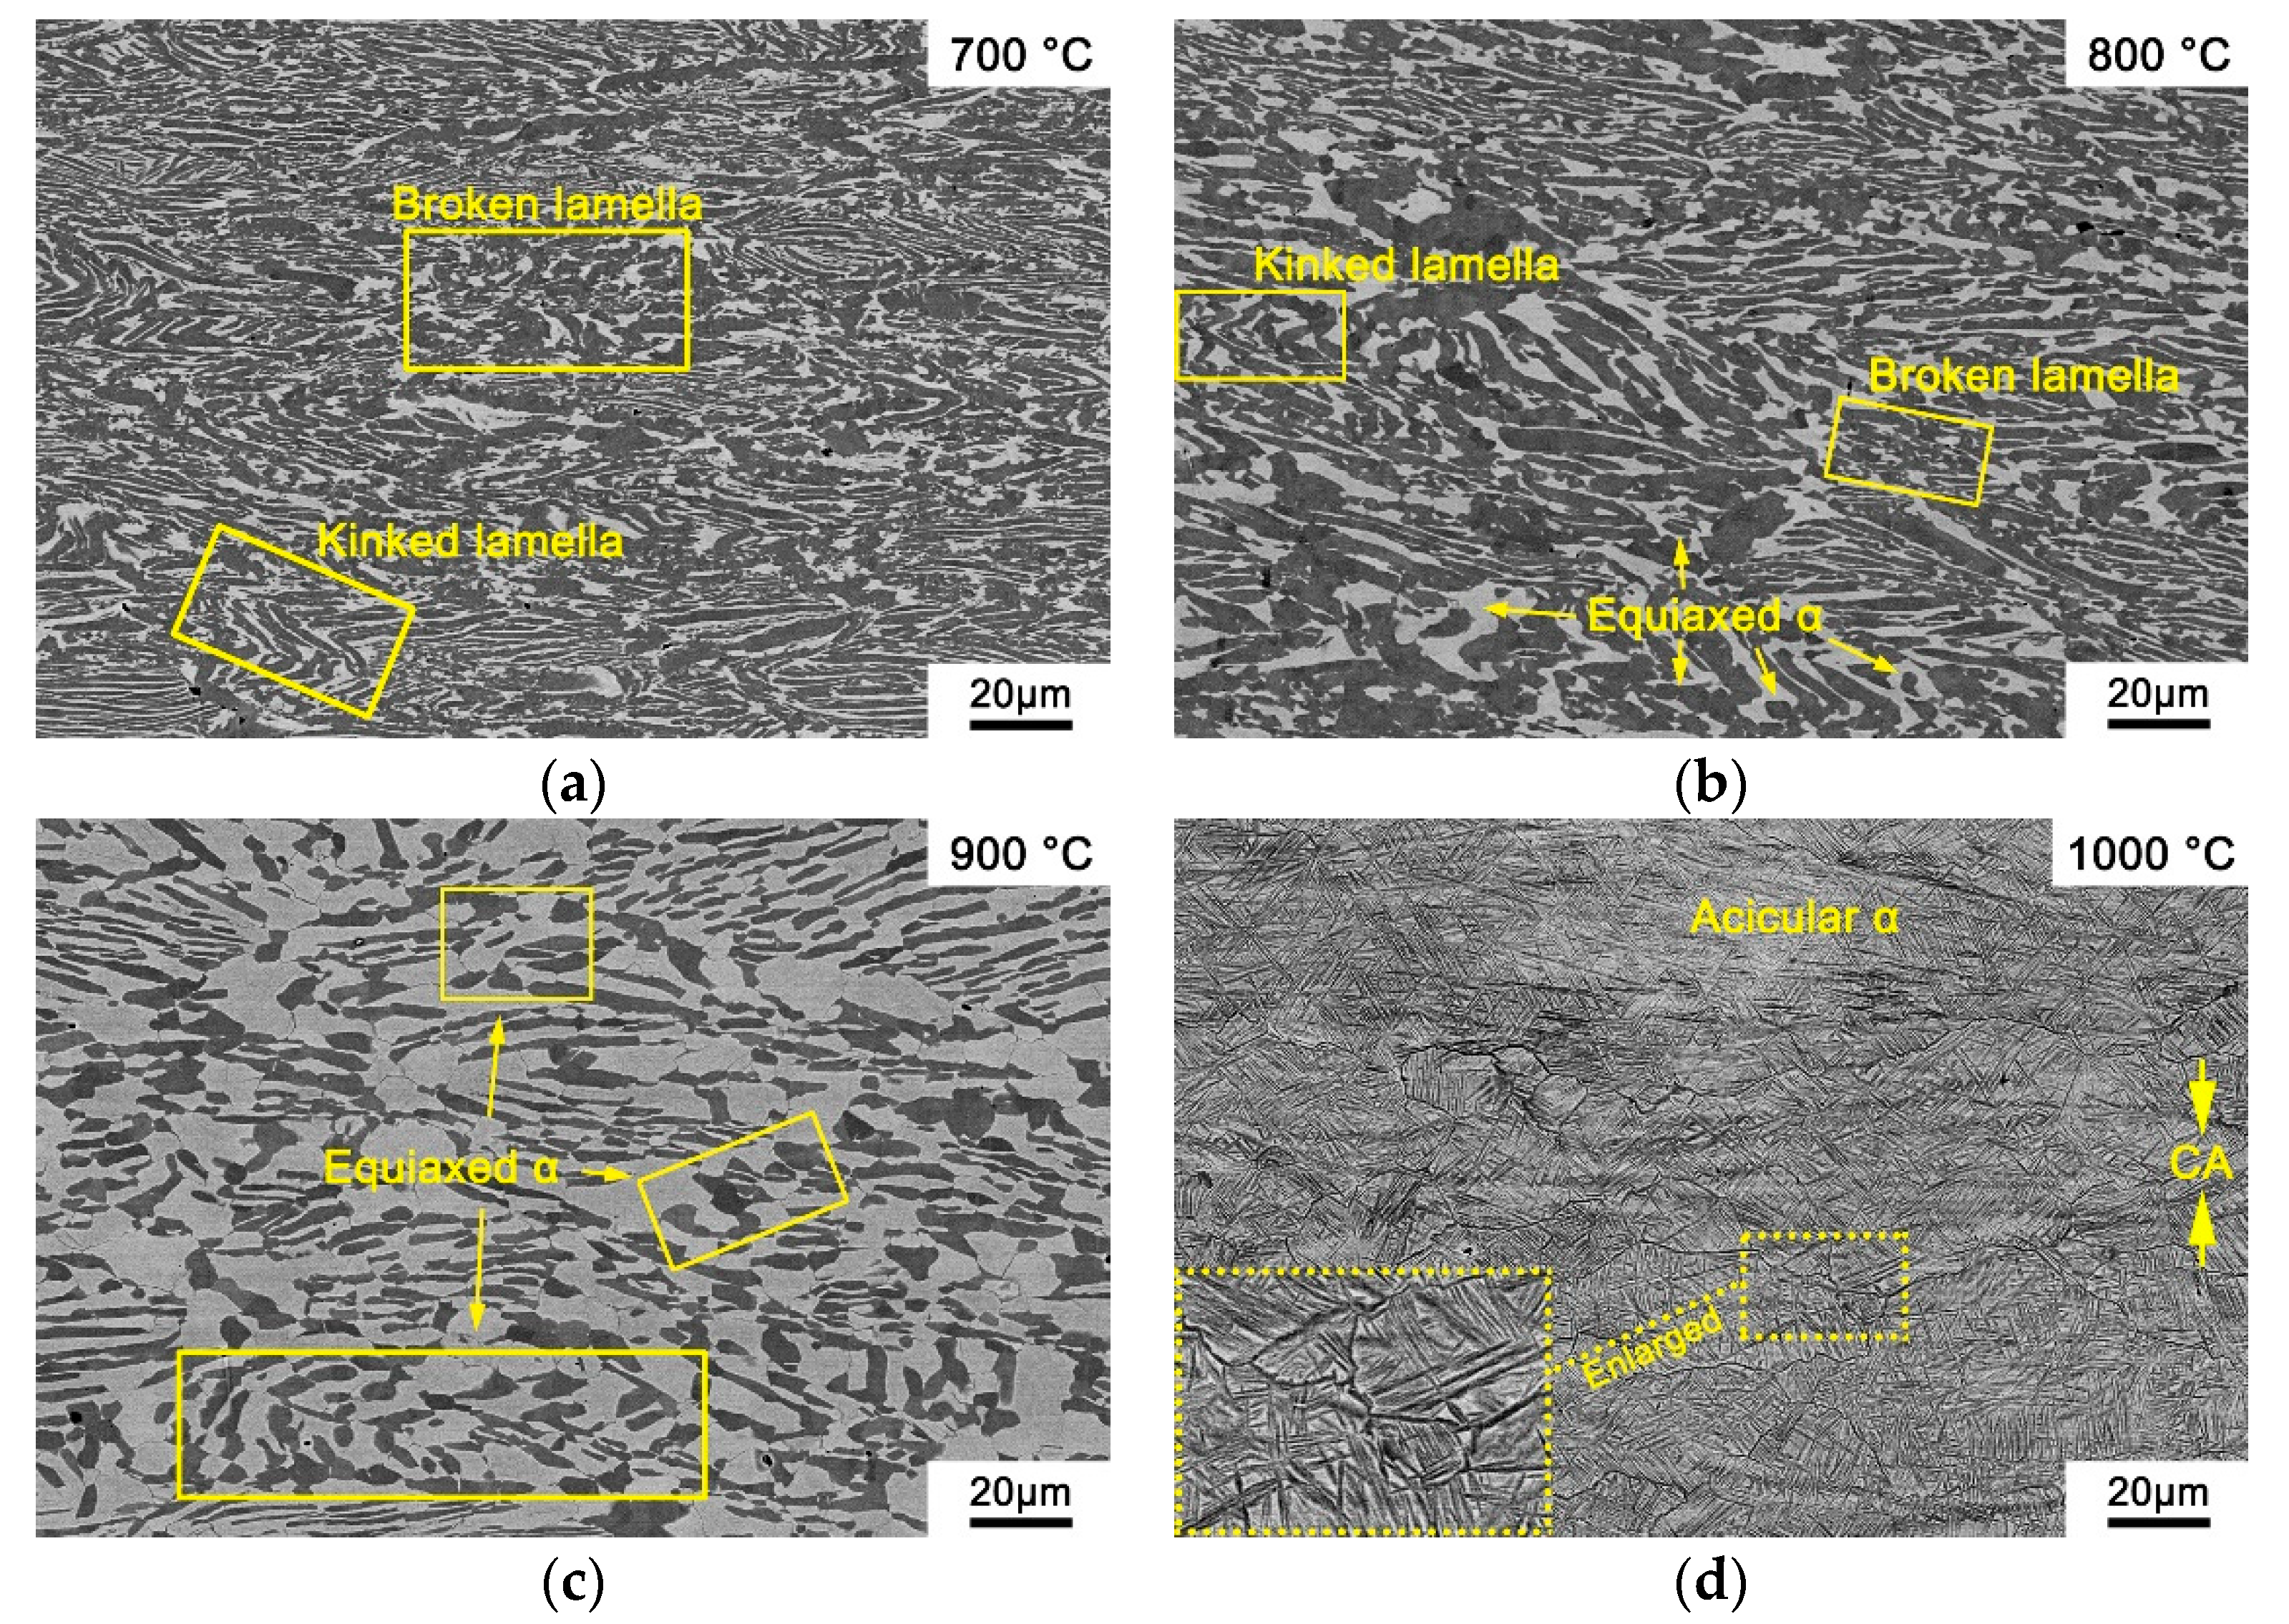
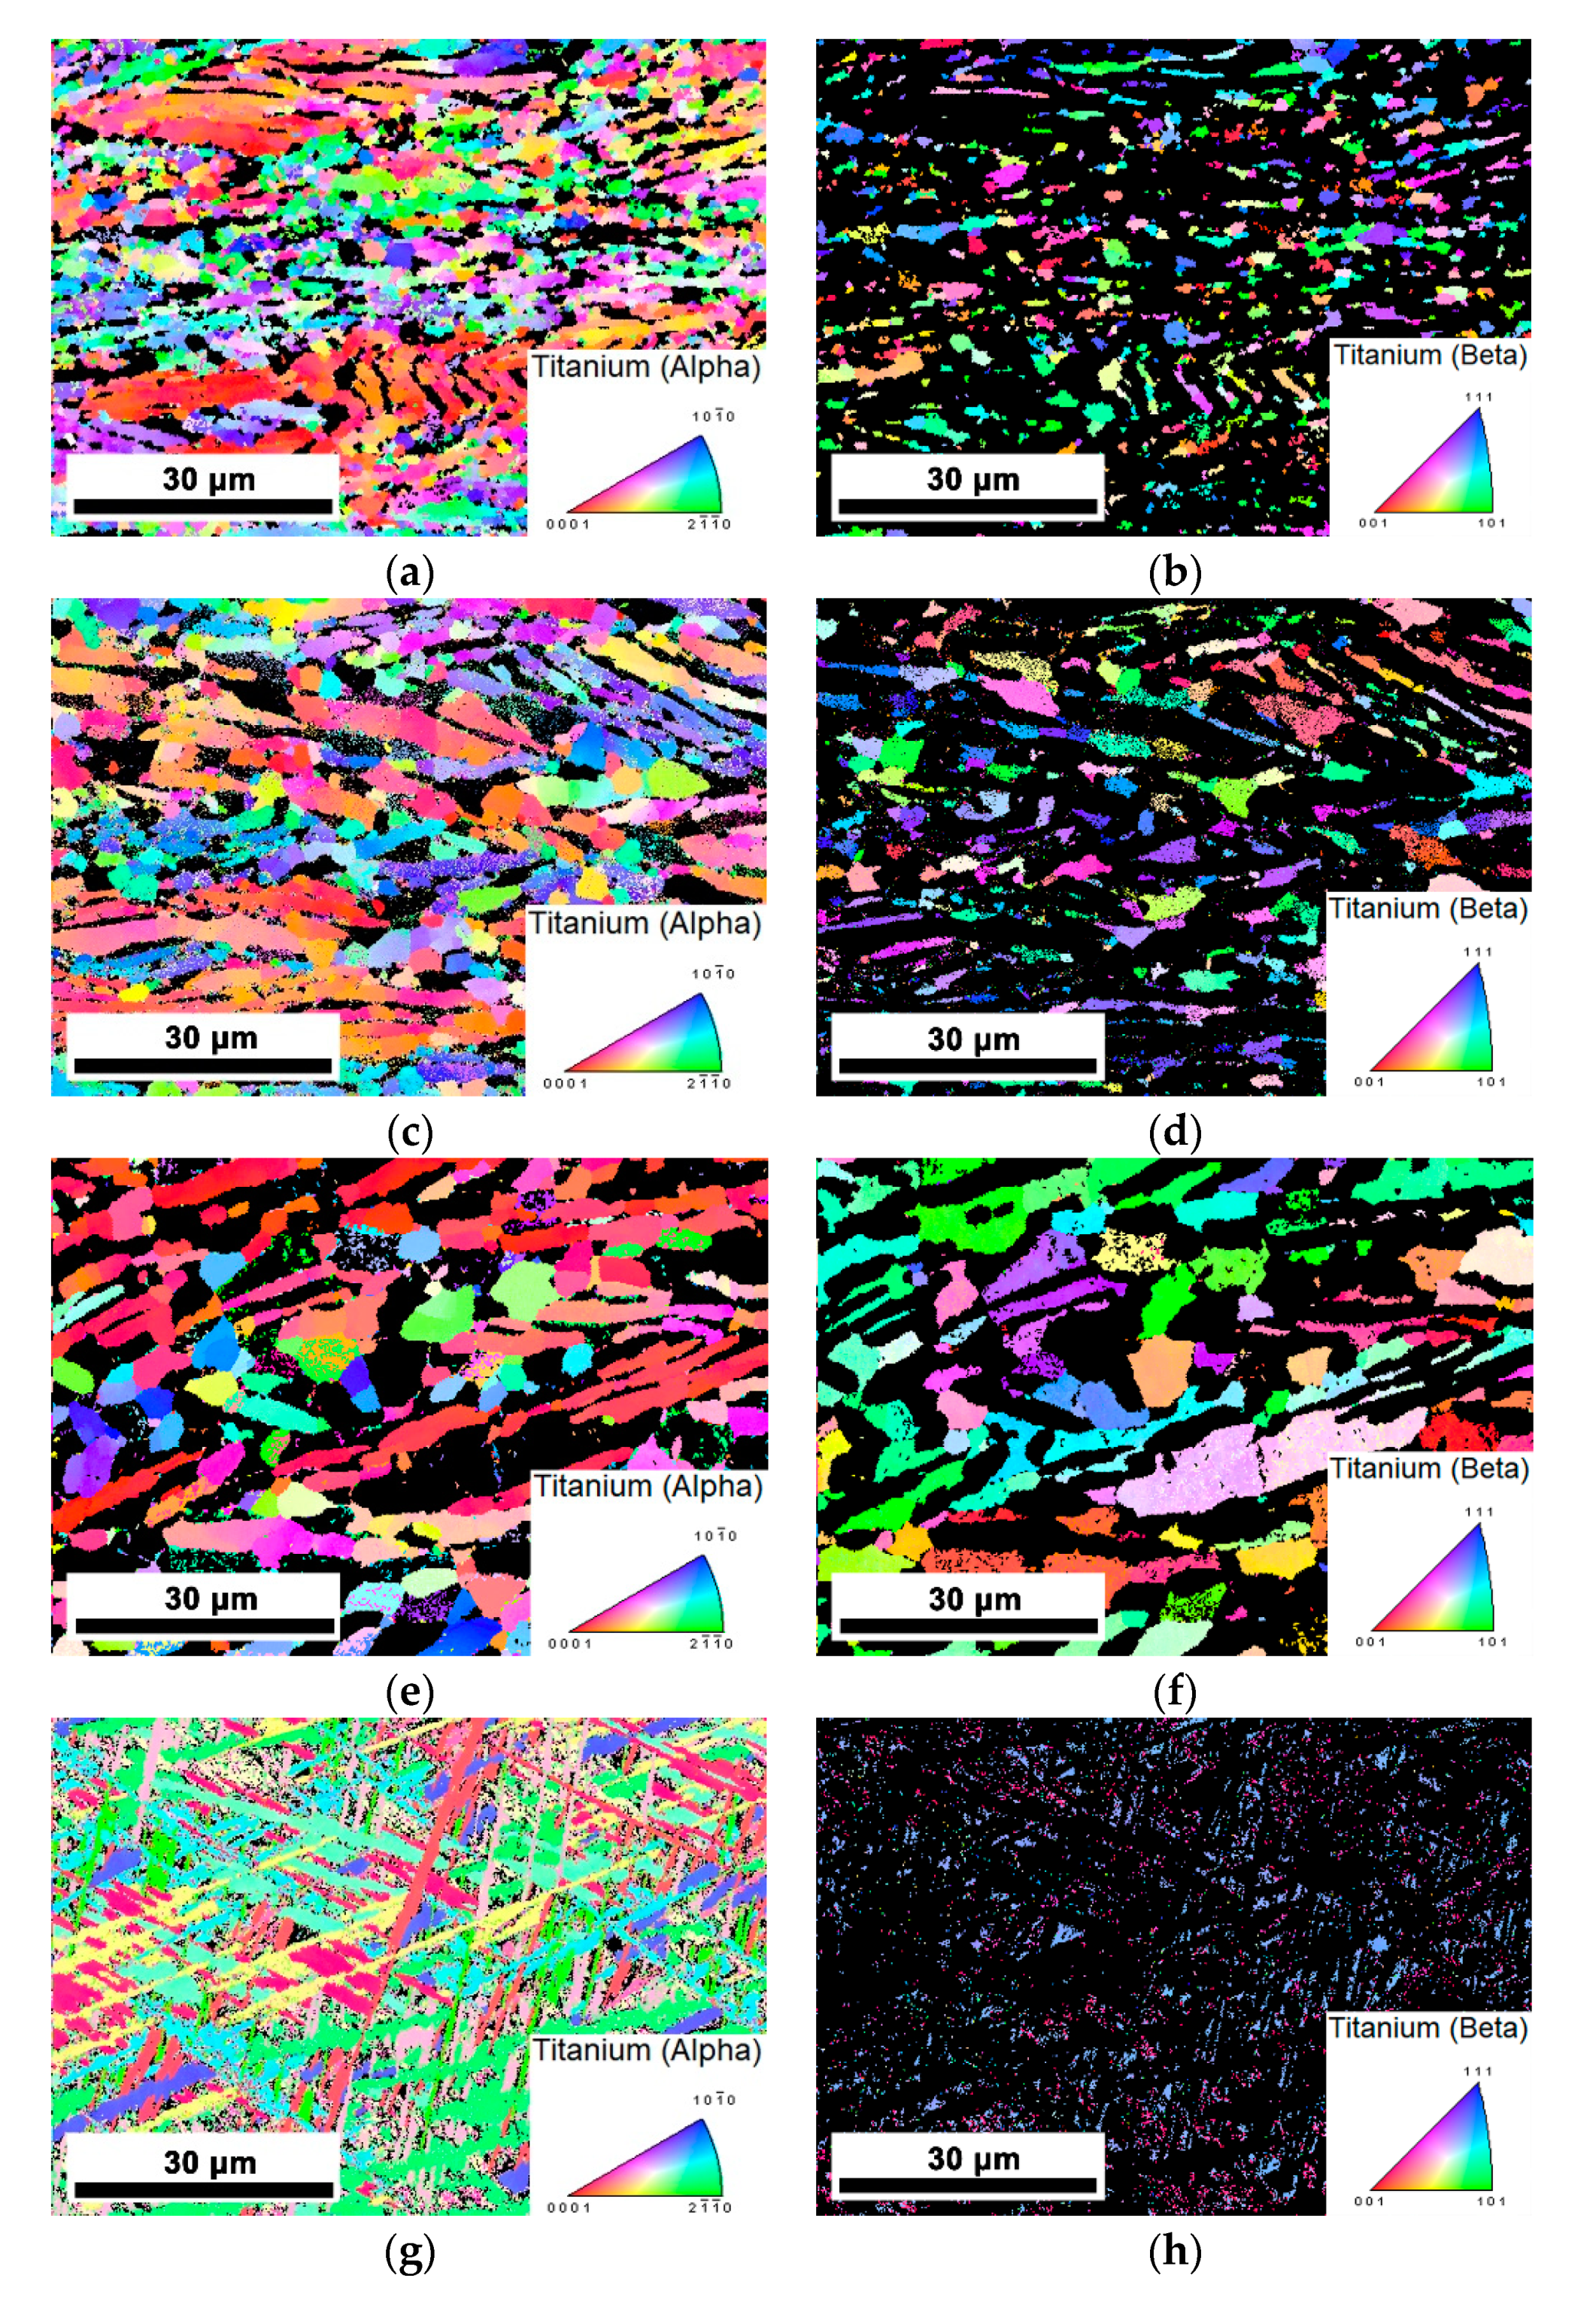
3.4. Deformation Microstructures

It is known that the flow stability/instability and high/low power dissipation coefficient in the processing map represent various microstructure evolutions during hot processing. Hence, it is significant to verify those analyses about above deformation mechanisms by microstructure observation. Moreover, it is also an effective method to verify the accuracy of the DMM model and choose the optimal processing parameters in the practical hot working process.

3.4.1. Effects of Temperature on Deformation Microstructure

The deformation microstructure of the PM-TiAlFeMo alloy deformed at the condition of 0.001 s−1/700 °C–1000 °C is illustrated in Figure 11. It is worth noting that the pores in the as-sintered PM-TiAlFeMo alloy (Figure 1) have been eliminated, which agrees with the discussion of correlation between porosity and activation energy (Section 3.2). As shown in Figure 11a,b, the originally lamellar microstructure which is parallel/perpendicular or angled (e.g., 45°) to the compression axis (CA) has been kinked/broken or rotated after compression at relatively low deformation temperatures. For HCP Ti, the dislocation climbing and cross-slipping will be restricted at relatively low temperatures. Therefore, the energy stored during compression could not be released at relatively low strain rates and temperatures. Consequently, the breaking, rotation and kinking of microstructure will occur as the strain increases and accumulates. As shown in Figure 11b, the equiaxed α phase could be observed in partial areas, which means dynamic globularization occurred at 800 °C. The globularization in Figure 11c (900 °C) shows to be more distinct compared with Figure 11b. A similar result was observed in the Ti600 alloy [23], which is well consistent with the current result that higher deformation temperature help globularization to occur during hot deformation. When the deformation temperature exceeds Tβ, the original lamellar α + β microstructure transforms into nearly single β during hot deformation (Figure 11d). The deformation driving force rapidly increases at high temperature, the agglomeration and growth of β grains may occur more easily under this condition [23,55]. Ultrafine acicular α phase precipitated in the β phase during water quenching after hot compression, so the microstructure after deformed at 1000 °C showed a mixture of the acicular α phase and retained β. Moreover, small-size recrystallization grains could be observed in the junction of coarse deformed β grain boundaries (as marked by frame and presented in the enlarged figure at the lower-left corner in Figure 11d), which could be interpreted that recrystallization prefers to occur in those areas [21]. When hot working is performed at the temperature above Tβ, dislocation migration will be enabled by the high self-diffusivity of BCC Ti with the increase in temperature, and the stored energy will decrease, which help dynamic recovery, dynamic recrystallization and grain growth to occur. It is consistent with the discussion above (Section 3.3), where the peak value of power dissipation efficiency at 1000 °C/0.01 s−1 often corresponds to the dynamic recovery and recrystallization.
The inverse pole figures of the PM-TiAlMoFe alloy deformed at the condition of 0.001 s−1/700 °C–1000 °C are shown in Figure 12. Breaking and globularization could be observed at the temperature of (α + β) region (Figure 12a,c,e), the grain size obviously increases as deformation temperature increases. The deformation microstructure exhibits distinct preferred orientation (α-0001)/(β-101)/(β-111), which indicates that the preferential deformation will occur along the slip system during hot compression. For titanium alloys, β phase (BCC) has twelve {101} <111> slip systems which are much more than three {0001} <11–20> slip systems in α phase (HCP) in titanium alloy [56], confirming that the workability of the PM-TiAlFeMo alloy is better at a relatively high temperature with a high volume fraction of the β phase.

3.4.2. Effects of Strain Rate on Deformation Microstructure

The deformation microstructure of the PM-TiAlFeMo alloy deformed at the condition of 700 °C/0.001 s−1–1 s−1 (temperature/strain rate) is illustrated in Figure 13. Kinked lamellar α/β phase and equiaxed α could be observed (marked by frame in Figure 13a), which means the microstructure has enough time to spheroidize at a relatively low strain rate (0.001 s−1). The primary α phase is distinctly elongated in Figure 13b, and the elongated α phase is perpendicular to the compressive axis (CA). Furthermore, the elongated α phase becomes thinner, broken, or kinked during deformation when the strain rate is 0.1 s−1 (Figure 13c). It may be interpreted as the increasing dislocation accumulation rate and dislocation density at a relatively high strain rate [23]. When the strain rate increases to 1 s−1, a kinked lamellar phase and flow localization could be observed in the deformation microstructure (Figure 13d). This coincides with the analysis of a deformation mechanism in Section 3.1.1, where the flow localization and kinking may occur at a relatively high strain rate. Similar results were observed in the relevant literature [41], indicating a partial high heat during deformation and low thermal conductivity of the alloy could result in inhomogeneous deformation. Furthermore, the high strain rate is unfavorable to the evolution from the substructure to stable recrystallized grains formed by dislocation accumulation, which also leads to inhomogeneous deformations (e.g., kinking or flow localization). It is consistent with the high η at a relatively low temperature/high strain rate in the processing map, which often corresponds to the unfavorable area for hot deformation.

4. Conclusions

The thermal activation energy (Q) of the PM-TiAlFeMo alloy is 413.25 kJ/mol. The relationship between the strain rate, temperature and peak value of the flow stress could be described by a hyperbolic sinh Arrhenius equation, which has good accuracy in describing the hot deformation behavior of the PM-TiAlFeMo alloy:
ε   ˙ =   exp ( 39 . 84 ) [ sin h ( 0 . 0068 σ ) ] 6.85 exp ( - 413 . 25 / R T )
The PM-TiAlFeMo alloy is suitable to be hot processed at the condition of (900–1000 °C/0.001–0.1 s−1), which is attributed to the dynamic recovery and dynamic recrystallization occurring in this range. However, the flow localization caused by inhomogeneous deformation makes the area of (700–850 °C/0.01–10 s−1) unsuitable for performing hot deformation.
The flow behavior of the PM-TiAlFeMo alloy is significantly affected by the deformation temperature and strain rate. The mechanisms of flow softening at relatively low temperature (below Tβ) are mainly kinking, breaking and dynamic globularization. Dynamic recovery and recrystallization are dominant mechanisms at relatively high temperatures. Kinking and flow localization occur at relatively high strain rates, while dynamic globularizations have sufficient time to nucleate and grow at relatively low strain rates.

Author Contributions

Writing—original draft, visualization, D.P.; data curation, D.P. and R.X.; investigation, D.P. and R.X.; writing—review and editing, D.P., B.L., J.Q. and C.L.; conceptualization, methodology, resources, project administration and supervision, B.L., J.Q. and C.L. All authors have read and agreed to the published version of the manuscript.

Funding

This research was funded by the Financial Supports of National Natural Science Foundation of China (51604112), Natural Science Foundation of Hunan Province of China (2017JJ3089), Project of Huxiang Young Talents (2019RS2067), Programs for Science and Technology Development in Strategic Emerging Industries and Major Scientific and Technological Achievements Transformation of Hunan Province(2019GK4048).

Data Availability Statement

The data presented in this study are available from the corresponding author on reasonable request. The data are not publicly available due to privacy.

Conflicts of Interest

The authors declare no conflict of interest.

References

  1. Zakaria, M.Y.; Sulong, A.B.; Muhamad, N.; Raza, M.R.; Ramli, M.I. Incorporation of wollastonite bioactive ceramic with titanium for medical applications: An overview. Mater. Sci. Eng. C 2019, 97, 884–895. [Google Scholar] [CrossRef]
  2. Fellah, M.; Hezil, N.; Hussein, M.A.; Abdul Samad, M.; Touhami, M.Z.; Montagne, A.; Iost, A.; Obrosov, A.; Weiss, S. Preliminary investigation on the bio-tribocorrosion behavior of porous nanostructured β-type titanium based biomedical alloys. Mater. Lett. 2019, 257, 126755. [Google Scholar] [CrossRef]
  3. Meng, Q.; Bai, C.; Xu, D. Flow behavior and processing map for hot deformation of ATI425 titanium alloy. J. Mater. Sci. Technol. 2018, 34, 679–688. [Google Scholar] [CrossRef]
  4. Liang, Z.; Miao, J.; Brown, T.; Sachdev, A.K.; Williams, J.C.; Luo, A.A. A low-cost and high-strength Ti-Al-Fe-based cast titanium alloy for structural applications. Scr. Mater. 2018, 157, 124–128. [Google Scholar] [CrossRef]
  5. Low, C.T.J.; Wills, R.G.A.; Walsh, F.C. Electrodeposition of composite coatings containing nanoparticles in a metal deposit. Surf. Coat. Technol. 2006, 201, 371–383. [Google Scholar] [CrossRef]
  6. Tseluikin, V.; Vasilenko, E. Electrodeposition and properties of composite coatings based on nickel. Russ. J. Appl. Chem. 2011, 84. [Google Scholar] [CrossRef]
  7. Walsh, F.C.; Ponce de Leon, C. A review of the electrodeposition of metal matrix composite coatings by inclusion of particles in a metal layer: An established and diversifying technology. Trans. IMF 2014, 92, 83–98. [Google Scholar] [CrossRef] [Green Version]
  8. Esteban, P.G.; Ruiz-Navas, E.M.; Bolzoni, L.; Gordo, E. Low-cost titanium alloys? Iron may hold the answers. Met. Powder Rep. 2008, 63, 24–27. [Google Scholar] [CrossRef]
  9. Bolzoni, L.; Ruiz-Navas, E.M.; Gordo, E. Quantifying the properties of low-cost powder metallurgy titanium alloys. Mater. Sci. Eng. A 2017, 687, 47–53. [Google Scholar] [CrossRef]
  10. Amherd Hidalgo, A.; Frykholm, R.; Ebel, T.; Pyczak, F. Powder Metallurgy Strategies to Improve Properties and Processing of Titanium Alloys: A Review. Adv. Eng. Mater. 2017, 19, 1600743. [Google Scholar] [CrossRef]
  11. Liu, Y.; Chen, L.F.; Tang, H.P.; Liu, C.T.; Liu, B.; Huang, B.Y. Design of powder metallurgy titanium alloys and composites. Mater. Sci. Eng. A 2006, 418, 25–35. [Google Scholar] [CrossRef]
  12. Wei, W.; Liu, Y.; Zhou, K.; Huang, B. Effect of Fe addition on sintering behaviour of titanium powder. Powder. Metall. 2003, 46, 246. [Google Scholar] [CrossRef]
  13. Alshammari, Y.; Manogar, B.; Raynova, S.; Yang, F.; Bolzoni, L. Behaviour of novel low-cost blended elemental Ti–5Fe-xAl alloys fabricated via powder metallurgy. J. Mech. Behav. Biomed. Mater. 2020, 110, 103865. [Google Scholar] [CrossRef]
  14. Sjafrizal, T.; Dehghan-Manshadi, A.; Kent, D.; Yan, M.; Dargusch, M.S. Effect of Fe addition on properties of Ti–6Al-xFe manufactured by blended elemental process. J. Mech. Behav. Biomed. Mater. 2020, 102, 103518. [Google Scholar] [CrossRef]
  15. Abdelrhman, Y.; Gepreel, M.A.H.; Kobayashi, S.; Okano, S.; Okamoto, T. Biocompatibility of new low-cost (α + β)-type Ti-Mo-Fe alloys for long-term implantation. Mater. Sci. Eng. C 2019, 99, 552–562. [Google Scholar] [CrossRef]
  16. Wang, C.H.; Yang, C.D.; Liu, M.; Li, X.; Hu, P.F.; Russell, A.M.; Cao, G.H. Martensitic microstructures and mechanical properties of as-quenched metastable β-type Ti–Mo alloys. J. Mater. Sci. 2016, 51, 6886–6896. [Google Scholar] [CrossRef]
  17. Qiu, J.W.; Liu, Y.; Liu, B.; Liu, Y.B.; Wang, B.; Ryba, E.; Tang, H.P. Optimizing the hot-forging process parameters for connecting rods made of PM titanium alloy. J. Mater. Sci. 2012, 47, 3837–3848. [Google Scholar] [CrossRef]
  18. Yan, Z.; Chen, F.; Cai, Y.; Yin, J.; Zheng, Y. Preparation and properties of Ti–4.5Al–6.8Mo–1.5Fe alloy by high-velocity compaction. Powder Technol. 2013, 246, 345–350. [Google Scholar] [CrossRef]
  19. Liu, Y.; Chen, L.; Wei, W.; Tang, H.; Liu, B.; Huang, B. Improvement of Ductility of Powder Metallurgy Titanium Alloys by Addition of Rare Earth Element. J. Mater. Sci. Technol. 2006, 22, 465–469. [Google Scholar] [CrossRef]
  20. Xu, R.; Liu, B.; Yan, Z.; Chen, F.; Guo, W.; Liu, Y. Low-cost and high-strength powder metallurgy Ti–Al–Mo–Fe alloy and its application. J. Mater. Sci. 2019, 54, 12049–12060. [Google Scholar] [CrossRef]
  21. Jia, W.; Zeng, W.; Liu, J.; Zhou, Y.; Wang, Q. On the influence of processing parameters on microstructural evolution of a near alpha titanium alloy. Mater. Sci. Eng. A 2011, 530, 135–143. [Google Scholar] [CrossRef]
  22. Zhao, Q.; Yang, F.; Torrens, R.; Bolzoni, L. Comparison of hot deformation behaviour and microstructural evolution for Ti-5Al-5V-5Mo-3Cr alloys prepared by powder metallurgy and ingot metallurgy approaches. Mater. Des. 2019, 169, 107682. [Google Scholar] [CrossRef]
  23. Han, Y.; Zeng, W.; Qi, Y.; Zhao, Y. The influence of thermomechanical processing on microstructural evolution of Ti600 titanium alloy. Mater. Sci. Eng. A 2011, 528, 8410–8416. [Google Scholar] [CrossRef]
  24. Hajari, A.; Morakabati, M.; Abbasi, S.M.; Badri, H. Constitutive modeling for high-temperature flow behavior of Ti-6242S alloy. Mater. Sci. Eng. A 2017, 681, 103–113. [Google Scholar] [CrossRef]
  25. Li, C.; Cui, W.F.; Zhang, Y.S. Surface self-nanocrystallization of alpha plus beta titanium alloy by surface mechanical grinding treatment. Met. Mater.-Int. 2017, 23, 512–518. [Google Scholar] [CrossRef]
  26. Su, Z.; Wan, L.; Sun, C.; Cai, Y.; Yang, D. Hot deformation behavior of AZ80 magnesium alloy towards optimization of its hot workability. Mater. Charact. 2016, 122, 90–97. [Google Scholar] [CrossRef]
  27. Zhou, X.; Wang, K.; Lu, S.; Li, X.; Feng, R.; Zhong, M. Flow behavior and 3D processing map for hot deformation of Ti-2.7Cu alloy. J. Mater. Res. Technol. 2020, 9, 2652–2661. [Google Scholar] [CrossRef]
  28. Han, Y.; Zeng, W.; Qi, Y.; Zhao, Y. Optimization of forging process parameters of Ti600 alloy by using processing map. Mater. Sci. Eng. A 2011, 529, 393–400. [Google Scholar] [CrossRef]
  29. Chen, W.; Zeng, W.; Xu, J.; Zhou, D.; Wang, S.; He, S. Deformation behavior and microstructure evolution during hot working of Ti60 alloy with lamellar starting microstructure. J. Alloys Compd. 2019, 792, 389–398. [Google Scholar] [CrossRef]
  30. Balasundar, I.; Raghu, T.; Kashyap, B.P. Modeling the hot working behavior of near-α titanium alloy IMI 834. Prog. Nat. Sci. Mater. Int. 2013, 23, 598–607. [Google Scholar] [CrossRef] [Green Version]
  31. Ma, F.; Shi, Z.; Liu, P.; Li, W.; Liu, X.; Chen, X.; He, D.; Zhang, K.; Pan, D.; Zhang, D. Strengthening effect of in situ TiC particles in Ti matrix composite at temperature range for hot working. Mater. Charact. 2016, 120, 304–310. [Google Scholar] [CrossRef]
  32. Zhang, W.-D.; Liu, Y.; Wu, H.; Song, M.; Zhang, T.-Y.; Lan, X.-D.; Yao, T.-H. Elastic modulus of phases in Ti–Mo alloys. Mater. Charact. 2015, 106, 302–307. [Google Scholar] [CrossRef]
  33. Zong, Y.Y.; Shan, D.B.; Lu, Y. Microstructural evolution of a Ti-4.5Al-3Mo-1V alloy during hot working. J. Mater. Sci. 2006, 41, 3753–3760. [Google Scholar] [CrossRef]
  34. Semiatin, S.L.; Seetharaman, V.; Weiss, I. Flow behavior and globularization kinetics during hot working of Ti–6Al–4V with a colony alpha microstructure. Mater. Sci. Eng. A 1999, 263, 257–271. [Google Scholar] [CrossRef]
  35. Ma, X.; Zeng, W.; Tian, F.; Zhou, Y. The kinetics of dynamic globularization during hot working of a two phase titanium alloy with starting lamellar microstructure. Mater. Sci. Eng. A 2012, 548, 6–11. [Google Scholar] [CrossRef]
  36. Sellars, C.M.; Tegart, W.J.M. Hot Workability. Int. Mater. Rev. 1972, 17, 1–24. [Google Scholar] [CrossRef]
  37. Shafaat, M.A.; Omidvar, H.; Fallah, B. Prediction of hot compression flow curves of Ti–6Al–4V alloy in α + β phase region. Mater. Des. 2011, 32, 4689–4695. [Google Scholar] [CrossRef]
  38. Ghavam, M.H.; Morakabati, M.; Abbasi, S.M.; Badri, H. Flow behavior modeling of IMI834 titanium alloy during hot tensile deformation. Trans. Nonferrous Met. Soc. China 2015, 25, 748–758. [Google Scholar] [CrossRef]
  39. Peng, W.; Zeng, W.; Wang, Q.; Yu, H. Comparative study on constitutive relationship of as-cast Ti60 titanium alloy during hot deformation based on Arrhenius-type and artificial neural network models. Mater. Des. 2013, 51, 95–104. [Google Scholar] [CrossRef]
  40. Dehghan, H.; Abbasi, S.M.; Momeni, A.; Karimi Taheri, A. On the constitutive modeling and microstructural evolution of hot compressed A286 iron-base superalloy. J. Alloys Compd. 2013, 564, 13–19. [Google Scholar] [CrossRef]
  41. Liu, B.; Li, Y.P.; Matsumoto, H.; Liu, Y.B.; Liu, Y.; Chiba, A. Thermomechanical characterization of P/M Ti–Fe–Mo–Y alloy with a fine lamellar microstructure. Mater. Sci. Eng. A 2011, 528, 2345–2352. [Google Scholar] [CrossRef]
  42. Momeni, A.; Abbasi, S.M. Effect of hot working on flow behavior of Ti–6Al–4V alloy in single phase and two phase regions. Mater. Des. 2010, 31, 3599–3604. [Google Scholar] [CrossRef]
  43. Zhao, Z.L.; Li, H.; Fu, M.W.; Guo, H.Z.; Yao, Z.K. Effect of the initial microstructure on the deformation behavior of Ti60 titanium alloy at high temperature processing. J. Alloys Compd. 2014, 617, 525–533. [Google Scholar] [CrossRef]
  44. Briottet, L.; Jonas, J.J.; Montheillet, F. A mechanical interpretation of the activation energy of high temperature deformation in two phase materials. Acta Mater. 1996, 44, 1665–1672. [Google Scholar] [CrossRef]
  45. Peng, X.; Guo, H.; Shi, Z.; Qin, C.; Zhao, Z.; Yao, Z. Study on the hot deformation behavior of TC4-DT alloy with equiaxed α + β starting structure based on processing map. Mater. Sci. Eng. A 2014, 605, 80–88. [Google Scholar] [CrossRef]
  46. Shen, G.; Semiatin, S.L.; Altan, T. Investigation of flow stress and microstructure development in non-isothermal forging of Ti-6242. J. Mater. Process. Technol. 1993, 36, 303–319. [Google Scholar] [CrossRef]
  47. Zener, C.; Hollomon, J.H. Effect of Strain Rate Upon Plastic Flow of Steel. J. Appl. Phys. 1944, 15, 22–32. [Google Scholar] [CrossRef]
  48. Mandal, S.; Rakesh, V.; Sivaprasad, P.V.; Venugopal, S.; Kasiviswanathan, K.V. Constitutive equations to predict high temperature flow stress in a Ti-modified austenitic stainless steel. Mater. Sci. Eng. A 2009, 500, 114–121. [Google Scholar] [CrossRef]
  49. Ma, L.; Wan, M.; Li, W.; Shao, J.; Bai, X. Constitutive modeling and processing map for hot deformation of Ti–15Mo–3Al-2.7Nb-0.2Si. J. Alloys Compd. 2019, 808, 151759. [Google Scholar] [CrossRef]
  50. Cai, J.; Li, F.; Liu, T.; Chen, B.; He, M. Constitutive equations for elevated temperature flow stress of Ti–6Al–4V alloy considering the effect of strain. Mater. Des. 2011, 32, 1144–1151. [Google Scholar] [CrossRef]
  51. Wang, F.; Shen, J.; Zhang, Y.; Ning, Y. A Modified Constitutive Model for the Description of the Flow Behavior of the Ti-10V-2Fe-3Al Alloy during Hot Plastic Deformation. Metals 2019, 9, 844. [Google Scholar] [CrossRef] [Green Version]
  52. Pilehva, F.; Zarei-Hanzaki, A.; Ghambari, M.; Abedi, H.R. Flow behavior modeling of a Ti–6Al–7Nb biomedical alloy during manufacturing at elevated temperatures. Mater. Des. 2013, 51, 457–465. [Google Scholar] [CrossRef]
  53. Prasad, Y.V.R.K.; Gegel, H.L.; Doraivelu, S.M.; Malas, J.C.; Morgan, J.T.; Lark, K.A.; Barker, D.R. Modeling of dynamic material behavior in hot deformation: Forging of Ti-6242. Metall. Mater. Trans. A 1984, 15, 1883–1892. [Google Scholar] [CrossRef]
  54. Sen, I.; Kottada, R.S.; Ramamurty, U. High temperature deformation processing maps for boron modified Ti–6Al–4V alloys. Mater. Sci. Eng. A 2010, 527, 6157–6165. [Google Scholar] [CrossRef]
  55. Ding, C.; Shi, Q.; Liu, X.; Zheng, L.; Li, R.; Hang, Z.; Yu, B.; Wu, W. Microstructure and mechanical properties of PM Ti600 alloy after hot extrusion and subsequent annealing treatment. Mater. Sci. Eng. A 2019, 748, 434–440. [Google Scholar] [CrossRef]
  56. Froes, F.H.; Eylon, D. Powder metallurgy of titanium alloys. Int. Mater. Rev. 1990, 35, 162–184. [Google Scholar] [CrossRef]
Figure 1. The microstructure of the as-sintered powder metallurgy (PM)-TiAlFeMo alloy: (a) backscatter scanning in E-beam (BSE) image; (b) EDS analysis; (c) IPF map; (d) phase image. (BSE and IPF are not generated from the same region.)
Materials 14 00836 g001
Figure 2. True stress–true strain curves of the PM-TiAlFeMo alloy deformed at different temperatures and strain rates: (a) 700 °C; (b) 800 °C; (c) 900 °C; and (d) 1000 °C.
Materials 14 00836 g002
Figure 3. Flow softening degree (∆σ = σm − σ0.65) of the PM-TiAlFeMo alloy deformed at different temperatures and strain rates.
Materials 14 00836 g003
Figure 4. Relationship between the peak stress and strain rate of the PM-TiAlFeMo alloy: (a) ln ε ˙ –lnσ; (b) ln ε ˙ –σ; and (c) ln ε ˙ –ln(sinh(ασ)).
Materials 14 00836 g004
Figure 5. Linear regression analysis of ln[sinh(ασ)]–1/T.
Materials 14 00836 g005
Figure 6. Linear regression analysis of lnZ–ln[sinh(ασ)].
Materials 14 00836 g006
Figure 7. Relationship between the material constants and true strain of the PM-TiAlFeMo alloy by polynomial fitting: (a) α; (b) n; (c) lnA; and (d) Q.
Materials 14 00836 g007
Figure 8. Comparison between the predicted data and experimental data of flow stress at different temperatures and strain rates: (a) 700 °C; (b) 800 °C; (c) 900 °C; and (d) 1000 °C.
Materials 14 00836 g008
Figure 9. 3D power dissipation efficiency map of the PM-TiAlFeMo alloy.
Materials 14 00836 g009
Figure 10. Processing map of the PM-TiAlFeMo alloy.
Materials 14 00836 g010
Figure 11. Microstructures of the PM-TiAlFeMo alloy deformed at the strain rate of 0.001 s−1: (a) 700 °C; (b) 800 °C; (c) 900 °C; and (d) 1000 °C.
Materials 14 00836 g011
Figure 12. IPF maps of the PM-TiAlFeMo alloy deformed at the strain rate of 0.001 s−1: (a,b) 700 °C; (c,d) 800 °C; (e,f) 900 °C; and (g,h) 1000 °C.
Materials 14 00836 g012
Figure 13. Microstructures of the PM-TiAlFeMo alloy deformed at the temperature of 700 °C: (a) 0.001 s−1; (b) 0.01 s−1; (c) 0.1 s−1; and (d) 1 s−1.
Materials 14 00836 g013
Table 1. Detailed information of raw elemental powders.
PowdersPurity (wt.%)O (wt.%)Other Impurity (wt.%)Particle Size, D50 (μm)Producing MethodsProducer
Ti99.744 ± 0.0150.22 ± 0.010.036 ± 0.00567.5 ± 0.2Hydrogenation-dehydrogenationTiTd Metal Materials Co., Ltd., Changsha, China
Al99.718 ± 0.0150.27 ± 0.010.012 ± 0.00521.3 ± 0.2Gas atomization
Fe99.811 ± 0.0150.18 ± 0.010.009 ± 0.00525.3 ± 0.2Deoxidization
Mo99.729 ± 0.0150.26 ± 0.010.011 ± 0.0056.18 ± 0.2Deoxidization
Table 2. Comparison of the value of Q among several similar titanium alloys.
AlloyRefs.Q (kJ/mol)TypeDeformation Temperature (°C)Initial Microstructure
Ti60[43]591Near α900–1000Acicular
IMI834[38]557α + β800–1000Transformed β
Ti-6242S[46]623Near α816–955Lamellar
TiAlFeMoPresent work413.25α + β700–1000Lamellar
Table 3. The fitting results for the coefficients of the polynomial functions.
Subscript of CoefficientMaterial Constants
α (Ex)n (Fx)lnA (Mx)Q (Nx)
00.006167.4027846.65846464.1805
10.0114−9.67458−120.575−687.345
2−0.0541754.39862702.70412179.603
30.13092−150.532−2050.21−5502.86
4−0.09441190.7612683.3957744.687
5−0.00302−89.1704−1279.64−4137.25
Table 4. Comparison of AARE% between the PM-TiAlFeMo alloy and similar alloys.
AlloyRefs.TypeDeformation Temperature
(°C)
Strain Rate
(s−1)
AARE%
IMI834[30]near α850–10600.0003–110.43
Ti-6242S[24]near α850–10000.001–19.98
Ti60[39]near α970–11200.01–108.45
Ti-6Al-4V[50]α + β800–10500.0005–19.06
Ti–6Al–7Nb[52]α + β850–10000.0025–0.255.53
Ti–5Al–2Fe–3MoPresent workα + β700–10000.001–105.21
Publisher’s Note: MDPI stays neutral with regard to jurisdictional claims in published maps and institutional affiliations.

