Abstract
Dust accumulation on the front cover of solar panels is closely linked to location and orientation of photovoltaic (PV) installation. Its build-up depends on the module tilt angle, frequency of precipitation, humidity, wind strength and velocity, as well as grain size. Additionally, soil composition is determined by solar farm surroundings such as local factories, agricultural crops, and traffic. Over time, molecules of atmospheric dust agglomerate on top of each other and cause gradual reduction in generated energy. Manual cleaning techniques are required to restore working conditions of PV installation to their original conditions; however, they are time consuming and may lead to damage of the glass coverage. Therefore, implementing a different approach by utilizing self-cleaning and anti-dust coatings on front covers of module surfaces is thought of as a competitive manner of cleansing. Based on the varying properties of such thin-films, a division was made into hydrophobic, hydrophilic, and anti-dust coatings. In this article, the authors would like to present a comprehensive review of those types of transparent films. Moreover, a few hydrophobic coatings available on the Polish market were analyzed by applying them on glass tiles and covering them with three types of dust.
1. Introduction
Solar energy is the steady growing green energy source with both large companies as well as individual people willing to invest in this market. As the need to reduce carbon footprints is common in our everyday lives, one should not be surprised that photovoltaic establishment tries to mitigate any drawbacks connected to solar farms. One such difficulty is connected to pollutant deposition on photovoltaic (PV) module surfaces, which directly corresponds to the lowered energy yield possible to obtain from installation. Soil build-up progressing over time causes the reduction of the glass transparency of the front module cover [1,2,3]. This, in turn, leads to decreases of solar irradiance reaching semiconductor cells and decrements in current output [4,5,6,7]. Such effects could be partially mitigated if precipitation occurs and washes off a part of the accumulated pollution [8].
The rate of dust accumulation on top of the front glass coverage of PV modules is closely linked to the tilt angle, latitude, and environmental surroundings in the close proximity of solar power sources [9]. The more horizontal the tilt angle, the higher the speed of soil settlement. Additionally, dust molecules tend to gather more at the bottom of PV modules because of gravitational forces dragging them down [10]. Any occurrence of heavy wind and storm or precipitation would likely cause a regain in efficiency [11,12]. On the other hand, frequent sand storms in desert regions negatively impact the power generation of solar energy, as they lead to complete coverage of glass surfaces, with sand almost completely cutting off sun radiation reaching solar cells [13]. Similarly, a sparse amount of rain or high levels of humidity cause a formation of a cement-like layer, which dries into to a hard shell on the glass surface [9].
Dust properties, namely, the size, shape, mass, and composition, depend on the location of solar power plants. They can also be influenced by nearby industry, heavy traffic or agricultural crops [14]. The relations found between soiling tempo and particle size is that for grains with a smaller diameter, the loss of glass transmission is greater as such molecules can be stacked closely and block irradiance more efficiently [10].
Manufacturers handling worldwide sales outline in documents concerning conservation of PV modules that it is mandatory to clean them manually [15,16,17,18,19]. It may help if the installation is small; however, this can hardly be an optimal solution for solar plants consisting of dozens or more devices. Not only is it time-consuming but wasting of water ought to be avoided if possible, given much more frequent and prolonged periods of drought.
Addressing this issue, alternative cleaning methods are developed, namely, electrostatic, mechanical, and surface enhancement [20]. Electrostatic cleaning utilizes standing and traveling waves to expel dust from electrostatic fields. Standing waves move the dust downwards or upwards, and horizontal movement is achieved by traveling waves. Mechanical cleaning offers four methods—robotic, air-blowing, water-blowing, and ultrasonic. Blowing air and water also result in reducing the temperature of PV surfaces. Lastly, surface enhancement revolves around introducing an additional layer on top of the front glass coverage. It utilizes nanotechnology in order to design hydrophobic and hydrophilic thin films. Hydrophobic coatings allow water drops to roll down and carry away dirt residue. Hydrophilic ones reduce the amount of dirt via photo-catalytic reactions. This article aims at familiarizing the reader with the overview of the current state of knowledge in the field of thin films developed specifically for usage in the photovoltaic industry. Additionally, experimental analysis of a few hydrophobic coatings available on the Polish market was performed.
2. Hydrophilic Coatings
Hydrophilic coatings are characterized by their high surface energy. After spraying them with water they distribute it evenly over the whole surface and thus clean it. They are oftentimes based on silica particles [21]; however, the photo-catalytic effect may also be incorporated by utilizing titanium or wolfram [21,22].
Hee et al. analyzed the effect of dust settlement on glass slides without any coverage and discovered their transmission was reduced by 3% over the course of one month despite heavy rainfall occurring in Singapore [23]. The experiment was carried out for four months and after an initial steep linear decrease in glass transparency, this phenomena progressed more slowly for a day number over 32 (Figure 1). They added another conclusion such that the rate of transmission reduction was faster at the bottom of the glass tile, meaning the debris after precipitation tended to gather there due to gravitational force.
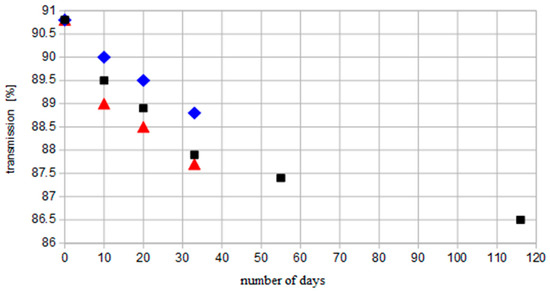
Figure 1.
Graph of the average glass plate transmission as a function of the number of days (■) and transmission of the top (♦) and bottom (▼) part of the glass plate (based on: [23]).
Later on, glass tiles were covered by a layer of TiO2 intended as a self-cleaning coating. Two different thickness levels were implemented—40 nm and 60 nm. Although a slower reduction of transmittance was observed for glass tile with 60 nm coating, it also had much lower initial transparency (Figure 2). The mitigation of dust settlement was hardly compensated in this situation, since the TiO2 layer negatively impacted glass transmittance.
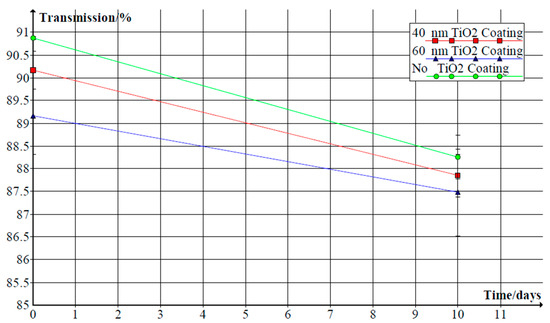
Figure 2.
Transmittance spectrum for uncoated glass surface, pure TiO2 films, and TiO2/SiO2 composite films after placing them in a furnace at varying temperatures [23].
Introducing composites of TiO2/SiO2 was therefore proposed. Varying molar rates were tested by de Jesus, and the conclusion was drawn that adding molecules of silicon improved the transmittance of glass [24]. However, as is visible from Figure 3, the lesser the amount of titanium in the complex, the closer the resemblance of the transmittance function between the bare glass plate and the covered one.
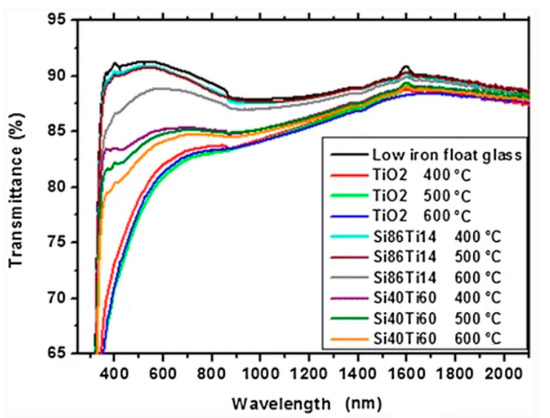
Figure 3.
Transmittance spectrum for uncoated glass surface, pure TiO2 films, and TiO2/SiO2 composite films after placing them in furnaces at varying temperatures [24].
Another utilization of hydrophilic properties included coatings prepared by Jang [25]. They were made out of SiO2 nanoparticle layers and a silica binder film between the nanoparticles and protected mirror surface. They showed complete water spreading, with a water contact angle (WCA) between 57.5° and 4.8°, and no negative impact on glass transparency was observed. Afterwards, they were subjected to external conditions for 234 days. The mirror with the lowest WCA layer experienced the least reduction in reflectance overall, but the difference between values for all mirrors was clearly visible after some exposure time, over at least 100 days (Figure 4).
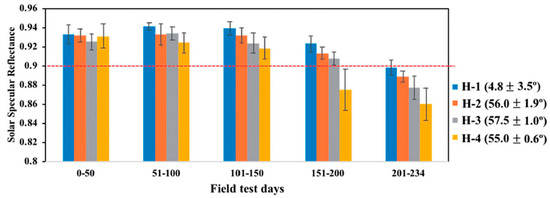
Figure 4.
Solar specular reflectance as a function of time for mirrors with hydrophilic coatings with varying water contact angles (4.8°, 55°, 56°, 57.5°) [25].
Nabemoto proposed a photo-catalytic anti-soiling and hydrophilic layer that was obtained by modifying WO3 with partially hydrolyzed tetra-ethyl orthosilicate [26]. Its effect was observed on a surface of polymethylmethacrylate (PMMA), since such material is used as Fresnel lenses for concentrator photovoltaics. The difference was significant, as the reduction in the measured current output in the concentrator photovoltaic system was 9.6% without additional coating and 3.3% with coating.
The same approach was analyzed by another group from Japan. However, Sueto decided to further expand the number of added layers [27], and so PMMA was first spin-coated with an acrylic urethane capping layer, then with a nanograded intermediate layer, and finally with enhanced WO3 as a photocatalytic layer. It helped to shield PMMA from photocatalytic properties and to reduce reflectivity. The measured mass of dust agglomerated on the surface without coating exceeded 0.01 g, whereas for PMMA with the hydrophilic layer, it oscillated around 0.005 g.
Testing performed on the PV modules was done by Canete [28]. A compound made of hybrid polymer and metal-oxide nanoparticles was flow-coated on the surface. Interestingly, initial power output was 1–1.5% higher after depositing this coating, suggesting better anti-reflectivity. Current–voltage characteristics were measured through one year, and modules were constantly kept outside; thus, they were subjected to real-time atmospheric conditions. Current values are presented in Figure 5 as a function of time, with additional insight into rainfall statistics. In the dry months of summer, the greatest difference between modules with and without coating was observed, corresponding to approximately 5%.
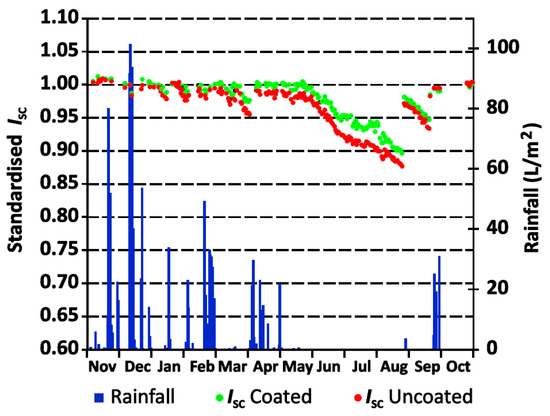
Figure 5.
Short-circuit current values over the course of 12 months with daily rainfall data [28].
3. Hydrophobic Coatings
Hydrophobic coatings exhibit a high water contact angle, over 90°, as well as low surface energy. As a result, they encourage dew and rain to form into spheres, causing such droplets to slide off of the surface and carry off any pollutant residue [29,30,31].
The approach utilizing SiO2 matrix with two sized particles (8 nm, 60 nm) was proposed by Bahattab [32]. After applying it onto a glass substrate, it was stated that transparency increased by a few percentile points. Annual exposure to the outside conditions in Saudi Arabia caused a 13% transmittance reduction for glass tiles with hydrophobic coatings and 19% for the surface without any film. The blowing of compressed air proved to be enough to almost completely clean the coated surface, since the transparency loss was 2%. However, it was not as successful for the other glass, as transparency loss reached 8%. Highly transparent silica nanoparticles synthesized with the addition of tetraethyl orthosilicate and ethanol were the aims of study carried out by Polizos [33]. They were deposited on top of the glass surface and left under external conditions for three months. Afterwards, it was stated that the transmittance of the uncoated tile was around 20–25% lower.
Transparent hydrophobic coatings based on silica sol (SS) and SiO2 nanoparticles were proposed by Quan [34]. Their hydrophobic character could be adjusted by changing the x number of (SS-SiO2)x. Increasing the number x also resulted in heightened transmittance, and it was explained by the formation of nanovoids limiting reflection: x = 1 or x = 3 thin layers exhibit similar transparency as bare glass. For x > 5, transmittance rises a few percentile points and the sliding angle plummets. Bare glass and glass enhanced with thin layers were inspected after artificially blowing dust over each surface. From Figure 6, the conclusion can be drawn that the magnitude of the hydrophobic effect does not greatly impact the reduction in transmittance after polluting surfaces. Bare glass faces more than 1.5% transparency reduction and for glass with coatings, this number is less than 0.6%. Low surface energy and the course structure of such films is enough to hinder particle adhesion.
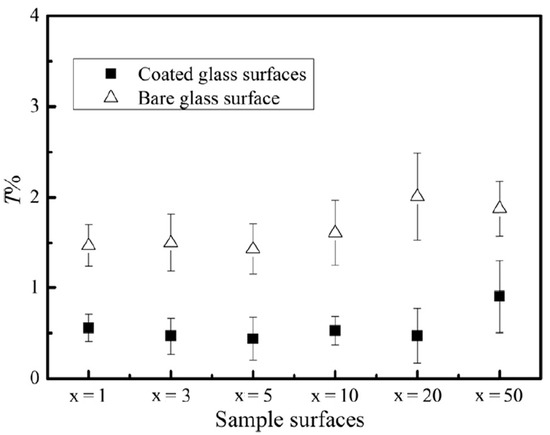
Figure 6.
Transmittance loss for bare glass surface (Δ) and glass with (SS-SiO2)x coating (■) [34].
The SiO2 nanoparticle layer and silica binder film between nanoparticles analyzed by Jang could also be altered to exhibit hydrophobic properties [25]. Additional thermal vapor deposition of fluorosilane over this thin film performed at a temperature of 120 °C set the water contact angle value between 111° and 165°. Afterwards, the testing surfaces were placed outside for 234 days, where mirror with the highest WCA layer outperformed other coatings (Figure 7).
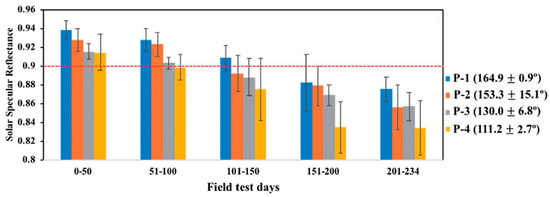
Figure 7.
Solar specular reflectance as a function of time for mirrors with hydrophobic coatings with varying water contact angles (164.9°, 153.3°, 130°, 111.2°) [25].
In another studies of de Jesus, SiO2 sol-gel treated with hexamethyldisilazane (referred to as SM) resulted in a hydrophobic thin film [35]. In comparison with their previous TiO2/SiO2 composite, it had much higher transparency, which is even superior to the bare glass (Figure 8). A soiling test was performed, but it was concluded that all glass plates with additional layers performed similarly with regards to dust adhesion and were easily cleaned with water.
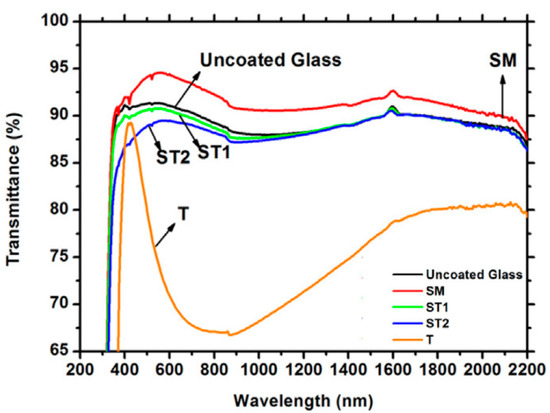
Figure 8.
Transmittance spectrum for uncoated glass plate and glass with the layer of hydrophobic film (SM), hydrophilic Si86Ti14 (ST1), hydrophilic Si40Ti60 (ST2), and pure TiO2 (T) [35].
4. A Study of Hydrophobic Coatings Available on the Polish Market
An additional experiment concerning hydrophobic coatings provided by certified Polish companies has been carried out on nine identical glass plates sized 0.13 m × 0.18 m. Each plate was cleaned with isopropyl alcohol, and then 2 mm of the liquid substance was sprayed directly on the surface and evenly distributed with a clean cloth. One glass was kept clean and without any coating for the comparative analysis. Table 1 contains names of applied products with corresponding glass plate numbers. Price conversion from PLN to USD was calculated via the pl.investing.com website on January 24th.

Table 1.
Glass plate numbering and corresponding reference plate without coating (1) as well as plates with hydrophobic coatings (2–9), with information about the manufacturer.
Lighting intensity was measured with the aid of an luxmeter with catalog number AB-8809A manufactured by Abatronic company, that was placed behind the glass plate in accordance with Figure 9.
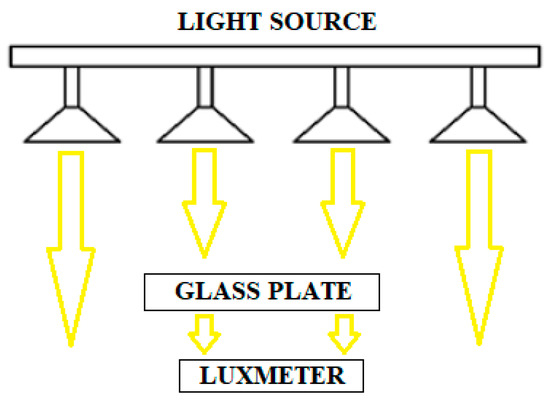
Figure 9.
Illuminance measurement layout carried out by an Abatronic luxmeter.
Firstly, illuminance values for clean glass plates were gathered. Further consecutive tests involved obtaining the lighting intensity for different pollutant types and layers of dust. Three various soils, later referred to as 1, 2, and 3, with four dust densities—4.3, 8.5, 12.8, and 21.4 g/m2—were deposited on each glass plate to calculate normalized illuminance for clean glass plates (1) and normalized illuminance after soil adhesion (2).
Every soil type applied in artificial dust experiments has been listed in Table 2. Soil 1 was taken directly from roads in the vicinity of Chemistry building, on Gdansk University of Technology (GUT) campus. The size of its grains differs, as some are much smaller with a diameter of 0.2 mm, whereas others reach around 0.45 mm. Soils 2 and 3 were gathered from sand beach areas in the close proximity of a walking pier and tram loop, both located in Gdańsk Brzezno district. They are much more uniform concerning grain size; for soil 2, the average diameter falls in the range of 0.23–0.36 mm and for soil 3, it is 0.22–0.33 mm.

Table 2.
Numbering of soil samples collected from photovoltaic modules, laboratory hall, and three various locations in Gdansk.
5. Results and Discussion
Figure 10 presents the normalized illuminance for clean glass plates with respect to light intensity in the laboratory hall that oscillated around 330 lux at the beginning of the experiment. It should be noted that all of the glass plates caused an approximate 10% light intensity decrease, regardless of whether they were covered with coating, as this is attributed to transmittance reduction caused by the glass itself. Glass covered with Eco hydrophobic impregnate exhibited slightly lower illuminance loss than other slides with coatings; however, differences between the light intensity calculated between each plate were minimal and did not exceed 1% with regards to glass tile 6. Therefore, it may be stated that hydrophobic surface enhancement leads to a slight decrease of transparency and could be applied to photovoltaic modules.
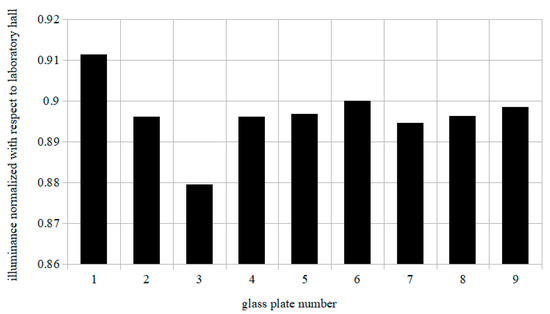
Figure 10.
Illuminance measurement layout carried out by an Abatronic AB-8809A luxmeter.
Results from further analysis carried out for three pollutant types and four different surface densities of dust are presented in Figure 11. Normalization was applied with regards to the clean glass plate 1, without hydrophobic coating, which corresponds to value 1. Such an approach enabled coating type analysis of transmittance losses for pollutant-covered glass. For every amount of soil there was a slight drop in light intensity passing through slides, and lower amount of soil did seem to have a positive effect in regaining some of the transparency. Smaller values of dust densities provided some level of difference in illuminance between various pollutant types; however, it never exceeded 1%.
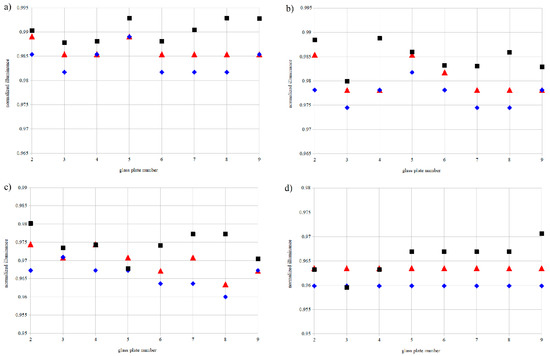
Figure 11.
Normalized illuminance for glass plates polluted with soil 1 (■), soil 2 (♦), and soil 3 (▼) at different surface densities: (a) 4.3 g/m2, (b) 8.5 g/m2, (c) 12.8 g/m2, (d) 17.1 g/m2.
6. Conclusions
Decreasing the efficiency of photovoltaic modules caused by the deposition of pollutants on their surface is a significant problem, causing the reduction of generated energy, and thus the decrease of economic viability. An alternative approach to manual cleaning is modification of the cover material and implementing self-cleaning films on glass. It would be useful for application in PV installations on both a large scale and a small scale.
A general conclusion can be drawn from the presented literature review that glass transparency is not impacted, irrespective of if such a coating is hydrophilic or hydrophobic. This, however, is observed for research carried out at an especially small scale, as it was performed under laboratory conditions. Some negative impact on the transparency value was noted when taking into consideration coatings provided by local companies. It is recommended to ask manufacturers for providing details of their product—namely, if they performed glass transmittance analysis before and after thin film application. If such evaluation is available, prosumers are able to choose in full awareness the product with the best possible properties.
Author Contributions
Conceptualization, E.K.-R.; methodology, E.K.-R.; software, M.R.; validation, E.K.-R.; formal analysis, E.K.-R.; investigation, M.R.; resources, E.K.-R.; data curation, M.R.; writing-original draft preparation, M.R.; writing-review and editing, E.K.-R.; visualization, M.R.; supervision, E.K.-R.; project administration, E.K.-R.; funding acquisition, E.K.-R. All authors have read and agreed to the published version of the manuscript.
Funding
This research received no external funding.
Institutional Review Board Statement
Not applicable.
Informed Consent Statement
Not applicable.
Data Availability Statement
The data presented in this study are available on request from the corresponding author.
Conflicts of Interest
The authors declare no conflict of interest.
References
- Al-Hasan, A. A new correlation for direct beam solar radiation received by photovoltaic panel with sand dust accumulated on its surface. Sol. Energy 1998, 63, 323–333. [Google Scholar] [CrossRef]
- Elminir, H.K.; Ghitas, A.E.; Hamid, R.; El-Hussainy, F.; Beheary, M.; Abdel-Moneim, K.M. Effect of dust on the transparent cover of solar collectors. Energy Convers. Manag. 2006, 47, 3192–3203. [Google Scholar] [CrossRef]
- Beattie, N.S.; Moir, R.S.; Chacko, C.; Buffoni, G.; Roberts, S.H.; Pearsall, N.M. Understanding the effects of sand and dust accumulation on photovoltaic modules. Renew. Energy 2012, 48, 448–452. [Google Scholar] [CrossRef]
- Al-Hasan, A.; Ghoneim, A.A. A new correlation between photovoltaic panels efficiency and amount of sand dust accumulated on their surface. Int. J. Sustain. Energy 2005, 24, 187–197. [Google Scholar] [CrossRef]
- Rao, A.; Pillai, R.; Mani, M.; Ramamurthy, P. Influence of dust deposition on photovoltaic panel performance. Energy Procedia 2013, 54, 690–700. [Google Scholar] [CrossRef]
- Aïssa, B.; Isaifan, R.J.; Madhavan, V.E.; Abdallah, A.A. Structural and physical properties of the dust particles in Qatar and their influence on the PV panel performance. Sci. Rep. 2016, 6, 31467. [Google Scholar] [CrossRef]
- Shi, C.; Yu, B.; Liu, D.; Wu, Y.; Li, P.; Chen, G.; Wang, G. Effect of high-velocity sand and dust on the performance of crystalline silicon photovoltaic modules. Sol. Energy 2020, 206, 390–395. [Google Scholar] [CrossRef]
- Yadav, S.; Bajpai, U. Variation in the performance of solar photovoltaic power plant due to climatic parameters in composite climatic zone. IJETER 2017, 5, 67–72. [Google Scholar]
- Khodakaram-Tafti, A.; Yaghoubi, M. Experimental study on the effect of dust deposition on photovoltaic performance at various tilts in semi-arid environment. Sustain. Energy Technol. Assess. 2020, 42, 100822. [Google Scholar] [CrossRef]
- Abderrezek, M.; Fathi, M. Experimental study of the dust effect on photovoltaic panels’ energy yield. Sol. Energy 2017, 142, 308–320. [Google Scholar] [CrossRef]
- Gholami, A.; Saboonchi, A.; Alemrajabi, A.A. Experimental study of factors affecting dust accumulation and their effects on the transmission coefficient of glass solar applications. Renew. Energy 2017, 112, 466–473. [Google Scholar] [CrossRef]
- Styszko, K.; Jaszczur, M.; Teneta, J.; Hassan, Q.; Burzyńska, P.; Marcinek, E.; Łopian, N.; Samek, L. An analysis of the dust deposition on solar photovoltaic modules. Environ. Sci. Pollut. Res. 2019, 26, 8393–8401. [Google Scholar] [CrossRef]
- Abdeen, E.; Orabi, M.; Hasaneen, E.S. Optimul tilt angle for photovoltaic system in desert environment. Sol. Energy. 2017, 155, 267–280. [Google Scholar] [CrossRef]
- Jaszczur, M.; Teneta, J.; Styszko, K.; Hassan, Q.; Burzyńska, P.; Marcinek, E.; Łopian, N. The field experiments and model of the natural dust deposition effects on photovoltaic module efficiency. Environ. Sci. Pollut. Res. Int. 2019, 26, 8402–8417. [Google Scholar] [CrossRef]
- LONGi Solar Technology Co., LTD. Installation Manual for LONGi Solar PV Modules, V03. Available online: https://www.tim.pl/fileuploader/download/download/?d=1&file=GLOWNA%2F0001%2F000%2F13%2F628%2F65%2F0001_00013_62865_8.pdf (accessed on 24 January 2021).
- JA Solar Holdings Co., LTD. JA Solar PV Modules Installation Manual, Regular Modules. Available online: https://www.jasolar.com.cn/uploadfile/2019/0129/20190129030900765.pdf (accessed on 24 January 2021).
- Aleo Solar GmbH. Quick Referance Manual for the Aleo Modules. Quick Reference Manual Rel. 4.2, 08/2015, en-GB-DE (1) JD00000 10-EN. Available online: https://www.aleo-solar.com/app/uploads/sites/7/2016/02/quick-reference-manual_-V4.2.pdf (accessed on 24 January 2021).
- Chint Solar (Zhejiang) Co., LTD. Crystalline Silicon PV Module Installation Manual. Available online: http://www.chint.com/zh/upload/data/201910-31/150138418100001646.pdf (accessed on 21 January 2021).
- SANYO Electric Co., LTD. Panasonic. General Installation Manual. Photovoltaic Module HITTM. IME002-0918-2. Available online: https://eu-solar.panasonic.net/cps/rde/xbcr/solar_en/2019_VBHNxxxSJ25_40_46_47_installation_manual_EN.pdf (accessed on 21 January 2021).
- Sarver, T.; Al-Qaraghuli, A.; Kazmerski, L.L. A comprehensive review of the impact of dust on the use of solar energy: History, investigations, results, literature, and mitigation approaches. Renew. Sust. Energ. Rev. 2013, 22, 698–733. [Google Scholar] [CrossRef]
- Aranzabe, E.; Azpitarte, I.; Fernández-García, A.; Argüelles-Arízcun, D.; Pérez, G.; Ubach, J.; Sutter, F. Hydrophilic anti-soiling coating for improved efficiency of solar reflectors. AIP Conf. Proc. 2018, 2033, 220001. [Google Scholar]
- Atkinson, C.; Sansom, C.L.; Almond, H.J.; Shaw, C.P. Coatings for concentrating solar systems—A review. Renew. Sust. Energ. Rev. 2015, 45, 113–122. [Google Scholar] [CrossRef]
- Hee, J.Y.; Kumar, L.V.; Danner, A.J.; Yang, H.; Bhatia, C.S. The effect of dust on transmission and self-cleaning property of solar panels. Energy Procedia 2012, 15, 421–427. [Google Scholar] [CrossRef]
- De Jesus, M.A.; da Silva Neto, J.T.; Timò, G.; Paiva, P.R.; Dantas, M.S.; de Mello Ferreira, A. Superhydrophilic self-cleaning surfaces based on TiO2 and TiO2/SiO2 composite films for photovoltaic module cover glass. Appl. Adhes. Sci. 2015, 3, 1–9. [Google Scholar] [CrossRef]
- Jang, G.G.; Smith, D.B.; Polizos, G.; Collins, L.; Keum, J.K.; Lee, D.F. Transparent superhydrophilic and superhydrophobic nanoparticle textured coatings: Comparative study of anti-soiling performance. Nanoscale Adv. 2019, 1, 1249–1260. [Google Scholar] [CrossRef]
- Nabemoto, K.; Sakurada, Y.; Ota, Y.; Takami, K.; Nagai, H.; Tamura, K.; Araki, K.; Nishioka, K. Effect of anti-soiling layer coated on poly(methyl methacrylate) for concentrator photovoltaic modules. Jpn. J. Appl. Phys. 2012, 51, 10ND11. [Google Scholar] [CrossRef]
- Sueto, T.; Ota, Y.; Nishioka, K. Supression of dust adhesion on a concentrator photovoltaic module using an anti-soiling photocatalytic coating. Sol. Energy 2013, 97, 414–417. [Google Scholar] [CrossRef]
- Canete, C.T.; Moreno-Saez, R.; Carretero, J.; Piliougine, M.; Sidrach-de-Cardona, M.; Hirose, J.; Ogawa, S. Comparative analysis of energy produced by photovoltaic modules with anti-soiling coating surface in arid climates. In Proceedings of the Fourth International Conference on Applied Energy, Jiangsu, China, 5–8 July 2012; pp. 3678–3684. [Google Scholar]
- Mondal, B.; Eain, M.M.G.; Xu, Q.; Egan, V.M.; Punch, J.; Lyons, A.M. Design and fabrication of a hybrid superhydrophobic-hydrophilic surface that exhibits stable dropwise condensation. ACS Appl. Mater. Interfaces 2015, 7, 23575–23588. [Google Scholar] [CrossRef]
- Nayshevsky, I.; Xu, Q.; Lyons, A.M. Hydrophobic-hydrophilic surfaces exhibiting dropwise condensation for anti-soiling application. IEEE J. Photovolt. 2018, 9, 302–307. [Google Scholar] [CrossRef]
- Zhang, T.; Zhang, Z. Droplet growth model for dropwise condensation on concave hydrophobic surfaces. ACS Omega 2020, 5, 22560–22567. [Google Scholar] [CrossRef]
- Bahattab, M.A.; Alhomoudi, I.A.; Alhussaini, M.I.; Mirza, M.; Hegmann, J.; Glaubitt, W.; Löbmann, P. Anti-soiling surfaces for PV applications prepared by sol-gel processing: Comparison of laboratory testing and outdoor exposure. Sol. Energy Mater. Sol. Cells 2016, 157, 422–428. [Google Scholar] [CrossRef]
- Polizos, G.; Sharma, J.K.; Smith, D.B.; Tuncer, E.; Park, J.; Voylov, D.; Sokolov, A.P.; Meyer, H.M.; Aman, M. Anti-soiling and highly transparent coatings with multi-scale features. Sol. Energy Mater. Sol. Cells 2018, 188, 255–262. [Google Scholar] [CrossRef]
- Quan, Y.Y.; Zhang, L.Z. Experimental investigation of the anti-dust effect of transparent hydrophobic coatings applied for solar cell covering glass. Sol. Energy Mater. Sol. Cells 2017, 160, 382–389. [Google Scholar] [CrossRef]
- De Jesus, M.A.; Timò, G.; Agustín-Sáenz, C.; Braceras, I.; Cornelli, M.; de Mello Ferreira, A. Anti-soiling coatings for solar cell cover glass: Climate and surface properties influence. Sol. Energy Mater. Sol. Cells 2018, 185, 517–523. [Google Scholar] [CrossRef]
Publisher’s Note: MDPI stays neutral with regard to jurisdictional claims in published maps and institutional affiliations. |
© 2021 by the authors. Licensee MDPI, Basel, Switzerland. This article is an open access article distributed under the terms and conditions of the Creative Commons Attribution (CC BY) license (http://creativecommons.org/licenses/by/4.0/).