
Aqueous Sol-Gel Synthesis of Different Iron Ferrites: From 3D to 2D

 , ,
, ,
Abstract
:
1. Introduction
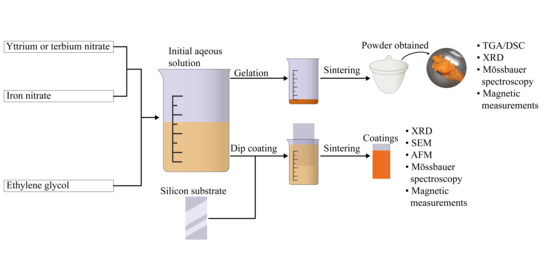
2. Materials and Methods
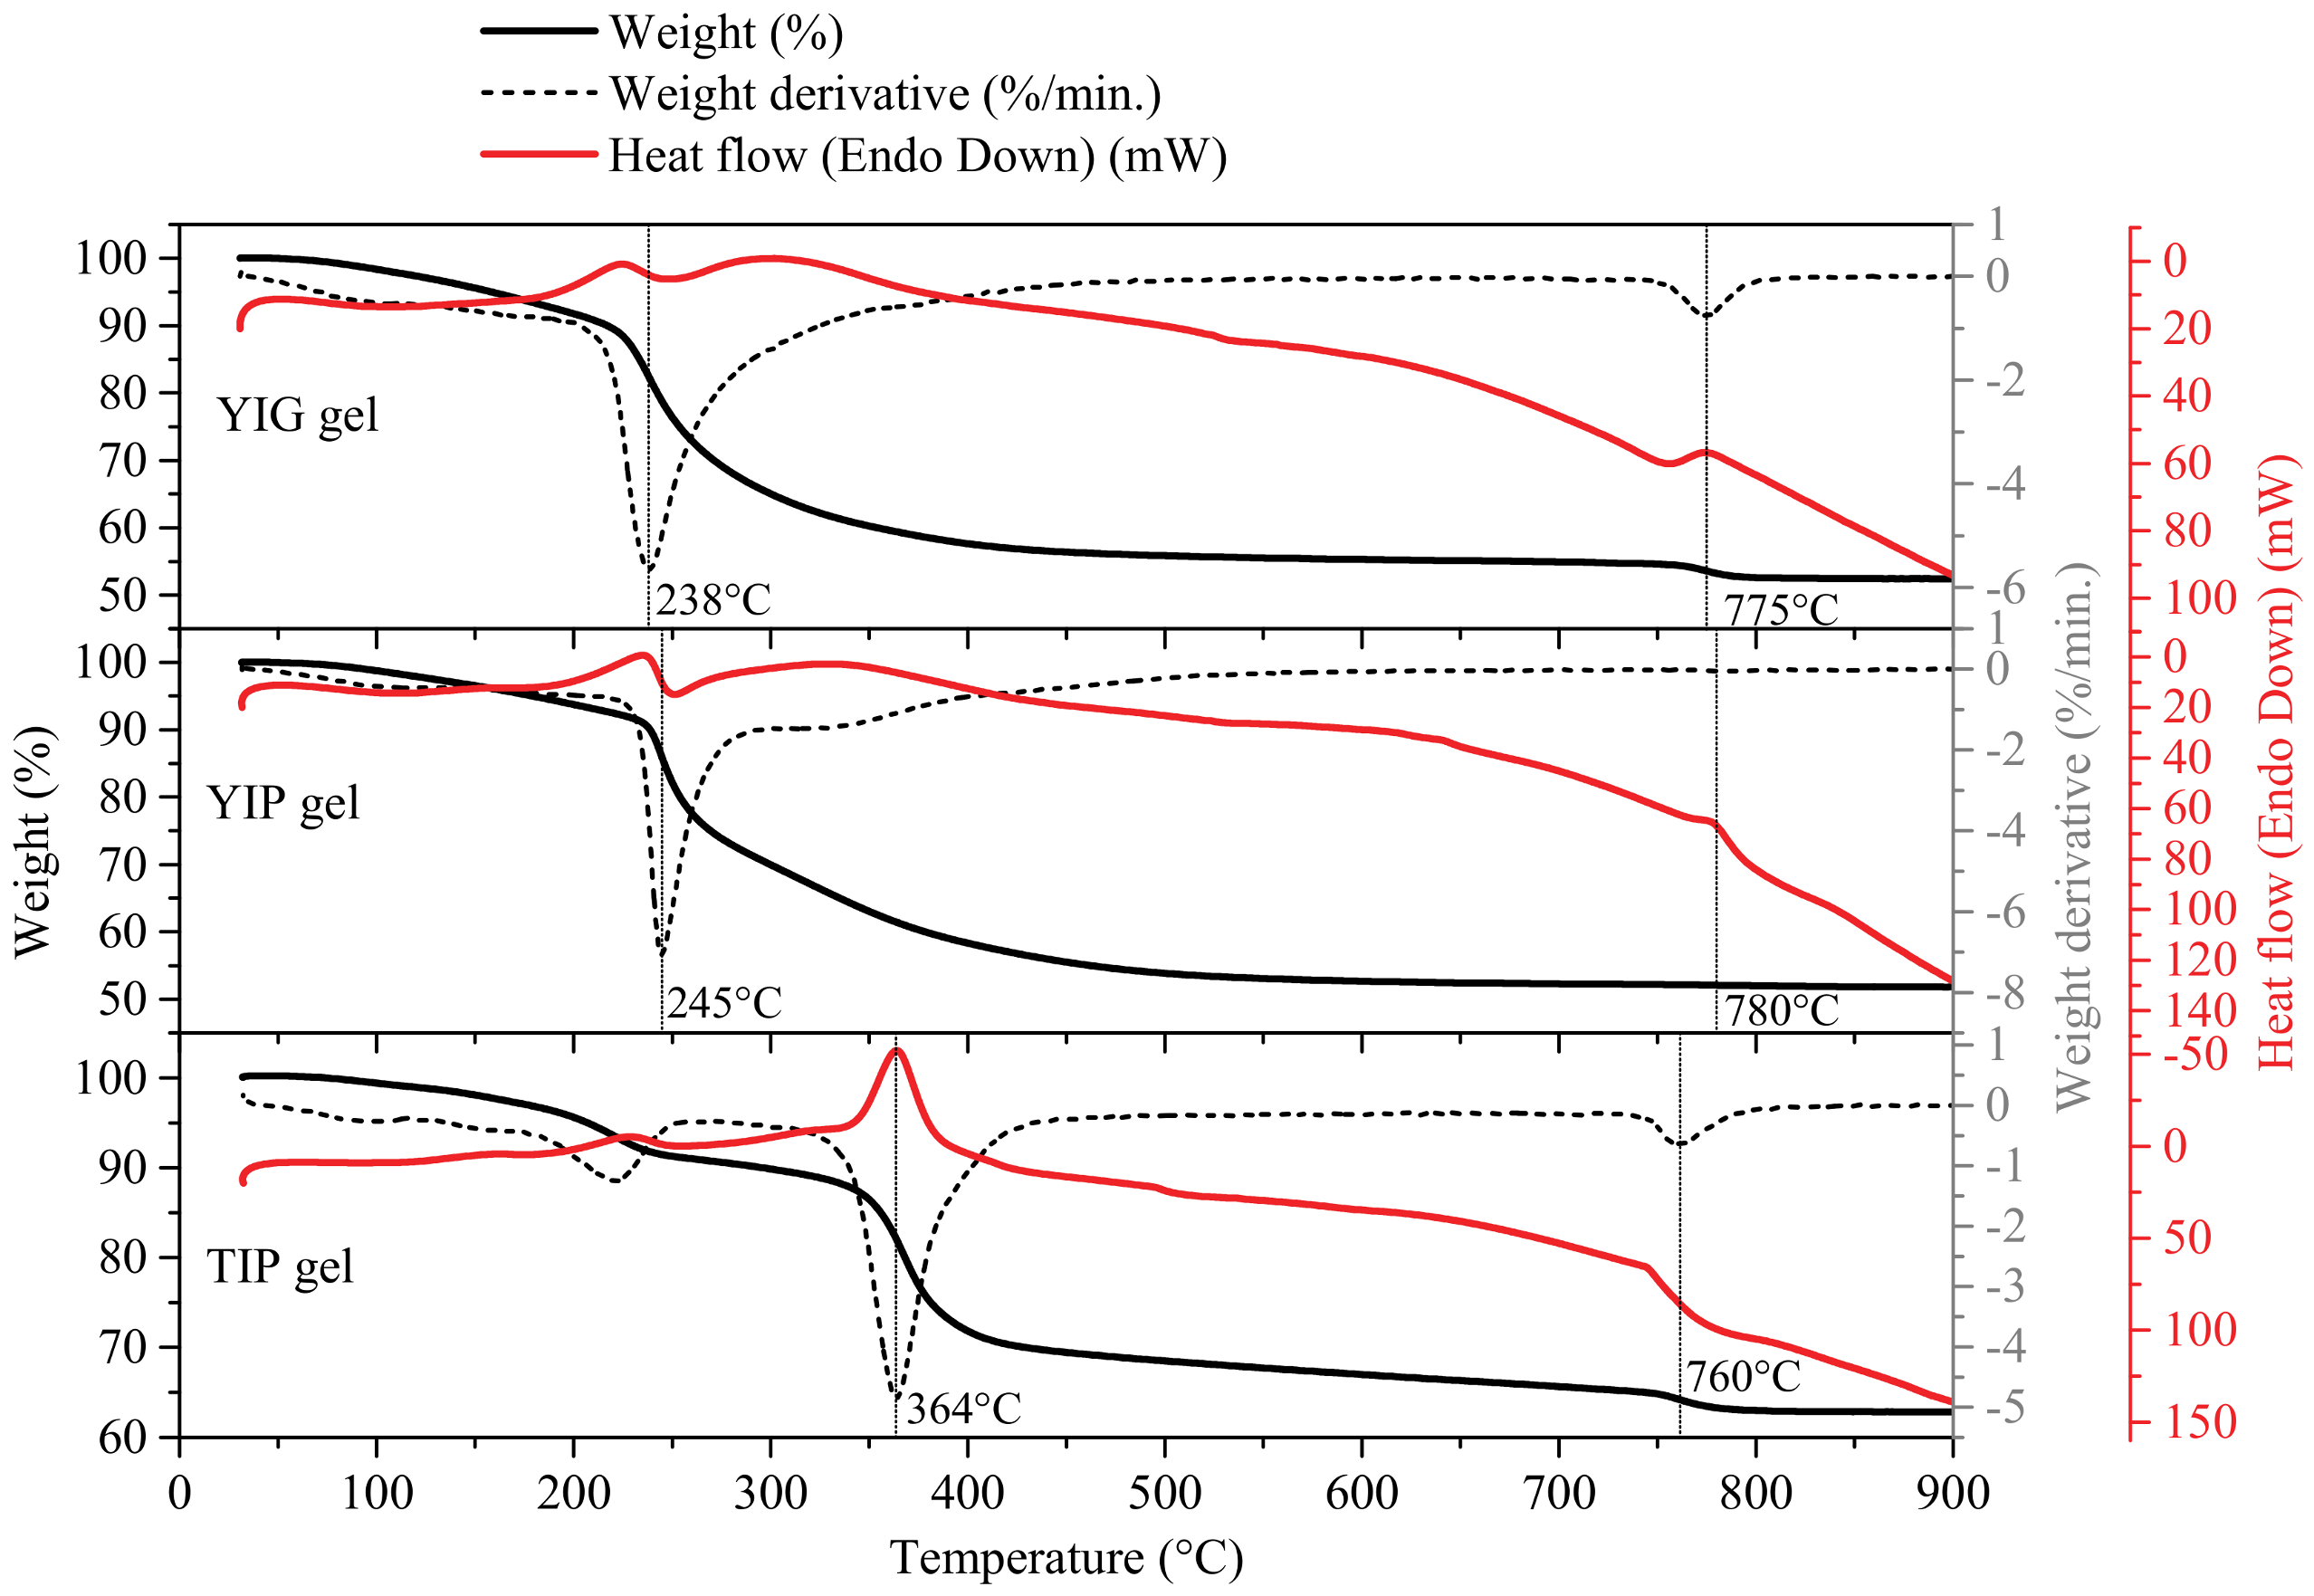
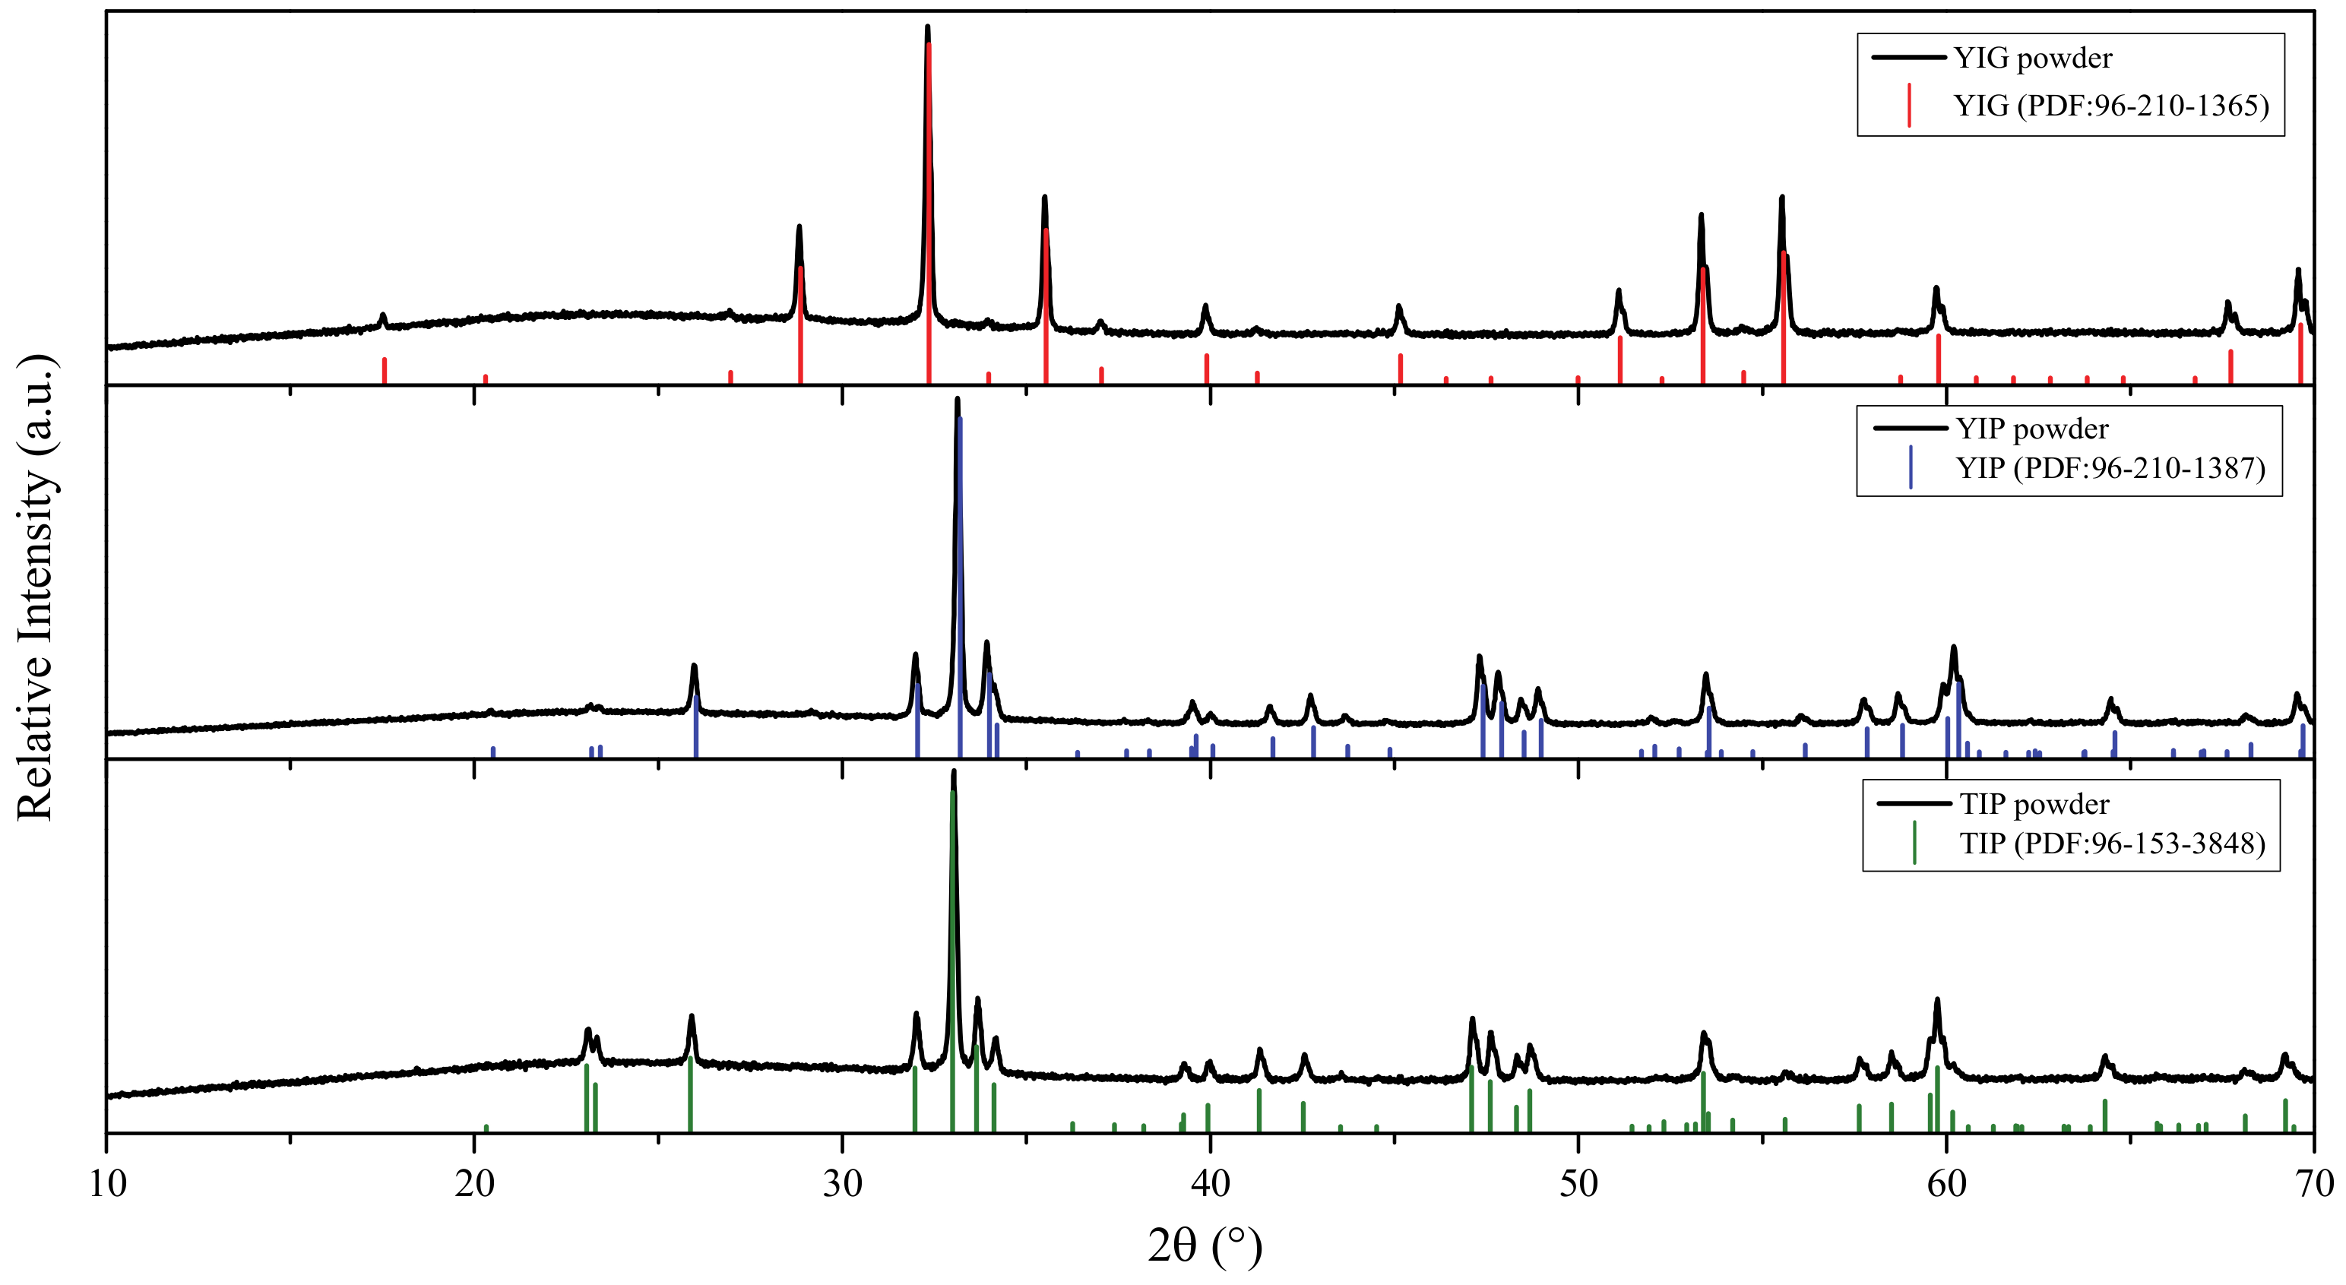
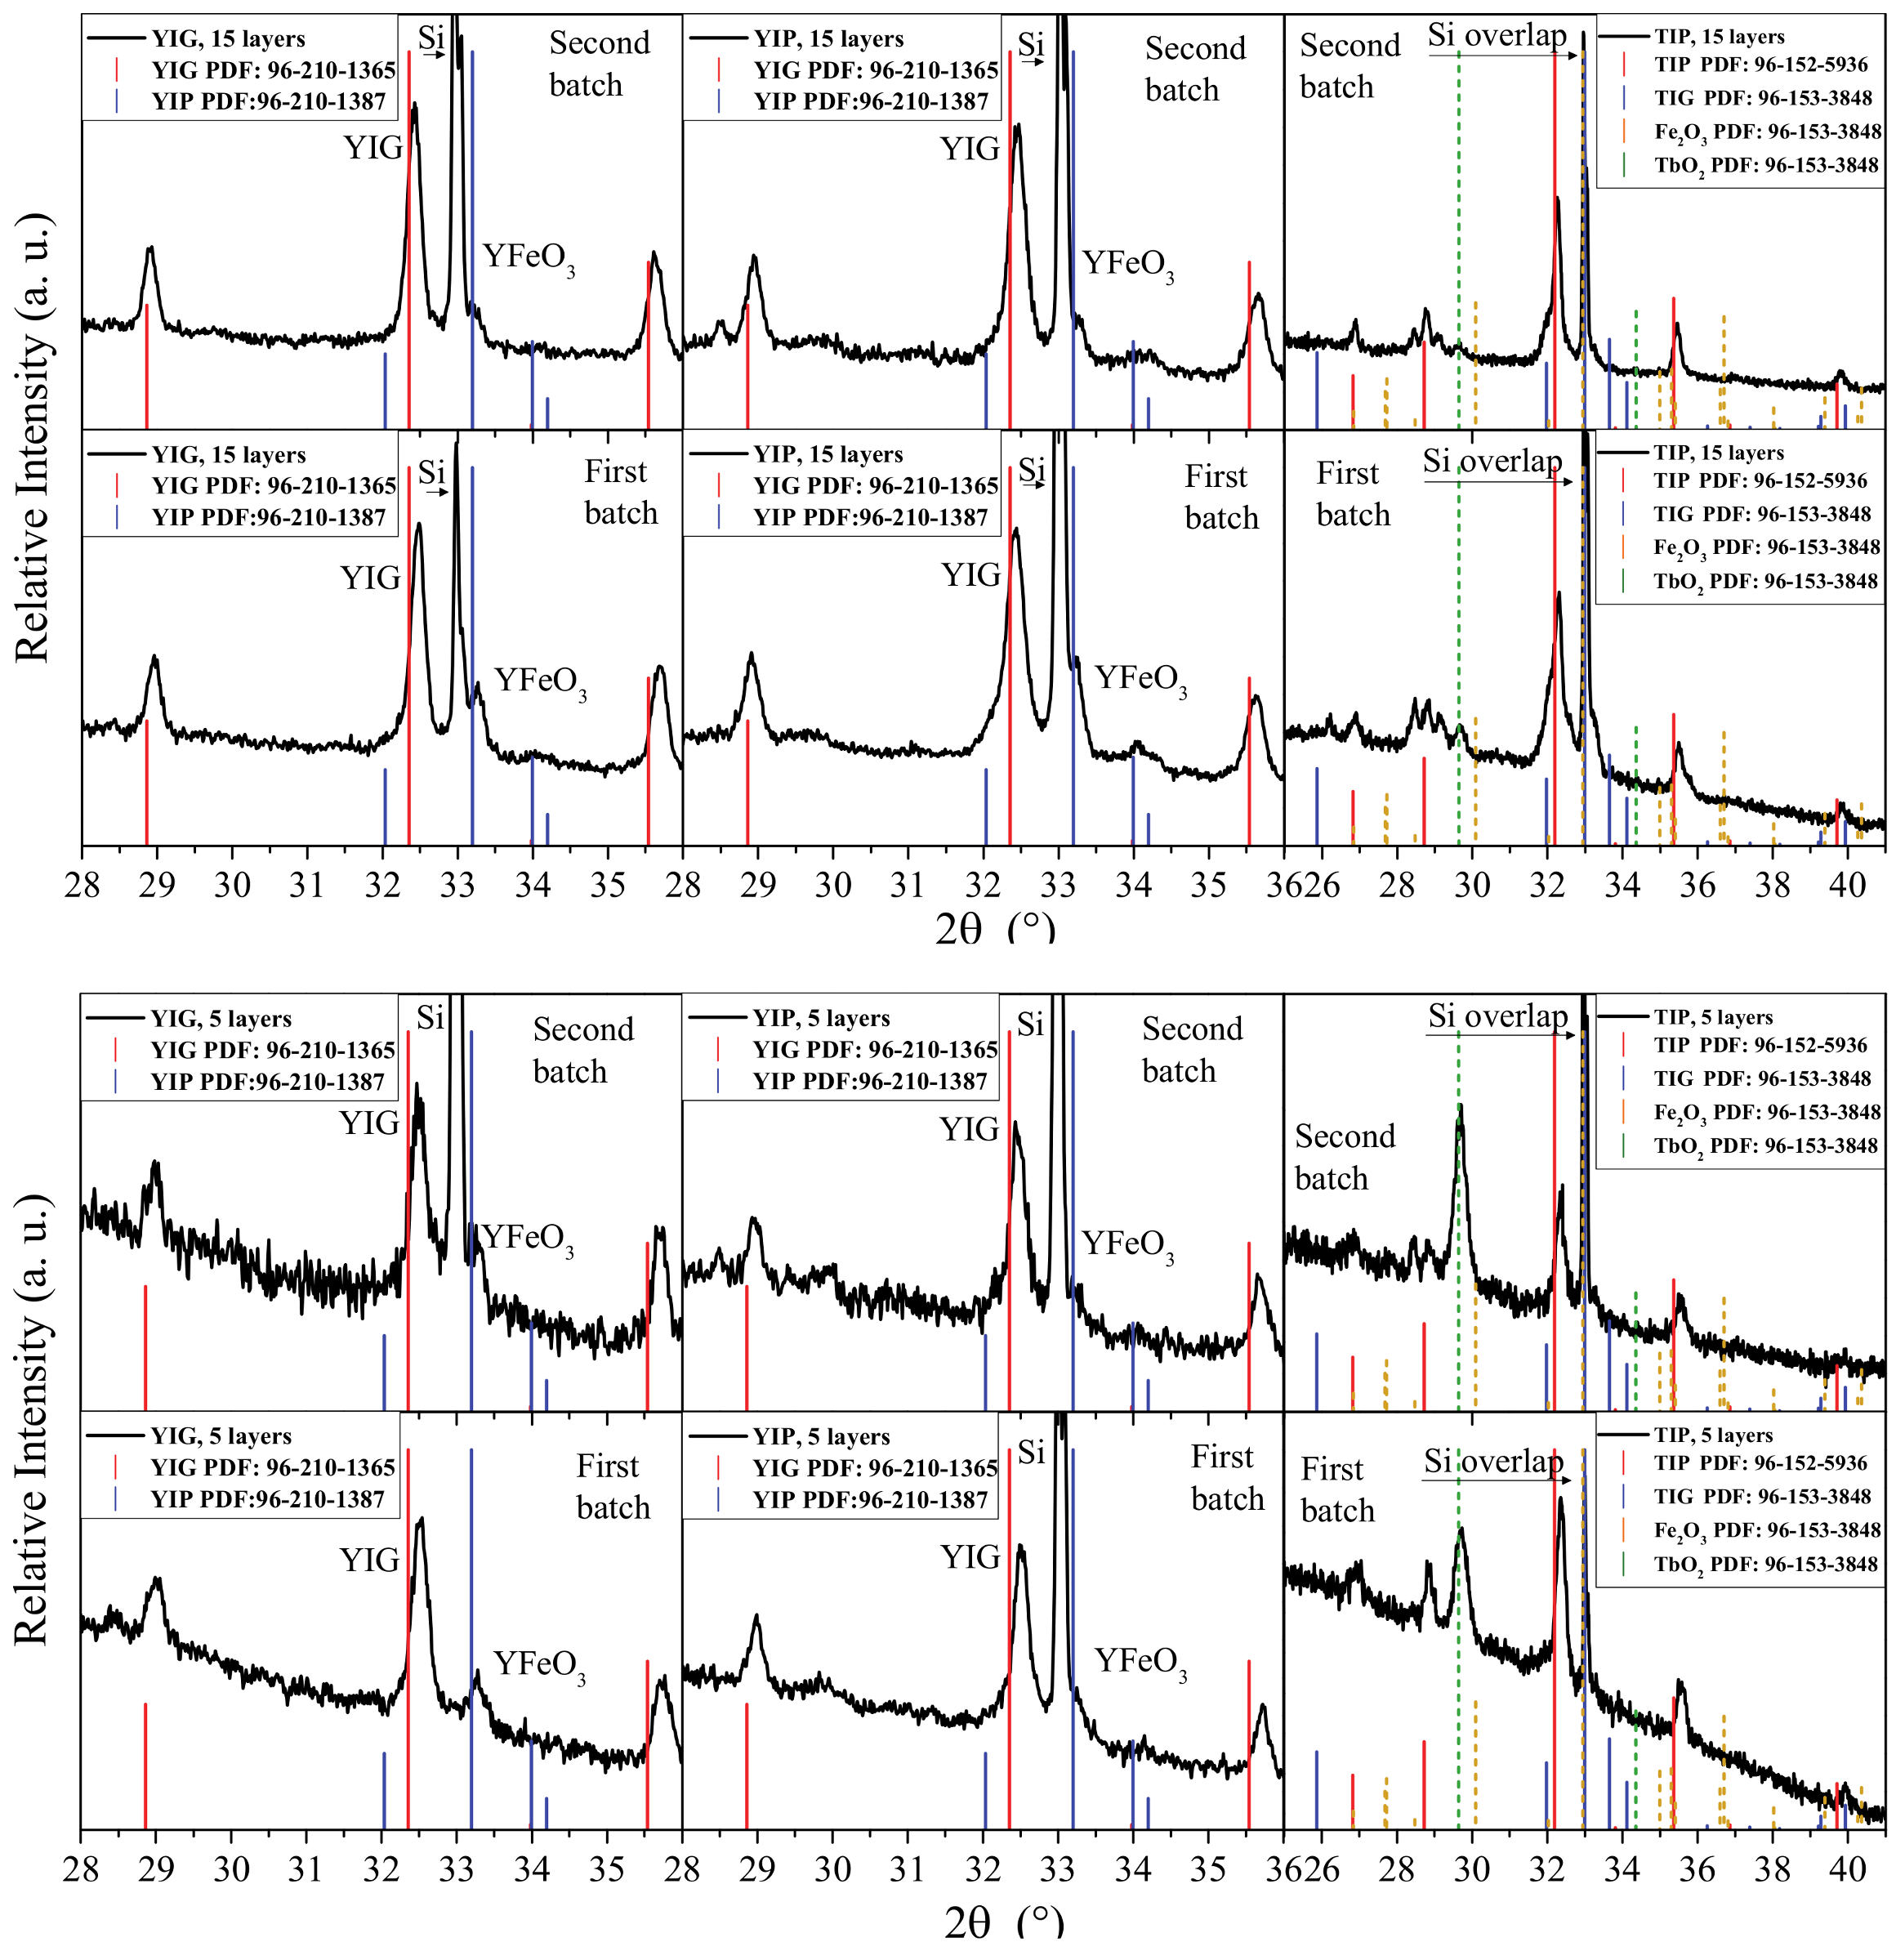
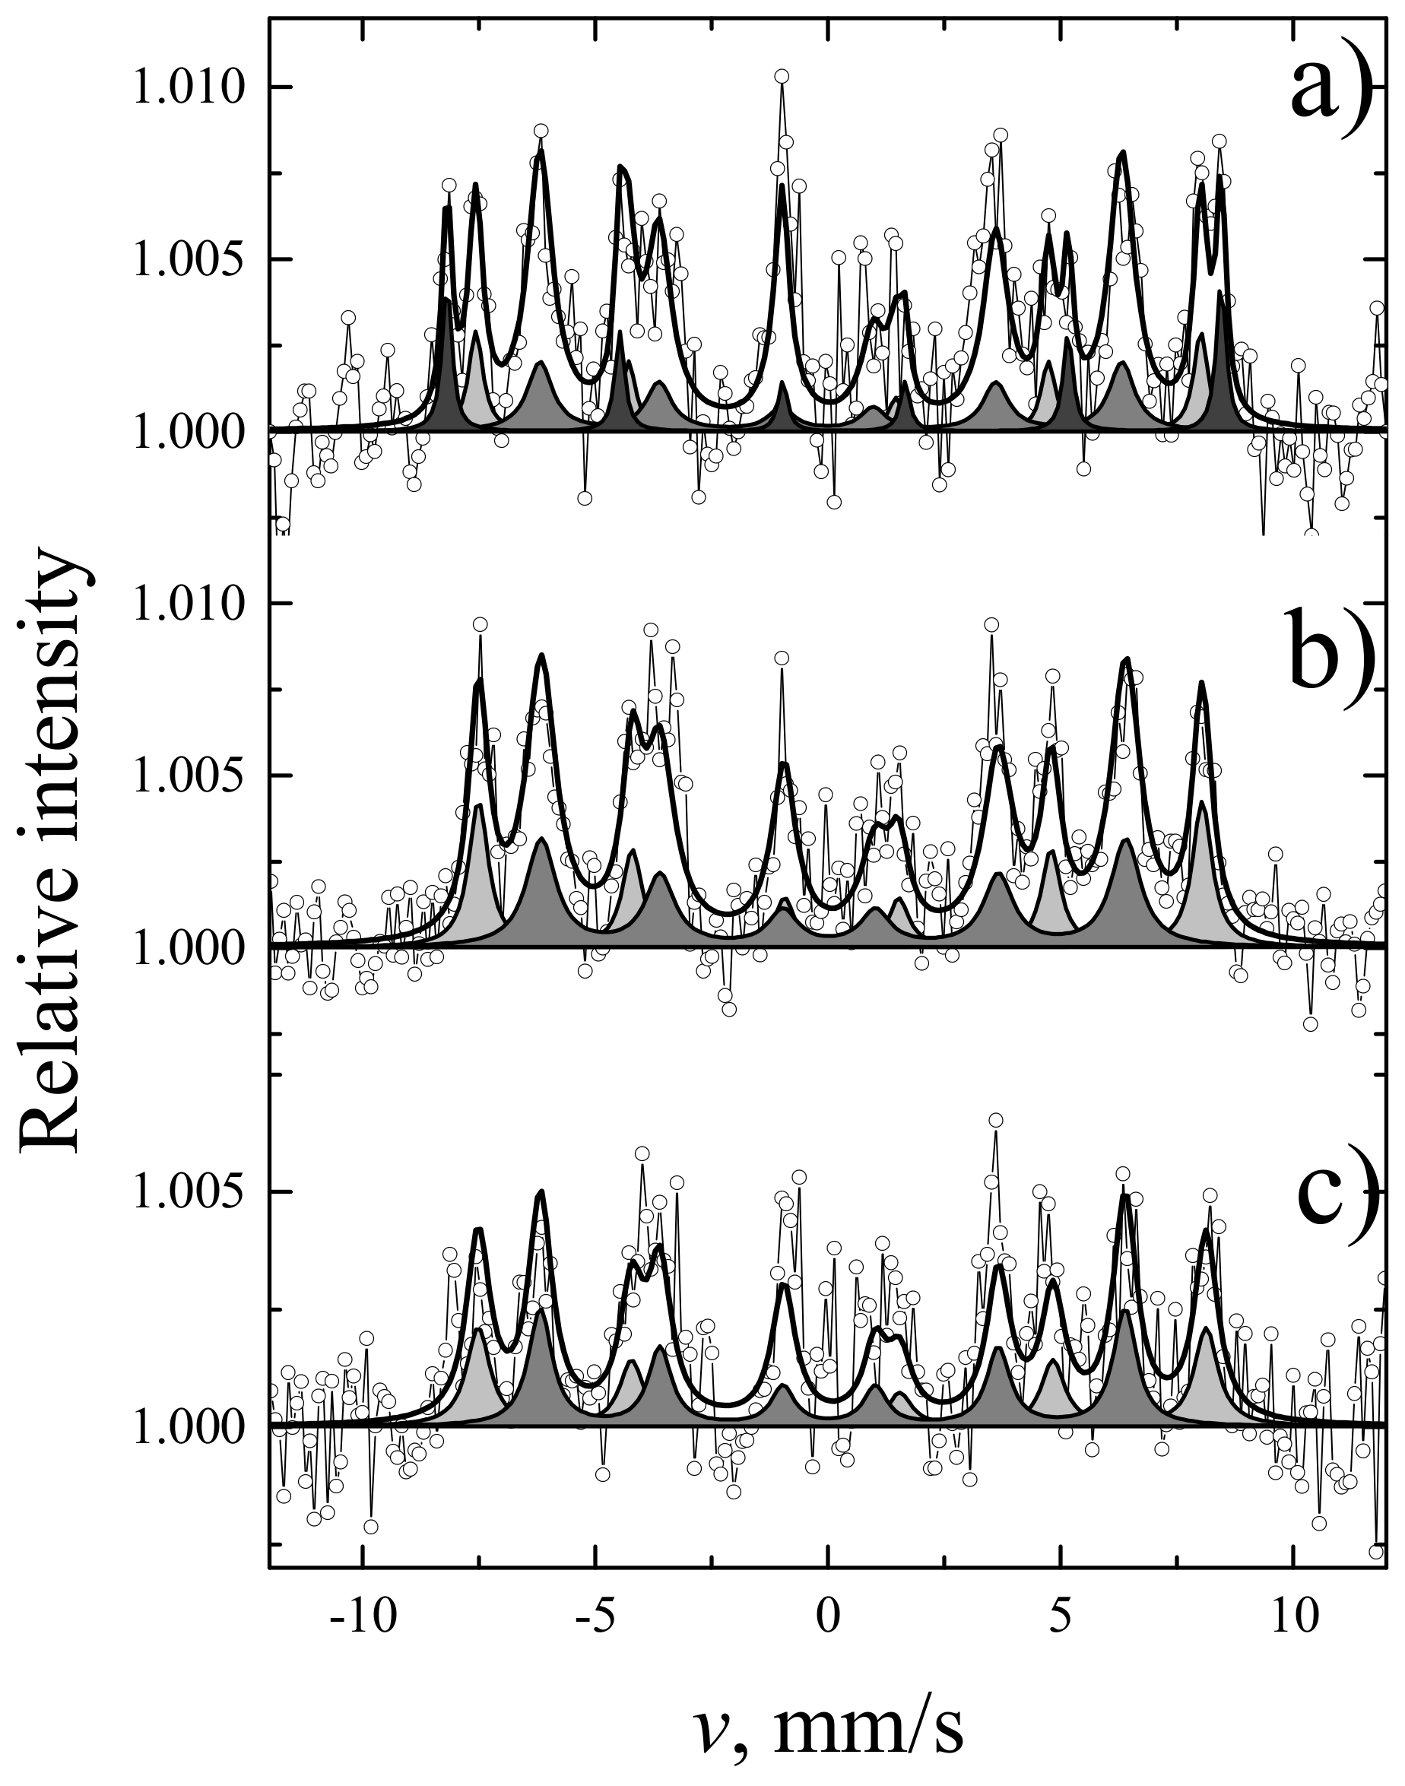
3. Results and Discussion
4. Conclusions
Author Contributions
Funding
Institutional Review Board Statement
Informed Consent Statement
Data Availability Statement
Conflicts of Interest
References
- Wang, J.; Zhang, J.; Zhou, Y.; Liu, H.; Xue, Q.; Li, X.; Chueh, C.-C.; Yip, H.-L.; Zhu, Z.; Jen, A.K.Y. Highly Efficient All-Inorganic Perovskite Solar Cells with Suppressed Non-Radiative Recombination by a Lewis base. Nat. Commun. 2020, 11, 1–9. [Google Scholar] [CrossRef] [PubMed]
- Röhm, H.; Leonhard, T.; Schulz, A.D.; Wagner, S.; Hoffmann, M.J.; Colsmann, A. Ferroelectric Properties of Perovskite Thin Films and Their Implications for Solar Energy Conversion. Adv. Mater. 2019, 31, e1806661. [Google Scholar] [CrossRef] [PubMed] [Green Version]
- Onbasli, M.C.; Beran, L.; Zahradnik, M.; Kucera, M.; Antos, R.; Mistrik, J.; Dionne, G.F.; Veis, M.; Ross, C.A. Optical and magneto-optical behavior of Cerium Yttrium Iron Garnet thin films at wavelengths of 200–1770 nm. Sci. Rep. 2016, 6, 23640. [Google Scholar] [CrossRef] [PubMed] [Green Version]
- Grishin, A.; Khartsev, S. All-Garnet Magneto-Optical Photonic Crystals. J. Magn. Soc. Jpn. 2008, 32, 140–145. [Google Scholar] [CrossRef] [Green Version]
- Bednorz, J.G.; Müller, K.A. Perovskite-Type Oxides-the New Approach to High-Tc Superconductivity. Nobel Lecture. Angew. Chem. Int. Ed. 1988, 27, 735–748. [Google Scholar] [CrossRef]
- Auciello, O.; Paz de Araujo, C.A.; Celinska, J. Review of the Science and Technology for Low- and High-Density Nonvolatile Ferroelectric Memories. In Emerging Non-Volatile Memories; Hong, S., Auciello, O., Wouters, D., Eds.; Springer: New York, NY, USA, 2014; ISBN 9781489975379. [Google Scholar]
- Gilleo, M.A. Ferromagnetic insulators: Garnets. In Handbook of Ferromagnetic Materials; Wohlfarth, E.P., Ed.; Elsevier: Amsterdam, The Netherlands, 1980; pp. 1–53. ISBN 9780444853127. [Google Scholar]
- Lozano-Gorrín, A.; Rodríguez-Mendoza, U.; Venkatramu, V.; Monteseguro, V.; Hernández-Rodríguez, M.; Martin, I.; Lavín, V. Lanthanide-Doped Y3Ga5O12 Garnets for Nanoheating and Nanothermometry in the First Biological Window. Opt. Mater. 2018, 84, 46–51. [Google Scholar] [CrossRef]
- Subkhangulov, R.R.; Mikhaylovskiy, R.V.; Zvezdin, A.K.; Kruglyak, V.V.; Rasing, T.; Kimel, A.V. Terahertz Modulation of the Faraday Rotation by Laser Pulses via the Optical Kerr Effect. Nat. Photon. 2016, 10, 111–114. [Google Scholar] [CrossRef]
- Chen, Q.; Wu, J.; Ou, X.; Huang, B.; Almutlaq, J.; Zhumekenov, A.A.; Guan, X.; Han, S.; Liang, L.; Yi, Z.; et al. All-Inorganic Perovskite Nanocrystal Scintillators. Nat. Cell Biol. 2018, 561, 88–93. [Google Scholar] [CrossRef]
- Wang, G.; Li, D.; Cheng, H.-C.; Li, Y.; Chen, C.-Y.; Yin, A.; Zhao, Z.; Lin, Z.; Wu, H.; He, Q.; et al. Wafer-scale Growth of Large Arrays of Perovskite Microplate Crystals for Functional Electronics and Optoelectronics. Sci. Adv. 2015, 1, e1500613. [Google Scholar] [CrossRef] [Green Version]
- Veldhuis, S.A.; Boix, P.P.; Yantara, N.; Natalia, Y.; Sum, T.C.; Mathews, N.; Mhaisalkar, S.G. Perovskite Materials for Light-Emitting Diodes and Lasers. Adv. Mater. 2016, 28, 6804–6834. [Google Scholar] [CrossRef]
- Lee, Y.; Kwon, J.; Hwang, E.; Ra, C.-H.; Yoo, W.J.; Ahn, J.-H.; Park, J.H.; Cho, J.H. High-Performance Perovskite-Graphene Hybrid Photodetector. Adv. Mater. 2015, 27, 41–46. [Google Scholar] [CrossRef] [PubMed]
- Zheng, T.; Wu, J.; Xiao, D.; Zhu, J. Recent Development in Lead-Free Perovskite Piezoelectric Bulk Materials. Prog. Mater. Sci. 2018, 98, 552–624. [Google Scholar] [CrossRef]
- Frukacz, Z.; Pawlak, D.A. Garnets, Growth of. In Encyclopedia of Materials: Science and Technology; Buschow, K.H.J., Cahn, R.W., Flemings, M.C., Ilschner, B., Kramer, E.J., Mahajan, S., Veyssière, P., Eds.; Elsevier: Amsterdam, The Netherlands, 2001; pp. 3455–3463. ISBN 9780080431529. [Google Scholar]
- Khattak, C.; Wang, F.F. Perovskites and Garnets. In Perovskites and Garnets; Office of Scientific and Technical Information (OSTI): Oak Ridge, TN, USA, 1976; pp. 525–607. [Google Scholar]
- Li, C.; Soh, K.C.K.; Wu, P. Formability of ABO3 Perovskites. J. Alloy Compd. 2004, 372, 40–48. [Google Scholar] [CrossRef]
- Tsui, K.Y.; Onishi, N.; Berger, R.F. Tolerance Factors Revisited: Geometrically Designing the Ideal Environment for Perovskite Dopants. J. Phys. Chem. C 2016, 120, 23293–23298. [Google Scholar] [CrossRef]
- Sato, T.; Takagi, S.; Deledda, S.; Hauback, B.C.; Orimo, S.-I. Extending the Applicability of the Goldschmidt Tolerance Factor to Arbitrary Ionic Compounds. Sci. Rep. 2016, 6, 23592. [Google Scholar] [CrossRef] [PubMed] [Green Version]
- Bartel, C.J.; Sutton, C.; Goldsmith, B.R.; Ouyang, R.; Musgrave, C.B.; Ghiringhelli, L.M.; Scheffler, M. New Tolerance Factor to Predict the Stability of Perovskite Oxides and Halides. Sci. Adv. 2019, 5, eaav0693. [Google Scholar] [CrossRef] [Green Version]
- Boudiar, T.; Payet-Gervy, B.; Blanc-Mignon, M.-F.; Rousseau, J.-J.; Le Berre, M.; Joisten, H. Magneto-Optical Properties of Yttrium Iron Garnet (YIG) Thin Films Elaborated by Radio Frequency Sputtering. J. Magn. Magn. Mater. 2004, 284, 77–85. [Google Scholar] [CrossRef]
- Shang, M.; Zhang, C.; Zhang, T.; Yuan, L.; Ge, L.; Yuan, H.; Feng, S. The Multiferroic Perovskite YFeO3. Appl. Phys. Lett. 2013, 102, 062903. [Google Scholar] [CrossRef]
- Rosales-González, O.; Jesús, F.S.-D.; Cortés-Escobedo, C.; Bolarín-Miró, A. Crystal Structure and Multiferroic Behavior of Perovskite YFeO3. Ceram. Int. 2018, 44, 15298–15303. [Google Scholar] [CrossRef]
- Yang, H.; Zhang, J.; Lin, G.; Xian, T.; Jiang, J. Preparation, Characterization and Photocatalytic Properties of Terbium Orthoferrite Nanopowder. Adv. Powder Technol. 2013, 24, 242–245. [Google Scholar] [CrossRef]
- Artyukhin, S.; Mostovoy, M.; Jensen, N.P.; Le, D.; Prokes, K.; De Paula, V.G.; Bordallo, H.N.; Maljuk, A.; Landsgesell, S.; Ryll, H.; et al. Solitonic Lattice and Yukawa Forces in the Rare-Earth Orthoferrite TbFeO3. Nat. Mater. 2012, 11, 694–699. [Google Scholar] [CrossRef] [Green Version]
- Gordon, J.; Gorodetsky, G.; Hornreich, R. Magnetization Studies of TbFeO3. J. Magn. Magn. Mater. 1976, 3, 288–294. [Google Scholar] [CrossRef]
- Opuchovic, O.; Beganskiene, A.; Kareiva, A. Sol–Gel Derived Tb3Fe5O12 and Y3Fe5O12 Garnets: Synthesis, Phase Purity, Micro-Structure and Improved Design of Morphology. J. Alloy. Compd. 2015, 647, 189–197. [Google Scholar] [CrossRef]
- Opuchovic, O.; Culunlu, S.; Morkan, A.U.; Morkan, I.A.; Niznansky, D.; Garskaite, E.; Beganskiene, A.; Kareiva, A. Structural, Morphological, and Magnetic Characterization of Bulk and Thin Films Y 3 Al 5– x Fe x O 12 (YAIG): From the Perspective of Aqueous Sol–Gel Processing. Chem. Eng. Commun. 2017, 204, 1037–1048. [Google Scholar] [CrossRef]
- Garskaite, E.; Gibson, K.; Leleckaite, A.; Glaser, J.; Nižňanský, D.; Kareiva, A.; Meyer, H.-J. On the Synthesis and Characterization of Iron-Containing Garnets (Y3Fe5O12, YIG and Fe3Al5O12, IAG). Chem. Phys. 2006, 323, 204–210. [Google Scholar] [CrossRef]
- Zaharescu, M.; Predoana, L.; Pandele-Cusu, J. Thermal Analysis on Gels, Glasses, and Powders. In Handbook of Sol-Gel Science and Technology, 1st ed.; Metzler, J.B., Ed.; Springer International Publishing: Cham, Switzerland, 2018; pp. 1833–1867. [Google Scholar]
- Chen, W.; Li, F.; Liu, L.; Li, Y. Synthesis of Nano-sized Yttria via a Sol-Gel Process Based on Hydrated Yttrium Nitrate and Ethylene Glycol and Its Catalytic Performance for Thermal Decomposition of NH4ClO4. J. Rare Earths 2006, 24, 543–548. [Google Scholar] [CrossRef]
- Chen, L.; Lin, Z.; Zhao, C.; Zheng, Y.; Zhou, Y.; Peng, H. Direct Synthesis and Characterization of Mesoporous Fe3O4 Through Pyrolysis of Ferric Nitrate-Ethylene Glycol Gel. J. Alloy. Compd. 2011, 509, L1–L5. [Google Scholar] [CrossRef]
- Mathur, S.; Shen, H.; Leleckaite, A.; Beganskiene, A.; Kareiva, A. Low-Temperature Synthesis and Characterization of Yttrium–Gallium Garnet Y3Ga5O12 (YGG). Mater. Res. Bull. 2005, 40, 439–446. [Google Scholar] [CrossRef]
- Minqiang, W.; Xiangying, Z.; Xiaoyong, W.; Liangying, Z.; Xi, Y. Preparation and Annealing Process of Y3Fe5O12by Sol-Gel Method. Ferroelectronics 2001, 264, 249–254. [Google Scholar] [CrossRef]
- Puetz, J.; Aegerter, M.A. Dip Coating Technique. Sol-Gel Technologies for Glass Producers and Users; Aegerter, M.A., Mennig, M., Eds.; Springer: New York, NY, USA, 2004; ISBN 978-0-387-88953-5. [Google Scholar]


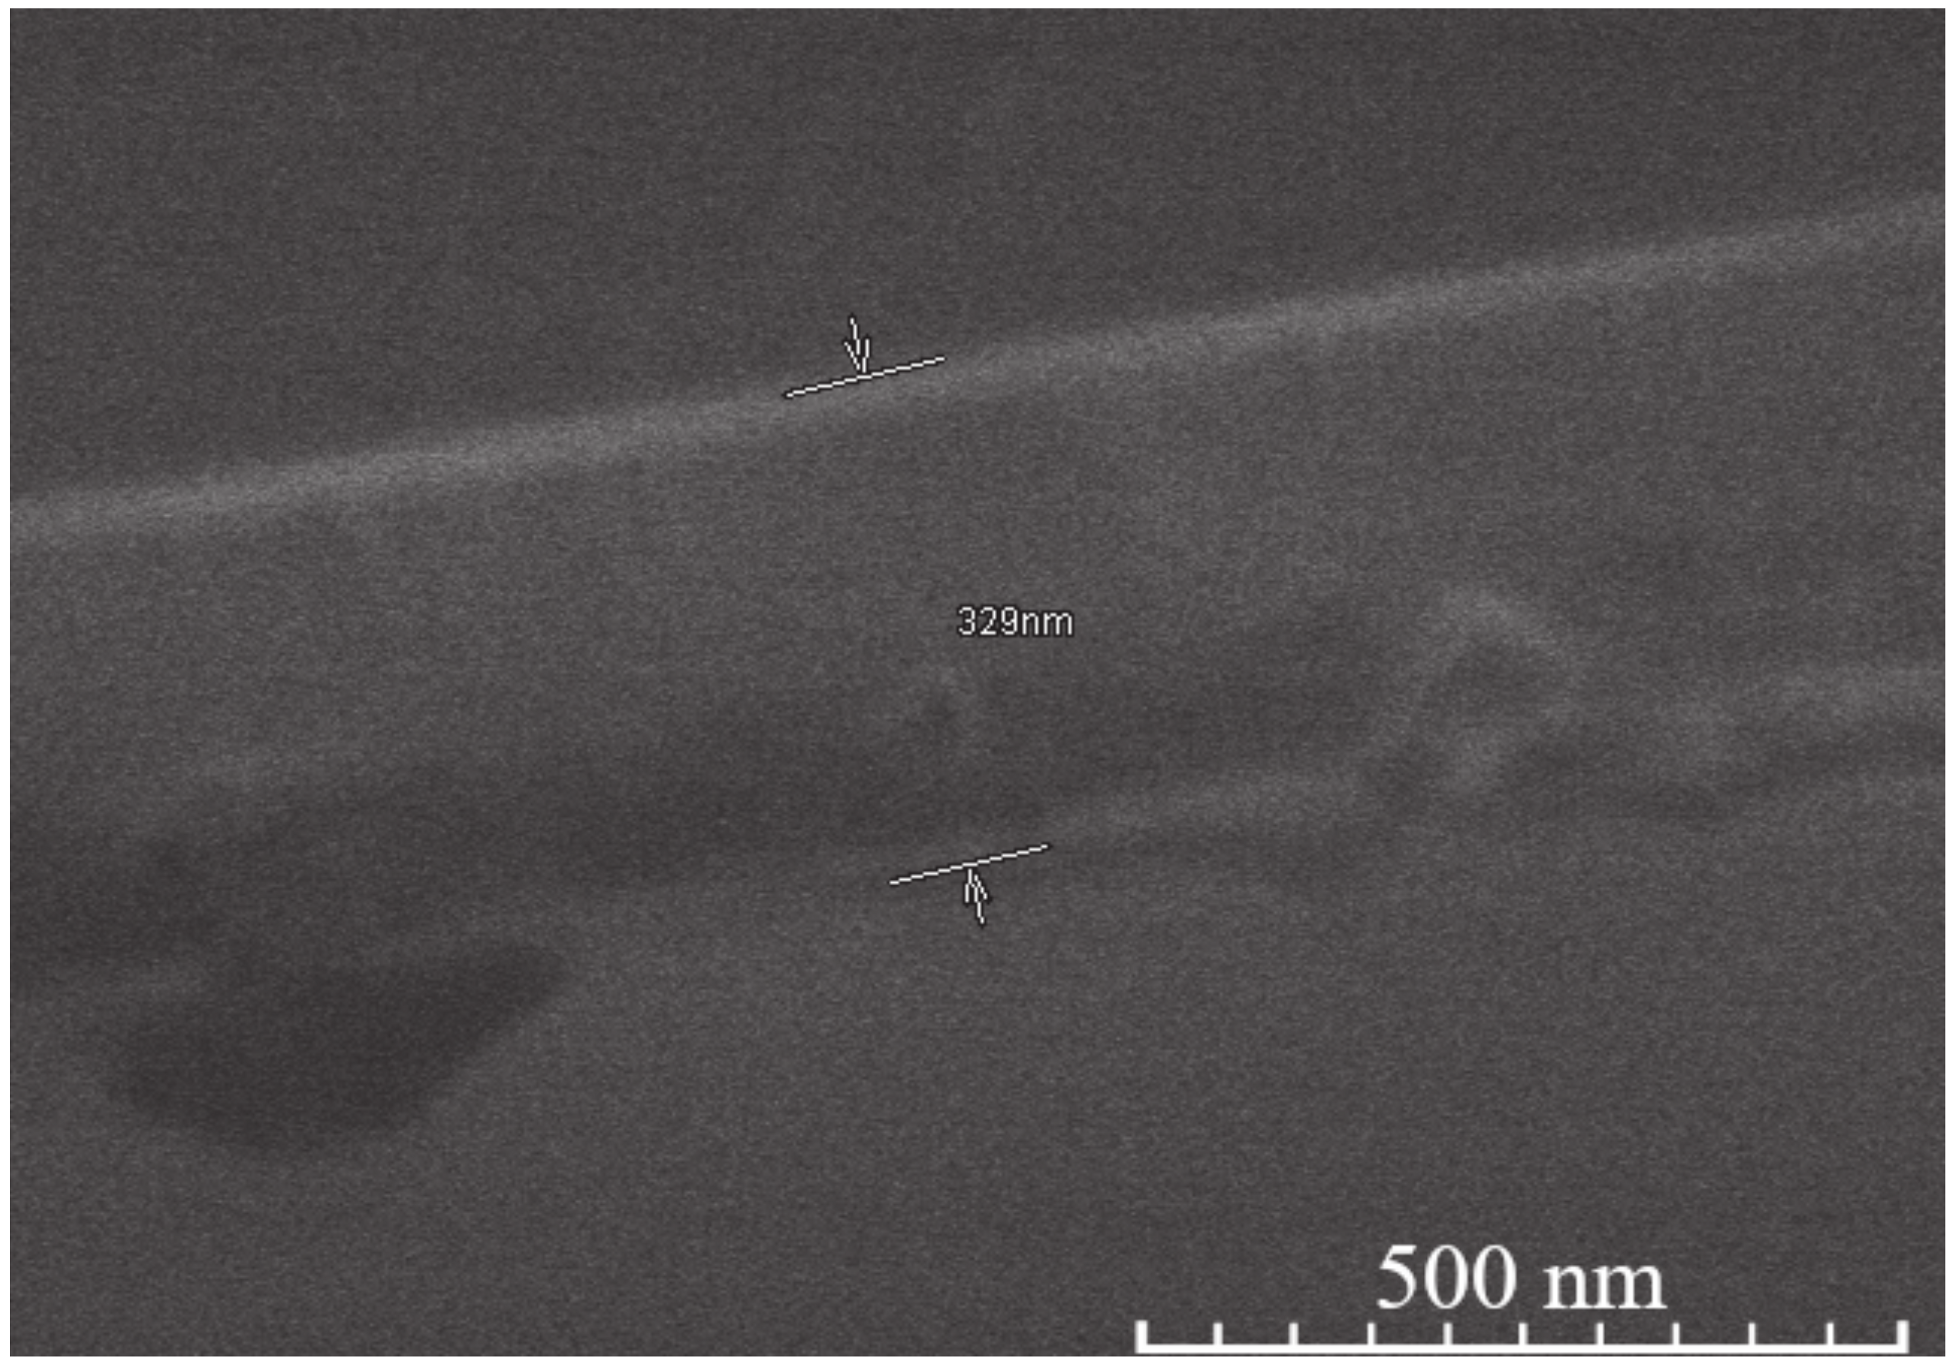
| Sample | Thickness Range, Nm | Average Thickness, Nm | Thickness Median, Nm | Short Analysis * | |
|---|---|---|---|---|---|
| 15-layer | YIG | 380–472 | 424 | 416 | Mostly even surface. No noticeable pores or cavities. Difficult to measure since separation line between coating and Si not clearly visible. |
| YIP | 485–559 | 511 | 506 | Moderately uneven surface. Few pores, some cavities visible. | |
| TIP | 358–414 | 386 | 385 | Mostly even surface, however either cavities or pores clearly visible. | |
| 5-layer | YIG | 201–342 | 273 | 280 | Uneven surface, some unusually large or small crystallites on the surface expand thickness range. No hidden cavities visible. |
| YIP | 261–354 | 307 | 316 | Even surface. Few cavities or pores visible. | |
| TIP | 216–256 | 233 | 234 | Even surface, thickness variations due to nature of dip coating. No hidden cavities visible. | |
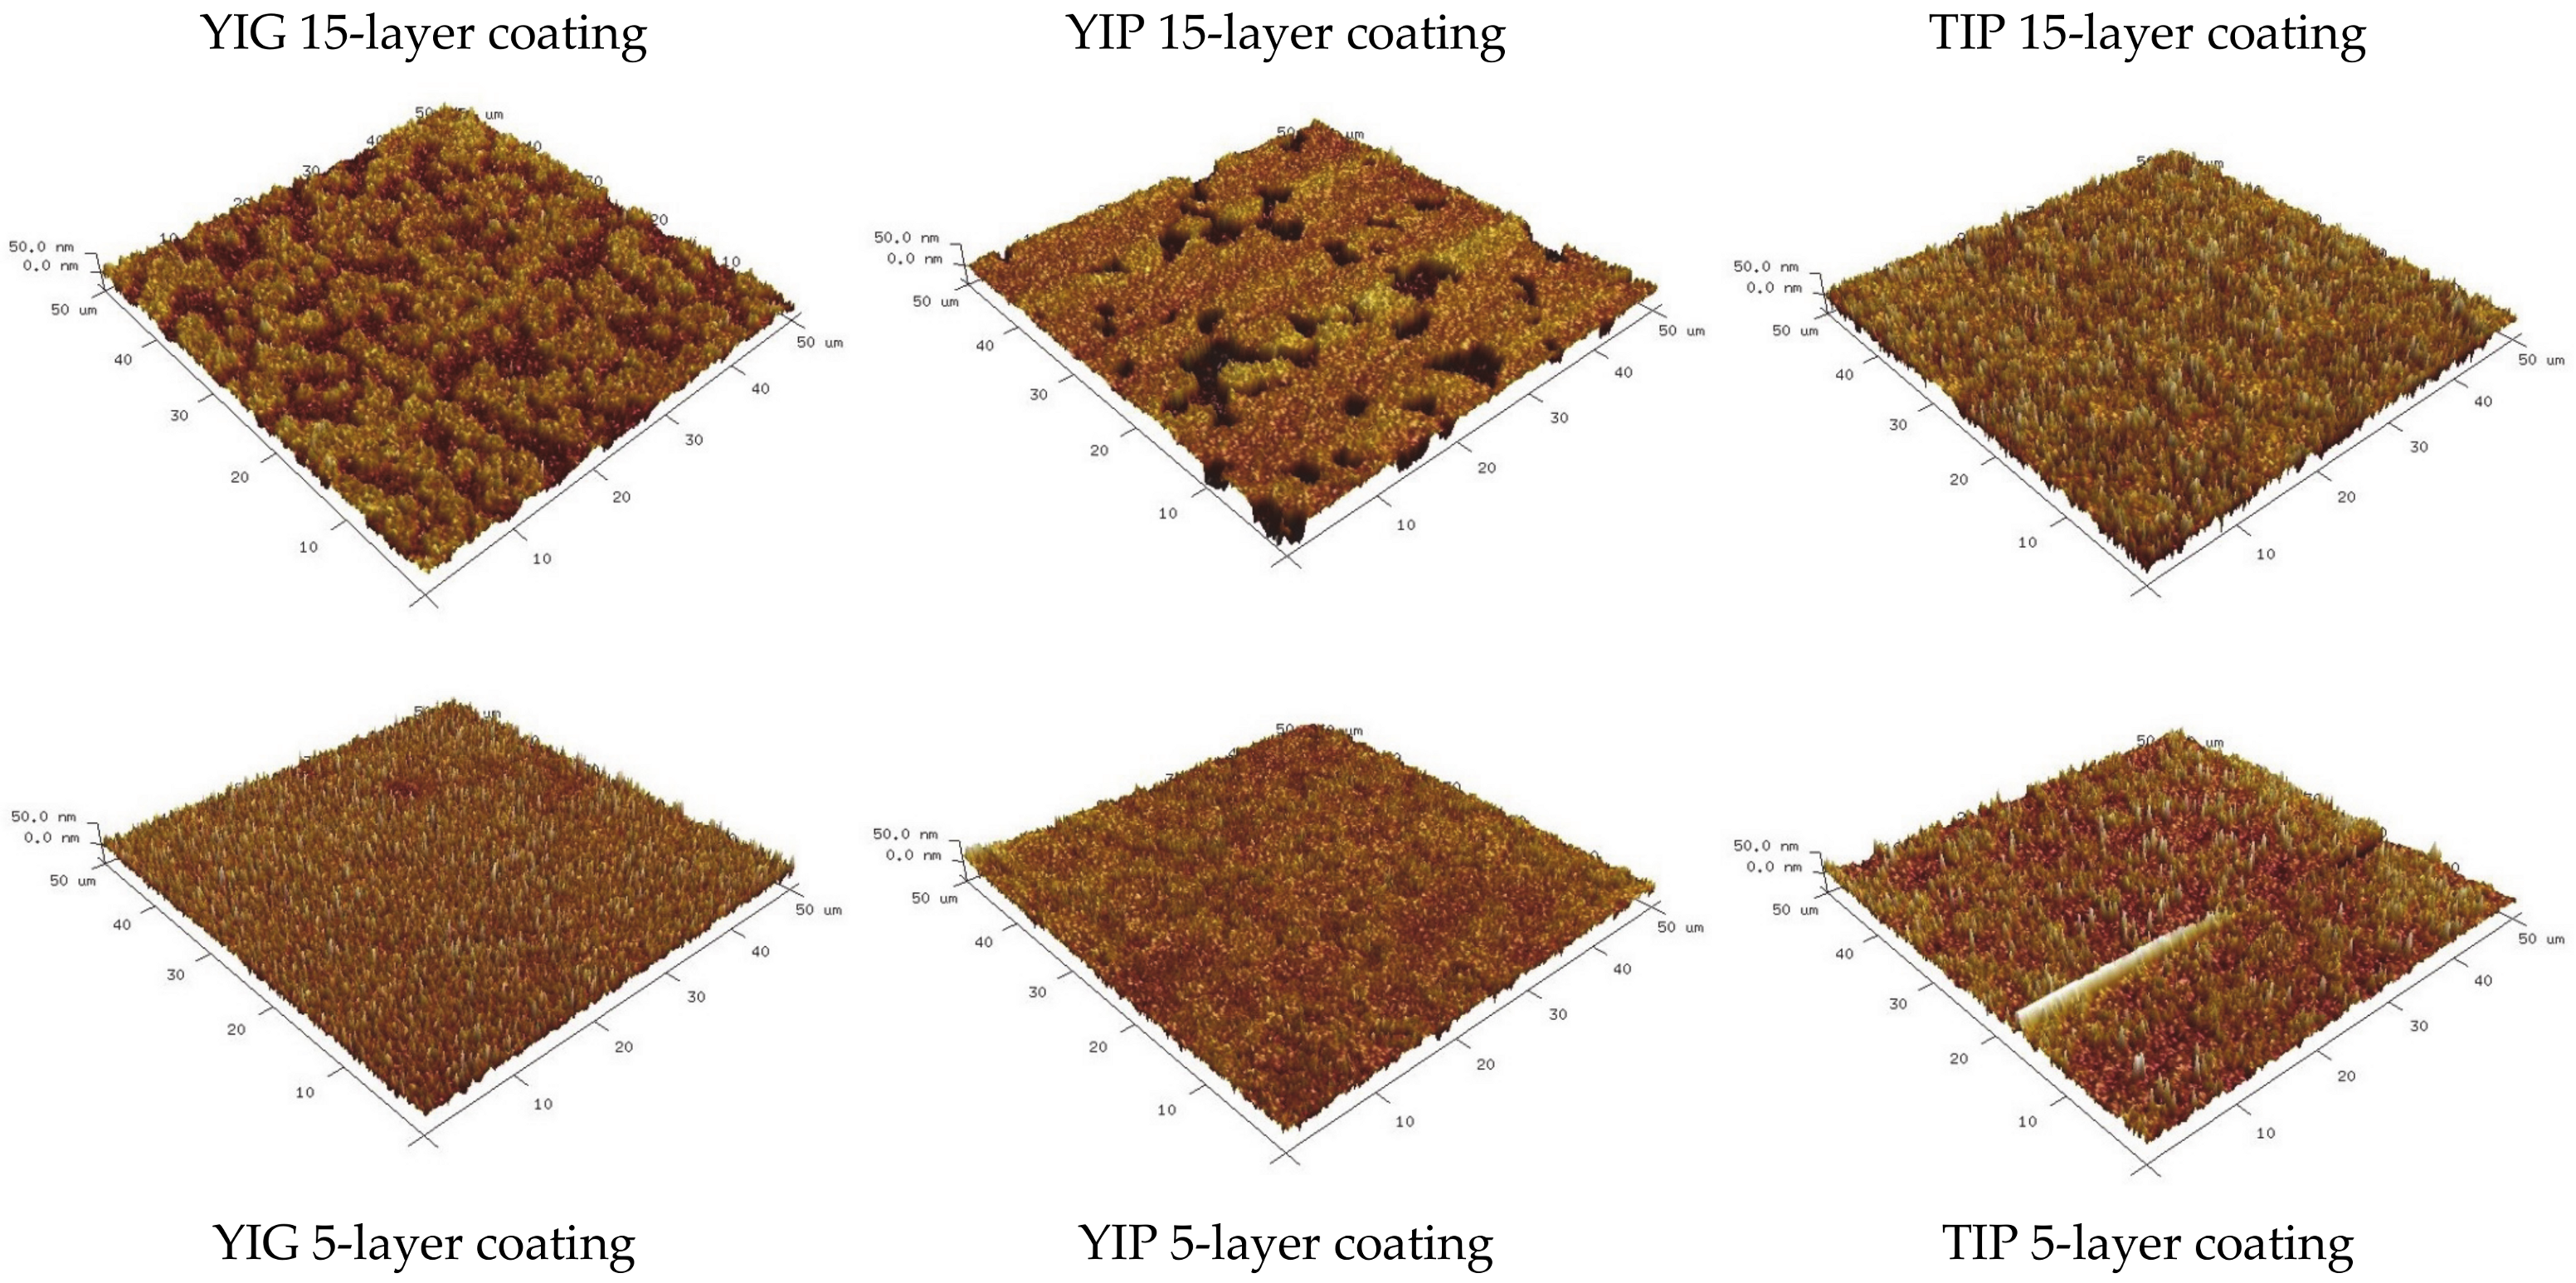
| Rq, nm | Ra, nm | |
|---|---|---|
| YIG 15-layer sample | 10.7 | 8.7 |
| YIG 5-layer sample | 10.1 | 7.9 |
| YIP 15-layer sample | 12.5 | 8.8 |
| YIP 5-layer sample | 8.56 | 6.5 |
| TIP 15-layer sample | 13.6 | 10.7 |
| TIP 5-layer sample | 10.6 | 7.1 |
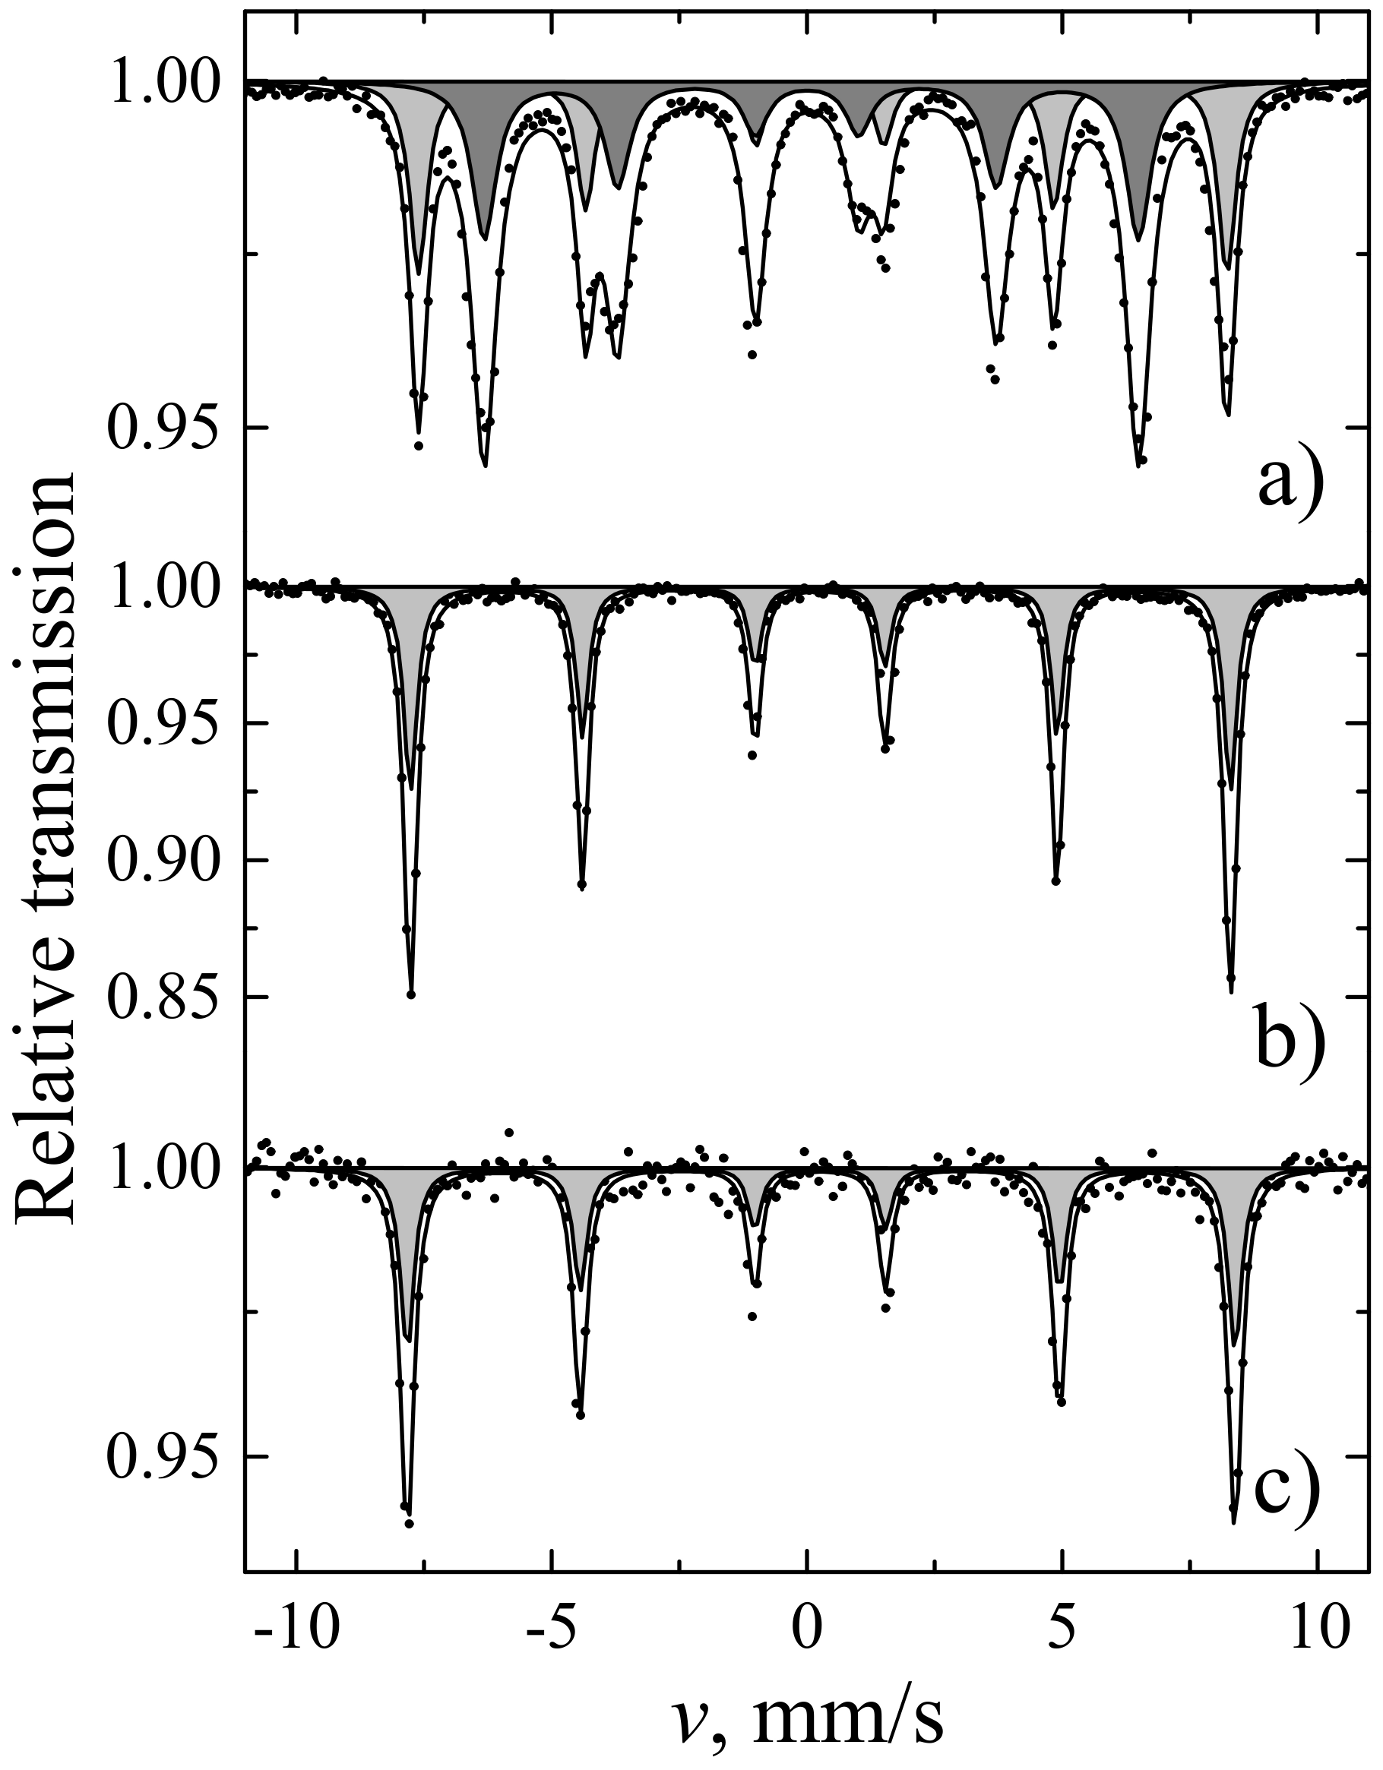
| Sites | S, % | Γ, mm/s | δ, mm/s | 2ε, mm/s | B, T | |
|---|---|---|---|---|---|---|
| YIG | a | 39 | 0.42 ± 0.01 | 0.38 ± 0.01 | 0.06 ± 0.01 | 49.07 ± 0.01 |
| d | 61 | 0.58 ± 0.01 | 0.15 ± 0.01 | 0.08 ± 0.01 | 39.71 ± 0.01 | |
| YIP | - | 100 | 0.31 ± 0.01 | 0.36 ± 0.01 | 0.01 ± 0.01 | 49.78 ± 0.01 |
| TIP | - | 100 | 0.32 ± 0.01 | 0.37 ± 0.01 | 0.02 ± 0.01 | 50.25 ± 0.02 |
| S, % | Γ, mm/s | δ, mm/s | 2ε, mm/s | B, T | ||
|---|---|---|---|---|---|---|
| YIG | 26 ± 3 | 0.37 ± 0.06 | 0.33 ± 0.02 | 0.00 ± 0.03 | 48.29 ± 0.15 | IG a sites |
| 56 ± 3 | 0.66 ± 0.06 | 0.13 ± 0.02 | 0.08 ± 0.04 | 38.76 ± 0.13 | IG d sites | |
| 17 ± 3 | 0.25 ± 0.05 | 0.35 ± 0.01 | −0.21 ± 0.02 | 51.58 ± 0.09 | α-Fe2O3 | |
| YIP | 37 ± 2 | 0.51 ± 0.05 | 0.39 ± 0.02 | −0.03 ± 0.03 | 48.20 ± 0.11 | IG a sites |
| 63 ± 2 | 0.77 ± 0.06 | 0.18 ± 0.02 | 0.09 ± 0.03 | 38.94 ± 0.12 | IG d sites | |
| TIP | 46 ± 5 | 0.62 ± 0.10 | 0.42 ± 0.03 | −0.00 ± 0.06 | 48.49 ± 0.22 | IG a sites |
| 54 ± 5 | 0.61 ± 0.08 | 0.17 ± 0.03 | 0.08 ± 0.05 | 38.95 ± 0.18 | IG d sites |
Publisher’s Note: MDPI stays neutral with regard to jurisdictional claims in published maps and institutional affiliations. |
© 2021 by the authors. Licensee MDPI, Basel, Switzerland. This article is an open access article distributed under the terms and conditions of the Creative Commons Attribution (CC BY) license (http://creativecommons.org/licenses/by/4.0/).
Share and Cite
Januskevicius, J.; Stankeviciute, Z.; Baltrunas, D.; Mažeika, K.; Beganskiene, A.; Kareiva, A. Aqueous Sol-Gel Synthesis of Different Iron Ferrites: From 3D to 2D. Materials 2021, 14, 1554. https://doi.org/10.3390/ma14061554
Januskevicius J, Stankeviciute Z, Baltrunas D, Mažeika K, Beganskiene A, Kareiva A. Aqueous Sol-Gel Synthesis of Different Iron Ferrites: From 3D to 2D. Materials. 2021; 14(6):1554. https://doi.org/10.3390/ma14061554
Chicago/Turabian StyleJanuskevicius, Justinas, Zivile Stankeviciute, Dalis Baltrunas, Kęstutis Mažeika, Aldona Beganskiene, and Aivaras Kareiva. 2021. "Aqueous Sol-Gel Synthesis of Different Iron Ferrites: From 3D to 2D" Materials 14, no. 6: 1554. https://doi.org/10.3390/ma14061554