Article

Glass-Forming Ability and Corrosion Resistance of Al88Y8−xFe4+x (x = 0, 1, 2 at.%) Alloys

1
Department of Engineering Materials and Biomaterials, Silesian University of Technology, Konarskiego 18a, 44-100 Gliwice, Poland
2
Institute of Non-Ferrous Metals, ul. Sowińskiego 5, 44-100 Gliwice, Poland
3
Institute of Physics, University of Silesia, 75 Pułku Piechoty 1, 41-500 Chorzów, Poland
4
Department of Physics, Częstochowa University of Technology, Armii Krajowej 19, 42-200 Częstochowa, Poland
*
Author to whom correspondence should be addressed.
Materials 2021, 14(7), 1581; https://doi.org/10.3390/ma14071581
Submission received: 2 January 2021 / Revised: 14 March 2021 / Accepted: 19 March 2021 / Published: 24 March 2021
(This article belongs to the Special Issue Structure and Properties of Crystalline and Amorphous Alloys)

Abstract

:
The effect of iron and yttrium additions on glass forming ability and corrosion resistance of Al88Y8-xFe4+x (x = 0, 1, 2 at.%) alloys in the form of ingots and melt-spun ribbons was investigated. The crystalline multiphase structure of ingots and amorphous-crystalline structure of ribbons were examined by a number of analytical techniques including X-ray diffraction, Mössbauer spectroscopy, and transmission electron microscopy. It was confirmed that the higher Fe additions contributed to formation of amorphous structures. The impact of chemical composition and structure of alloys on their corrosion resistance was characterized by electrochemical tests in 3.5% NaCl solution at 25 °C. The identification of the mechanism of chemical reactions taking place during polarization test along with the morphology and internal structure of the surface oxide films generated was performed. It was revealed that the best corrosion resistance was achieved for the Al88Y7Fe5 alloy in the form of ribbon, which exhibited the lowest corrosion current density (jcorr = 0.09 μA/cm2) and the highest polarization resistance (Rp = 96.7 kΩ∙cm2).

1. Introduction

Aluminum is commonly used for structural applications due to many favorable features such as low density, good mechanical properties, and corrosion resistance, as well as easy recyclability [1]. Amorphous aluminum alloys with ultra-high specific strength and Al content of 80 to 95 at.% were produced by an ultra-fast cooling method at the end of the 20th century. Various studies showed that an amorphous structure can only be obtained by rapid solidification of aluminum alloys with the addition of rare earth (RE) metals (Gd or Ce; 3–20 at.%), yttrium, or one or two transition metals (TM; Fe, Ni, and/or Co; 1–15 at.%) [2]. The mechanical properties of these alloys depend on the local atomic and long-range structural order. For example, the amorphous, single-phase Al85Ni5Y10 alloy achieved a tensile strength value of 1260 MPa. The fcc-Al nanocrystals are precipitated during the transformation of primary amorphous structure in Al-based alloys (>87 at.%). The result is increasing the tensile strength to 1.5 GPa without reducing plasticity [3]. However, partial or complete crystallization often significantly reduces the corrosion resistance [4]. Aluminum alloys with amorphous structure are characterized by good corrosion resistance because of homogeneity and absence of microstructural imperfections [5,6], and their high solubility of corrosion-resistant elements. However, these materials are susceptible to pitting corrosion generated by chloride ions which can cause premature destruction [7].
Bulk nanocrystalline aluminum alloys are attractive structural or coating materials for aerospace and automotive applications, as well as for light-weight machine parts, because of high strength, hardness, corrosion resistance, electrical conductance, and flexibility [8,9]. Their high specific strength and outstanding corrosion resistance also render these materials applicable for the medical field [5]. However, amorphous Al-based alloys with approximately 90 at.% of aluminum content show poor paramagnetic behavior and are considered relatively uninteresting from a magnetic perspective [10]. Addition of alloying elements in Al-based amorphous alloys can improve their glass-forming ability (GFA), thermal stability, strength, ductility, electrochemical and magnetic properties [1,11,12,13,14,15]. For example, the addition of selected alloying elements of transition and rare-earth metals like Ni, Fe, Co, Ce, Y, and/or Gd (≤15 at.%) enhances the GFA. In addition, Co, Ni, or Fe also improve the local corrosion resistance of the Al-based alloys with amorphous structure [16]. Addition of iron has a positive impact on increasing strength and stiffness of aluminum alloys, whereas addition of nickel increases the modulus of elasticity and improves mechanical strength at high temperatures [17]. Higher content of rare-earth and/or transition metal elements has an influence on the thermal stability and phase content of the alloys after crystallization. For example, an increase in yttrium content causes an increase in the primary crystallization temperature of Al-RE-TM amorphous alloys [18].
In the last decade, Al-Fe-Y metallic glasses have been studied precisely with regard to atomic structure and crystallization scheme, as well as the effects of microalloying additions on their glass forming ability [3,14,15,19,20,21,22,23]. However, the research gap is the structural analysis of Al88Y8−xFe4+x (x = 0, 1, 2 at.%) alloys with the phase composition: fcc-Al, Al3Y, and Al3FeY2. The aim of this work is to assess the impact of alloying additions (Fe and Y) on amorphous phase formation. Also, very few studies have been dedicated to revealing the corrosion resistance of these materials. Considering that corrosion resistance is extremely important to the practical applications of Al-based metallic glasses as engineering materials, the primary aim of the present work is to investigate the influence of alloying elements on the corrosion behavior of Al-Y-Fe alloys obtained by melt spinning (ribbons) or slow casting methods (ingots). The effect of corrosion process on the sample’s surface and chemical reactions were analyzed.

2. Materials and Methods

The studies described herein were provided on Al88Y8−xFe4+x (x = 0, 1, 2 at.%) alloys in the form of ingots and ribbons. The ingots were prepared by induction melting for the appropriate mixtures of elements, such as Al (99.9%), Y (99.9%), Fe (99.9%), in Al2O3 crucible under Ar atmosphere with purity of 99.9%. The external morphology of alloys in the form of ingots after casting was presented in Figure 1. The solidification conditions of the alloys were similar, hence no differences in the morphology of the obtained ingots are visible. The samples in the form of ribbons with a thickness of about 30 µm were prepared by the Bühler Melt Spinner SC apparatus (Edmund Bühler GmbH, Hechingen, Germany) at a wheel speed of 30 m/s.
The structure of ingots and melt-spun alloys was investigated by X-ray diffraction (XRD) and Mössbauer spectroscopy (MS). X-ray diffraction patterns were recorded for samples in a form of powder by 2θ angular range from 10° to 90°. Phase analysis was performed using a Mini Flex 600 (Rigaku, Tokyo, Japan) equipped with a copper tube as an X-ray source and D/TEX strip detector.
Mössbauer 57Fe transmission spectra were recorded at room temperature by MS96 spectrometer (Tampa, FL, USA) with a linear 57Co: Rh source (25 mCi), multichannel analyzer, absorber, and detector. The spectrometer was calibrated with α-Fe foil. The numerical analyses of the Mössbauer spectra were performed with the WMOSS software (Ion Prisecaru, WMOSS4 Mössbauer Spectral Analysis Software, 2009–2016).
The high-resolution transmission electron microscopy (HRTEM) was used to determine structure and phase analysis by S/TEM TITAN 80–300 (FEI Company, Hillsboro, OR, USA).
The electrochemical corrosion investigations were provided in 3.5% NaCl solution at room temperature using an Autolab 302 N potentiostat (Metrohm AG, Herisau, Switzerland), which was controlled by the NOVA software (version 1.11). The measurements were performed in a cell with a water jacket equipped in a saturated calomel electrode (SCE), a platinum counter electrode, and a working electrode (sample). The corrosion behavior was estimated by collecting the open circuit potential (EOCP) variation versus SCE. Corrosion current density (jcorr) was determined by the Tafel extrapolation using the βa and βc coefficients. The polarization resistance (Rp) was defined as the slope of a potential versus current density plot.
Microstructure and surface morphology changes of alloys in the form of ingot were observed using a scanning electron microscope (SEM) Supra 35 (Carl Zeiss, Oberkochen, Germany) with the energy-dispersive X-ray spectroscopy (EDX) EDAX. Additionally, based on the XRD results after corrosion the mechanism of chemical reaction was proposed.

3. Results

3.1. Structural Analysis

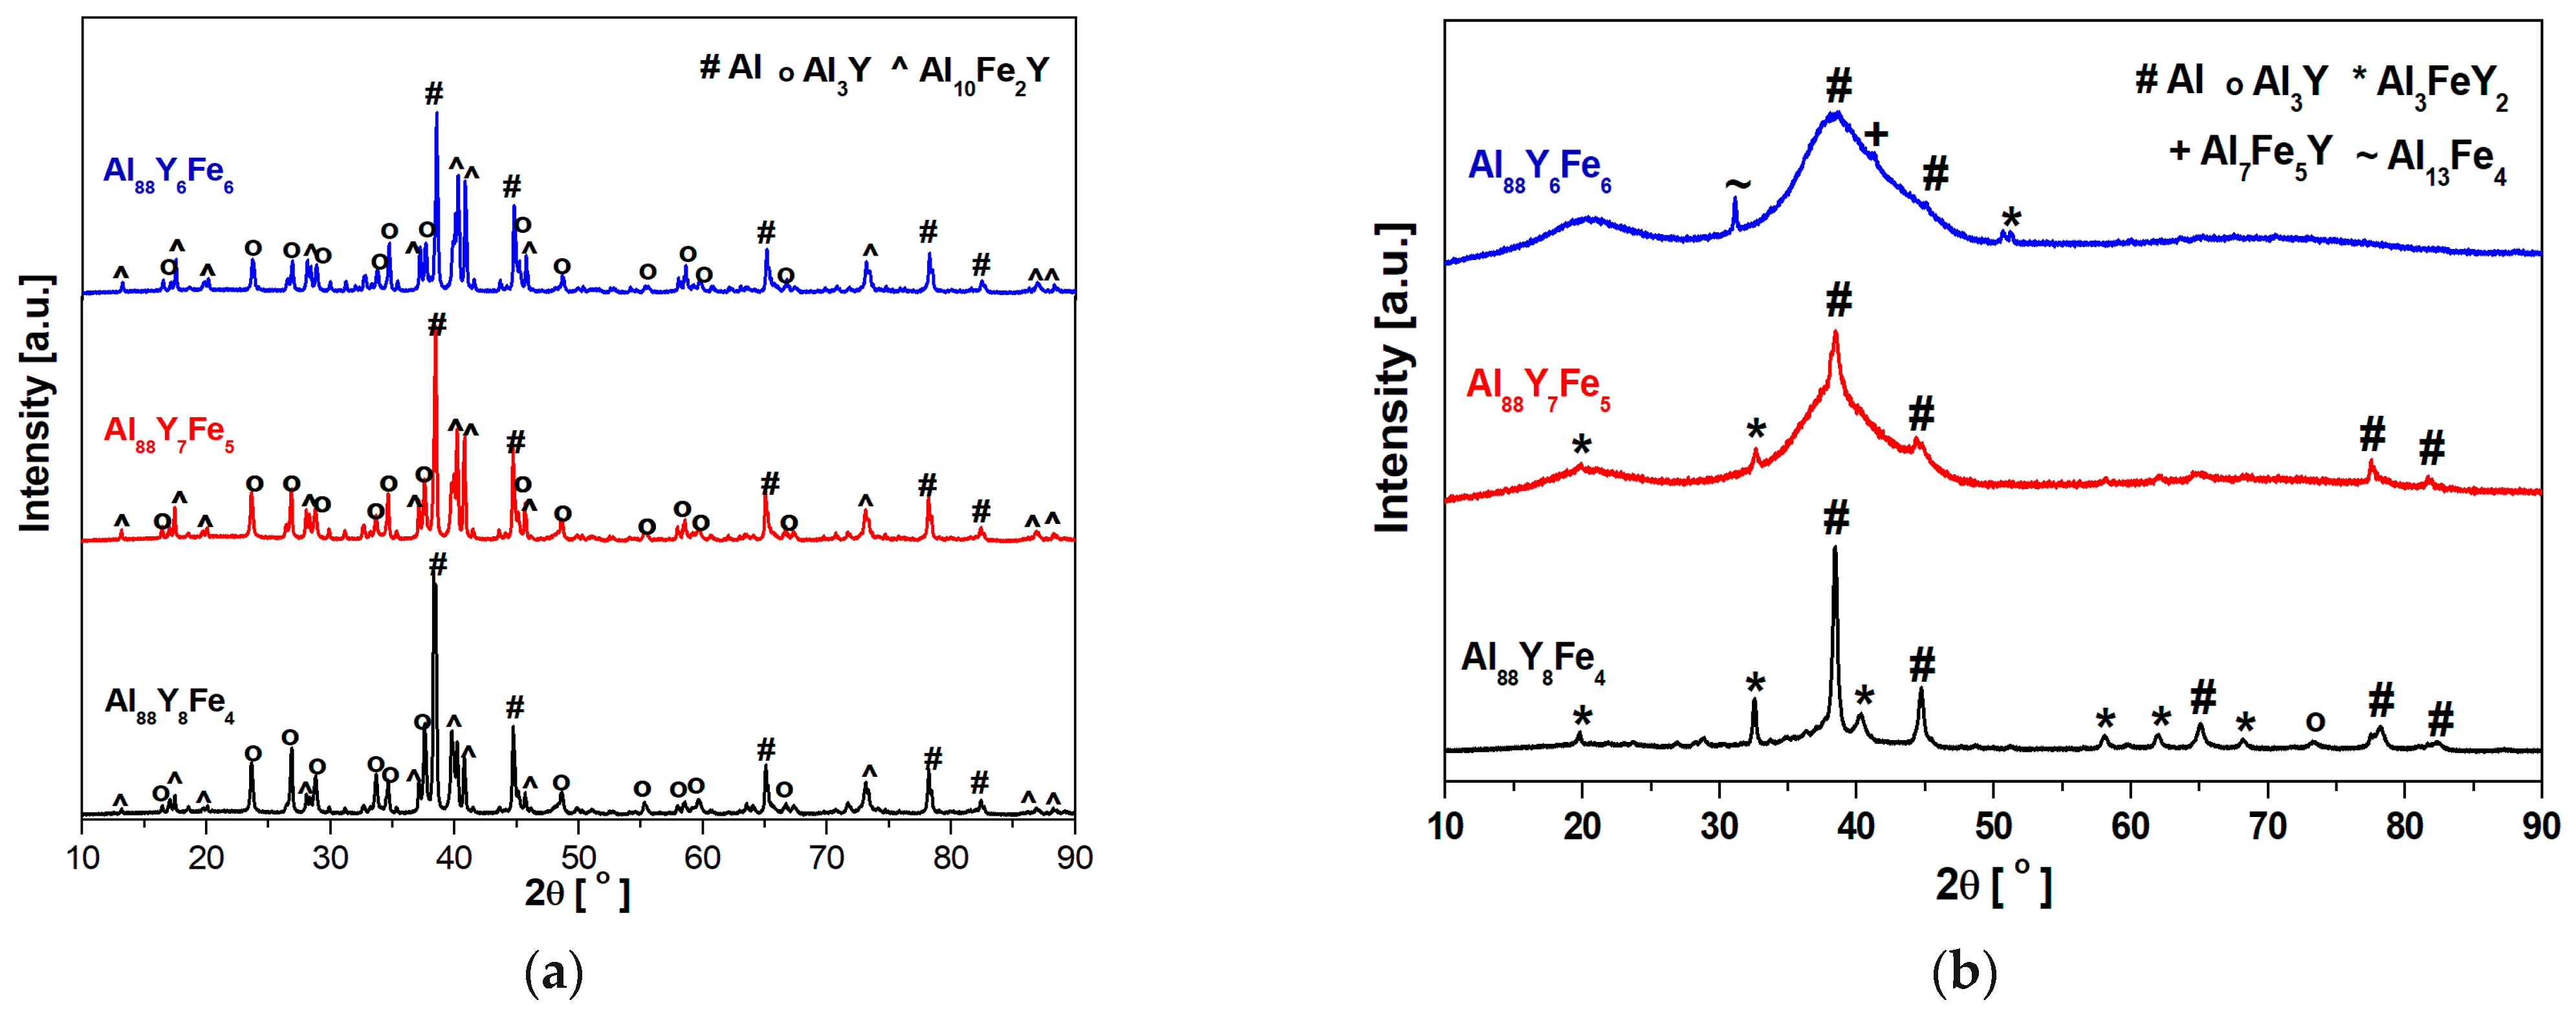
The structure of the Al-based alloys in the as-cast state was evaluated by X-ray diffraction. The XRD patterns of Al88Y6Fe6, Al88Y7Fe5, and Al88Y8Fe4 are presented in Figure 2; ingots—(a) and ribbons—(b). Induction melted alloys were characterized by a multi-phase crystalline structure. The phase composition was the same for all alloying compositions. The ingots were consisted of the following phases: α-Al, Al3Y, and Al10Fe2Y. The same phase composition was also confirmed in the literature for Al80Fe10Y10 (induction melted) [24] and Al82.71Y11.22Fe6.07 (prepared by arc-melting) alloys [25]. The XRD patterns of Al88Y8Fe4 and Al88Y7Fe5 ribbons showed broad diffraction lines as well as sharp peaks corresponding to the following crystalline phases: α-Al, Al3Y, Al3FeY2, Al7Fe5Y, and Al13Fe4. It was noted, that with increased Fe content, the diffraction peaks related to the crystalline phases disappeared and for Al88Y6Fe6 alloy, the close to pure amorphous phase alloy was obtained. The observed first diffuse maximum (Figure 2b) is associated with the presence of a large number of nanocrystals of Al3FeY2 phase.
The α-Al, Al3Y, and AlFeY phases formed after preannealing amorphous Al88Y7Fe5 alloy at 773K were previously reported by Saksl et al. [3]. In addition, Yin et al. [7] published the XRD pattern of an Al88Y7Fe5 master alloy, which showed diffraction peaks corresponding to α-Al, Al3Y, Al3.25Fe, and Fe2Y phases. Other investigations of the Al88Y5Fe7 amorphous alloy were carried out by Yang et al. [26]. The authors showed that nano-sized aluminum crystals precipitate during isothermal annealing at 280 °C for 30 min. Additionally, isothermal annealing leads to further growth of aluminum crystals and precipitation of intermetallic phases at 370 °C for 30 min [26].
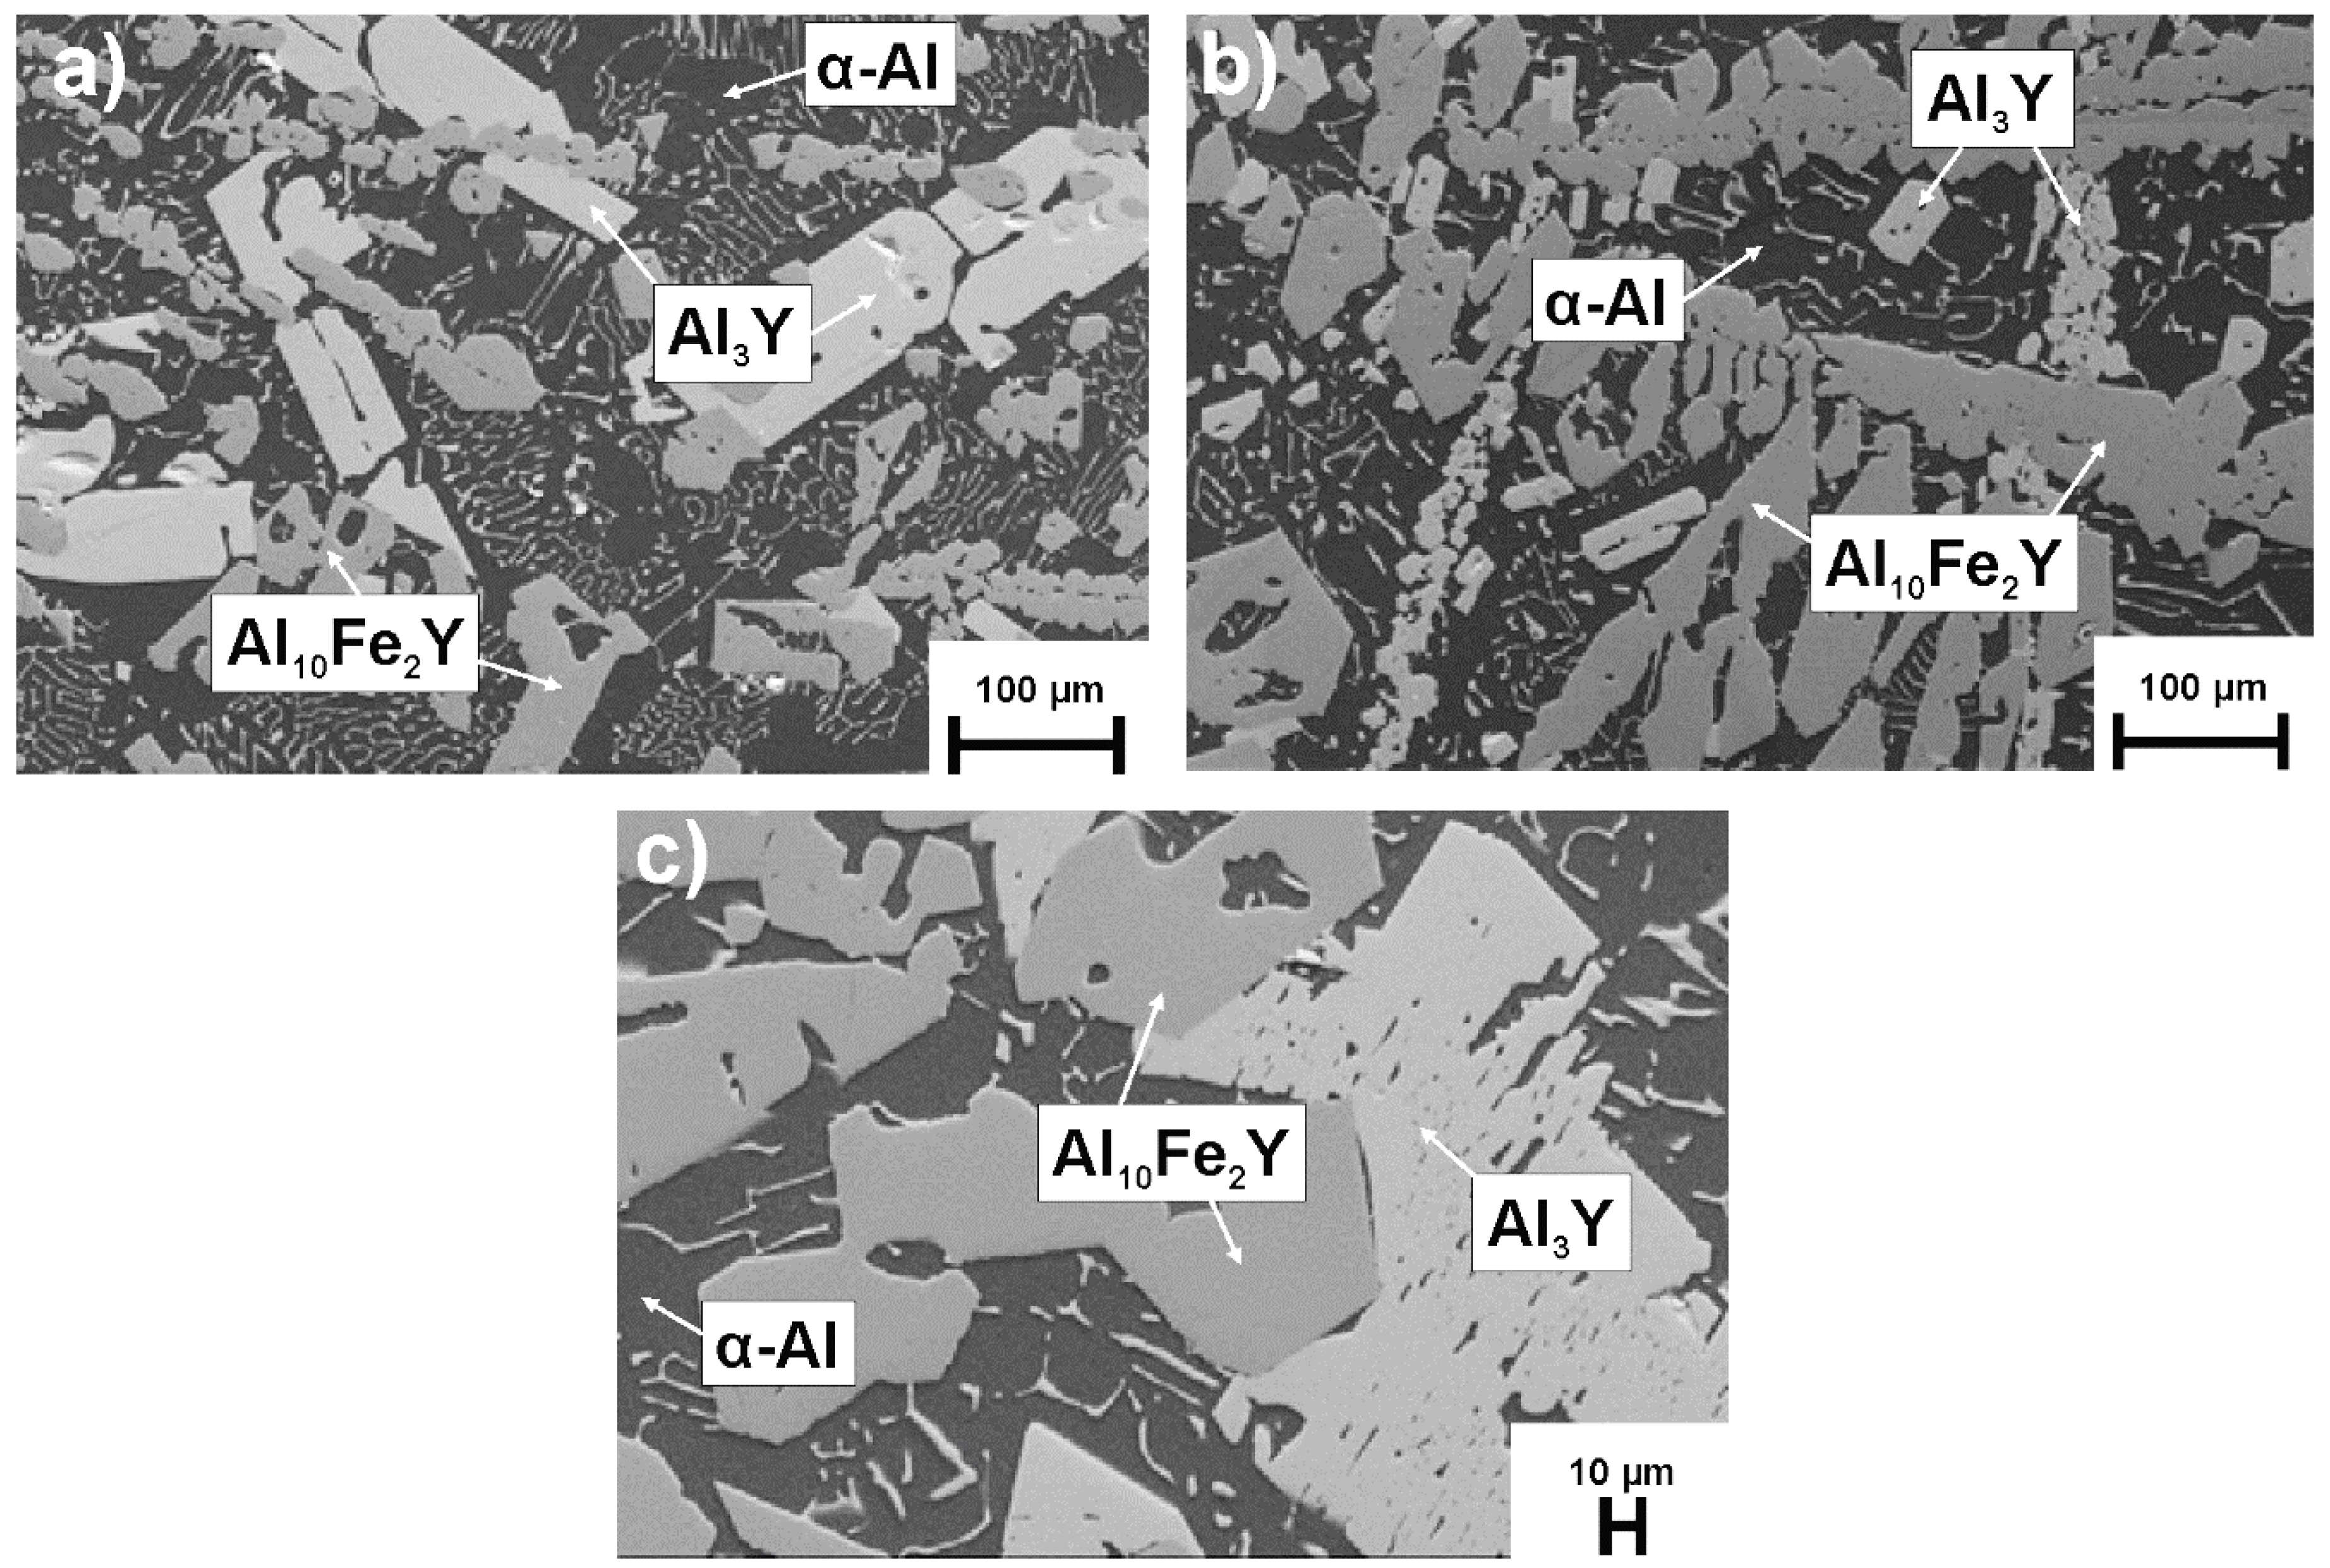
The SEM microscope images of the Al88Y8Fe4, Al88Y7Fe5, and Al88Y6Fe6 ingots are illustrated in Figure 3. The SEM images present the existence of α-Al, Al3Y and Al10Fe2Y phases (identified by EDX). The Al3Y phase crystallized in the form of elongated, regular grains. The Al10Fe2Y formed dendritic structures, which are especially visible for the alloys Al88Y8Fe4 (Figure 3a) and Al88Y7Fe5 (Figure 3b). In the work [24] for the Al80Fe10Y10 alloy, the same phases were identified, however, there was a greater proportion of Al3Y and Al10Fe2Y phases. The paper proposes a crystallization mechanism based on the differential thermal analysis (DTA) cooling curves. First, Al3Y phase was crystallized (~1000 °C), then Al10Fe2Y (~900 °C), and finally aluminum phase (~639 °C).
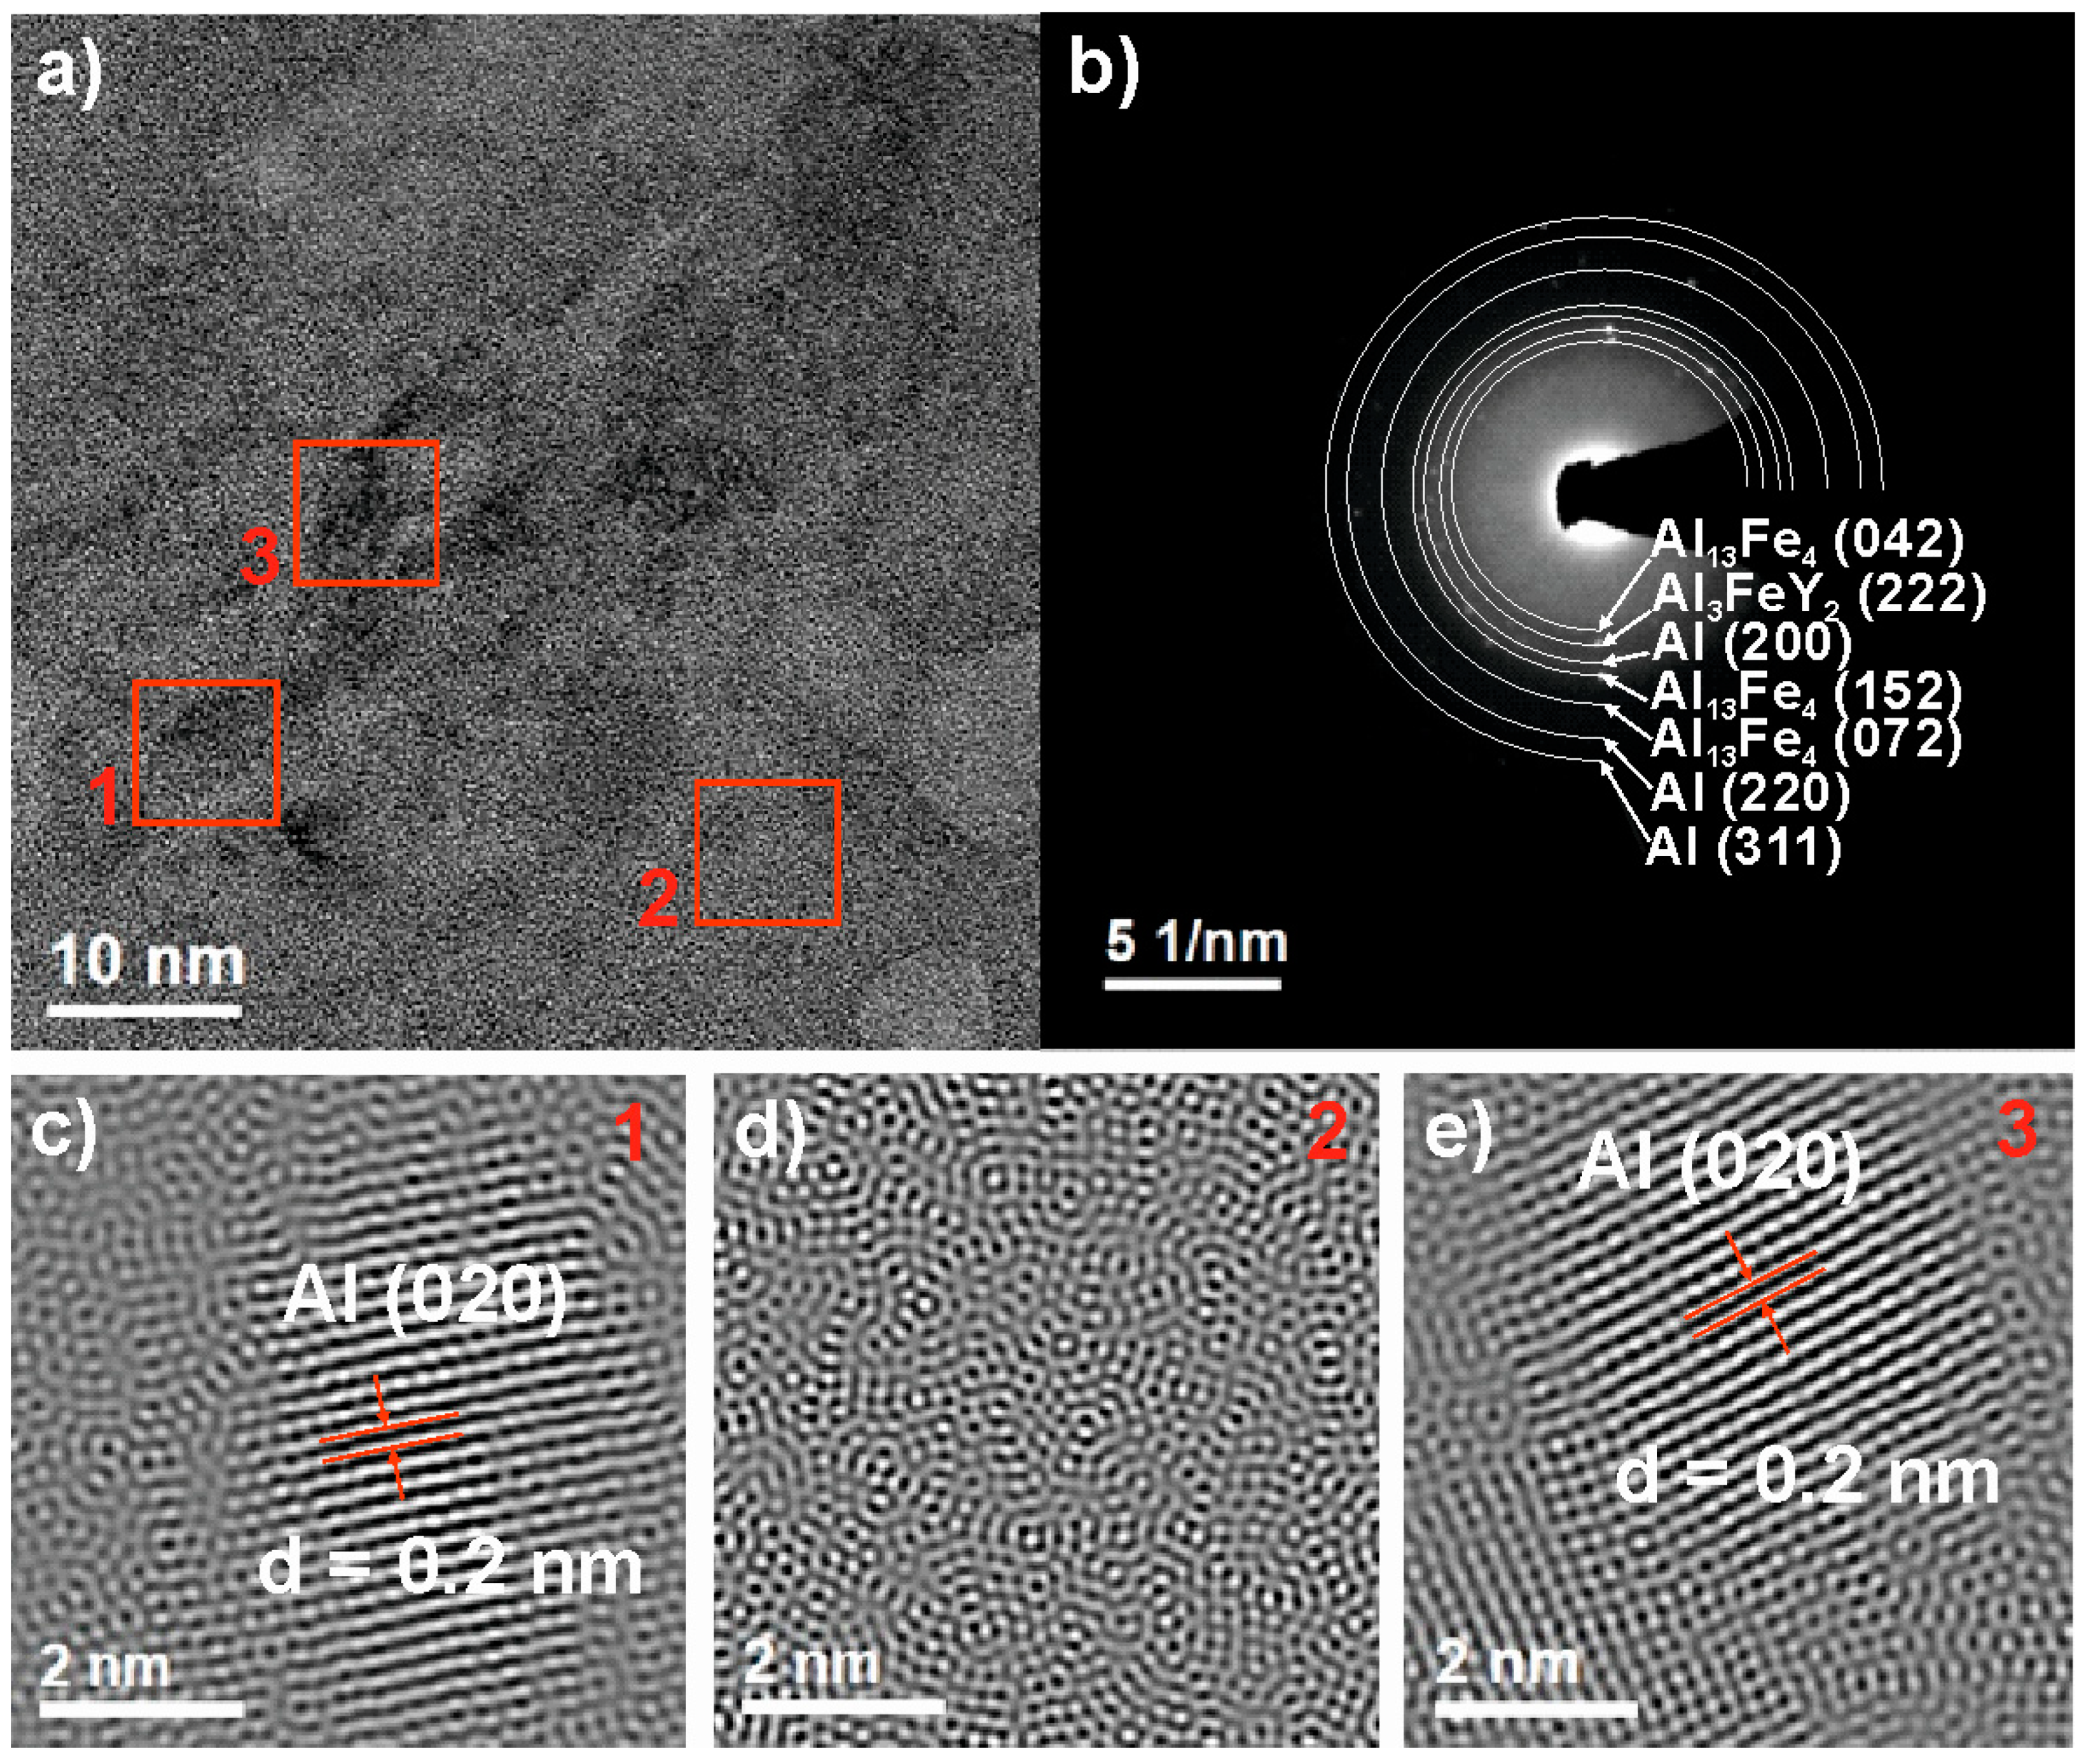
To identify the detailed structure of Al88Y6Fe6 alloy, the HRTEM examinations were carried out in the ribbon sample in as-cast state (Figure 4). Selected area electron diffraction (SAED), presented in Figure 4b, confirmed the presence of α-Al, Al13Fe4, and Al3FeY2 phases in the studied ribbon. These phases were also detected by XRD analysis. To further investigate the structure of as-cast ribbon, the high-resolution image (Figure 4a) was treated by inverse Fourier transfer method (IFT). The HRTEM image with selected areas present a crystalline (Figure 4c,e) and amorphous (Figure 4d) regions. The interplanar spacings in the marked crystalline areas were d = 0.2 nm. The revealed values of d-spacings were found to fit with the interplanar spacings of α-Al phase.
In the works to date, the Al82Fe16Y2, Al85Y10Fe5, Al88Y5Fe7 alloys were described as fully amorphous [27,28]. The occurrence of crystalline phases for these compositions was described as the effect of crystallization during heating [27] or cold-rolling [28] samples from the amorphous state. The publication [29] shows a diagram where the presence of amorphous (ductile and brittle), amorphous-crystalline, and crystalline phases was marked for individual atomic shares of Y and Fe. According to this diagram, the Al88Y8−xFe4+x alloys (x = 0, 1, 2 at.%) are located on the border of the amorphous and crystalline regions, which may suggest the coexistence of these structural states [29]. Additionally, Foley and Perepezko described in work [30] that TEM observations showed the presence of large micrometer sized intermetallic phases in the amorphous matrix in Al88Y7Fe5 alloys.
Figure 5 shows room temperature Mössbauer spectra of Al88Y8−xFe4+x (x = 0, 1, 2 at.%) alloys in the form of ingots. The measurements show that no magnetic ordering is detected in the investigated alloys, which is not surprising considering the low concentration of Fe atoms and that both Y and Al are non-magnetic. These spectra were fitted with two components, which indicate that iron atoms are situated correspondingly in two different neighborhoods of Al atoms. The hyperfine interaction parameters obtained from the analysis of these spectra are summarized in Table 1. Hyperfine parameters of the doublet, which is the main component of all spectra, correspond to Fe atoms located in Al10Fe2Y structure [31]. The singlet corresponding to the solid solution of Fe in Al [31] was also found in these spectra. Room temperature Mössbauer spectra of Al88Y8−xFe4+x (x = 0, 1, 2 at.%) ribbons in their as-cast states are shown in Figure 6. The hyperfine parameters are summarized in Table 2. All Mössbauer spectra for melt-spun ribbons were fitted using two doublets representing two different local environments of a 57Fe nuclide which also means that iron atoms are situated correspondingly in two different neighborhoods of Al and Y atoms. Moreover, the values of isomer shifts of these doublets are quite similar and correspond to amorphous aluminum containing Fe [32,33] not well-crystallized aluminum phase. However, these doublets have significantly different values of quadrupole splitting. Such differences can be the result of substitution of Fe atoms with Y atoms, which have a higher atomic radius, leading to greater distortion in the local environment of an Fe site, and in consequence higher values of quadrupole splitting. For this reason, we assume that the first doublet is connected with aluminum areas rich in Fe and Y atoms and another doublet corresponds to aluminum areas containing only Fe atoms.

3.2. Corrosion Properties

The electrochemical results obtained from measurements in 3.5% NaCl solution at 25 °C for Al88Y8−xFe4+x (x = 0, 1, 2 at.%) alloys in the form of ingots and ribbons are presented in Figure 7. Table 3 compares quantitative results of electrochemical tests. The corrosion resistance can be assessed on the basis of polarization curves by the extrapolation of the Tafel anode and cathode slopes (βa, βc) according to the Stern–Geary method. Based on the Equation (1), Ecorr, Rp, and jcorr were determined [34].
j corr = β a | β c | 2.303   ( β a + | β c | ) 1 R p = B R p
The comparison of the values of open circuit potential and corrosion potential is used in assessing corrosion resistance between individual studied alloys under the same conditions. This approach was also described in other publications [35,36].
It is noticed that the EOCP of all samples during the initial immersion time displayed unstable behavior (Figure 7a,c). The highest open circuit potential values after 3600 s were recorded for Al88Y6Fe6 alloys in the form of ingot (−732 mV) and ribbon (−729 mV). The lowest values of EOCP were indicated by the Al88Y7Fe5 alloy in the form of ingot (−1041 mV), while in case of ribbons, Al88Y8Fe4 (−779 mV). Figure 7b,d shows the polarization curves. The most favorable values of the corrosion potential were indicated by the Al88Y6Fe6 alloy for ingot (−707 mV), for ribbon (−648 mV), while the lowest Ecorr values were observed in the Al88Y7Fe5 alloy for ingot (−987 mV) and ribbon (−691 mV). However, the lowest value of corrosion current density (jcorr = 0.09 μA/cm2) and the highest polarization resistance (Rp = 96.7 kΩ∙cm2) were obtained for the Al88Y7Fe5 alloy in the form of ribbon. The discrepancy between the values of Ecorr and EOCP and icorr indicates a better corrosion resistance of Al88Y7Fe5 alloys, because the potentials are thermodynamic values while the corrosion current density is kinetic and related to the corrosion rate. Despite the higher potentials, the Al88Y8Fe4 and Al88Y6Fe6 alloys will be subject to corrosion phenomena faster.
In all studied compositions, the effect of rapid solidification on the improvement of EOCP, Ecorr, jcorr values is clear. In case of Rp, more favorable values occurred just for Al88Y7Fe5 and Al88Y6Fe6 alloys. Similar, the potentiodynamic polarization curves of Al88Fe5Y7 ribbons in 3.5% NaCl solution were obtained in work [7]. More favorable corrosion resistance properties were observed for the samples in the form of ribbons, and these findings are directly related to the structural testing results for these alloys. The ribbon form of the Al88Y6Fe6 alloy has an amorphous-crystalline structure, and, according to the literature [4], single-phase or close to single-phase structural characteristics improve the corrosion resistance of aluminum alloys. Additionally, studies conducted by Lin et al. [37] confirm that, in partially crystallized alloys, the created phases may enhance the diffusion of passive elements of the alloys to form a protective passive layer. With further crystallization, metallurgical defects, such as grain boundaries and grain edges, are formed in the alloy, thus creating local corrosion-prone regions and decreasing the corrosion resistance of completely crystallized samples. For these reasons, the extent of crystallization significantly affects the corrosion resistance of the alloys. It was also discovered that partially crystallized alloys containing different volume fractions of nano α-Al phases exhibit higher corrosion resistance [37]. Finally, in the study presented in [38], it was found that the volume fraction of nanocrystal α-Al plays an important role in governing the electrochemical corrosion properties of Al-Ni-Y alloys, and complete crystallization causes corrosion resistance deterioration.
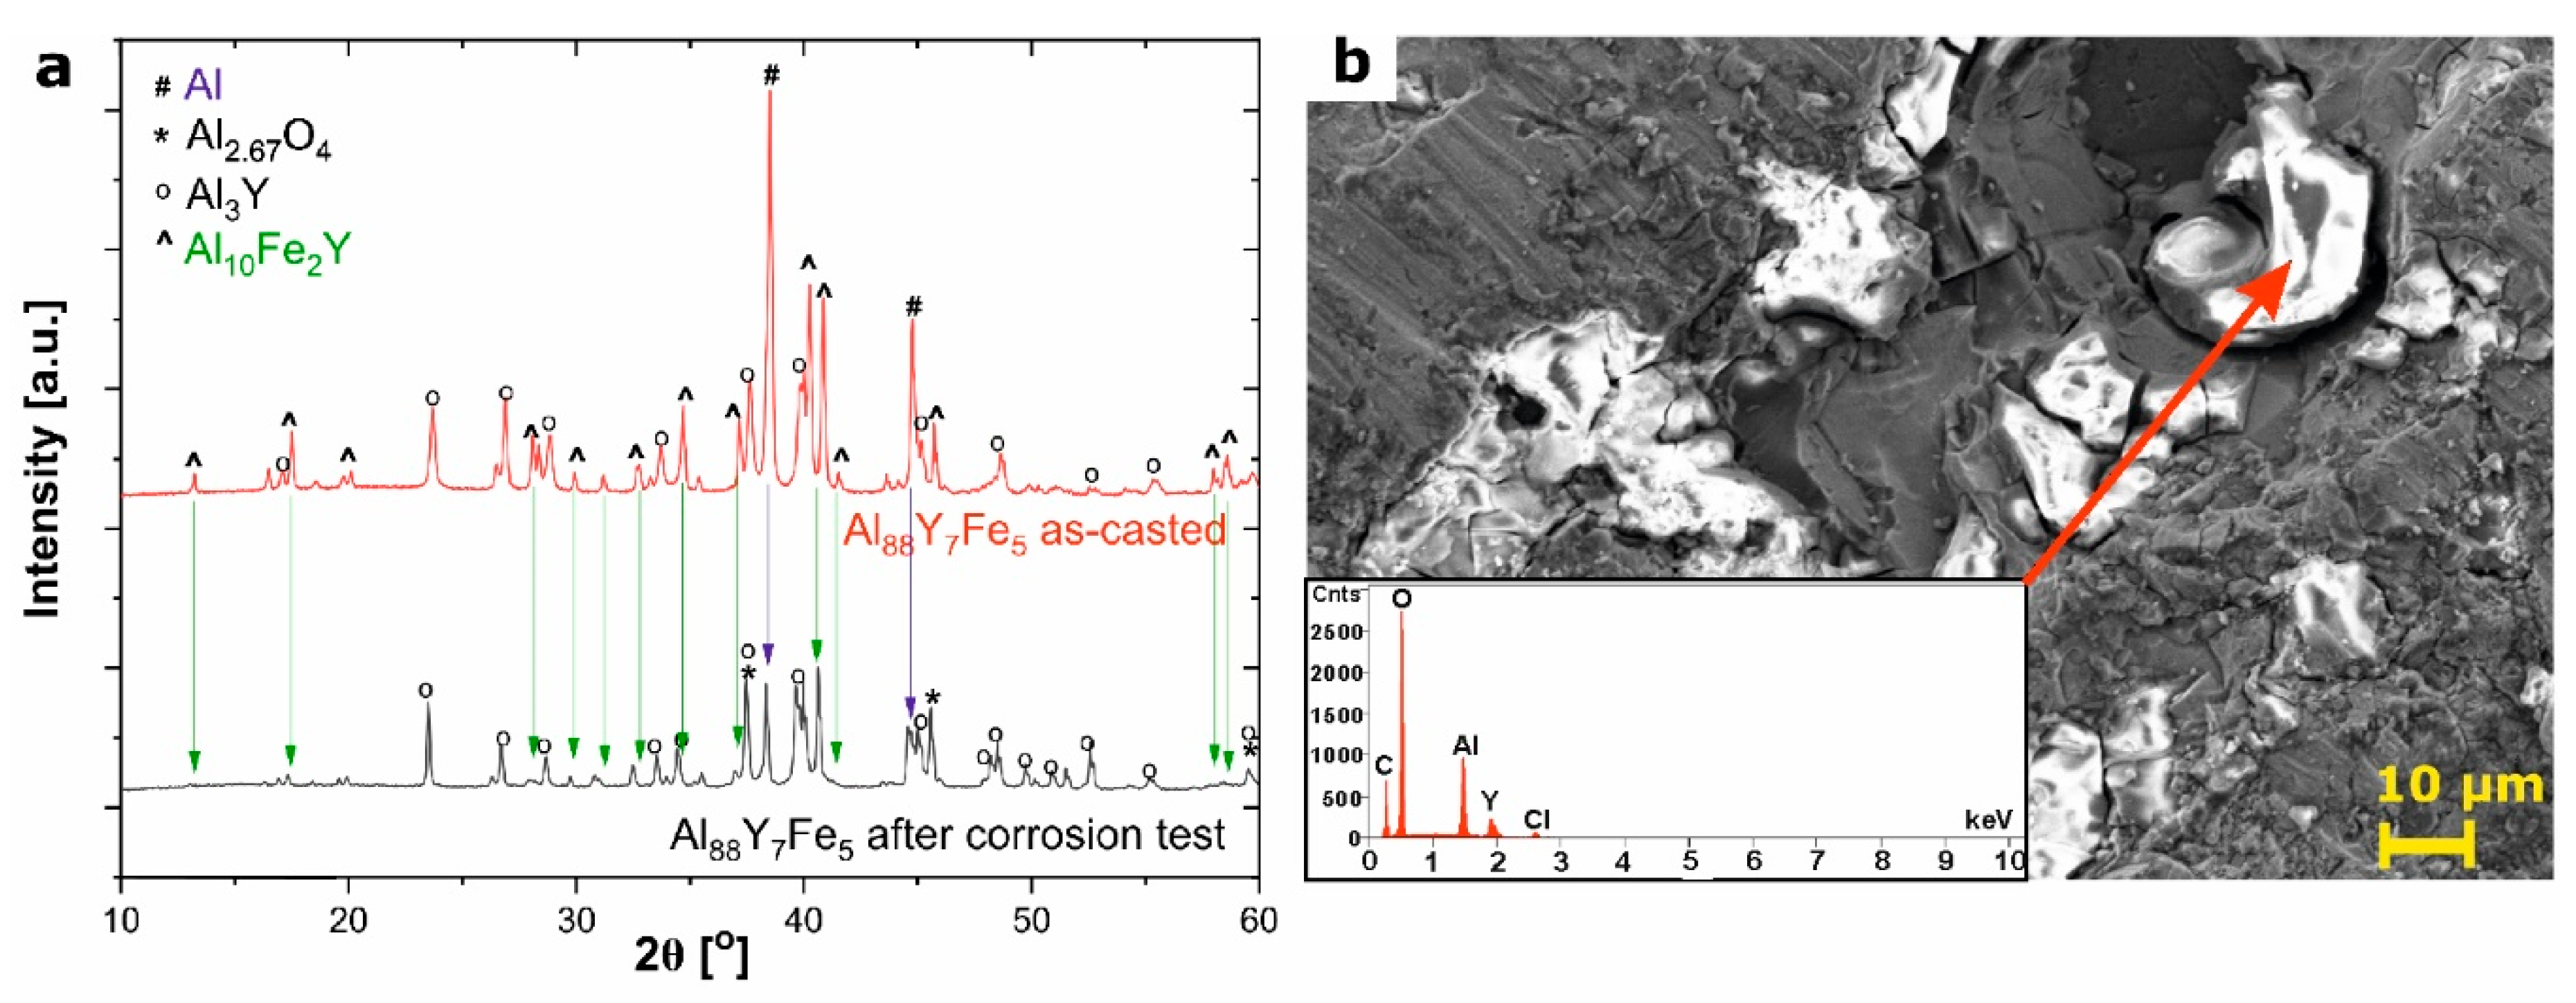
Additionally, to determine the corrosion mechanism, as well as the corrosion products, the XRD patterns and SEM micrographs with EDS (Energy Dispersive Spectrometer) were collected for the samples after immersion corrosion test in NaCl. The analysis of results for the Al88Y8Fe5 alloy in a form of ingot are presented in Figure 8. As can be seen in XRD patterns collected for the same sample before and after the corrosion test, the intensity of the diffraction peaks related to the existence of Al and Al10Fe2Y phases decreased, whereas the changes in the intensity of Al3Y phase were not observed. Moreover, some peaks related to the nonstoichiometric Al2.67O4 phase were indicated for the sample after the corrosion test. It can be concluded that the corrosion resistance of the pure Al, as well as phase with Fe and Y, is much lower than Al3Y. The existence of corrosion products on the surface of the alloy was additionally confirmed by analysis of SEM micrographs and EDX spectra (Figure 8b). The presence of Al and O confirms the formation of the passive layer, whereas peak related to the Y can be attributed to the Al3Y phase with higher corrosion resistance. As was presented in the literature, the addition and formation of phases with Fe increases the corrosion resistance of pure Al [39]. Therefore, firstly, pure Al reacts with electrolyte and form Al3+ ions, which in contact with OH- ions precipitate as Al(OH)3 and then transform in air into Al2.67O4 (porous metal oxide described as a defected spinel structure with some cationic vacancies). With decreasing of the concentration of the Al phase, the same reaction occurs in the Al10Fe2Y phase, however, the Fe atoms also can form the Fe2+ ion, however, the low concentration of the Fe in alloy (5 at.%) made it difficult to identify the products of this reaction (which should be stable oxide: Fe2O3 formed by oxidation of unstable Fe(OH)2 [39]). The corrosion process in electrolyte (NaCl) solution can be described by the Reactions (2–7).
Al ( from   Al   and   Al 10 Fe 2 Y ) electrolyte   Al 3 + + 3 e
Fe ( from   Al 10 Fe 2 Y ) electrolyte   Fe 2 + + 2 e
6 e + 3 O 2 + 6 H 2 O 6 OH
Al 3 + + 3 OH   Al ( OH ) 3
Fe 2 + + 2 OH   Fe ( OH ) 2
4 Fe ( OH ) 2 + O 2 +   2 H 2 O   4 Fe ( OH ) 3
Yin et al. [7] studied the corrosion behavior of an Al88Fe5Y7 alloy in 3.5% NaCl at room temperature with SEM and EDS analysis and observed the formation of an oxide film on the surface of the samples. Further testing of the passive layer using X-ray photoelectron spectroscopy (XPS) techniques confirmed the presence of aluminum, iron, and yttrium oxides. In addition, SEM images did not reveal any signs of pitting, which supports the formation of a passive oxide layer on the surface and the observed corrosion resistance of these alloys in the NaCl environment.

4. Conclusions

In the article, the structural and anticorrosion properties of Al88Y8−xFe4+x alloys (x = 0, 1, 2 at.%) in a form of ingots and melt-spun samples were investigated. The glass-forming ability was increasing with greater iron content, therefore rapidly quenched alloy containing 6 at.% of Fe was characterized by close to the full amorphous structure. The alloy Al88Y7Fe5 in the form of a ribbon was characterized by the lowest corrosion current density and the highest polarization resistance, what indicates the best corrosion resistance.

Author Contributions

Conceptualization, R.B., M.S.; methodology, R.B., M.S.; formal analysis, R.B.; investigation, R.B., M.S., K.M., W.Ł., D.Ł., A.R., M.K.-G., P.G.; writing—original draft preparation, M.S., K.M., W.Ł., A.R., M.K.-G.; supervision, R.B.; results analysis, R.B., D.Ł., P.G.; visualization, K.M. All authors have read and agreed to the published version of the manuscript.

Funding

This research was funded by National Science Centre, Poland, grant number 2018/29/B/ST8/02264.

Institutional Review Board Statement

Not applicable.

Informed Consent Statement

Not applicable.

Data Availability Statement

Data sharing is not applicable to this article.

Conflicts of Interest

The authors declare no conflict of interest.

References

  1. Wang, Z.; Qu, R.; Scudino, S.; A Sun, B.; Prashanth, K.G.; Louzguine-Luzgin, D.V.; Chen, M.W.; Zhang, Z.F.; Eckert, J. Hybrid nanostructured aluminum alloy with super-high strength. NPG Asia Mater. 2015, 7, e229. [Google Scholar] [CrossRef]
  2. Perepezko, J.; Hebert, R.; Tong, W. Amorphization and nanostructure synthesis in Al alloys. Intermetallics 2002, 10, 1079–1088. [Google Scholar] [CrossRef]
  3. Saksl, K.; Jóvári, P.; Franz, H.; Jiang, J.Z. Atomic structure of Al88Y7Fe5 metallic glass. J. Appl. Phys. 2005, 97, 113507. [Google Scholar] [CrossRef]
  4. Sweitzer, J.E.; Scully, J.R.; Bley, R.A.; Hsu, J.W.P. Nanocrystalline Al87Ni8.7Y4.3 and Al90Fe5Gd5 Alloys that Retain the Localized Corrosion Resistance of the Amorphous State. Electrochem. Solid-State Lett. 1999, 2, 267–270. [Google Scholar] [CrossRef]
  5. Fan, C.; Yue, X.; Inoue, A.; Liu, C.-T.; Shen, X.; Liaw, P.K. Recent Topics on the Structure and Crystallization of Al-based Glassy Alloys. Mater. Res. 2019, 22, 1–15. [Google Scholar] [CrossRef] [Green Version]
  6. De Oliveira, L.A.; De Oliveira, M.C.L.; Ríos, C.T.; Antunes, R.A. Corrosion of Al85Ni9Ce6 amorphous alloy in the first hours of immersion in 3.5-wt% NaCl solution: The role of surface chemistry. Surf. Interface Anal. 2019, 52, 50–62. [Google Scholar] [CrossRef]
  7. Yin, P.J. Effect of Au Addition on Intermetallics Precipitation Tendency and Repassivation of Al88Fe5Y7 Glassy Alloy. Int. J. Electrochem. Sci. 2017, 12, 1288–1305. [Google Scholar] [CrossRef]
  8. Louzguine-Luzgin, D.V.; Louzguine-Luzgin, D. Aluminum-base amorphous and nanocrystalline materials. Met. Sci. Heat Treat. 2012, 53, 472–477. [Google Scholar] [CrossRef]
  9. Wu, N.; Lian, J.; Wang, R.; Li, R.; Liu, W. Effect of element types on the glass forming ability of Al-TM-RE ternary metallic glasses using electron structure guiding. J. Alloys Compd. 2017, 723, 123–128. [Google Scholar] [CrossRef]
  10. Dunlap, R.; Lawther, D.; Beydaghyan, G.; McHenry, M.; Srinivas, V. Mössbauer Effect Studies of Amorphous Al-Fe-Rare Earth Alloys. Key Eng. Mater. 1993, 81–83, 413–418. [Google Scholar] [CrossRef]
  11. Yang, H.; Tan, M.-J.; Li, R.; Wang, J. Effect of Minor V Addition on Al88Y7Fe5 Amorphous Alloys. Appl. Mech. Mater. 2013, 302, 76–81. [Google Scholar] [CrossRef]
  12. Wang, J.; Liu, Y.; Imhoff, S.; Chen, N.; Louzguine-Luzgin, D.; Takeuchi, A.; Chen, M.; Kato, H.; Perepezko, J.; Inoue, A. Enhance the thermal stability and glass forming ability of Al-based metallic glass by Ca minor-alloying. Intermetallics 2012, 29, 35–40. [Google Scholar] [CrossRef]
  13. Wang, Y.; Liu, Y.; Li, Y.; An, B.; Cao, G.; Jin, S.; Sun, Y.; Wang, W. Crystallization of Al-based Amorphous Alloys in Good Conductivity Solution. J. Mater. Sci. Technol. 2014, 30, 1262–1270. [Google Scholar] [CrossRef]
  14. Shen, Y.; Perepezko, J. Al-based amorphous alloys: Glass-forming ability, crystallization behavior and effects of minor alloying additions. J. Alloys Compd. 2017, 707, 3–11. [Google Scholar] [CrossRef] [Green Version]
  15. Shen, Y.; Perepezko, J. The effect of minor addition of insoluble elements on transformation kinetics in amorphous Al alloys. J. Alloys Compd. 2015, 643, S260–S264. [Google Scholar] [CrossRef] [Green Version]
  16. Presuel-Moreno, F.; Jakab, M.; Tailleart, N.; Goldman, M.; Scully, J. Corrosion-resistant metallic coatings. Mater. Today 2008, 11, 14–23. [Google Scholar] [CrossRef]
  17. Engin, S.; Büyük, U.; Maraşlı, N. The effects of microstructure and growth rate on microhardness, tensile strength, and electrical resistivity for directionally solidified Al–Ni–Fe alloys. J. Alloys Compd. 2016, 660, 23–31. [Google Scholar] [CrossRef]
  18. Mika, T.; Karolus, M.; Boichyshyn, L.; Haneczok, G.; Kotur, B.; Nosenko, V. Crystallization of Al87Y5Ni8 amorphous alloys doped with Dy and Fe. Chem. Met. Alloy. 2012, 5, 50–58. [Google Scholar] [CrossRef]
  19. Sahu, K.; Mauro, N.; Longstreth-Spoor, L.; Saha, D.; Nussinov, Z.; Miller, M.; Kelton, K. Phase separation mediated devitrification of Al88Y7Fe5 glasses. Acta Mater. 2010, 58, 4199–4206. [Google Scholar] [CrossRef]
  20. Bondi, K.; Gangopadhyay, A.; Marine, Z.; Kim, T.; Mukhopadhyay, A.; Goldman, A.; Buhro, W.E.; Kelton, K. Effects of microalloying with 3d transition metals on glass formation in AlYFe alloys. J. Non-Cryst. Solids 2007, 353, 4723–4731. [Google Scholar] [CrossRef]
  21. Gao, M.; Perepezko, J. Flash DSC determination of the delay time for primary crystallization and minor alloying effect in marginal Al-based metallic glasses. Thermochim. Acta 2019, 677, 91–98. [Google Scholar] [CrossRef]
  22. Xiong, X.; Yi, J.; Kong, L.; Jiang, Z.; Huang, Y.; Li, J. The atomic packing structure of Al-(TM)-Y metallic glasses. Intermetallics 2019, 111, 106505. [Google Scholar] [CrossRef]
  23. Sadoc, A.; Sabra, M.; Proux, O.; Hazemann, J.-L.; Bondi, K.; Kelton, K. Zr and Hf microalloying in an Al–Y–Fe amorphous alloy. Relation between local structure and glass-forming ability. Philos. Mag. 2008, 88, 2569–2582. [Google Scholar] [CrossRef] [Green Version]
  24. Babilas, R.; Łoński, W.; Młynarek, K.; Bajorek, A.; Radoń, A. Relationship between the Thermodynamic Parameters, Structure, and Anticorrosion Properties of Al-Zr-Ni-Fe-Y Alloys. Met. Mater. Trans. A 2020, 51, 4215–4227. [Google Scholar] [CrossRef]
  25. Feng, H.; Zhang, M.; Chen, H.; Liang, J.; Tao, X.; Ouyang, Y.; Du, Y. Experimental Investigation on Phase Equilibria of Al-Fe-Y System at 773 K. J. Phase Equilibria Diffus. 2014, 35, 256–261. [Google Scholar] [CrossRef]
  26. Yang, H.; Luo, L.; Shen, Y.; Li, C.; Li, R. Glass forming ability and thermal stability of Al-Y-Fe amorphous alloys. J. Shenyang Univ. Technol. 2014, 36, 498–502. [Google Scholar] [CrossRef]
  27. Nguyen, V.H.; Nguyen, O.T.H.; Dudina, D.V.; Le, V.V.; Kim, J.-S. Crystallization Kinetics of Al-Fe and Al-Fe-Y Amorphous Alloys Produced by Mechanical Milling. J. Nanomater. 2016, 2016, 1–9. [Google Scholar] [CrossRef] [Green Version]
  28. Hebert, R.; Perepezko, J. Effect of Intense Rolling and Folding on the Phase Stability of Amorphous Al-Y-Fe Alloys. Met. Mater. Trans. A 2007, 39, 1804–1811. [Google Scholar] [CrossRef]
  29. Inoue, A.; Kong, F.; Zhu, S.; Liu, C.T.; Al-Marzouki, F. Development and Applications of Highly Functional Al-based Materials by Use of Metastable Phases. Mater. Res. 2015, 18, 1414–1425. [Google Scholar] [CrossRef] [Green Version]
  30. Foley, J.; Perepezko, J. The devitrification of Al-Y-Fe amorphous alloys. J. Non-Cryst. Solids 1996, 205–207, 559–562. [Google Scholar] [CrossRef]
  31. Waerenborgh, J.C.; Salamakha, P.; Sologub, O.; Sério, S.; Godinho, M.; Gonçalves, A.P.; Almeida, M. Y-Fe-Al ternary system: Partial isothermal section at 1070 K: Powder X-ray diffraction and Mössbauer spectroscopy study. J. Alloys Compd. 2001, 323–324, 78–82. [Google Scholar] [CrossRef]
  32. Sitek, J.; Degmová, J. Aluminium-based amorphous and nanocrystalline alloys with Fe impurity. Czechoslov. J. Phys. 2006, 56, E17–E22. [Google Scholar] [CrossRef]
  33. Dunlap, R.; Yewondwossen, M.; Lawther, D. Mössbauer effect studies of amorphous Al-Y-Ni-Fe alloys. J. Non-Cryst. Solids 1993, 156–158, 192–195. [Google Scholar] [CrossRef]
  34. McCafferty, E. Validation of corrosion rates measured by the Tafel extrapolation method. Corros. Sci. 2005, 47, 3202–3215. [Google Scholar] [CrossRef]
  35. Kirtay, S. Improvement of Oxidation Resistance of Mild Steel by SiO2-Al2O3 Sol Gel Coating. Acta Phys. Pol. A 2015, 128, 90–92. [Google Scholar] [CrossRef]
  36. Jinhong, P.; Ye, P.; Jili, W.; Xiancong, H. Influence of Minor Addition of in on Corrosion Resistance of Cu-Based Bulk Metallic Glasses in 3.5% NaCl Solution. Rare Met. Mater. Eng. 2014, 43, 32–35. [Google Scholar] [CrossRef]
  37. Lin, J.; Xu, J.; Wang, W.; Li, W. Electrochemical behavior of partially crystallized amorphous Al86Ni9La5 alloys. Mater. Sci. Eng. B 2011, 176, 49–52. [Google Scholar] [CrossRef]
  38. Zhang, L.; Zhang, S.; Ma, A.; Hu, H.; Zheng, Y.; Yang, B.; Wang, J. Thermally induced structure evolution on the corrosion behavior of Al-Ni-Y amorphous alloys. Corros. Sci. 2018, 144, 172–183. [Google Scholar] [CrossRef]
  39. Seikh, A.H.; Baig, M.; Singh, J.K.; Mohammed, J.A.; Luqman, M.; Abdo, H.S.; Khan, A.R.; Alharthi, N.H. Microstructural and Corrosion Characteristics of Al-Fe Alloys Produced by High-Frequency Induction-Sintering Process. Coatings 2019, 9, 686. [Google Scholar] [CrossRef] [Green Version]
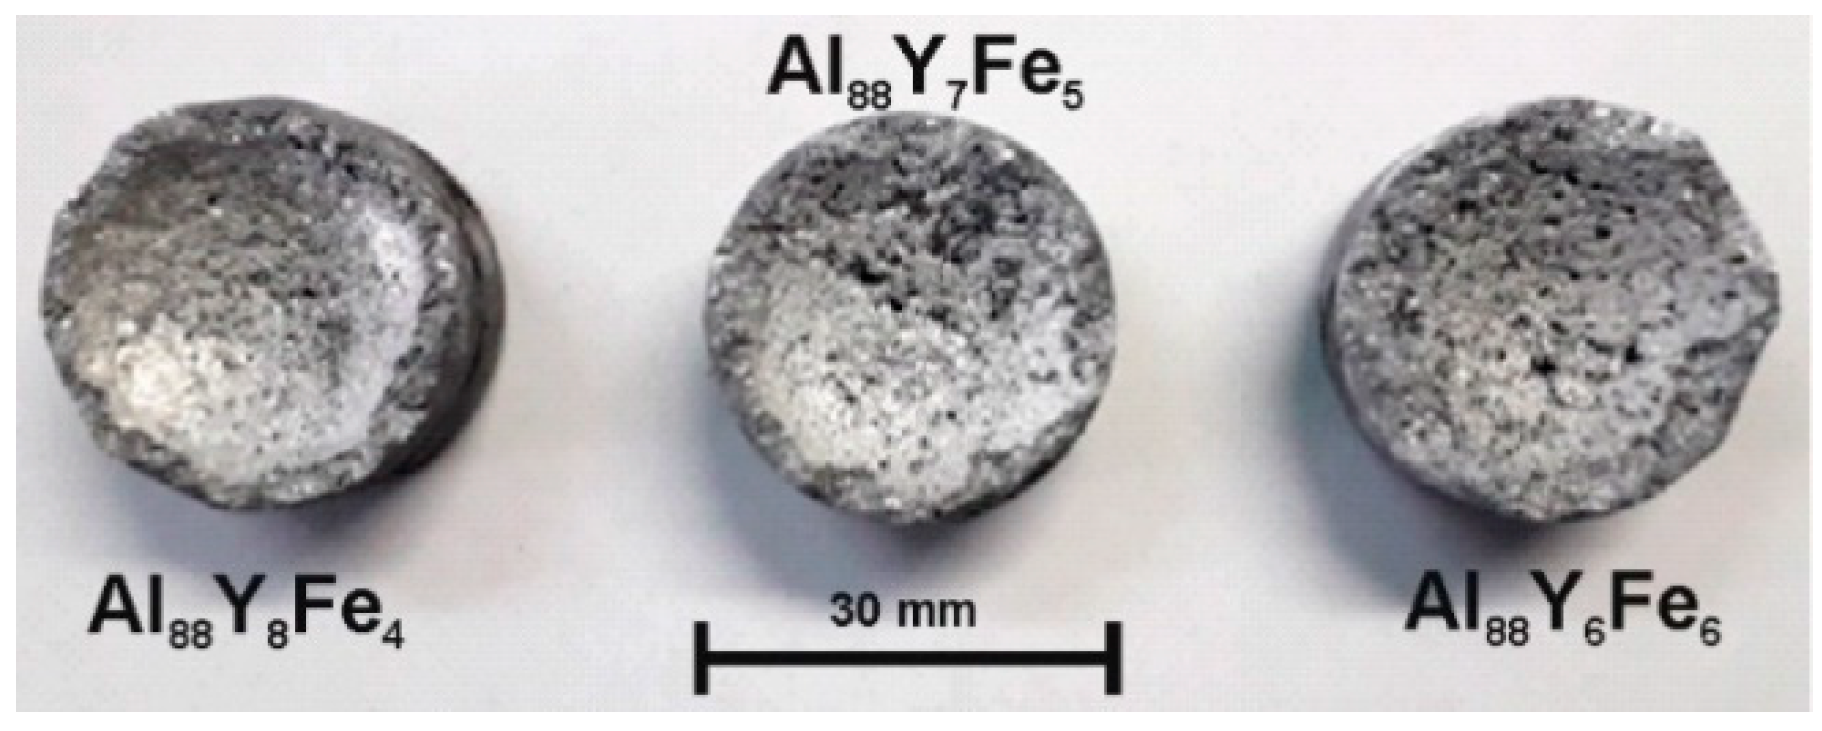
Figure 1. External morphology of Al88Y8Fe4, Al88Y7Fe5, and Al88Y6Fe6 alloys in the form of ingots.
Materials 14 01581 g001
Figure 2. X-ray diffraction (XRD) patterns of Al88Y6Fe6, Al88Y7Fe5, and Al88Y8Fe4 alloys in the form of ingots (a) and in the form of ribbons (b) in as-cast states.
Materials 14 01581 g002
Figure 3. Microstructures of (a) Al88Y8Fe4, (b) Al88Y7Fe5, (c) Al88Y6Fe6 alloys in the form of ingots.
Materials 14 01581 g003
Figure 4. High-resolution transmission electron microscopy (HRTEM) image (a), selected area electron diffraction (SAED) pattern (b) of Al88Y6Fe6 ribbon, and inverse Fourier transfer (IFT) images (ce) from selected areas 1–3.
Materials 14 01581 g004
Figure 5. Mössbauer spectra of Al88Y8Fe4, Al88Y7Fe5, and Al88Y6Fe6 alloys in the form of ingots.
Materials 14 01581 g005
Figure 6. Mössbauer spectra of Al88Y8Fe4, Al88Y7Fe5, and Al88Y6Fe6 alloys in the form of ribbons.
Materials 14 01581 g006
Figure 7. Changes of the open-circuit potential with time (a,c) and polarization curves (b,d) in 3.5% NaCl solution at 25 °C of ingots (a,b) and ribbons (c,d).
Materials 14 01581 g007
Figure 8. Analysis of the formation process of corrosion products on the surface of Al88Y7Fe5 alloy: (a) comparison of XRD patterns of alloy before and after corrosion test with marked identified phases, (b) scanning electron microscopy (SEM) micrograph of Al88Y7Fe5 surface after corrosion test (inset shows the energy-dispersive X-ray (EDX) spectrum).
Materials 14 01581 g008
Table 1. Hyperfine parameters of Al88Y8-xFe4+x (x = 0, 1, 2 at.%) alloys in ingot states (IS = isomer shift, QS = quadrupole splitting, FWHM = full width at half maximum, A = relative area derived from the spectra).
ComponentIS (mm/s)QS (mm/s)FWHM (mm/s)A (%)Compound
Al88Y6Fe6
Singlet0.31-0.2722Al(Fe)
Doublet0.300.1578Al10Fe2Y [32]
Al88Y7Fe5
Singlet0.34-0.2722Al(Fe)
Doublet0.290.0978Al10Fe2Y [32]
Al88Y8Fe4
Singlet0.34-0.2726Al(Fe)
Doublet0.290.1074Al10Fe2Y [32]
Table 2. Hyperfine parameters of Al88Y8−xFe4+x (x = 0, 1, 2 at.%) alloys in ribbon states (IS = isomer shift, QS = quadrupole splitting, FWHM = full width at half maximum, A = relative area derived from the spectra).
ComponentIS (mm/s)QS (mm/s)FWHM (mm/s)A (%)Compound
Al88Y6Fe6
Doublet 10.170.400.2758Al(Fe,Y)
Doublet 20.150.2242Al(Fe)
Al88Y7Fe5
Doublet 10.160.390.2763Al(Fe,Y)
Doublet 20.150.1837Al(Fe)
Al88Y8Fe4
Doublet 10.170.470.3667Al(Fe,Y)
Doublet 20.200.1633Al(Fe)
Table 3. Results of polarization tests of Al-Y-Fe alloys in the form of ingots and ribbons (EOCP = open circuit potential, Ecorr = corrosion potential, βa, βc = anodic and cathodic Tafel slopes, Rp = polarization resistance, jcorr = corrosion current density).
AlloyEOCP
(Mv)
Ecorr
(mV)
a|
(mV/dec)
c|
(mV/dec)
Rp
(kΩ∙cm2)
jcorr
(μA/cm2)
Ingots
Al88Y8Fe4−888−92116721915.22.70
Al88Y7Fe5−1041−98762877.91.99
Al88Y6Fe6−732−70776101.42.67
Ribbons
Al88Y8Fe4−779−653242412.20.14
Al88Y7Fe5−731−6911972396.70.09
Al88Y6Fe6−729−64871114.90.12
Publisher’s Note: MDPI stays neutral with regard to jurisdictional claims in published maps and institutional affiliations.