Article

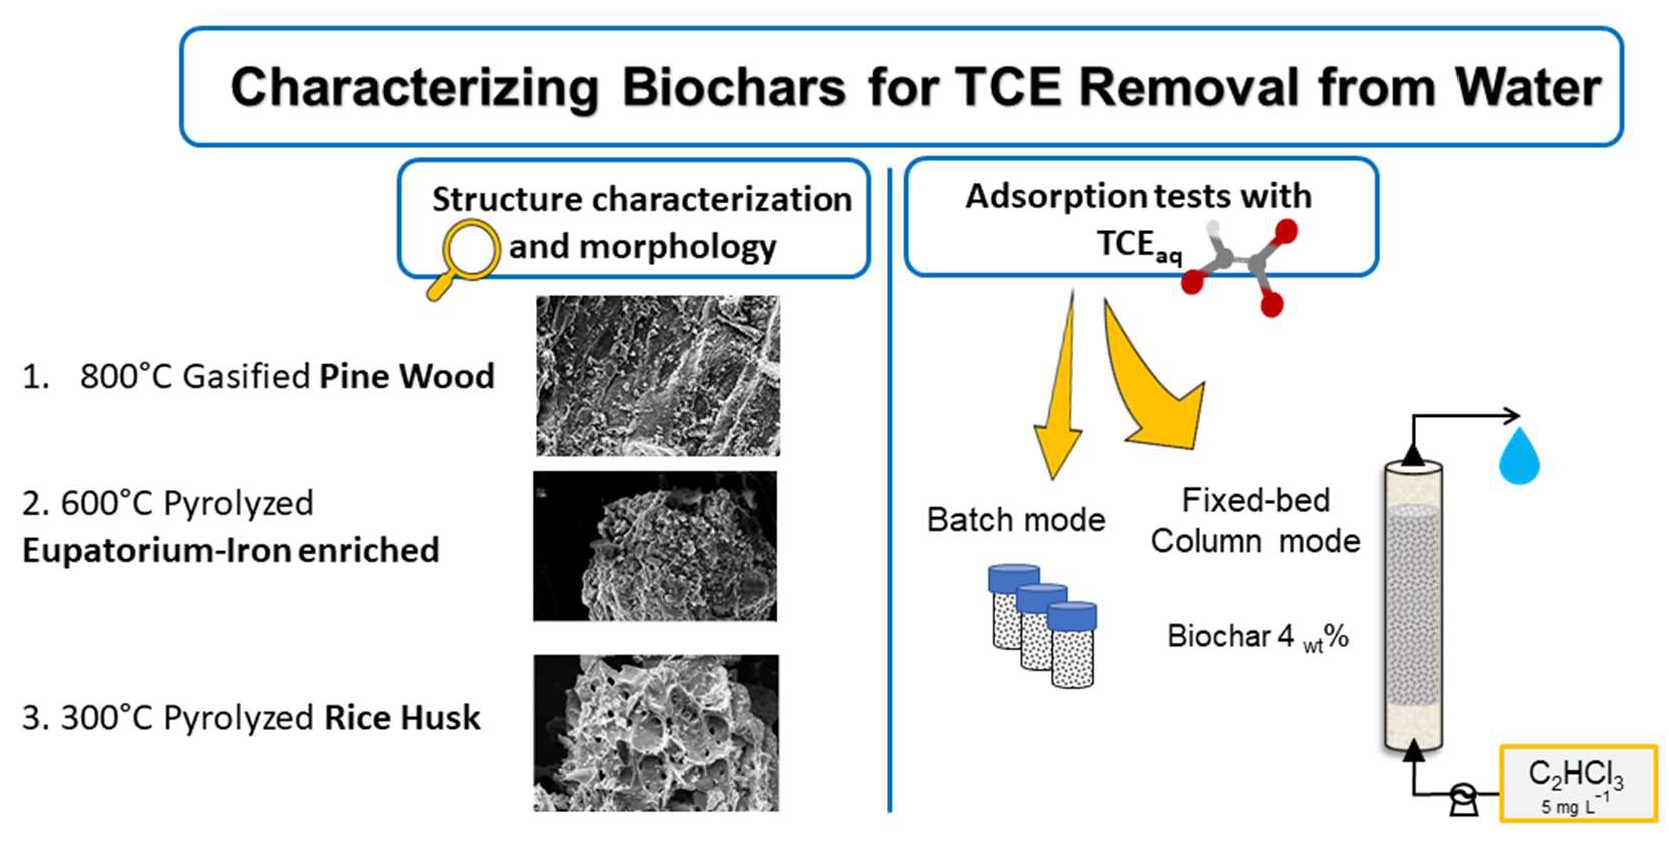
Biochar from Pine Wood, Rice Husks and Iron-Eupatorium Shrubs for Remediation Applications: Surface Characterization and Experimental Tests for Trichloroethylene Removal

1
Department of Chemistry, Sapienza University of Rome, P.le Aldo Moro 5, 00185 Rome, Italy
2
Aedes S.r.l. Research and Development, Aedes Chimica e Ambiente, Via Cancelliera 12, 00041 Albano Laziale, Italy
*
Author to whom correspondence should be addressed.
Materials 2021, 14(7), 1776; https://doi.org/10.3390/ma14071776
Submission received: 23 February 2021 / Revised: 24 March 2021 / Accepted: 28 March 2021 / Published: 3 April 2021
(This article belongs to the Special Issue Production, Characterization and Adsorption Studies of Composites )

Abstract

:
Nowadays porous materials from organic waste, i.e., Biochar (BC), are receiving increased attention for environmental applications. This study adds information on three BCs that have undergone a number of studies in recent years. A Biochar from pine wood, one from rice husk and one from Eupatorium shrubs enriched with Iron, labelled as PWBC, RHBC and EuFeBC respectively, are evaluated for Trichloroethylene (TCE) removal from aqueous solution. Physical-chemical description is performed by SEM-EDS and BET analysis. The decrease of TCE over time follows a pseudo-second order kinetics with increased removal by the PWBC. Freundlich and Langmuir models well fit equilibrium test data. The optimized values of the maximum adsorbed amount, qmax (mg g−1), follows this order 109.41 PWBC > 30.35 EuFeBC > 21.00 RHBC. Fixed-bed columns are also carried out. Best performance is again achieved by PWBC, which operates for a higher number of pore volume, followed by EuFeBC and RHBC. Continuous testing confirms batch studies and makes it possible to evaluate the workability of materials in configurations closer to reality. Results are promising for potential environmental application. In particular, the characterization of several classes of contaminants opens the doors to possible uses in mixed contamination cases.

Graphical Abstract

1. Introduction

Halogenated hydrocarbons have been widely used as degreasers, process solvents and intermediates in various industrial sectors. As a result of mismanagement, use and disposal, these substances are very common pollutants in soil and groundwater. The distribution of Chlorinated Solvents, such as Perchloroethylene (PCE) and Trichloroethylene (TCE), in solid and liquid matrix of the subsoil is a process that depends not only on the chemical and physical characteristics, but also on the hydrological characteristics of the site. In general, many years after the primary source of contamination has been removed, chlorinated solvents act as persistent, slow-release sources in the saturated area at very low concentrations [1,2].
The oldest and most diffused system of groundwater treatment is the Pump and Treat, that uses wells for the extraction of the contaminated water and needs a successive treatment on external unit for the requalification of the liquid phase. In Italy, where PCE and TCE threshold limit (to be respected at the boundary of the site) are 1.1 and 1.5 µg L−1, many of the SIN (National Interest Sites) are still treated with this approach [3]. However, it has been known for decades that this strategy has a high environmental and economic impact linked to the energy demand due to the treatment of high volumes of liquid phase [4].
For the specific purpose of intercepting a contaminated plume, a widespread remediation technology involves the installation of Permeable Reactive Barriers (PRBs) [5]. Depending on the reactive material, the barrier removes the contaminant by chemical action (the most common PRBs are with Zero Valent Iron (ZVI)), by biological action or by adsorption (zeolites, activated carbon). Although Activated Carbon (AC) is recognized as the most preferred reactive material for its removal efficiency, it is also well known for the high costs associated with its use [6]. These days, the remediation fields are looking for more sustainable options [7], so low-cost materials are receiving much attention. The search for alternative adsorbing materials for environmental applications and the desire to reduce solid waste volumes explain the growing interest of the scientific community in Biochar (BC). BC is an ancient fertilizer derived from non-fossil-based carbonaceous materials such as agricultural and manure wastes [8]. According to some authors, it is produced to be applied to soil as fertilizer and its manufacture allows converting biomass into reusable products and energy [9,10,11,12,13]. Since the early decades of this century, the number of BC related papers has grown exponentially [14].
Recently, initiative like the International Biochar Initiative (IBI) and the European Biochar Certificate (EBC) are born to talk about BC and better define its standards, especially for the valorization of such residues in environmental field [15,16]. Most papers propose it as contaminants immobilizers due to its graphite-like structure, its porosity and surface area. BC from different feedstocks is investigated in several papers as possible adsorbent for the removal of heavy metals and organic contaminants from municipal wastewater as well as from industrial wastewater [17,18,19,20,21,22]. Furthermore, it is of particular interest to study these materials by also considering the interaction with subsoil’s bacteria. The favorable interaction between BC and microorganisms certainly could open the door to possible innovative applications as support for active biofilms for coupling adsorption and biodegradation strategies for environmental applications [23,24,25].
It is well known that many parameters influence the final characteristics of BC, which is why its production and surface alteration certainly select its final application [16,26,27,28,29]. When the pollutant is hydrophobic or aromatic, the aromatization of BC is a fundamental characteristic to increase the adsorption capability. By increasing the temperature of the heat treatment, the chemical structure of BC is constantly changing and eventually forms more graphitized carbon [30]. On the other hand, electrostatic interactions are responsible of ionic compounds immobilization, that is the reason why BC obtained at lower temperature should be a selective adsorbent for cationic species thanks to the presence of functional groups (e.g., phenol and carboxyl moieties) [31]. In addition, the size and structure of the pores are dependent on the composition of the raw materials and the temperature adopted during the heat treatment. To evaluate and predict the applicability of a material as an adsorbent, it is essential to combine textural characterization with batch and continuous adsorption tests.
In this work three different BCs are investigated: a pine wood BC (PWBC) obtained in a gasification unit in Germany [32]; a rice husk BC (RHBC), made in Indonesia using local technique [33] and a modified BC, the Eupatorium adenophorum Iron-enriched biochar (EuFeBC) from Nepal [34]. With respect to these BCs, certain studies have already been published for specific environmental purposes. PWBC showed promising results in the removal of Toluene from synthetic solutions [32] and it has been also demonstrated a greater capping efficiency of oil spill contaminated sediment, compared to a commercial AC [35]. More recently, RHBC has been reported to reduce the bioavailability of PCBs when utilized as amended in soil [36]. At the same time, the Iron enriched BC (EuFeBC) was firstly evaluated in a real soil contaminated by heavy metals [34], underlying that engineered BC should be considered for specific contamination situations [37].
Therefore, the three BCs were firstly characterized from a textural point of view (SEM-EDS analysis and BET analysis) as the adsorption of organic molecules depends on the available and suitable sites [38]; batch reactors (kinetic and equilibrium tests) were then performed to study the capacity of TCE removal from aqueous solution; finally, to simulate the conditions of a real configuration technology (i.e., PRB), fixed-bed reactors were performed. The majority of published literature characterizes Biochar by Batch tests. Nevertheless, Breakthrough curves obtained by continuous tests are useful to understand possible real application [39,40].

2. Materials and Methods

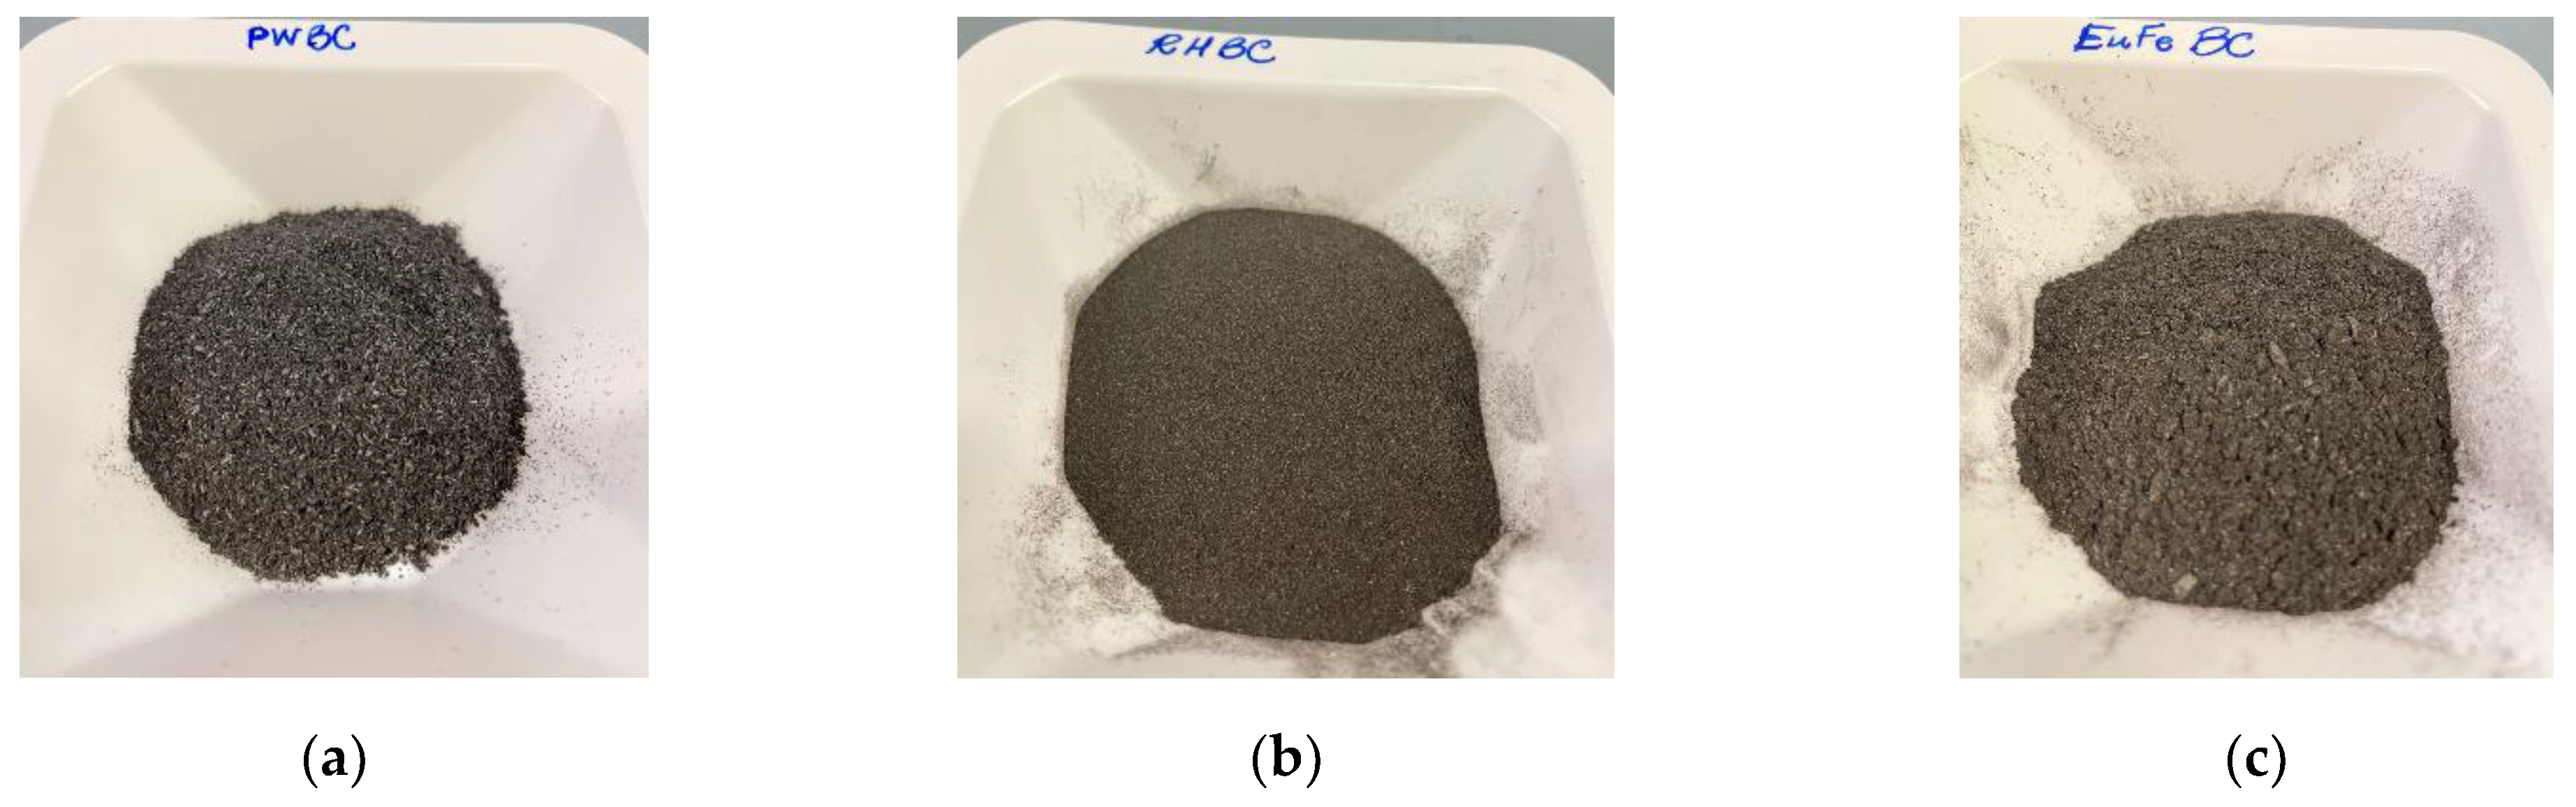
2.1. Biochars Description

The materials were received thanks to previous collaboration between the La Sapienza University (Rome) and the University of Chemistry and Technology of Prague and the NGI (Norwegian Geotechnical Institute) of Oslo. The Pine Wood BC (PWBC) is obtained by gasifying wood at approximately 850 °C and using the resulting gases for energy recovering (wood gas generator V 3.90 Burkhardt and ECO 180 HG as heat and power plant, Plößberg bei Tirschenreuth, Germany). The technical data were extensively described elsewhere along with the composition of the resulting gas [32]. The Rice husk BC (RHBC) from rice (Oryza sativa L.) is produced with a low technology method consisting in husks pyrolysis in a little unit realized in Indonesia (kiln method). Conditions were 3.5 h pyrolysis duration and an average temperature of 300 °C [33]. In pre-treatment RHBC was sieved, so the only fraction < 125 µm was used. The third BC from Eupatorium adenophorum shrubs (EuFeBC) is obtained with Kon-Tiki flame curtain pyrolysis method, which leads back to the ancient methods of biomass combustion combined with a low gas emission. The process reaches approximatively 600 °C and powdered iron oxide-hydroxide (FeOOH) was added between fresh biomass layers. For additional details, see Silvani and Cornelissen work (2019) [34]. Since EuFeBC had a different particle size distribution, only a fraction less than 500 µm was selected and manually homogenized in a mortar. The materials for the experimental tests are shown in Figure 1.

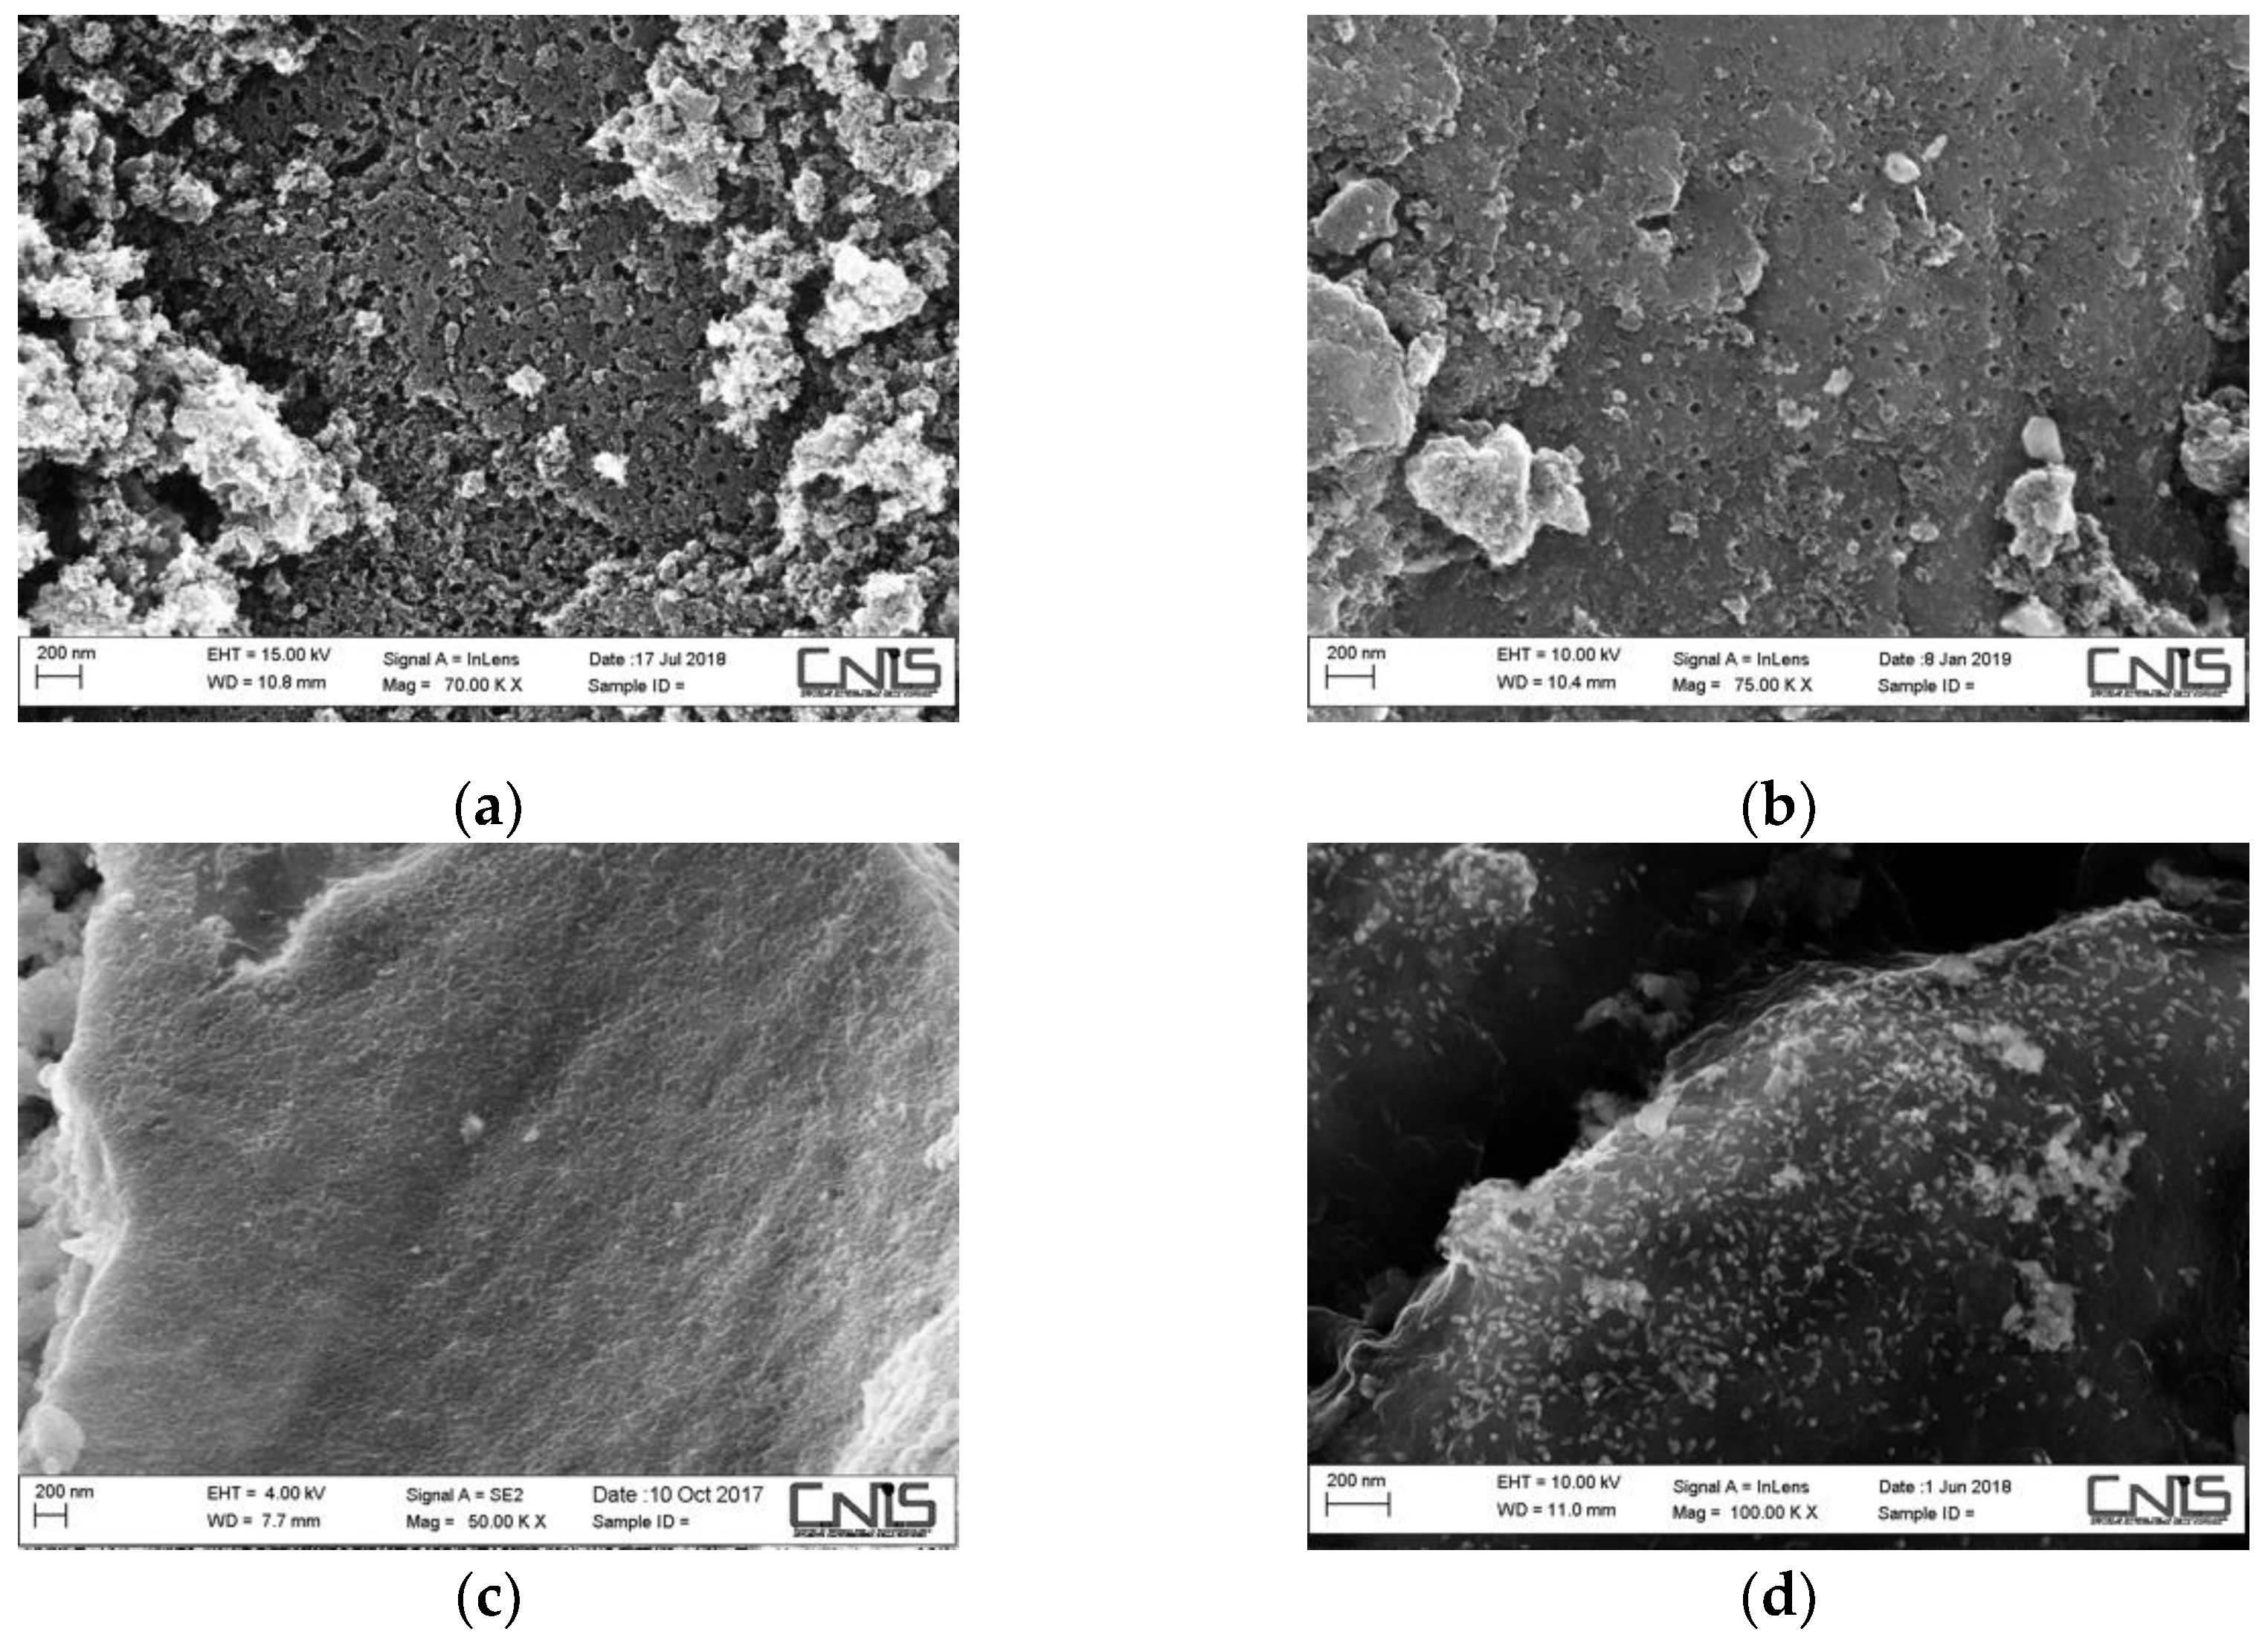
2.2. SEM-EDS Acquisition and BET Analysis

To evaluate the morphology of the materials, a Zeiss Auriga (Germany) FESEM (Field Emission Scanning Electron Microscope) with Energy Dispersive Spectroscopy (EDS) has been used. BCs were dried in oven (Carbolite, Thetford, Norfolk, UK), 100 °C overnight, then the analysis was performed on untreated materials. Surface area, the Brunauer–Emmett–Teller (BET) method, and textural analysis were determined as described elsewhere [32].

2.3. Kinteric and Isotherm Tests

Kinetic and isothermal experiments were performed as described in Kastanek (2017) and co-workers [32].
For TCE adsorption tests, a mono-component solution was prepared in a Tedlar bag® (Supelco, Bellefonte, PA, USA) (no headspace formation); a volume of pure TCE, (ACS ≥ 99.5%) Sigma-Aldrich® (St. Louis, MO, USA), was spiked in order to achieve the decided concentration; the solution was horizontally shaken for one day. For the initial effective concentration, one volume of the contaminated solution was always sampled at the beginning of the test. The batch reactors (VWR International glass vials, Milan, Italy) were prepared by weighing a known amount of BC and fully filling with 0.02 L of the contaminated solution. The reactor was sealed by a Teflon butyl stopper (Wheaton, Millville, NJ, USA) and aluminum cap and mechanically shaken for the duration of the test.
For the kinetic study, the initial theoretical concentration (C0) was 100 mg L−1 with a solid/liquid ratio of 2.5 (in triplicate). Aliquots of the solution was sampled at 0.5, 1, 2, 3, 4, 5 and 24, 27 and 52 h in hermetically sealed glass vials sent to the analysis. The isothermal curve was designed to prepare the solution in a theoretical initial concentration range equal to 10–60–120 mg L−1, in contact with 0.010–0.020–0.050–0.100 g of BC. The solution was sampled at time 0 (C0), to assess the initial concentration, and at equilibrium time (Ce). Based on the kinetic tests, 24 h was considered as enough time to ensure the achievement of equilibrium. Elemental analysis and isothermal curve were carried out on a commercial Norit AC, type Darco Sigma-Aldrich®, for comparison purpose only.

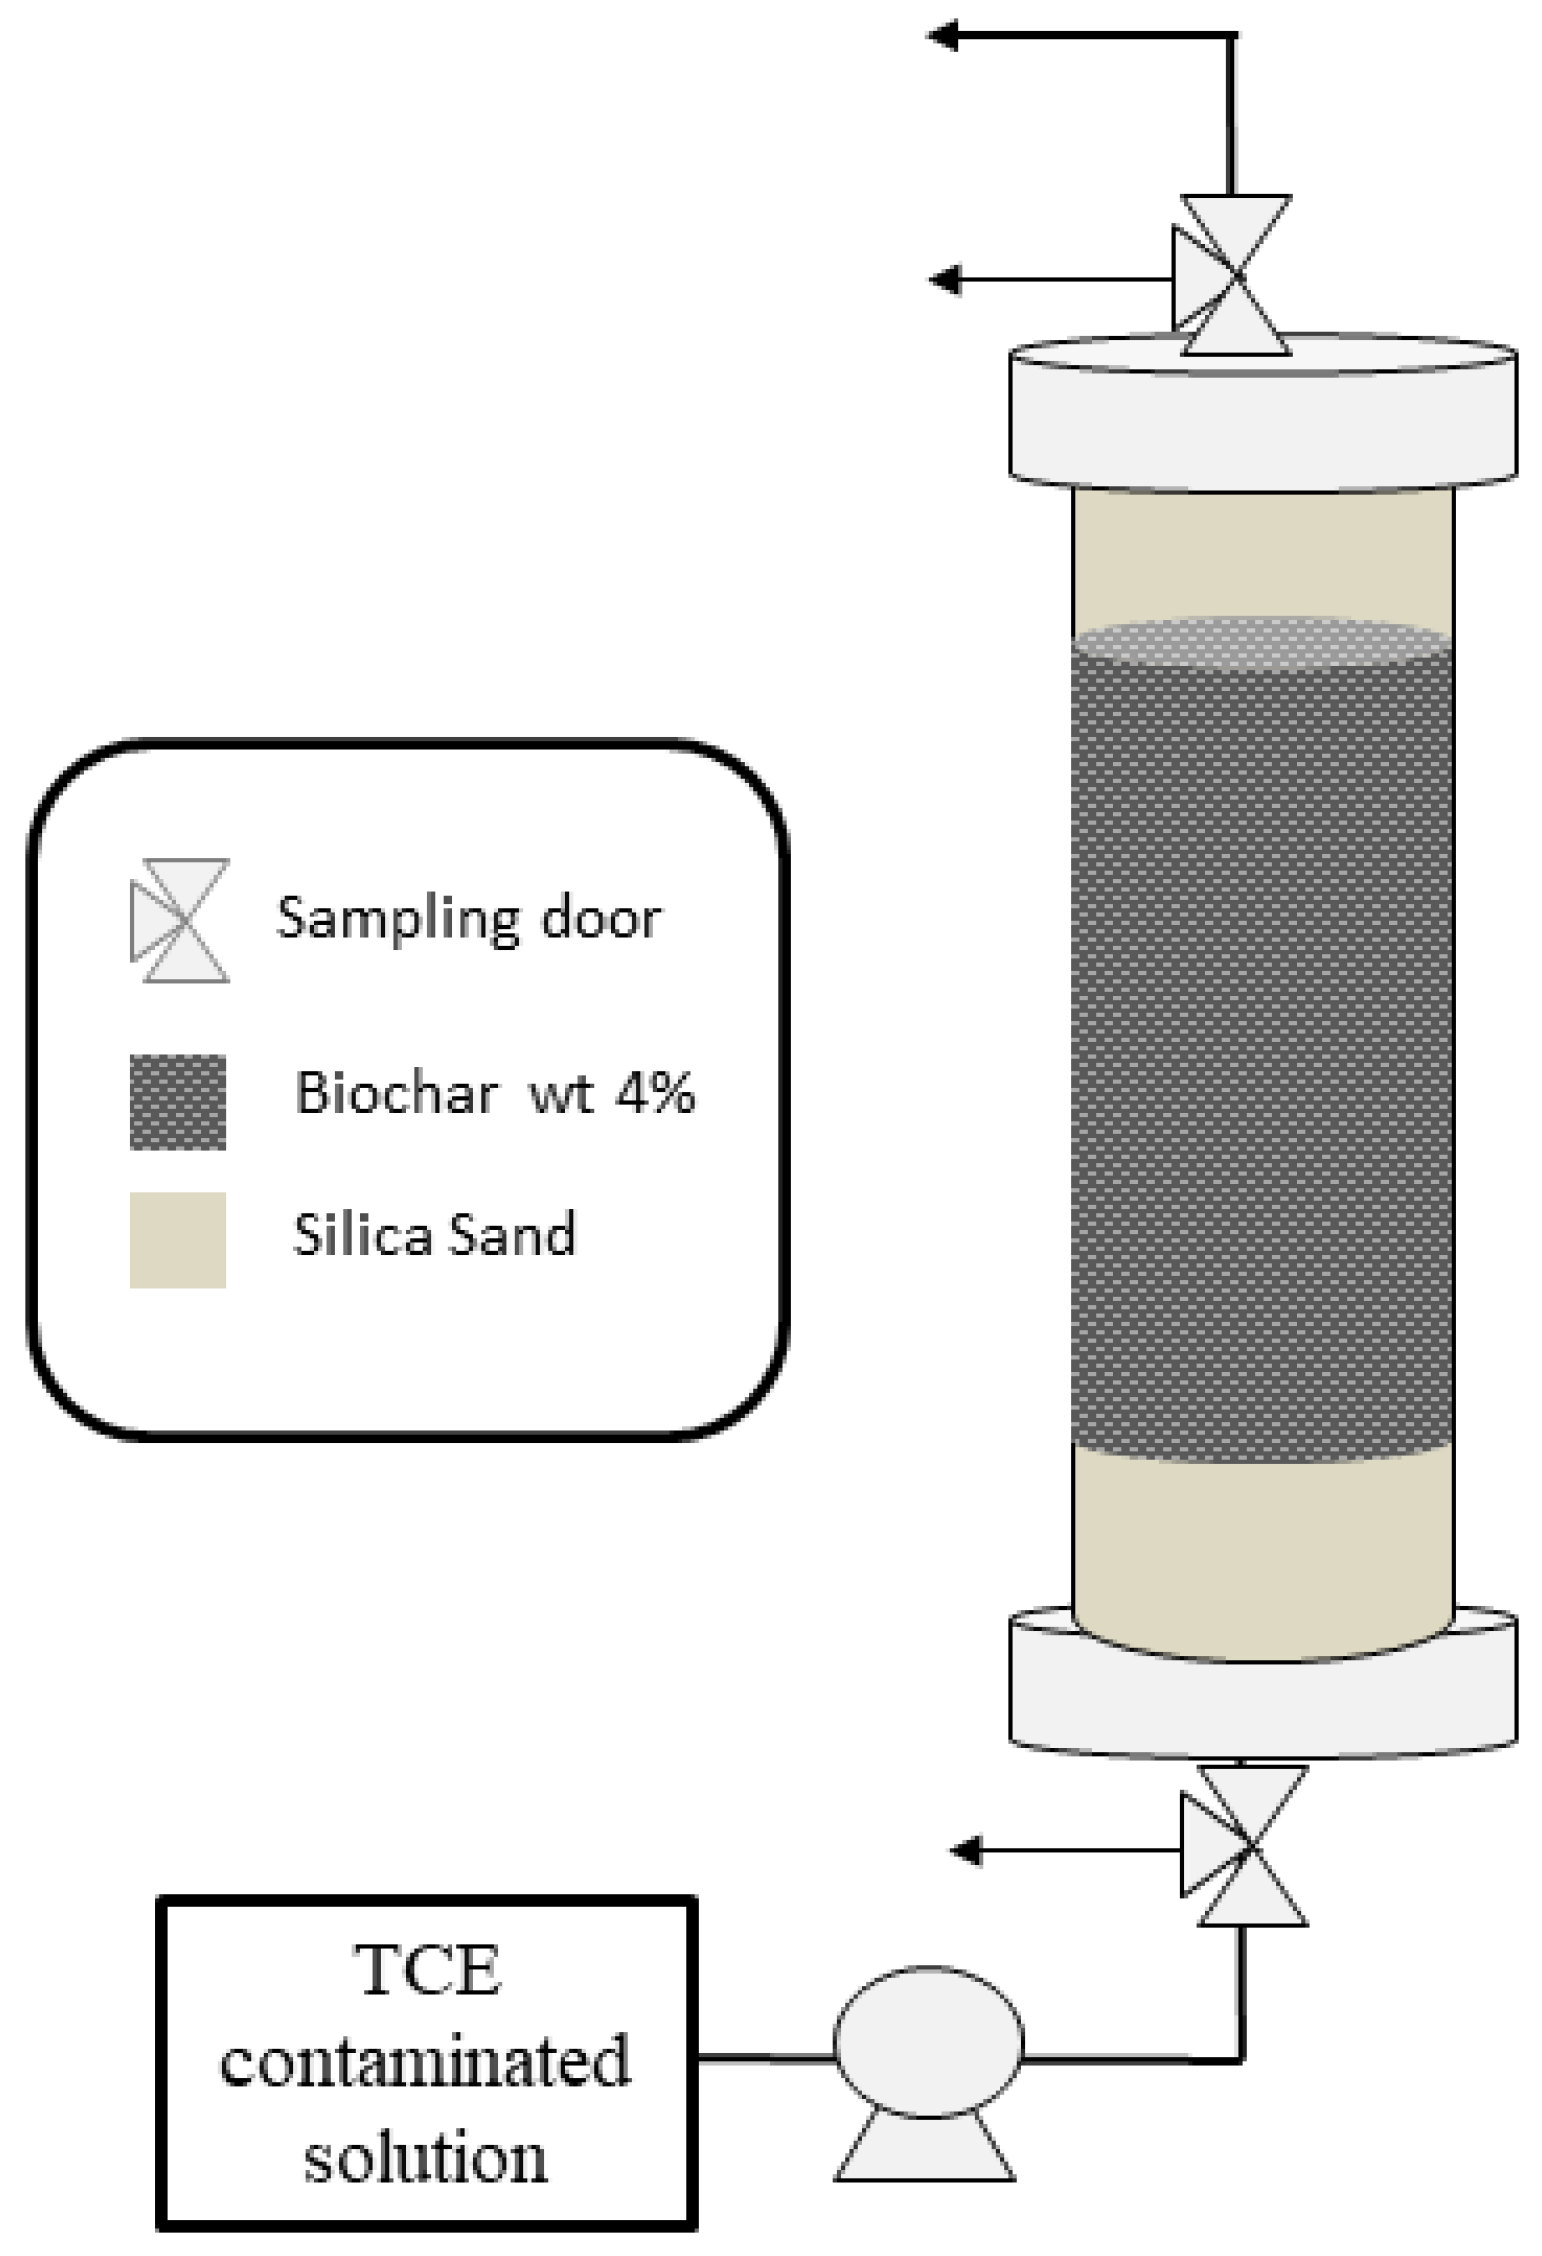
2.4. Column Experiments

Three column tests were carried out to draw the breakthrough curves. Plexiglas (PMMA) columns (13 cm × 2.6 cm) were equipped with two sampling points, door IN and OUT, respectively at the entry and the exit of the column. The adsorbent materials were mixed with silica sand in quantities equal to 4 wt% (equivalents to about 2 g of reactive material). In detail, the first and the last 3 cm of the column were filled only with sand in order to make the liquid phase front homogeneous in the reactive zone (7 cm of bed height). A peristaltic pomp (Gilson Miniplus evolution) was used to pump the feeding solution upwards at 0.6 mL min−1 as flow rate. A tracer test with Br was first performed to obtain the residence time, the porosity and the pores volume. The feeding solution was approximately 5 mg L−1 of TCE. For TCE analysis, 1 mL of influent and effluent was sampled daily. Figure 2 illustrates a schematic draw of the experimental configuration. The tests were stopped when the outlet concentration (COUT) became equal to that of the input (CIN), indicating that the bed adsorption capacity was exhausted.

2.5. Calculations

Kinetic data were fitted according to a pseudo-first order (PFO) model and pseudo-second order model (PSO) as described in [41,42]. The equations are written in Equations (1) and (2):
ln (qe − qt) = ln qe − k1t,
t/qt = (1/qe2 k2) + (1/qe) t.
Removal efficiency %, after 24 h, is calculated as:
R24 (%) = (C0 − Ceq)/C0 ∗ 100.
The TCE adsorbed per gram of material at equilibrium, qe and at the sampling time, qt (mg g−1), are calculated using Equations (4) and (5). k1 (min−1) and k2 (mg g−1 min−1) are pseudo-first-order (PFO) and pseudo-second-order (PSO) adsorption rate constants. C0, Ce and Ct are respectively the TCE starting, the equilibrium concentration (24 h) and the concentration at the time of sampling (t), expressed in mg L−1, V is the volume of the solution (L). According to Equations (6) and (7), representing Langmuir and Freundlich models, the optimized parameters were obtained using Sigma Plot 12. qmax and KL (L mg−1) are Langmuir coefficients; KF (L g−1) and n are the Freundlich constants characteristics of the system [43].
qe = (C0 − Ce) V/w,
qt = (C0 − Ct) V/w,
qe = qmax KL Ce/(1 + KLCe),
qe = KF Cen.
A three-parameter sigmoidal equation, Equation (8), was used to fit both tracer test data and breakthrough curves. A quantitative performance of the reactive bed has been determined. Some authors choose to define the breakthrough point once the compound can be detected in the effluent [40,44]. Alternatively, a COUT/CIN ratio can be defined in order to represent a tolerance limit (as a threshold concentration admitted by the local legislation) beyond which the effluent quality is no longer acceptable. In this case, the breakpoint was defined as the volume in which COUT/CIN = 0.05 and the bed saturation point was considered COUT/CIN = 0.95. The area between Y axis and breakthrough curve is proportional to TCE adsorbed by fixed-bed, hence the area under the curve was subtracted at the total area at the saturation point. Details on column data elaboration are presented in Supplementary Materials.
f = a/(1 + exp(x − x0/b))

2.6. Analytical Methods

TCE was determined with gas chromatography (GC) DANI MASTER, equipped with DANI 86.50 headspace auto-sampler ((DANI Instruments, Contone, Switzerland): capillary column (30 m × 0.53 mm ID × 3 um, TRB624) and a Flame Ionization Detector (FID) was used. The headspace analysis program was performed as follows: oven temperature 80 °C, manifold T 120 °C, transfer line temperature 180 °C, shaking softly for 1 min. The GC conditions were: He carrier gas (flow 10 mL min−1), 180 °C injector temperature split injection 1:2; 300 °C detector temperature with air, N2 and H2 for the FID (flows 240, 25, 60 mL min−1). The oven temperature was programmed as follows: 70 °C 0.5 min, 30 °C min−1 to 90 °C then 30 °C min−1 to 180 °C. For the quantitative determination of TCE, a calibration curve was obtained by dilution of a TCE/Ethanol stock solution in standards with concentration range 0.1–5 mg L−1.
Bromide was revealed with ion chromatograph Dionex (Sunnyvale, CA, USA) ICS-1000 IC with conductivity cell detector, equipped with Dionex AS-40 Auto sampler. Pre-column Dionex IonPac™ AG14 (4 × 50 mm) and a Dionex IonPac™ AS14 IC Column with suppressor AESR 500 4 mm (Thermo Fisher Scientific Chelmsford, MA, USA). The eluent phase was prepared with 3.5 mM Na2CO3 and 1.0 mM NaHCO3 with 1.2 mL min−1 as flow rate. The calibration curve was realized from 5 to 100 mg L−1.

3. Results and Discussion

3.1. Physicochemical Properties of Biochars

Physicochemical characteristics were studied using SEM-EDS. Here are reported the images obtained at resolution of 200 nm, also with the AC, the same used in Kastanek (2017) [32] (Figure 3). It is evident that there is a regular pore distribution on the PWBC surface, fairly similar to the AC. On the other hand, the other two materials prove to be very different and highlight the heterogeneity of the biomass materials that have not undergone any activation process.
Elemental analysis confirms the differences between all the BCs investigated due to the starting biomass and heat treatment. As expected, for PWBC the 95.84 wt% of the mass was C; 3.92 wt% O; 0.10 wt% S; 0.09 and 0.04 wt% of K and Mg (complete data in Figure S3). This is consistent with results concerning wood based biochar [45,46,47]. At high processing temperature, wood based feedstock may reach a carbon content greater than 95% and oxygen content less than 5% [8]. Traces of Mg, K, S, are commonly found in plants and soil. EuFeBC mostly consists of C (80.69 wt%) in the investigated area, with 13.15 wt% of O and Iron (1.17 wt%). The full list and elemental distribution maps are in S4. On the other hand, the percentage of Total Carbon in RHBC 41.24 and O/C ratio was higher [33]. These results confirm a relationship with the thermal treatment and high graphitization making PWBC the biochar closer to an activated carbonaceous material (elemental analysis of the commercial Activated Carbon in S5). Textural characterization of Pine Wood Biochar has already been defined with 343 ± 2 m2 g−1 and a total pores volume 0.383 cm3 g−1, mostly due to micro-pores, 0.136 cm3 g−1, comparable with the commercial AC [32]. BET method for surface area and pores distributions of sieved RHBC reports that the sample is micro/meso-porous with a specific surface area value of 81.0 ± 0.7 m2 g−1 of which 59 m2 g−1 are due to the micro-pores present. The total volume of pores is 0.101 cm3 g−1, including 0.0280 cm3 g−1 for the presence of micro-pores. The pore diameter is distributed between 0 and 800 Å, with a maximum of about 19.9 Å (in the mesoporous area studied). EuFeBC powder is mainly micro/meso-porous and has a specific surface area of 97 ± 1 m2 g−1, of which 81 m2 g−1 for micro-pores. The total pore volume is 0.0752 cm3 g−1, 0.0390 cm3 g−1 due to micro-pores. The pore diameter is distributed in the range 0 and 300 Å, with a maximum of around 19.8 Å in this area. Results are summarised in Table 1.

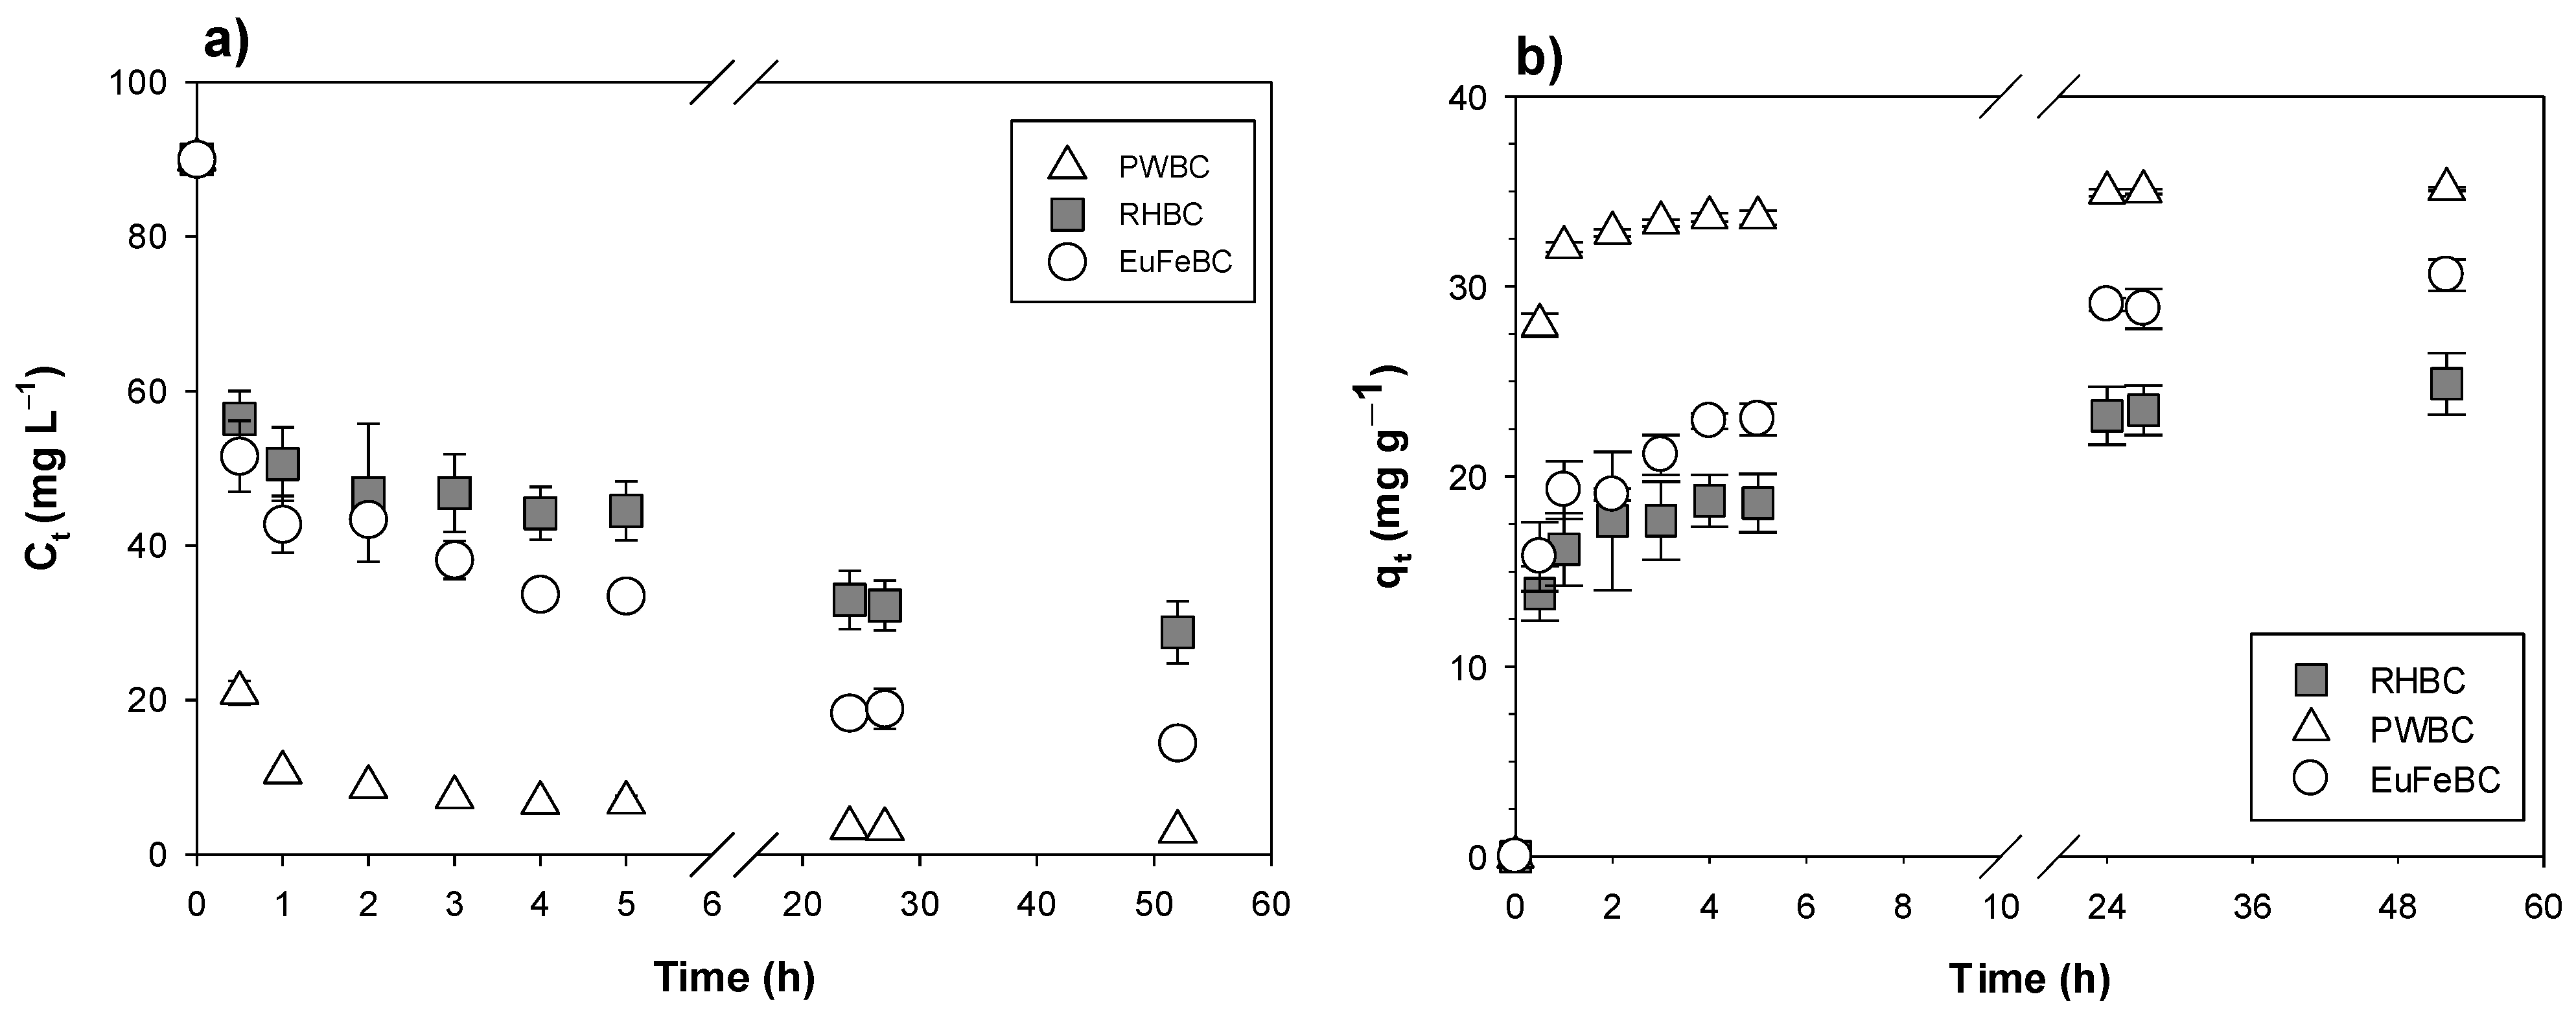
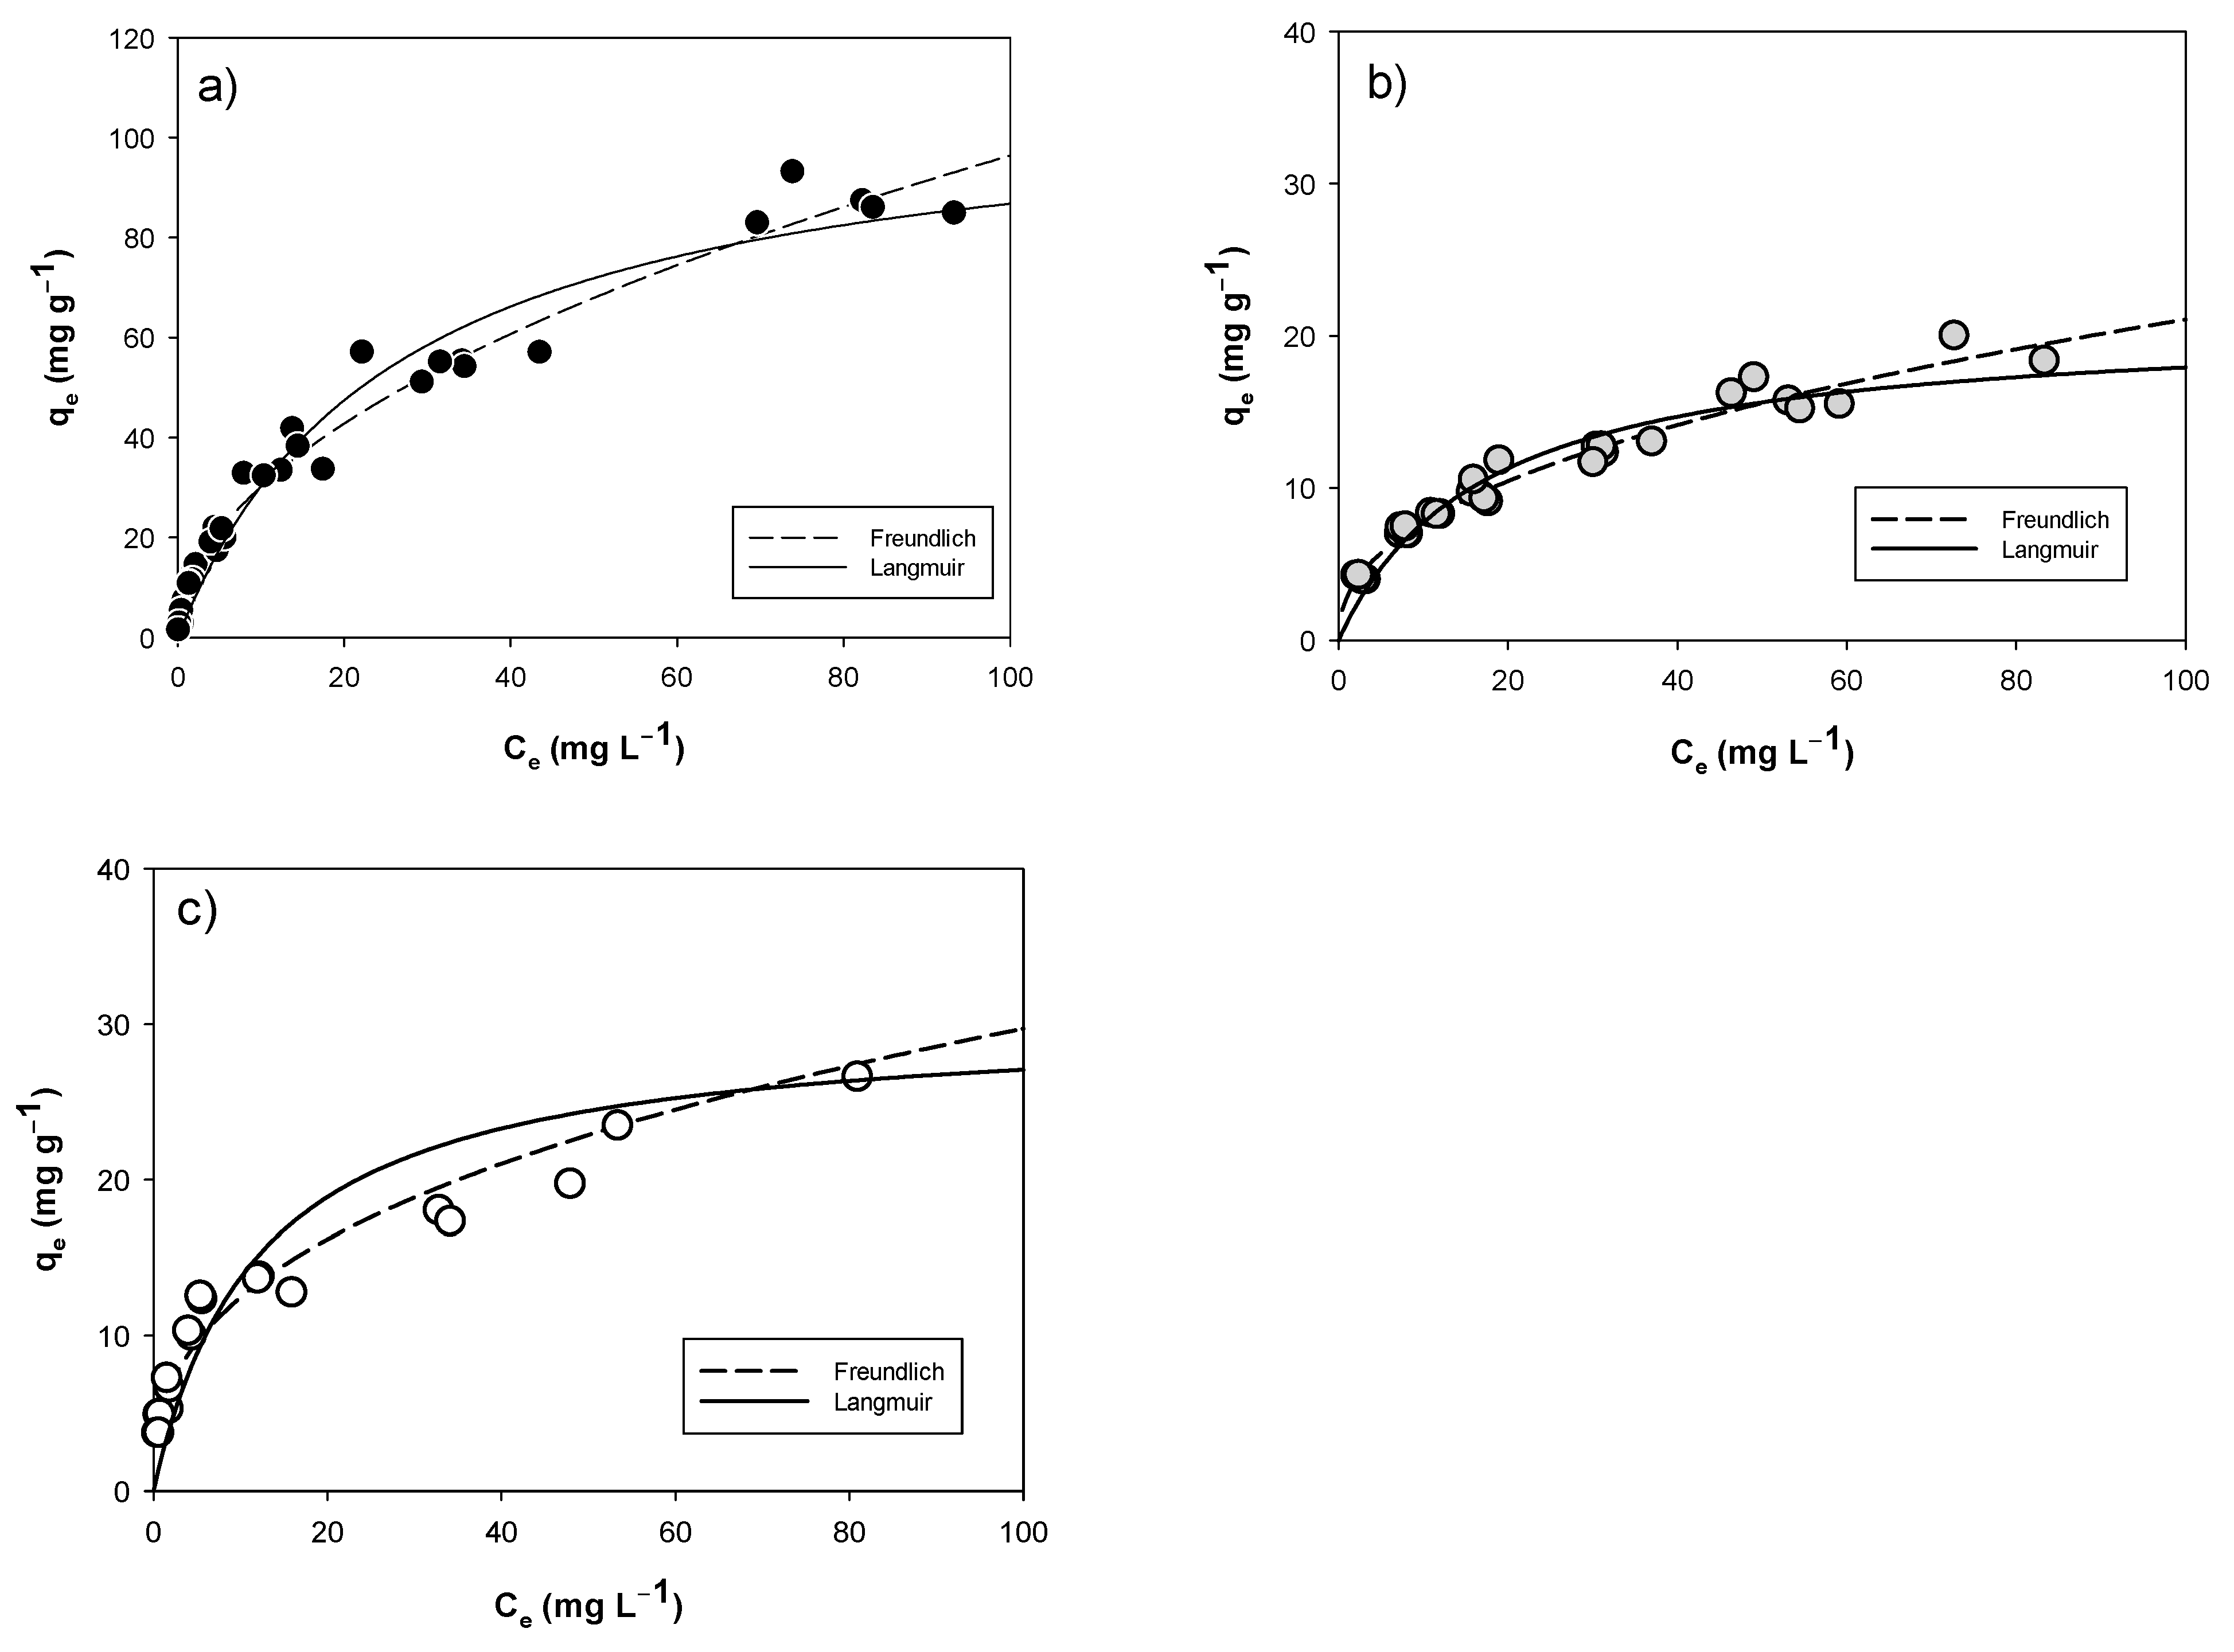
3.2. Adsorption Test in Batch Reactors
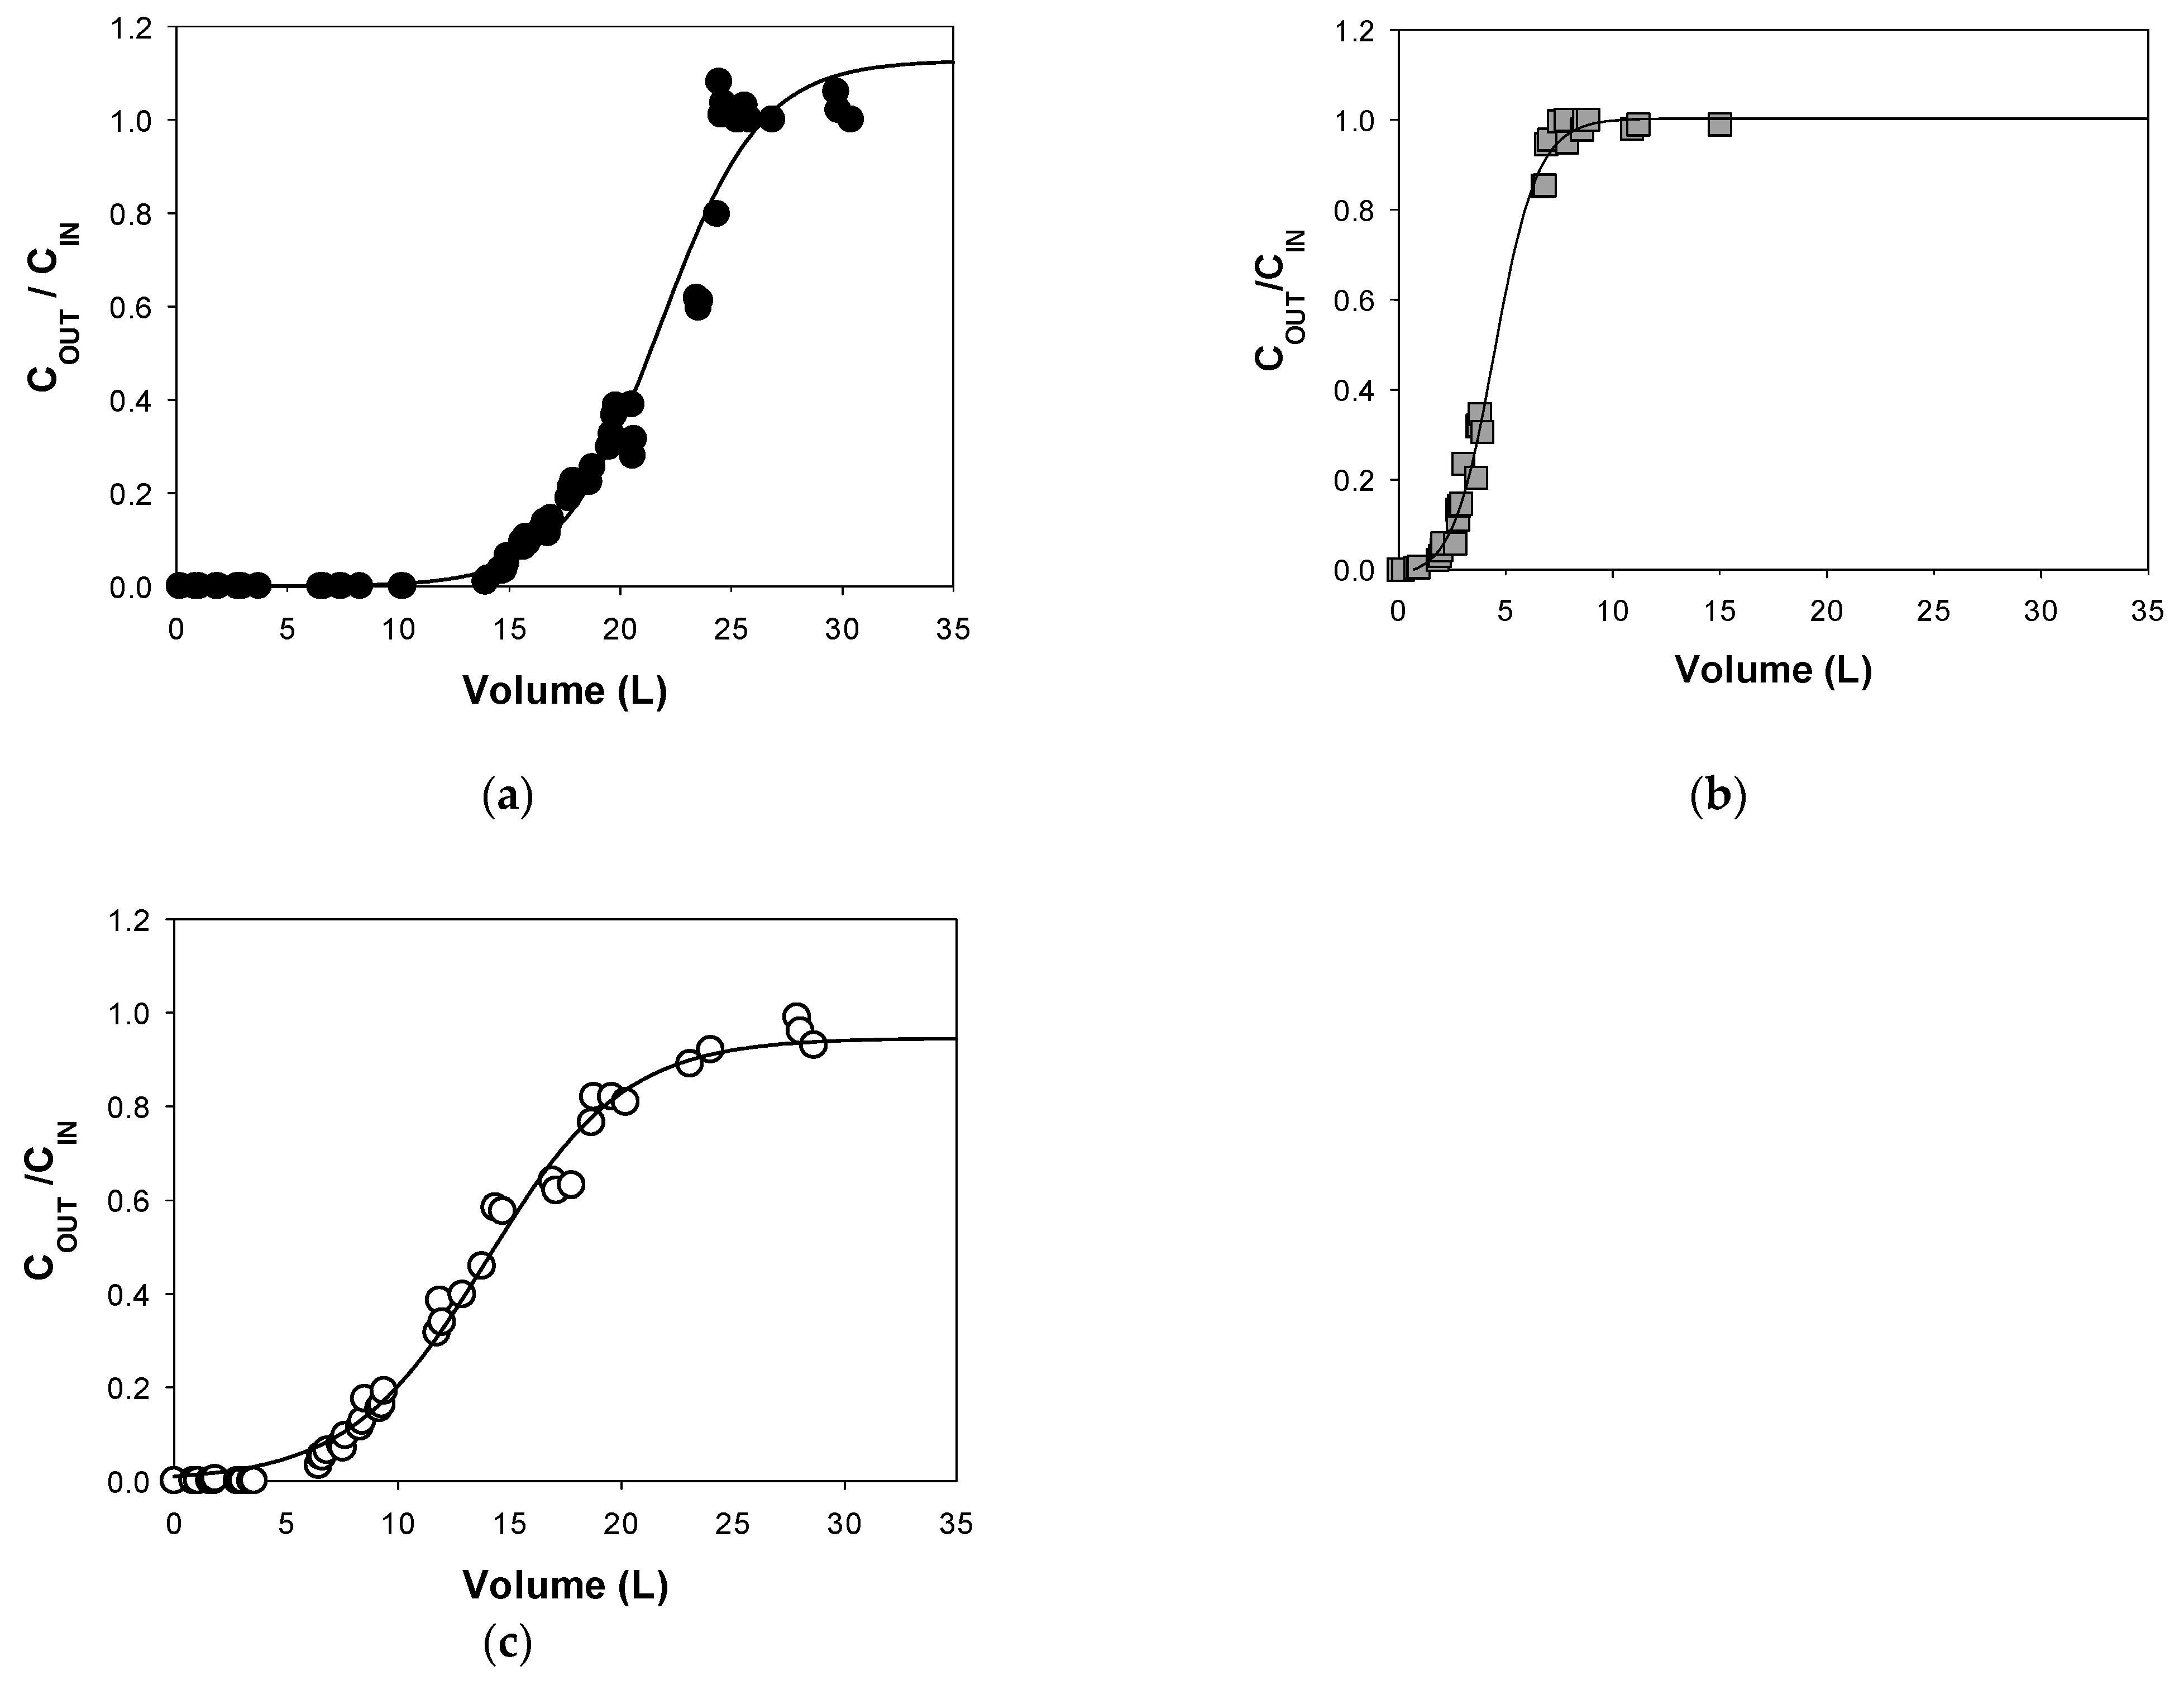
The decrease in TCE concentration over time from C0 of approximately 90.07 mg L−1 can be seen in Figure 4a. Figure 4b illustrates the amount of TCE adsorbed per gram of biochar over time. qt values have already increased after 30 min from the beginning of the test. The behavior of PWBC indicates a greater adsorbent capacity at the same contact time, compared to RHBC and EuFeBC. A greater adsorbent capacity of PWBC was calculated, with 33.6 ± 0.4 mg g−1; followed by 23.0 ± 0.83 mg g−1 for EuFeBC and 18.6 ± 1.5 mg g−1 for RHBC. 24 h were considered a sufficient time to determine the equilibrium mg TCE per gram of BC. More effective removal, based on Equation (3), was achieved by PWBC with 96.1 ± 0.4%, followed by EuFeBC and RHBC with 79.8 ± 4.2% and 63.8 ± 0.6% respectively. Rapid TCE removal and values of the mg g−1 achieved at the equilibrium time are similar with the literature, where BCs obtained at 300 °C and 700 °C (from soybean Stover and peanut shells) were compared [41]. It is also confirmed that the BCs produced at 700 °C were more effective, thus the pine wood biochar behavior is consistent with the literature. The parameters for both kinetic models are reported in Table 2. Because of the higher R2 values, PSO model works better for our kinetic data. According to some authors, a second order kinetic should represent a rate of adsorption controlled by direct interaction with solute and surface (i.e., chemisorption), as well as sharing or exchanging electron [26,41,43].
BC with better adsorption capacity has greater K2 value than the other two (following this order K2 PWBC > K2 RHBC > K2 EuFeBC). This demonstrates a greater affinity for TCE related to a faster binding. The qe(cal) range values and both the k1 and k2 rate constants, are comparable with the literature. It is quite interesting to note that the k2 of PWBC is close to the one of Activated Carbon reported in the literature [41].
Isothermal curves (Figure 5) follow the typical trend of the adsorption of a solute onto a solid material. Within the studied concentration range (Ce), mg g−1 values increase strongly initially and then slow down as the concentration of Chlorinated Solvent increases (Ce). In particular, the tested materials do not reach an obvious plateau at the maximum of Ce investigated, confirmed by a higher R2 of Freundlich model, compared to that of Langmuir.
The parameters obtained by nonlinear regression are given in Table 3, only to compare the performances. In addition, KF and n values are higher for PWBC since the TCE removal and adsorption intensity are more evident [43].
In parallel, the maximum TCE adsorbent amount per gram of material (qmax), calculated with Langmuir model, is absolutely greater for PWBC with 109.41 ± 5.62 mg g−1, while the qmax of EuFeBC and RHBC is 30.35 ± 2.49 and 21.00 ± 0.91 mg g−1, even though the Langmuir model has an R2 far from the unit. In S6 the isotherm curve of Activated Carbon and TCE is only reported for comparison purpose. The AC’s qmax values has the same order of magnitude (even if it is about 100 times that of PWBC), but it was obtained over a wider range of equilibrium concentrations.
Concerning the BC from pine wastes (PWBC) the parameters listed in Table 3 are comparable with results published by Ahmad Mahtab Lee and his colleagues towards TCE and pine needle derived BC at 700 °C [47] and with Freundlich parameters obtained for (Volatile Organic Compounds) VOCs sorption to peat moss BC investigated by Kim et al. (2017) [48]. More recently, A. Siggnins characterized and compared the behavior towards TCE removal of 15 BCs and a GAC. As verified in this work, BCs prepared at high temperatures (>600 °C) demonstrated a better performance [49].
The study was compared to the results of the batch tests performed with the same BC (PWBC) against Toluene. Values of qmax and KL obtained for the TCE are of the same order of magnitude, although within a lower concentration range. Conversely, when comparing the Freundlich model parameters, n values are comparable whereas KF values are higher for Toluene in synthetic seawater [32]. The only study looking at the possible adsorption capacity of RHBC was done by Silvani et al. (2019) with polychlorinated bisphenols (PCBs) contaminated soil. The results showed good performances of this BC in PCBs uptake, possibly related to its physical-chemical properties [36]. However, this is the first study with this Indonesian made biochar concerning the removal of a Chlorinated Solvent from an aqueous phase.
The performance of the BC enriched with Fe was attractive, as more than one removal mechanism may be implicated [34]. Recent papers have described the reduction of organic contaminants on the ZVI/BC magnetic surface [45,50,51,52]. In contrast, no intermediates of TCE reduction were revealed in the range of concentration investigated in our study. To compare the performance of the materials investigated, some basic characteristics (the starting biomass, the process temperature and the surface area (BET analysis)) are related to the maximum adsorption capacity, expressed by the isothermal parameter “qmax” (optimized with the Langmuir adsorption model) (Table 4).

3.3. Column Tests

To simulate a real scenario of contamination, a low concentration of feeding solution was prepared (5 mg L−1 of TCE) and an intermediate flow rate was studied (0.6 mL min−1). The results of the tracer test (step signal) showed the typical behavior of a Plug Flow reactor (data shown in S7). For the three columns, the experimental hydraulic retention time were 58.2, 55.2, 55 min for PWBC, RHBC and EuFeBC (the operating conditions and geometrical characteristics were the same for all the columns). The estimated porosity was 50%, 47% and 48%, in the same order. Dispersion phenomena are probably responsible of little deviations in the shape of the curves. This is a proof of a difference in the fixed-bed packing due to several particle sizes of the BCs and the manual preparation of the columns itself.
The breakthrough curves are shown in Figure 6. The concentration at the outlet normalized with that in the inlet (COUT/CIN) is reported as a function of the volume of contaminated water treated (L). By comparing the experimental data, the first breakthrough point (COUT/CIN = 0.05) is reached by the RHBC bed at 2.04 L, corresponding to 2.5 days of working and 65 pore volumes. The EuFeBC’s breakthrough was revealed at 6.5 L (7.5 days and about 195 numbers of pore volume) and finally, after 17 days of continuous feeding and 408 number of pore volumes, also PWBC’s column reached the breakthrough point at 14.8 L, indicating that the BC from pine wood has treated higher volumes of contaminated water.
The curves diverged from the conventional sharp sigmoid probably because of the heterogeneity of the particle size. Diffusion phenomena may occur because a steeper profile is most often checked when a small particle moves into a homogeneous reactive bed. [39]. This is more evident in the EuFeBC curve, where the adsorbent bed consists of grain particles of different size (the fraction less than 500 µm, manually homogenized, was used).
Since the mass of contaminant adsorbed by the reactive zone is proportional to the area to the left of the curve, from the difference between the total area and the area under the curves the practical capacity (mg g−1) for each BC fixed-bed column was calculated. PWBC has removed more mg of TCE per grams (16.6 mg g−1), followed by EuFeBC (5.77 mg g−1) and RHBC (2.23 mg g−1), confirming the hypothesis made from characterization and batch tests. Furthermore, the expected adsorption capacity of the thermodynamic study was confirmed. 17.4, 8.85 and 4.73 mg g−1 were calculated with Langmuir parameters, choosing CIN = 5 mg L−1 as the equilibrium concentration (summarized in Table S1).

4. Conclusions

This study highlights the potential use of Biochar as an adsorbent in environmental contexts, especially because “activation processes” are not required. Moreover, results have increased the acknowledge on three BCs recently investigated as a possible low-cost adsorbent of a wide range of ubiquitous contaminants and their effectiveness in different contaminated matrices (e.g., soil and groundwater).
In this respect, the heat treatment temperature (850–600–300 °C) must have affected the specific surface area. The materials are mainly meso-micro porous, and all the three BCs have pores diameters in the appropriate range for TCE adsorption (0–80 nm).
From a real application point of view, PWBC and EuFeBC seem to have better performance due to the sharp increase of the isotherm curves at very low Ce. This condition is indeed more representative of a real contaminated site indeed, particularly in the case of an aging contaminated situation or in a Chlorinated Solvent plume. With regard to the pollutant adsorption, effectiveness depends on how the maximum mg g−1 at very low concentration is reached combined with a fast-kinetic removal. Our results are in line with the literature, confirming higher parameter values for higher temperature BC (PWBC), both for the kinetic and thermodynamic models. Moreover, column tests allowed to evaluate the performance of the materials for a high number of pore volumes, demonstrating the possibility to treat high volumes of water for long periods if compared to real conditions (lower ground water velocity and low concentrations of the contaminant).
The RHBC is still interesting as a cost-effective BC produced by a low-technology method and more investigations should be performed towards hydrophilic contaminants such as heavy metals. Finally, the hopeful results obtained by the engineered Eupatorium adenophorum BC allow expansion of the possibilities of use in case of mixed contamination (co-presence of organic solvents and heavy metals) thanks to the Iron active sites. A classification of the BC based on the starting biomass and the process conditions, together with a quality control of the final product, could make this solid waste an economically competitive material.

Supplementary Materials

The following are available online at https://www.mdpi.com/article/10.3390/ma14071776/s1, Figure S1: Other SEM images of Rice Husk biochar at 200 µm, 100 µm, and 1 µm, Figure S2: Other SEM images with a backscatter electron detector (BSD) of Eupatorium Iron enriched Biochar (Silvani et al. 2019) at 100 µm, 20 µm, 10 µm. It is emphasized the presence of well-defined and bright patches, probably caused by the high elemental weight, Iron (Lawrinenko et al. 2017), Figure S3: Pine Wood Biochar’s EDX spectra, and results of two different areas (indicated by PWB_1 and PWB_2 in the following photo) confirm the high presence of carbon (95.84 and 91.88 %wt C) concerning other elements due to the high thermal treatment, Figure S4: EDX data of a selected area of Eupatorium Iron enriched biochar and elemental distribution maps, Figure S5: EDS data of a selected zone of the Norit Activated Carbon Sigma Aldrich®. As reported in Figure S3, this composition is very close to the biochar obtained by the wood-based biomass, Figure S6: Isotherm curve of TCE on Activated Carbon Norit Sigma Aldrich® as reference was realized only with a comparison purpose, Figure S7: Column tests data elaboration. The panel shows the step signal tracer test curves of the three columns packed with the investigated biochars, Table S1: Some parameters and quantitative performance of fixed-bed biochars columns.

Author Contributions

Conceptualization, M.M.R. and M.P.P.; formal analysis, M.M.R.; investigation, M.M.R. and L.S.; resources, M.P.P.; data curation, M.M.R. and N.A.; writing—original draft preparation, M.M.R.; writing—review and editing, M.M.R., N.A., L.S.; visualization, L.S. and M.P.P.; supervision, M.P.P.; project administration, M.P.P.; funding acquisition, M.P.P. All authors have read and agreed to the published version of the manuscript.

Funding

This research was funded by University Research Project-2017—Innovative materials in the remediation of contaminated aquifers: characterization, reactivity and hypothesis for technological implementation. Sapienza University of Rome. Principal Investigator Marco Petrangeli Papini.

Institutional Review Board Statement

Not applicable.

Informed Consent Statement

Not applicable.

Data Availability Statement

Data sharing not applicable. No new data were created or analyzed in this study. Data sharing is not applicable to this article.

Acknowledgments

The authors acknowledge the Norwegian Geotechnical Institute (NGI) for the materials. The images were obtained at the Research Institute “Centro di Ricerca per le Nanotecnologie Applicate all’Ingegneria della Sapienza” (CNIS) with the help of the Francesco Mura. The authors want also to acknowledge Ida Petitti for morphological analysis. Lucia Pierro and Gloria Arduini are sincerely acknowledged for the setting of the experimental set-up and for the assistance for the experimental activities.

Conflicts of Interest

The authors declare no conflict of interest.

References

  1. Ciampi, P.; Esposito, C.; Papini, M.P. Hydrogeochemical Model Supporting the Remediation Strategy of a Highly Contaminated Industrial Site. Water 2019, 11, 1371. [Google Scholar] [CrossRef] [Green Version]
  2. Sale, T.; Newell, C.; Stroo, H.; Hinchee, R.; Johnson, P. Frequently Asked Questions Regarding Management of Chlorinated Solvents in Soils and Groundwater; Environmental Security Technology Certification Program Office (DOD): Arlington, VA, USA, 2008. [Google Scholar]
  3. Casasso, A.; Tosco, T.; Bianco, C.; Bucci, A.; Sethi, R. How can we make pump and treat systems more energetically sustainable? Water 2020, 12, 67. [Google Scholar] [CrossRef] [Green Version]
  4. Mackay, D.M.; Cherry, J.A. Groundwater contamination: Pump-and-treat remediation. Environ. Sci. Technol. 1989, 23, 630–636. [Google Scholar] [CrossRef]
  5. Baric, M.; Majone, M.; Beccari, M.; Papini, M.P. Coupling of polyhydroxybutyrate (PHB) and zero valent iron (ZVI) for enhanced treatment of chlorinated ethanes in permeable reactive barriers (PRBs). Chem. Eng. J. 2012, 195–196, 22–30. [Google Scholar] [CrossRef]
  6. Ghaeminia, M.; Mokhtarani, N. Remediation of nitrate-contaminated groundwater by PRB-Electrokinetic integrated process. J. Environ. Manag. 2018, 222, 234–241. [Google Scholar] [CrossRef] [PubMed]
  7. Hou, D.; Al-Tabbaa, A. Sustainability: A new imperative in contaminated land remediation. Environ. Sci. Policy 2014, 39, 25–34. [Google Scholar] [CrossRef]
  8. Weber, K.; Quicker, P. Properties of biochar. Fuel 2018, 217, 240–261. [Google Scholar] [CrossRef]
  9. Qin, C.; Wang, H.; Yuan, X.; Xiong, T.; Zhang, J.; Zhang, J. Understanding structure-performance correlation of biochar materials in environmental remediation and elec-trochemical devices. Chem. Eng. J. 2020, 382, 122977. [Google Scholar] [CrossRef]
  10. Tan, X.F.; Liu, S.B.; Liu, Y.G.; Gu, Y.L.; Zeng, G.M.; Hu, X.J.; Wang, X.; Liu, S.H.; Jiang, L.H. Biochar as potential sustainable precursors for activated carbon production: Multiple applications in environmental protection and energy storage. Bioresour. Technol. 2017, 227, 359–372. [Google Scholar] [CrossRef] [PubMed]
  11. Oliveira, F.R.; Patel, A.K.; Jaisi, D.P.; Adhikari, S.; Lu, H.; Khanal, S.K. Environmental application of biochar: Current status and perspectives. Bioresour. Technol. 2017, 246, 110–122. [Google Scholar] [CrossRef]
  12. Lee, J.; Kim, K.-H.; Kwon, E.E. Biochar as a Catalyst. Renew. Sustain. Energy Rev. 2017, 77, 70–79. [Google Scholar] [CrossRef]
  13. Gaunt, J.; Cowie, A. Biochar for Environmental Management: Science and Technology; Routledge: London, UK, 2012. [Google Scholar] [CrossRef]
  14. Wu, P.; Ata-Ul-Karim, S.T.; Singh, B.P.; Wang, H.; Wu, T.; Liu, C.; Fang, G.; Zhou, D.; Wang, Y.; Chen, W. A scientometric review of biochar research in the past 20 years (1998–2018). Biochar 2019, 1, 23–43. [Google Scholar] [CrossRef] [Green Version]
  15. Sørmo, E.; Silvani, L.; Thune, G.; Gerber, H.; Schmidt, H.P.; Smebye, A.B.; Cornelissen, G. Waste timber pyrolysis in a medium-scale unit: Emission budgets and biochar quality. Sci. Total Environ. 2020, 718, 137335. [Google Scholar] [CrossRef]
  16. Bartoli, M.; Giorcelli, M.; Jagdale, P.; Rovere, M.; Tagliaferro, A. A Review of Non-Soil Biochar Applications. Materials 2020, 13, 261. [Google Scholar] [CrossRef] [PubMed] [Green Version]
  17. Ippolito, J.A.; Cui, L.; Novak, J.; Johnson, M.G. Biochar for Mine-land Reclamation. In Biochar from Biomass and Waste; Elsevier BV: Amsterdam, The Netherlands, 2019; pp. 75–90. [Google Scholar]
  18. Gwenzi, W.; Chaukura, N.; Noubactep, C.; Mukome, F.N. Biochar-based water treatment systems as a potential low-cost and sustainable technology for clean water provision. J. Environ. Manag. 2017, 197, 732–749. [Google Scholar] [CrossRef]
  19. Shen, Z.; Zhang, Y.; Jin, F.; McMillan, O.; Al-Tabbaa, A. Qualitative and quantitative characterisation of adsorption mechanisms of lead on four biochars. Sci. Total Environ. 2017, 609, 1401–1410. [Google Scholar] [CrossRef] [Green Version]
  20. Yang, X.; Liu, J.; McGrouther, K.; Huang, H.; Lu, K.; Guo, X.; Zhengqian, Y.; Lin, X.; Che, L.; Ye, Z.; et al. Effect of biochar on the extractability of heavy metals (Cd, Cu, Pb, and Zn) and enzyme activity in soil. Environ. Sci. Pollut. Res. 2016, 23, 974–984. [Google Scholar] [CrossRef]
  21. Rodríguez-Vila, A.; Asensio, V.; Forján, R.; Covelo, E.F. Chemical fractionation of Cu, Ni, Pb and Zn in a mine soil amended with compost and biochar and vegetated with Brassica juncea L. J. Geochem. Explor. 2015, 158, 74–81. [Google Scholar] [CrossRef]
  22. Ahmad, M.; Rajapaksha, A.U.; Lim, J.E.; Zhang, M.; Bolan, N.; Mohan, D.; Vithanage, M.; Lee, S.S.; Ok, Y.S. Biochar as a sorbent for contaminant management in soil and water: A review. Chemosphere 2014, 99, 19–33. [Google Scholar] [CrossRef] [PubMed]
  23. Siggins, A.; Thorn, C.; Healy, M.G.; Abram, F. Simultaneous adsorption and biodegradation of trichloroethylene occurs in a biochar packed column treating contaminated landfill leachate. J. Hazard. Mater. 2021, 403, 123676. [Google Scholar] [CrossRef]
  24. Piai, L.; Blokland, M.; van der Wal, A.; Langenhoff, A. Biodegradation and adsorption of micropollutants by biological activated carbon from a drinking water production plant. J. Hazard. Mater. 2000, 388, 122028. [Google Scholar] [CrossRef]
  25. Dalahmeh, S.S.; Alziq, N.; Ahrens, L. Potential of biochar filters for onsite wastewater treatment: Effects of active and inactive biofilms on adsorption of per- and polyfluoroalkyl substances in laboratory column experiments. Environ. Pollut. 2019, 247, 155–164. [Google Scholar] [CrossRef]
  26. Daňo, M.; Viglašová, E.; Galamboš, M.; Štamberg, K.; Kujan, J. Surface complexation models of pertechnetate on biochar/montmorillonite composite-batch and dynamic sorption study. Materials 2020, 13, 3108. [Google Scholar] [CrossRef]
  27. Chaves Fernandes, B.C.; Ferreira Mendes, K.; Dias Júnior, A.F.; da Silva Caldeira, V.P.; da Silva Teófilo, T.M.; Severo Silva, T.; Mendonça, V.; de Freitas Souza, M.; Valadão Silva, D. Impact of pyrolysis temperature on the Properties of Eucaluptus Wood-Derived Biochar. Materials 2020, 13, 5841. [Google Scholar] [CrossRef]
  28. Wang, J.; Wang, S. Preparation, modification and environmental application of biochar: A review. J. Clean. Prod. 2019, 227, 1002–1022. [Google Scholar] [CrossRef]
  29. Ding, Y.; Liu, Y.; Liu, S.; Li, Z.; Tan, X.; Huang, X.; Zeng, G.; Zhou, Y.; Zheng, B.; Cai, X. Competitive removal of Cd(ii) and Pb(ii) by biochars produced from water hyacinths: Performance and mechanism. RSC Adv. 2016, 6, 5223–5232. [Google Scholar] [CrossRef]
  30. Keiluweit, M.; Nico, P.S.; Johnson, M.G.; Kleber, M. Dynamic Molecular Structure of Plant Biomass-Derived Black Carbon (Biochar). Environ. Sci. Technol. 2010, 44, 1247–1253. [Google Scholar] [CrossRef] [PubMed] [Green Version]
  31. Inyang, M.; Dickenson, E. The potential role of biochar in the removal of organic and microbial contaminants from potable and reuse water: A review. Chemosphere 2015, 134, 232–240. [Google Scholar] [CrossRef] [PubMed]
  32. Silvani, L.; Vrchotova, B.; Kastanek, P.; Demnerova, K.; Pettiti, I.; Papini, M.P. Characterizing Biochar as Alternative Sorbent for Oil Spill Remediation. Sci. Rep. 2017, 7, srep43912. [Google Scholar] [CrossRef] [PubMed]
  33. Martinsen, V.; Alling, V.; Nurida, N.; Mulder, J.; Hale, S.; Ritz, C.; Rutherford, D.; Heikens, A.; Breedveld, G.D.; Cornélissen, G. pH effects of the addition of three biochars to acidic Indonesian mineral soils. Soil Sci. Plant Nutr. 2015, 61, 821–834. [Google Scholar] [CrossRef] [Green Version]
  34. Silvani, L.; Cornelissen, G.; Smebye, A.B.; Zhang, Y.; Okkenhaug, G.; Zimmerman, A.R.; Thune, G.; Sævarsson, H.; Hale, S.E. Can biochar and designer biochar be used to remediate per- and polyfluorinated alkyl substances (PFAS) and lead and antimony contaminated soils? Sci. Total Environ. 2019, 694, 133693. [Google Scholar] [CrossRef] [PubMed]
  35. Silvani, L.; Di Palma, P.R.; Riccardi, C.; Eek, E.; Hale, S.E.; Viotti, P.; Papini, M.P. Use of biochar as alternative sorbent for the active capping of oil contaminated sediments. J. Environ. Chem. Eng. 2017, 5, 5241–5249. [Google Scholar] [CrossRef]
  36. Silvani, L.; Hjartardottir, S.; Bielská, L.; Škulcová, L.; Cornelissen, G.; Nizzetto, L.; Hale, S.E. Can polyethylene passive samplers predict polychlorinated biphenyls (PCBs) uptake by earthworms and turnips in a biochar amended soil? Sci. Total Environ. 2019, 662, 873–880. [Google Scholar] [CrossRef] [PubMed]
  37. Premarathna, K.; Rajapaksha, A.U.; Sarkar, B.; Kwon, E.E.; Bhatnagar, A.; Ok, Y.S.; Vithanage, M. Biochar-based engineered composites for sorptive decontamination of water: A review. Chem. Eng. J. 2019, 372, 536–550. [Google Scholar] [CrossRef]
  38. Li, L.; Quinlivan, P.A.; Knappe, D.R. Effects of activated carbon surface chemistry and pore structure on the adsorption of organic contaminants from aqueous solution. Carbon 2002, 40, 2085–2100. [Google Scholar] [CrossRef]
  39. Rosales, E.; Meijide, J.; Pazos, M.; Sanromán, M.A. Challenges and recent advances in biochar as low-cost biosorbent: From batch assays to continuous-flow systems. Bioresour. Technol. 2017, 246, 176–192. [Google Scholar] [CrossRef] [PubMed]
  40. Zhang, M.; Ahmad, M.; Al-Wabel, M.I.; Vithanage, M.; Rajapaksha, A.U.; Kim, H.S.; Lee, S.S.; Ok, Y.S. Adsorptive Removal of Trichloroethylene in Water by Crop Residue Biochars Pyrolyzed at Contrasting Temperatures: Continuous Fixed-Bed Experiments. J. Chem. 2015, 2015, 1–6. [Google Scholar] [CrossRef] [Green Version]
  41. Ahmad, M.; Lee, S.S.; Oh, S.-E.; Mohan, D.; Moon, D.H.; Lee, Y.H.; Ok, Y.S. Modeling adsorption kinetics of trichloroethylene onto biochars derived from soybean stover and peanut shell wastes. Environ. Sci. Pollut. Res. 2013, 20, 8364–8373. [Google Scholar] [CrossRef]
  42. Kołodyńska, D.; Wnętrzak, R.; Leahy, J.; Hayes, M.; Kwapiński, W.; Hubicki, Z. Kinetic and adsorptive characterization of biochar in metal ions removal. Chem. Eng. J. 2012, 197, 295–305. [Google Scholar] [CrossRef]
  43. Liu, Y.; Liu, Z.; Gao, J.; Dai, J.; Han, J.; Wang, Y.; Xie, J.; Yan, Y. Selective adsorption behavior of Pb(II) by mesoporous silica SBA-15-supported Pb(II)-imprinted polymer based on surface molecularly imprinting technique. J. Hazard. Mater. 2011, 186, 197–205. [Google Scholar] [CrossRef]
  44. El-Naas, M.H.; Alhaija, M.A.; Al-Zuhair, S. Evaluation of an activated carbon packed bed for the adsorption of phenols from petroleum refinery wastewater. Environ. Sci. Pollut. Res. 2017, 24, 7511–7520. [Google Scholar] [CrossRef]
  45. Ai, J.; Lu, C.; Berg, F.W.V.D.; Yin, W.; Strobel, B.W.; Hansen, H.C.B. Biochar catalyzed dechlorination – Which biochar properties matter? J. Hazard. Mater. 2021, 406, 124724. [Google Scholar] [CrossRef]
  46. Kameyama, K.; Miyamoto, T.; Iwata, Y. The Preliminary Study of Water-Retention Related Properties of Biochar Produced from Various Feedstock at Different Pyrolysis Temperatures. Materials 2019, 12, 1732. [Google Scholar] [CrossRef] [Green Version]
  47. Ahmad, M.; Lee, S.S.; Rajapaksha, A.U.; Vithanage, M.; Zhang, M.; Cho, J.S.; Lee, S.-E.; Ok, Y.S. Trichloroethylene adsorption by pine needle biochars produced at various pyrolysis temperatures. Bioresour. Technol. 2013, 143, 615–622. [Google Scholar] [CrossRef]
  48. Kim, J.; Lee, S.S.; Khim, J. Peat moss-derived biochars as effective sorbents for VOCs’ removal in groundwater. Environ. Geochem. Health 2017, 41, 1637–1646. [Google Scholar] [CrossRef]
  49. Siggins, A.; Abram, F.; Healy, M.G. Pyrolysed waste materials show potential for remediation of trichloroethylene-contaminated water. J. Hazard. Mater. 2020, 390, 121909. [Google Scholar] [CrossRef] [PubMed]
  50. Liu, Y.; Sohi, S.P.; Liu, S.; Guan, J.; Zhou, J.; Chen, J. Adsorption and reductive degradation of Cr(VI) and TCE by a simply synthesized zero valent iron magnetic biochar. J. Environ. Manag. 2019, 235, 276–281. [Google Scholar] [CrossRef] [PubMed]
  51. Lyu, H.; Tang, J.; Cui, M.; Gao, B.; Shen, B. Biochar/iron (BC/Fe) composites for soil and groundwater remediation: Synthesis, applications, and mechanisms. Chemosphere 2020, 246, 125609. [Google Scholar] [CrossRef]
  52. Lawrinenko, M.; Wang, Z.; Horton, R.; Mendivelso-Perez, D.; Smith, E.A.; Webster, T.E.; Laird, D.A.; Van Leeuwen, J.H. Macroporous Carbon Supported Zerovalent Iron for Remediation of Trichloroethylene. ACS Sustain. Chem. Eng. 2016, 5, 1586–1593. [Google Scholar] [CrossRef]
  53. Ahmad, M.; Lee, S.S.; Dou, X.; Mohan, D.; Sung, J.-K.; Yang, J.E.; Ok, Y.S. Effects of pyrolysis temperature on soybean stover- and peanut shell-derived biochar properties and TCE adsorption in water. Bioresour. Technol. 2012, 118, 536–544. [Google Scholar] [CrossRef]
Figure 1. Photos of the investigated materials: (a) PWBC, (b) RHBC and (c) EuFeBC.
Materials 14 01776 g001
Figure 2. Experimental configuration of the fixed-bed column.
Materials 14 01776 g002
Figure 3. SEM images at 200 nm of resolution: (a) commercial Activated Carbon; (b) PWBC; (c) RHBC and (d) EuFeBC. Other images can be found in Supplementary Materials (Figures S1 and S2).
Materials 14 01776 g003
Figure 4. Kinetic results of TCE onto BCs. TCE Concentration (a) and TCE adsorbed per gram of BC (b) as a function of time. Error bars indicate the standard deviation.
Materials 14 01776 g004
Figure 5. Isotherm curves of TCE onto investigated BCs: (a) PWBC, (b) RHBC and (c) EuFeBC.
Materials 14 01776 g005
Figure 6. Breakthrough curves of TCE onto (a) PWBC; (b) RHBC and (c) EuFeBC. Fixed-bed reactors treated about 0.8 L die−1 and about 25 pore volume per day.
Materials 14 01776 g006
Table 1. Results of textural characterization.
MaterialSpecific Surface Area (m2 g−1)Total Pores Volume (cm3 g−1)Micro-Pores Volume (cm3 g−1)
PWBC 1343 ± 20.3830.136
RHBC81.0 ± 0.70.1010.028
EuFeBC97 ± 10.0750.039
Commercial AC 1712 ± 20.7360.281
1 Results reported by Kastanek et al. (2027) [32].
Table 2. Kinetic parameters for TCE on tested BCs.
MaterialPseudo-First OrderPseudo-Second Order
qe(cal)
(mg g−1)
K1
(min−1)
R2qe(cal.)
(mg g−1)
K2
(g (mg min−1))
R2
PWBC0.160.0290.8334.360.00530.99
RHBC1.680.00720.8919.420.00410.99
EuFeBC2.280.00670.9224.440.00190.99
Table 3. Optimized parameters of Freundlich and Langmuir models.
MaterialFreundlichLangmuir
nKF
(L g−1)
R2qmax
(mg g−1)
KL
(L mg−1))
R2
PWBC0.50 ± 1.6 × 10−29.44 ± 0.600.98109.41 ± 5.623.8 × 10−2 ± 4.8 × 10−30.96
RHBC0.43 ± 1.4 × 10−22.83 ± 0.140.9721.00 ± 0.915.8 × 10−2 ± 6.3 × 10−30.93
EuFeBC0.37 ± 1.8 × 10−25.21 ± 0.380.9630.35 ± 2.498.2 × 10−2 ± 2.2 × 10−20.85
Table 4. Characteristics of various Biochar and commercial Activated Carbon studied and the maximum TCE adsorbed per grams of material (according to the Langmuir model).
Material TypePeak Temperature (°C)Surface Area (m2 g−1)qmax (mg g−1) Range of Ce (mg L−1)Reference
Pine Wood BC 850343 ± 2109.41 ± 5.6210–120Kastanek et al., 2017 [32]; this work
Rice husks BC 30081.0 ± 0.721.00 ± 0.91
Eupatorium shrubs BC + Fe(OOH) 60097 ± 130.35 ± 2.49
Norit AC Darco®-712 ± 2260.33 ± 22.3210–200
Herbal Pomace BC600374562.157200Siggins et al., 2020 [49]
Oak BC650–72021622.093
Spruce BC6003946.754
GAC Darco®-63390.680
Soybean Stover BC 3005.6112.482–20Ahmad et al., 2012 [53]
Soybean Stover BC 700420.331.74
Peatnut Shell BC 3003.1412.12
Peatnut Shell BC 700448.232.02
AC Darco® G-60-111050.01
Pine Needle BC 3004.09205.4175–50Ahmad et al., 2013 [47]
Pine Needle 50013.06320.251
Pine Needle 700390.52211.189
Publisher’s Note: MDPI stays neutral with regard to jurisdictional claims in published maps and institutional affiliations.

