Abstract
In this study, calcium carbonate (CaCO3) microparticles having pH-sensitive properties were loaded with sodium lignosulfonate (SLS), a corrosion inhibitor. Scanning electron microscope (SEM), UV–VIS spectrophotometer (UV-vis), X-ray diffraction (XRD), and attenuated total reflection-Fourier-transform infrared spectroscopy (ATR-FTIR) were applied to evaluate the properties of the synthetic microparticles. This material could lead to the release of corrosion inhibitor under different pH conditions of the aqueous media. However, the extent of release of the corrosion inhibitor in the acidic media was higher, leading to enhanced shielding effect of the Q235 steel. These microparticles can serve as anti-corrosion additive for epoxy resin-coated Q235 steel. Electrochemical experiments were used to assess the anti-corrosive ability of the epoxy coatings in simulated concrete pore (SCP) solution, confirming the superior corrosion inhibition of the epoxy coating via incorporation of 5 wt % calcium carbonate microparticles loaded with SLS (SLS/CaCO3). The physical properties of coating specimens were characterized by water absorption, contact angle, adhesion, and pencil hardness mechanical tests.
1. Introduction
Among the various building materials used in civil engineering, concrete is considered as one of the most critical materials. Life span of the concrete mainly depends on the steel bars along with different other properties of concrete. Steel corrosion is one of the key factors reducing the life span of the concrete [1]. The corrosion initiation of reinforced concrete can be triggered by carbonation and chloride erosion [2,3], especially under severe environment including marine and saline lake environment. Under these environments, the protective layer on the steel bars gets quickly destroyed, which subsequently leads to the destruction of concrete and thereby damaging the reinforcement [4,5].
Therefore, efficient prevention and repair of the corrosion damage of the reinforced concrete structures are necessary. Various methods have been proposed for mitigating the corrosion damage including admixing of suitable corrosion inhibitors [6,7,8], selection of corrosion-resistant steel bars (such as galvanized steel bars and epoxy-coated steel bars) [9,10], and using electrochemical protection [11]. In terms of economic and technical point of view, a durable and well-bonded coating on steel can serve as a physical barrier against the ingression of potentially dangerous environmental corrosive agents. The coating allows the steel surface to tolerate corrosive ions from the external medium by providing a physical barrier [12,13,14]. The key characteristics of the protective level provided by coating are the adhesiveness and continuity of the coating applied on the metal surface and its reactivity with the environmental medium.
Epoxy resins have extensive applications in the protection of metallic corrosion due to their low costs and excellent anti-corrosive ability. The matrix of the metal is prevented from getting destroyed by the corrosive ions by the coating. However, most of the coatings are vulnerable against mechanical damage. Therefore, some researchers mixed corrosion inhibitors to the coating for enhancing the effective corrosion inhibition and mechanical properties of the coating [15,16]. However, if added directly to the coating, the corrosion inhibitors show certain reactivity towards certain components of the coating, which subsequently affect the mechanical strength and stability of the coating and simultaneously lead to environmental problems [11,17,18,19]. In the recent years, many researchers have applied carrier for the loading of inhibitors in order to prevent the reaction between the inhibitors and the coating, and thereby achieving optimized shielding properties of the coating [19].
Calcium carbonate (CaCO3) can be divided into three kinds of crystal polymorphs according to the crystalline form having similar composition but different structures, i.e., calcite, aragonite, and vaterite [20]. Through the series gradual decrease in thermal stability takes place with sequential increase in energy [21]. In the biological systems, CaCO3 is mostly present as calcite or aragonite. The thermodynamics of vaterite is unstable and quick transforms vaterite into calcite or aragonite in an aqueous solution. Vaterite is rare in the nature. In recent times, CaCO3 microspheres have received great attention thanks to their better mechanical and thermal stability, biocompatibility, and biodegradability [22,23,24,25]. Nano-particulate CaCO3 can be transformed into various structures and morphologies using modifiers, and it is possible to easily load them with the corrosion inhibitors [26,27]. CaCO3 powders have been used as filler in coating and as a carrier material to control the release rate [28]. This behavior does not lead to incompatibility between the particles and the coating. If CaCO3 microspheres loaded with corrosion inhibitors are embedded in the coating, slight modification of the coating is required and the modification step is a simple one.
Earlier reports in the literature have shown the application of epoxy coatings modified by CaCO3 microspheres with a variety of inhibitors over aluminum alloy as anti-corrosive coating [19]. These coatings were found to enhance the impact resistance, thermal stability, and corrosion resistance. However, with the increasing of added microspheres, tensile characteristic of the thin layer is reduced, leading to brittleness of the coating. Recent work demonstrated that CaCO3 microbeads have been modified with various inhibitors: cerium nitrate, salicylaldoxime, and 2,5-dimercapto-1,3,4-thiadiazolate to extend the corrosion inhibition ability of coating and impart pH sensitivity. It indicated that CaCO3 microbeads with cerium nitrate revealed good dispersibility, imparted pH sensitivity into epoxy coatings, and prolonged corrosion in AA2024 substrates [19]. Roma Raj et al. also investigated that CaCO3 microbeads worked as containers for a mixture of two inhibitors triethanolamine (TEA) and polyethylenimine (PEI) in epoxy coating and found that the coating pore resistance of the modified coating presented about four order of magnitude higher compared to the neat epoxy coating [29].
Sodium lignosulfonate (SLS) is a natural polymer and is being used as an anionic surfactant [30]. As a by-product from the production of pulp, SLS is harmless to the environment. SLS is soluble in water and in low concentration exists as a single molecule with a diameter of about 14–22 nm. With increasing concentration of SLS, SLS polymerizes and forms spherical particles with the diameter of about 0.5–1 µm. SLS has been reported to provide corrosion protection for steel. Ouyang et al. investigated the corrosion inhibition performances of carbon steel under recirculatory cooling water using SLS as an environmentally benign corrosion inhibitor [31]. SLS showed active inhibition properties on zinc in hydrochloric acid (HCl) aqueous solution [32].
This study explores the anti-corrosion properties of a novel composite prepared by the combination of SLS and pH-sensitive CaCO3 particles in the epoxy coatings applied on Q235 steel. Various physicochemical analytical methods were used to characterize the microspheres with or without SLS loading. After immersion in the SCP solutions containing 3.5 wt % sodium chloride, the inhibition protection of the coated Q235 coupons was evaluated by electrochemical measurements and physical properties tests.
2. Experimental Procedures
2.1. Synthesis of SLS/CaCO3
CaCO3 microparticles were synthesized via the co-precipitation method. In the first step, 0.5 M CaCl2 (50 mL) (purchased from Macklin (Shanghai, China), ≥99.9%) was poured rapidly into an equal volume of 0.5 M Na2CO3 (purchased from Macklin, ≥99.9%) under vigorous stirring (40 °C, 60 s). The produced suspension was evacuated applying vacuum filtration with filter paper of 0.22 μm pore size and rinsed with deionized water and ethanol. Then, the synthesized microparticles were dried for 24 h at 50 °C. Dried calcium carbonate particles were soaked into a 15 wt% SLS solution (50 mL) (purchased from Macklin) in vacuum for 1 day. The suspension was separated using circulating water vacuum pump, followed by washing with Millipore ultrapure water and subsequent drying in an oven at 50 °C.
2.2. Preparation of the Epoxy Coating
The Epoxy resin (E44) and polyamide hardener (650) were provided by Zhenjiang Danbao Resin Co., Ltd. (Zhenjiang, China). Epoxy resin with CaCO3 microparticles with or without SLS loading was applied onto the prepared specimens. CaCO3 particles with SLS (3 wt% and 5 wt% of the gross weight of the hardener and epoxy resin) were added into ethanol under ultrasonic dispersing for 1 h. After that, the dispersion of CaCO3 particles with or without SLS loading was stirred with the epoxy resin for 10 min. Subsequently, the mixture of the hardener and epoxy resin keeping a weight ratio of 1:1 was stirred for 15 min before applying the coating mixture. Then, various coating formulations were applied on steel bar by dipping coating with the withdrawal rate of 18 cm/min. Finally, the coated steels were cured for 7 days.
2.3. Materials and Sample Preparation
Before coating, the Q235 carbon steel specimen (Dongguan Tengwei Metallic Material Co., Ltd., Dongguan, China) was abraded with metallographic paper (#400, #500, #600, #800 and #1000 garde), then sonicated in acetone for 5 min, followed by the subsequent rinsing with ethanol and deionized water [33]. The epoxy coatings were deposited onto the carbon steel bar measuring 12-mm diameter and 30-mm length. The picture of coating steel bar is shown in Figure 1. The chemical composition (wt%) of the carbon steel was 0.002 S, 0.003 N, 0.021 P, 0.021 O 0.13 C, 0.17 Si, 0.57 Mn, and balance Fe. Except the working surface, all the parts of the steel bar were sealed by the epoxy resin. The coated Q235 steel specimens were immersed in SCP solution at pH ~ 12.5 to evaluate their protective properties by means of electrochemical techniques.
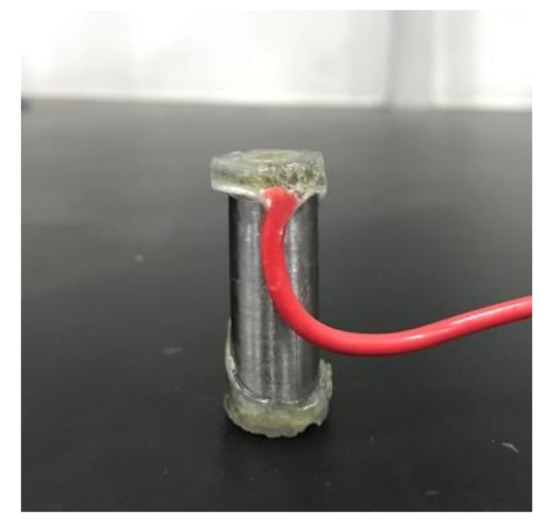
Figure 1.
Coating steel bar.
3. Characterization of the Particles and Coated Samples
3.1. Scanning Electron Microscopy
SEM (Zeiss, Merlin, Jena, Germany) was applied to observe the micrographs of the blank and SLS-loaded microspheres (accelerating voltage of 5 kV). Appropriate amount of CaCO3 microbeads were stuck with conductive glue on the aluminum block, gilded, and then put into the sample chamber. In addition, SEM presented the fracture surface morphologies of the coatings after broken in liquid nitrogen.
3.2. X-ray Diffraction
X-Ray diffraction (XRD) study (Bruker, D8 Advance, Karlsruhe, Germany) using Cu-Kα radiation source was carried out to confirm the phase identification of CaCO3 particles before and after the loading with SLS. The data was collected between the angular range of 10° ≤ 2θ ≤ 80° employing a scanning rate of 2°/min with a 2θ step of 0.013°.
3.3. ATR-FTIR
The attenuated total reflection-Fourier-transformed infrared spectroscopy (Bruker, Vertex 70, Karlsruhe, Germany) was employed to analyze the structure of the CaCO3 microparticles employing wavelength range scanning from 4000 to 400 cm−1.
3.4. UV–Vis Spectrum
UV–VIS spectrophotometer (YOKE INSTRUMENT, UV755B, Shanghai, China) was employed to measure the concentration of the released inhibitor in the aqueous solution from SLS/CaCO3 particles. The absorption peak at about 280 nm belongs to the benzene ring in the sodium lignosulfonate. The SLS concentration and its absorbance peak at 280 nm show good linear correlation. Standard curve was obtained by measuring the absorbance of known concentration of SLS in the aqueous solution and a linear plot was obtained. The loaded microspheres were dispersed in aqueous solution with varying pHs (4.0, 7.0, and 10.0) after different immersion times (24, 48, and 72 h).
3.5. Electrochemical Experiments
The steel was immersed in SCP test solutions for 15 days at ambient temperature. After stabilizing the open-circuit potential (OCP) for at least 30 min, inhibition properties of the coated-Q235 steel were measured using electrochemical impedance spectroscopy (EIS) spectra within the frequency range of 100 kHz to 10 mHz and oscillation amplitude of 20 mV from peak to peak utilizing Princeton 263A electrochemical workstation. Potentiodynamic polarization measurements also applied in the electrochemical workstation. The experimental potential range was in the range of −1.0 to +1.0 V (vs. OCP) and the scan rate was 0.8 mV/s. Reproducibility of the results was confirmed by carrying out each experiment at least thrice.
3.6. Water Absorption Test
Water absorption tests were used according to the ASTM D570 2005 standard in order to characterize the anti-corrosive ability of the coating. The weight of each coated samples was recorded before and after the immersion in deionized water at room temperature and was indicated as m0 and mt, respectively. Prior to weighing, the coating specimens were wiped with filtration paper. The coated samples were weighed after various immersion periods. Then, the water absorption Qt was calculated by Equation (1) [34]
3.7. Contact Angle Tests
The contact angle estimations (DataPhysics, OCA40 Micro, Stuttgart, Germany) was carried out to analyze the wettability of the coating. Prior to the measurement, 3 μL distilled water was dropped on the surface of the coating steel. Each sample was measured three times.
3.8. Adhesion Measurements
The adhesion property of the coating is an effective criterion to evaluate the inhibition performance of the coatings. Adhesion test was performed according to ISO-2409: 2013 Standard. A coating surface was drawn out 100 grids and swept the surface with a brush. Then, a transparent adhesive tape was firmly stuck on the scratched surface and tore off with an angle of about 60° within 0.5–1.0 s. The spalling area of the coating was observed by magnifying glass. The adhesion level of the coating without the detached area can be classified as level 0, whereas coating surface with the lowest adhesion belong to level 5 [35].
3.9. Pencil Hardness Mechanical Test
The pencil hardness test was performed on the coatings according to ASTM D3363. The hardness of the wood pencils scale ranges from 6B to 6H. The test started from the pencil with minimum hardness (6B). Until the pencil scratched or dug the coating, the coating hardness was equated to the previous pencil. Gouge hardness and scratch hardness determined the hardness value. The first one presents the resistance of the coating to being cut, the second one indicates the mechanical resistance of the coating to being scratch [36].
4. Result and Discussion
4.1. Characterization of the Calcium Carbonate Particles
The morphological structures of the CaCO3 microbeads with or without SLS loading were investigated by SEM (Figure 2). As shown in Figure 2a, the morphological features of the CaCO3 microbeads prior to the SLS loading shows roughly spherical and oblong in shape. As confirmed by the magnified micrograph (Figure 2b), the CaCO3 microparticles are typical of porous vaterite and agglomerate to form larger microparticles which are composed of many small and nearly spherical microparticles. Each one small spherical microparticles will increase the surface area of CaCO3 microbeads and result in the generation of porous surface. Furthermore, CaCO3 microbeads without SLS loading are also composed of a small amount of prismatic calcite. These structures are conducive for the loading of the inhibitor. The average size of the unmodified CaCO3 microparticles is found to be around 2–10 μm. After the loading of SLS on the CaCO3 microparticles (Figure 2c,d), the original spherical morphology and diameter of the micro-agglomerates are maintained along with the observation of few prismatic calcite.
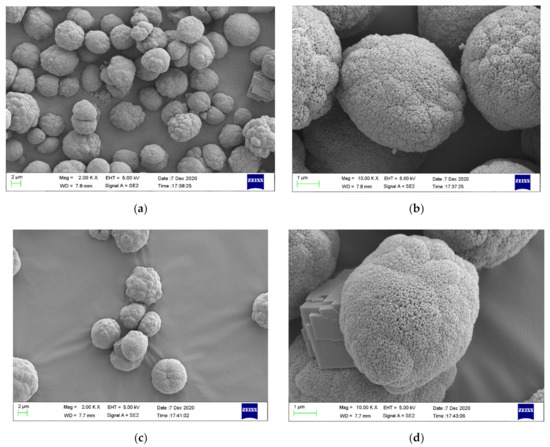
Figure 2.
SEM images of (a) CaCO3 microparticles, (b) CaCO3 microparticles at higher magnification, (c) CaCO3 microparticles loaded with sodium lignosulfonate (SLS), and (d) CaCO3 microparticles loaded with SLS at higher magnification.
Crystalline structure of the synthesized CaCO3 (Figure 3) demonstrated characteristic diffraction peaks related to vaterite (JCPDS #72-0506) or calcite (JCPDS #99-0022), thus revealing the presence of mixed crystals of spherical vaterite and calcite. The high crystallinity of the obtained CaCO3 particles was confirmed from the pronounced peaks observed in the XRD pattern. Sixteen diffraction peaks in the XRD patterns at 2θ = 22.944, 29.311, 31.409, 35.849, 39.314, 43.045, 47.034, 47.455, 48.414, 56.463, 57.275, 60.535, 61.310, 62.909, 64.525, and 65.616° correspond to the respective planes of (012), (104), (006), (110), (113), (202), (024), (018), (116), (211), (122), (214), (119), (125), (300), (0012) of vaterite and the peaks at 2θ = 20.880, 24.883, 26.973, 32.711, 42.613, 43.767, 49.098, 49.946, and 55.768° correspond to the respective planes of (002), (100), (101), (102), (004), (110), (112), (104), and (202) for calcite. We estimated that the vaterite and calcite relative mole fractions in the CaCO3 microparticles can be correlated to the X-ray diffraction intensity from the following expression [37]:
where, C and V are the calcite and vaterite mole fractions, respectively, IC is the X-ray diffraction intensity of the corresponding planes of calcite, and IV is the X-ray diffraction intensity of planes of vaterite.
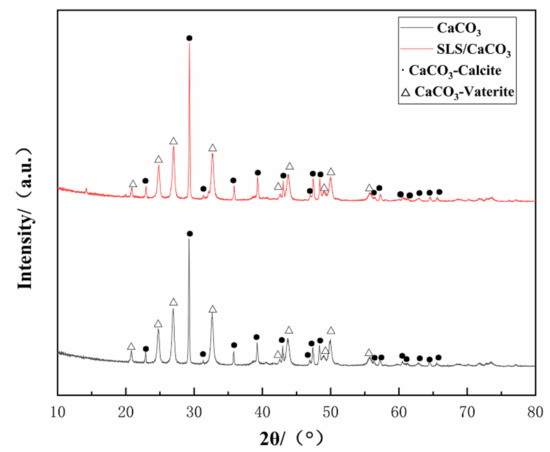
Figure 3.
XRD spectrum of loaded and unloaded CaCO3 microparticles.
The mole fractions of vaterite and calcite for the CaCO3 microparticles without SLS were found to be ~60.64% and 39.36%, respectively, while the corresponding values for the SLS-loaded CaCO3 microparticles were 55.95% and 44.05%, respectively.
Increasing pH of the synthetic solution due to the presence of SLS leads to the phase transformation of the synthesized CaCO3 microparticles from the vaterite to calcite. The dissolution of vaterite would lead to quick transformation of vaterite to calcite, so the addition of the SLS induced increasing rate of dissolution rate of the vaterite [38].
The absorbance of the aqueous solution with varying concentration of SLS was monitored by UV–VIS spectrophotometer. Linearity of the standard plot with eight different concentrations of SLS (10, 20, 30, 40, 50, 60, 70, and 80 mg/L) is depicted in Figure 4 [39]. The standard curve can be used to calculate the concentration of SLS in aqueous solution. The structure of SLS contains functional groups capable of absorbing UV light and among them the main peak at 280 nm is due to the presence of benzene ring. The wavelength was scanned from 800 to 190 nm for monitoring the absorbance of SLS at 280 nm [40]. Standard concentration-absorbance equations of SLS were established within the concentration range of 10–80 mg/L (A = 0.0038 × C − 0.0405, R2 = 0.9906 where A, C and R2 are the absorbance, the concentration of SLS and the correlation coefficient, respectively). Under different pHs of the aqueous solution, the release of SLS/CaCO3 micro-containers were also studied employing UV–vis spectrophotometer. Figure 5 shows the time dependent change of the absorbance values of SLS from the CaCO3 micro-containers under various pH of the aqueous solution over 72 h (pH = 4.0, 7.0, and 10.0). These solutions were prepared with deionized water, 0.1 M acetic acid, and 0.1 M sodium hydroxides (NaOH). Table 1 lists the absorbance and concentration of the SLS released from the CaCO3 micro-containers for 72 h of immersion in various pH solutions. At all immersion times, the highest absorbance intensity was presented at pH 4. The released SLS concentration decreased with increasing pH values. In acidic and neutral media, the SLS released from the CaCO3 micro-containers rapidly in early time. However, in alkaline media, the concentration of SLS increased slowly as the immersion time increases. Release behavior of SLS from the CaCO3 under various pH of the aqueous solution showed higher release in the acidic medium in comparison to the alkaline medium. Therefore, the SLS-loaded CaCO3 micro-containers have promising applications in the reinforced concrete.
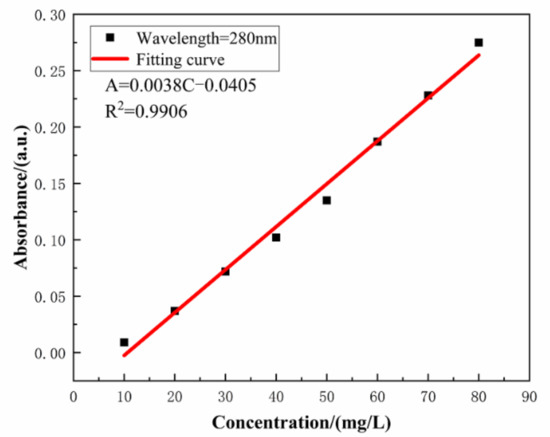
Figure 4.
The concentration dependent absorbance of SLS in aqueous solution.
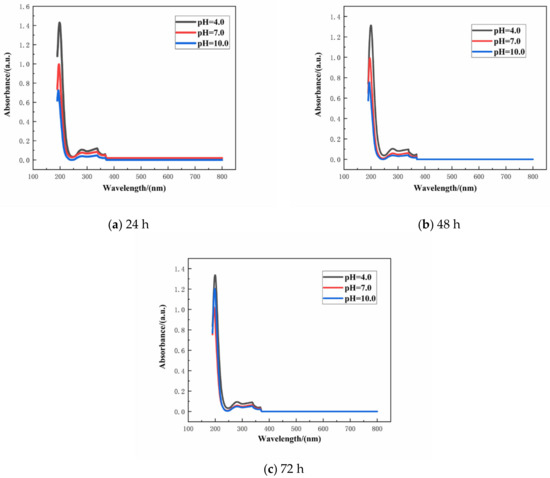
Figure 5.
Release curves of SLS from the CaCO3 micro-containers at different pH values: (a) 24 h, (b) 48 h, and (c) 72 h.

Table 1.
Time dependent release of sodium lignosulfonate (SLS) from the CaCO3 micro-containers under different pH values of the aqueous solutions.
Further details regarding the chemical composition of the CaCO3 micro-containers loaded with SLS were obtained by ATR-FTIR analysis. The absorption peaks at 713 and 876 cm−1 shown in Figure 6 can be assigned to the calcite. Two major bands at 745 and 1086 cm−1 are originated from the presence of vaterite. The broad areas of absorption in 1455–1490 cm−1 correspond to the amorphous calcium carbonate. The typical peaks attributed to calcite and vaterite remained unchanged in the spectra for the CaCO3 particles in absence or in presence of SLS. The presence of two weak peaks at 874–877 and 743–746 cm−1 corresponding to the out-of-plane and in-plane stretching of carbonate ions, respectively, confirm the presence of CaCO3. The carbonate ion is confirmed by the asymmetric stretching at 1446 cm−1 and the symmetric stretching at 1086 cm−1. The structure of SLS was also investigated by ATR-FTIR (Figure 6). The absorption peak at 2944 cm−1 is the signal of the C-H stretching for the methylene or methyl groups, and the characteristics spectral peak is detected at 618 cm−1 (C–S bending vibration of the sulfonic acid groups), which corresponds to the chemical structure of SLS [41]. The stretching vibration of the benzene ring and S=O from the sulfonic acid groups are observed at 1596 and 1195 cm−1, respectively [42]. The band at 1118 cm−1 could be a sign of C-H bond because of syringyl lignin [43]. The broad peak at 1046 cm−1 represents the S=O stretching vibration of sulfonate groups [44], which overlaps with the O-H stretching vibration in the guaiacyl lignin. SLS-loaded CaCO3 particles could also be indirectly inferred from the broad spectrum between the range of 3390–3450 and 2940–2990 cm−1 because of the stretching vibration of O-H bonds and C-H bonds, respectively [45]. These bands are assigned to the alcoholic and phenolic hydroxyl groups and methylene and methyl groups, respectively, which are characteristic for SLS and could be clearly seen in the spectra for the loaded CaCO3 particles. The bands in the range of 670–2050 cm−1 are from the bending vibrations of the carbonate ions. These overlap with the C-H, S=O, and C-S stretching, respectively, which are related to the presence of SLS.
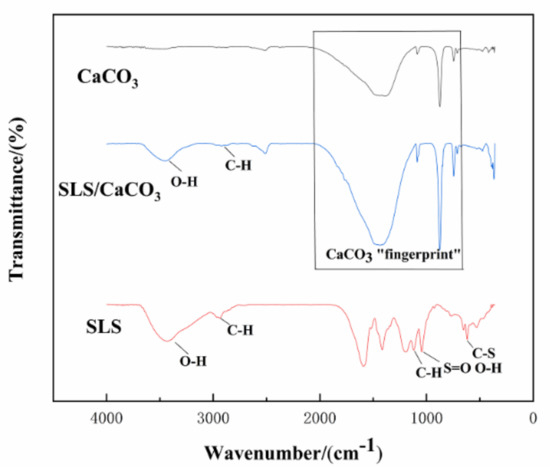
Figure 6.
Attenuated total reflection-Fourier-transform infrared spectroscopy (ATR-FTIR) spectra of CaCO3, SLS, and SLS-modified CaCO3.
4.2. Corrosion Inhibition Performance of CaCO3 Containing-Epoxy Coating
4.2.1. Open Circuit Potential (OCP)
Figure 7 displays the open circuit potentials (OCP) of all specimens in SCP solution. The SLS/CaCO3 microcontainers-containing epoxy coatings had a higher OCP value than blank epoxy coating at the initial stage of the immersion. After the prolonging immersion of the coating system, all specimens presented the gradually dropping OCP values. For instance, the OCP value for blank epoxy specimen dropped remarkably from the initial −0.344 to −0.545 V after immersion for 15 days. The open circuit potential of epoxy-CaCO3 coating increased slightly on the tenth day, which may be attributed to the corrosion products block penetration path of corrosive medium. Meanwhile, for the epoxy coating modified with SLS/CaCO3 microcontainers, the OCP value declined slowly. The OCP value for the epoxy coating containing 3 wt% SLS/CaCO3 and 5 wt% SLS/CaCO3 presented a decreasing trend (from −0.262 to −0.429 V, from −0.221 to −0.424 V). This confirmed that the inhibitor SLS could release from CaCO3 particles and optimized the protective properties of epoxy coating.
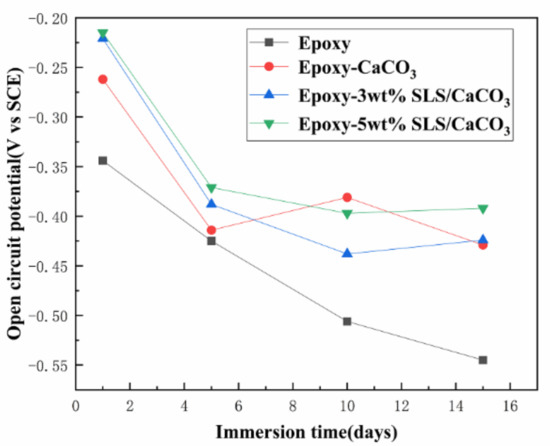
Figure 7.
Evolution of open-circuit potential (OCP) of all coating specimens with the immersion time in simulated concrete pore (SCP) solution.
4.2.2. Electrochemical Impedance Spectroscopy (EIS)
Figure 8 depicts the EIS diagrams of the blank epoxy coatings and modified epoxy coatings after immersion in the SCP solutions. Figure 8a is the Bode impedance spectra of the samples measured after immersion period of 5 days in the SCP test solutions. The barrier performance of the coating system is usually reflected by the impedance modulus |Z| at the lowest frequency. The impedance value at 0.01 Hz (|Z|0.01 Hz) of the coatings containing CaCO3 particles with SLS are higher than that of blank epoxy coating during the early stage of immersion period. Especially, the epoxy-5 wt% SLS/CaCO3 coating exhibited that the |Z|0.01 Hz value reached 7.22 × 10¹⁰ Ω·cm2, being five order of magnitude higher than that of the blank epoxy coating. The Bode curves of the specimens after 15-day immersion are presented in Figure 8b. For the reference sample, the |Z|0.01 Hz value dropped from 3.99 × 10⁵ to 4.05 × 10⁴ Ω·cm2 after 15 days, which was slightly lower than that of the epoxy coating containing CaCO3 particles in the absence of SLS (from 4.20 × 10⁵ to 2.04× 10⁵ Ω·cm2) after 15 days of immersion in the SCP solution. The |Z|0.01 Hz value decreased from 4.52 × 10¹⁰ to 3.88 × 10¹⁰ Ω·cm2 for the epoxy-3wt%SLS/CaCO3 coating. In addition, the coating modified by the 5 wt% CaCO3 particles loaded with SLS exhibited the higher |Z|0.01 Hz values at the early stage, and then, the values presented a slow descending trend, reaching values approximately 3.73 × 10¹⁰ Ω·cm2.
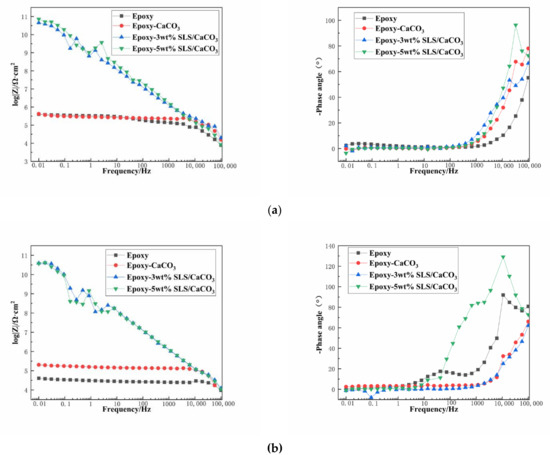
Figure 8.
Bode plots for the epoxy coating containing CaCO3 microparticle with or without SLS as well as the pure epoxy coating, measured after (a) 5 days and (b) 15 days exposure in the SCP solutions with 3.5 wt% NaCl.
The protective performance of the coating system was illustrated by the Bode phase angle. The peaks appear at the range of 10−2–1 Hz (low frequency region), owing to the corrosion activity at interface of the metallic surface and the coating; slight defects or pores on the coatings are reflected by the peak exhibiting within the range of 1 Hz to 103 Hz (intermediate frequency region); the shielding behavior of the coating can be observed by the peak at 104–105 Hz (high frequency region) [46]. In the high frequency region, the coating modified with 5 wt% SLS/CaCO3 exhibited pronounced peak under all immersion durations, suggesting that a better anticorrosion property than the other coatings. The phase angle of the epoxy-5wt% SLS/CaCO3 coating at high frequency was relatively higher than that of the epoxy coating with 3 wt% SLS/CaCO3 particles. For the blank coating, the peak appeared at the intermediate frequency region after 15 days of immersion, revealing the existence of tiny defect on the coating.
The presence of one-time constant corresponding to the coatings at the initial stage of the soaking were fitted by equivalent electrical circuit (Figure 9a) to model the EIS spectra. The impedance spectra of the coating at the later period of immersion revealed two-time constants: the inhibition properties of the coating are reflected at lower frequency, while the other at higher frequency indicates the corrosion phenomena appearing on the metal-coating interface [47].
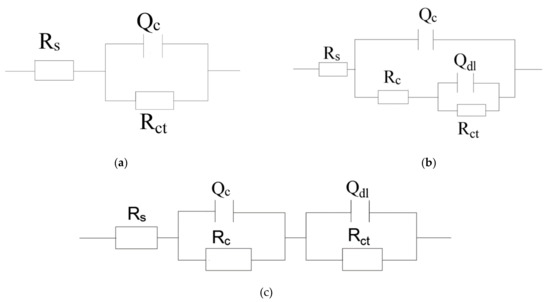
Figure 9.
Equivalent circuit: (a) one-time constant model and (b), (c) two-time constants model.
Those EIS data were modeled applying equivalent circuit, as shown in Figure 9b,c. The corrosion medium diffuses into the interface between coating and metal through micropore on the coating. The equivalent circuit of this situation corresponds to Figure 9b. If the corrosive media evenly penetrates into the coating system. The corresponding equivalent circuit is shown in Figure 9c. The related parameters for the corresponding coating fitted by ZSimpWin software are provided in Table 2. The proposed equivalent circuit consists of the solution resistance (Rs), capacitance of the coating (Qc), resistance of the coating (Rc), charge transfer resistance (Rct), and double-layer capacitance (Qdl) [16]. The value of n close to ~ 1 represents that the steel-electrode can be approximated by the pure capacitance. Otherwise, the n value is about zero, which indicates that the steel electrode can be regarded approximately as a pure resistance [48].
Table 2.
Fitting electrochemical data of the applied coatings in the simulated concrete pore (SCP) solutions.
The anticorrosive performance of the coating can be evaluated by the Rc value. The higher value of Rc indicates better corrosion protection of the coating. Specific changes exist in the Rc values with the increase in soaking time. For all the coatings, the values of Rc declined because of the invasion of the electrolyte and the accumulation of chloride ions between the coating and the steel surface. Thanks to the CaCO3 particles as fillers in the coating, the epoxy-CaCO3 coating Rc value (9.53 × 10⁴ Ω·cm2) was relatively higher than that of pure epoxy coating. The coatings modified by 3 wt% and 5 wt% SLS/CaCO3 micro-containers had higher values of Rc (5.16 × 10¹⁰ and 4.54 × 10¹⁰Ω·cm2), while the Rc value of blank epoxy coating was 1.96 × 10⁴ Ω·cm2 over the 15 days of testing period. Observation demonstrates that the tortuous penetration path of the aggressive medium thorough the coating can be increased by these micro-containers. This trend evidenced that the addition of SLS/CaCO3 microparticles significantly enhanced the corrosion resistance of the epoxy coating.
The evolution of the Rct value is related to the corrosion protection of the coating [42]. The Rct value of epoxy-SLS/CaCO3 coating was much higher than that of blank epoxy coating after immersion for 15 days, implying that its better corrosion-protective ability compared to the pure epoxy specimen.
The variation of the Qdl reflects the delamination of the interface of metal and coating. Therefore, the lower Qdl represents that the excellent barrier effect of coating [49]. The epoxy coating modified with CaCO3 particles exhibited lower Qdl value than neat epoxy coating. Thus, the metal-coating interface reaches stabilization because of the presence of CaCO3 particles.
Qc means the water absorption of coating. The penetration of corrosive electrolytes accompanied by an increase in Qc. The Qc values for all the coatings are stable during 15 days of immersion, revealing all the coatings still have barrier ability.
The Qc and Qdl represents the prefactor of a constant phase element (CPE)to replace the pure capacitance because of the heterogeneities of surface. The pure capacitance can be calculated as follows [50]
where Cx, Qx, and nx represents the capacitance, the constant-phase element, and the empirical exponent, respectively, Rx is either the pore resistance of the coating (Rc) or charge transfer resistance (Rct).
The protective property of the coatings can be acquired from the Nyquist plots [51]. The Nyquist plots of the coating system during 15 days immersion in SCP solutions are depicted in Figure 10. Larger the diameter of the capacitive loop means better the inhibition action. As shown in Figure 10, the diameter of the capacitive loop of all the coated steels decreases slightly after longer exposition time. However, the reference coating exhibited lower capacitive loop than those modified with the SLS/CaCO3 micro-containers, demonstrating superior inhibition performance of the epoxy-SLS/CaCO3 coating.
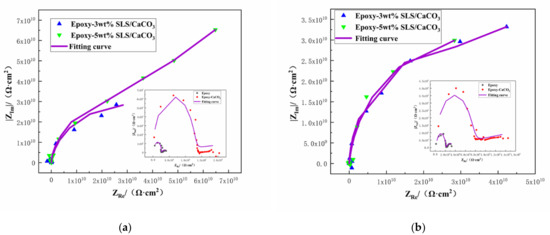
Figure 10.
Nyquist plots for Q235 steel covered by epoxy coatings containing CaCO3 microparticles with or without SLS as well as the pure epoxy coating after exposure to the SCP solution (a) 5 days and (b)15 days.
4.2.3. Potentiodynamic Polarization Measurement
The polarization curves of the coated steel after 5 and 15 days of immersion in the SCP solutions are illustrated in Figure 11. Table 3 reports the kinetic parameters obtained from polarization curves, including the corrosion potential (Ecorr), the corrosion current density (icorr), and the inhibition efficiency (IE%). The inhibition efficiency was defined using Equation (5)
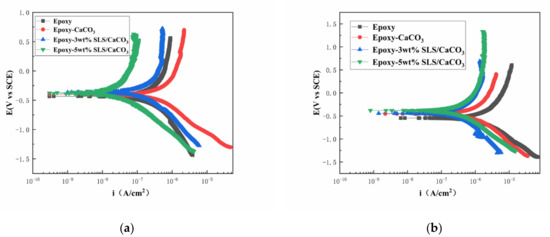
Figure 11.
Potentiodynamic polarization curves for the epoxy coating containing CaCO3 microparticles with or without SLS as well as the pure epoxy coating, measured after (a) 5 days and (b) 15 days exposure in the SCP solutions with 3.5 wt% NaCl.
Table 3.
Polarization parameters of the applied coatings in the SCP solutions.
As shown in Figure 11, the curves of the coatings modified with SLS/CaCO3 micro-containers shifted toward more positive potentials and exhibited a decreased icorr. This suggests that the addition of SLS/CaCO3 particles can further enhance the inhibition performance of the epoxy coating. In Table 3, in comparison to the pure epoxy coating, the Ecorr of 3 wt% SLS/CaCO3 epoxy coating and 5 wt% SLS/CaCO3 epoxy coating moved to more positive position of 0.042 and 0.059 V, respectively, after 5 days of immersion. Moreover, it was noticed that the IE% of 5 wt% SLS/CaCO3 epoxy coating reached 90.83%. After immersion period of 15 days, the icorr values of the coating system showed increasing trend. The icorr values obtained for epoxy coating, epoxy-CaCO3 coating, epoxy-3 wt% SLS/CaCO3 coating and epoxy-5wt%SLS/CaCO3 coating were 1.12 × 10⁻⁶, 3.73 × 10⁻⁷, 1.90 × 10⁻⁷, and 1.72 × 10⁻⁷ A·cm2 after 15 days of immersion, respectively. Surprisingly, the icorr value of modified coating was one orders of magnitude higher than that blank epoxy coating. The Ecorr value for the epoxy-5wt%SLS/CaCO3 coating remained stable (from −0.371 to −0.378 V), while the Ecorr value of the neat epoxy coating decreased in the range from −0.430 to −0.556 V. The IE% values of epoxy coating containing 3wt% SLS/CaCO3 and 5wt%SLS/CaCO3 were 83.02 and 84.64, respectively. Therefore, it suggests that SLS releases from CaCO3 micro-containers.
4.2.4. Physical Properties of Epoxy Composite Coatings
Figure 12 displays the fracture cross-sectional morphologies of different epoxy coatings after being immersed in the SCP solutions. For pure epoxy coating, the cross-section presented the relatively smooth surface. (Figure 12a). In Figure 12b–d, the CaCO3 particles were blended into the epoxy coating. After the addition of CaCO3 particles, the fracture surface of the modified coatings manifested rough surface. CaCO3 micro-container exhibited the better compatibility with the blank epoxy coating. The EDX elemental mapping of the epoxy-CaCO3, epoxy-3 wt% SLS/CaCO3, and epoxy-5 wt% SLS/CaCO3 specimens is depicted in Figure 13. Ca, Na, and S elements were dispersed homogeneously, indicating that the SLS/CaCO3 particles were distributed evenly in the epoxy matrix.
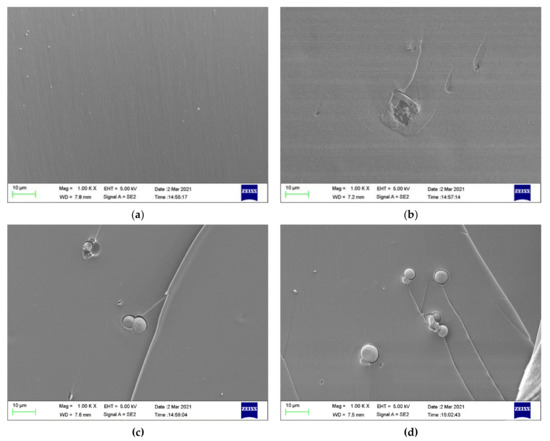
Figure 12.
Cross-section SEM of (a) epoxy coating (b) epoxy-CaCO3 coating, (c) epoxy-3 wt%SLS/CaCO3 coating, and (d) epoxy-5 wt%SLS/CaCO3 coating after exposure to the SCP solutions for 48 h.
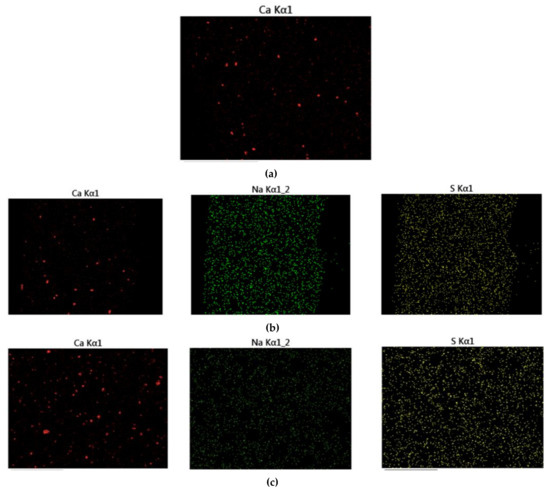
Figure 13.
The EDX map of (a) epoxy-CaCO3 coating, (b) epoxy-3 wt%SLS/CaCO3 coating, and (c) epoxy-5 wt%SLS/CaCO3 coating.
Permeation of water and anti-corrosive behavior of the coating can be measured by the water absorption test. The water absorptions of all the coatings are displayed in Figure 14. With increasing immersion time, a rapid rise in the water absorption values reveals the diffusion of water into the coating defects. Then, the coating water absorption was at a stable value, indicating that the liquid in the coating defects reached saturation state. After 12 days of immersion, the water absorption of the pure epoxy coating, epoxy-CaCO3 coating, epoxy-3 wt% SLS/CaCO3 coating, and epoxy-5 wt% SLS/CaCO3 coating were 0.592%, 0.405%, 0.312% and 0.233%, respectively. The modified coating possesses lower water absorption value and can be ascribed to the calcium carbonate filler reducing the porosity of the coating.
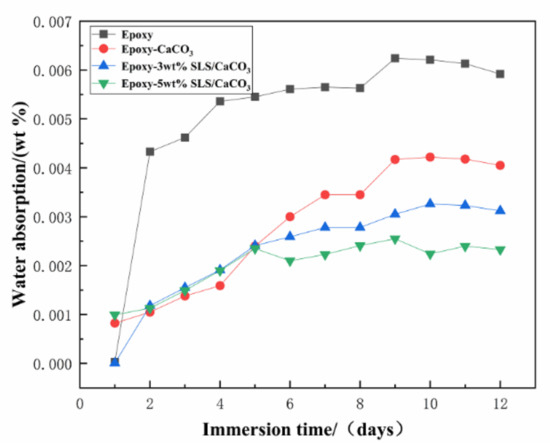
Figure 14.
Water absorption of various coatings over immersion time.
The contact angle analysis is a frequently used method to confirm the wettability of the coating, which is related to the barrier protection effect of the coating [52].The water contact angle photographs of all the coatings are depicted in Figure 15. The neat epoxy coating displayed a lower contact angle of 80.9°, while the contact angle of the epoxy coating incorporated with CaCO3, 3 wt% SLS/CaCO3, and 5 wt% SLS/CaCO3 were 100.2°, 100.5°, 106.1°, respectively, symbolizing the improved hydrophobicity of the modified coating specimens.
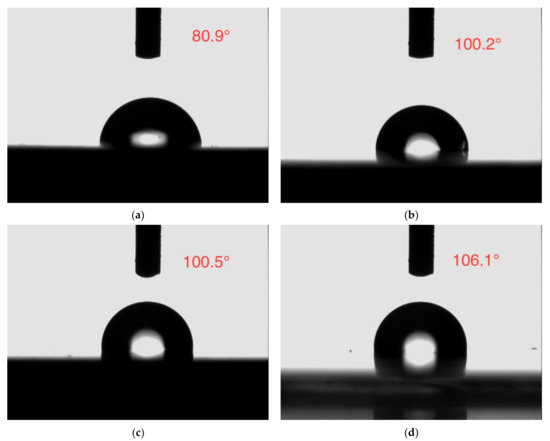
Figure 15.
Contact angle images of (a) epoxy coating, (b) epoxy-CaCO3 coating, (c) epoxy-3 wt%SLS/CaCO3 coating, and (d) epoxy-5 wt%SLS/CaCO3 coating.
The results of the coating system after adhesion measurements are showed in Table 4. The adhesion level for pure epoxy coating, epoxy-CaCO3 coating, epoxy-3 wt% SLS/CaCO3 coating, and epoxy-5 wt% SLS/CaCO3 coating were 1, 0, 0, and 0, respectively. These observations illustrate that the modification by SLS/CaCO3 micro-containers can effectively enhance the adhesion strength of the pure epoxy resin. It can be inferred that the epoxy-SLS/CaCO3 coating possesses better adhesive property because the moderate amount of SLS/CaCO3 micro-container was added in neat epoxy coating. Furthermore, CaCO3 particles as filler will generate physical or chemical bond with the metal substrate, so as to ensure that the coating can adhere to the metal surface well [53].
Table 4.
Adhesion level of different coatings.
The coating hardness of the pure epoxy coatings was similar to those coatings modified with the CaCO3 micro-containers, as shown in Table 5. All the coating displayed better hardness performance.
Table 5.
The pencil hardness of all the coatings.
4.3. Mechanism of Inhibition Protection
Importantly, 3CaO·SiO2 and 2CaO·SiO2 are the main components of Portland concrete cement. A large amount of calcium hydroxide is generated after hydration reaction, which will lead to the concrete pore solution with high alkalinity [54]. In the case of high pH value, a passive film (Fe(OH)3) precipitates on the carbon surface and hinders the invasion of corrosive medium. Under severe environment, corrosive media such as aggressive chloride ion and carbon dioxide will cause the decline in the pH value of the concrete and the destruction of protective film on the metallic substrate [55]. At this time, it is necessary to apply some practical methods on corrosion control of the reinforced concrete. Under acidic condition, an active release of SLS may contribute to the dissolution of CaCO3 micro-containers in response to the change of pH. Increasing pH of the SCP solution due to continuous release of SLS results in the formation of passive film on carbon surface. Furthermore, SLS contains hydrophobic skeleton and hydrophilic groups (hydroxyl groups and sulfonic groups). The interaction between the SLS with sulfonic groups and positively charged metal surfaces is responsible for chemisorption. Moreover, the SLS is absorbed on the carbon surface due to the formation of coordinative bonds between the metal ions and the O element in phenolic hydroxyl group of SLS. The optimum addition of 5 wt% SLS/CaCO3 not only improves the self-healing capability of the pure epoxy coating but also avoids the consumption of corrosion inhibitor when the steel bar is in the passivated state.
5. Conclusions
In this study, calcium carbonate was used as pH-sensitive micro-containers for the loading of SLS as corrosion inhibitor, which were confirmed with FTIR, XRD, and SEM. Under the presence of different pH solutions, the response of SLS-loaded CaCO3 micro-containers was investigated by UV-vis. The corrosion inhibition effect of incorporating various amount (3 wt% and 5 wt%) of SLS/CaCO3 microparticles with the epoxy coating in the SCP solutions was discussed by electrochemical measurements and a series of physical properties tests. The following observations were made:
- The CaCO3 microparticles modified with sodium lignosulfonate had the same oval-shaped morphology as the unmodified one.
- XRD results showed that the CaCO3 particles with or without SLS contain both the vaterite and calcite phases. Presence of sodium lignosulfonate in the CaCO3 particles leads to more calcite phase.
- The SLS loaded into the CaCO3 micro-containers can be released under different pH conditions, with the extent of sodium lignosulfonate release in the acidic media being higher.
- Electrochemical measurements demonstrated the beneficial role of the SLS/CaCO3 microparticles on the inhibition performances of the epoxy coating, especially the epoxy-5 wt% SLS/CaCO3 coating. These microparticles show better compatibility with the original epoxy coating.
- The epoxy-SLS/CaCO3 coating showed high hydrophobicity and good mechanical strength and exhibited better adhesion on the substrate.
Author Contributions
Introducing initial research ideas, W.L. and J.L.; performing the experiment, W.L., X.H., and J.B.; analyzing the experimental data, W.L. and J.L.; writing the paper: W.L.; revising the manuscript: all of the co-authors. All authors have read and agreed to the published version of the manuscript.
Funding
This research was funding by the special fund project of Guangdong Province (grant number B2190150).
Data Availability Statement
Data is contained within the article.
Conflicts of Interest
The authors declare no conflict of interest.
Abbreviation
| SLS | Sodium lignosulfonate |
| CaCO3 | Calcium carbonate |
| SCP solution | Simulated concrete pore solution |
| SLS/CaCO3 | Calcium carbonate microparticles loaded with SLS |
| SEM | Scanning electron microscope |
| UV-vis | UV–VIS spectrophotometer |
| XRD | X-ray diffraction |
| ATR-FTIR | attenuated total reflection-Fourier-transform infrared spectroscopy |
| OCP | Open-circuit potential |
| EIS | Electrochemical impedance spectroscopy |
| Epoxy-3 wt%SLS/CaCO3 coating | The epoxy coating modified by the 3 wt% calcium carbonate particles loaded with sodium lignosulfonate |
| Epoxy-5 wt%SLS/CaCO3 coating | The epoxy coating modified by the 5 wt% calcium carbonate particles loaded with sodium lignosulfonate |
References
- Hu, J.; Zhu, Y.; Hang, J.; Zhang, Z.; Ma, Y.; Huang, H.; Yu, Q.; Wei, J. The effect of organic core—shell corrosion inhibitors on corrosion performance of the reinforcement in simulated concrete pore solution. Constr. Build. Mater. 2021, 267, 121011. [Google Scholar] [CrossRef]
- Zhang, P.; Dai, Y.; Wang, W.; Yang, J.; Mo, L.; Guo, W.; Bao, J. Effects of magnesia expansive agents on the self-healing performance of microcracks in strain-hardening cement-based composites (SHCC). Mater. Today Commun. 2020, 25, 101421. [Google Scholar] [CrossRef]
- Zhang, P.; Wittmann, F.H.; Vogel, M.; Müller, H.S.; Zhao, T. Influence of freeze-thaw cycles on capillary absorption and chloride penetration into concrete. Cem. Concr. Res. 2017, 100, 60–67. [Google Scholar] [CrossRef]
- Yuan, X.; Wang, X.; Cao, Y.; Yang, H. Natural passivation behavior and its influence on chloride-induced corrosion resistance of stainless steel in simulated concrete pore solution. J. Mater. Res. Technol. 2020, 9, 12378–12390. [Google Scholar] [CrossRef]
- Ann, K.Y.; Ahn, J.H.; Ryou, J.S. The importance of chloride content at the concrete surface in assessing the time to corrosion of steel in concrete structures. Constr. Build. Mater. 2009, 23, 239–245. [Google Scholar] [CrossRef]
- Etteyeb, N.; Dhouibi, L.; Takenouti, H.; Alonso, M.C.; Triki, E. Corrosion inhibition of carbon steel in alkaline chloride media by Na3PO4. Electrochim. Acta 2007, 52, 7506–7512. [Google Scholar] [CrossRef]
- Fazayel, A.S.; Khorasani, M.; Sarabi, A.A. The effect of functionalized polycarboxylate structures as corrosion inhibitors in a simulated concrete pore solution. Appl. Surf. Sci. 2018, 441, 895–913. [Google Scholar] [CrossRef]
- Wu, M.; Ma, H.; Shi, J. Enhanced corrosion resistance of reinforcing steels in simulated concrete pore solution with low molybdate to chloride ratios. Cem. Concr. Compos. 2020, 110, 103589. [Google Scholar] [CrossRef]
- Montemor, M.F. Functional and smart coatings for corrosion protection: A review of recent advances. Surf. Coat. Technol. 2014, 258, 17–37. [Google Scholar] [CrossRef]
- Weishaar, A.; Carpenter, M.; Loucks, R.; Sakulich, A.; Peterson, A.M. Evaluation of self-healing epoxy coatings for steel reinforcement. Constr. Build. Mater. 2018, 191, 125–135. [Google Scholar] [CrossRef]
- Asipita, S.A.; Ismail, M.; Majid, M.Z.A.; Majid, Z.A.; Abdullah, C.; Mirza, J. Green Bambusa Arundinacea leaves extract as a sustainable corrosion inhibitor in steel reinforced concrete. J. Clean. Prod. 2014, 67, 139–146. [Google Scholar] [CrossRef]
- Criado, M.; Sobrados, I.; Sanz, J.; Bastidas, J.M. Steel protection using sol–gel coatings in simulated concrete pore solution contaminated with chloride. Surf. Coat. Technol. 2014, 258, 485–494. [Google Scholar] [CrossRef]
- Criado, M.; Sobrados, I.; Bastidas, J.M.; Sanz, J. Steel corrosion in simulated carbonated concrete pore solution its protection using sol—gel coatings. Prog. Org. Coat. 2015, 88, 228–236. [Google Scholar] [CrossRef]
- Xiong, C.; Li, W.; Jin, Z.; Gao, X.; Wang, W.; Tian, H.; Han, P.; Song, L.; Jiang, L. Preparation of phytic acid conversion coating and corrosion protection performances for steel in chlorinated simulated concrete pore solution. Corros. Sci. 2018, 139, 275–288. [Google Scholar] [CrossRef]
- Cotting, F.; Aoki, I.V. Smart protection provided by epoxy clear coating doped with polystyrene microcapsules containing silanol and Ce (III) ions as corrosion inhibitors. Surf. Coat. Technol. 2016, 303, 310–318. [Google Scholar] [CrossRef]
- Liu, H.; Xu, D.; Yang, K.; Liu, H.; Cheng, Y.F. Corrosion of antibacterial Cu-bearing 316L stainless steels in the presence of sulfate reducing bacteria. Corros. Sci. 2018, 132, 46–55. [Google Scholar] [CrossRef]
- Liu, Y.-H.; Xu, J.-B.; Zhang, J.-T.; Hu, J.-M. Electrodeposited silica film interlayer for active corrosion protection. Corros. Sci. 2017, 120, 61–74. [Google Scholar] [CrossRef]
- Dastgheib, A.; Zarebidaki, A.; Attar, M.M. Enhanced barrier properties of epoxy coating containing CaCO3 microparticles modified with cerium nitrate. Prog. Org. Coat. 2020, 144, 105660. [Google Scholar] [CrossRef]
- Snihirova, D.; Lamaka, S.V.; Montemor, M.F. “SMART” protective ability of water based epoxy coatings loaded with CaCO3 microbeads impregnated with corrosion inhibitors applied on AA2024 substrates. Electrochim. Acta 2012, 83, 439–447. [Google Scholar] [CrossRef]
- Koga, N.; Kasahara, D.; Kimura, T. Aragonite Crystal Growth and Solid-State Aragonite–Calcite Transformation: A Physico–Geometrical Relationship via Thermal Dehydration of Included Water. Cryst. Growth Des. 2013, 13, 2238–2246. [Google Scholar] [CrossRef]
- Gal, A.; Habraken, W.; Gur, D.; Fratzl, P.; Weiner, S.; Addadi, L. Calcite crystal growth by a solid-state transformation of stabilized amorphous calcium carbonate nanospheres in a hydrogel. Angew. Chem. Int. Ed. Engl. 2013, 52, 4867–4870. [Google Scholar] [CrossRef]
- Samatya, S.; Orhan, E.; Kabay, N.; Tuncel, A. Comparative boron removal performance of monodisperse-porous particles with molecular brushes via “click chemistry” and direct coupling. Colloids Surf. A Physicochem. Eng. Asp. 2010, 372, 102–106. [Google Scholar] [CrossRef]
- Mustata, F.; Tudorachi, N.; Rosu, D. Thermal behavior of some organic/inorganic composites based on epoxy resin and calcium carbonate obtained from conch shell of Rapana thomasiana. Compos. Part B Eng. 2012, 43, 702–710. [Google Scholar] [CrossRef]
- Li, Y.; Liu, X.; Yuan, J.; Wu, M. Toughness improvement of epoxy resin mortar by incorporation of ground calcium carbonate. Constr. Build. Mater. 2015, 100, 122–128. [Google Scholar] [CrossRef]
- Poh, C.L.; Mariatti, M.; Ahmad Fauzi, M.N.; Ng, C.H.; Chee, C.K.; Chuah, T.P. Tensile, dielectric, and thermal properties of epoxy composites filled with silica, mica, and calcium carbonate. J. Mater. Sci. Mater. Electron. 2014, 25, 2111–2119. [Google Scholar] [CrossRef]
- Dieleman, C.D.; Denissen, P.J.; Garcia, S.J. Long-Term Active Corrosion Protection of Damaged Coated-AA2024-T3 by Embedded Electrospun Inhibiting Nanonetworks. Adv. Mater. Interfaces 2018, 5, 1800176. [Google Scholar] [CrossRef]
- Fan, W.; Li, W.; Zhang, Y.; Wang, W.; Zhang, X.; Song, L.; Liu, X. Cooperative self-healing performance of shape memory polyurethane and Alodine-containing microcapsules. RSC Adv. 2017, 7, 46778–46787. [Google Scholar] [CrossRef]
- Gorna, K.; Hund, M.; Vučak, M.; Gröhn, F.; Wegner, G. Amorphous calcium carbonate in form of spherical nanosized particles and its application as fillers for polymers. Mater. Sci. Eng. A 2008, 477, 217–225. [Google Scholar] [CrossRef]
- Raj, R.; Morozov, Y.; Calado, L.M.; Taryba, M.G.; Kahraman, R.; Shakoor, R.A.; Montemor, M.F. Calcium carbonate particles loaded with triethanolamine and polyethylenimine for enhanced corrosion protection of epoxy coated steel. Corros. Sci. 2020, 167, 108548. [Google Scholar] [CrossRef]
- Chong, A.S.; Manan, M.A.; Idris, A.K. Sodium lignosulfonate as sacrificial agent and effectiveness in reducing CTAB cationic adsorption onto kaolinite. J. King Saud Univ.-Eng. Sci. 2020. [Google Scholar] [CrossRef]
- Ouyang, X.; Qiu, X.; Lou, H.; Yang, D. Corrosion and Scale Inhibition Properties of Sodium Lignosulfonate and Its Potential Application in Recirculating Cooling Water System. Ind. Eng. Chem. Res. 2006, 45, 5716–5721. [Google Scholar] [CrossRef]
- Ahangar, M.; Izadi, M.; Shahrabi, T.; Mohammadi, I. The synergistic effect of zinc acetate on the protective behavior of sodium lignosulfonate for corrosion prevention of mild steel in 3.5 wt% NaCl electrolyte: Surface and electrochemical studies. J. Mol. Liq. 2020, 314, 113617. [Google Scholar] [CrossRef]
- Verbruggen, H.; Baert, K.; Terryn, H.; De Graeve, I. Molybdate-phosphate conversion coatings to protect steel in a simulated concrete pore solution. Surf. Coat. Technol. 2019, 361, 280–291. [Google Scholar] [CrossRef]
- Li, C.; Li, Y.; Wang, X.; Yuan, S.; Lin, D.; Zhu, Y.; Wang, H. Synthesis of hydrophobic fluoro-substituted polyaniline filler for the long-term anti-corrosion performance enhancement of epoxy coatings. Corros. Sci. 2021, 178, 109094. [Google Scholar] [CrossRef]
- Wang, Y.; Fan, Y.; Zhang, P.; Tian, L.; Xu, J.; Niu, S.; Ren, L.; Zhao, J.; Ming, W. Dynamically oleophobic epoxy coating with surface enriched in silicone. Prog. Org. Coat. 2021, 154, 106170. [Google Scholar] [CrossRef]
- Marotta, A.; Faggio, N.; Ambrogi, V.; Mija, A.; Gentile, G.; Cerruti, P. Biobased furan-based epoxy/TiO2 nanocomposites for the preparation of coatings with improved chemical resistance. Chem. Eng. J. 2021, 406, 127107. [Google Scholar] [CrossRef]
- Luo, J.; Kong, F.; Ma, X. Role of Aspartic Acid in the Synthesis of Spherical Vaterite by the Ca(OH)2–CO2Reaction. Cryst. Growth Des. 2015, 16, 728–736. [Google Scholar] [CrossRef]
- Sheng Han, Y.; Hadiko, G.; Fuji, M.; Takahashi, M. Crystallization and transformation of vaterite at controlled pH. J. Cryst. Growth 2006, 289, 269–274. [Google Scholar] [CrossRef]
- Sun, S.; Zhao, X.; Cheng, M.; Wang, Y.; Li, C.; Hu, S. Facile preparation of redox-responsive hollow mesoporous silica spheres for the encapsulation and controlled release of corrosion inhibitors. Prog. Org. Coat. 2019, 136, 105302. [Google Scholar] [CrossRef]
- Yan, M.; Yang, D.; Deng, Y.; Chen, P.; Zhou, H.; Qiu, X. Influence of pH on the behavior of lignosulfonate macromolecules in aqueous solution. Colloids Surf. A Physicochem. Eng. Asp. 2010, 371, 50–58. [Google Scholar] [CrossRef]
- Wei, M.; Shi, S.; Wang, J.; Li, Y.; Duan, X. Studies on the intercalation of naproxen into layered double hydroxide and its thermal decomposition by in situ FT-IR and in situ HT-XRD. J. Solid State Chem. 2004, 177, 2534–2541. [Google Scholar] [CrossRef]
- Hassan, H.H. Inhibition of mild steel corrosion in hydrochloric acid solution by triazole derivatives. Electrochim. Acta 2007, 53, 1722–1730. [Google Scholar] [CrossRef]
- Shen, Q.; Zhang, T.; Zhu, M.-F. A comparison of the surface properties of lignin and sulfonated lignins by FTIR spectroscopy and wicking technique. Colloids Surf. A Physicochem. Eng. Asp. 2008, 320, 57–60. [Google Scholar] [CrossRef]
- Etaiw, S.E.; Abd El-Aziz, D.M.; Abd El-Zaher, E.H.; Ali, E.A. Synthesis, spectral, antimicrobial and antitumor assessment of Schiff base derived from 2-aminobenzothiazole and its transition metal complexes. Spectrochim. Acta A Mol. Biomol. Spectrosc. 2011, 79, 1331–1337. [Google Scholar] [CrossRef]
- Abu-Dalo, M.A.; Al-Rawashdeh, N.A.F.; Ababneh, A. Evaluating the performance of sulfonated Kraft lignin agent as corrosion inhibitor for iron-based materials in water distribution systems. Desalination 2013, 313, 105–114. [Google Scholar] [CrossRef]
- Xu, D.; Lou, C.; Huang, J.; Lu, X.; Xin, Z.; Zhou, C. Effect of inhibitor-loaded halloysite nanotubes on active corrosion protection of polybenzoxazine coatings on mild steel. Prog. Org. Coat. 2019, 134, 126–133. [Google Scholar] [CrossRef]
- Mandal, S.; Singh, J.K.; Lee, D.E.; Park, T. Effect of Phosphate-Based Inhibitor on Corrosion Kinetics and Mechanism for Formation of Passive Film onto the Steel Rebar in Chloride-Containing Pore Solution. Materials 2020, 13, 3642. [Google Scholar] [CrossRef]
- Hamadou, L.; Kadri, A.; Benbrahim, N. Characterisation of passive films formed on low carbon steel in borate buffer solution (pH 9.2) by electrochemical impedance spectroscopy. Appl. Surf. Sci. 2005, 252, 1510–1519. [Google Scholar] [CrossRef]
- Hao, Y.; Sani, L.A.; Ge, T.; Fang, Q. Phytic acid doped polyaniline containing epoxy coatings for corrosion protection of Q235 carbon steel. Appl. Surf. Sci. 2017, 419, 826–837. [Google Scholar] [CrossRef]
- Mostafaei, A.; Nasirpouri, F. Epoxy/polyaniline–ZnO nanorods hybrid nanocomposite coatings: Synthesis, characterization and corrosion protection performance of conducting paints. Prog. Org. Coat. 2014, 77, 146–159. [Google Scholar] [CrossRef]
- Henriques, R.R.; Soares, B.G. Sepiolite modified with phosphonium ionic liquids as anticorrosive pigment for epoxy coatings. Appl. Clay Sci. 2021, 200, 105890. [Google Scholar] [CrossRef]
- Caldona, E.B.; Wipf, D.O.; Smith, D.W. Characterization of a tetrafunctional epoxy-amine coating for corrosion protection of mild steel. Prog. Org. Coat. 2021, 151, 106045. [Google Scholar] [CrossRef]
- Pourhashem, S.; Vaezi, M.R.; Rashidi, A. Investigating the effect of SiO2-graphene oxide hybrid as inorganic nanofiller on corrosion protection properties of epoxy coatings. Surf. Coat. Technol. 2017, 311, 282–294. [Google Scholar] [CrossRef]
- Li, Y.; Liu, J.; Dong, Z.; Xing, S.; Lv, Y.; Li, D. A Novel Testing Method for Examining Corrosion Behavior of Reinforcing Steel in Simulated Concrete Pore Solutions. Materials 2020, 13, 5327. [Google Scholar] [CrossRef]
- Jiang, J.Y.; Liu, Y.; Chu, H.Y.; Wang, D.; Ma, H.; Sun, W. Pitting Corrosion Behaviour of New Corrosion-Resistant Reinforcement Bars in Chloride-Containing Concrete Pore Solution. Materials 2017, 10, 903. [Google Scholar] [CrossRef]


Publisher’s Note: MDPI stays neutral with regard to jurisdictional claims in published maps and institutional affiliations. |
© 2021 by the authors. Licensee MDPI, Basel, Switzerland. This article is an open access article distributed under the terms and conditions of the Creative Commons Attribution (CC BY) license (https://creativecommons.org/licenses/by/4.0/).