Laser Discoloration in Acrylic Painting of Visual Art: Experiment and Modeling

 , and
, and
Abstract
:1. Introduction
2. Materials and Methods
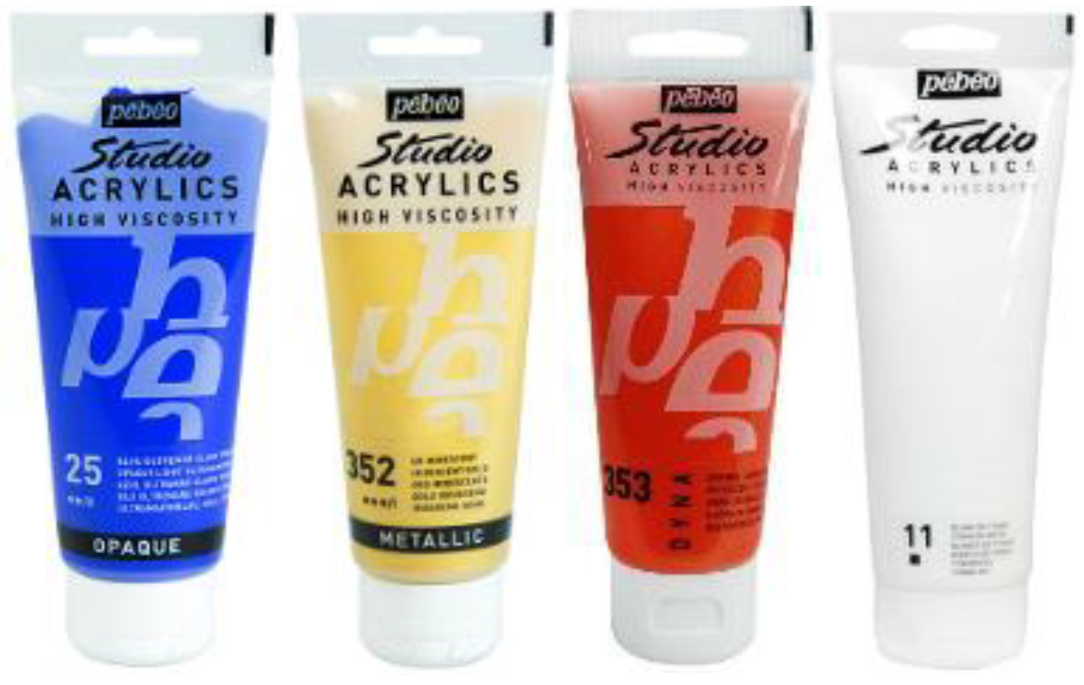
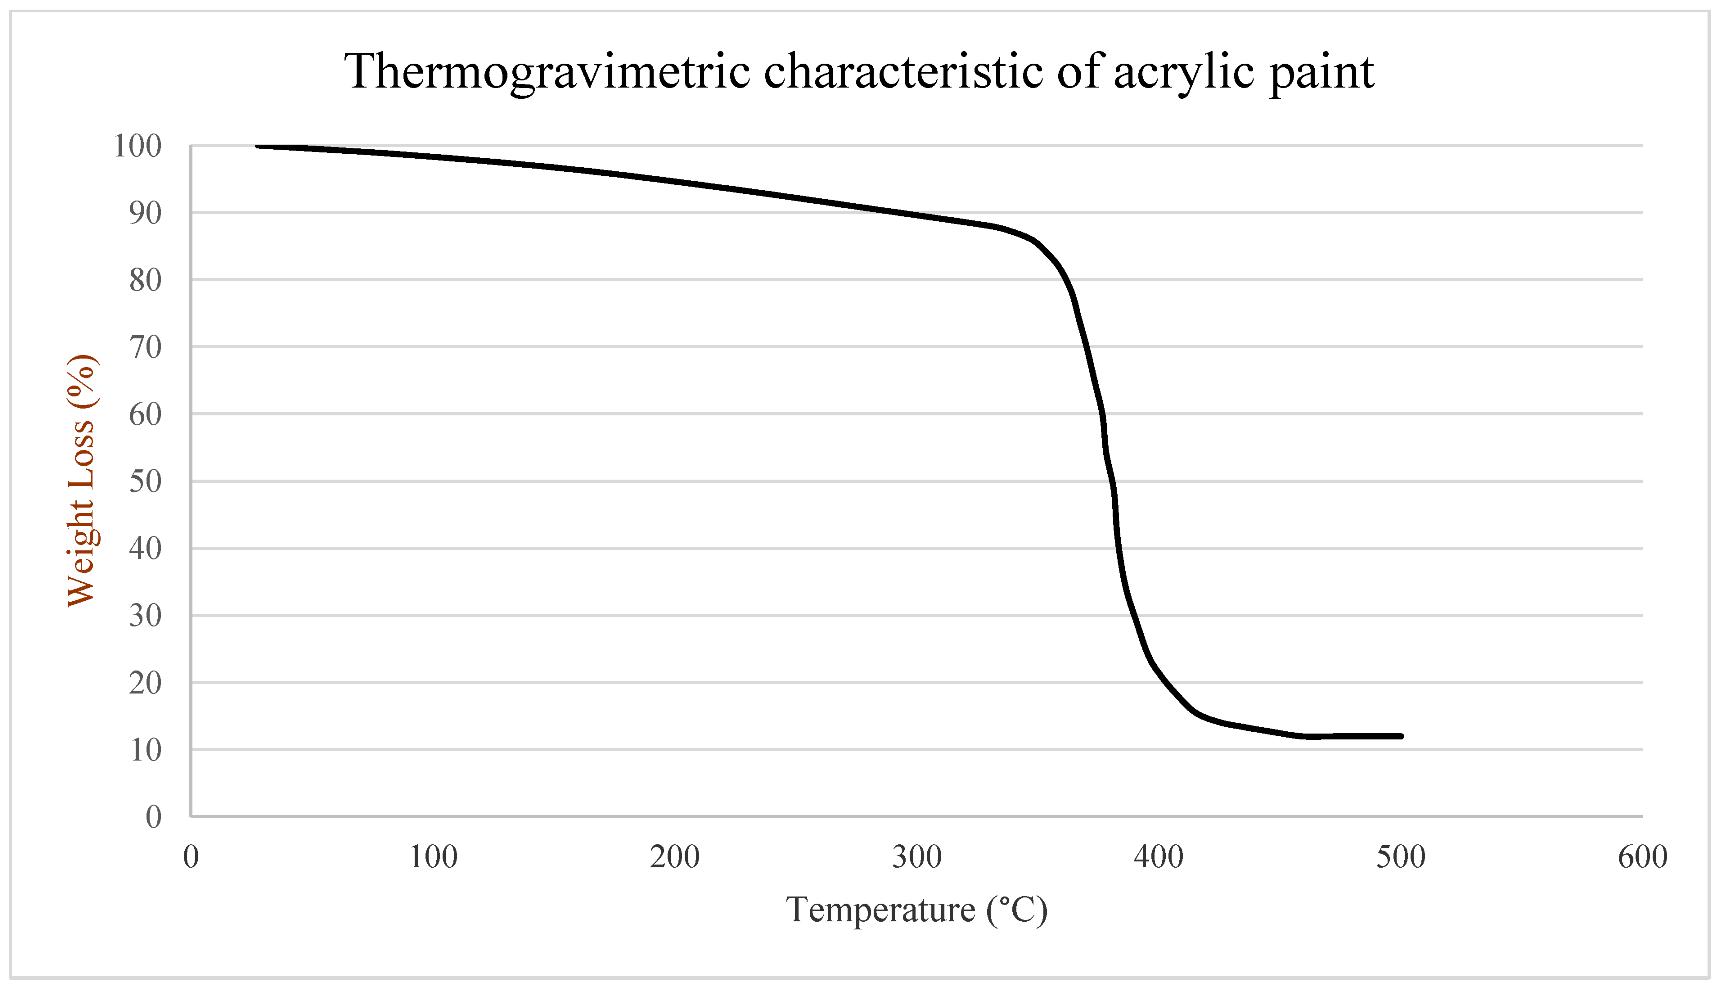
2.1. Materials
2.2. Methods
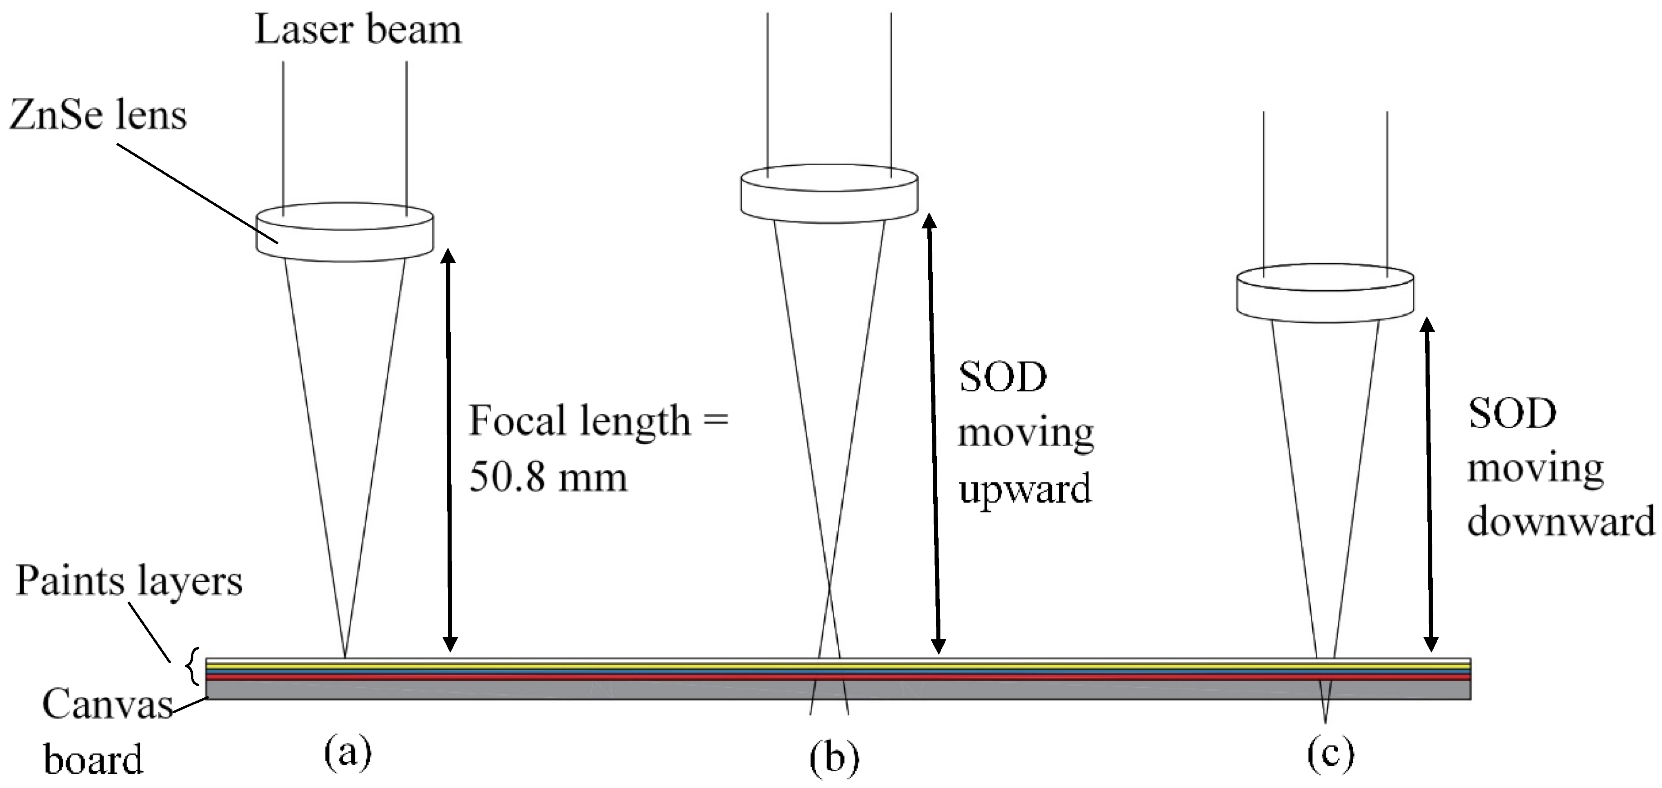
2.2.1. Laser Equipment
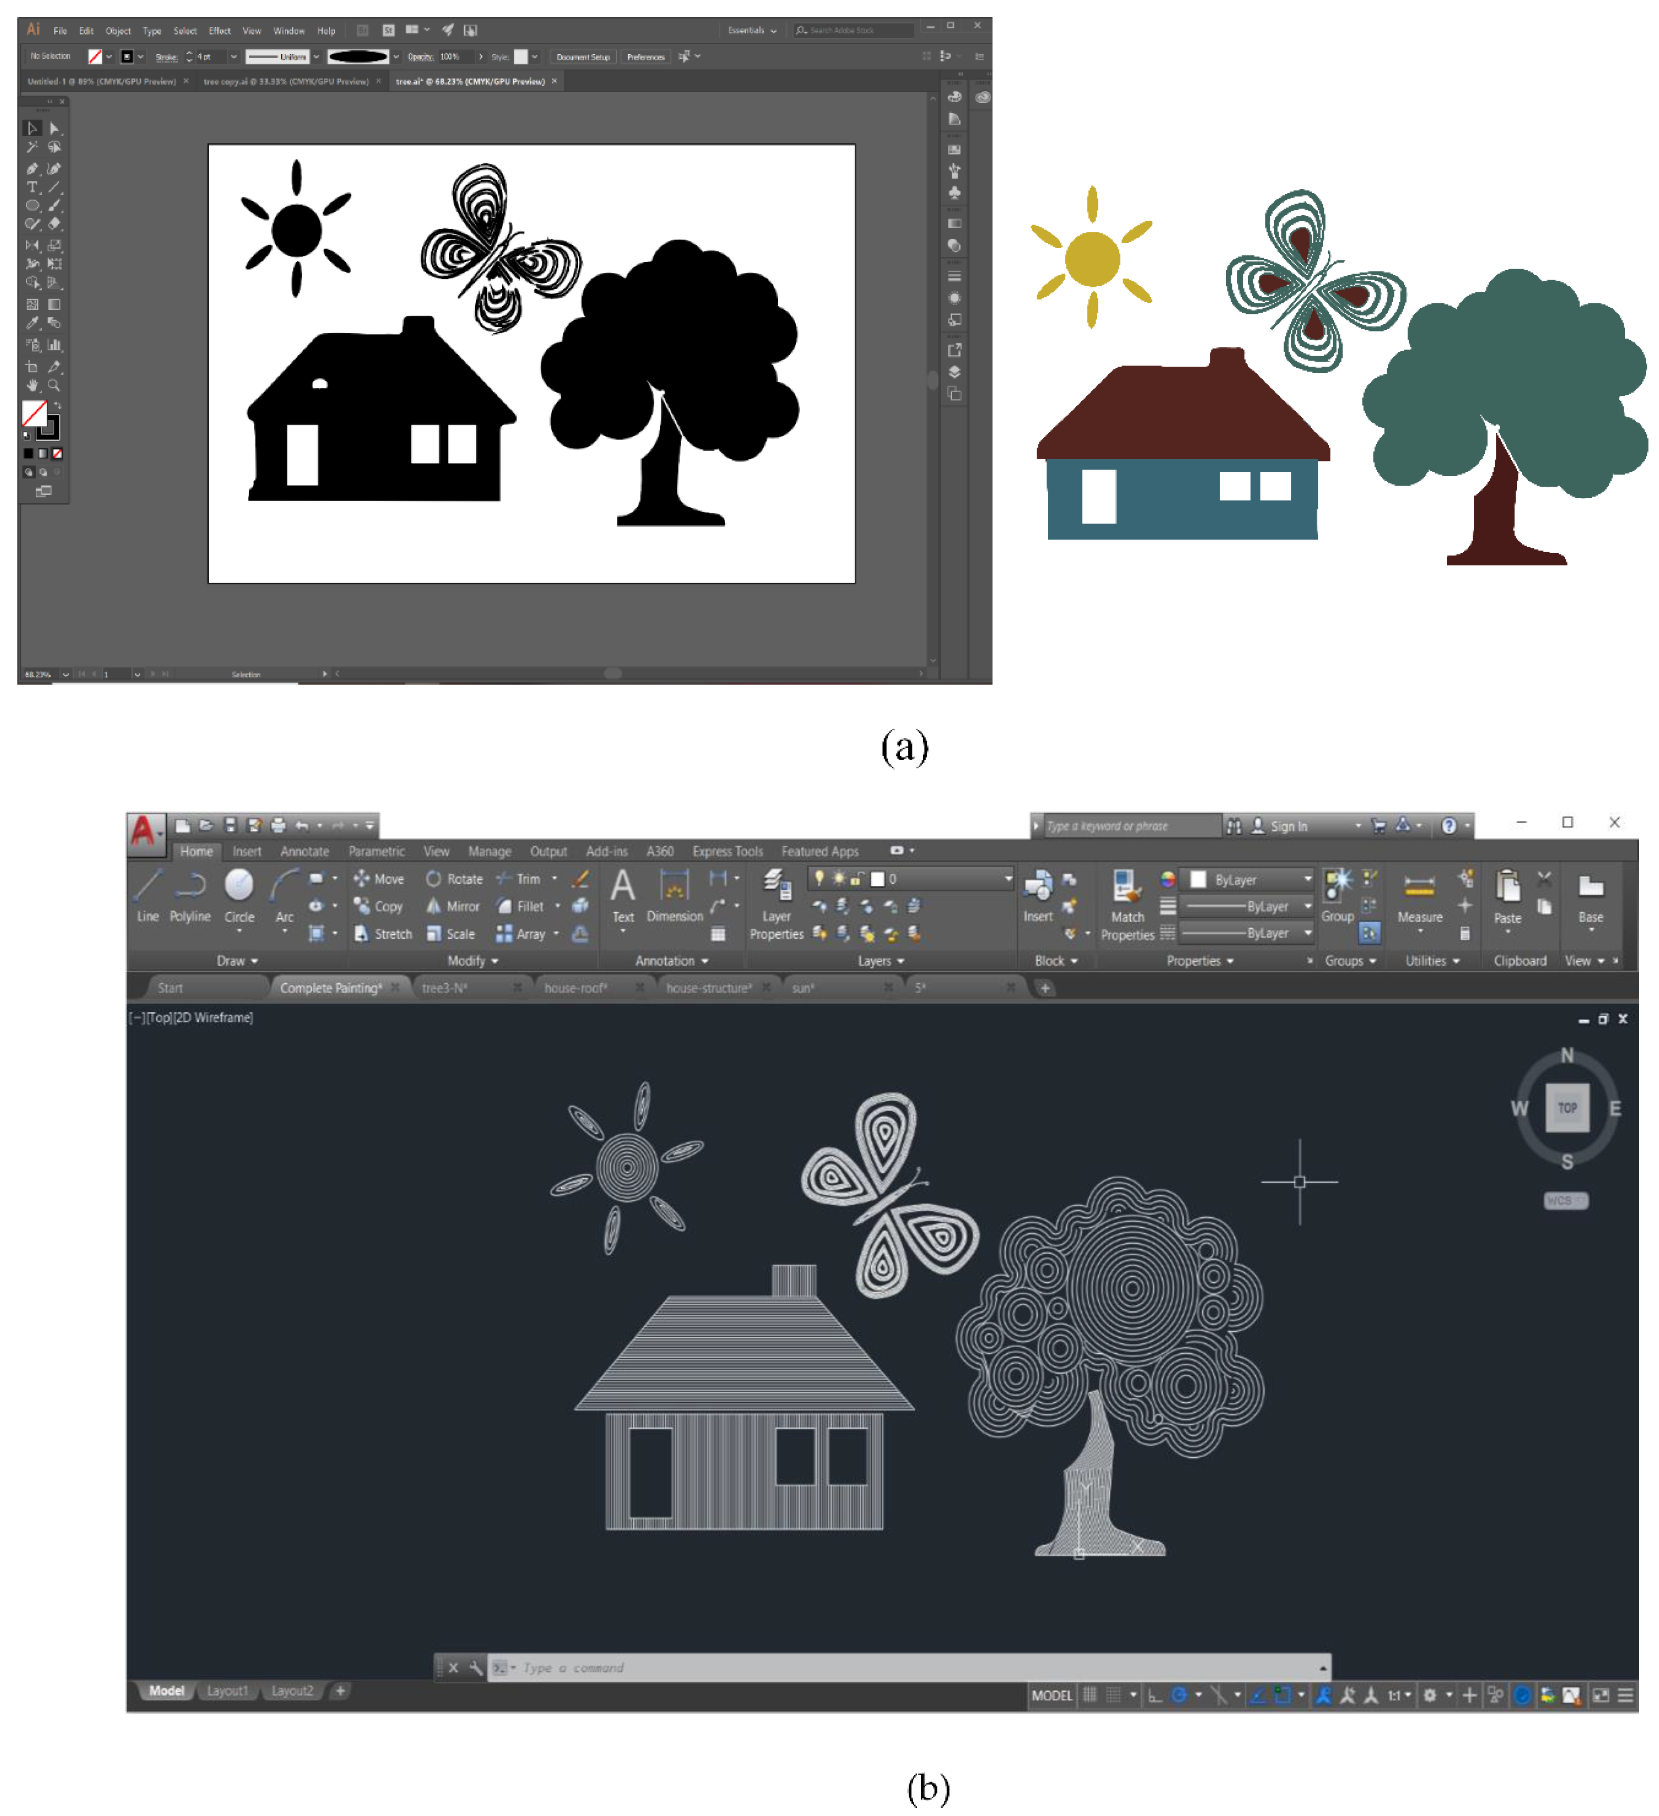
2.2.2. CAD Technology
3. Experimental Procedures
Preliminary Experiments
4. Result and Discussion
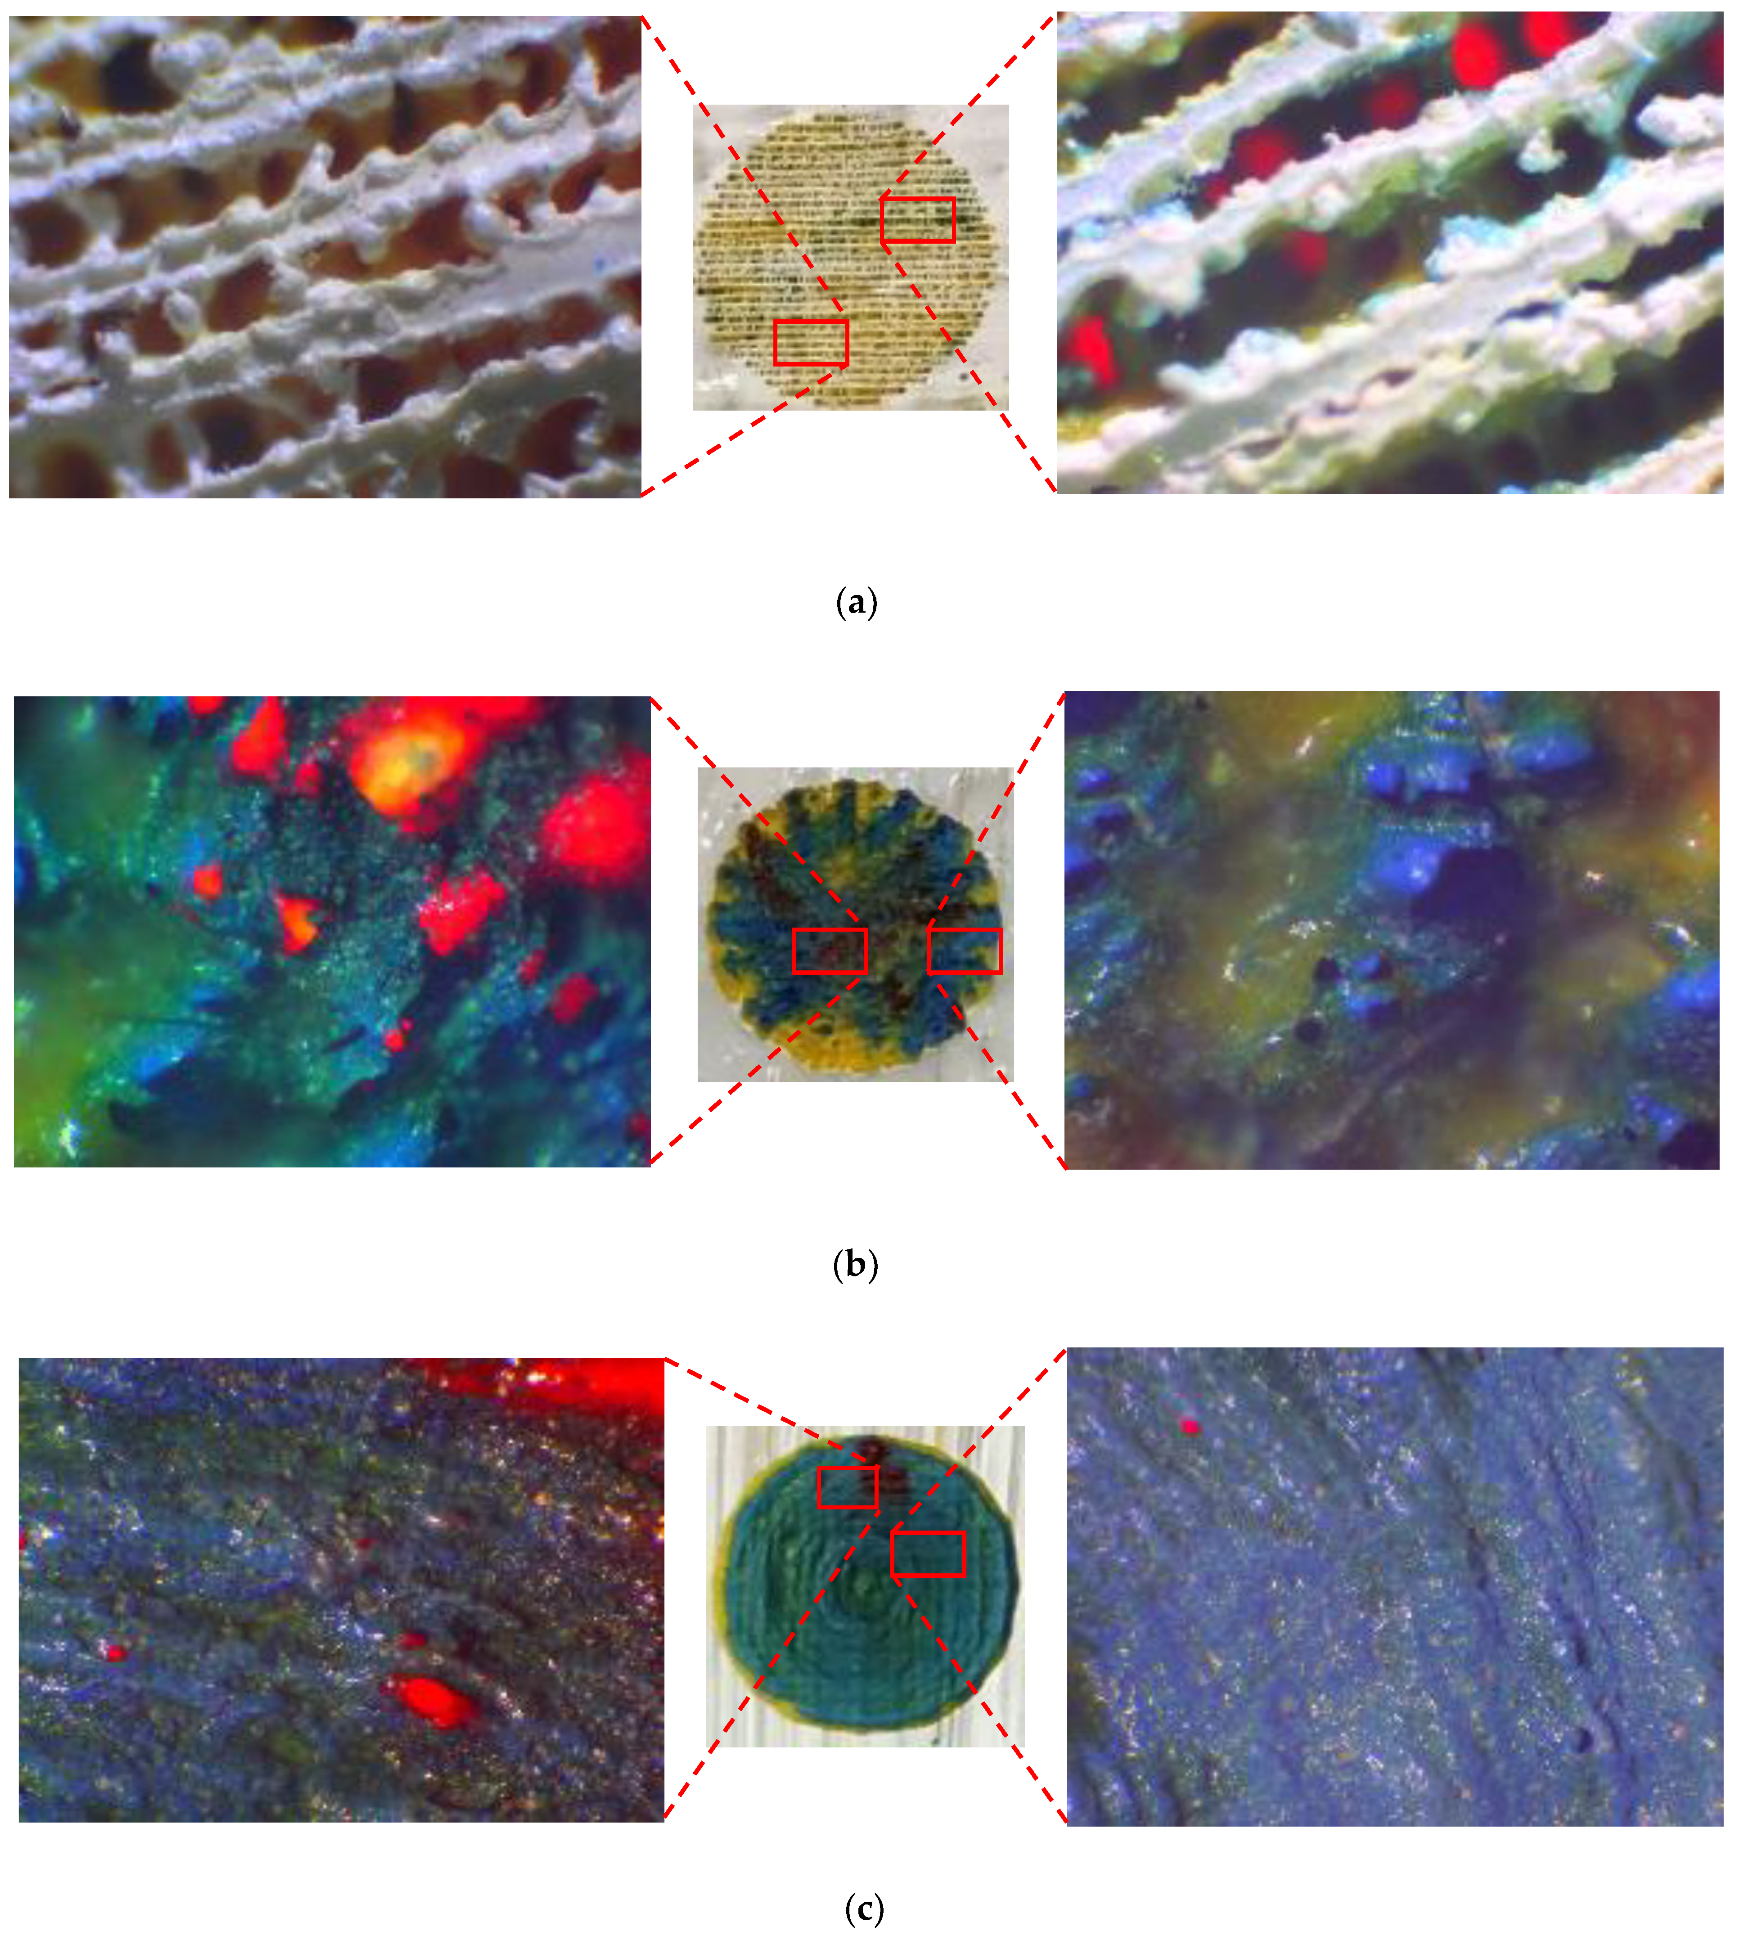
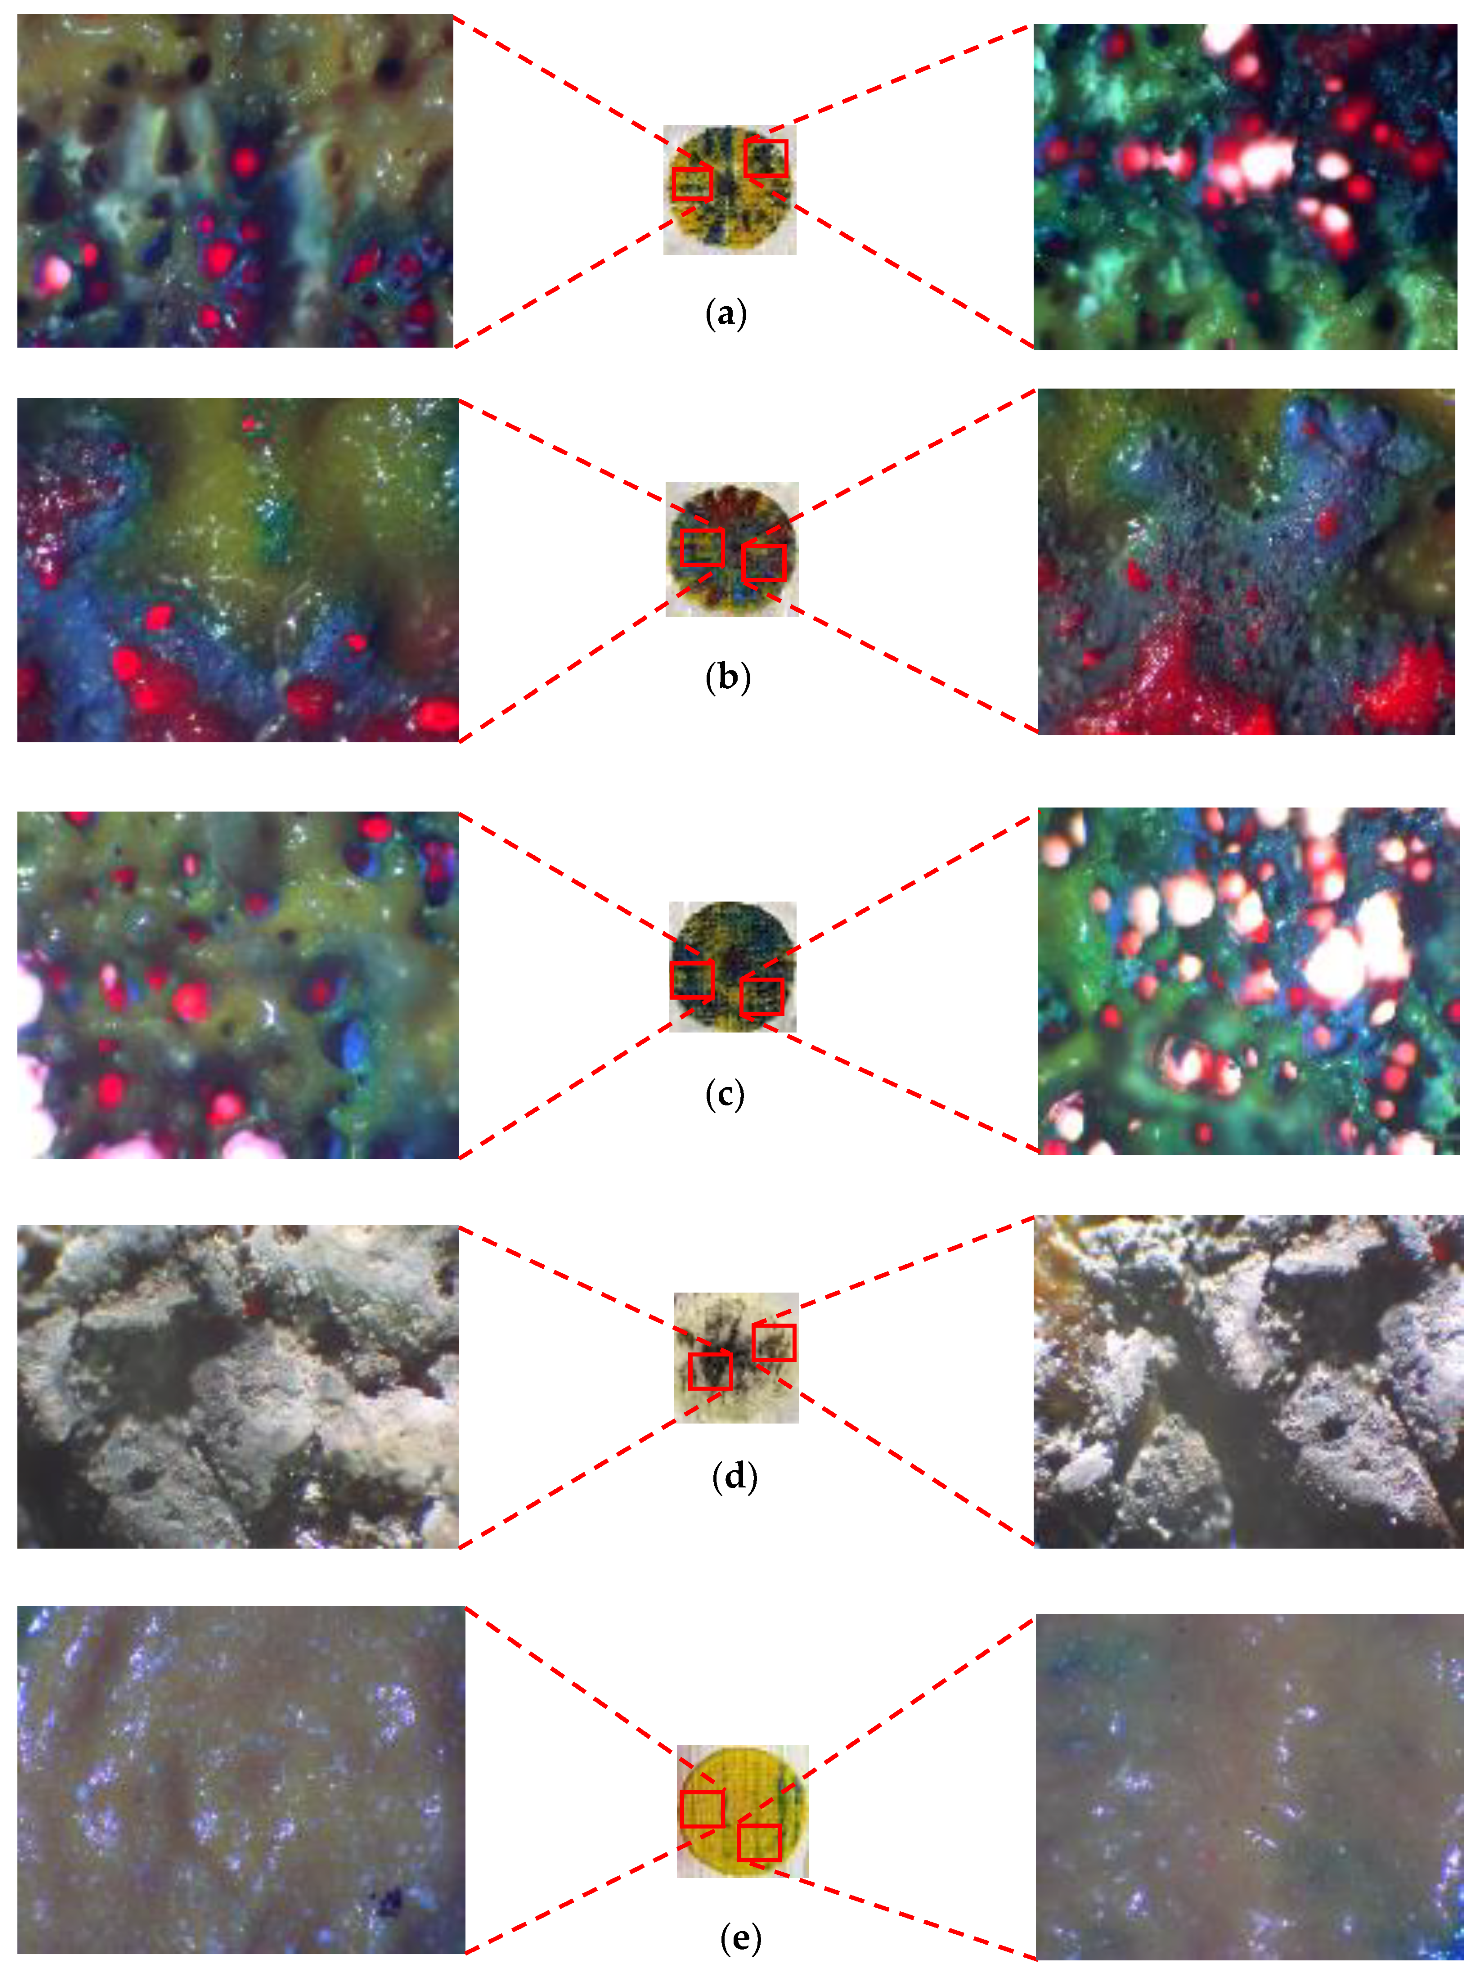
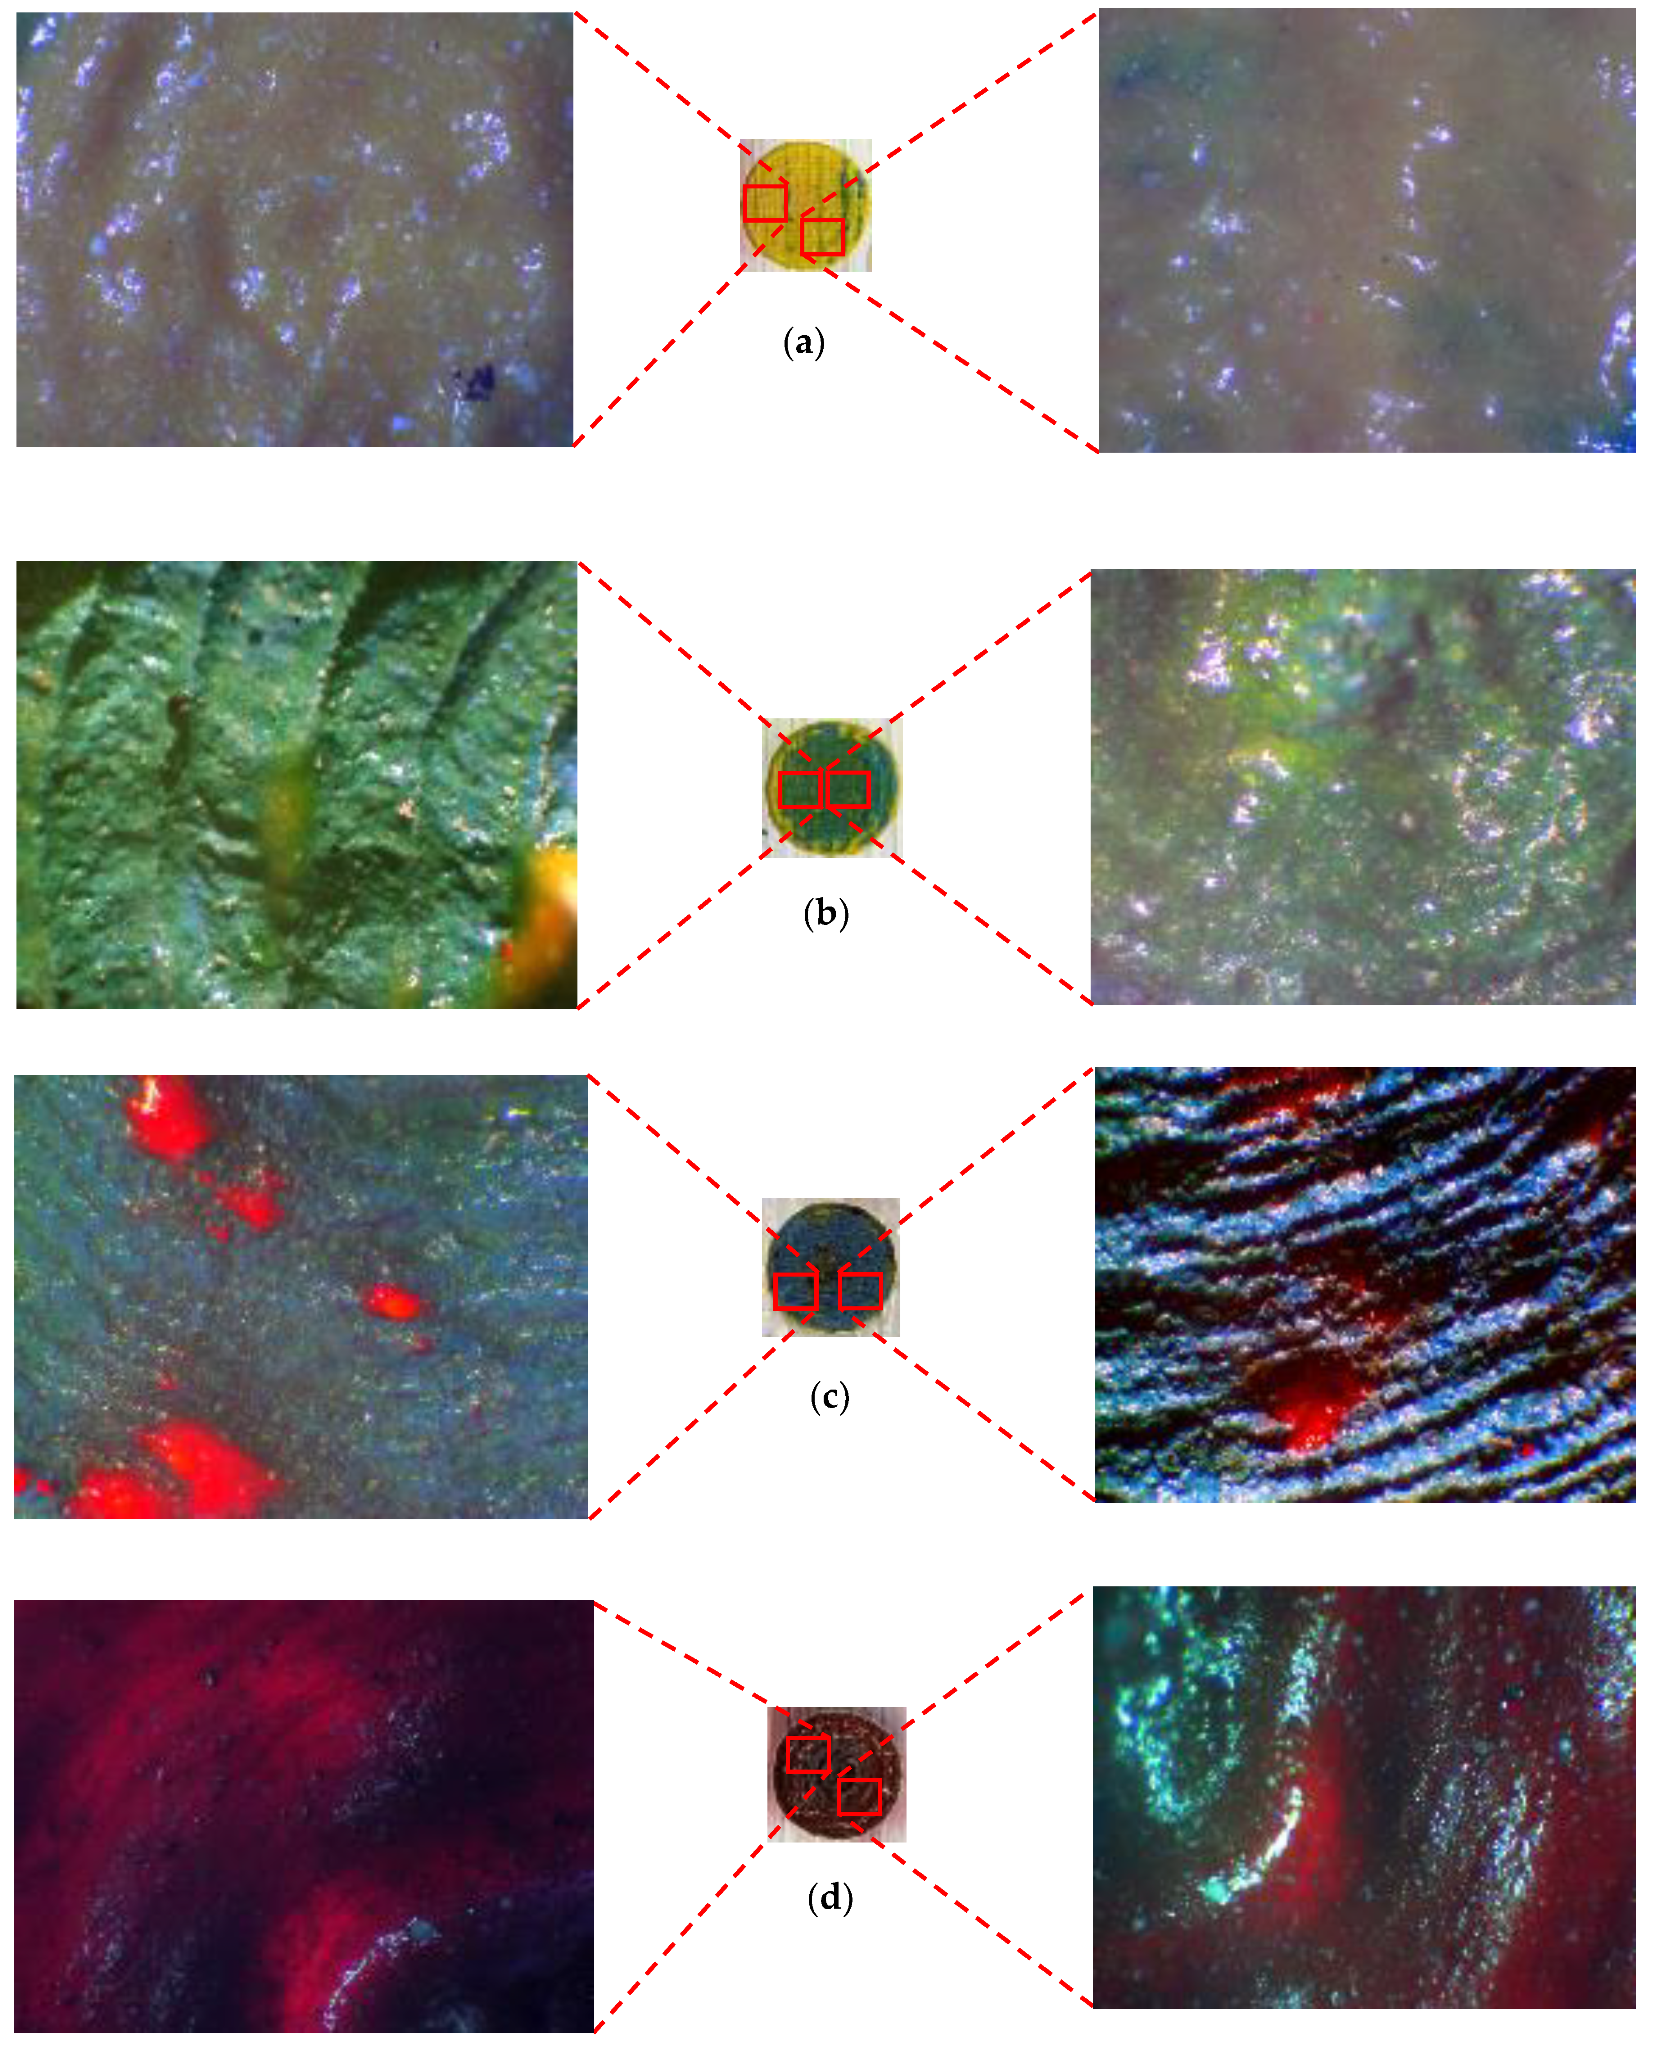
- High power, high speed at focal length (50.8 mm).
- Medium power, medium speed at lower standoff distance (47–49.8 mm).
- Low power, low speed at upper standoff distance (52 mm).
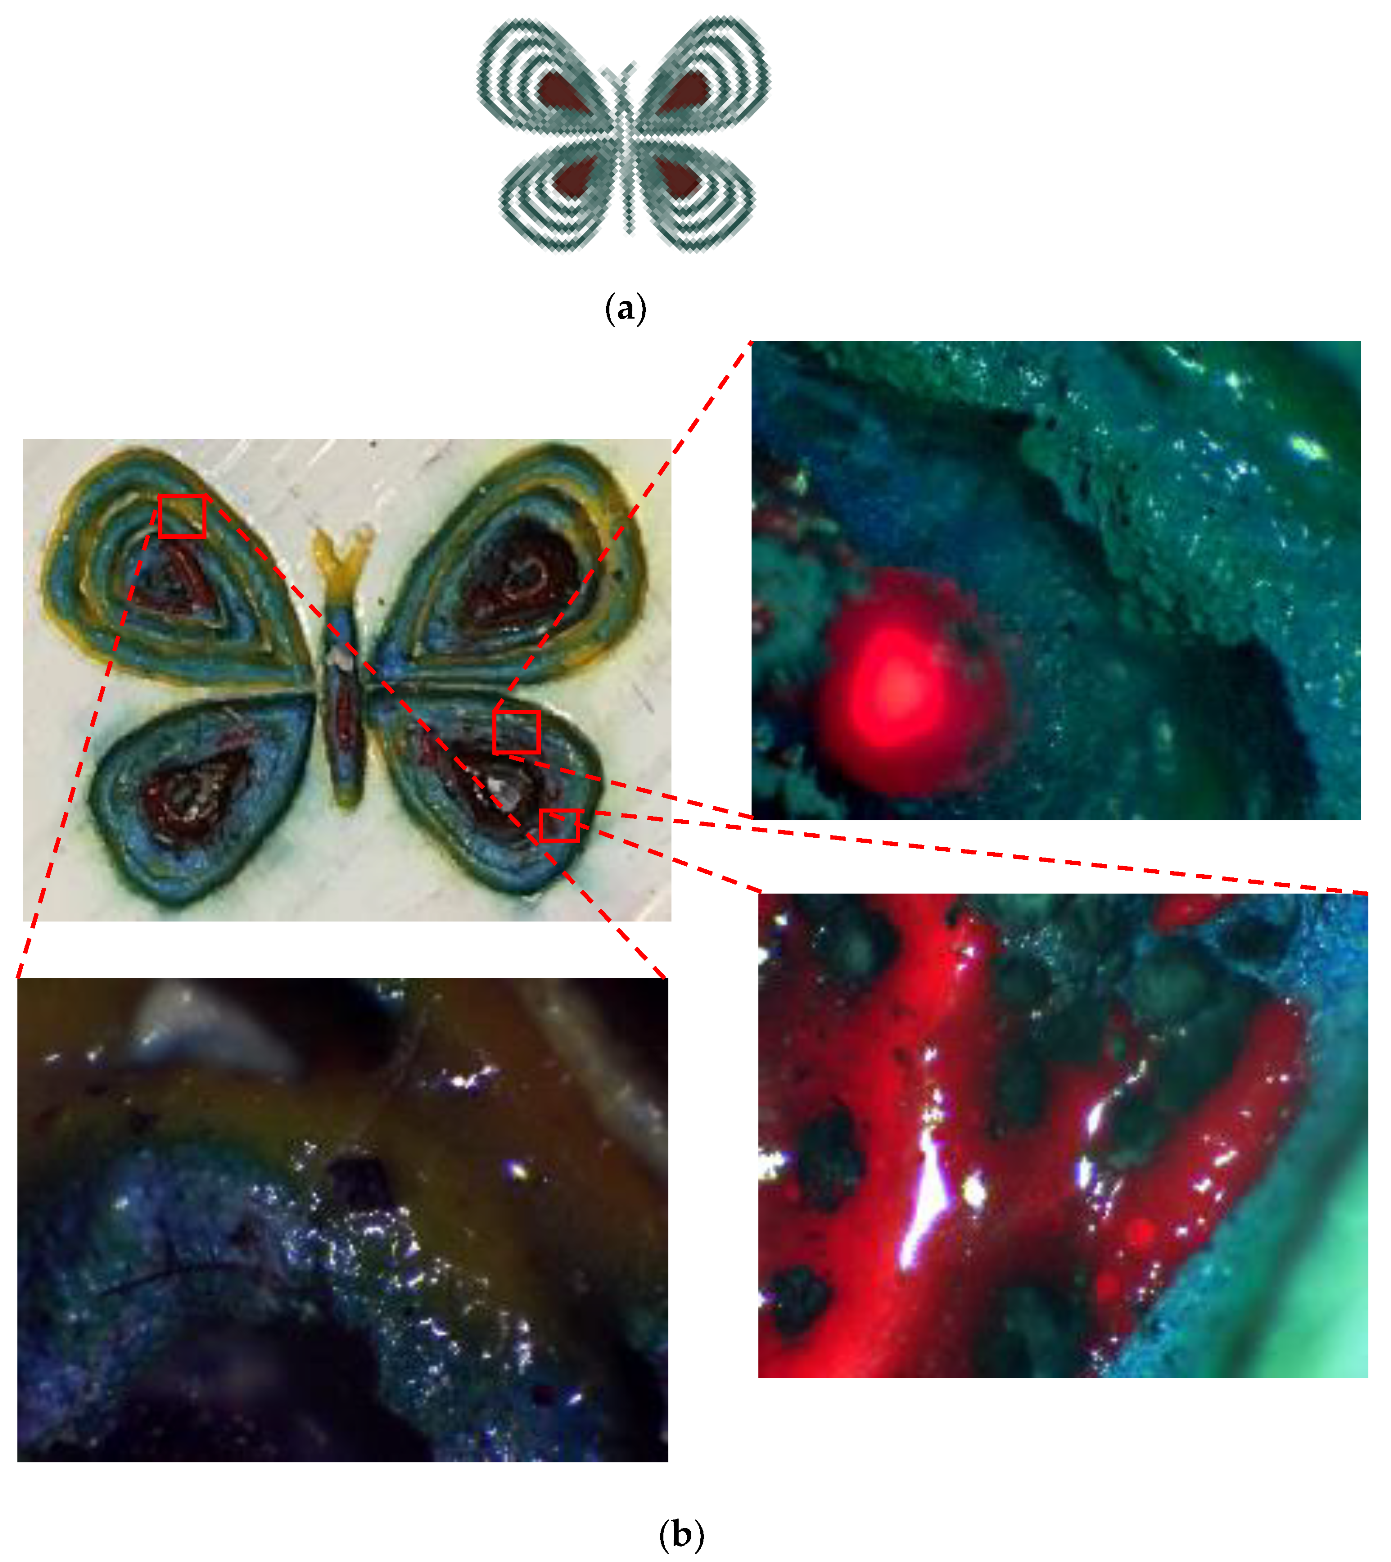
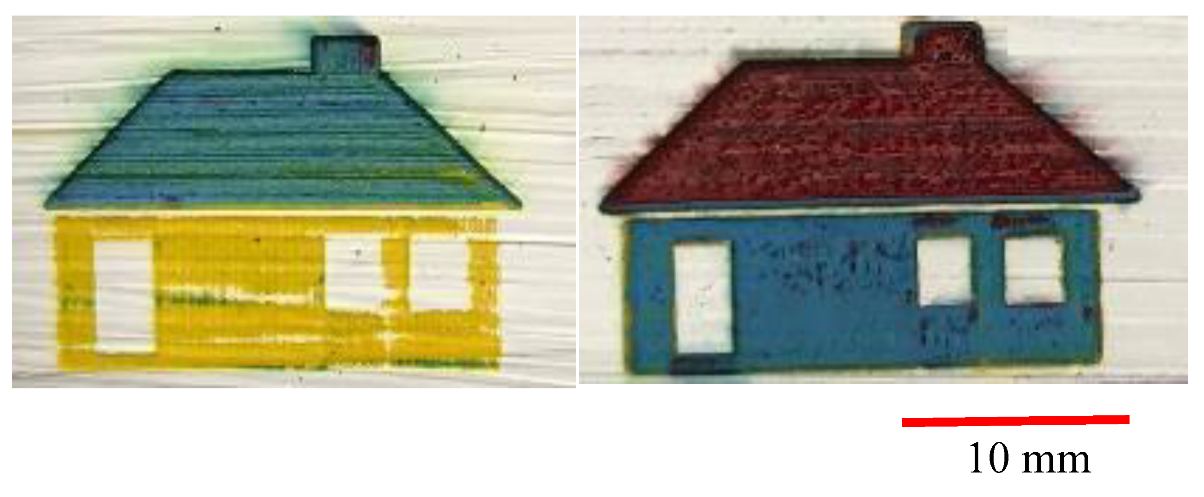
Final CAD Design Micrographs
5. Numerical Modelling
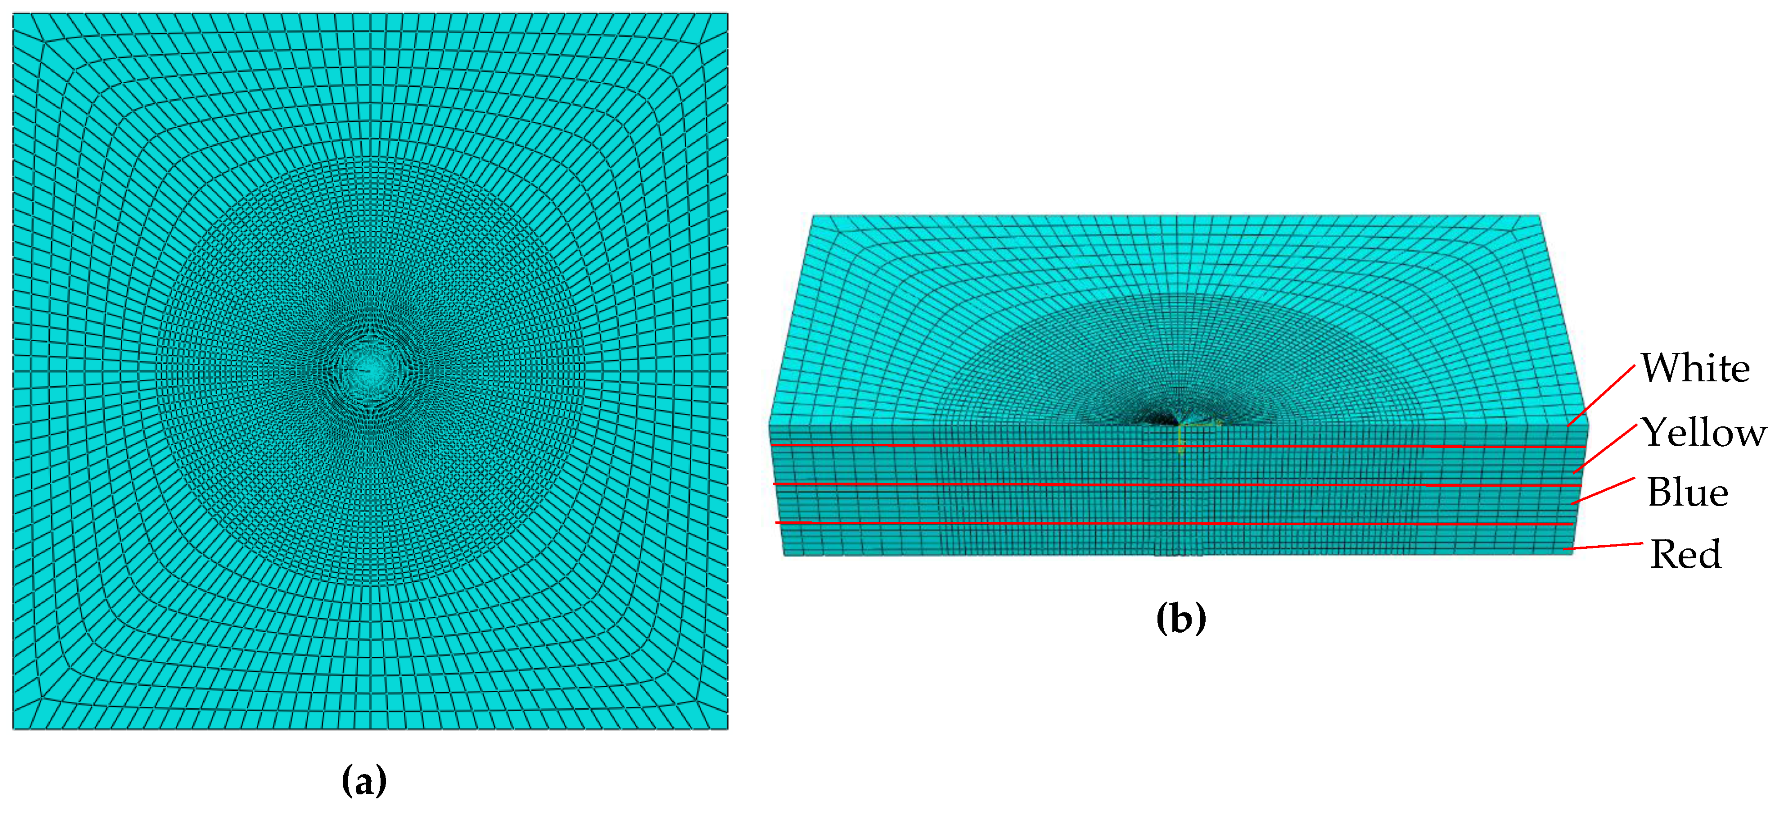
5.1. Geometric Model
5.2. Thermal Analysis
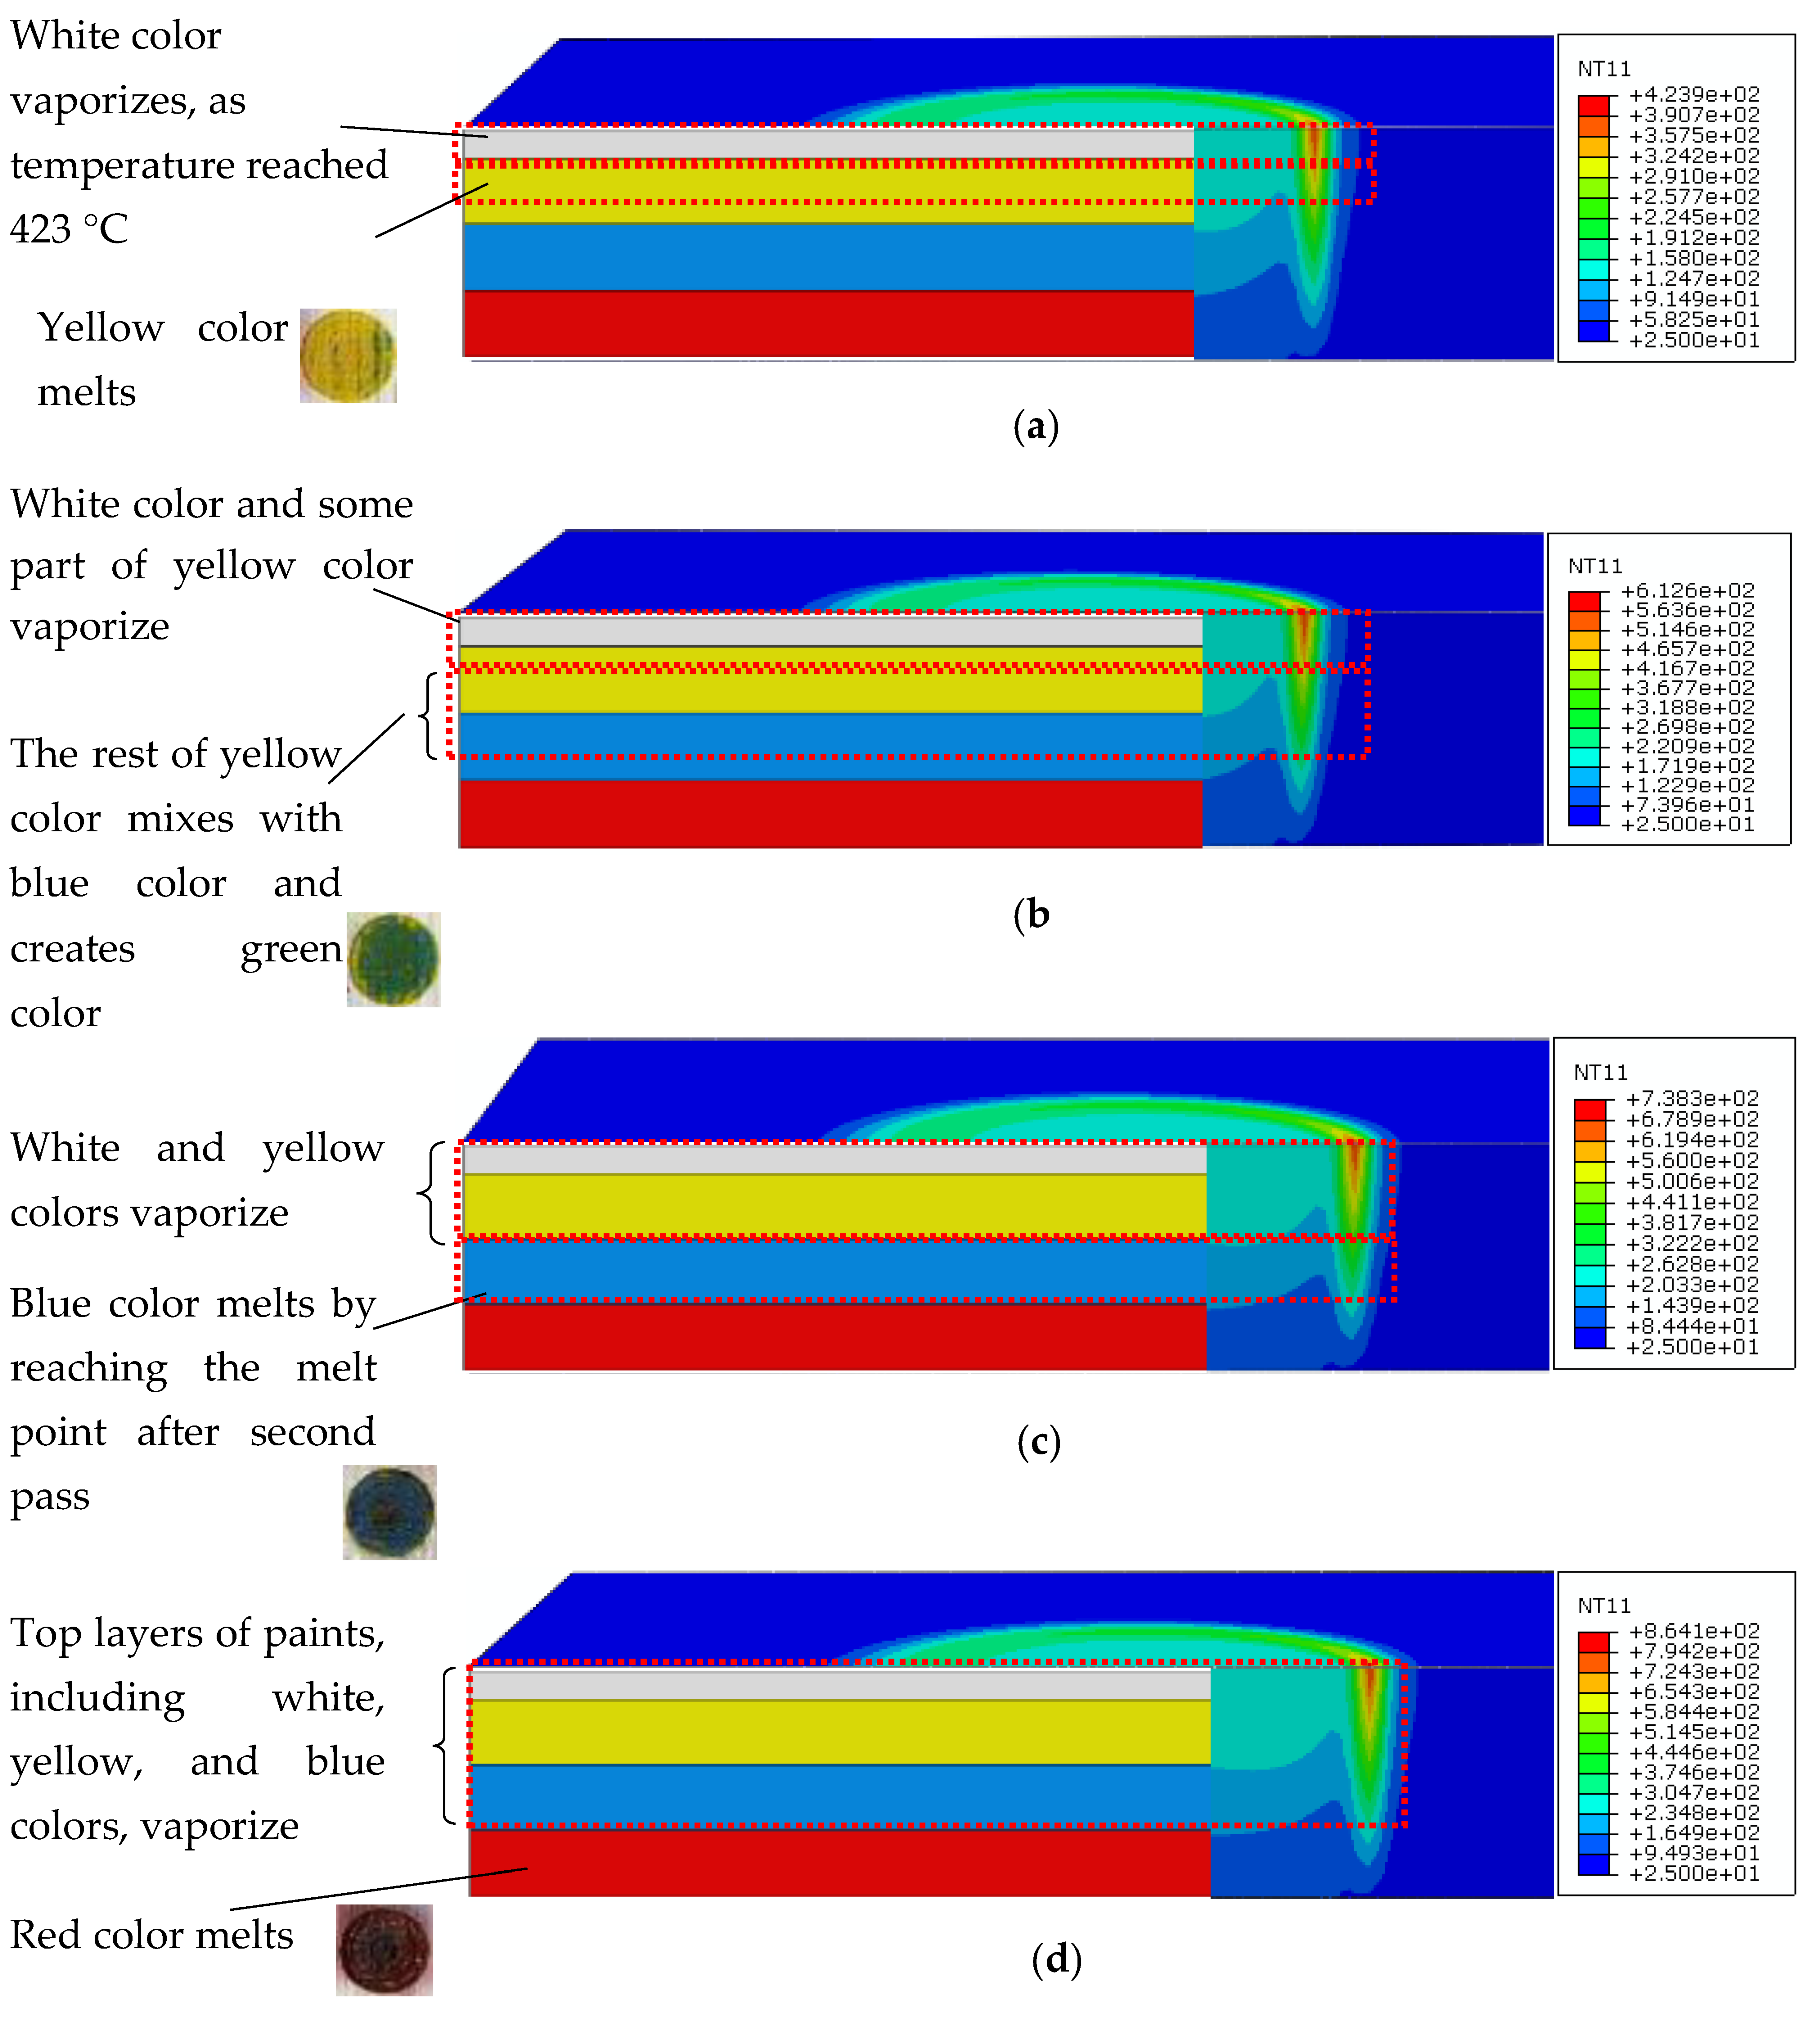
5.3. Numerical Result
6. Conclusions
Author Contributions
Funding
Institutional Review Board Statement
Informed Consent Statement
Data Availability Statement
Conflicts of Interest
References
- Shneiderman, B. Creativity support tools: Accelerating discovery and innovation. Commun. ACM 2007, 50, 20–32. [Google Scholar] [CrossRef] [Green Version]
- Li, Z.; Zheng, H.; Teh, K.; Liu, Y.; Lim, G.; Seng, H.; Yakovlev, N. Analysis of oxide formation induced by UV laser coloration of stainless steel. Appl. Surf. Sci. 2009, 256, 1582–1588. [Google Scholar] [CrossRef]
- Cui, C.; Cui, X.; Ren, X.; Qi, M.; Hu, J.; Wang, Y. Surface oxidation phenomenon and mechanism of AISI 304 stainless steel induced by Nd: YAG pulsed laser. Appl. Surf. Sci. 2014, 305, 817–824. [Google Scholar] [CrossRef]
- Antończak, A.; Trzcinski, M.; Hiller, T.; Bukaluk, A.; Wronkowska, A. Optical properties of laser induced oxynitride films on titanium. Appl. Surf. Sci. 2014, 304, 107–114. [Google Scholar]
- Sun, X.; Wang, W.; Mei, X.; Pan, A.; Zhang, Y. Femtosecond laser-induced periodic oxidization of titanium film: Structural colors both in reflection and transmission mode. Opt. Mater. 2020, 109, 110240. [Google Scholar] [CrossRef]
- Andreeva, Y.M.; Luong, V.; Lutoshina, D.; Medvedev, O.; Mikhailovskii, V.Y.; Moskvin, M.; Odintsova, G.; Romanov, V.; Shchedrina, N.; Veiko, V. Laser coloration of metals in visual art and design. Opt. Mater. Express 2019, 9, 1310–1319. [Google Scholar] [CrossRef]
- Veiko, V.; Luong, V.; Gornyi, S.; Andreeva, Y.M.; Lutoshina, D.; Odintsova, G. Production of laser art miniatures using localized oxidation of metals. J. Opt. Technol. 2020, 87, 633–637. [Google Scholar] [CrossRef]
- Garcell, E.M.; Singh, S.C.; Li, H.; Wang, B.; Jalil, S.A.; Guo, C. Comparative study of femtosecond laser-induced structural colorization in water and air. Nanoscale Adv. 2020, 2, 2958–2967. [Google Scholar] [CrossRef]
- Veiko, V.; Karlagina, Y.; Moskvin, M.; Mikhailovskii, V.; Odintsova, G.; Olshin, P.; Pankin, D.; Romanov, V.; Yatsuk, R. Metal surface coloration by oxide periodic structures formed with nanosecond laser pulses. Opt. Lasers Eng. 2017, 96, 63–67. [Google Scholar] [CrossRef]
- Li, G.; Li, J.; Hu, Y.; Zhang, C.; Li, X.; Chu, J.; Huang, W. Femtosecond laser color marking stainless steel surface with different wavelengths. Appl. Phys. A 2015, 118, 1189–1196. [Google Scholar] [CrossRef]
- Tamrin, K.; Nukman, Y.; Zakariyah, S. Laser lap joining of dissimilar materials: A review of factors affecting joint strength. Mater. Manuf. Process. 2013, 28, 857–871. [Google Scholar] [CrossRef] [Green Version]
- Dubey, A.K.; Yadava, V. Laser beam machining—A review. Int. J. Mach. Tools Manuf. 2008, 48, 609–628. [Google Scholar] [CrossRef]
- Kamal, H.; Antonious, M.; Mekewi, M.; Badawi, A.; Gabr, A.; El Baghdady, K. Nano ZnO/amine composites antimicrobial additives to acrylic paints. Egypt. J. Pet. 2015, 24, 397–404. [Google Scholar] [CrossRef] [Green Version]
- Hecht, E. Optics, 4th International ed.; Addison-Wesley: San Francisco, CA, USA, 2002; p. 698. [Google Scholar]
- Moghadasi, K.; Tamrin, K. Multi-pass laser cutting of carbon/Kevlar hybrid composite: Prediction of thermal stress, heat-affected zone, and kerf width by thermo-mechanical modeling. Proc. Inst. Mech. Eng. Part L J. Mater. Des. Appl. 2020, 234, 1228–1241. [Google Scholar] [CrossRef]
- Moghadasi, K.; Tamrin, K.F. Experimental investigation and parameter optimization of low power CO2 laser cutting of a carbon/Kevlar fiber-reinforced hybrid composite. Lasers Eng. 2020, 45, 85–108. [Google Scholar]
- Tamrin, K.; Nukman, Y.; Sheikh, N.; Harizam, M. Determination of optimum parameters using grey relational analysis for multi-performance characteristics in CO2 laser joining of dissimilar materials. Opt. Lasers Eng. 2014, 57, 40–47. [Google Scholar] [CrossRef]
- Tamrin, K.F.; Nukman, Y.; Choudhury, I.; Shirley, S. Multiple-objective optimization in precision laser cutting of different thermoplastics. Opt. Lasers Eng. 2015, 67, 57–65. [Google Scholar] [CrossRef]
- Kononenko, T.; Freitag, C.; Komlenok, M.; Weber, R.; Graf, T.; Konov, V. Heat accumulation between scans during multi-pass cutting of carbon fiber reinforced plastics. Appl. Phys. A 2018, 124, 217. [Google Scholar] [CrossRef]
- Tamrin, K.; Moghadasi, K.; Sheikh, N. Experimental and numerical investigation on multi-pass laser cutting of natural fibre composite. Int. J. Adv. Manuf. Technol. 2020, 107, 1483–1504. [Google Scholar] [CrossRef]
- Raghu, O.; Philip, J. Thermal properties of paint coatings on different backings using a scanning photo acoustic technique. Meas. Sci. Technol. 2006, 17, 2945. [Google Scholar] [CrossRef]
- Yilbas, B.; Akhtar, S.; Karatas, C. Laser circular cutting of Kevlar sheets: Analysis of thermal stress filed and assessment of cutting geometry. Opt. Laser Technol. 2017, 96, 180–189. [Google Scholar] [CrossRef]
- Shamsaei, S.; Ghoreishi, M. The effect of power density, scanning velocity, and pulse frequency on residual stress in laser grooving process. Proc. Inst. Mech. Eng. Part B J. Eng. Manuf. 2011, 225, 1772–1783. [Google Scholar] [CrossRef]
- Zhang, Z.; Huang, Y.; Kasinathan, A.R.; Shahabad, S.I.; Ali, U.; Mahmoodkhani, Y.; Toyserkani, E. 3-Dimensional heat transfer modeling for laser powder-bed fusion additive manufacturing with volumetric heat sources based on varied thermal conductivity and absorptivity. Opt. Laser Technol. 2019, 109, 297–312. [Google Scholar] [CrossRef]
- Bonakdar, A.; Molavi-Zarandi, M.; Chamanfar, A.; Jahazi, M.; Firoozrai, A.; Morin, E. Finite element modeling of the electron beam welding of Inconel-713LC gas turbine blades. J. Manuf. Process. 2017, 26, 339–354. [Google Scholar] [CrossRef]


| Surface | Roughness Measurement (Ra) | Sample Laser Discoloration |
|---|---|---|
 | 10.13 | 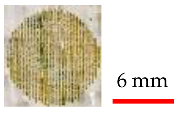 |
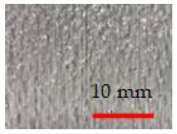 | 8.6 | 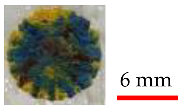 |
 | 5.95 |  |
| Power (W) | Speed (mm/s) | SOD (mm) | No. of Passes | Color | Result |
|---|---|---|---|---|---|
| 3.2 | 100 | 50.8 | 1 | Yellow-blue-red |  |
| 2 | 50 | 50.8 | 1 | Blue-red-yellow |  |
| 6 | 33.33 | 50.8 | 1 | Blue-red-brown-yellow |  |
| 4.8 | 33.33 | 50.8 | 1 | Blue-yellow |  |
| 4 | 50 | 51 | 1 | Burnt |  |
| 0.8 | 16.66 | 47.8 | 1 | Burnt |  |
| 4 | 50 | 48.8 | 1 | Burnt |  |
| 0.4 | 6.66 | 52 | 1 | Yellow |  |
| 0.4 | 5 | 52 | 1 | Green |  |
| 0.4 | 5 | 52 | Pass 1 | Blue |  |
| 0.4 | 7.5 | 52 | Pass 2 | ||
| 0.4 | 5 | 52 | Pass 1 | Red-brown |  |
| 0.4 | 5.83 | 52 | Pass 2 |
| Set No. | Results | Ranges of Laser Parameters | Surface Roughness, Ra (μm) |
|---|---|---|---|
| 1 | 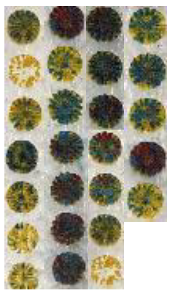 | 1 W ≤ P (laser power) ≤ 5 W 10 mm/s ≤ V (laser speed) ≤ 100 mm/s SOD = 50.8 mm | 8.6 |
| 2 | 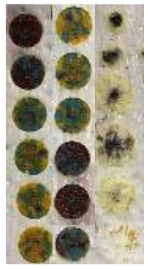 | 3 W ≤ P (laser power) ≤ 15 W 15 mm/s ≤ V (laser speed) ≤ 100 mm/s 47.8 mm ≤ SOD ≤ 51 mm | 5.95 |
| 3 | 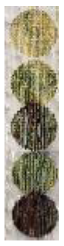 | 5 W ≤ P (laser power) ≤ 10 W 1 mm/s ≤ V (laser speed) ≤ 5 mm/s 49.8 mm ≤ SOD ≤ 50.8 mm | 10.13 |
| 4 | 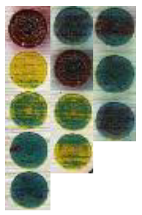 | 0.2 W ≤ P (laser power) ≤ 0.6 W 4 mm/s ≤ V (laser speed) ≤ 8 mm/s SOD = 52 mm (optimum results) | 5.95 |
| Power (W) | Speed (mm/s) | SOD (mm) | No. of Passes | Color | Result |
|---|---|---|---|---|---|
| 0.4 | 6.66 | 52 | 1 | Yellow |  |
| 0.4 | 5 | 52 | 1 | Green |  |
| 0.4 | 5 | 52 | Pass 1 | Blue |  |
| 0.4 | 7.5 | 52 | Pass 2 | ||
| 0.4 | 5 | 52 | Pass 1 | Red-brown |  |
| 0.4 | 5.83 | 52 | Pass 2 |
| Acrylic Paints | Thermal Conductivity (W/mK) | Specific Heat (J/kgK) | Thermal Expansion (1/K) |
| 1.45 | 5184 | 1.68 × 10⁻⁴ |
Publisher’s Note: MDPI stays neutral with regard to jurisdictional claims in published maps and institutional affiliations. |
© 2021 by the authors. Licensee MDPI, Basel, Switzerland. This article is an open access article distributed under the terms and conditions of the Creative Commons Attribution (CC BY) license (https://creativecommons.org/licenses/by/4.0/).
Share and Cite
Tamrin, K.F.; Moghadasi, K.; Jalil, M.H.; Sheikh, N.A.; Mohamaddan, S. Laser Discoloration in Acrylic Painting of Visual Art: Experiment and Modeling. Materials 2021, 14, 2009. https://doi.org/10.3390/ma14082009
Tamrin KF, Moghadasi K, Jalil MH, Sheikh NA, Mohamaddan S. Laser Discoloration in Acrylic Painting of Visual Art: Experiment and Modeling. Materials. 2021; 14(8):2009. https://doi.org/10.3390/ma14082009
Chicago/Turabian StyleTamrin, Khairul Fikri, Kaveh Moghadasi, Marzie Hatef Jalil, Nadeem Ahmed Sheikh, and Shahrol Mohamaddan. 2021. "Laser Discoloration in Acrylic Painting of Visual Art: Experiment and Modeling" Materials 14, no. 8: 2009. https://doi.org/10.3390/ma14082009