
Seismic Analysis and Design of Composite Shear Wall with Stiffened Steel Plate and Infilled Concrete

Abstract
:1. Introduction
2. Experimental Work
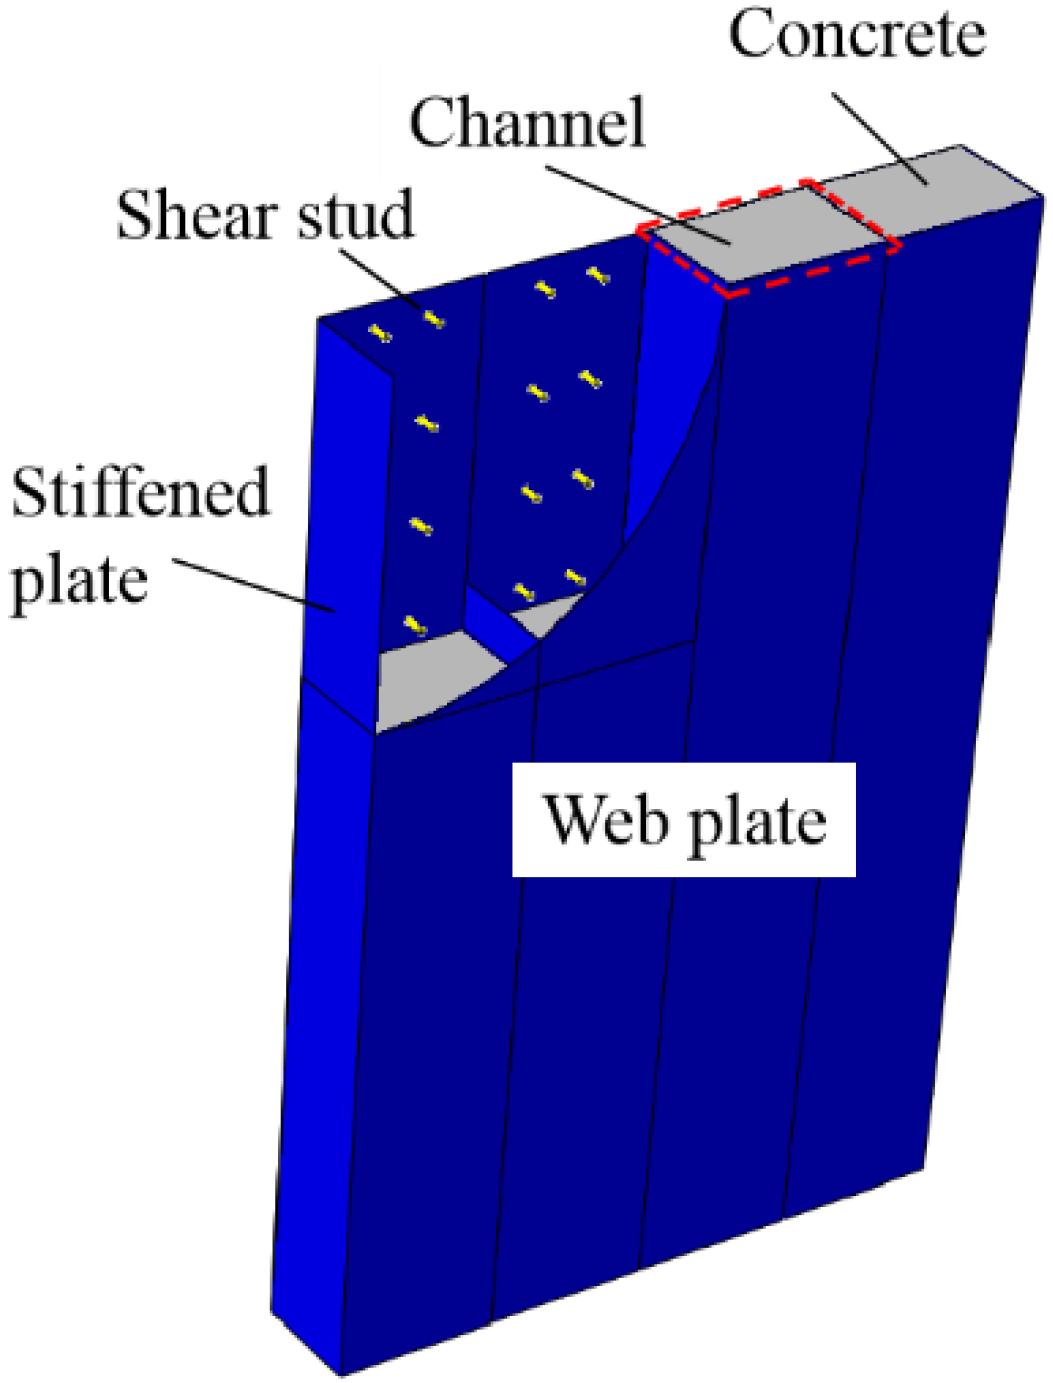
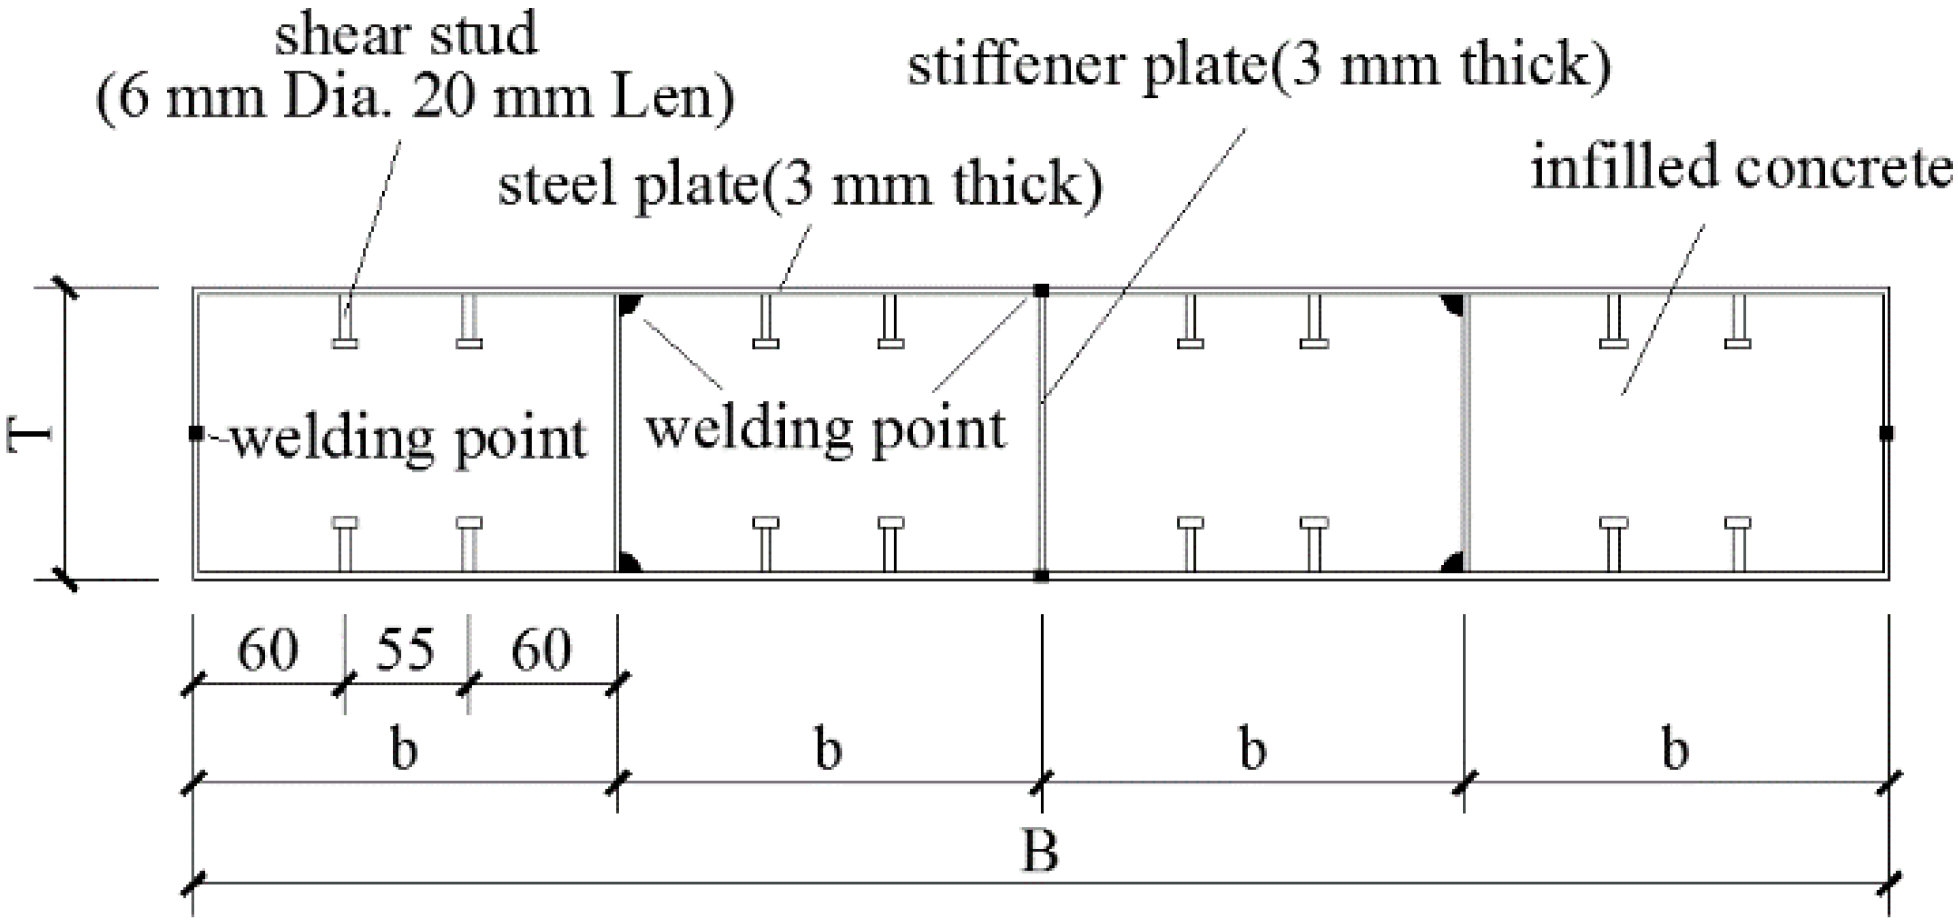
2.1. Sample Design
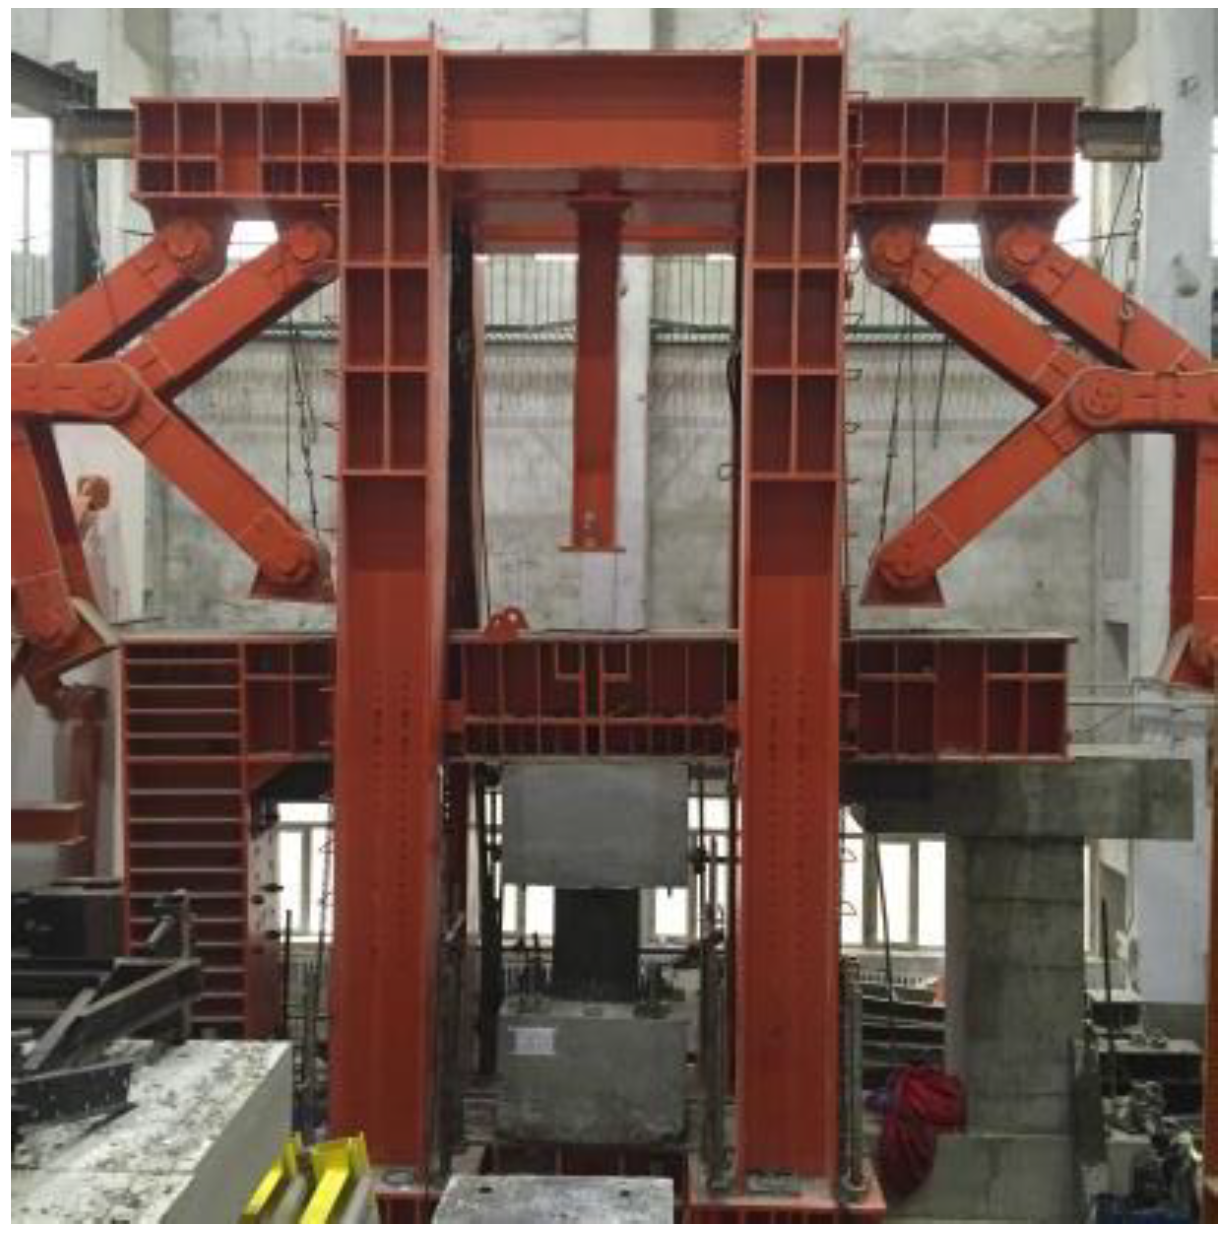
2.2. Loading Programme and Test Setup
3. FE Modelling
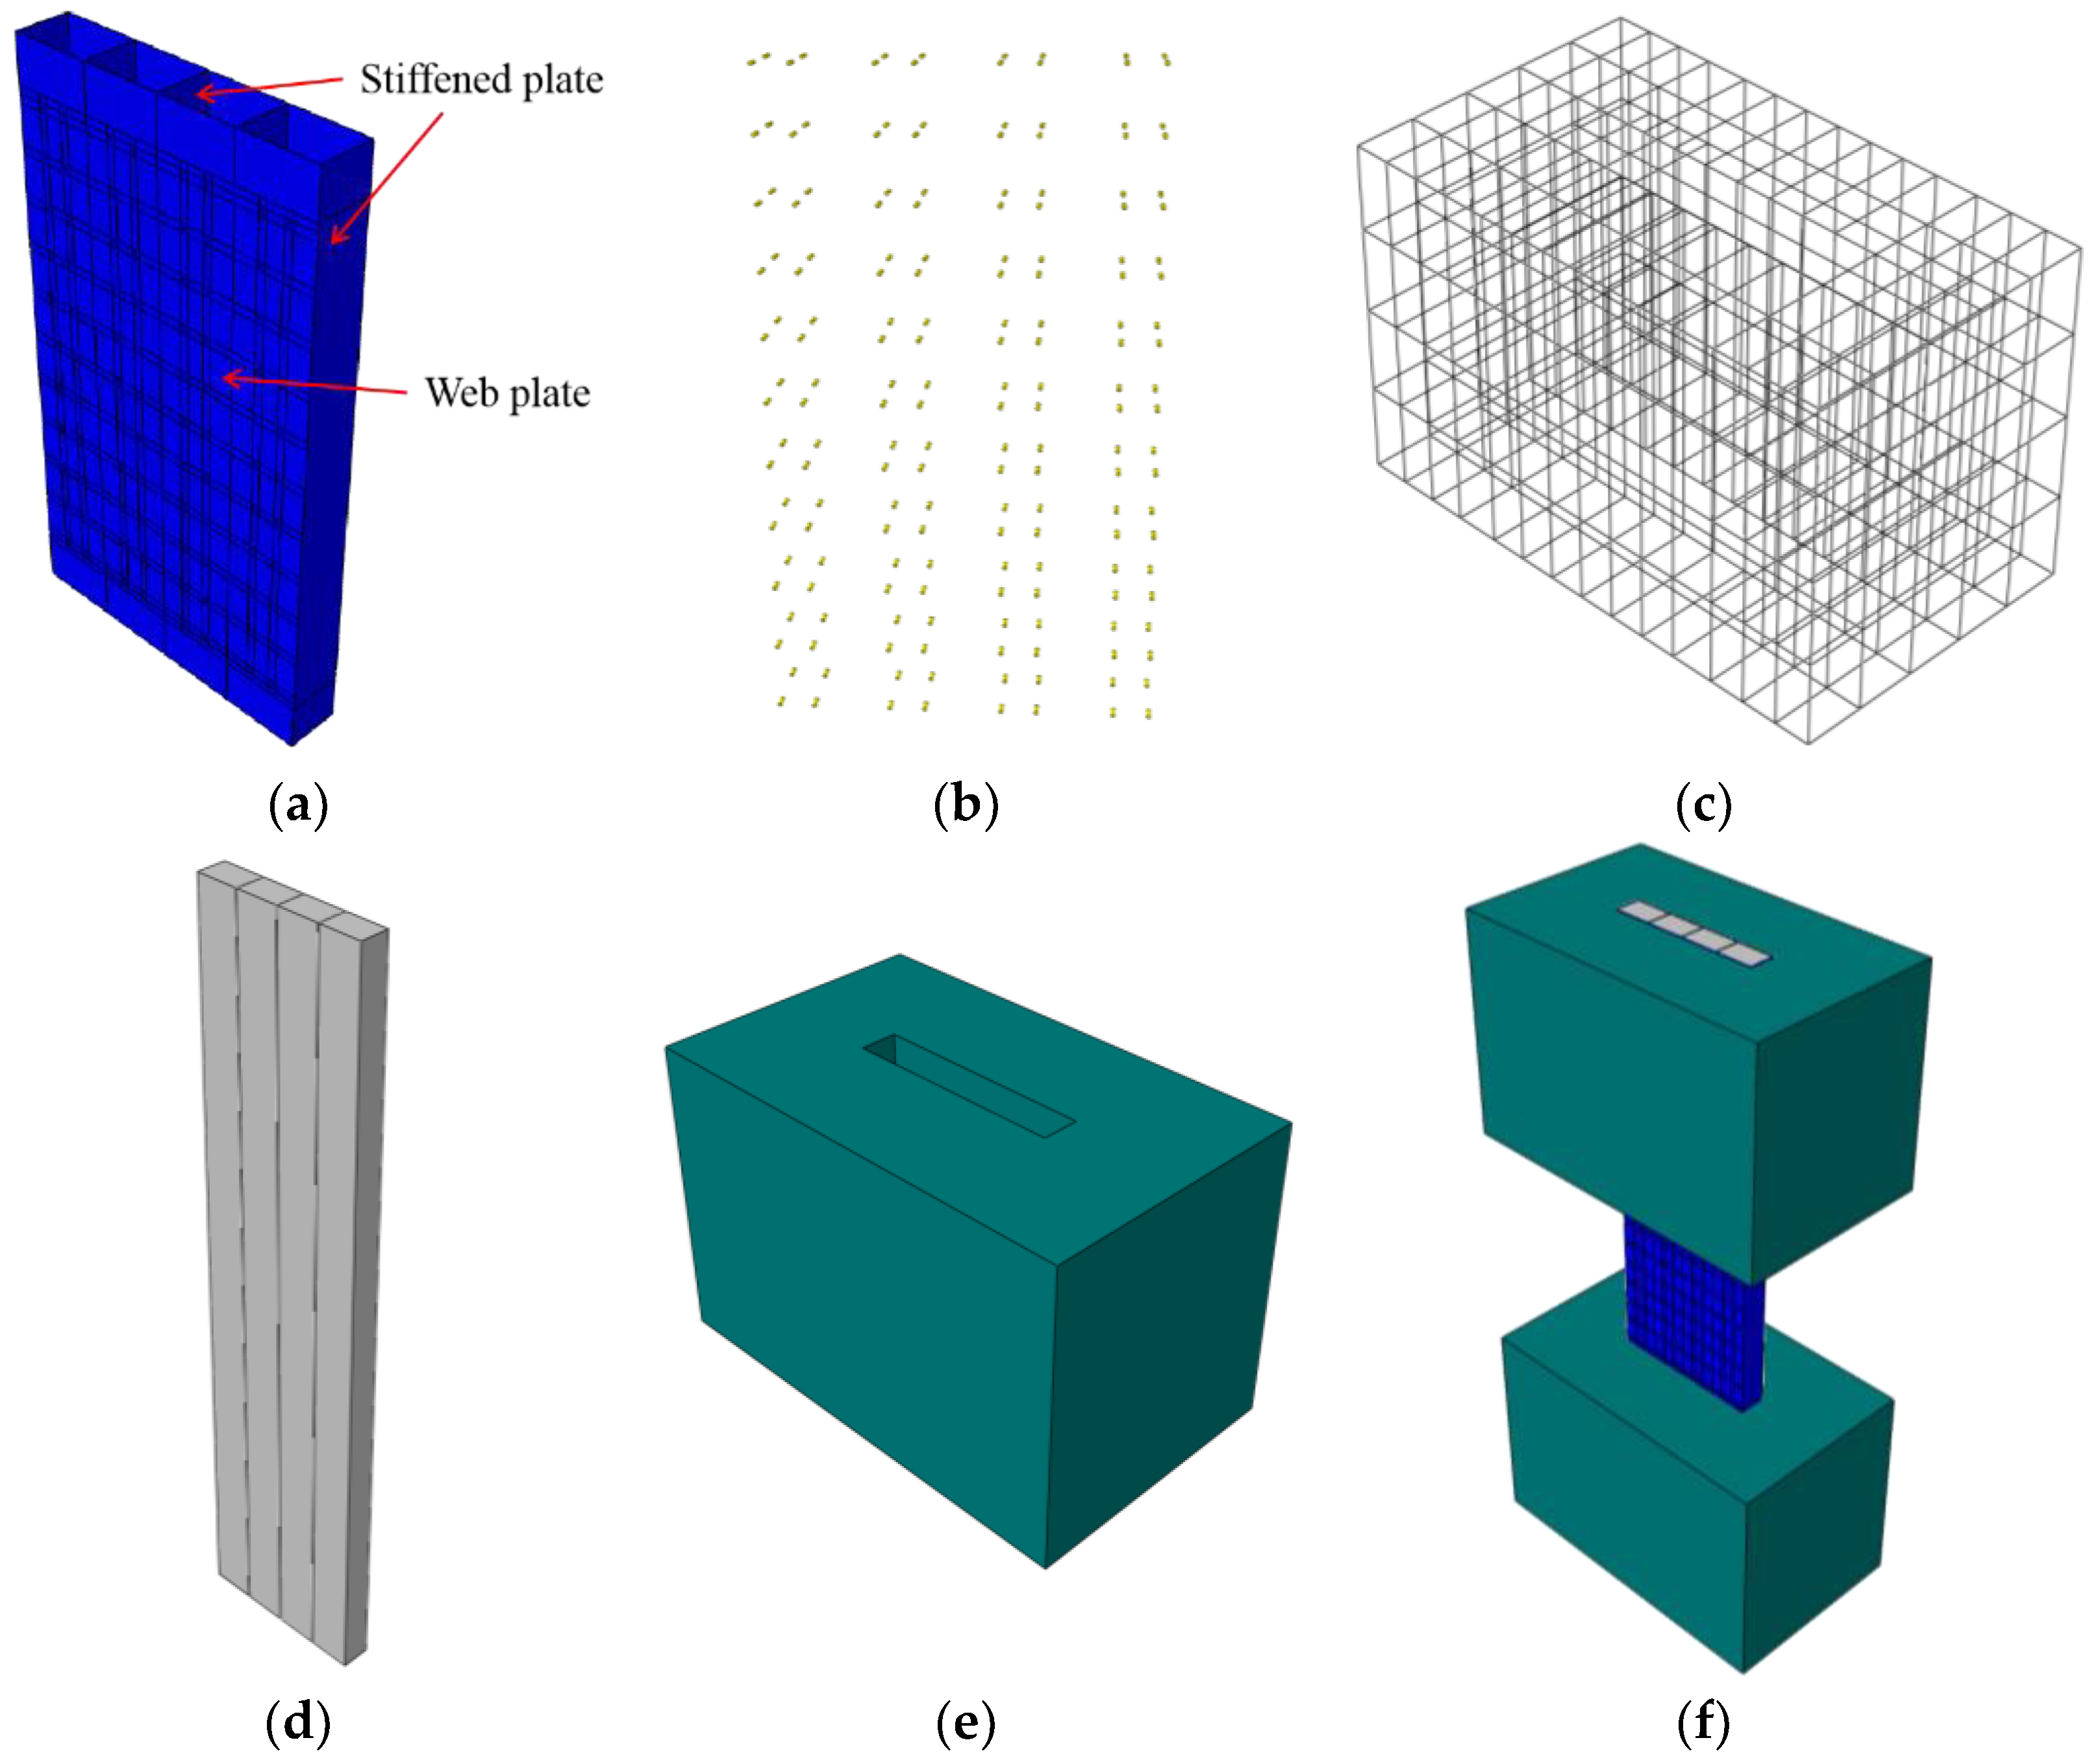
3.1. Model Overview
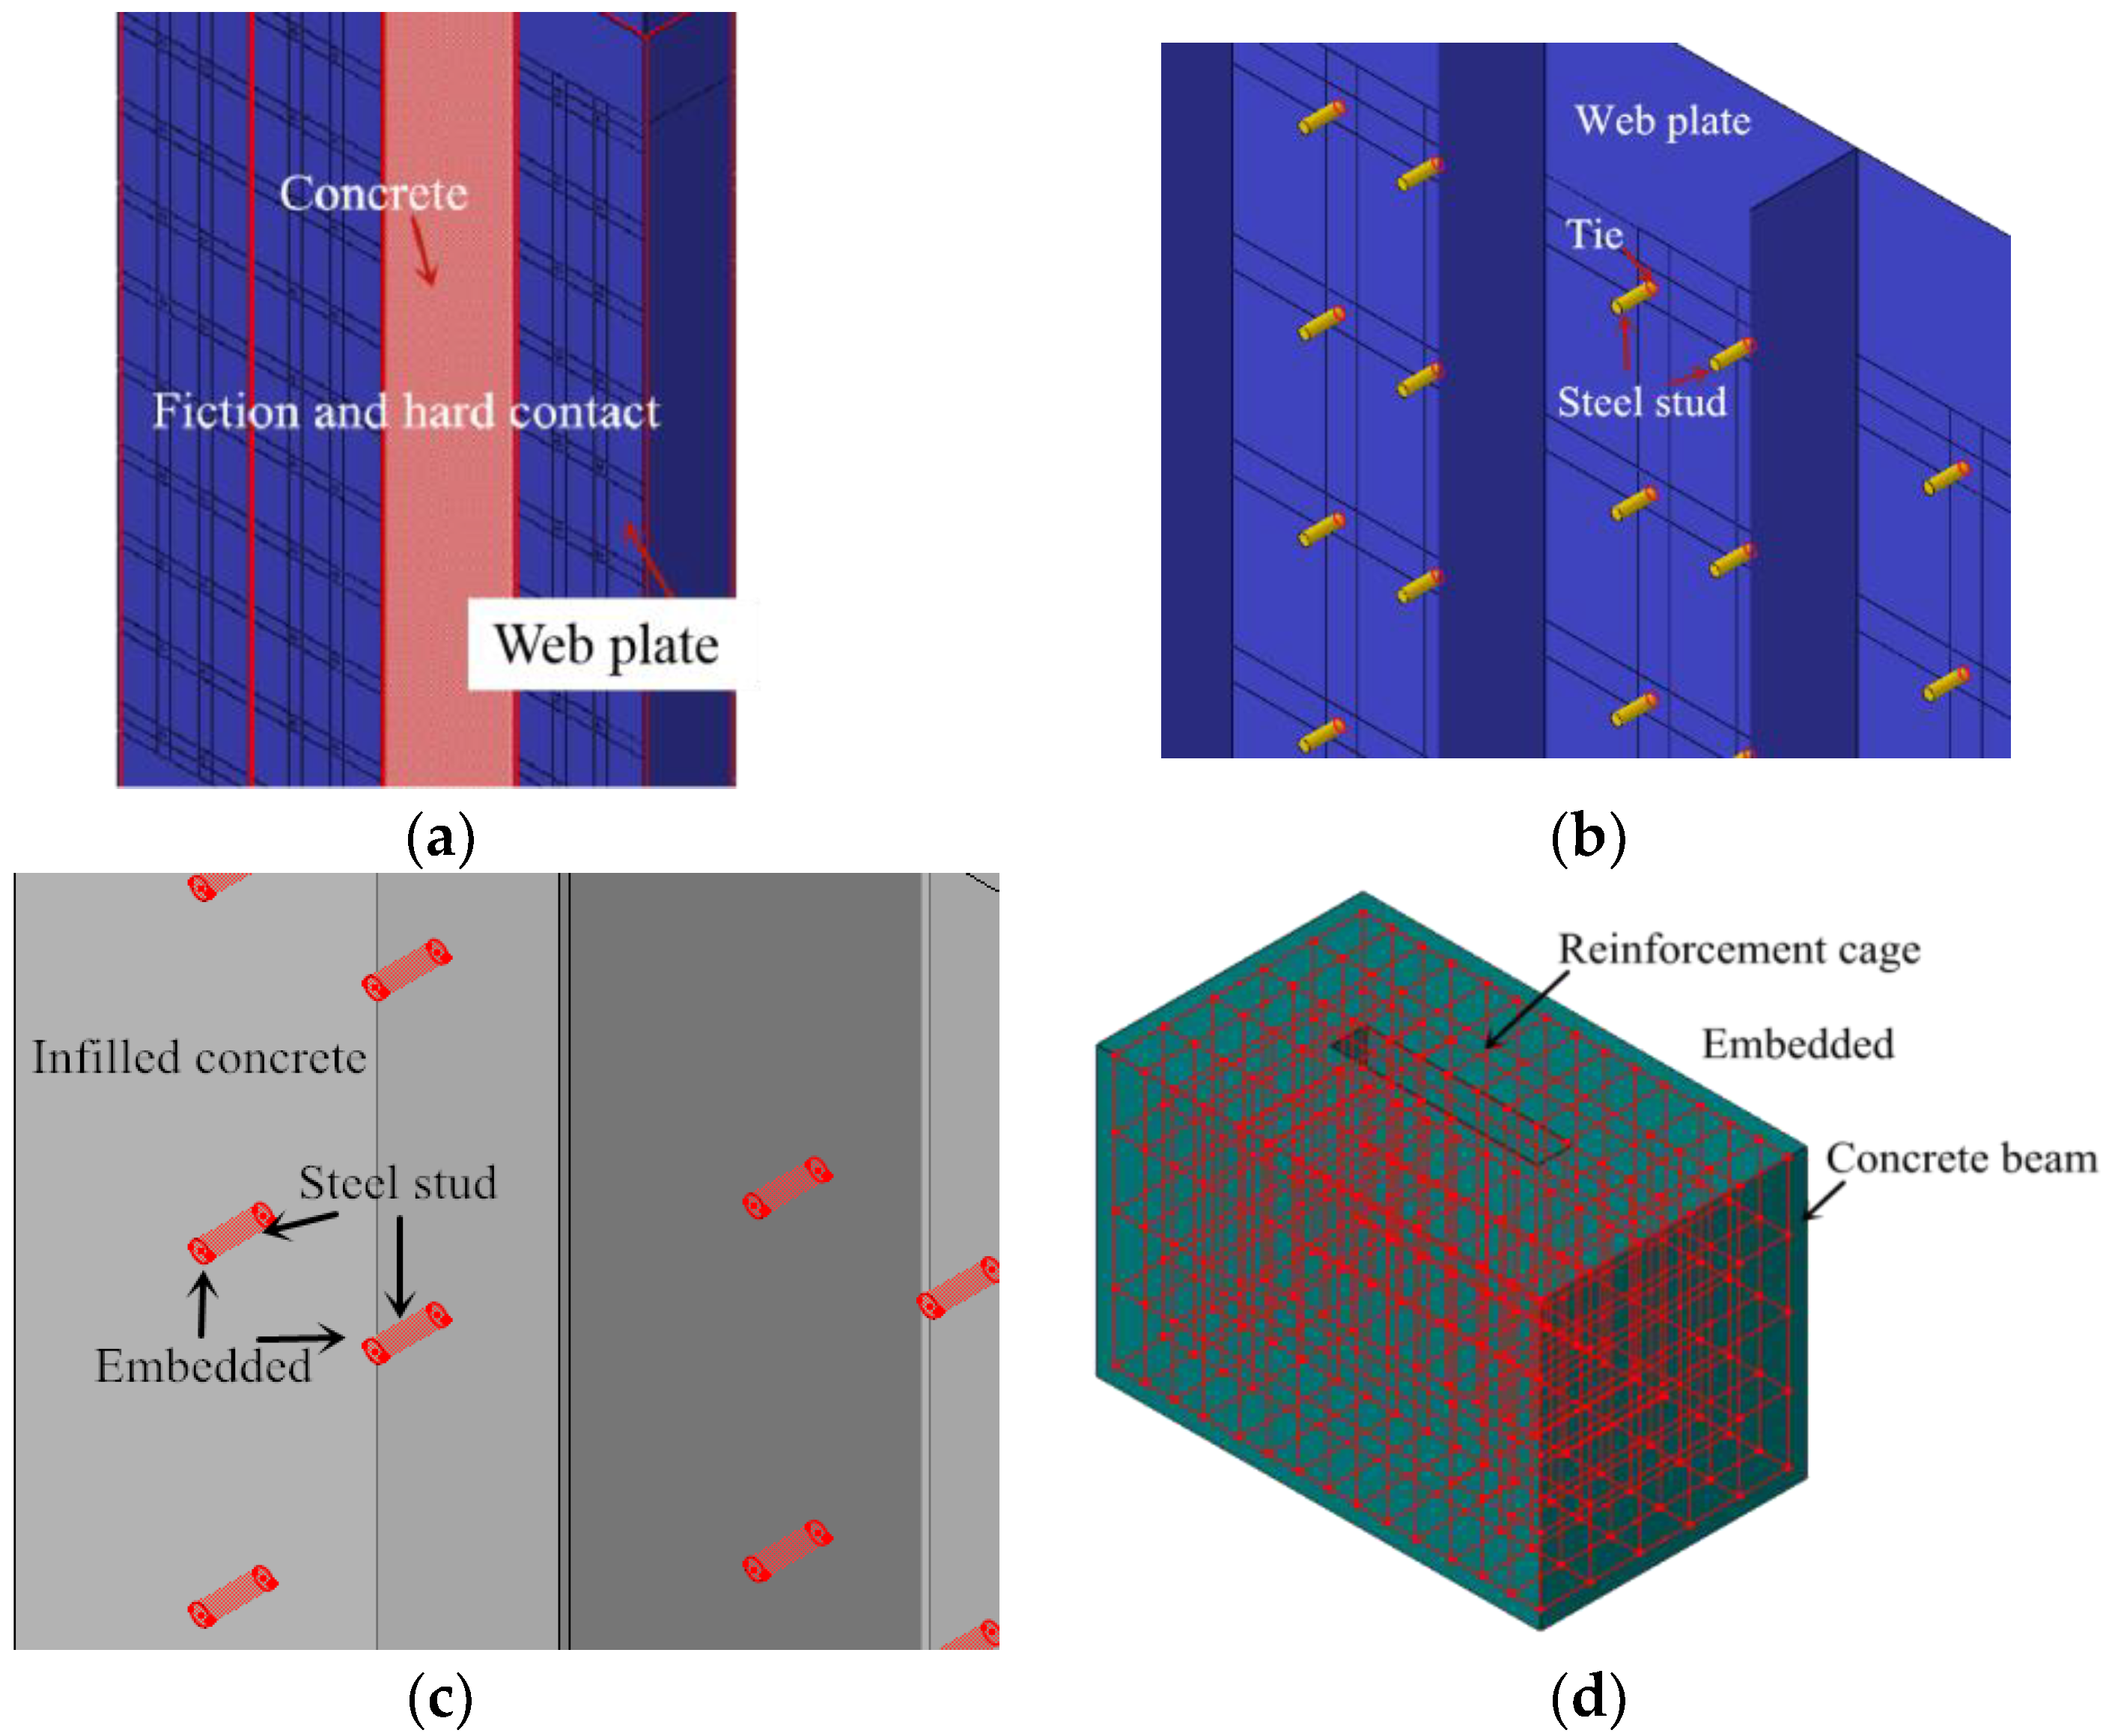
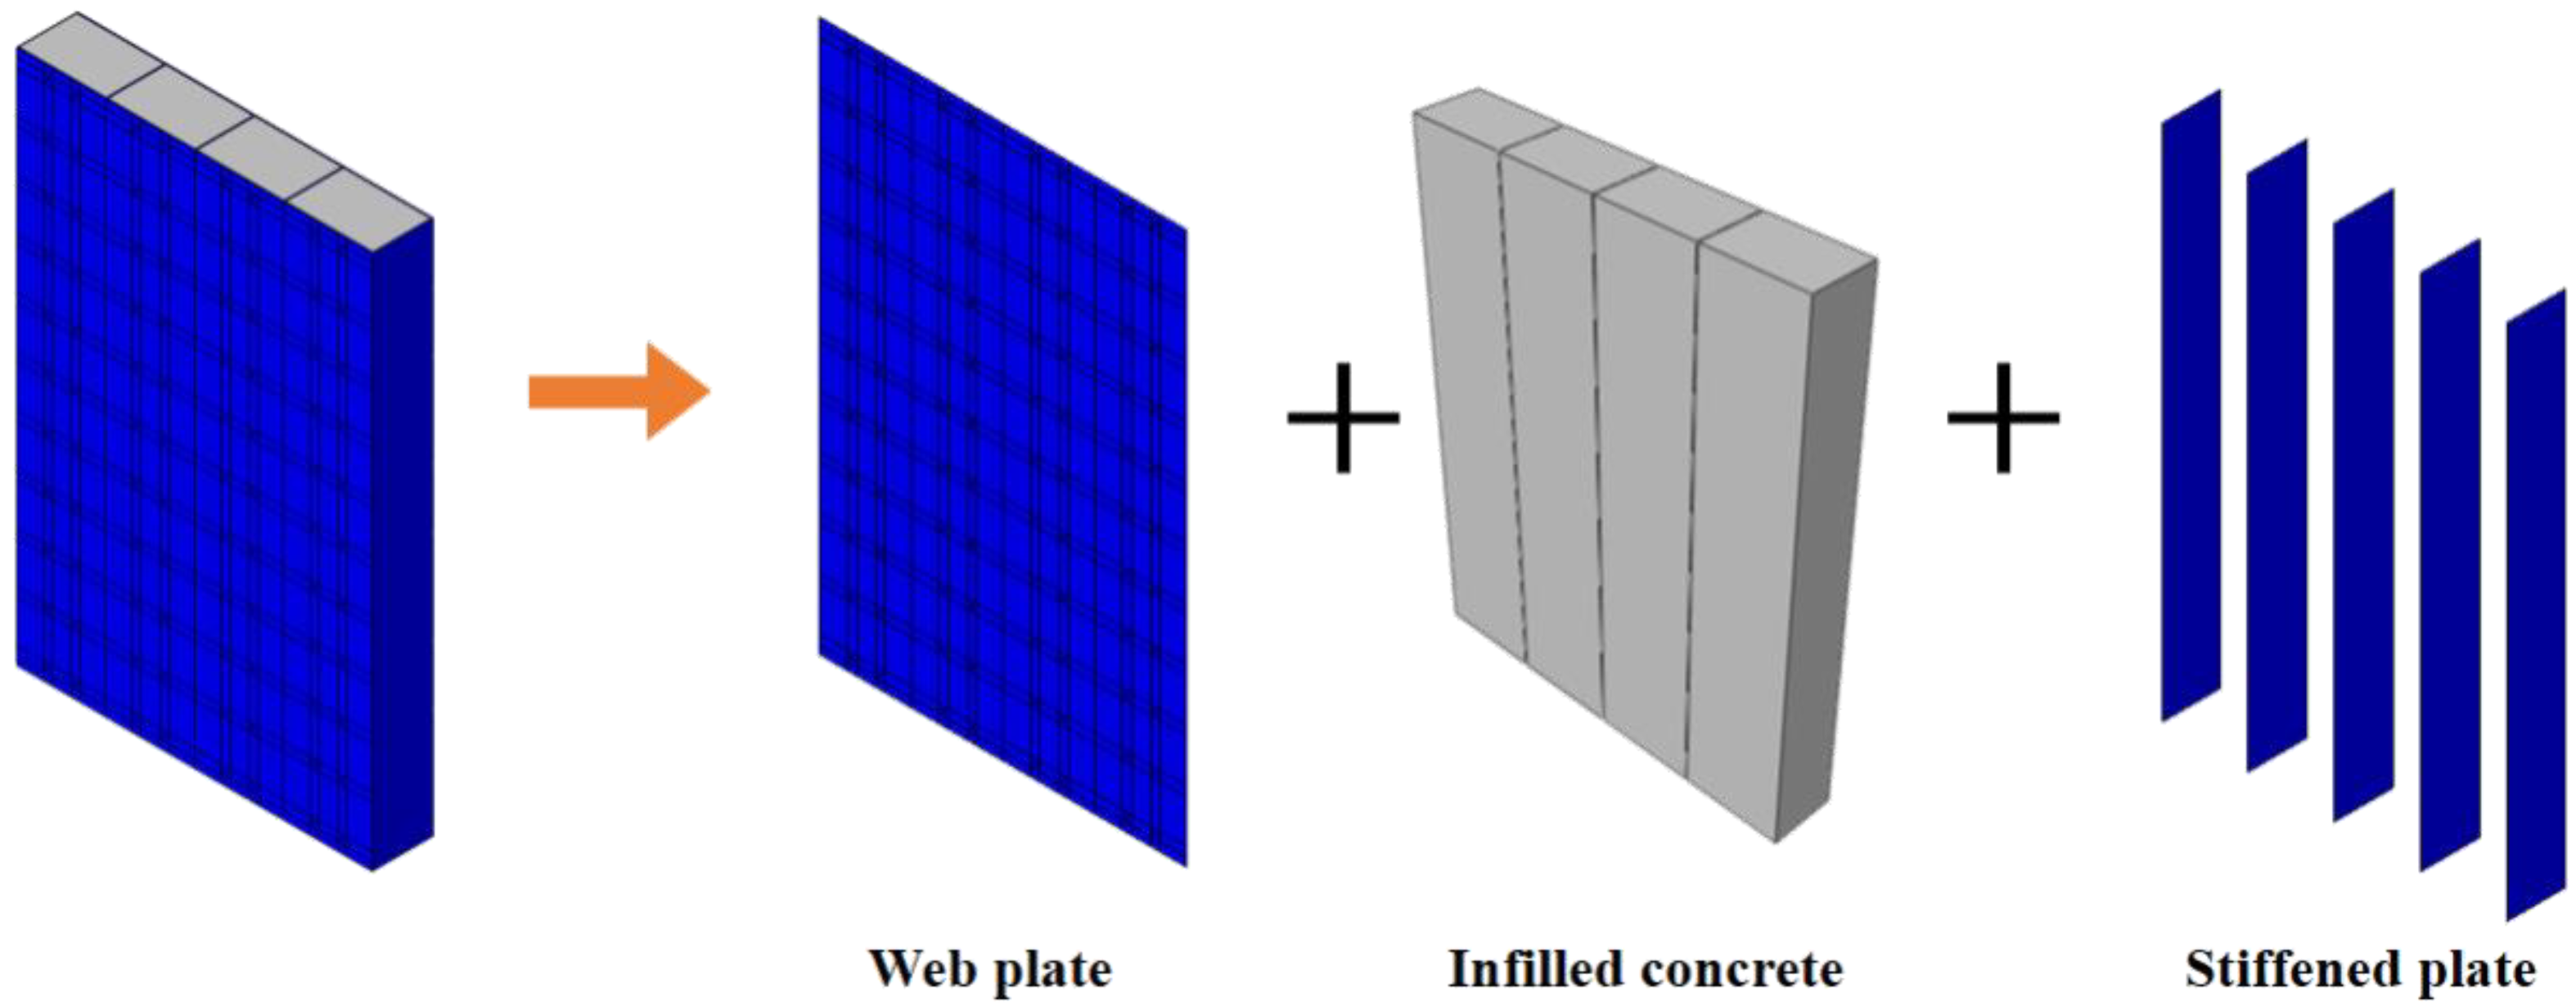
3.1.1. Part and Element of the FE Model
3.1.2. Contact of FE Model
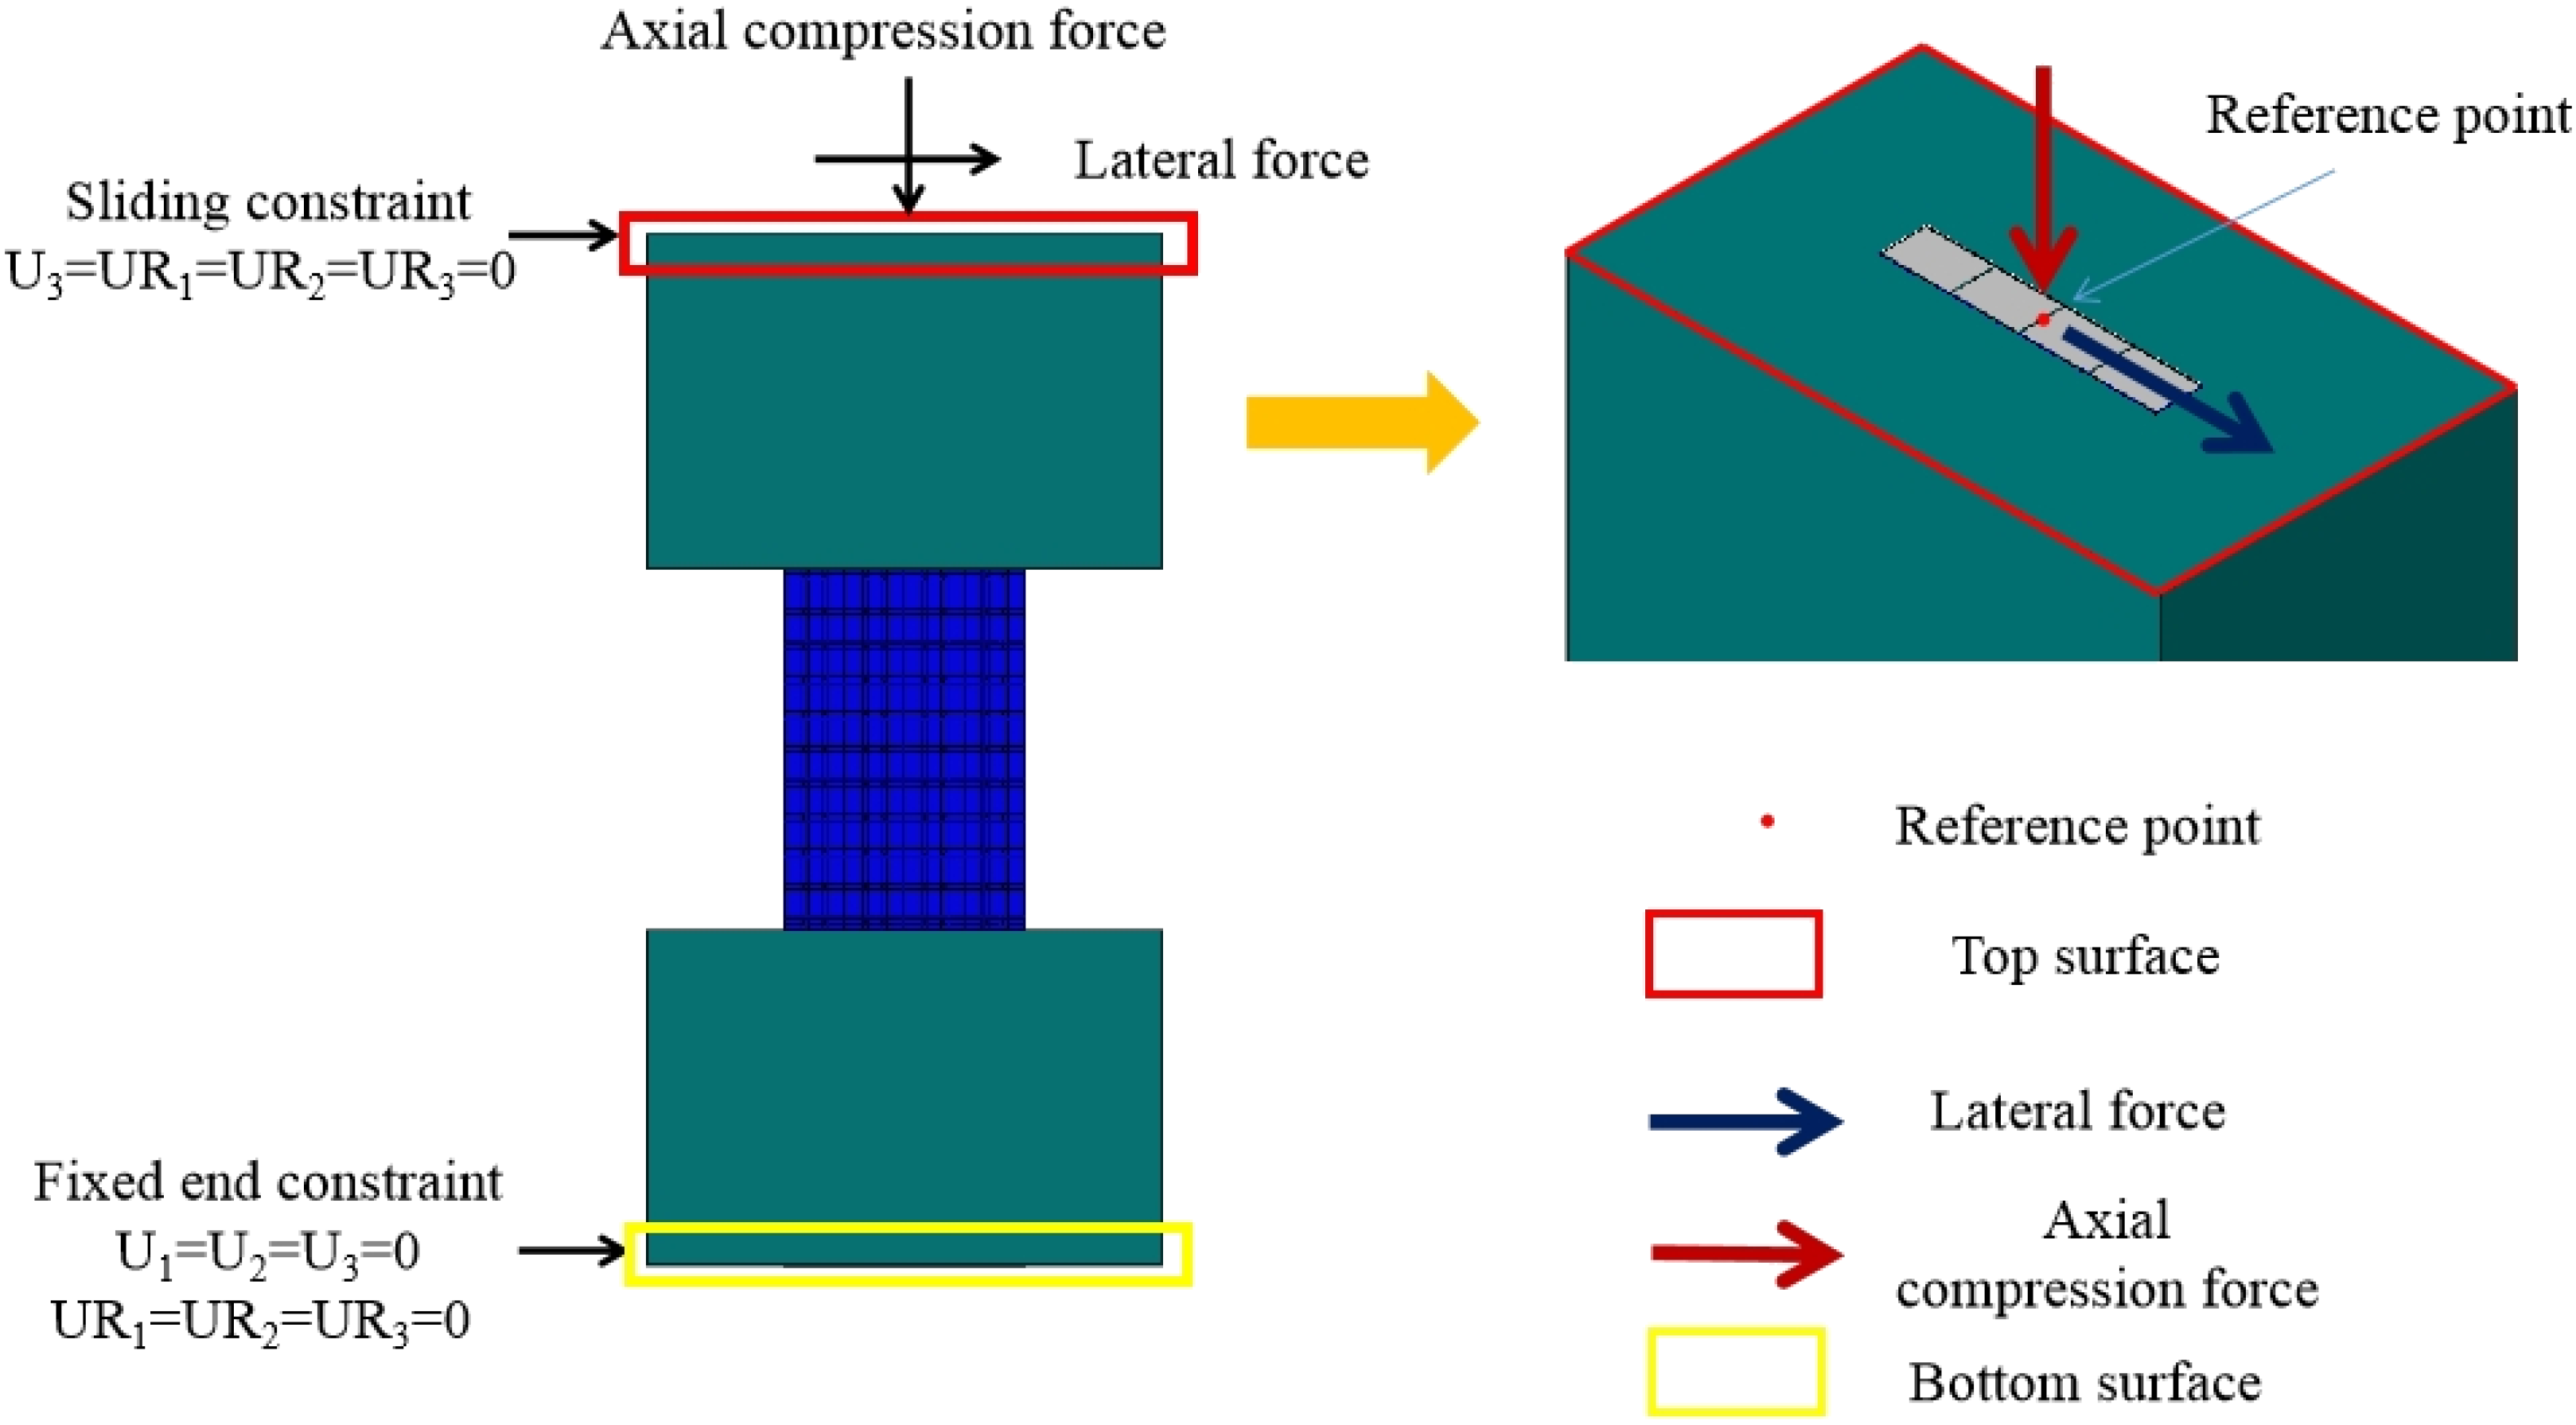
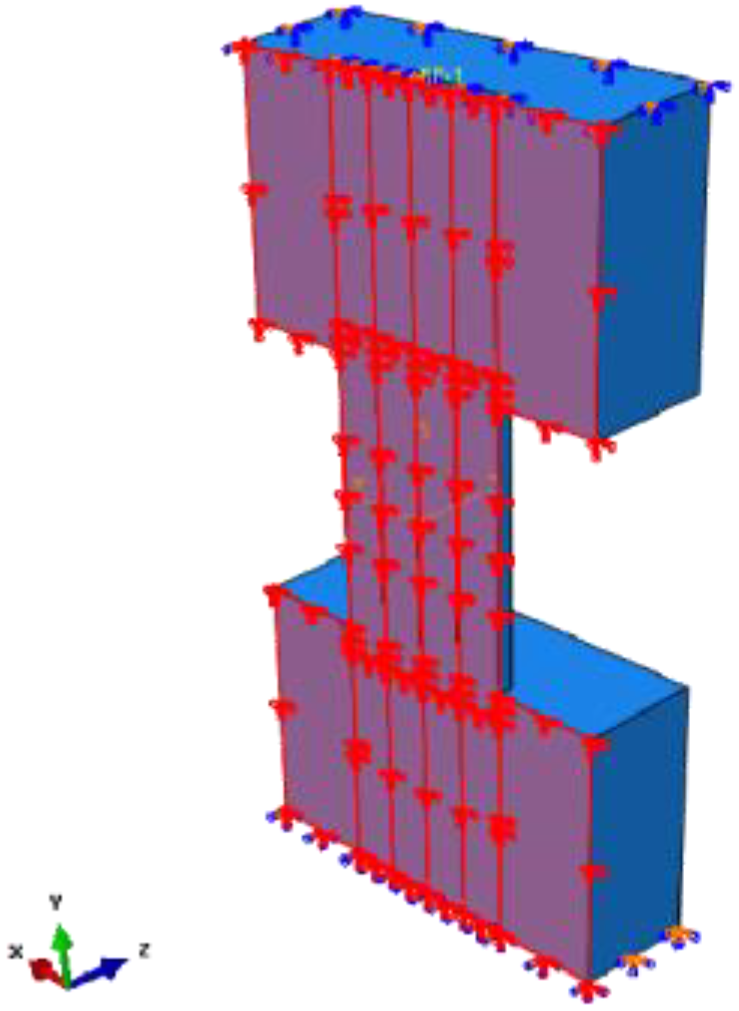
3.1.3. Boundary Conditions
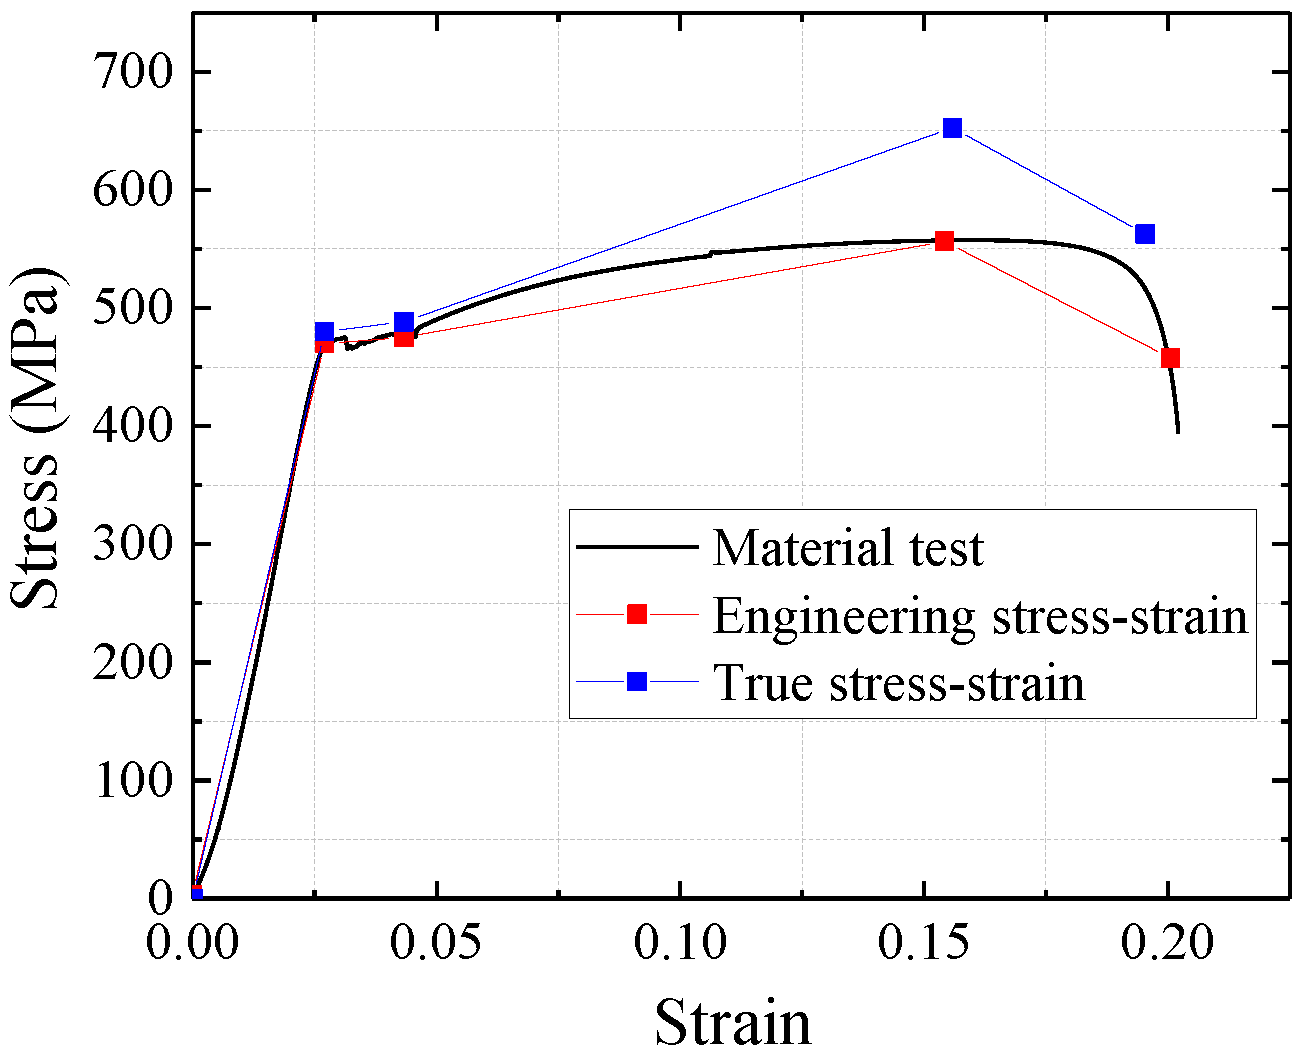
3.2. Steel Constitutive Model
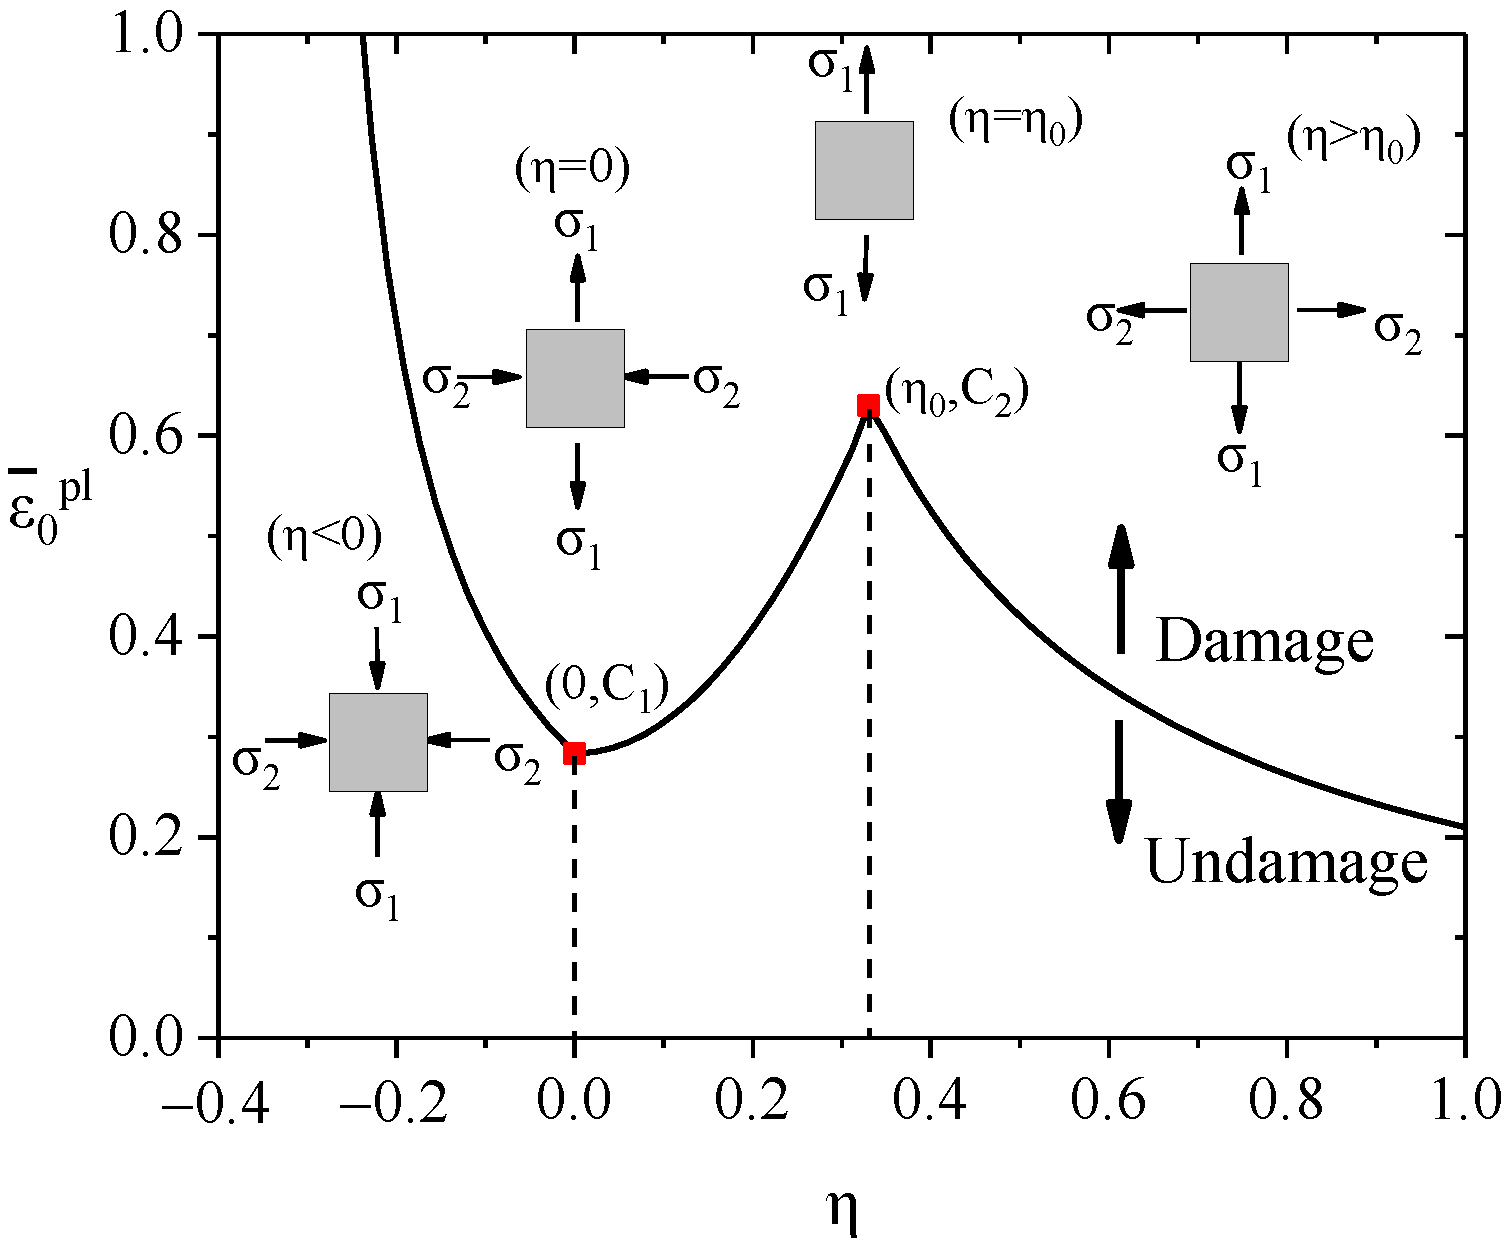
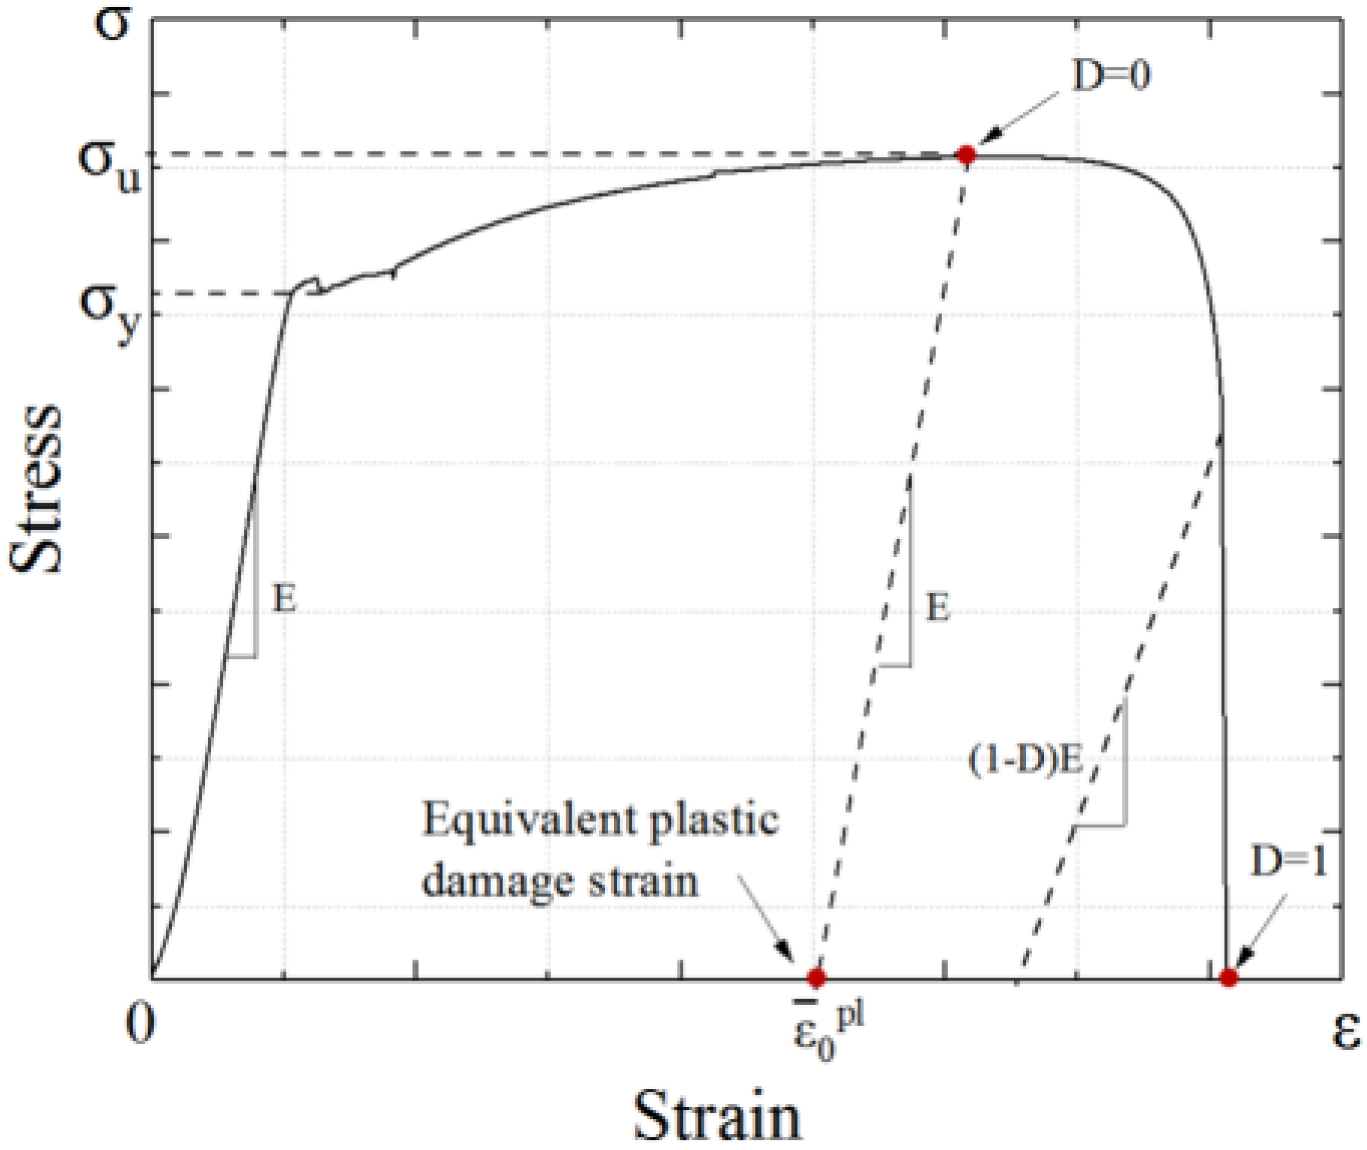
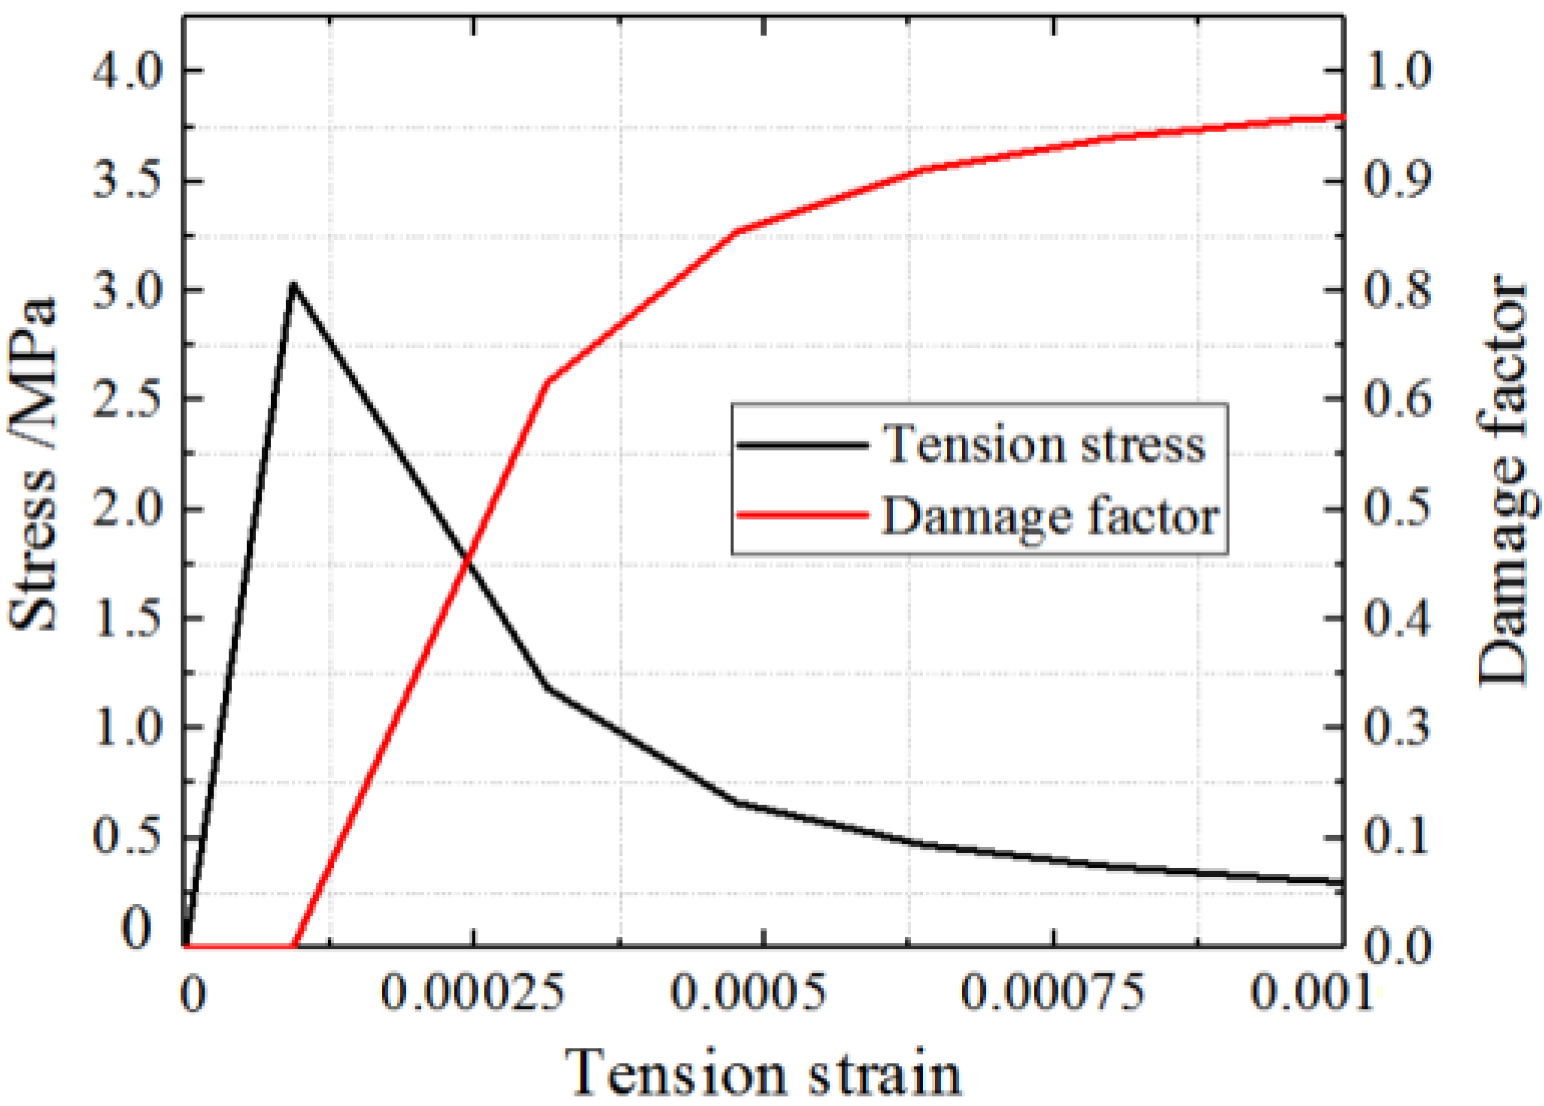
3.3. Concrete Constitutive Model
- ξc = Restrained coefficient factor.
- ε0 = Peak strain of the concrete under uniaxial compression.
- σp = Peak stress of the concrete under uniaxial tension.
- = Cylinder compressive strength of the concrete.
- As = Section area of the steel tube.
- Ac = Section area of the infilled concrete.
3.4. Meshing
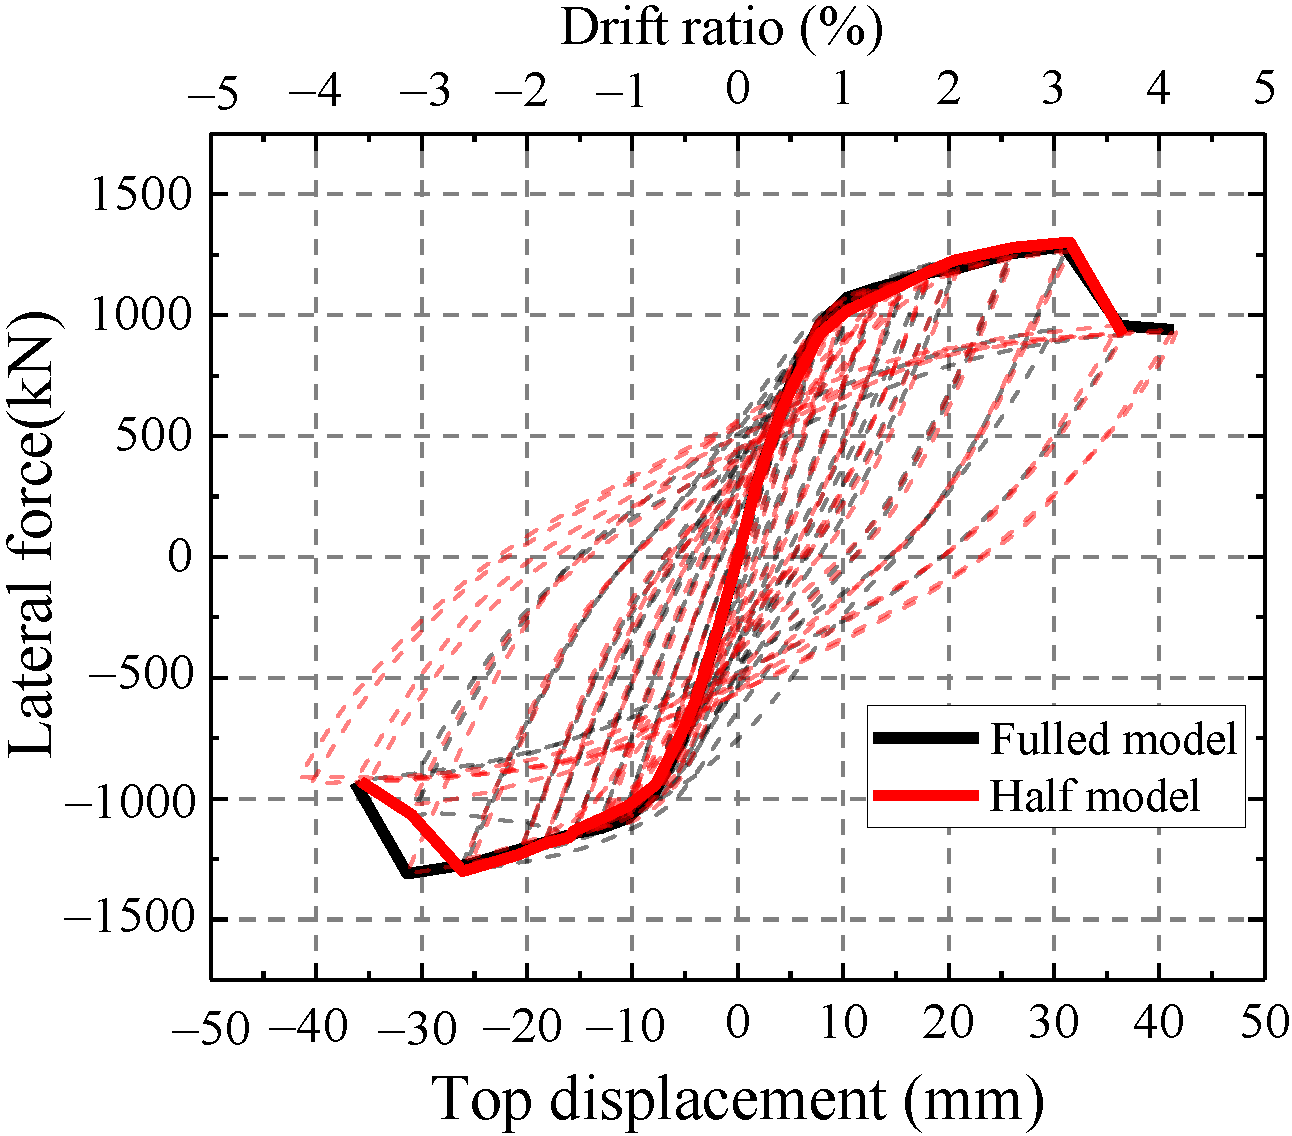
3.5. Simplification of the Finite Element Model
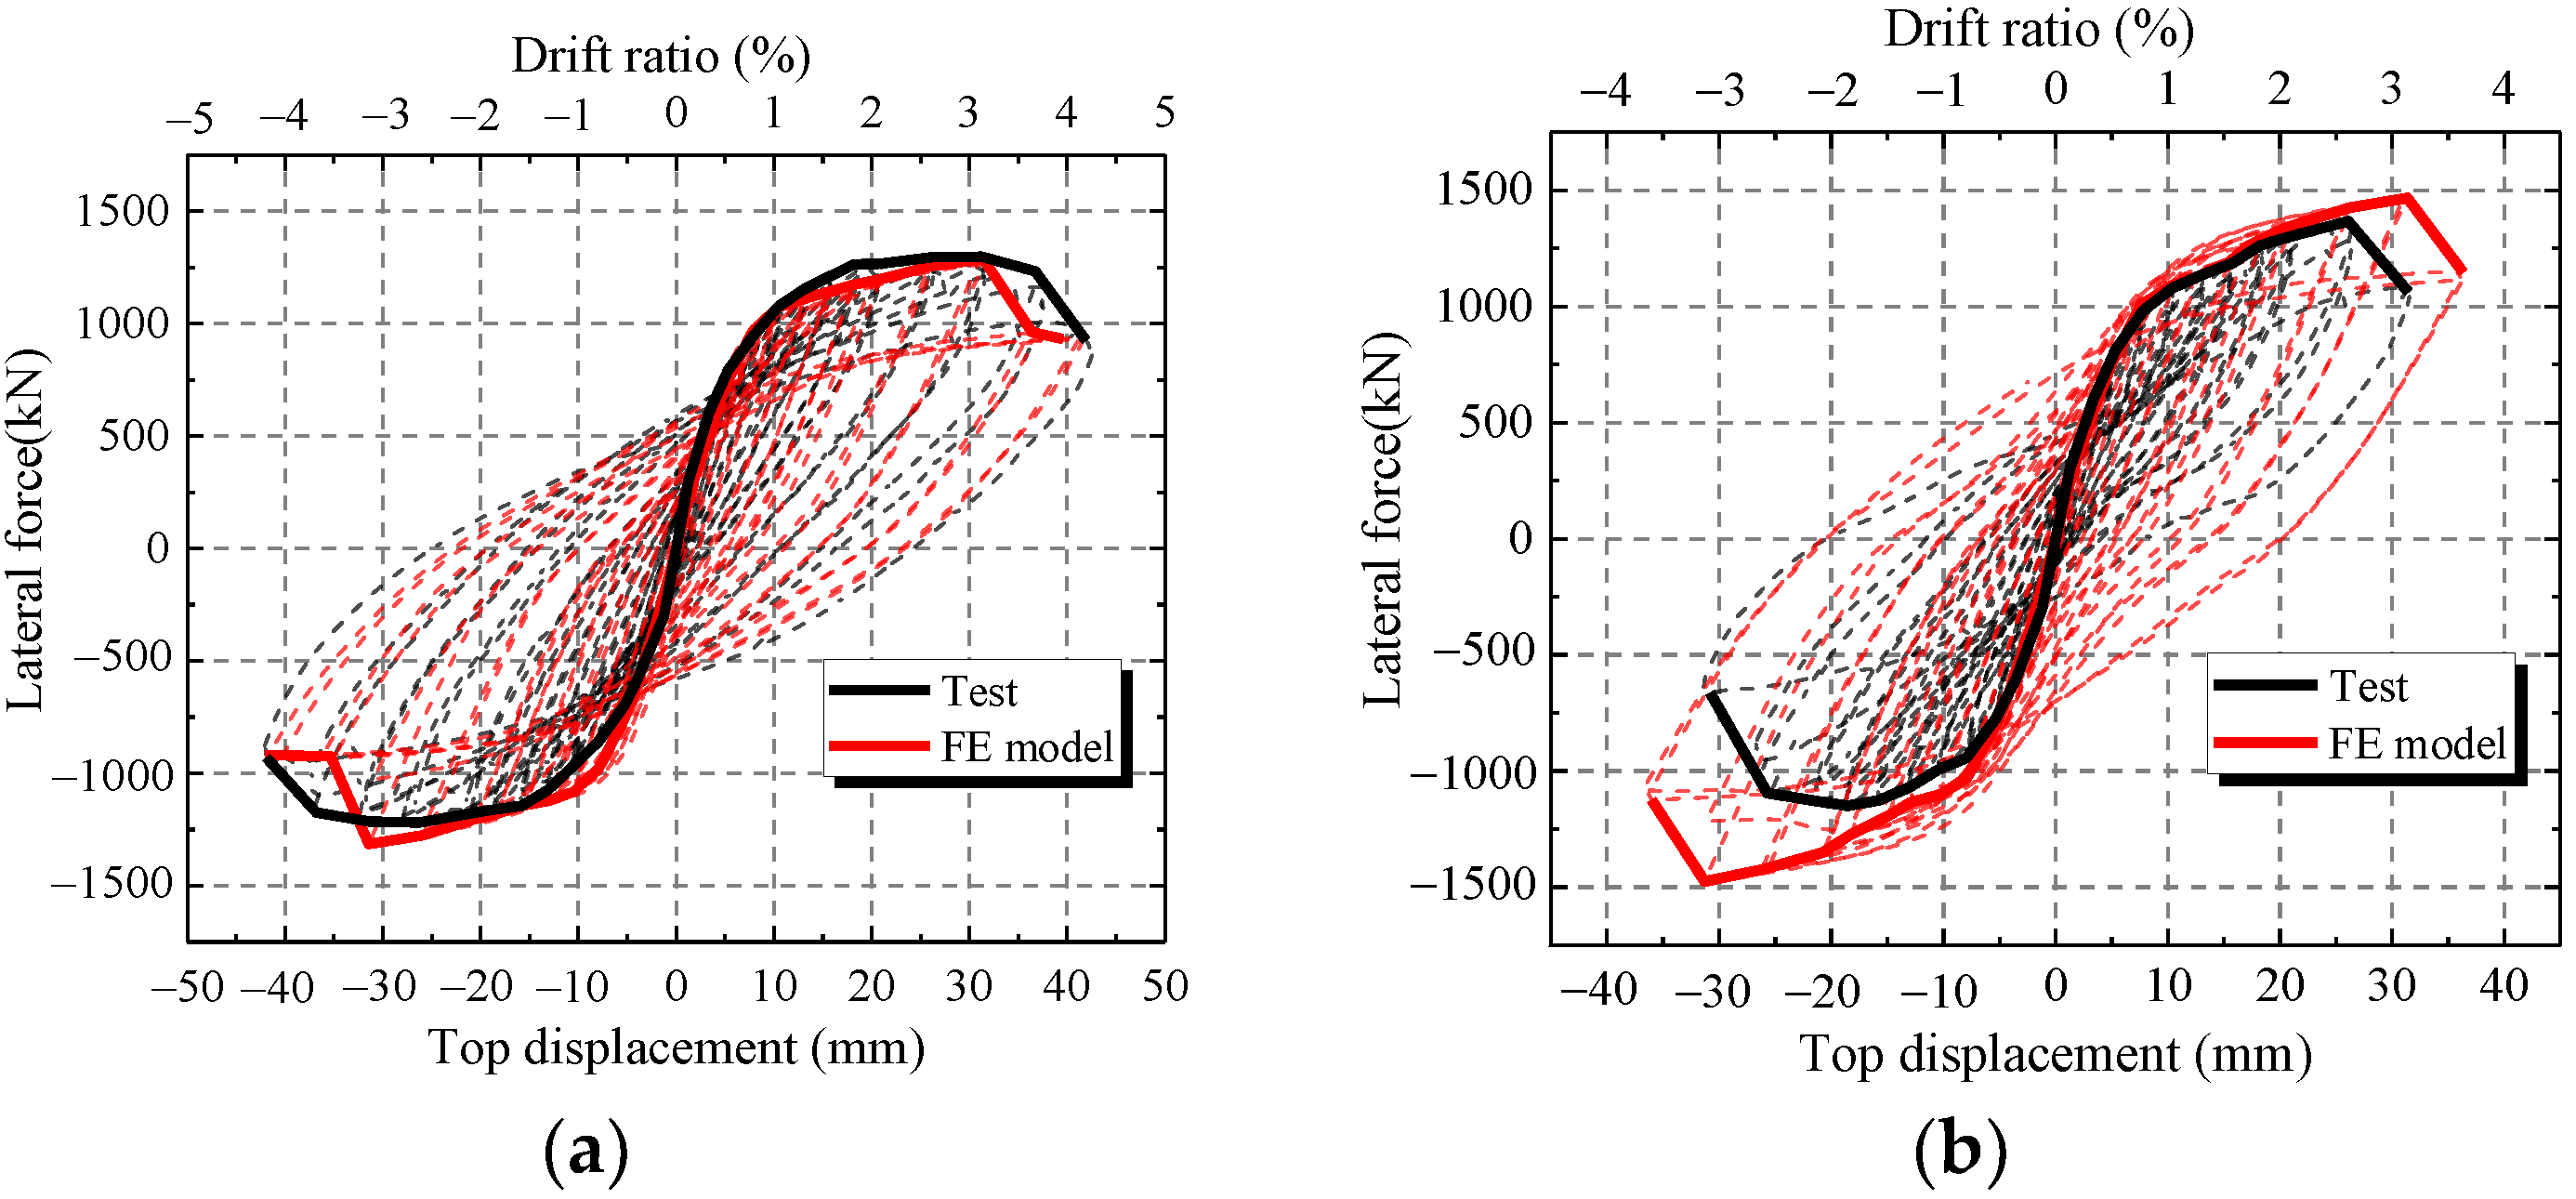
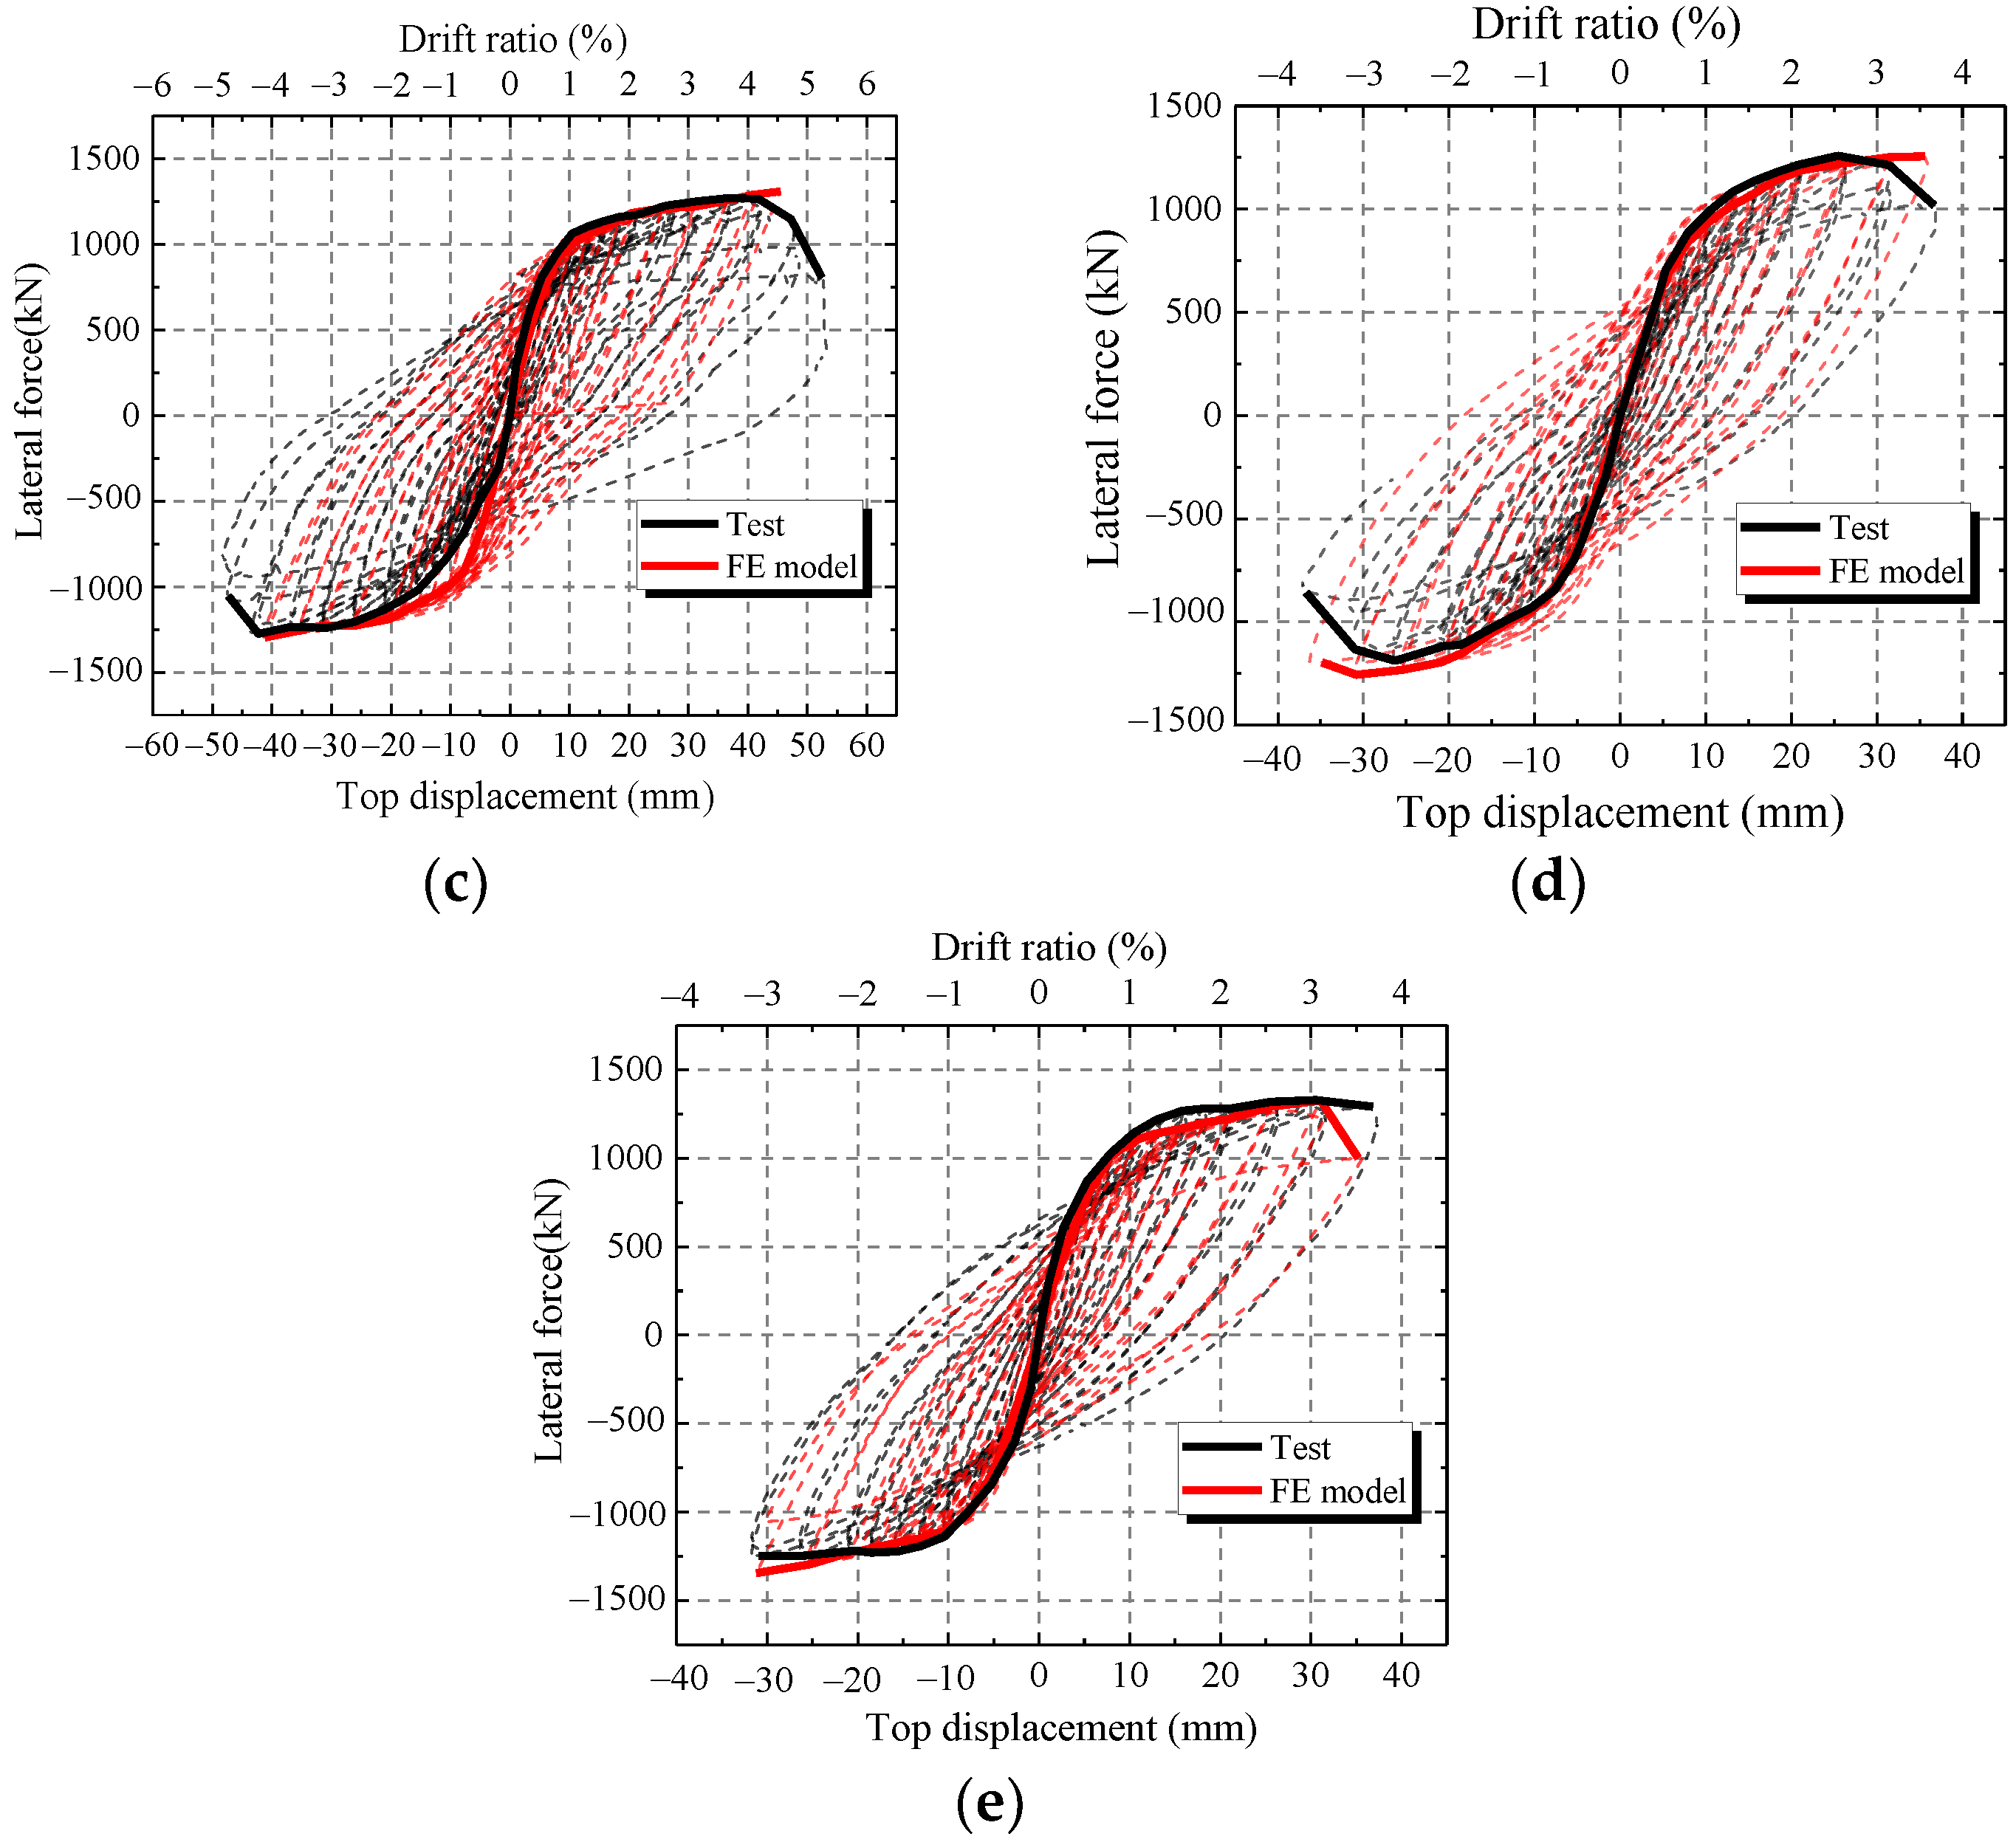
4. Validation of FE Models and Analysis of Results
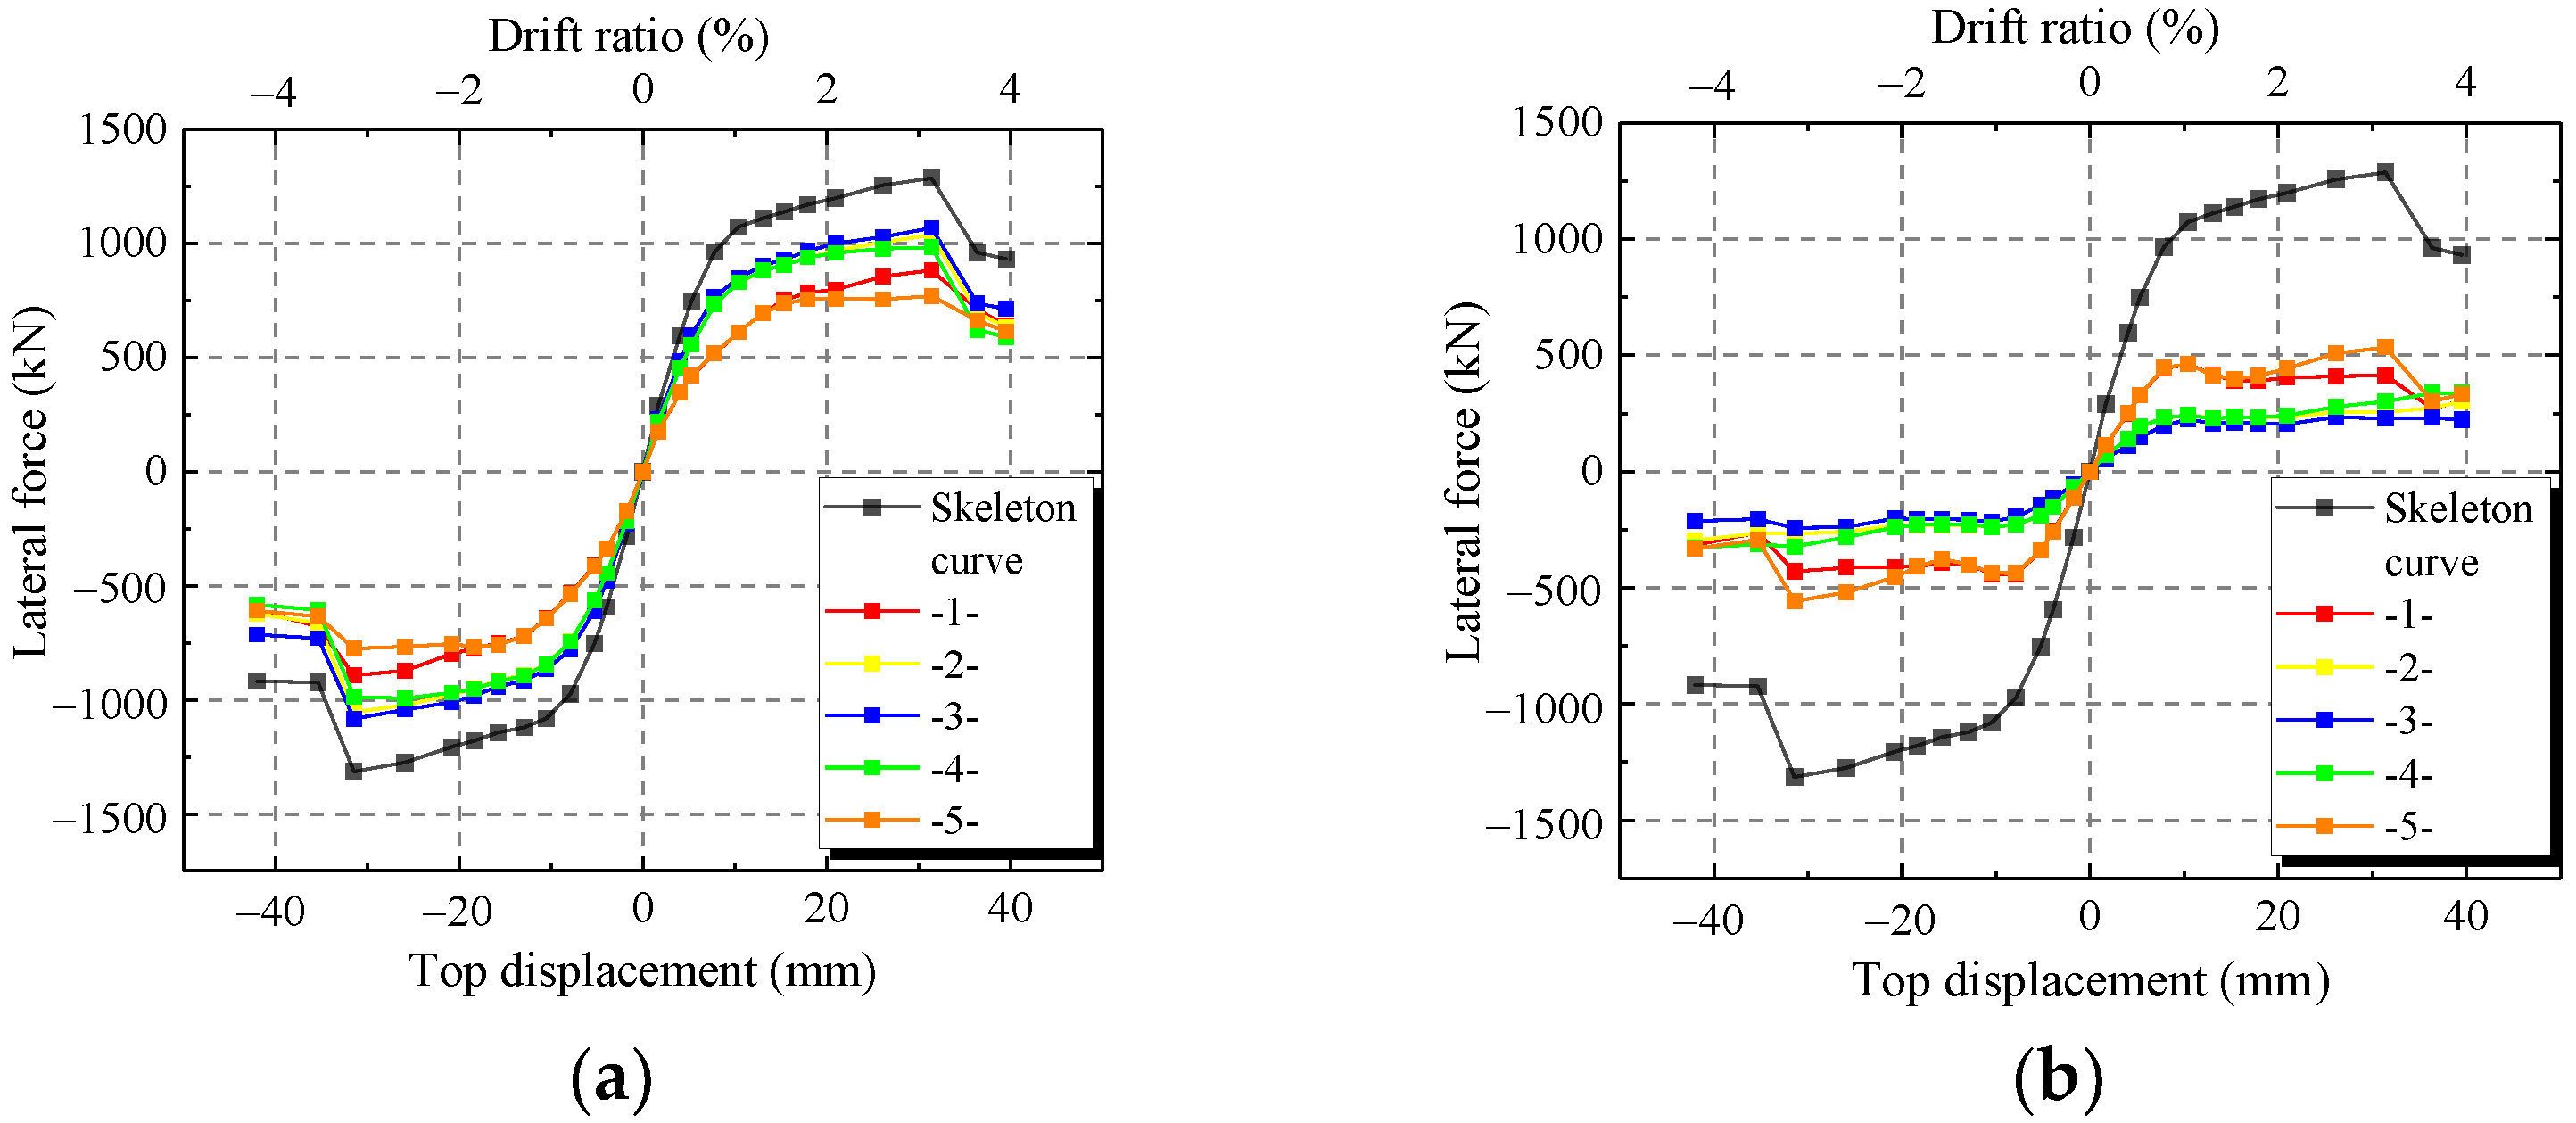
4.1. Force-Displacement Curve
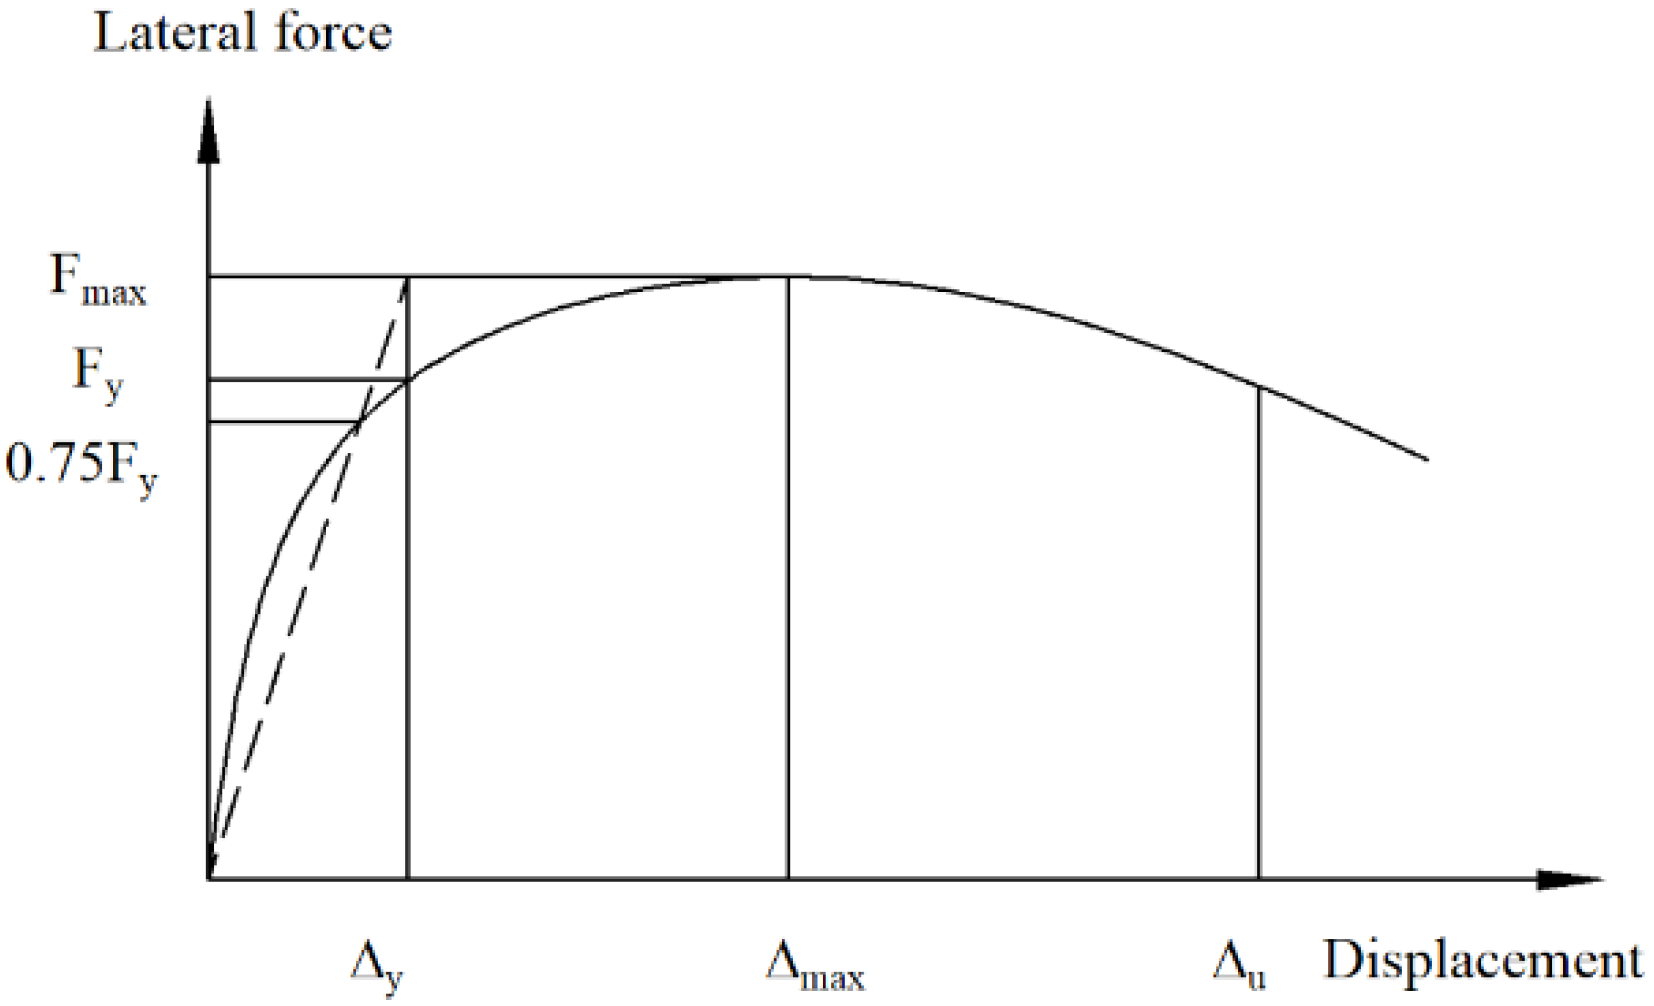
4.2. Characteristic Parameters
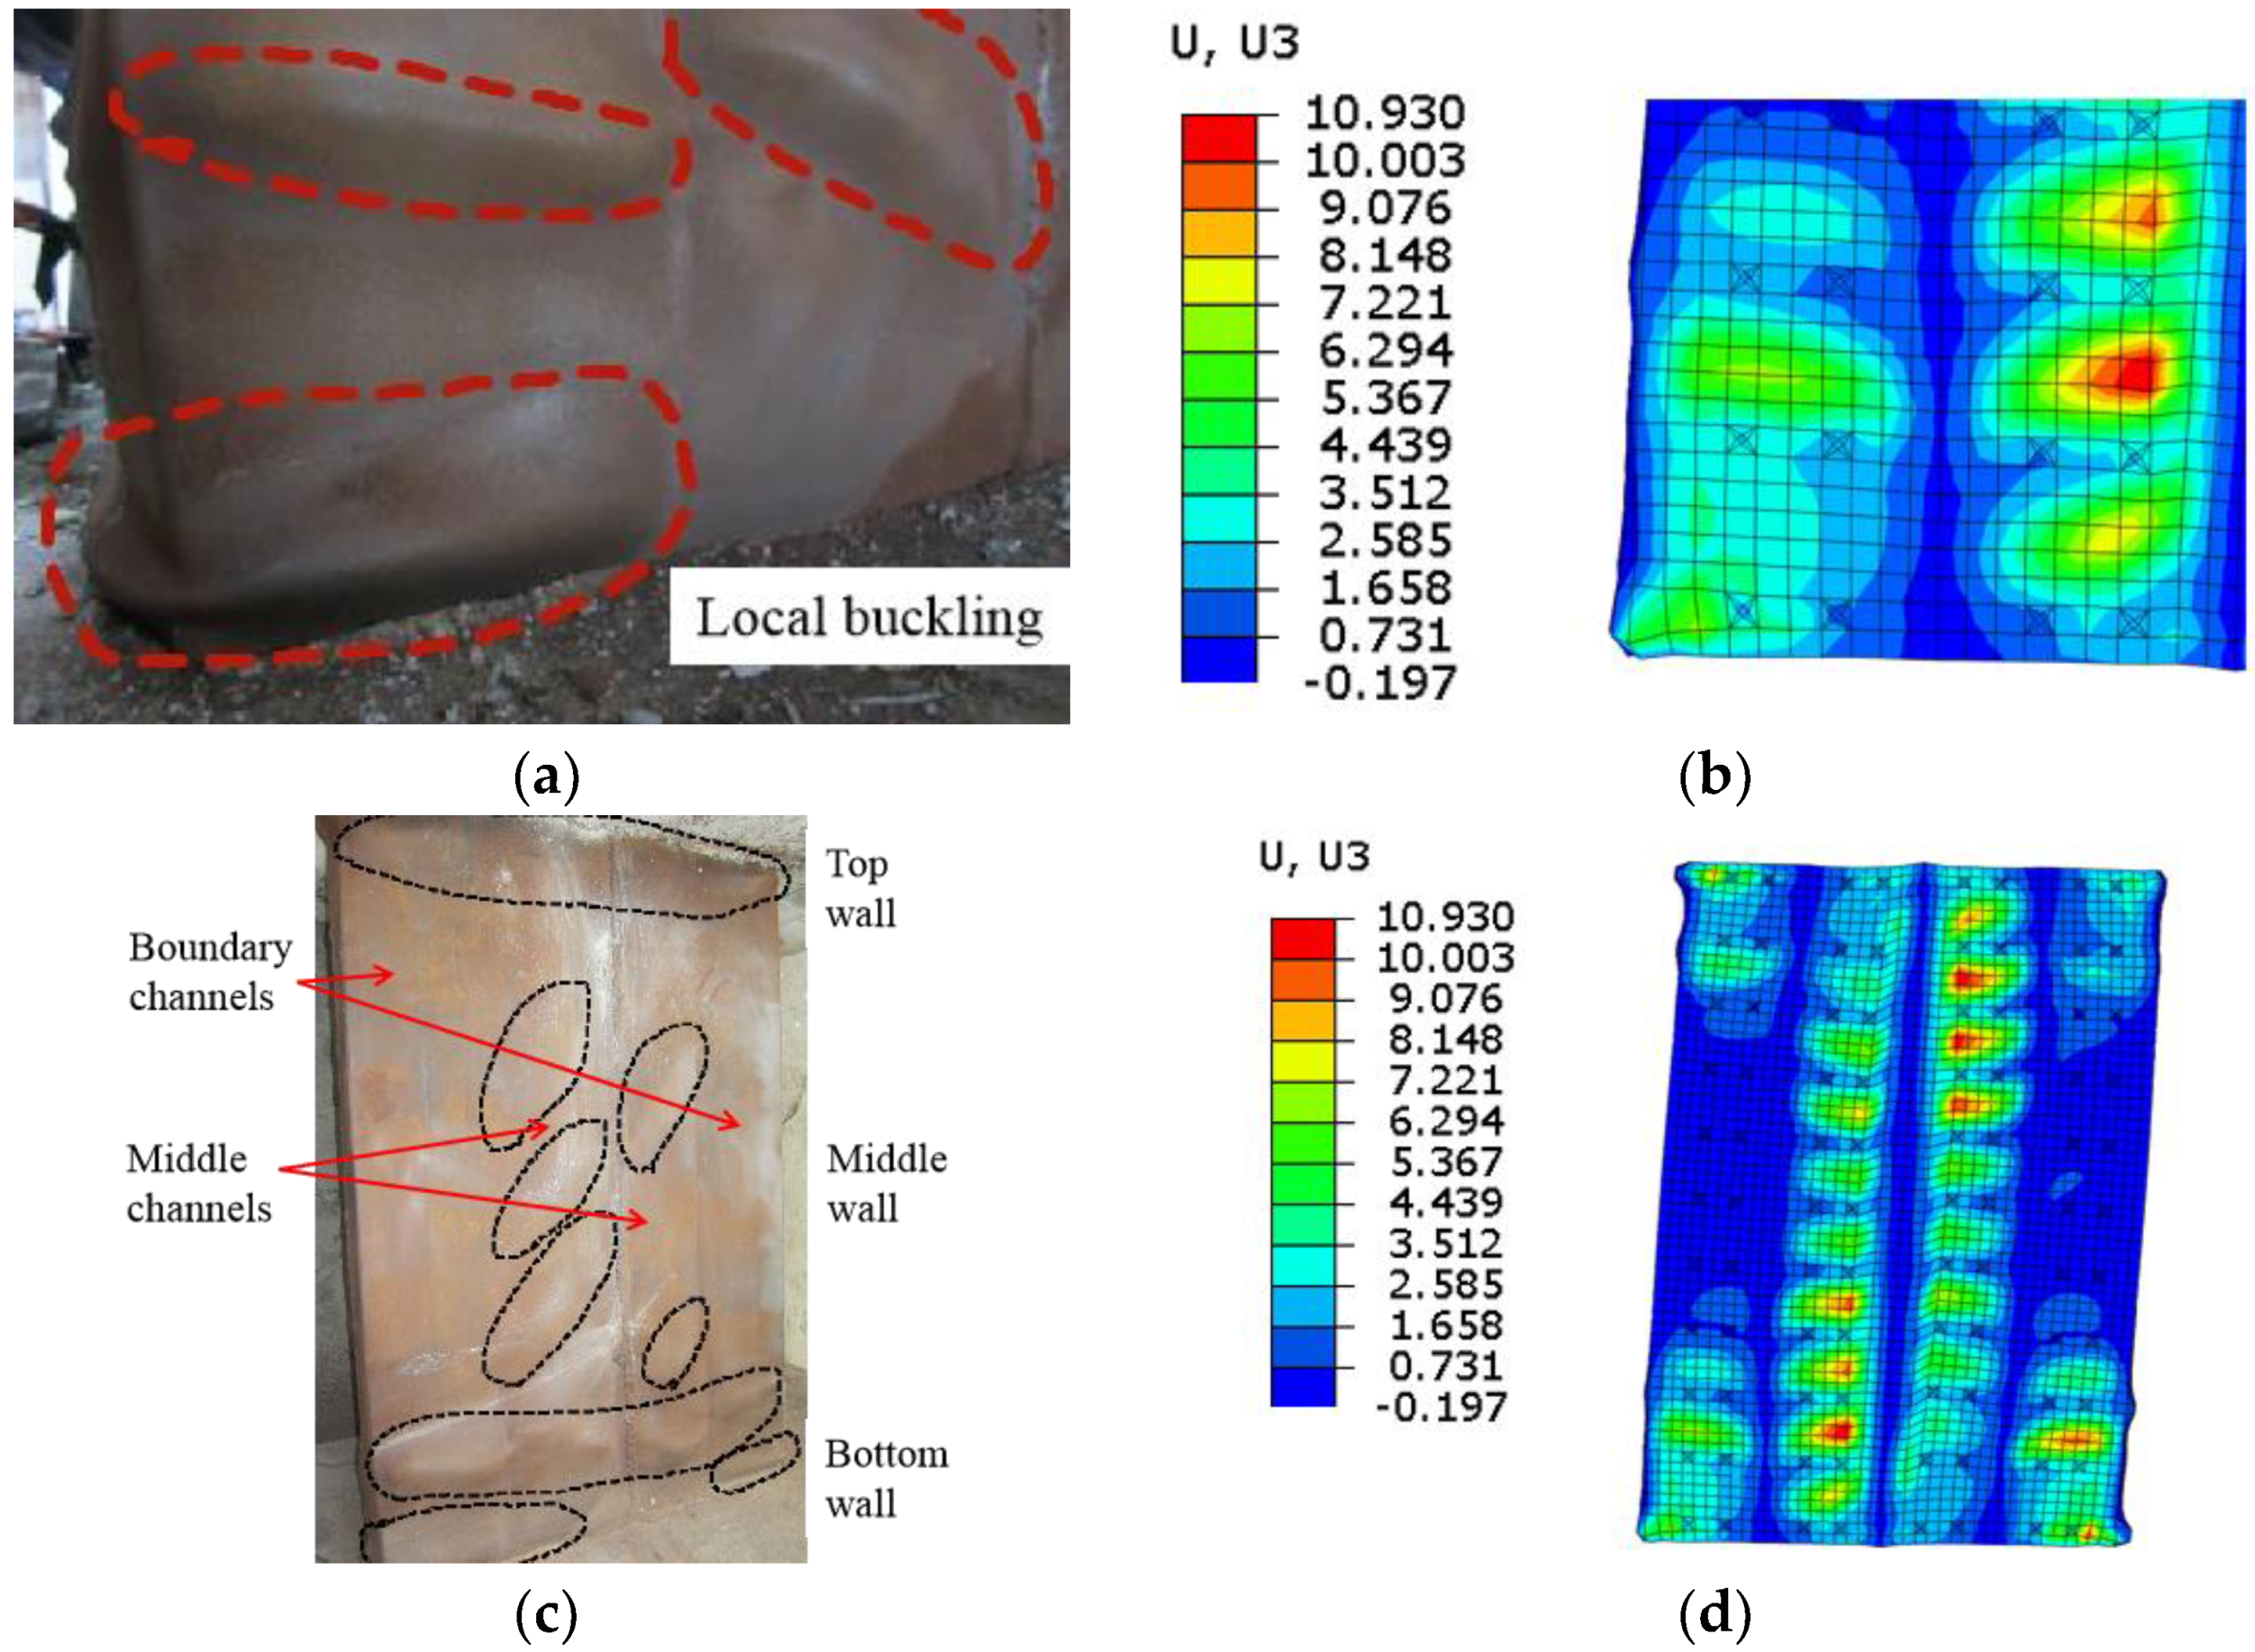
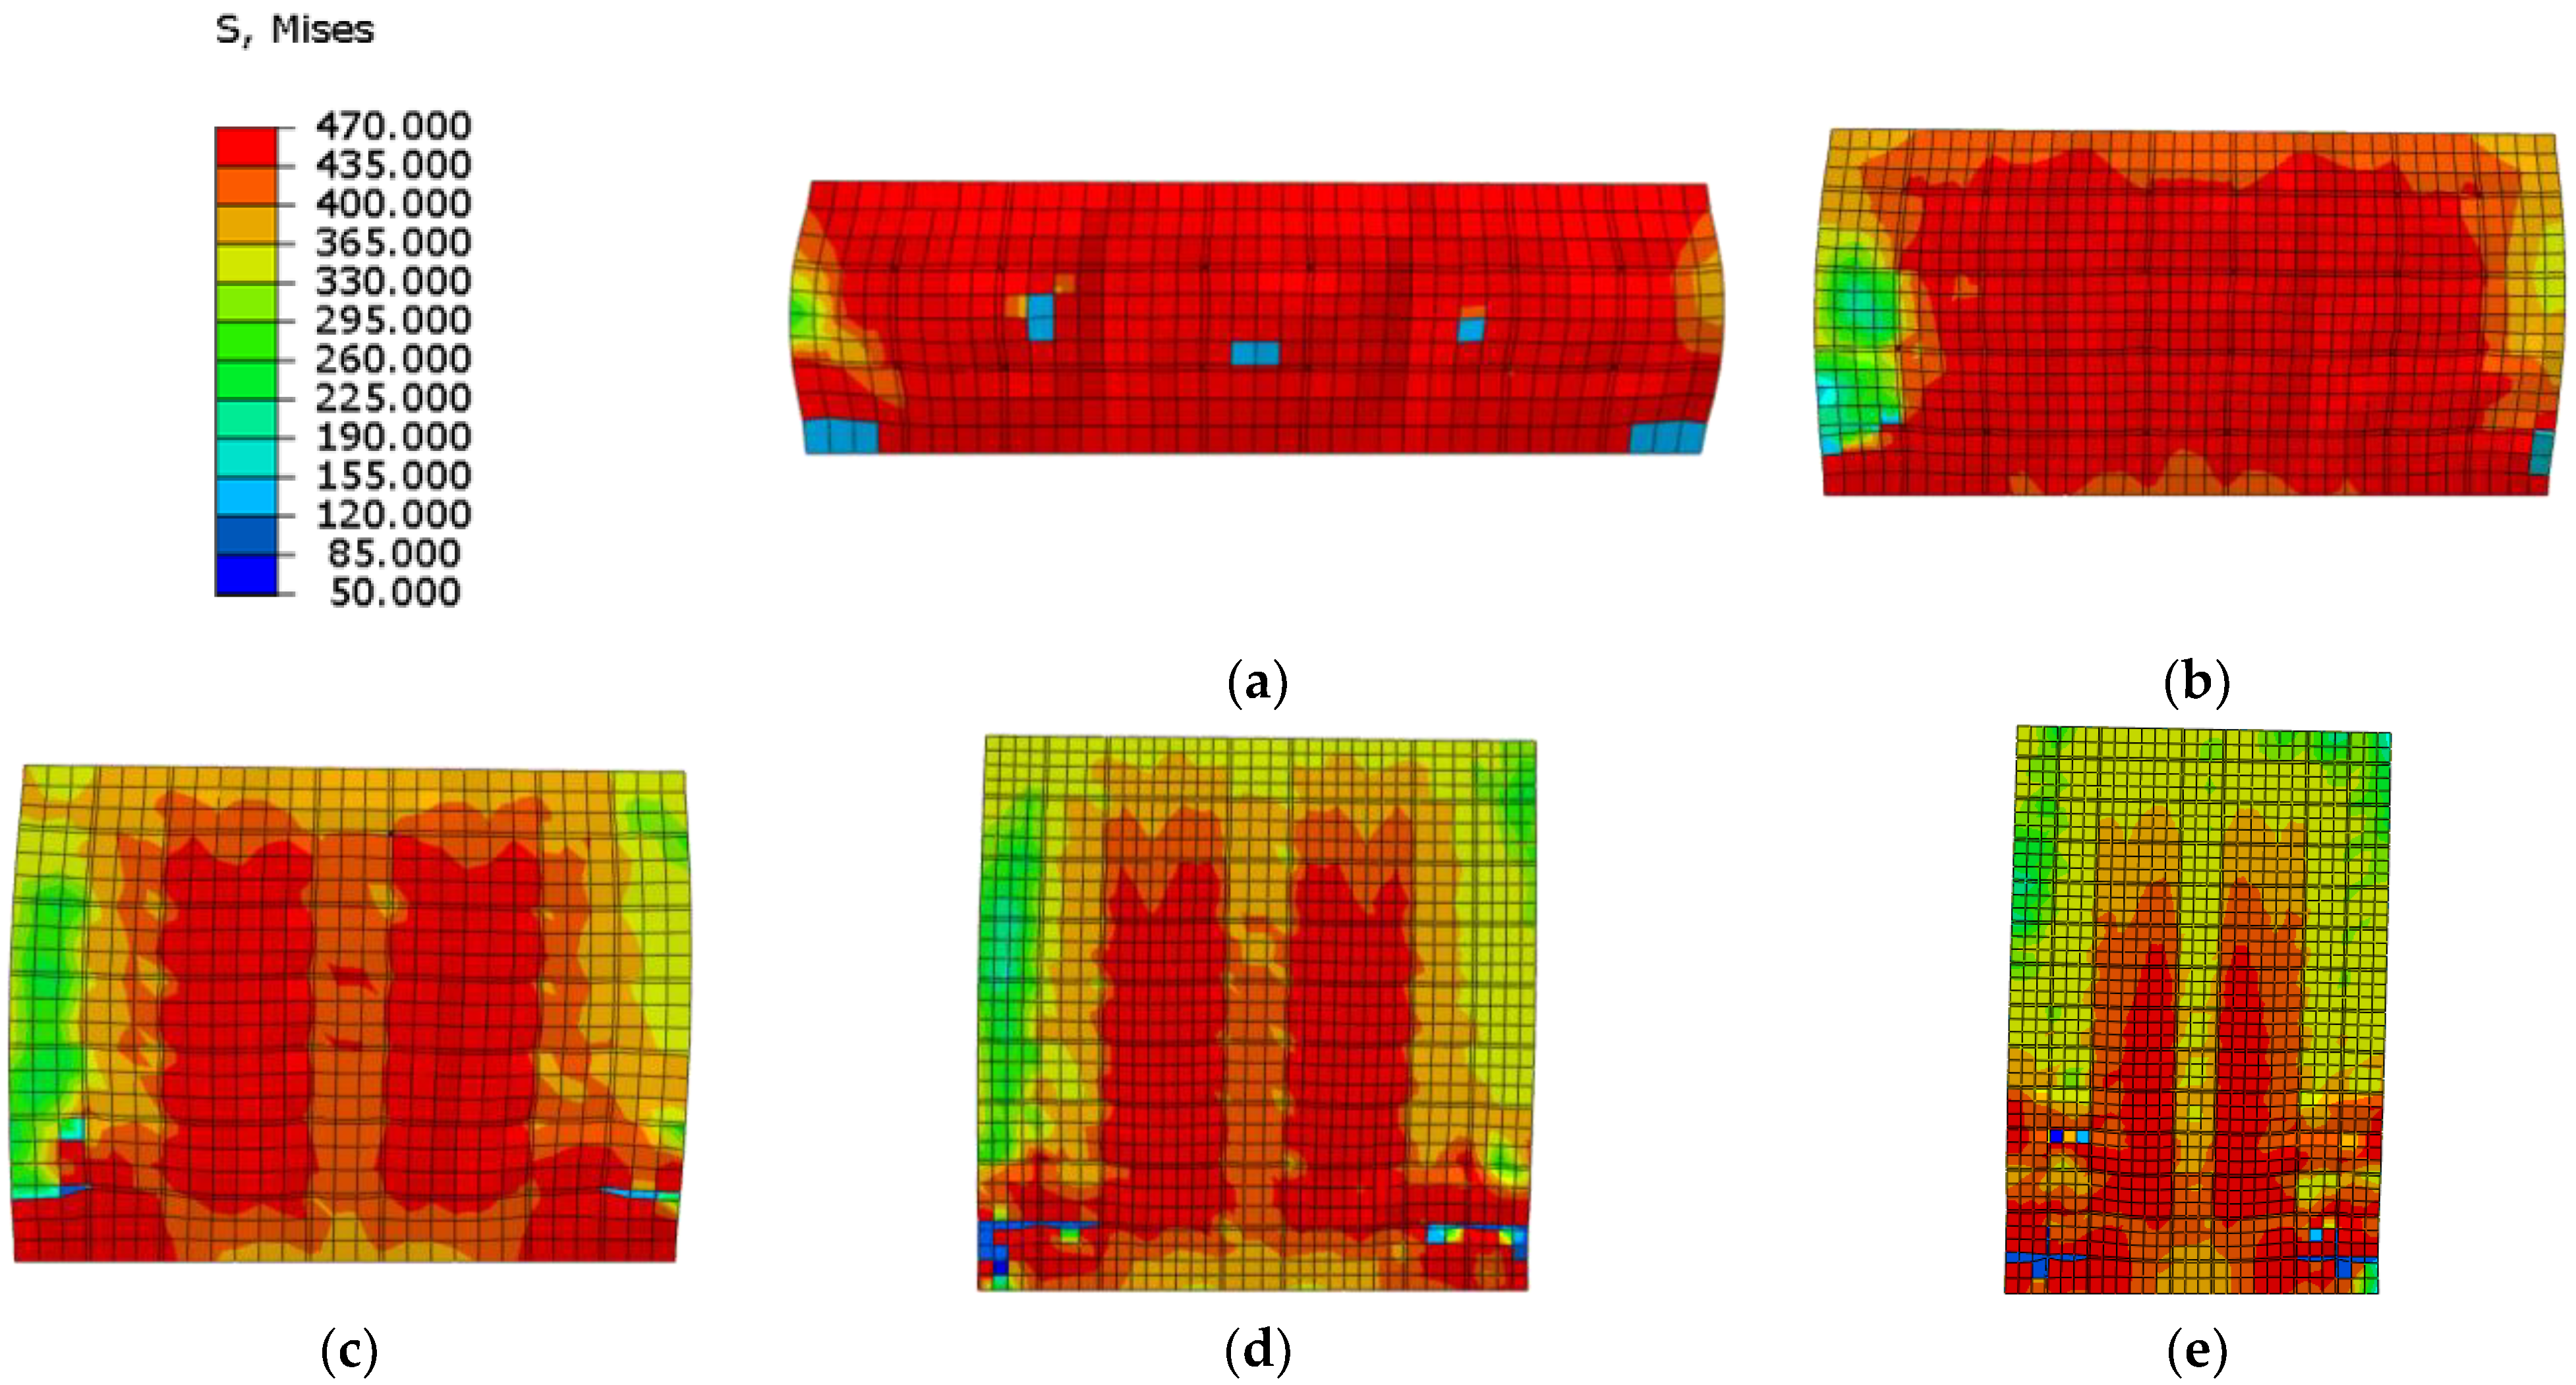
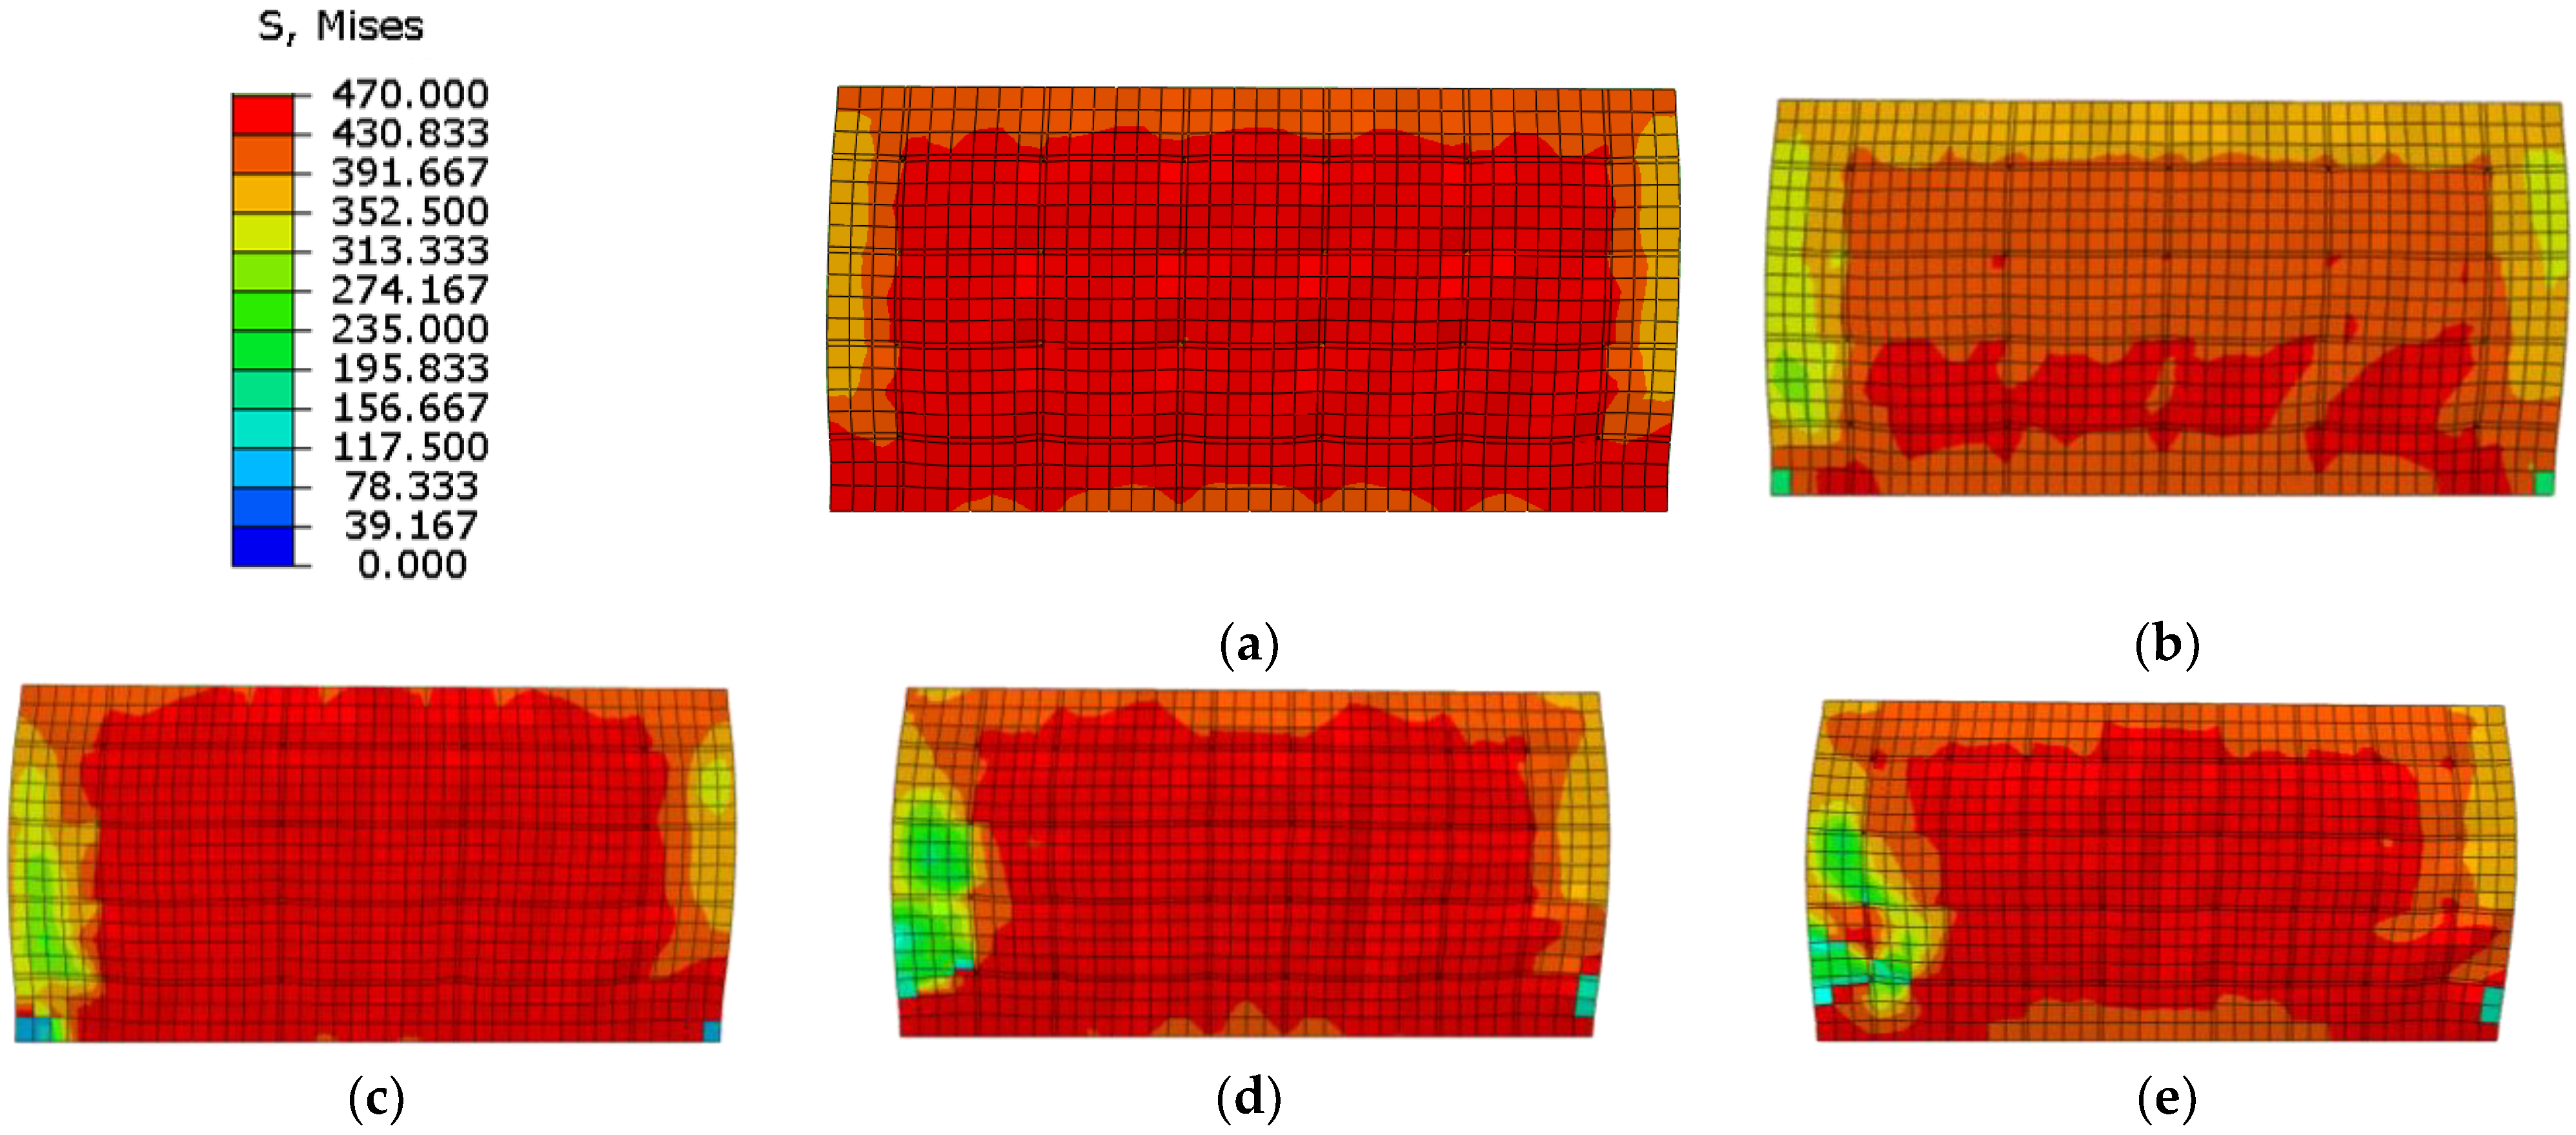
4.3. Failure Damage
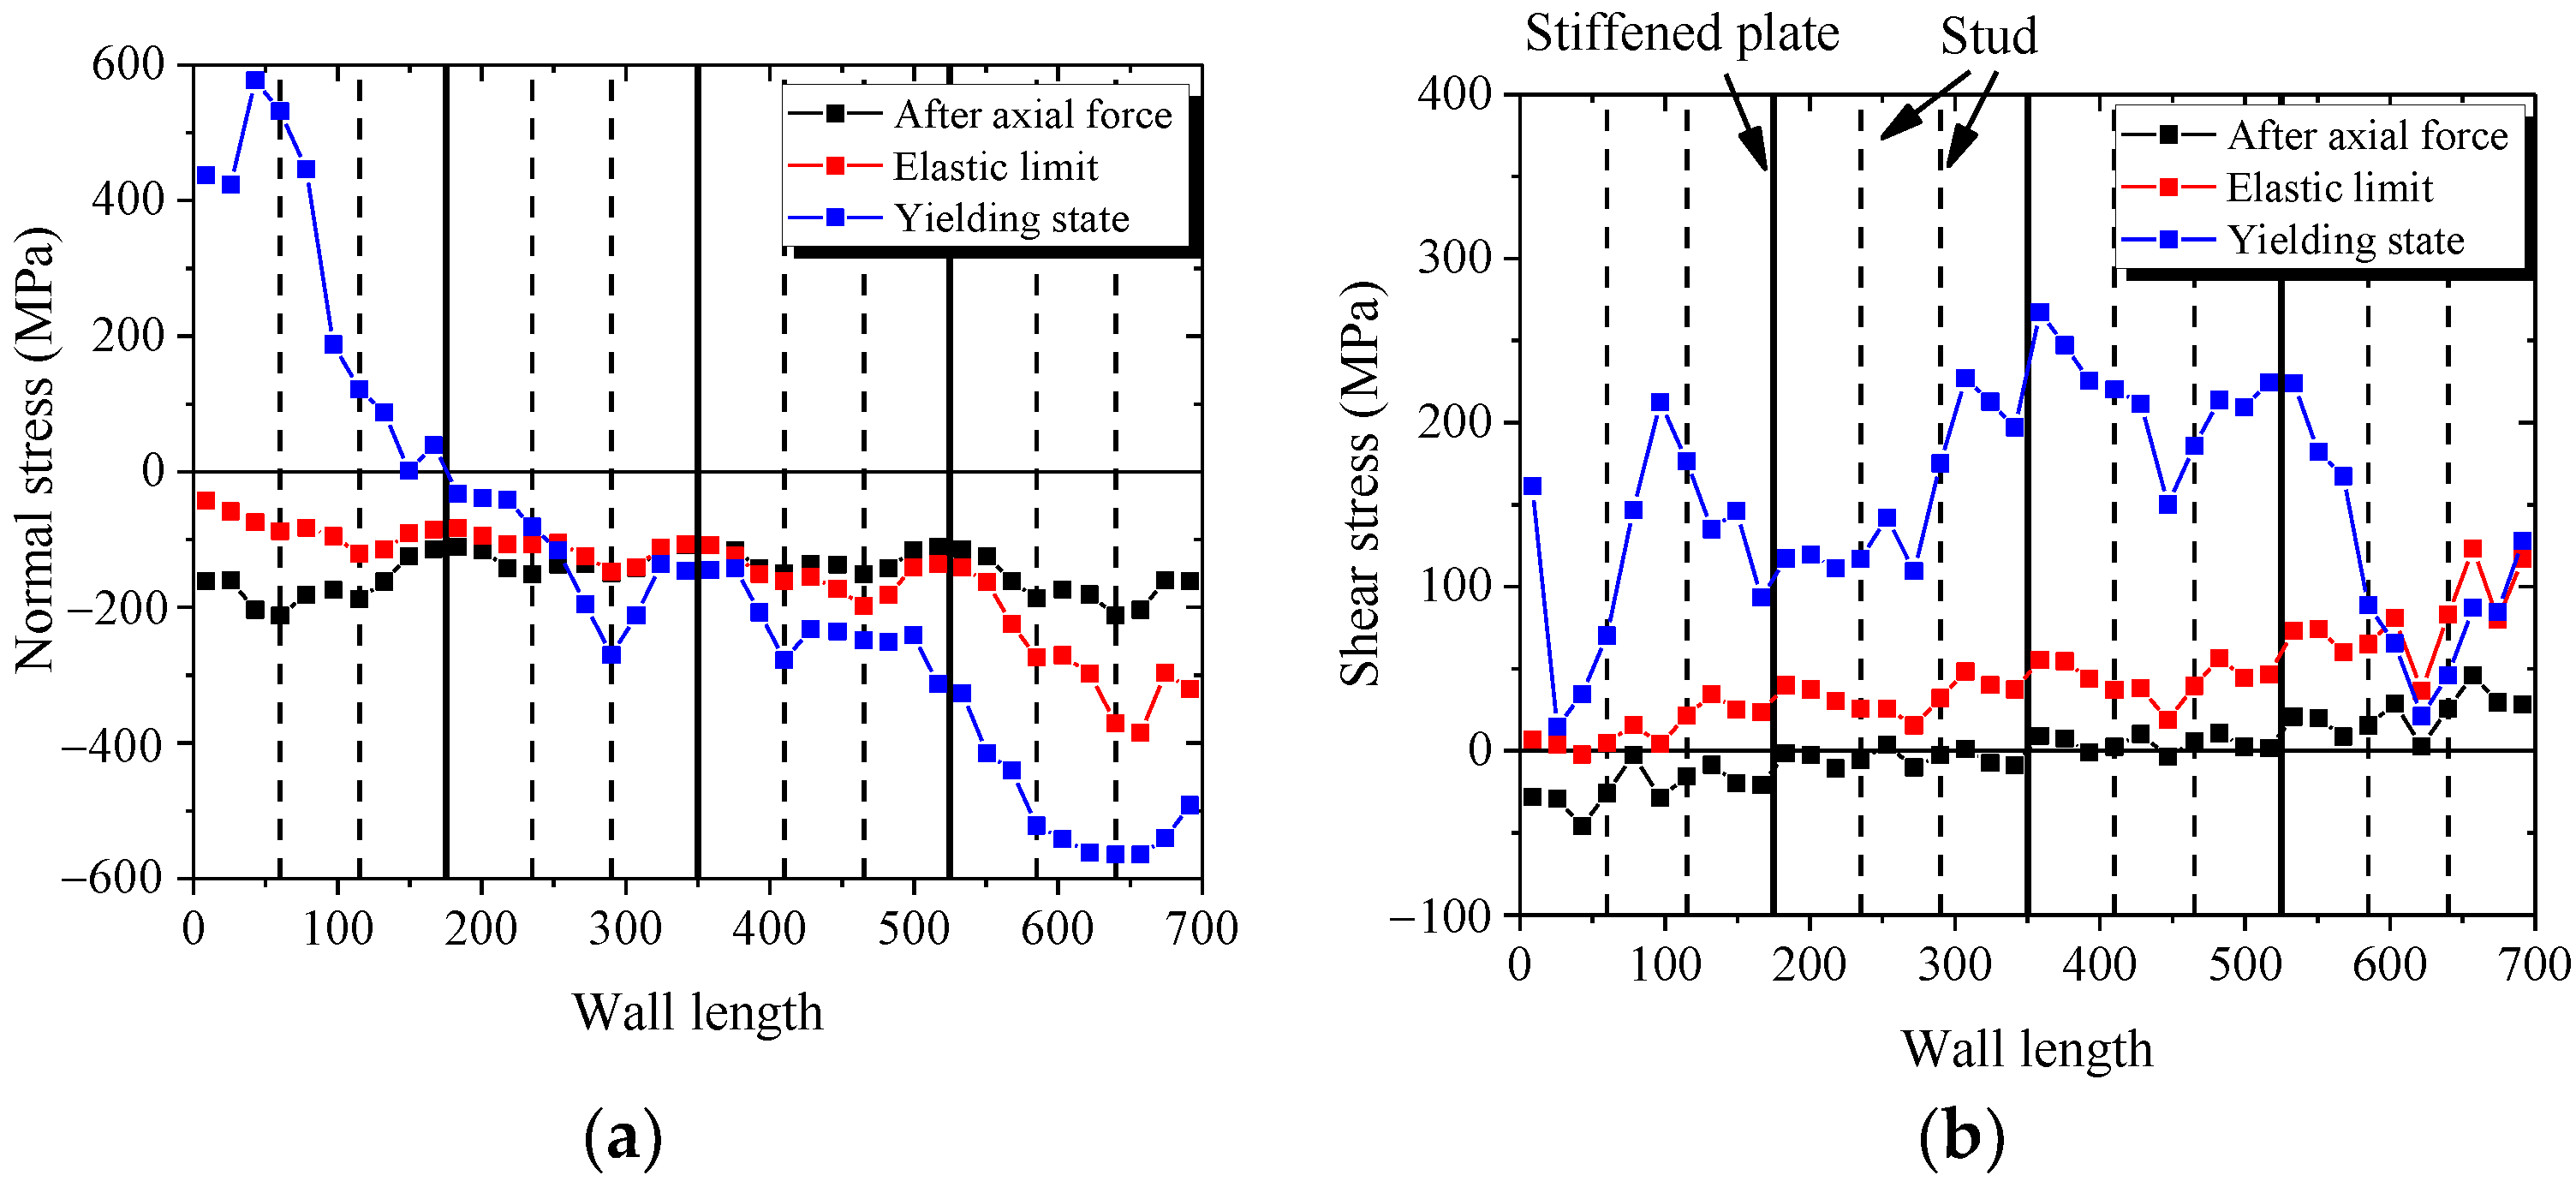
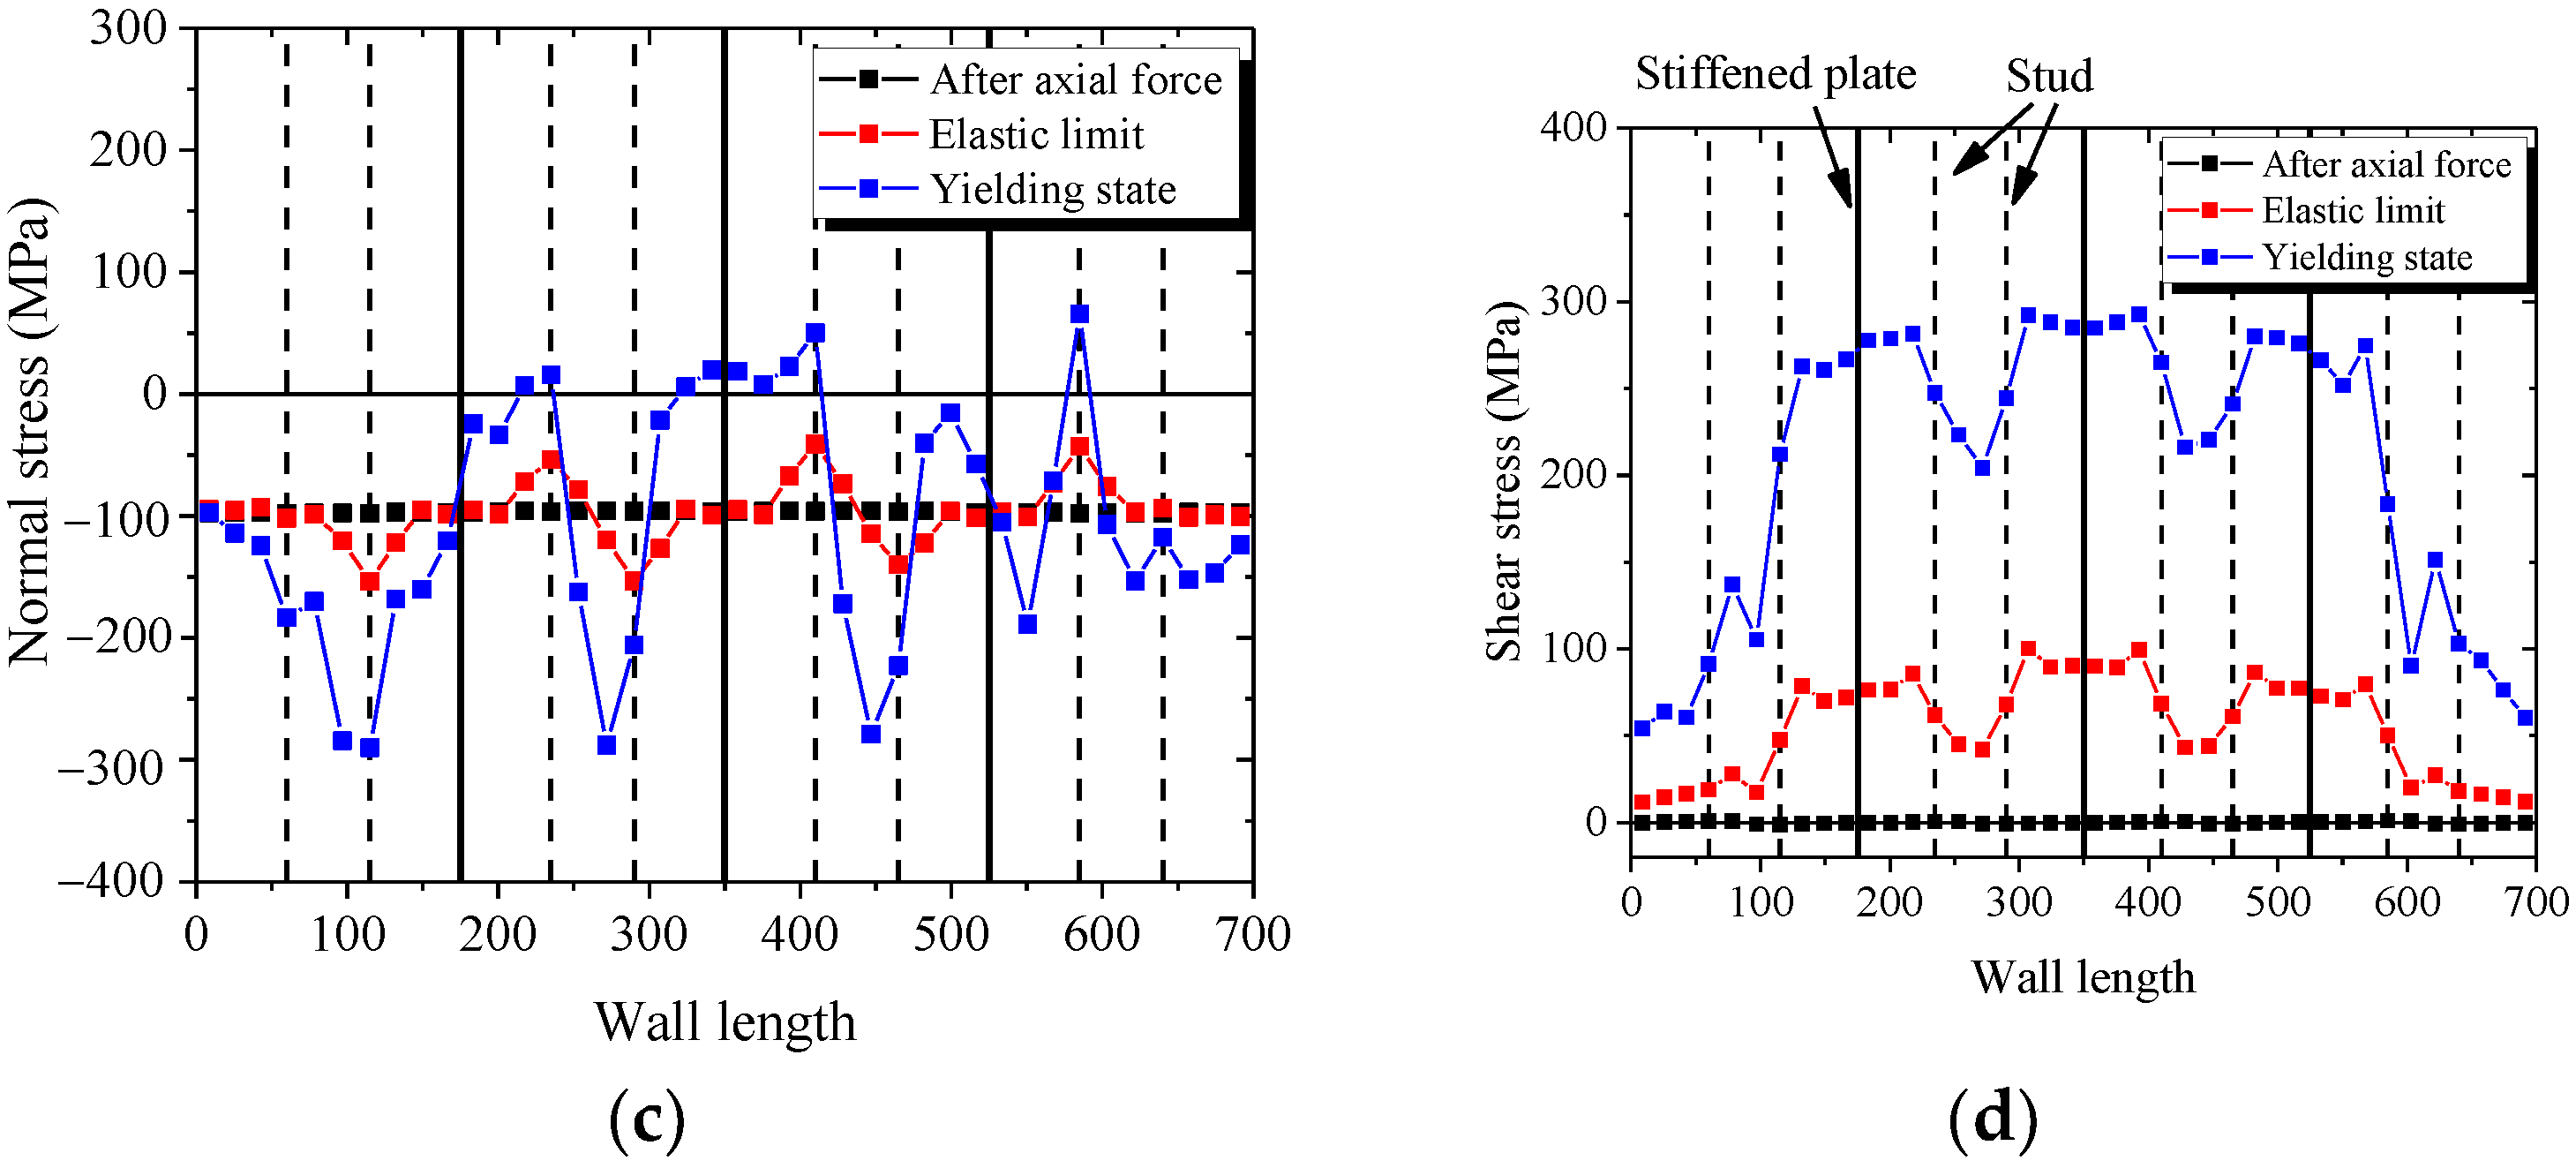
4.4. Mechanical Mechanism and Stress-Strain Analysis
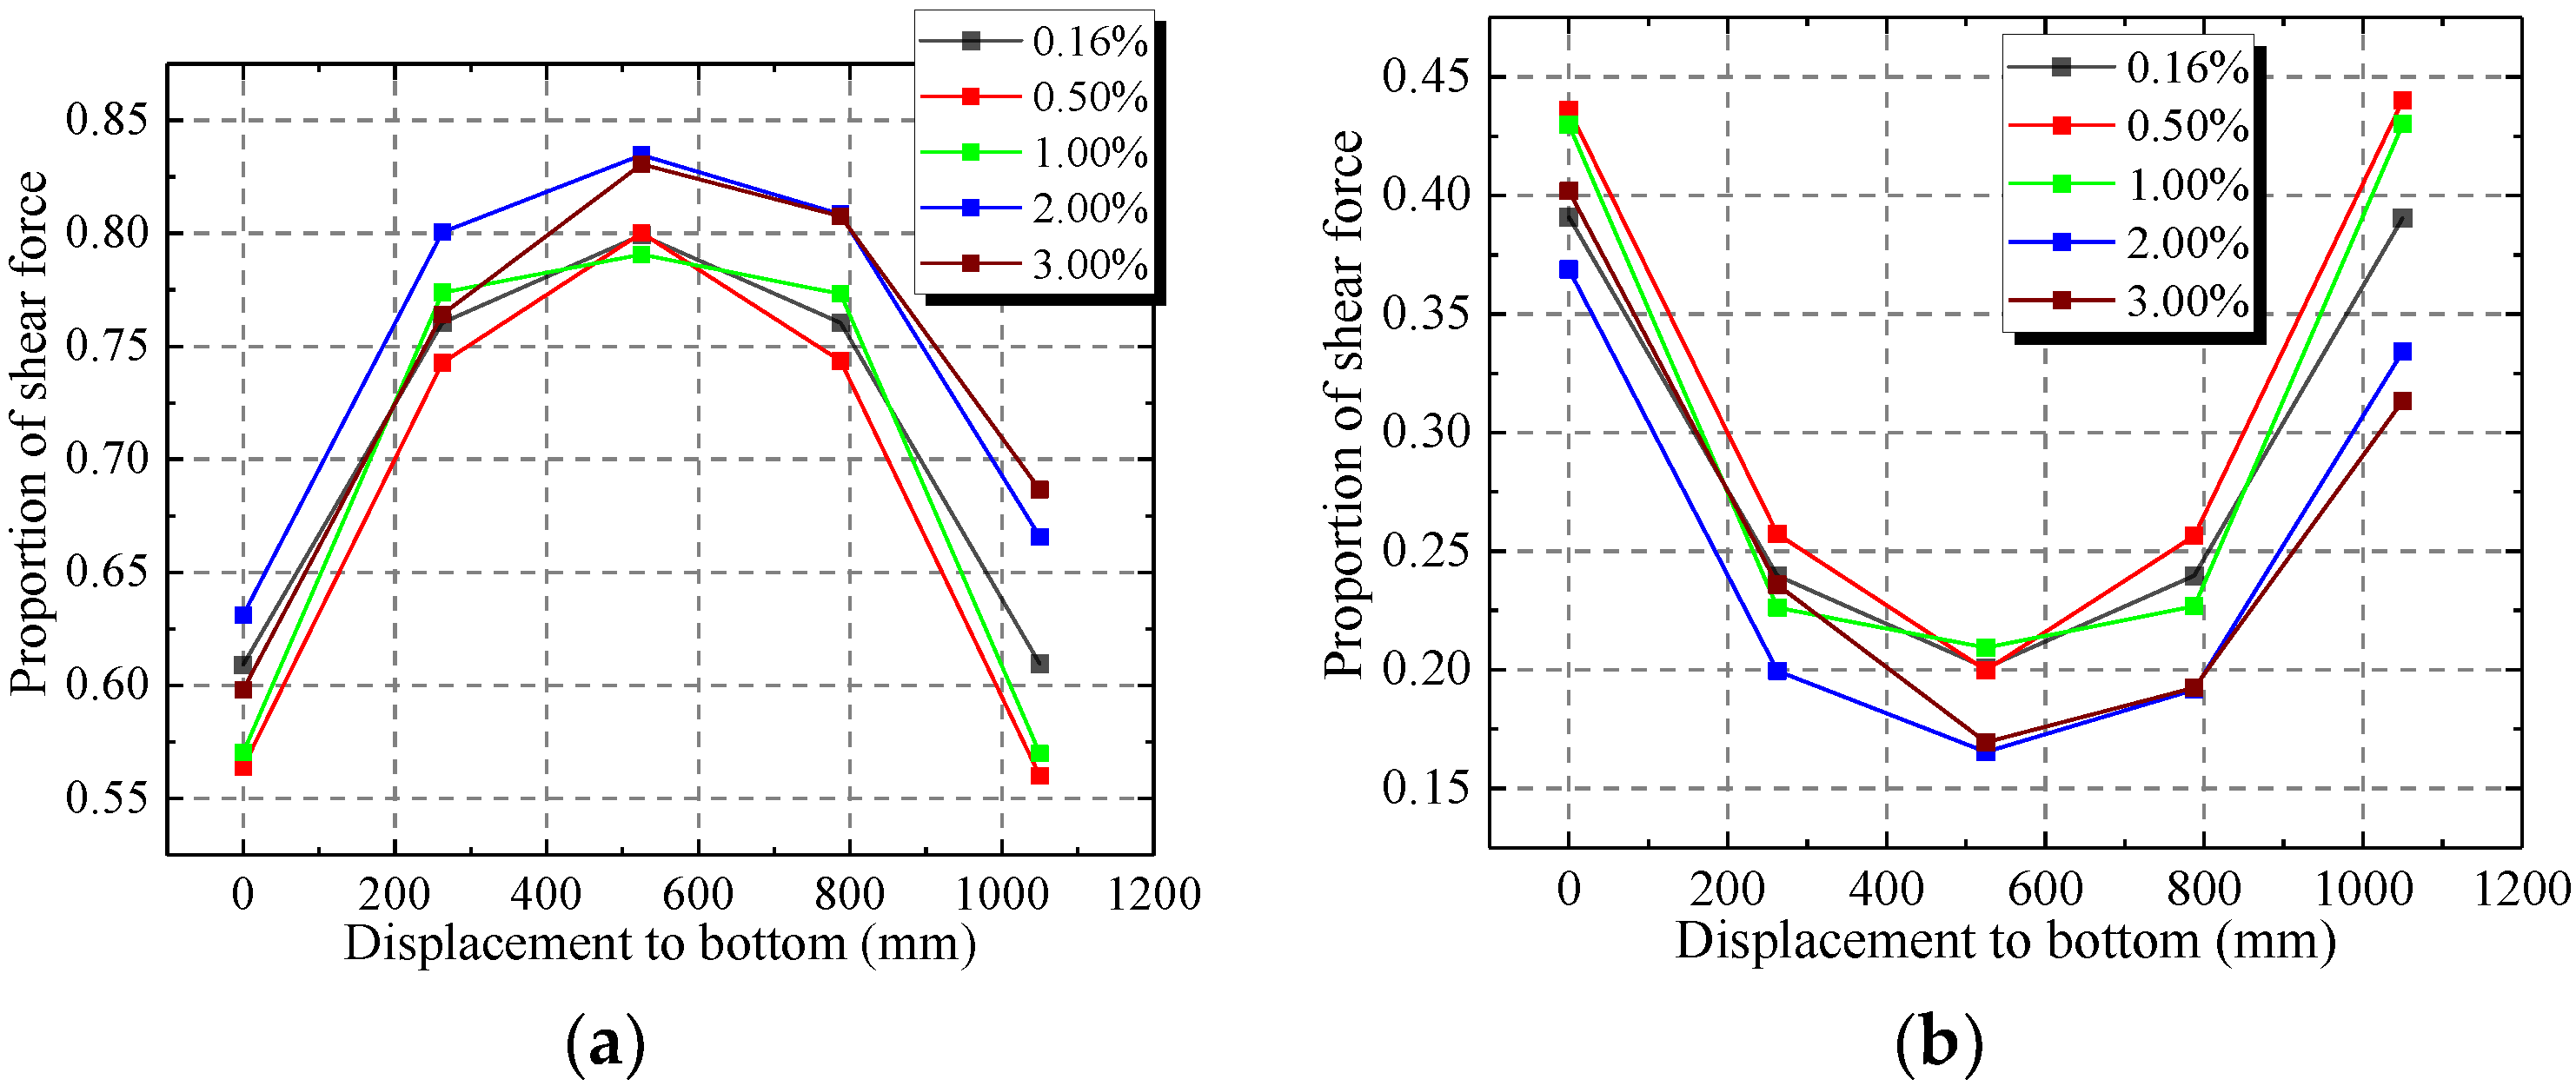
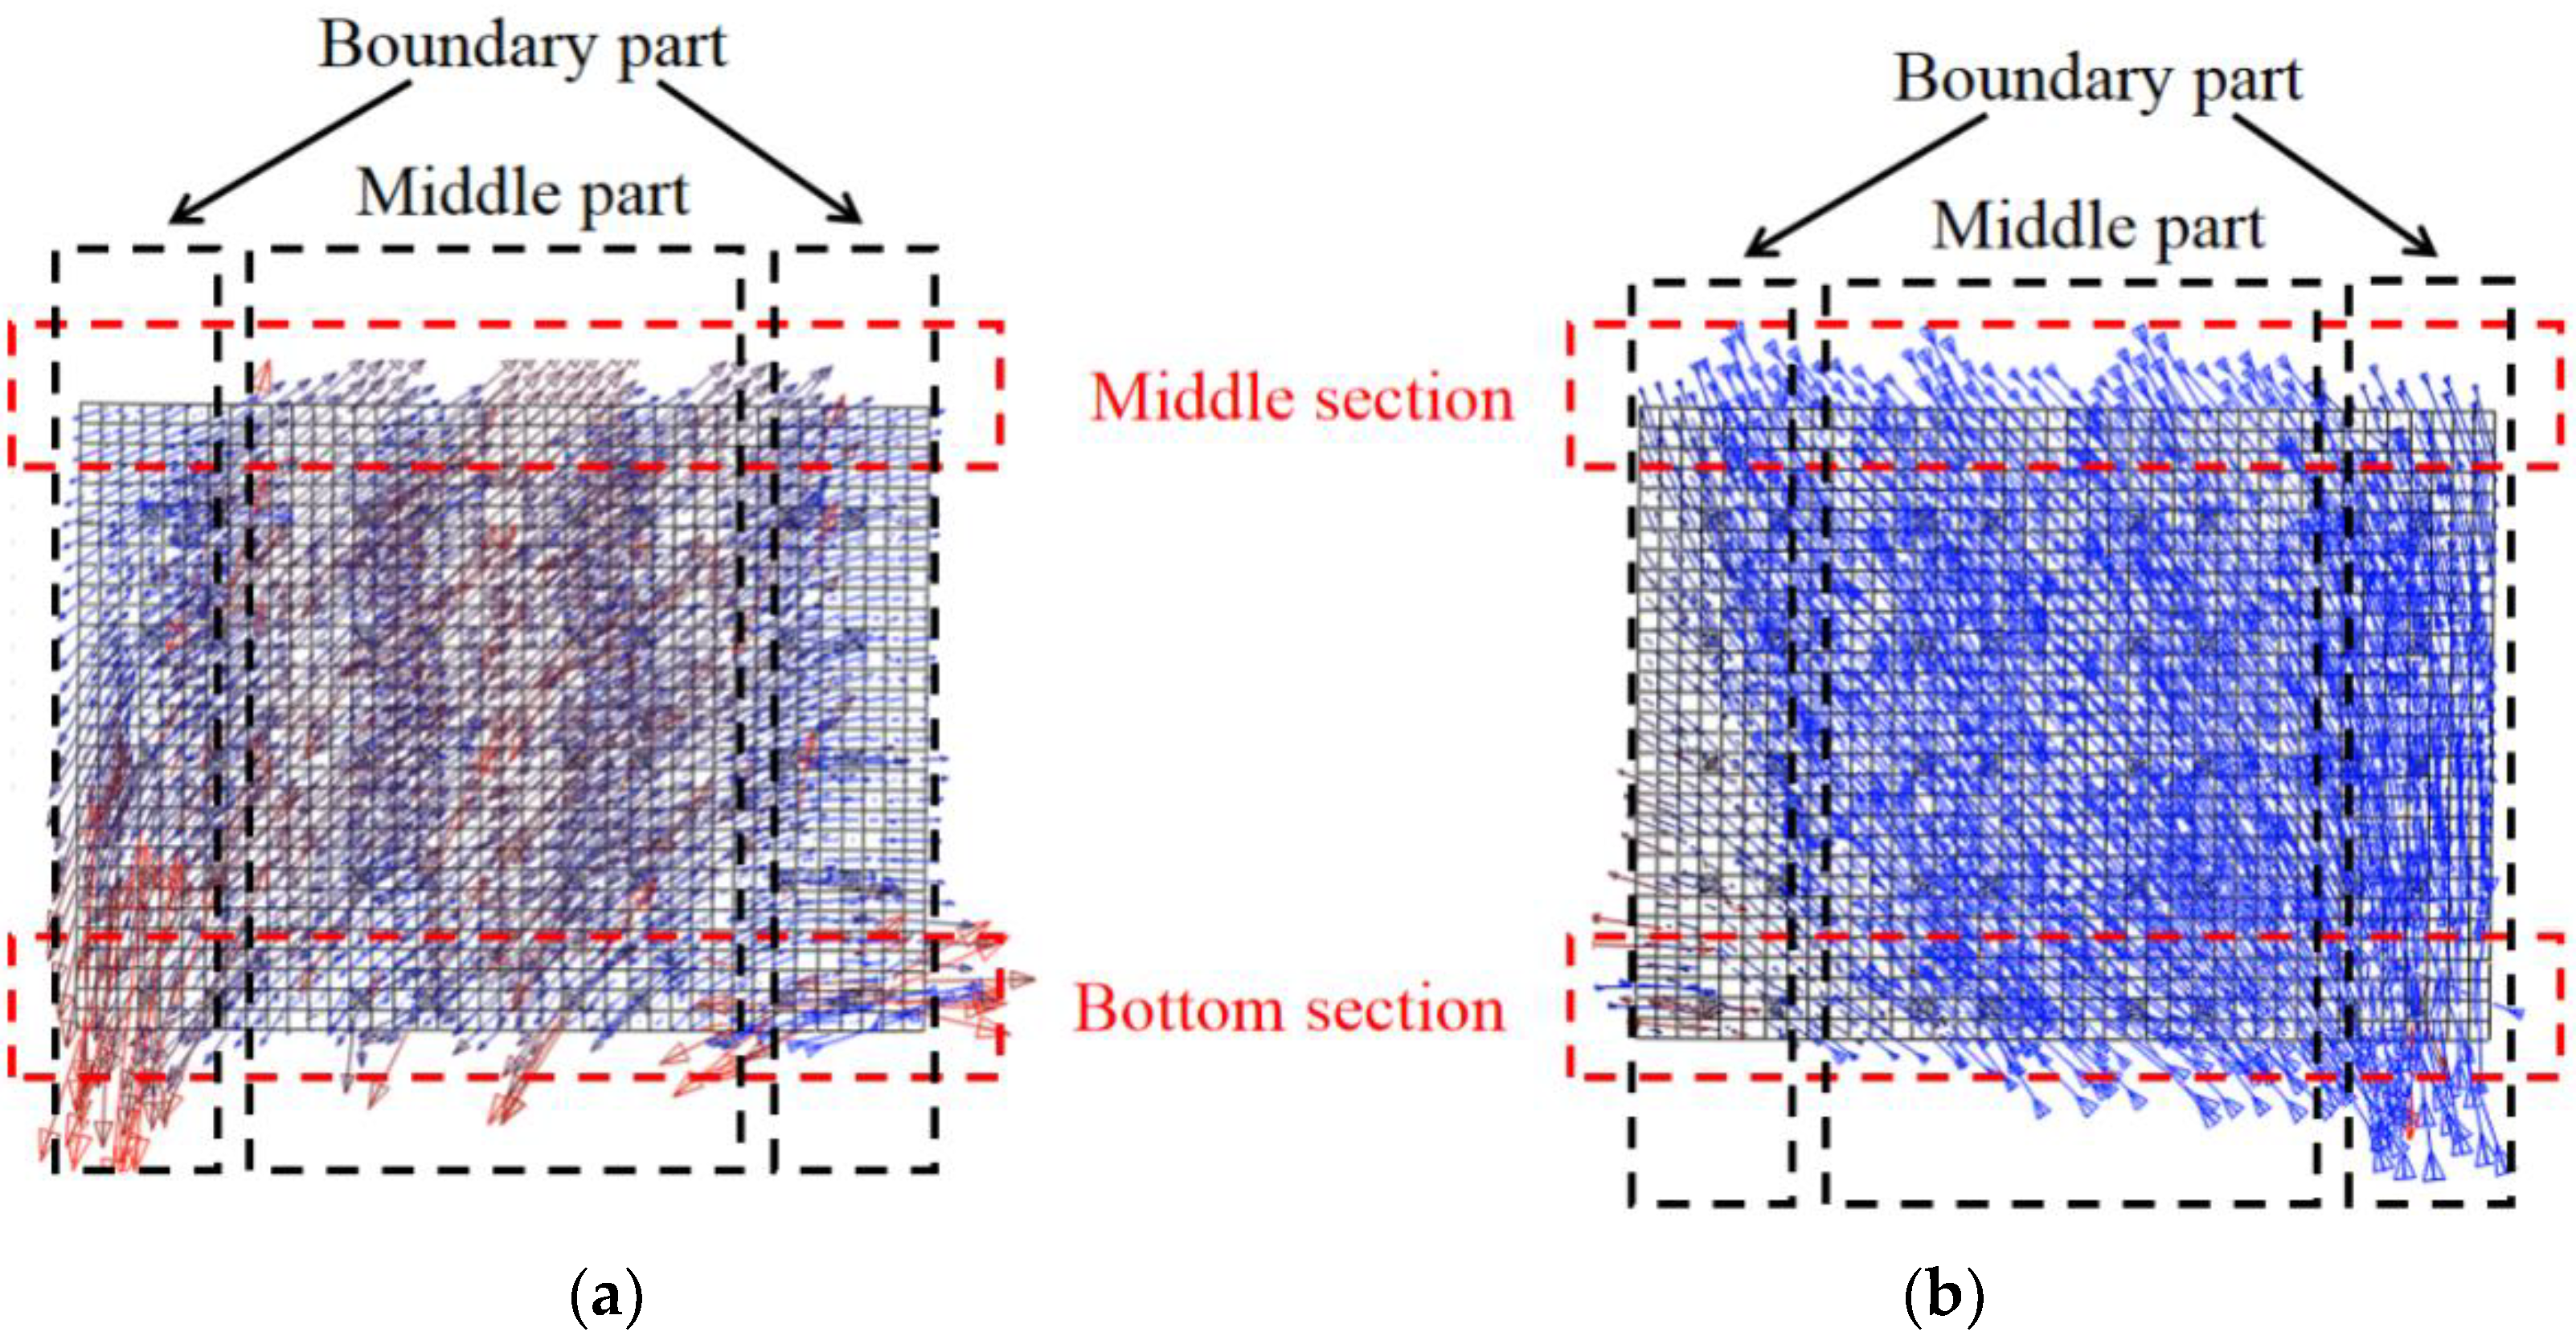
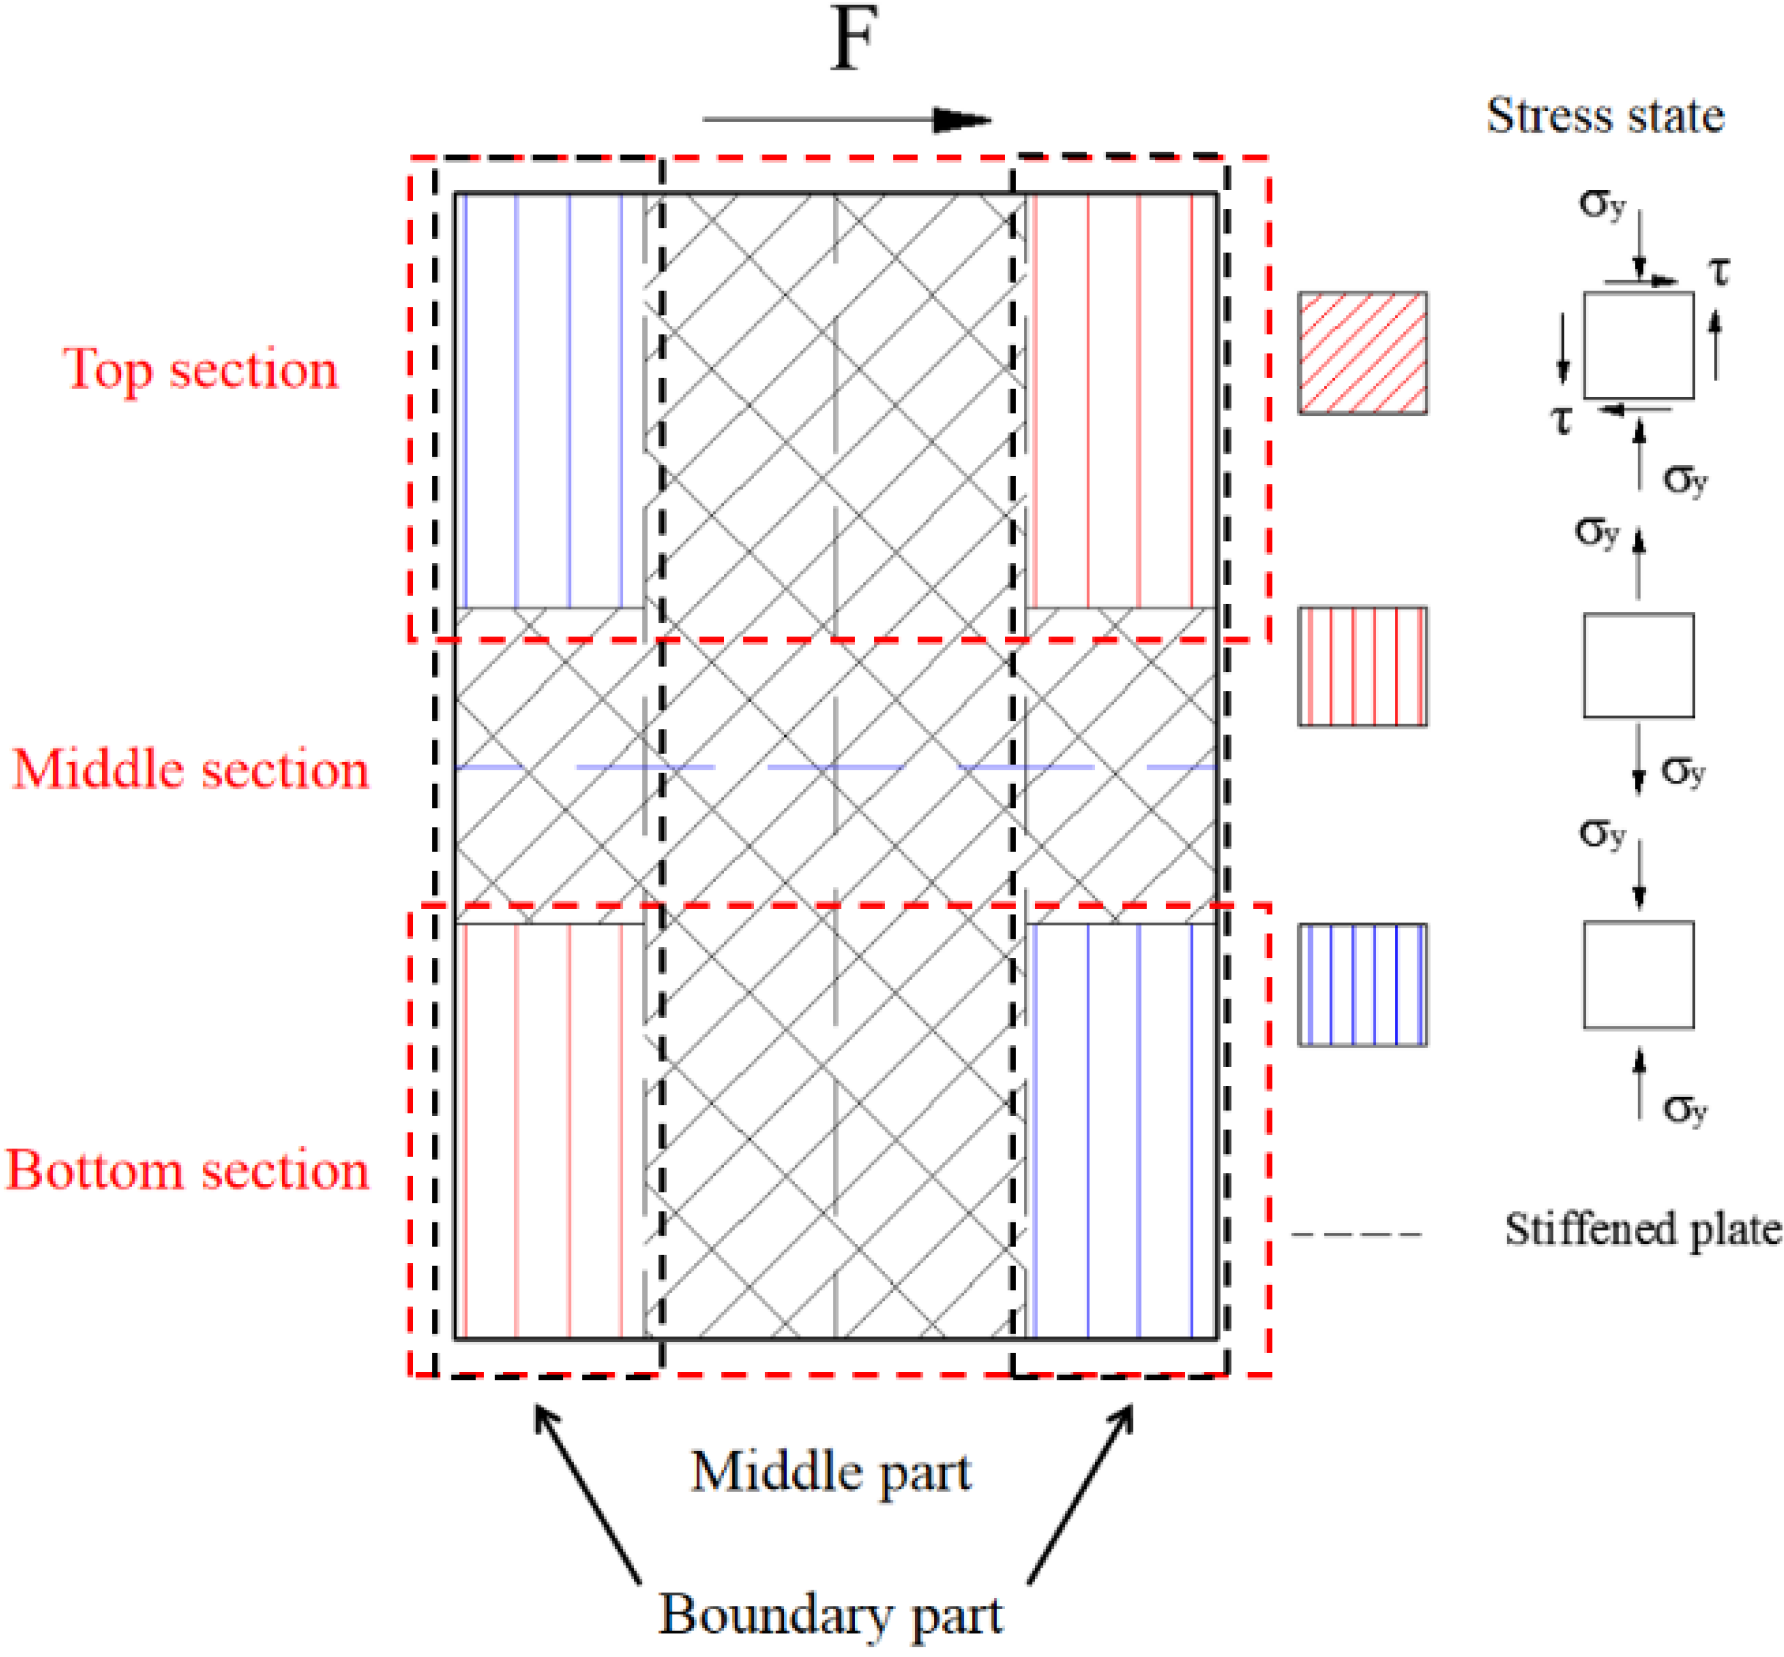
4.4.1. Distribution of the Lateral Force
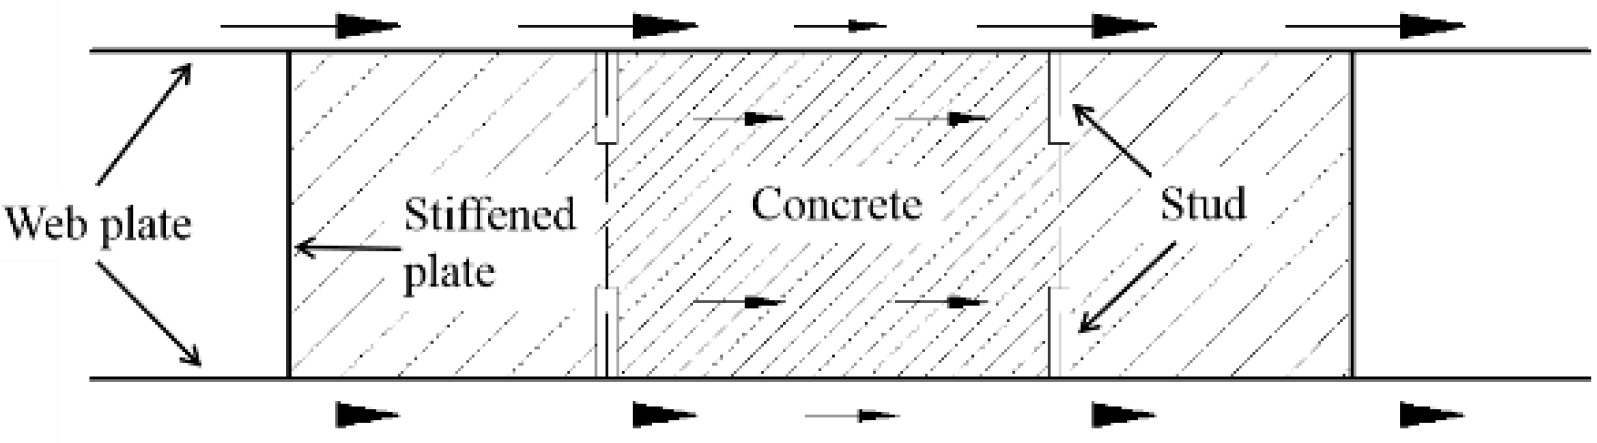
4.4.2. Mechanical Mechanism of the Wall
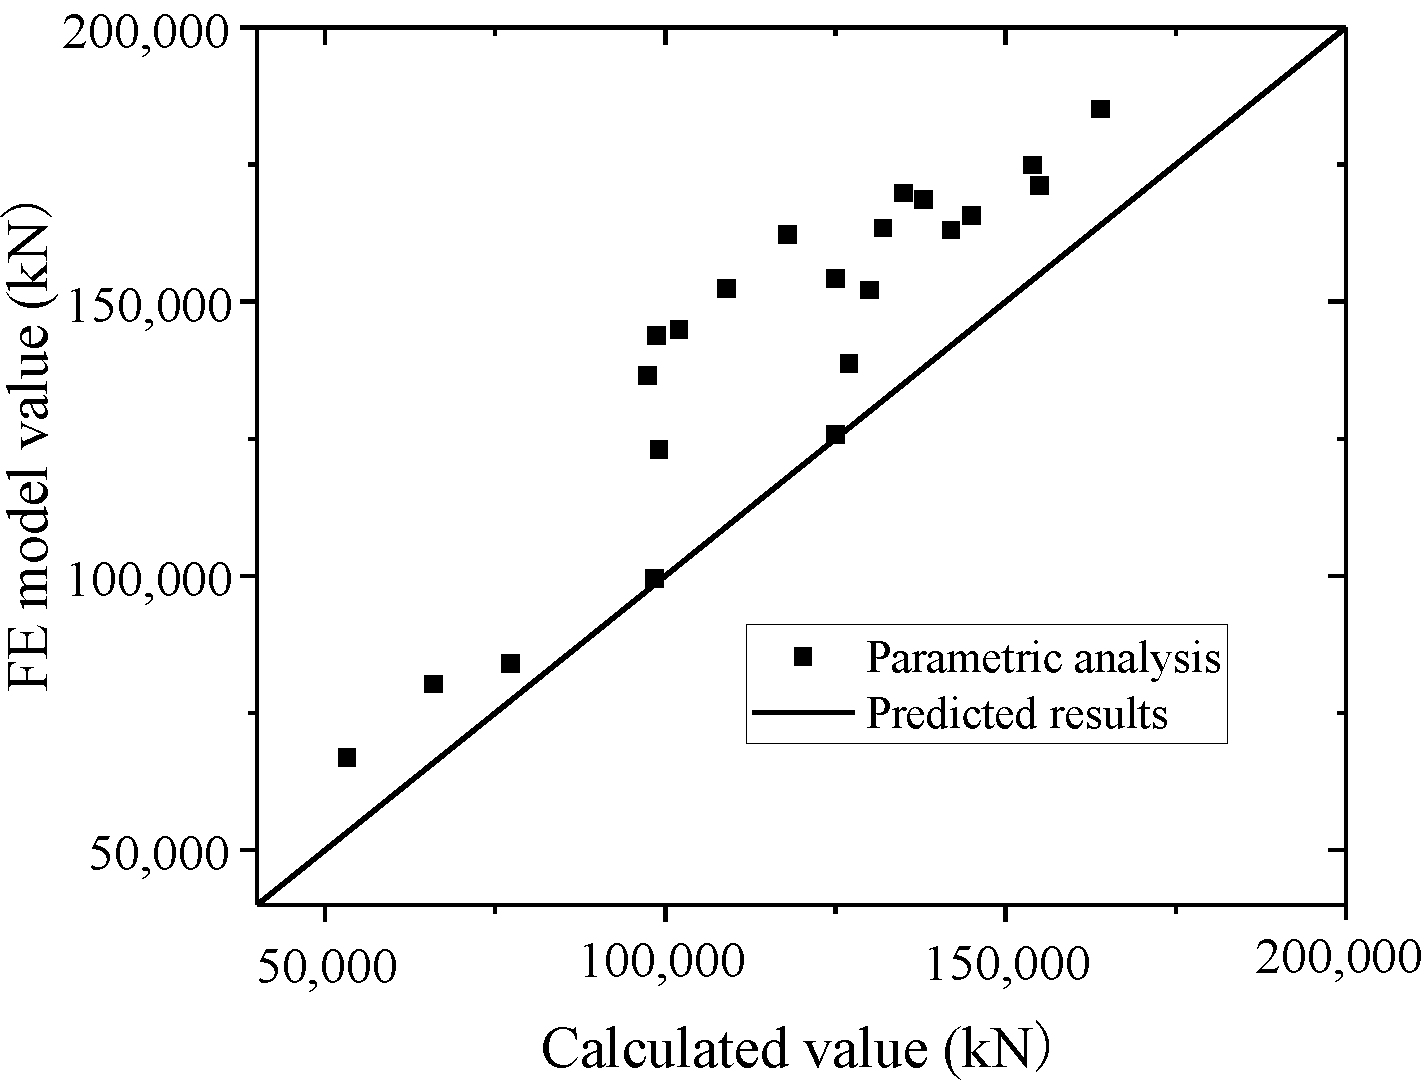
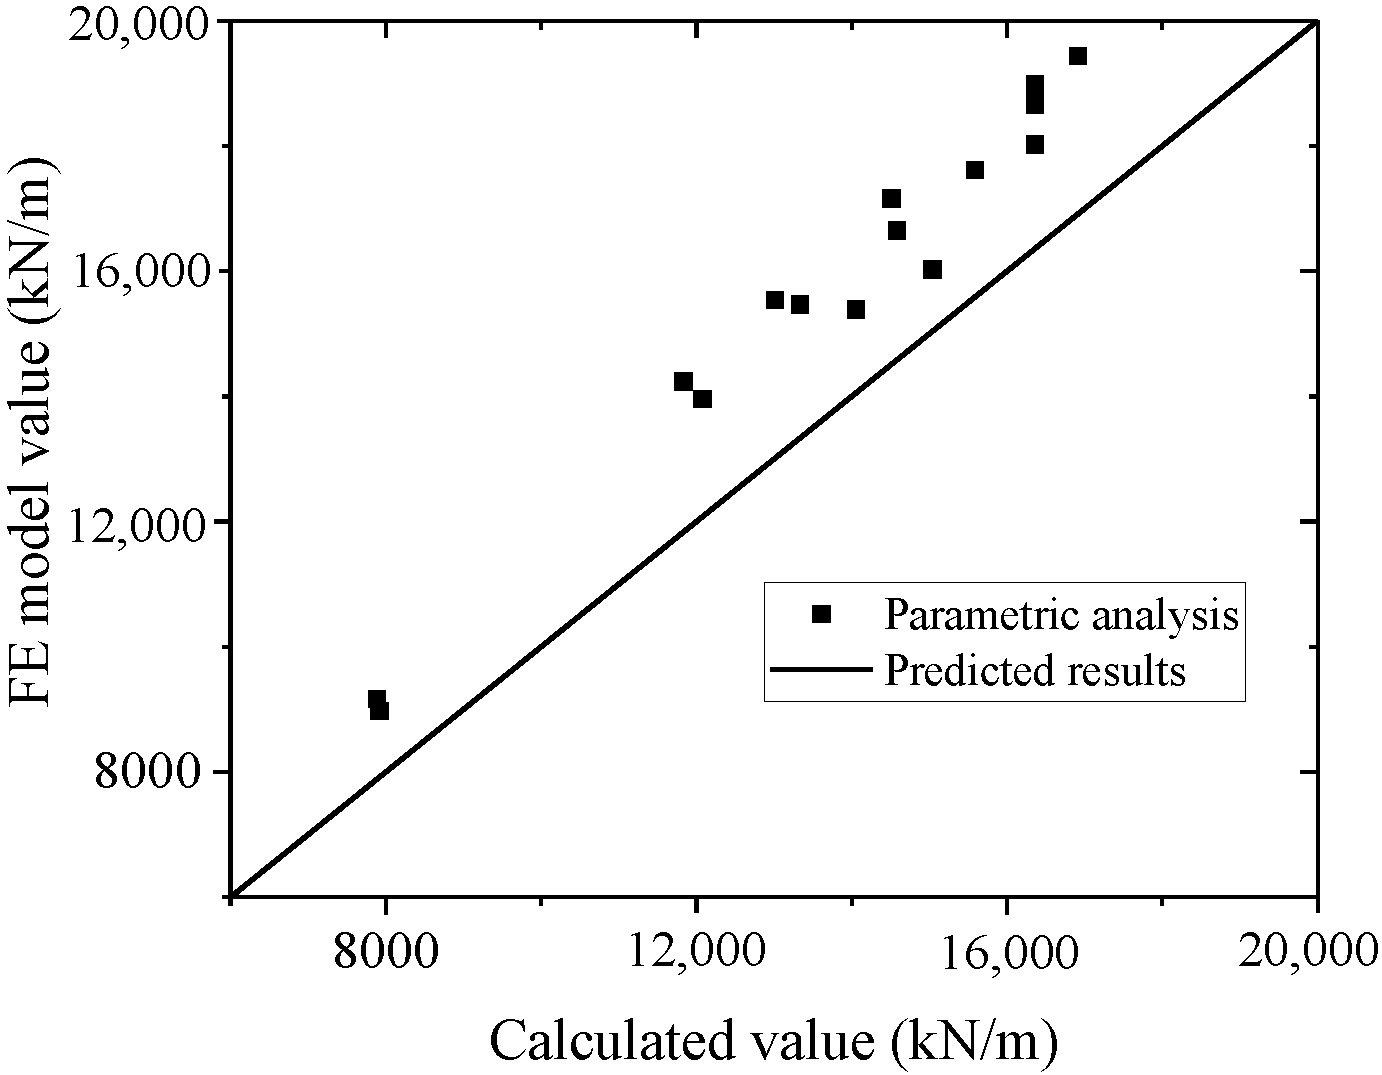
5. Parametric Analysis
5.1. Influence Rules of the Parameters
5.1.1. Influence on the Wall Thickness
5.1.2. Influence on the Steel Ratio
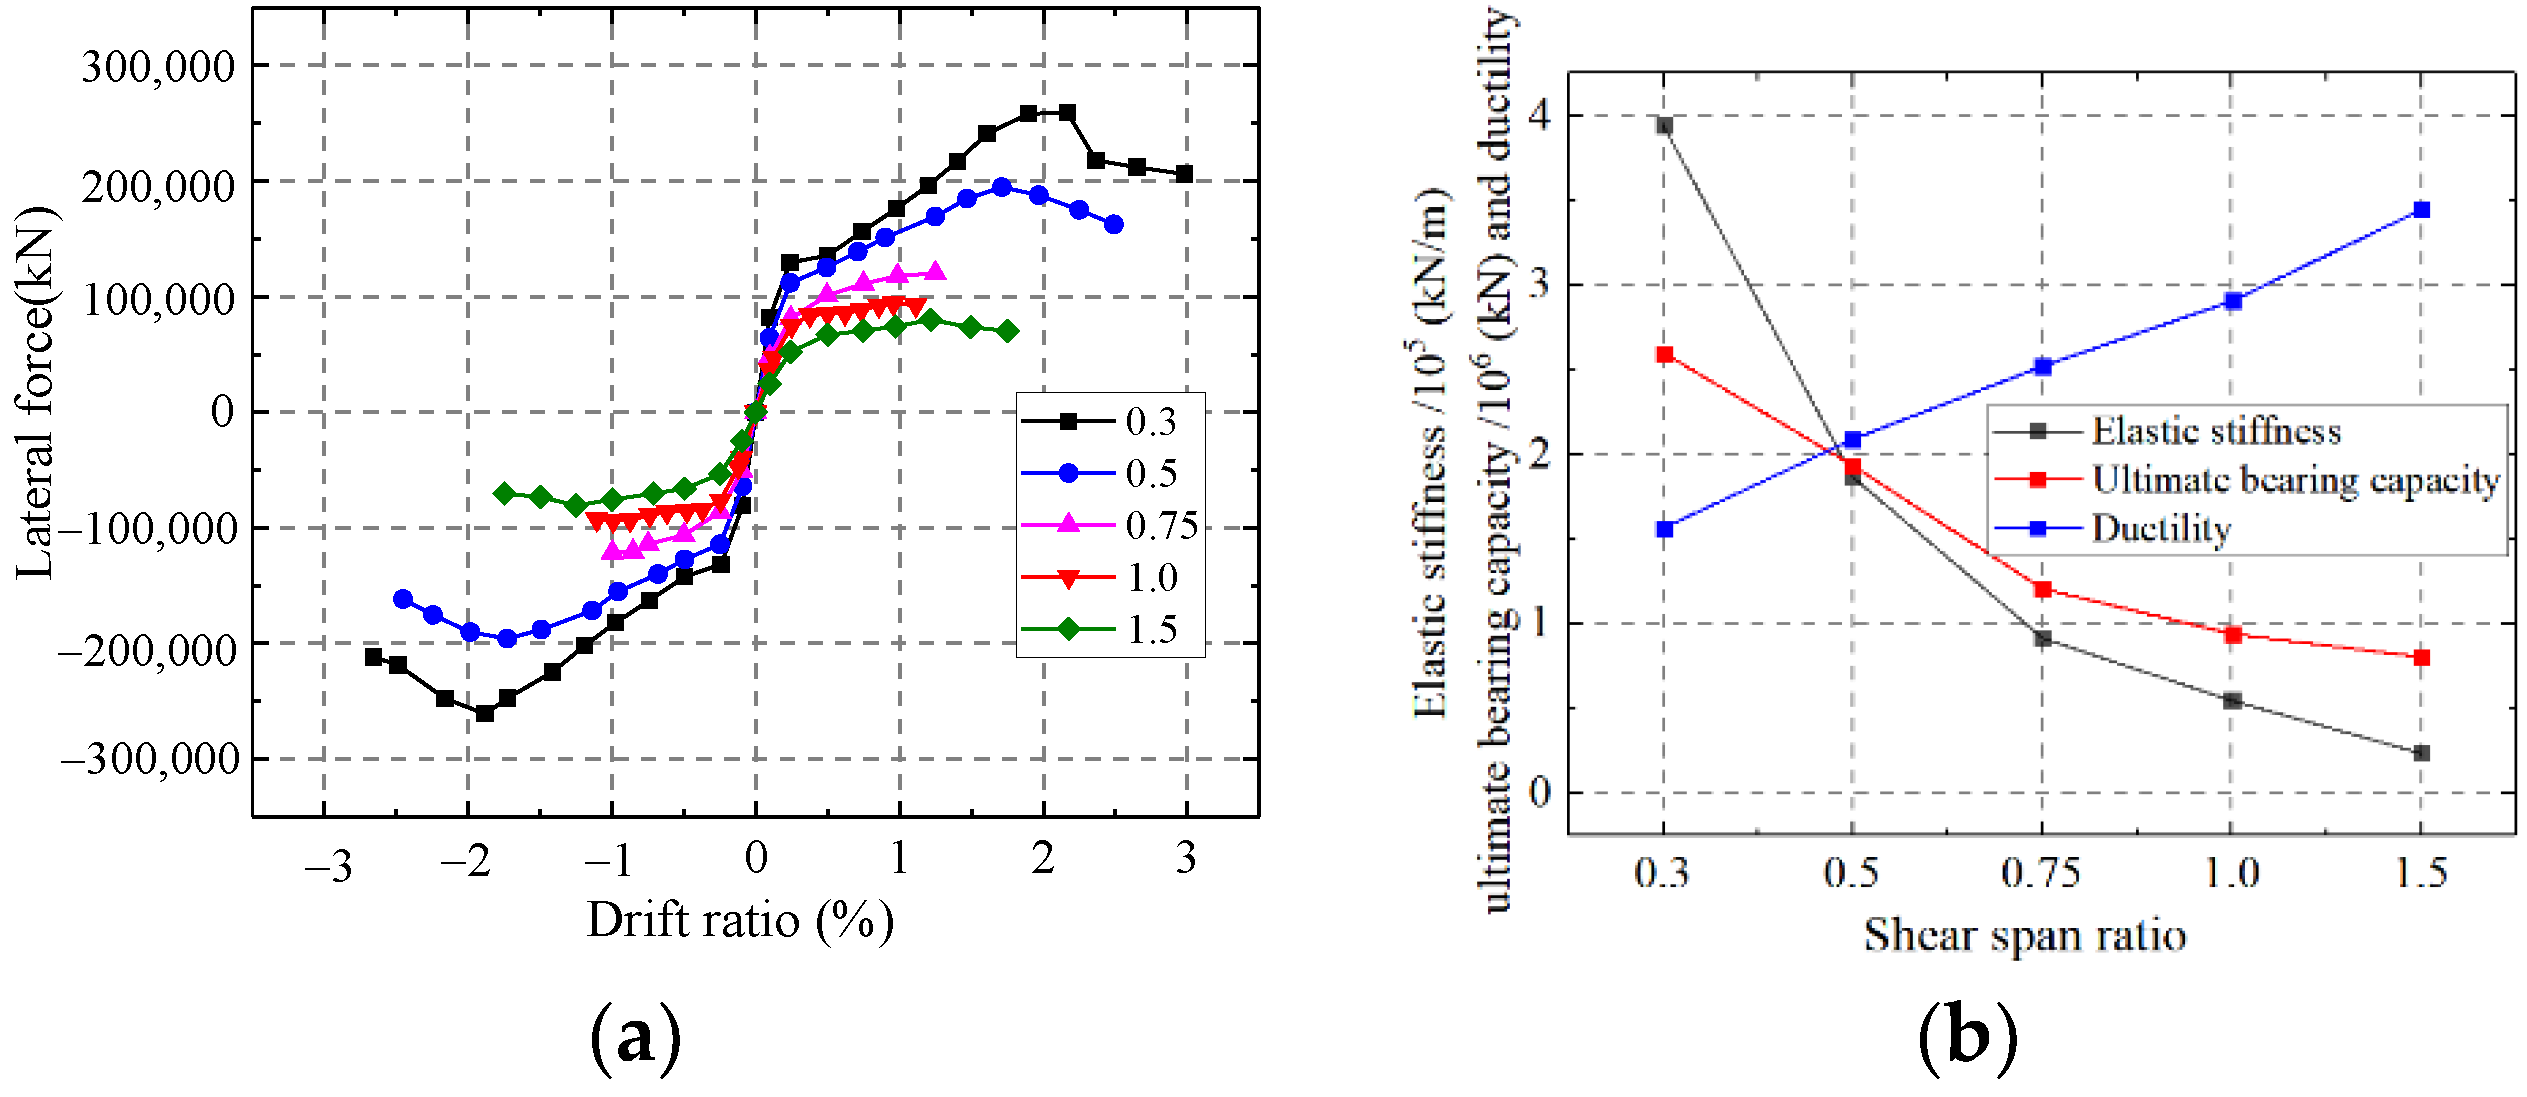
5.1.3. Influence on the Shear Span Ratio
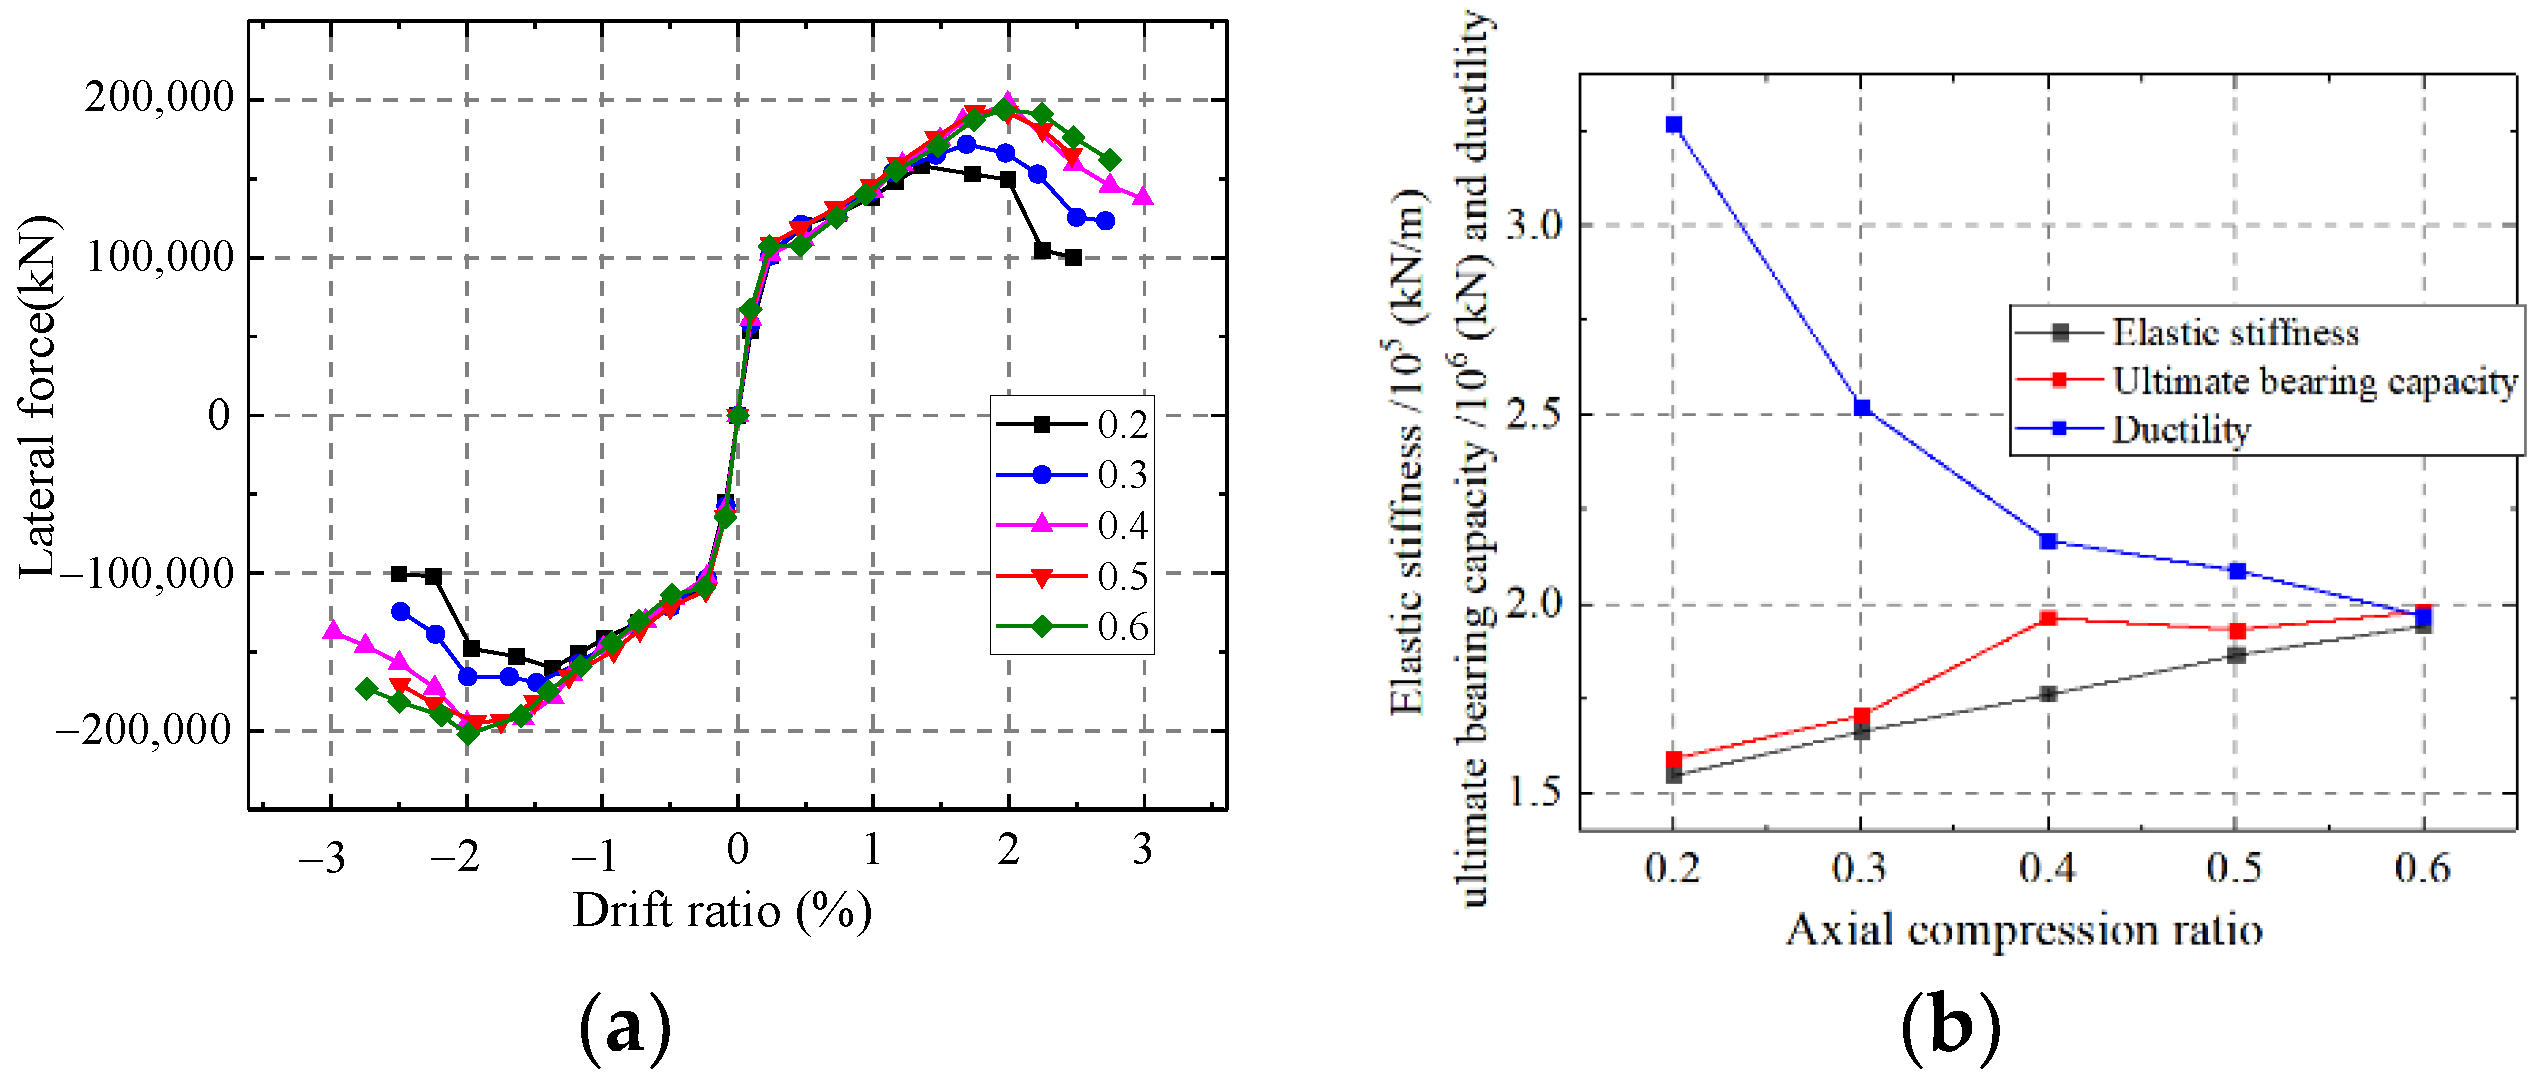
5.1.4. Influence on the Axial Compression Ratio
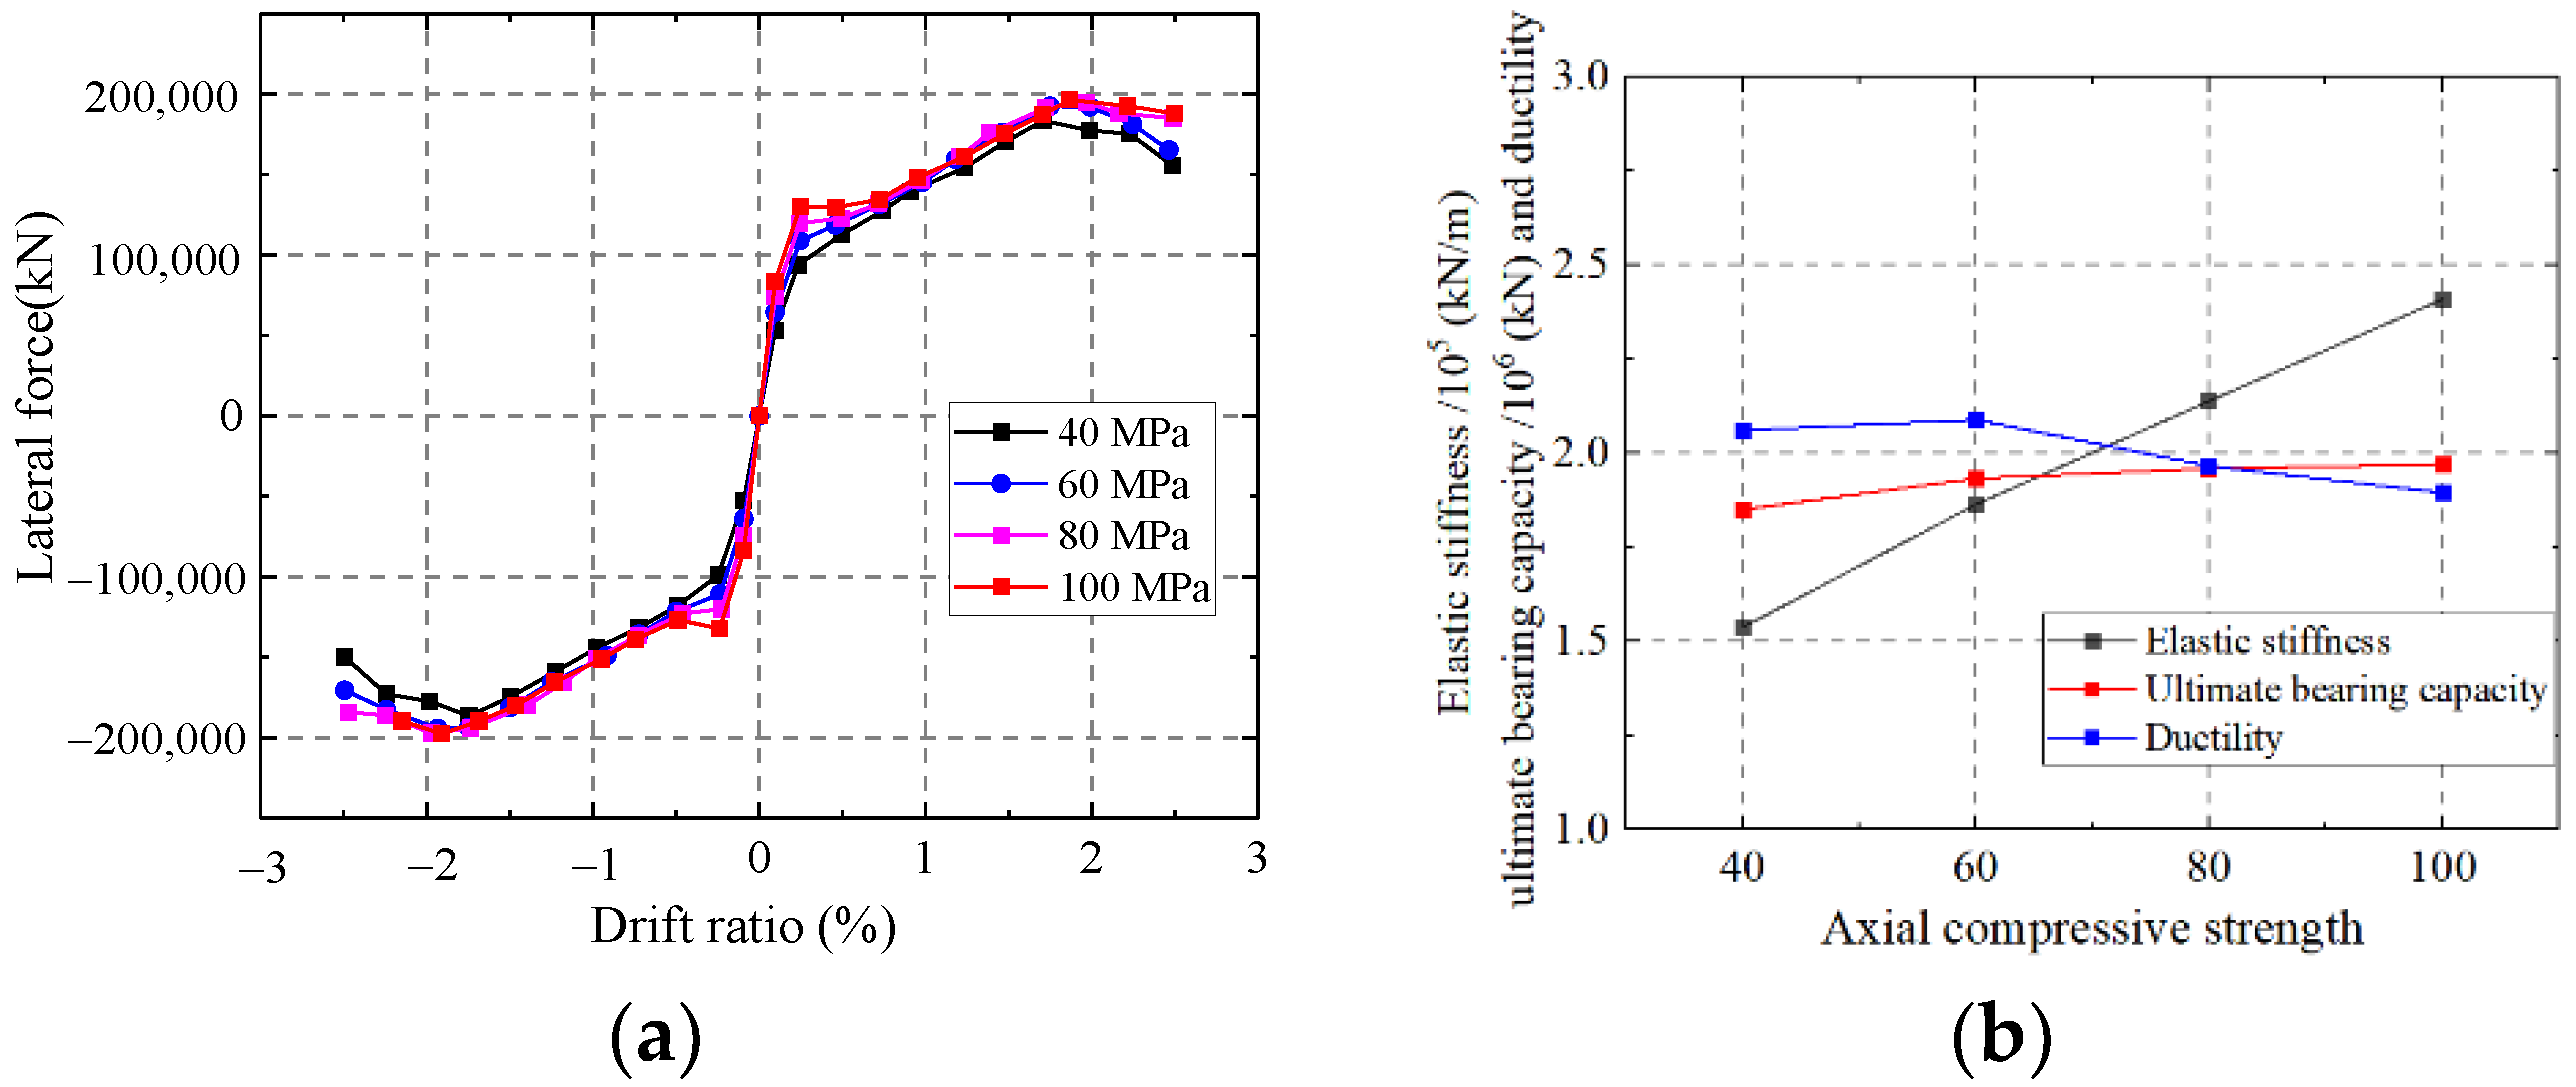
5.1.5. Influence on the Axial Compressive Strength of Concrete
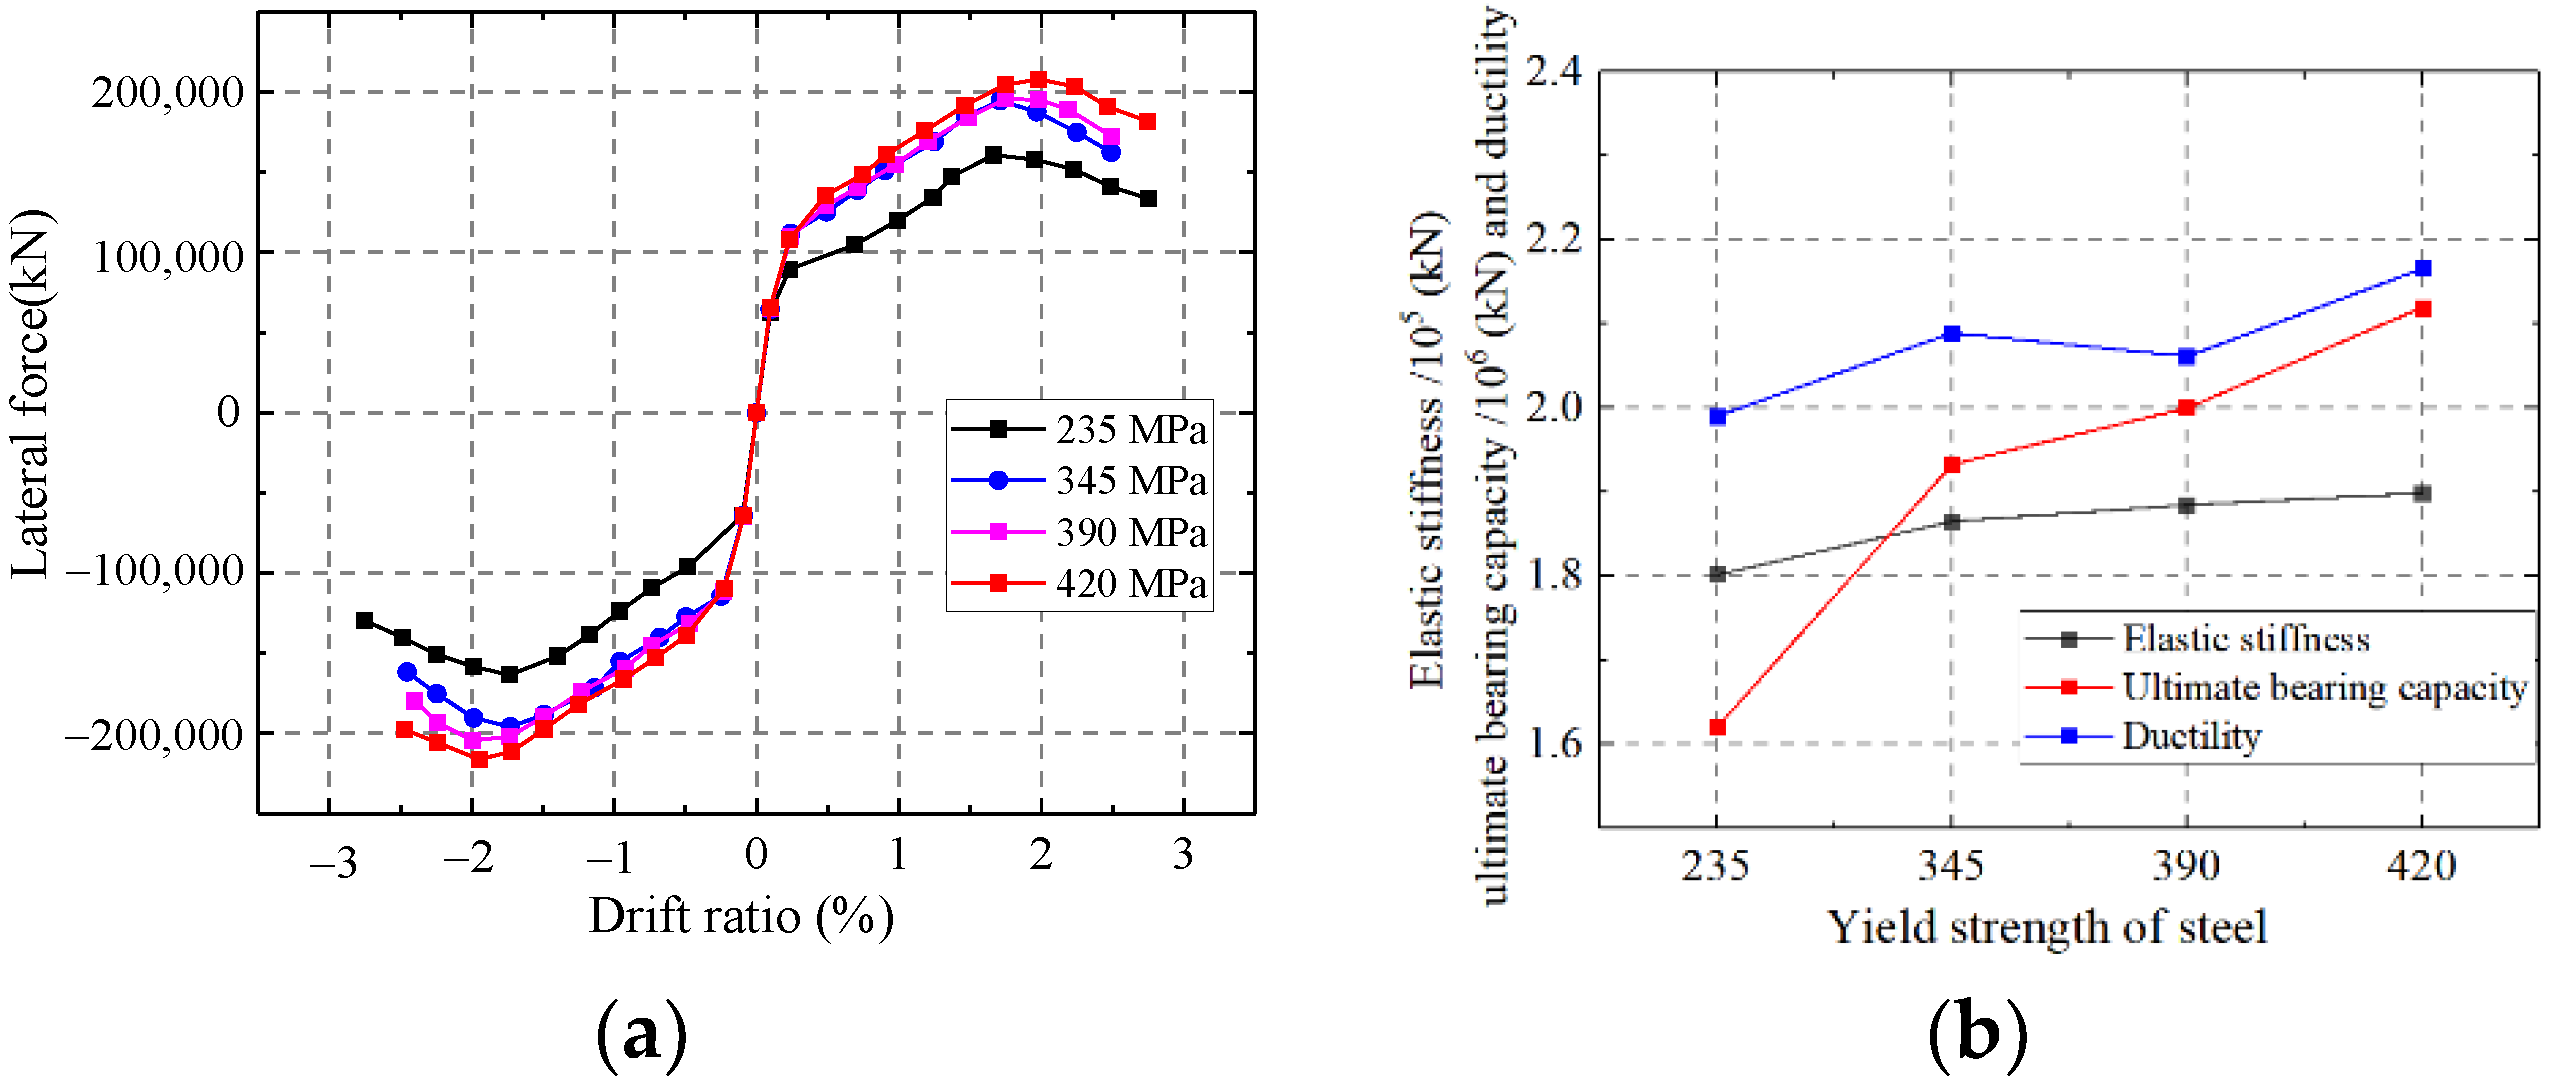
5.1.6. Influence on the Yield Strength of Steel
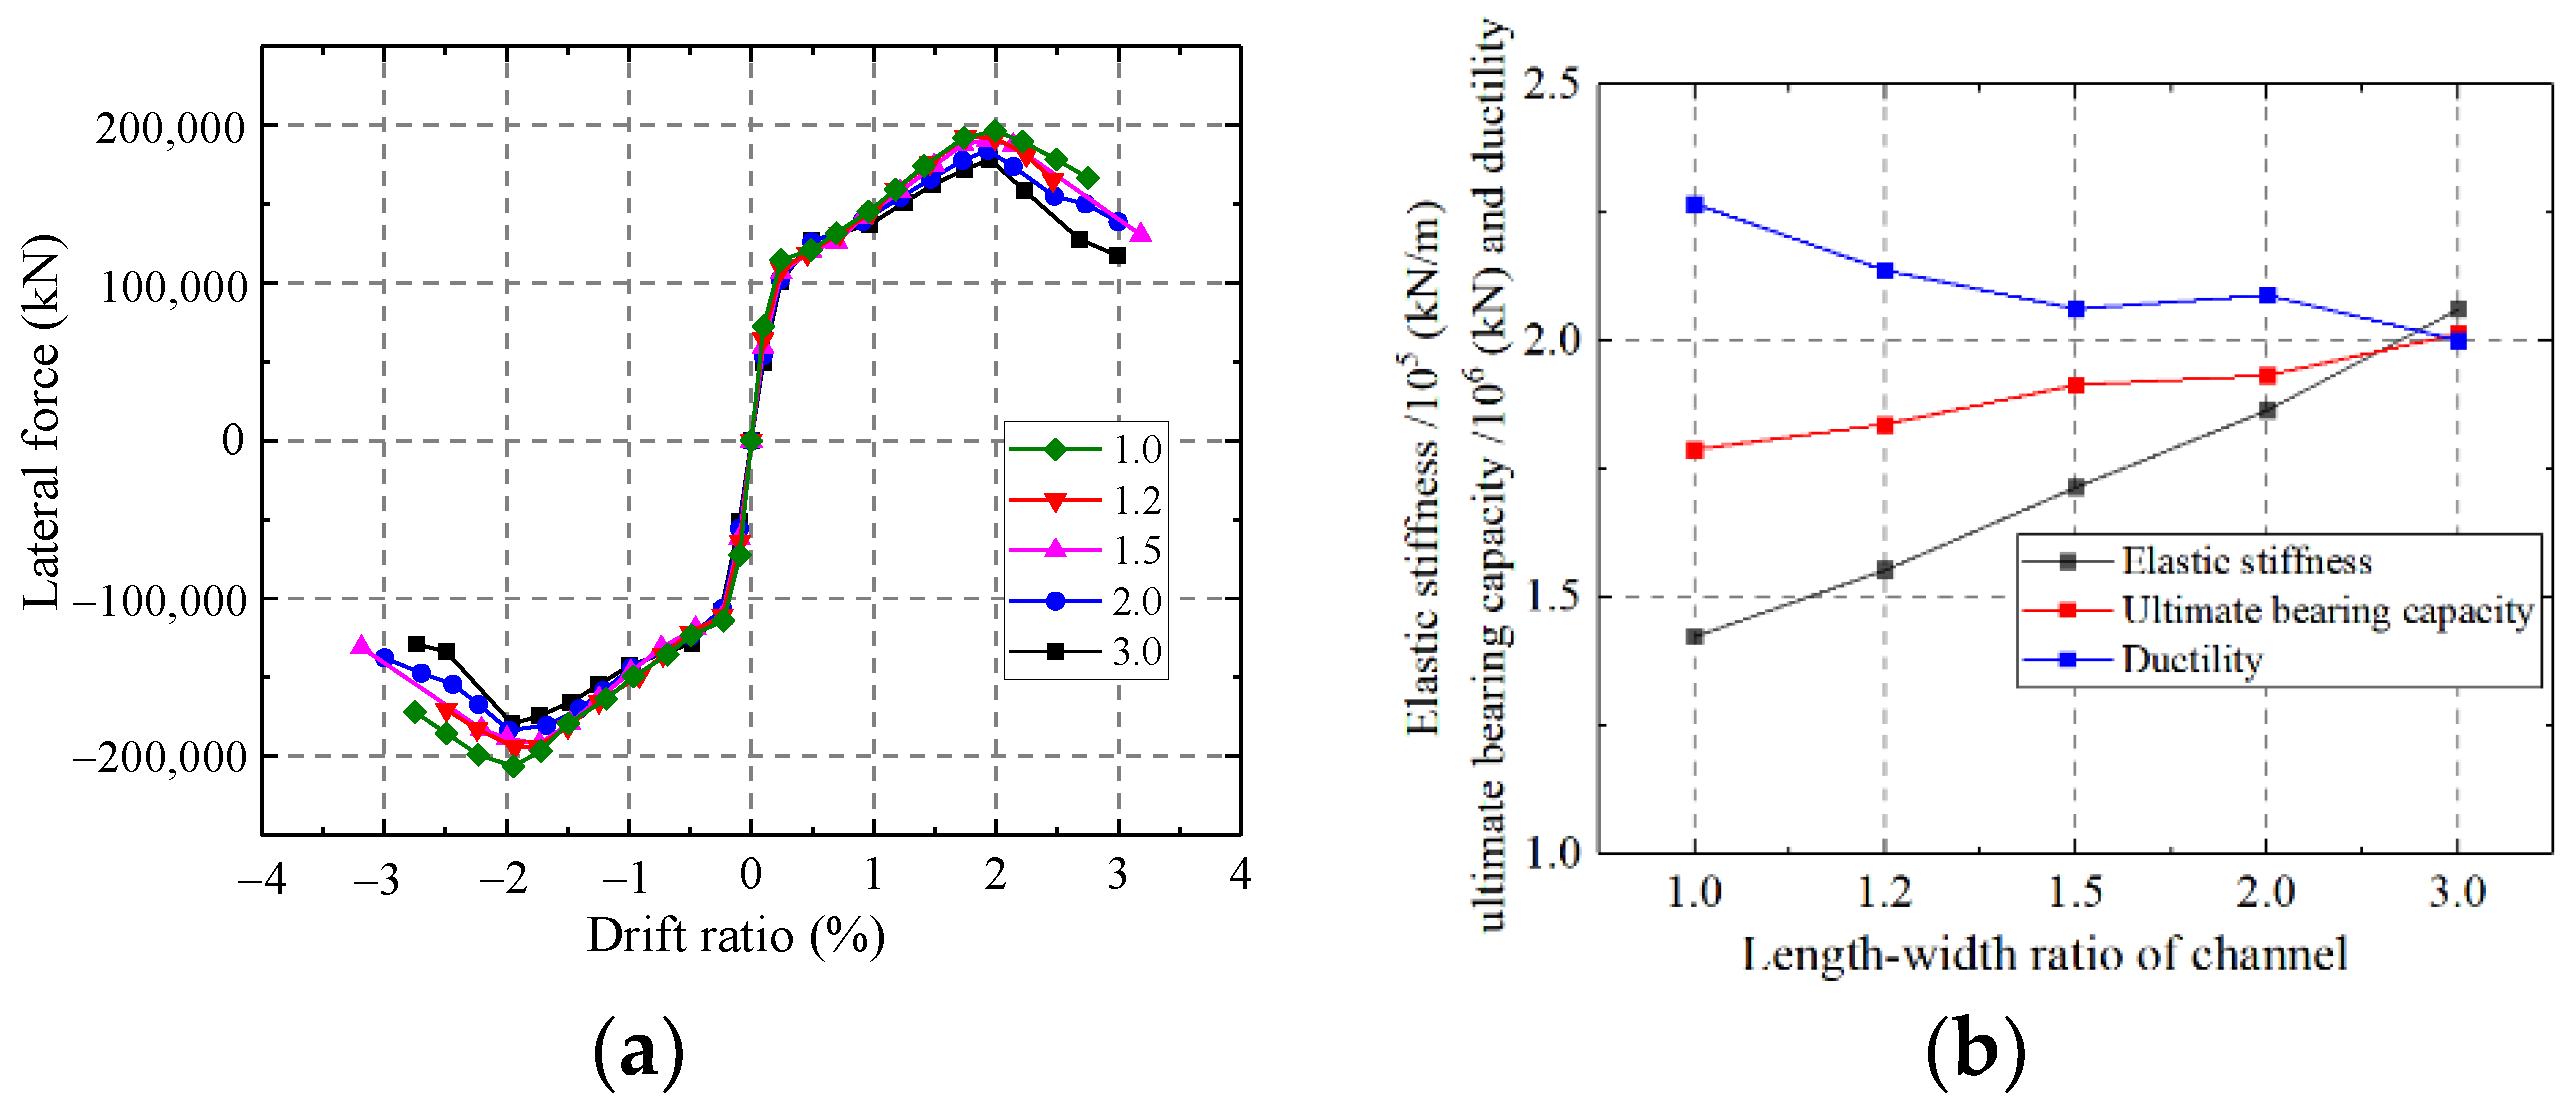
5.1.7. Influence on the Length-to-Width Ratio of the Channel
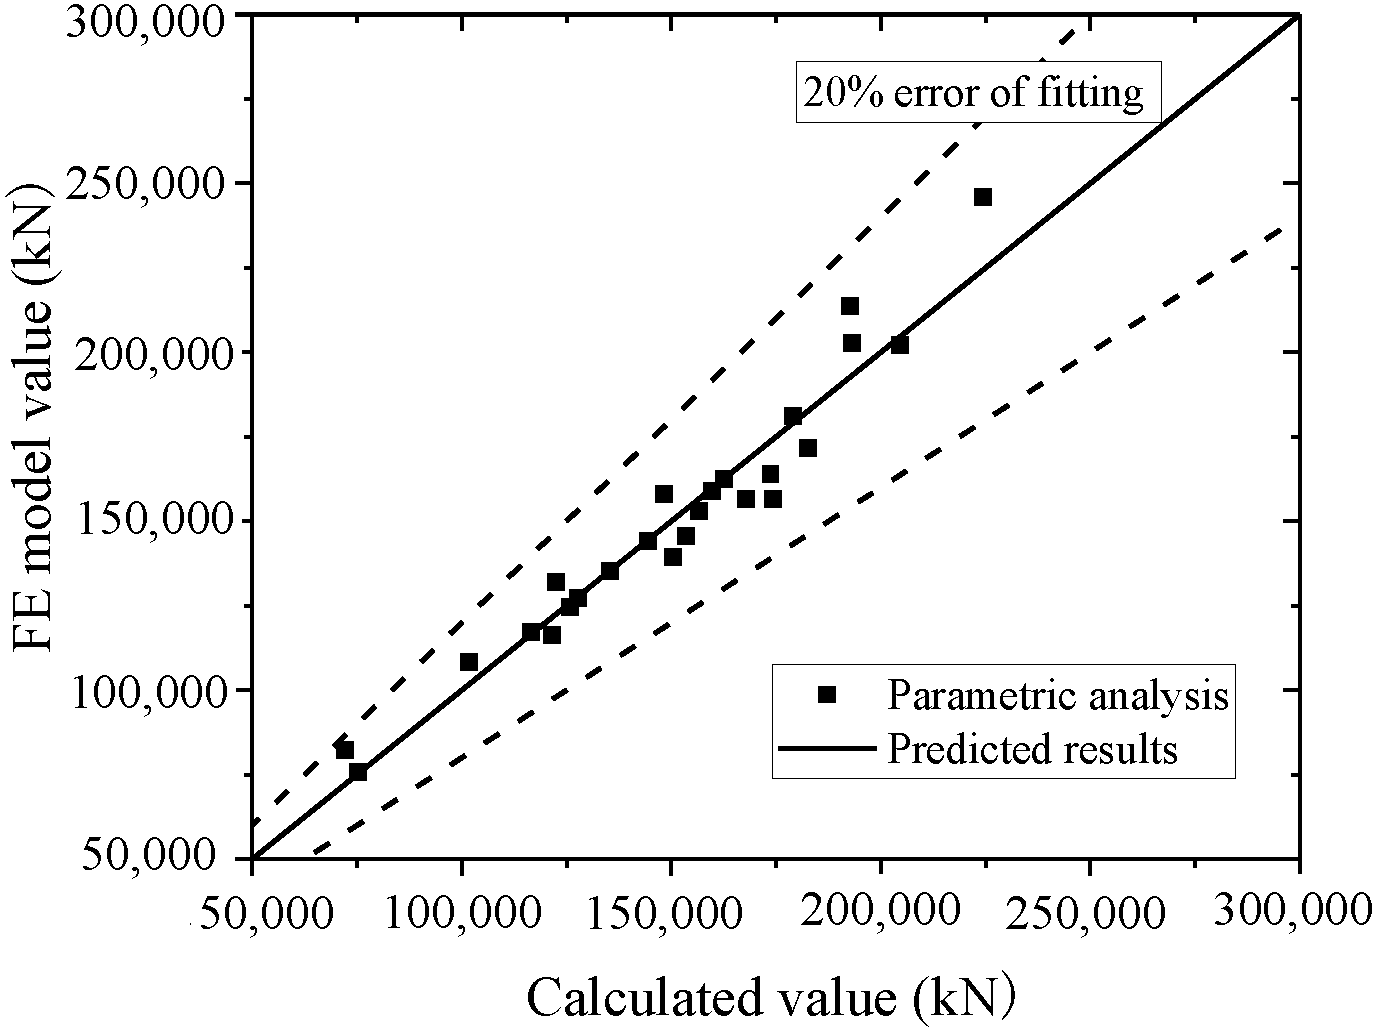
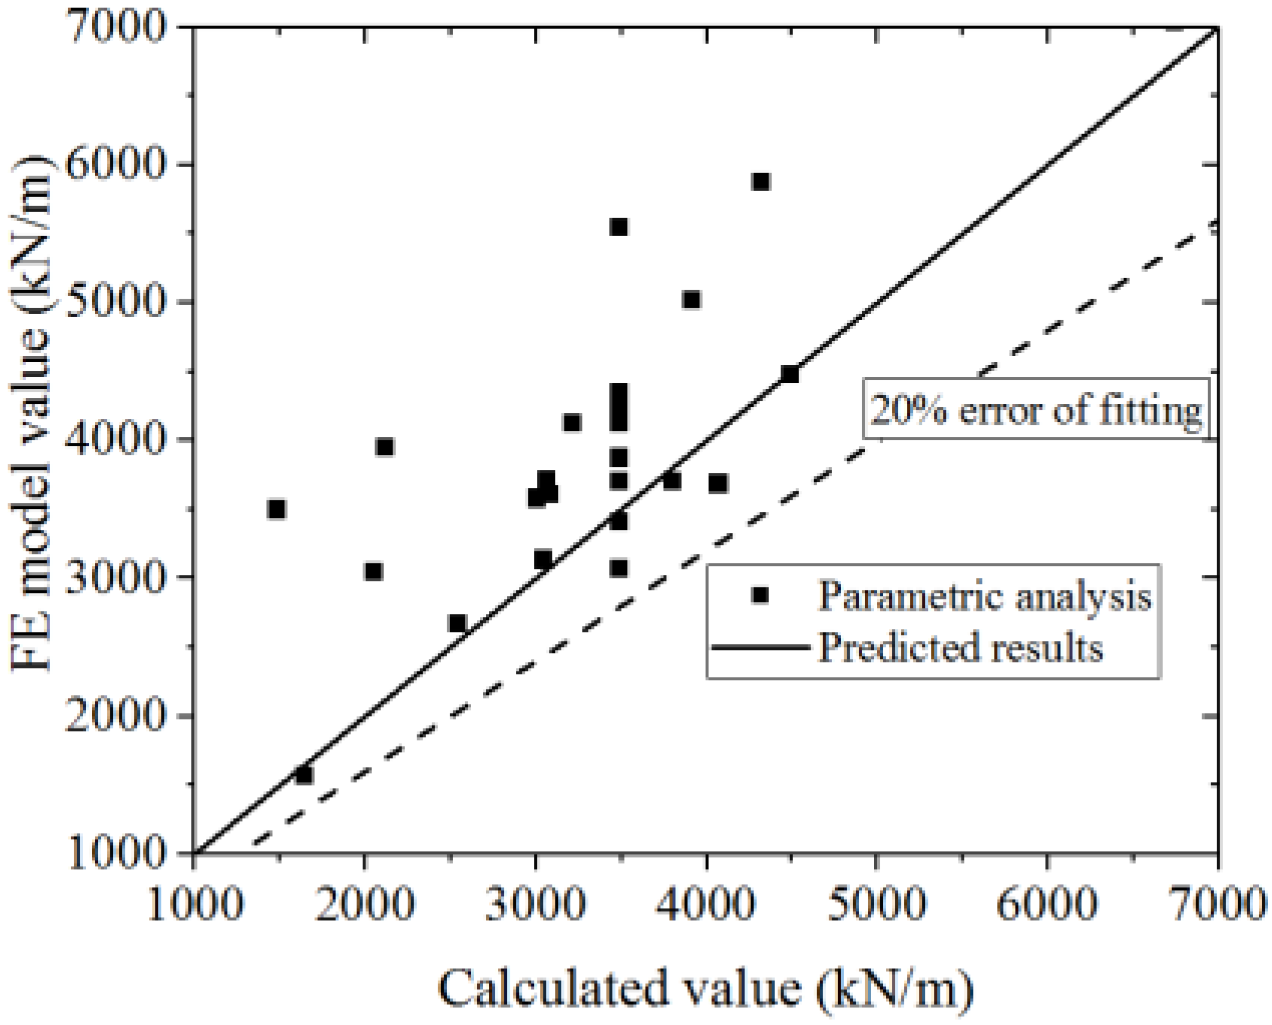
5.2. Formulation for Bearing Capacity and Stiffness Prediction
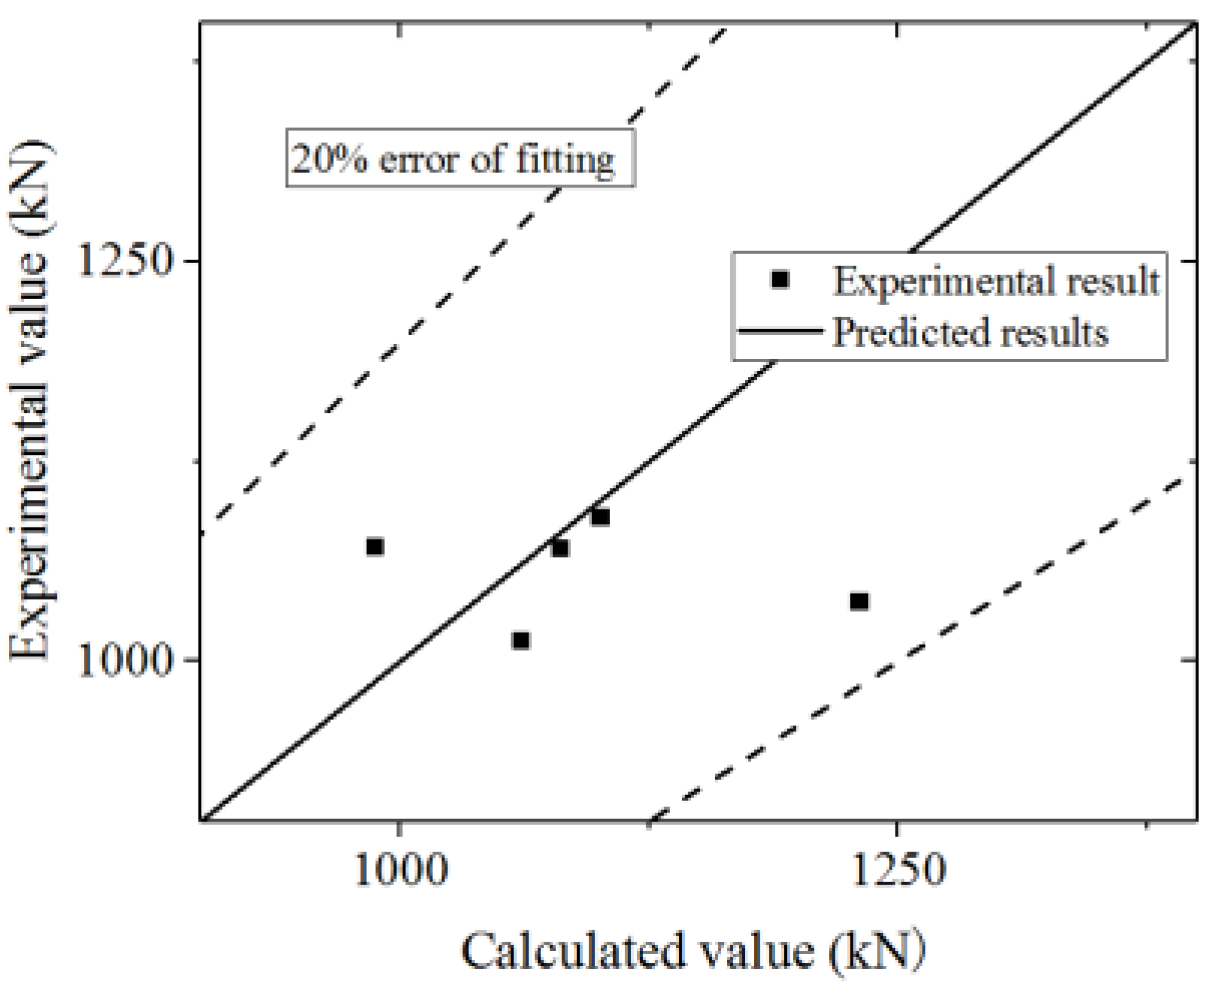
5.2.1. Prediction of the Ultimate Strength
- fcc = Axial compressive strength of the constrained concrete [40].
- fc = Axial compressive strength of concrete.
- fy = Yield strength of steel.
- ξsc = Constraint coefficient of the concrete in the CWSC sample.
- As1 = Area of the constrained steel plate.
- Ac1 = Area of the infilled concrete.
- Acc = Area of the concrete under uniaxial compression.
- Asc = Area of the steel plate under uniaxial compression.
- Ast = Area of the tension steel plate.
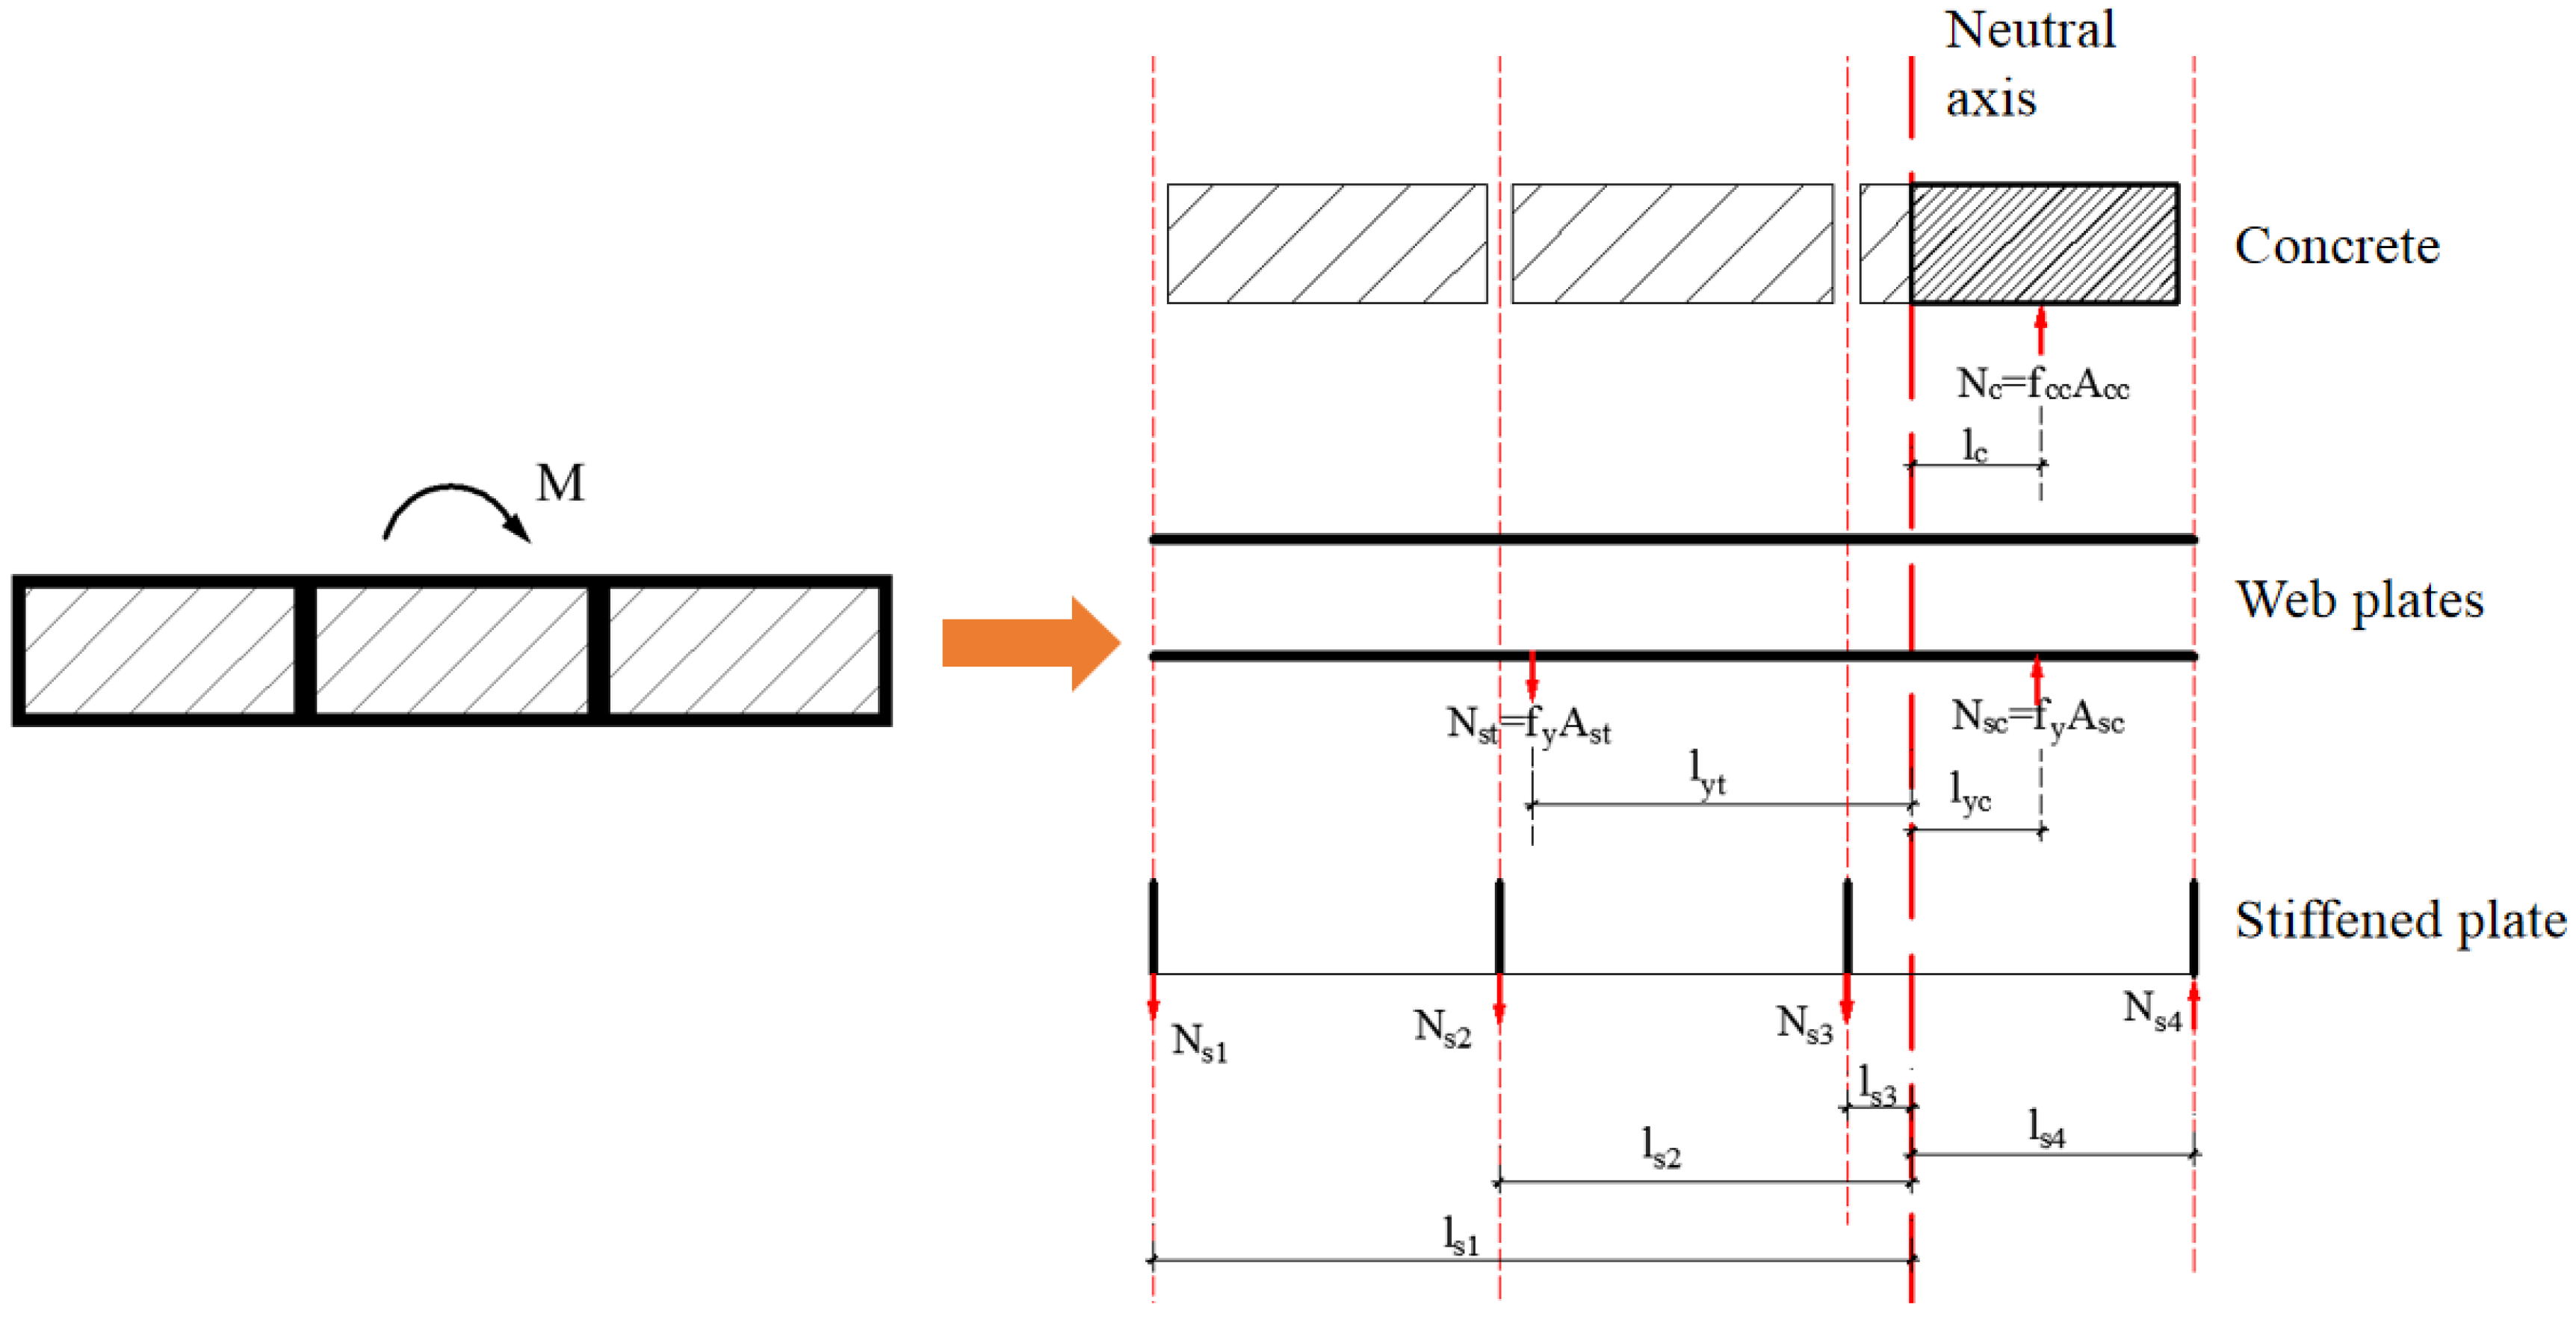
- Nsi = Vertical force on the stiffened plate.
- lsi = Distance from the stiffened plate to the neutral axis.
- lc = Distance from the constrained concrete to the neutral axis.
- lyc = Distance from the compression steel plate to the neutral axis.
- lyt = Distance from the tension steel plate to the neutral axis.
- N = Axial force applied at the shear wall.
- M = Bending moment applied at the shear wall.
- V = Horizontal shear force applied at the shear wall.
- Nu = Axial bearing capacity of the shear wall, determined by Equation (17).
- Mu = Flexural bearing capacity of the shear wall, determined by Equation (15).
- Vu = Ultimate strength capacity of the shear wall, determined by Equation (18) [42].
- ξ = Ratio of the channel width to wall width.
- = Compressive strength of the cylinder concrete.
- Asw = Steel plate area parallel to the horizontal force.
5.2.2. Prediction of the Yielding Bearing Capacity
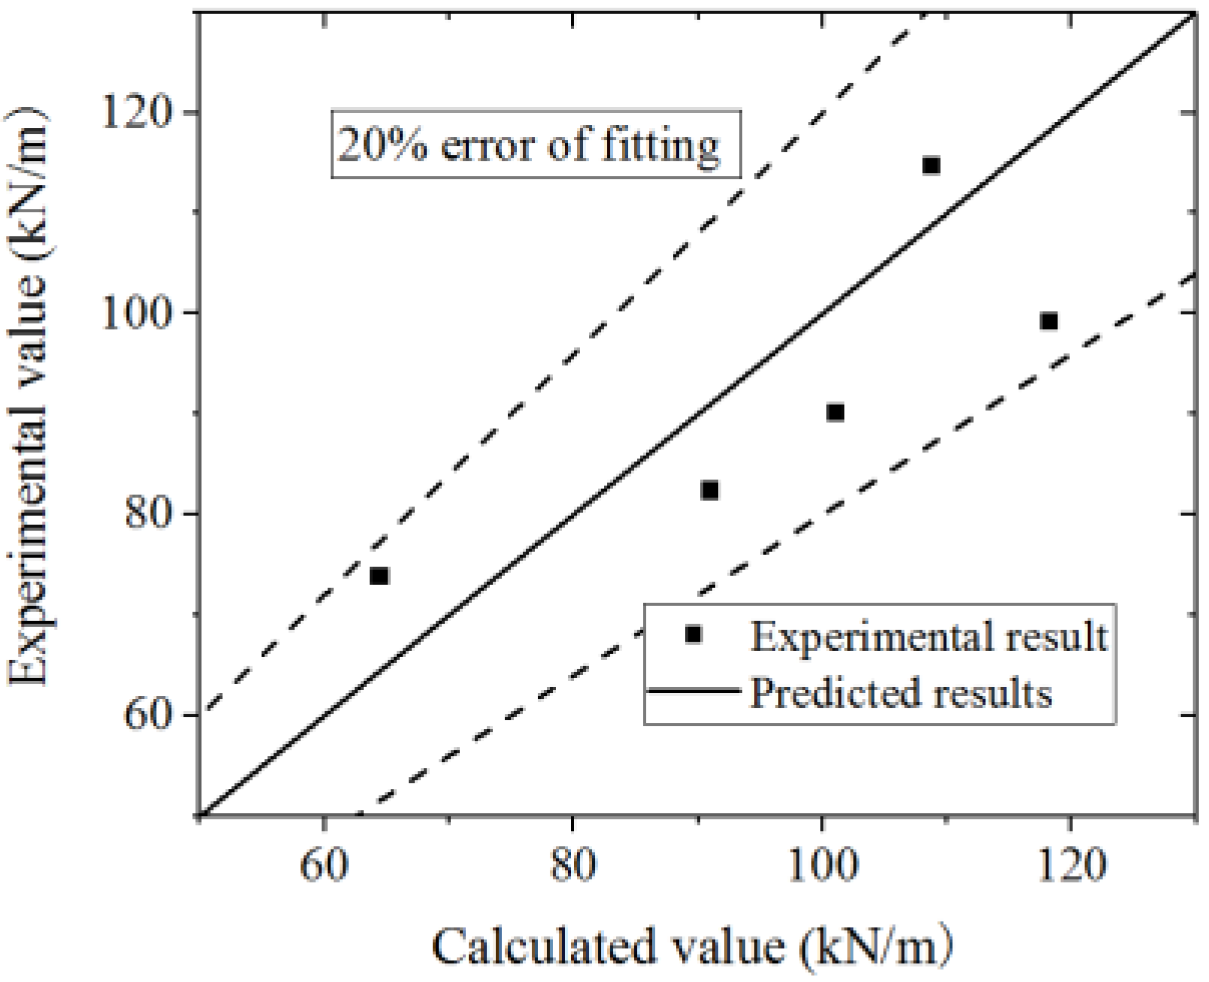
5.2.3. Prediction of the Elastic Stiffness
- p = End constraint coefficient of the sample, where p = 3 in the FE model.
- k = Section influence coefficient, where k = 1.2.
- h = Height of the wall.
- EscIsc = Flexural stiffness of the shear wall, where EscIsc = EsIs + EcIc.
- GscAsc = Shear stiffness of the shear wall, where GscAsc = qe(GsAs + GcAc).
- qe represents the shear stiffness reduction coefficient, as proposed by Equation (23).
5.2.4. Prediction of the Secant Stiffness of the Yield Point
- qm = Flexural stiffness reduction coefficient.
- qv = Shear stiffness reduction coefficient.
- ξ = Length-to-width ratio of the channel.
- λ = Shear span ratio of the shear wall.
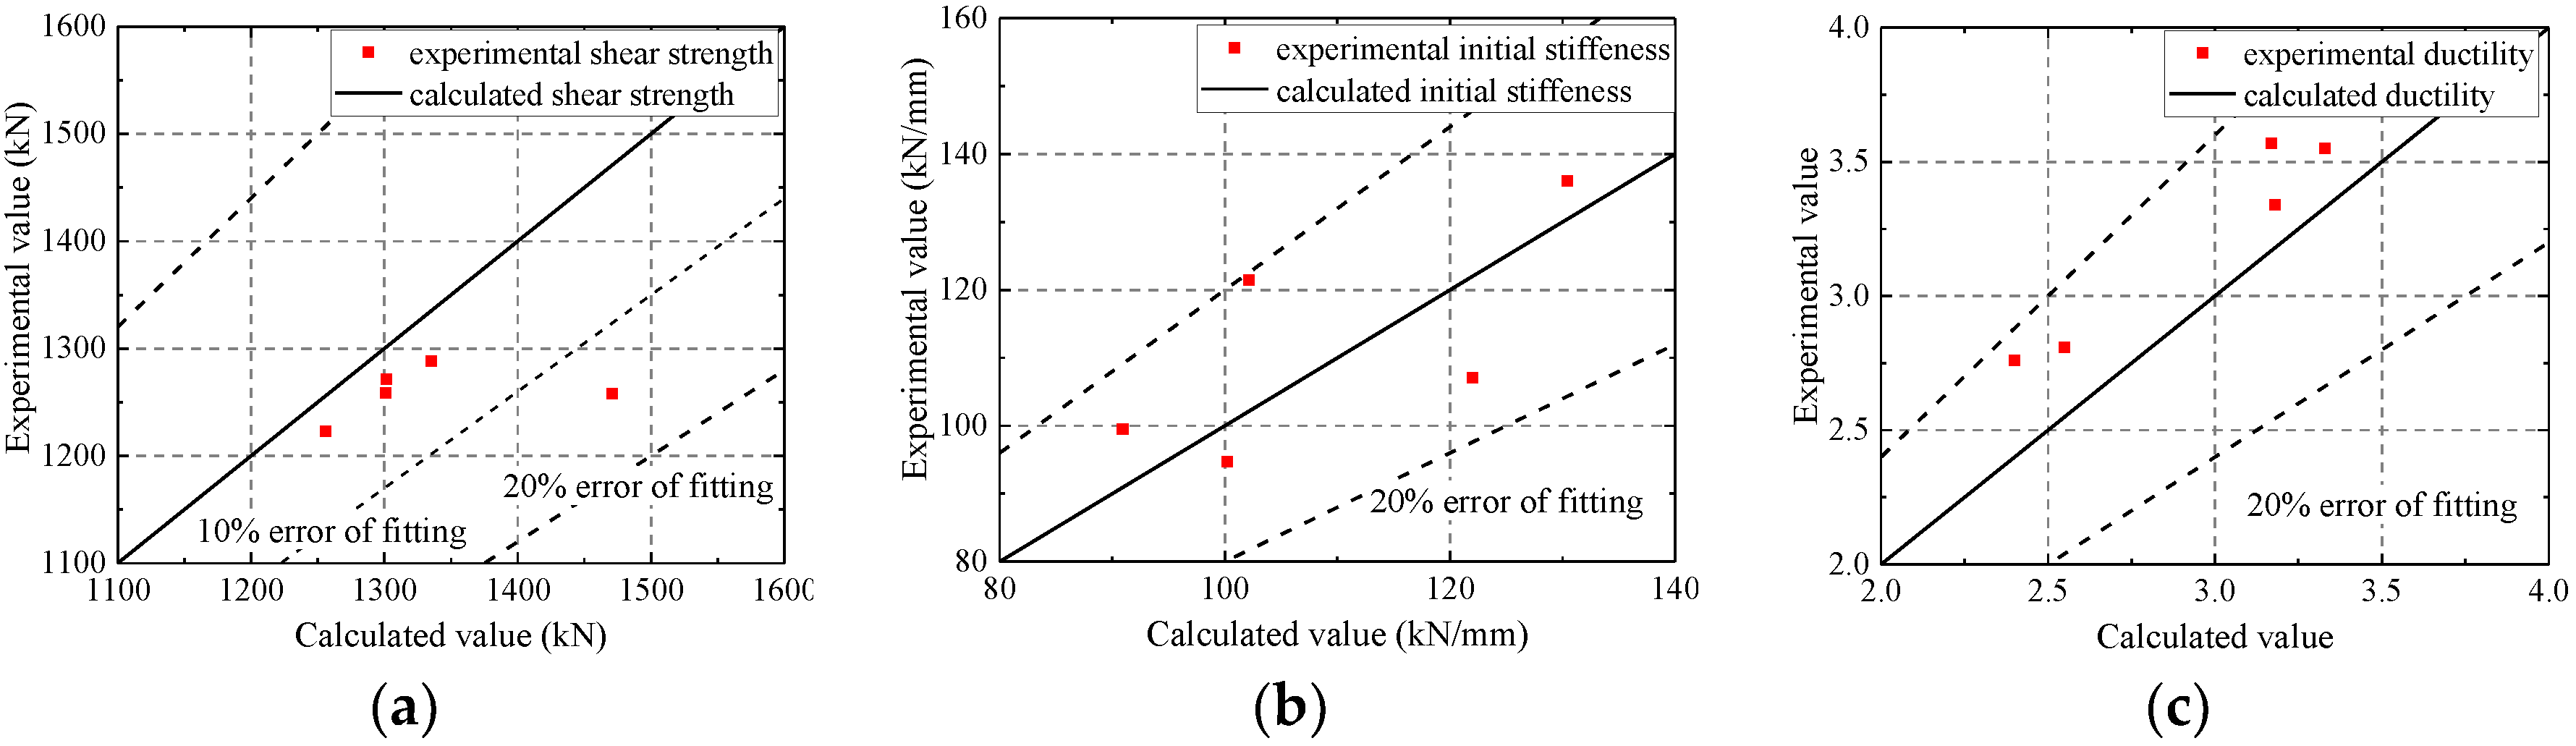
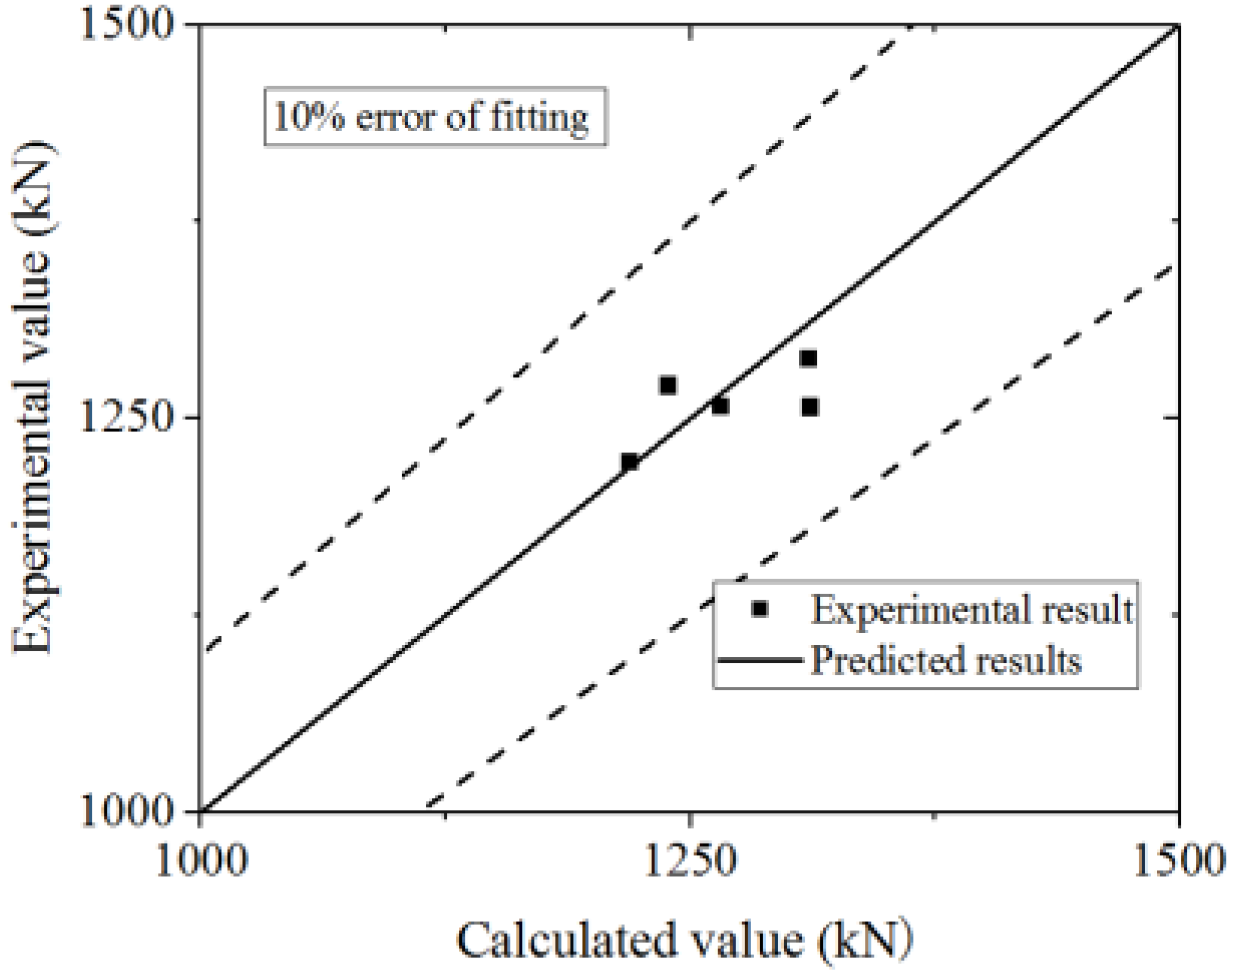
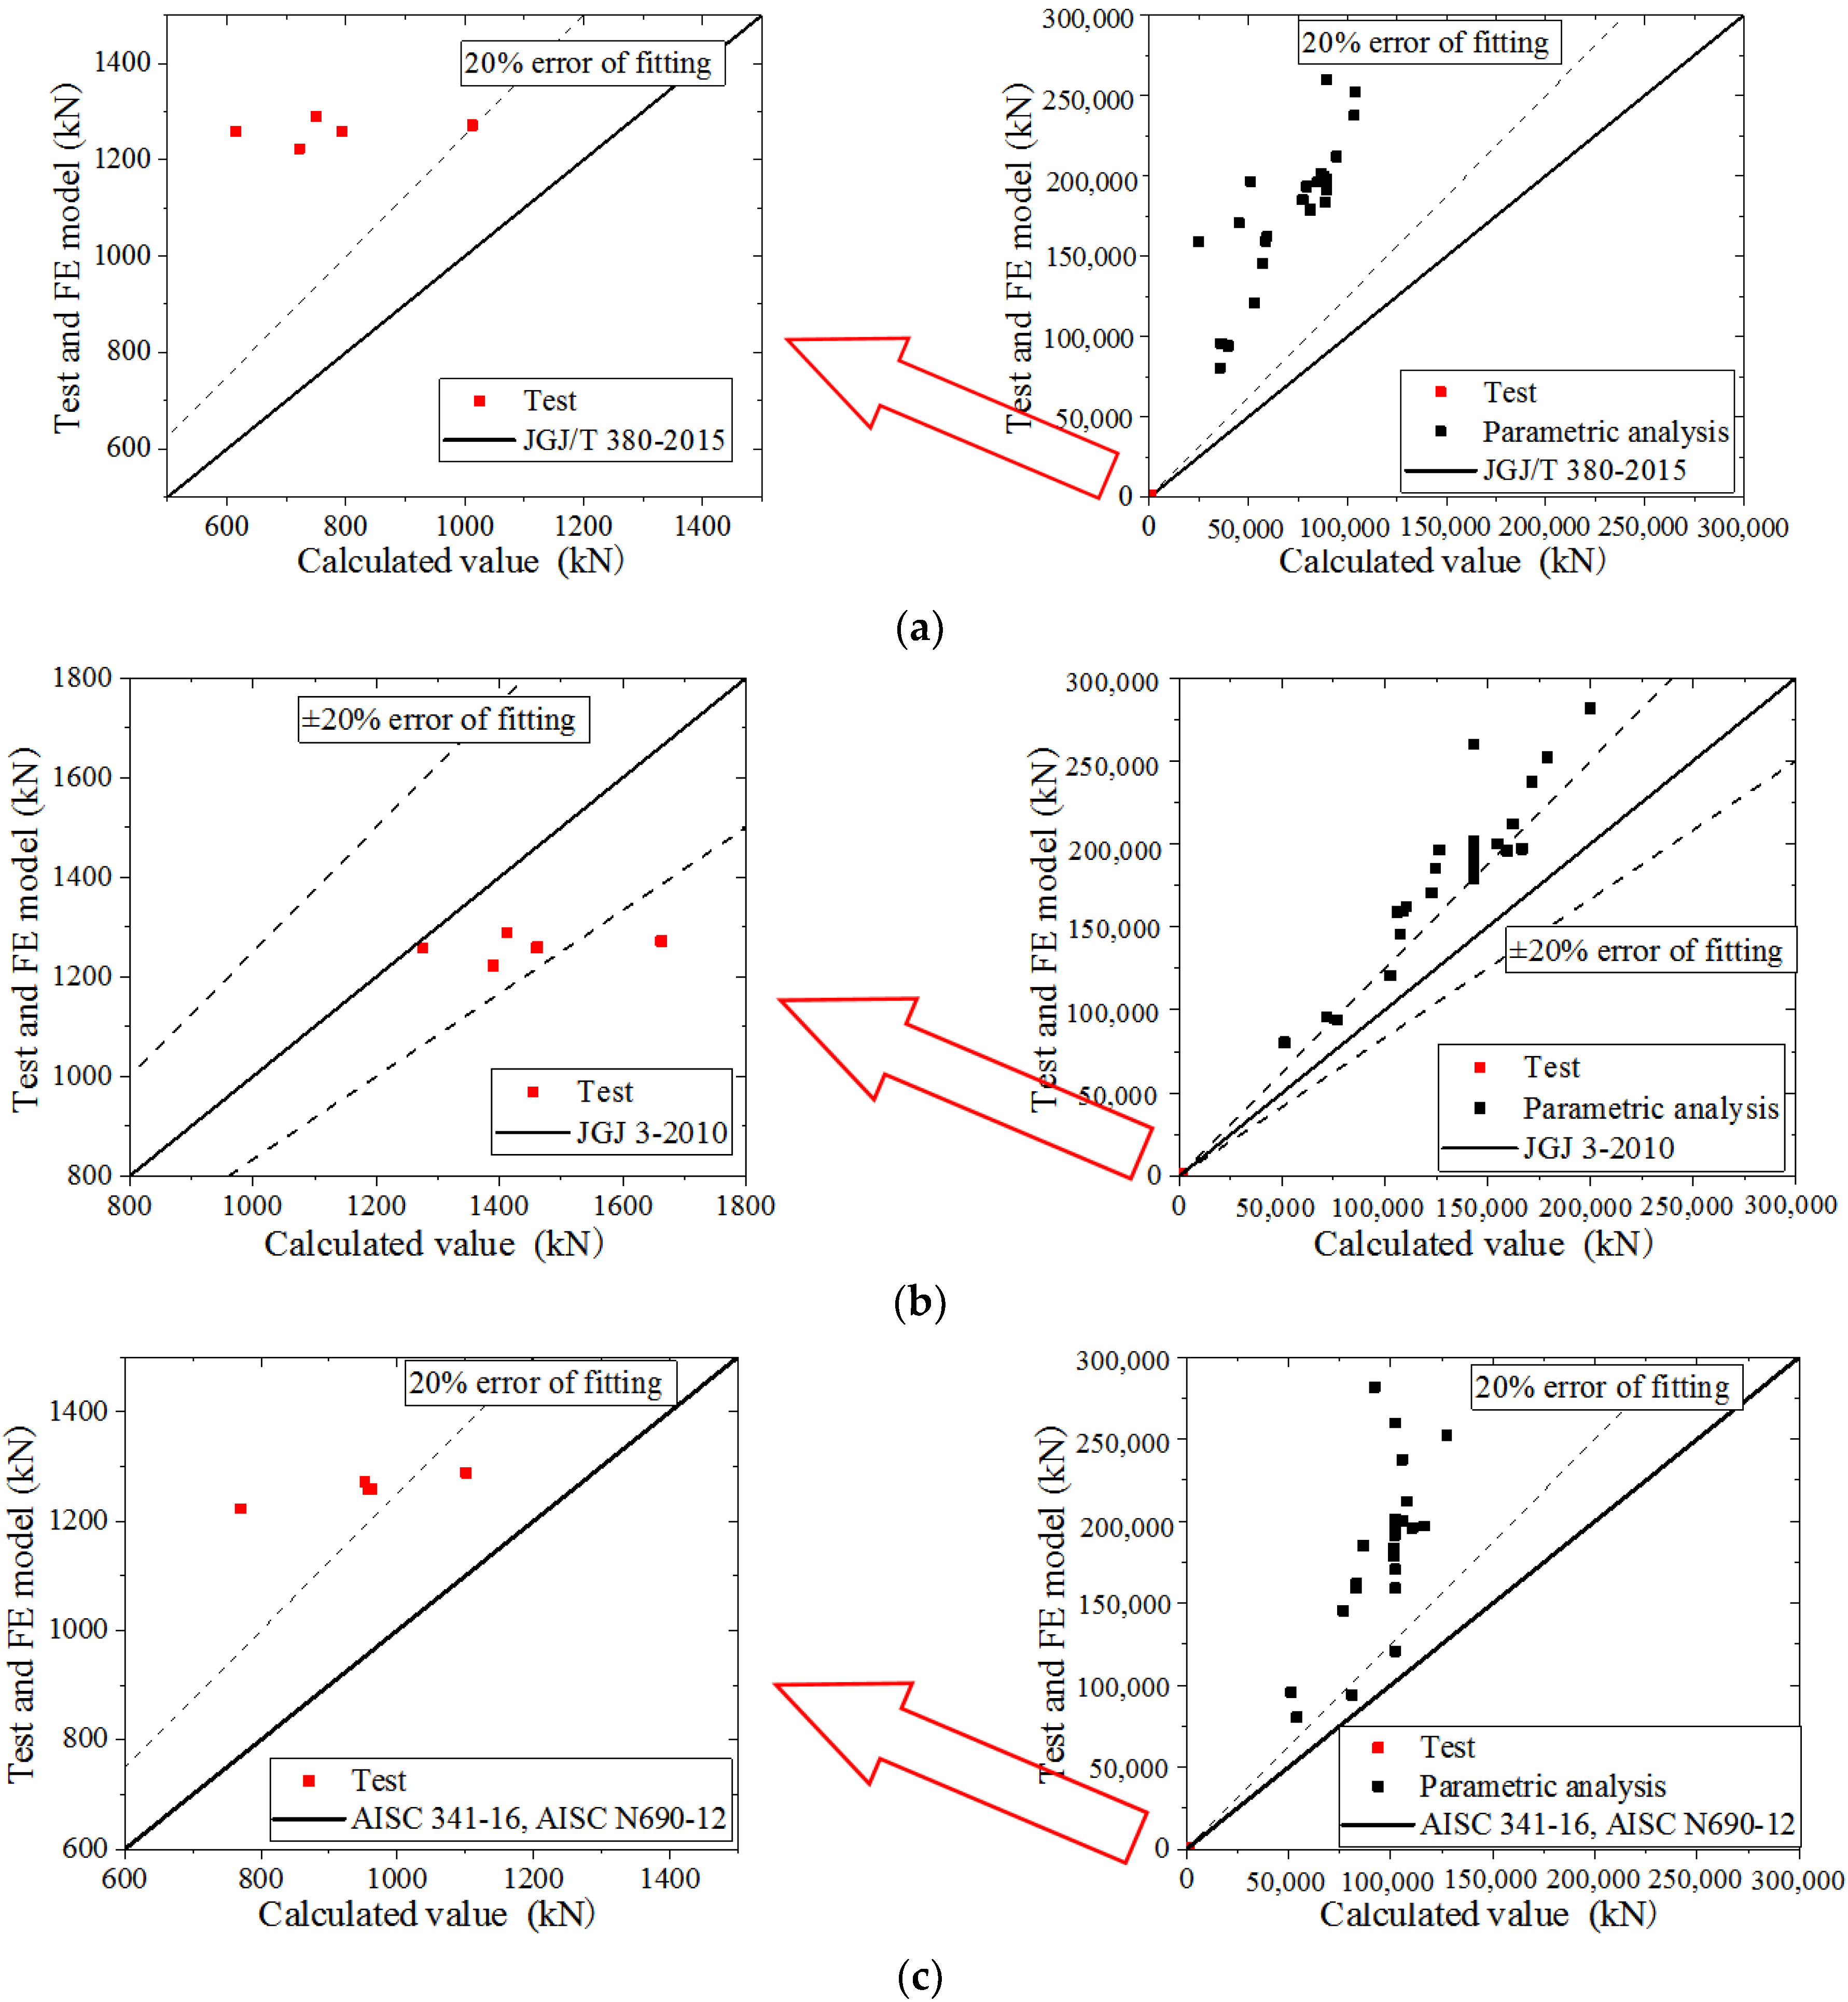
5.3. Comparison to Other Test Results
6. Conclusions
- The web plate and concrete are the main components that resisted the lateral force. The web plate is found to contribute to between 55% and 85% of the total shearing resistance of the wall.
- The corner of wall mainly resisted the vertical force and the rest of wall resisted the shear force. The concrete is separated into several columns by the stiffened plates, each of which is independent and resisted by vertical force.
- The elastic stiffness and ultimate strength capacity are enhanced with increasing wall thickness, steel ratio, axial compression ratio, and channel length-to-width ratio. The elastic stiffness and ultimate strength capacity are weakened with increasing shear span ratio.
- The parameters affecting the ductility of CWSC are the steel ratio, shear span ratio, axial compression ratio and the length-to-width ratio of the channel. The influence of steel ratio and shear span ratio on ductility is positively correlated, while the axial compression ratio and the length-to-width ratio of the channel are negatively correlated.
- Formulas are proposed to evaluate the ultimate strength capacity, yielding bearing capacity, elastic stiffness, and secant stiffness of the yield point of the composite shear wall. The formulas in this paper could predict the ultimate strength capacity more accurately than the formulas in specifications. Meanwhile, the formulas could predict the ultimate strength capacity in other tests from the literature well. The formulas can provide a basis for engineering design.
Author Contributions
Funding
Informed Consent Statement
Data Availability Statement
Acknowledgments
Conflicts of Interest
References
- Ramesh, S. Behavior and Design of Earthquake-Resistant Dual-Plate Composite Shear Wall Systems. Ph.D. Thesis, Purdue University, West Lafayette, IN, USA, 2013. [Google Scholar]
- Bruneau, M.; Alzeni, Y.; Fouché, P. Seismic Behavior of Concrete-Filled Steel Sandwich Walls and Concrete-Filled Steel Tube Columns; Steel Innovations: Buffalo, NY, USA, 2013. [Google Scholar]
- Chen, Y.; Chen, P. Structural design and research on the 1000m-high Skyscraper of CSCEC. Build. Struct. 2017, 3, 1–9. [Google Scholar]
- ASCE 7-10. Minimum Design Loads for Buildings and Other Structures; American Society of Civil Engineers: Woodbridge, VA, USA, 2010.
- AISC 341-10. Seismic Provisions for Structural Steel Buildings; American Institute of Steel Construction: Chicago, IL, USA, 2010.
- Nie, J.G.; Hu, H.S. Experimental study on seismic behavior of high-strength concrete filled double-steel-plate composite walls. J. Constr. Steel Res. 2013, 88, 206–219. [Google Scholar] [CrossRef]
- Mydin, M. Structural performance of lightweight steel-foamed concrete-steel composite walling system under compression. Thin Wall Struct. 2011, 49, 66–76. [Google Scholar] [CrossRef]
- Wright, H. Axial and bending behavior of composite walls. J. Struct. Eng. 1998, 124, 758–764. [Google Scholar] [CrossRef]
- Wang, M.Z.; Guo, Y.L.; Zhu, J.S. Flexural buckling of axially loaded concrete-infilled double steel corrugated-plate walls with T-section. J. Constr. Steel Res. 2020, 166, 105940. [Google Scholar] [CrossRef]
- Nie, X.; Wang, J.J.; Tao, M.X. Experimental study of flexural critical reinforced concrete filled composite plate shear walls. Eng. Struct. 2019, 197, 109439. [Google Scholar] [CrossRef]
- Zhang, X.; Qin, Y.; Chen, Z. Experimental seismic behavior of innovative composite shear walls. J. Constr. Steel Res. 2016, 116, 218–232. [Google Scholar] [CrossRef]
- Zhang, W.Y.; Wang, K.; Chen, Y.; Ding, Y.K. Experimental study on the seismic behaviour of composite shear walls with stiffened steel plates and infilled concrete. Thin Wall Struct. 2019, 144, 106279. [Google Scholar] [CrossRef]
- Nguyen, N.H.; Whittaker, A.S. Numerical modelling of steel-plate concrete composite shear walls. Eng. Struct. 2017, 150, 1–11. [Google Scholar] [CrossRef]
- Epackachi, S.; Whittaker, A.S.; Varma, A.H. Finite element modeling of steel-plate concrete composite wall piers. Eng. Struct. 2015, 100, 369–384. [Google Scholar] [CrossRef]
- Rafiei, S.; Hossain, K.M.A.; Lachemi, M. Finite element modeling of double skin profiled composite shear wall system under in-plane loadings. Eng. Struct. 2013, 56, 46–57. [Google Scholar] [CrossRef]
- FWei, F.; Zheng, Z.J.; Yu, J. Computational method for axial compression capacity of double steel-concrete composite shear walls with consideration of buckling. Eng. Mech. 2019, 36, 157–167. [Google Scholar]
- Guo, L.H.; Wang, Y.H.; Zhang, S.M. Experimental study of rectangular multi-partition steel-concrete composite shear walls. Thin Wall Struct. 2018, 130, 577–592. [Google Scholar] [CrossRef]
- Epackachi, S.; Nguyen, N.H.; Kurt, E.G. An experimental study of the in-plane response of steel-concrete composite walls. In Proceedings of the 22nd International Conference on Structural Mechanics in Reactor Technology (SMiRT 22), San Francisco, CA, USA, 18–23 August 2013. [Google Scholar]
- Epackachi, S.; Nguyen, N.H. In-plane seismic behavior of rectangular steel-plate composite wall piers. J. Struct. Eng. 2014, 141, 04014176. [Google Scholar] [CrossRef]
- Li, X.; Li, X. Steel plates and concrete filled composite shear walls related nuclear structural engineering: Experimental study for out-of-plane cyclic loading. Nucl. Eng. Des. 2017, 315, 144–154. [Google Scholar] [CrossRef]
- Huang, Z.; Liew, J. Structural behaviour of steel-concrete-steel sandwich composite wall subjected to compression and end moment. Thin Wall Struct. 2016, 98 Pt B, 592–606. [Google Scholar] [CrossRef]
- Yan, J.B.; Liew, J.; Zhang, M.H. Experimental and analytical study on ultimate strength behavior of steel-concrete-steel sandwich composite beam structures. Mater. Struct. 2015, 48, 1523–1544. [Google Scholar] [CrossRef]
- Qin, Y.; Shu, G.P. Compressive behavior of double skin composite wall with different plate thicknesses. J. Constr. Steel Res. 2019, 157, 297–313. [Google Scholar] [CrossRef]
- Kurt, E.G.; Varma, A.H.; Booth, P. In-Plane Behavior and Design of Rectangular SC Wall Piers without Boundary Elements. J. Struct. Eng. 2016, 142, 04016026. [Google Scholar] [CrossRef]
- AISC N690-12. Specification for Safety-Related Steel Structures for Nuclear Facilities; American Institute of Steel Construction: Chicago, IL, USA, 2014.
- ACI 318-08. Building Code Requirements for Structural Concrete and Commentary; American Concrete Institute: Farmington Hills, MI, USA, 2008.
- JGJ/T 380-2015. Technical Specification for Steel Plate Shear Walls; China Ministry of Construction: Beijing, China, 2015.
- JGJ 101-1996. Specification of Testing Methods for Earthquake Resistant Building; China Architecture&Building Press: Beijing, China, 1997.
- Wang, J.F.; Li, B.B.; Li, J.C. Experimental and analytical investigation of semi-rigid CFST frames with external SCWPs. J. Constr. Steel Res. 2017, 128, 289–304. [Google Scholar] [CrossRef]
- Wierzbicki, T.; Bao, Y.B.; Lee, Y.W. Calibration and evaluation of seven fracture models. Int. J. Mech. Sci. 2005, 47, 719–743. [Google Scholar] [CrossRef]
- Cook, J.W.H. Fracture characteristics of three metals subjected to various strains, strain rates, temperatures and pressures. Eng. Fract. Mech. 1985, 21, 31–48. [Google Scholar]
- Yu, H.L.; Jeong, D.Y. Application of a stress triaxiality dependent fracture criterion in the finite element analysis of unnotched Charpy specimens. Theor. Appl. Fract. Mec. 2010, 54, 54–62. [Google Scholar] [CrossRef]
- Bao, Y. Prediction of Ductile Crack Formation in Uncracked Bodies. Ph.D. Thesis, Department of Ocean Engineering, Massachusetts Institute of Technology, Cambridge, MA, USA, 2003. [Google Scholar]
- Zhou, T.H.; Wen, C.L.I.; Guan, Y. Damage analysis of steel frames under cyclic load based on stress triaxiality. Eng. Mech. 2014, 31, 146–155. [Google Scholar]
- Han, L.H. Concrete Infilled by Steel Tube Structure-Theory and Practice; Science Publishing: Beijing, China, 2007. [Google Scholar]
- Wang, Z.Q.; Yu, Z.W. Concrete Damage Model Based on Energy Loss. J. Build. Mater. 2004, 7, 365–369. [Google Scholar] [CrossRef]
- Tran, C.T.N.; Li, B. Initial Stiffness of Reinforced Concrete Columns with Moderate Aspect Ratios; SAGE Publications Sage: London, UK, 2016; Volume 15. [Google Scholar]
- Park, R.; Thompson, K.J. Behavior of Prestressed, Partially Prestressed, and Reinforced Concrete Interior Beam-Column Assemblied under Cyclic Loading: Test Results of Units 1 to 7; University of Canterbury: Christchurch, New Zealand, 1974. [Google Scholar]
- Wang, K.; Zhang, W.Y.; Ding, Y.K.; Chen, Y. The analysis of axial compression ratio and shear-span ratio of shear wall in high-rise buildings. Institute of Structural Stability and Fatigue, China Steel Construction Society. Ind. Constr. 2021, 4, 103–106. [Google Scholar]
- Ji, X.D.; Jiang, F.M.; Qian, J.R. Seismic behavior of steel tube-double steel plate-concrete composite walls: Experimental tests. J. Constr. Steel Res. 2013, 86, 17–30. [Google Scholar] [CrossRef]
- Huang, L.; Lu, Y.Q.; Xu, Z.P. Correctional recommendation of bearing capacity formula of RC compression-bending members. Eng. Mech. 2012, 29, 169–175. [Google Scholar]
- Sheet, I.S.; Gunasekaran, U.; MacRae, G.A. Experimental investigation of CFT column to steel beam connections under cyclic loading. J. Constr. Steel Res. 2013, 86, 167–178. [Google Scholar] [CrossRef]
- JGJ 3-2010. Technical Specification for Concrete Structures of Tall Building; China Ministry of Construction: Beijing, China, 2010.
- AISC 341-16. Seismic Provisions for Structural Steel Buildings; American Institute of Steel Construction: Chicago, IL, USA, 2016.
- Chen, L.H.; Wang, S.Y. Seismic behavior of double-skin composite wall with L-shaped and C-shaped connectors. J. Constr. Steel Res. 2019, 160, 255–270. [Google Scholar] [CrossRef]


| Sample | Height of Wall (H/mm) | Cross Section of Wall (B × T/mm × mm) | Cross Section of Channel (b × T/mm × mm) |
|---|---|---|---|
| CWSC-1 | 1050 | 700 × 120 | 175 × 120 |
| CWSC-2 | 1050 | 700 × 120 | 233 × 120 |
| CWSC-3 | 1050 | 700 × 120 | 140 × 120 |
| CWSC-4 | 1050 | 700 × 105 | 175 × 105 |
| CWSC-5 | 1050 | 700 × 135 | 175 × 135 |
| Sample | Ultimate Strength Capacity | Yielding Strength Capacity | |||||
|---|---|---|---|---|---|---|---|
| Test Value (kN) | Calculated Value (kN) | Error of Fitting | Test Value (kN) | Calculated Value (kN) | Error of Fitting | ||
J.G. Nie [4] | CFSCW-2 | 2539 | 2150 | −15% | 2153 | 1775 | −18% |
| CFSCW-4 | 2198 | 2005 | −9% | 1914 | 2005 | 5% | |
| CFSCW-5 | 2120 | 1906 | −10% | 1827 | 1906 | 4% | |
| CFSCW-6 | 2357 | 2098 | −11% | 1984 | 2098 | 6% | |
| CFSCW-10 | 1117 | 1052 | −6% | 954 | 874 | −8% | |
| CFSCW-11 | 1365 | 1359 | 0% | 1157 | 1142 | −1% | |
| CFSCW-12 | 2018 | 1892 | −6% | 1748 | 1628 | −7% | |
X.D. Ji [40] | SW-1 | 814 | 865 | 6% | 669 | 712 | 7% |
| SW-2 | 809 | 856 | 6% | 614 | 704 | 15% | |
| SW-3 | 669 | 700 | 5% | 509 | 575 | 13% | |
| SW-4 | 799 | 774 | −3% | 597 | 636 | 7% | |
L.H. Chen [45] | DSCW-L1 | 777 | 653 | −16% | 515 | 523 | 2% |
| DSCW-L2 | 785 | 674 | −14% | 465 | 542 | 17% | |
| DSCW-L3 | 801 | 694 | −13% | 553 | 560 | 1% | |
| DSCW-C1 | 791 | 694 | −12% | 521 | 560 | 8% | |
L.H. Guo [17] | CSW-8 | 457 | 448 | −2% | 392 | 373 | −5% |
X. Zhang [11] | YZQ-1 | 999 | 932 | −7% | 776 | 755 | −3% |
| YZQ-2 | 947 | 1064 | 12% | 758 | 873 | 15% | |
| YZQ-3 | 1288 | 1132 | −12% | 934 | 922 | −1% | |
| YZQ-5 | 1209 | 1231 | 2% | 953 | 1011 | 6% | |
| YZQ-7 | 2209 | 2075 | −6% | 1643 | 1710 | 4% | |
Publisher’s Note: MDPI stays neutral with regard to jurisdictional claims in published maps and institutional affiliations. |
© 2021 by the authors. Licensee MDPI, Basel, Switzerland. This article is an open access article distributed under the terms and conditions of the Creative Commons Attribution (CC BY) license (https://creativecommons.org/licenses/by/4.0/).
Share and Cite
Wang, K.; Zhang, W.; Chen, Y.; Ding, Y. Seismic Analysis and Design of Composite Shear Wall with Stiffened Steel Plate and Infilled Concrete. Materials 2022, 15, 182. https://doi.org/10.3390/ma15010182
Wang K, Zhang W, Chen Y, Ding Y. Seismic Analysis and Design of Composite Shear Wall with Stiffened Steel Plate and Infilled Concrete. Materials. 2022; 15(1):182. https://doi.org/10.3390/ma15010182
Chicago/Turabian StyleWang, Ke, Wenyuan Zhang, Yong Chen, and Yukun Ding. 2022. "Seismic Analysis and Design of Composite Shear Wall with Stiffened Steel Plate and Infilled Concrete" Materials 15, no. 1: 182. https://doi.org/10.3390/ma15010182