
Fracture Surface Behavior of 34CrNiMo6 High-Strength Steel Bars with Blind Holes under Bending-Torsion Fatigue


Abstract
:
1. Introduction
2. Materials and Methods
2.1. Material and Fatigue Test Procedure
2.2. Fracture Surface Measurement

| Height Parameters (Sx), ISO 25178 | |||
|---|---|---|---|
| Sq | µm | Root-mean-square height | |
| Sv | µm | Maximum pit height | Absolute value of the height of the largest pit within the defined area |
| Sz | µm | Maximum height | Height between the highest peak and the deepest valley |
| Sa | µm | Arithmetical mean height | |
| Sp | µm | Maximum peak height | Sp = Sz - Sv |
| Ssk | - | Skewness | |
| Sku | - | Kurtosis | |
| Functional Parameters (Volume)(Vx), ISO 25178 | |||
| Vm | mm3/mm2 | Material volume | Parameters describing the characteristics of the volume of the appropriate size to the surface area of the surface being examined |
| Vv | mm3/mm2 | Void volume | |
| Vmc | mm3/mm2 | Core material volume | |
| Vmp | mm3/mm2 | Peak material volume | |
| Vvv | mm3/mm2 | Pit void volume | |
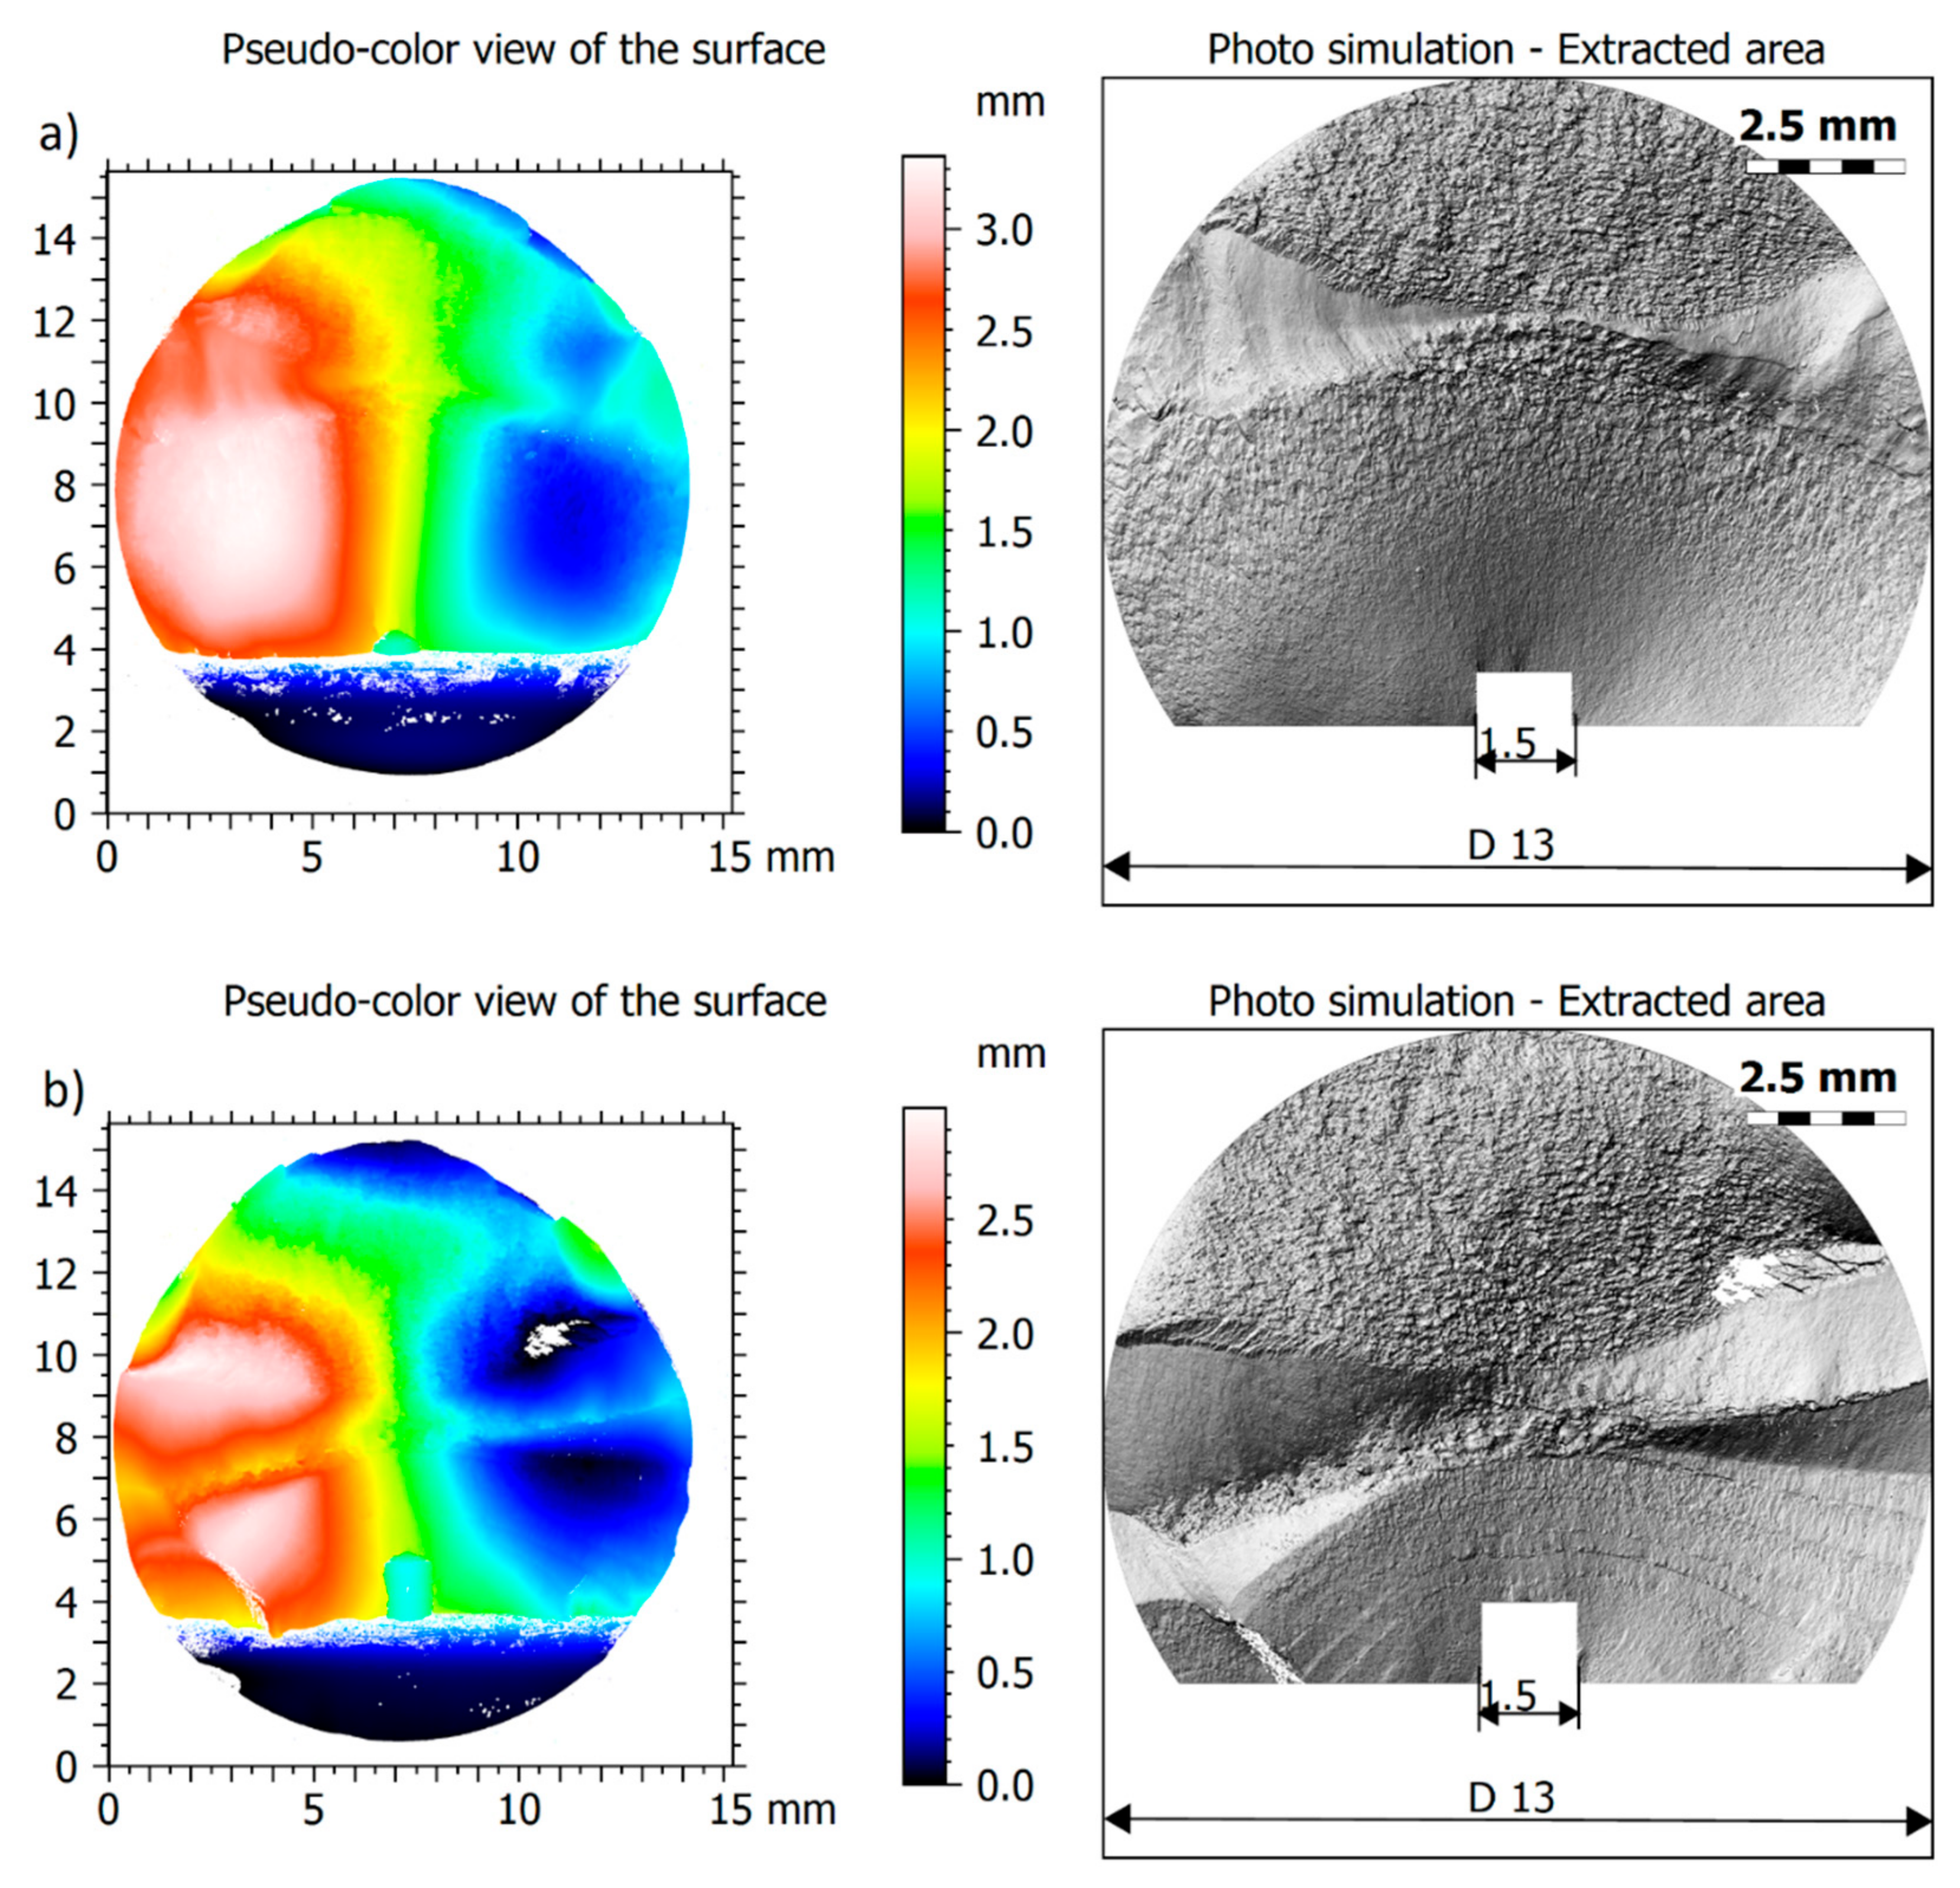
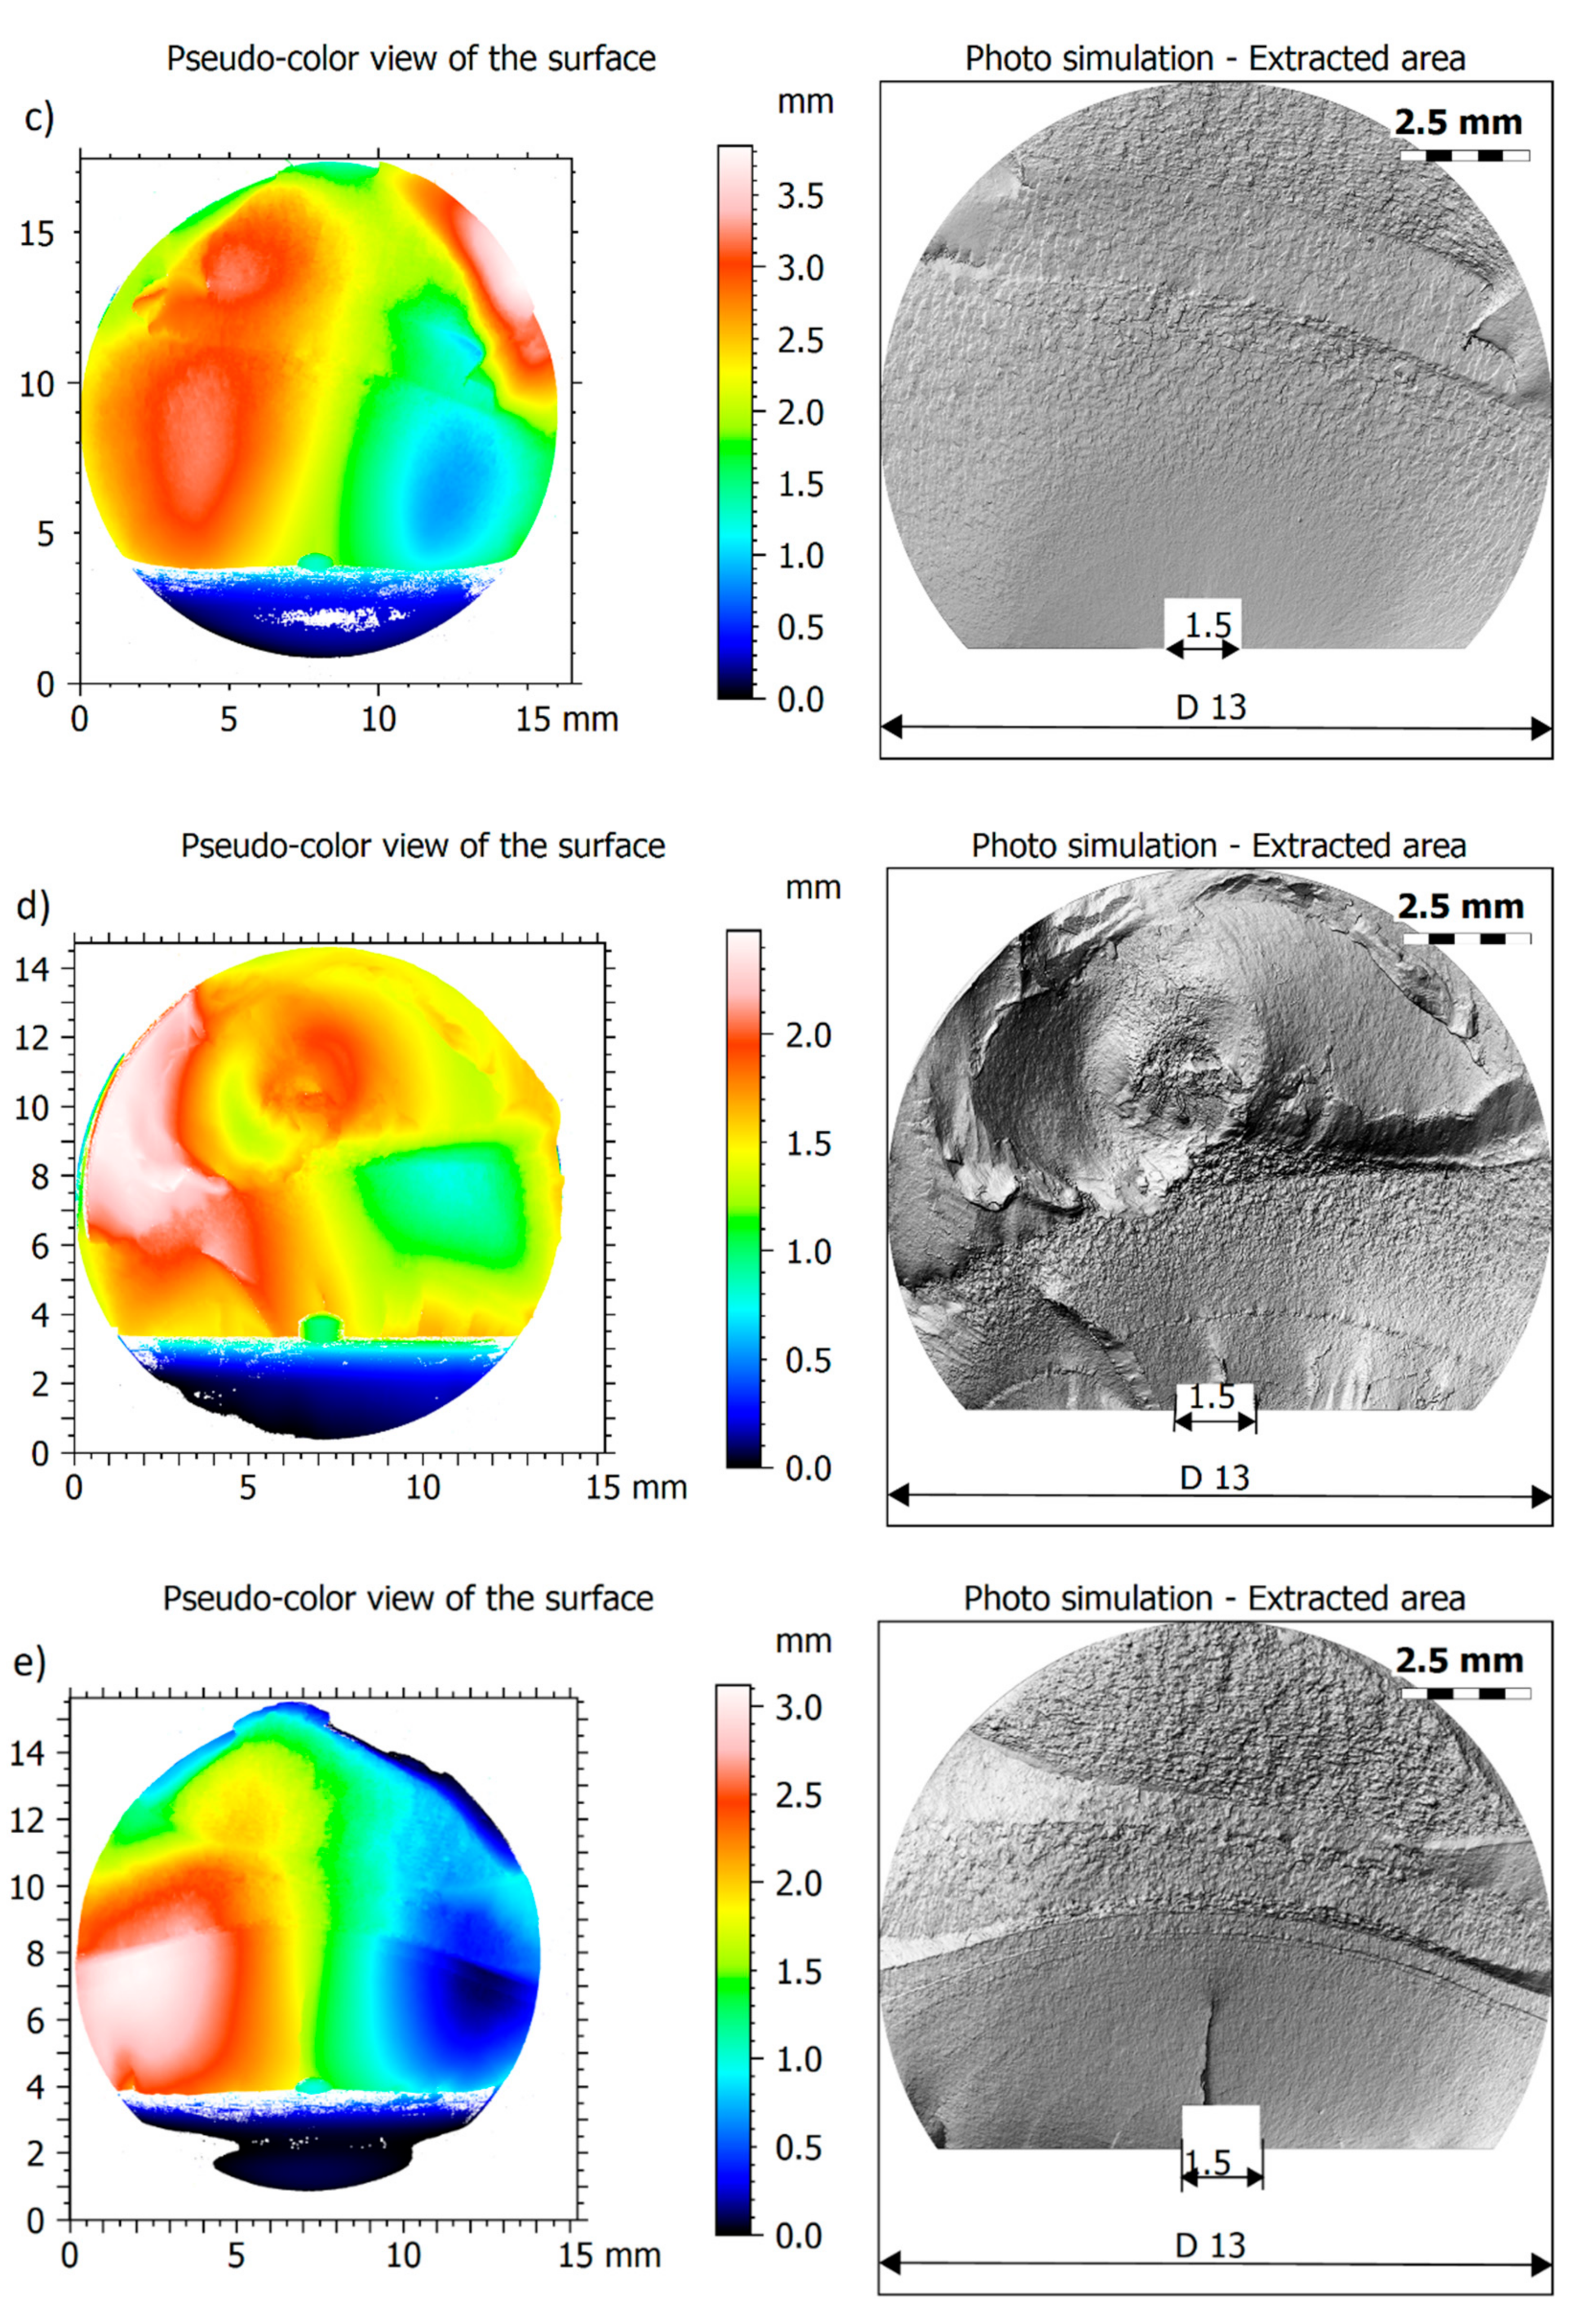
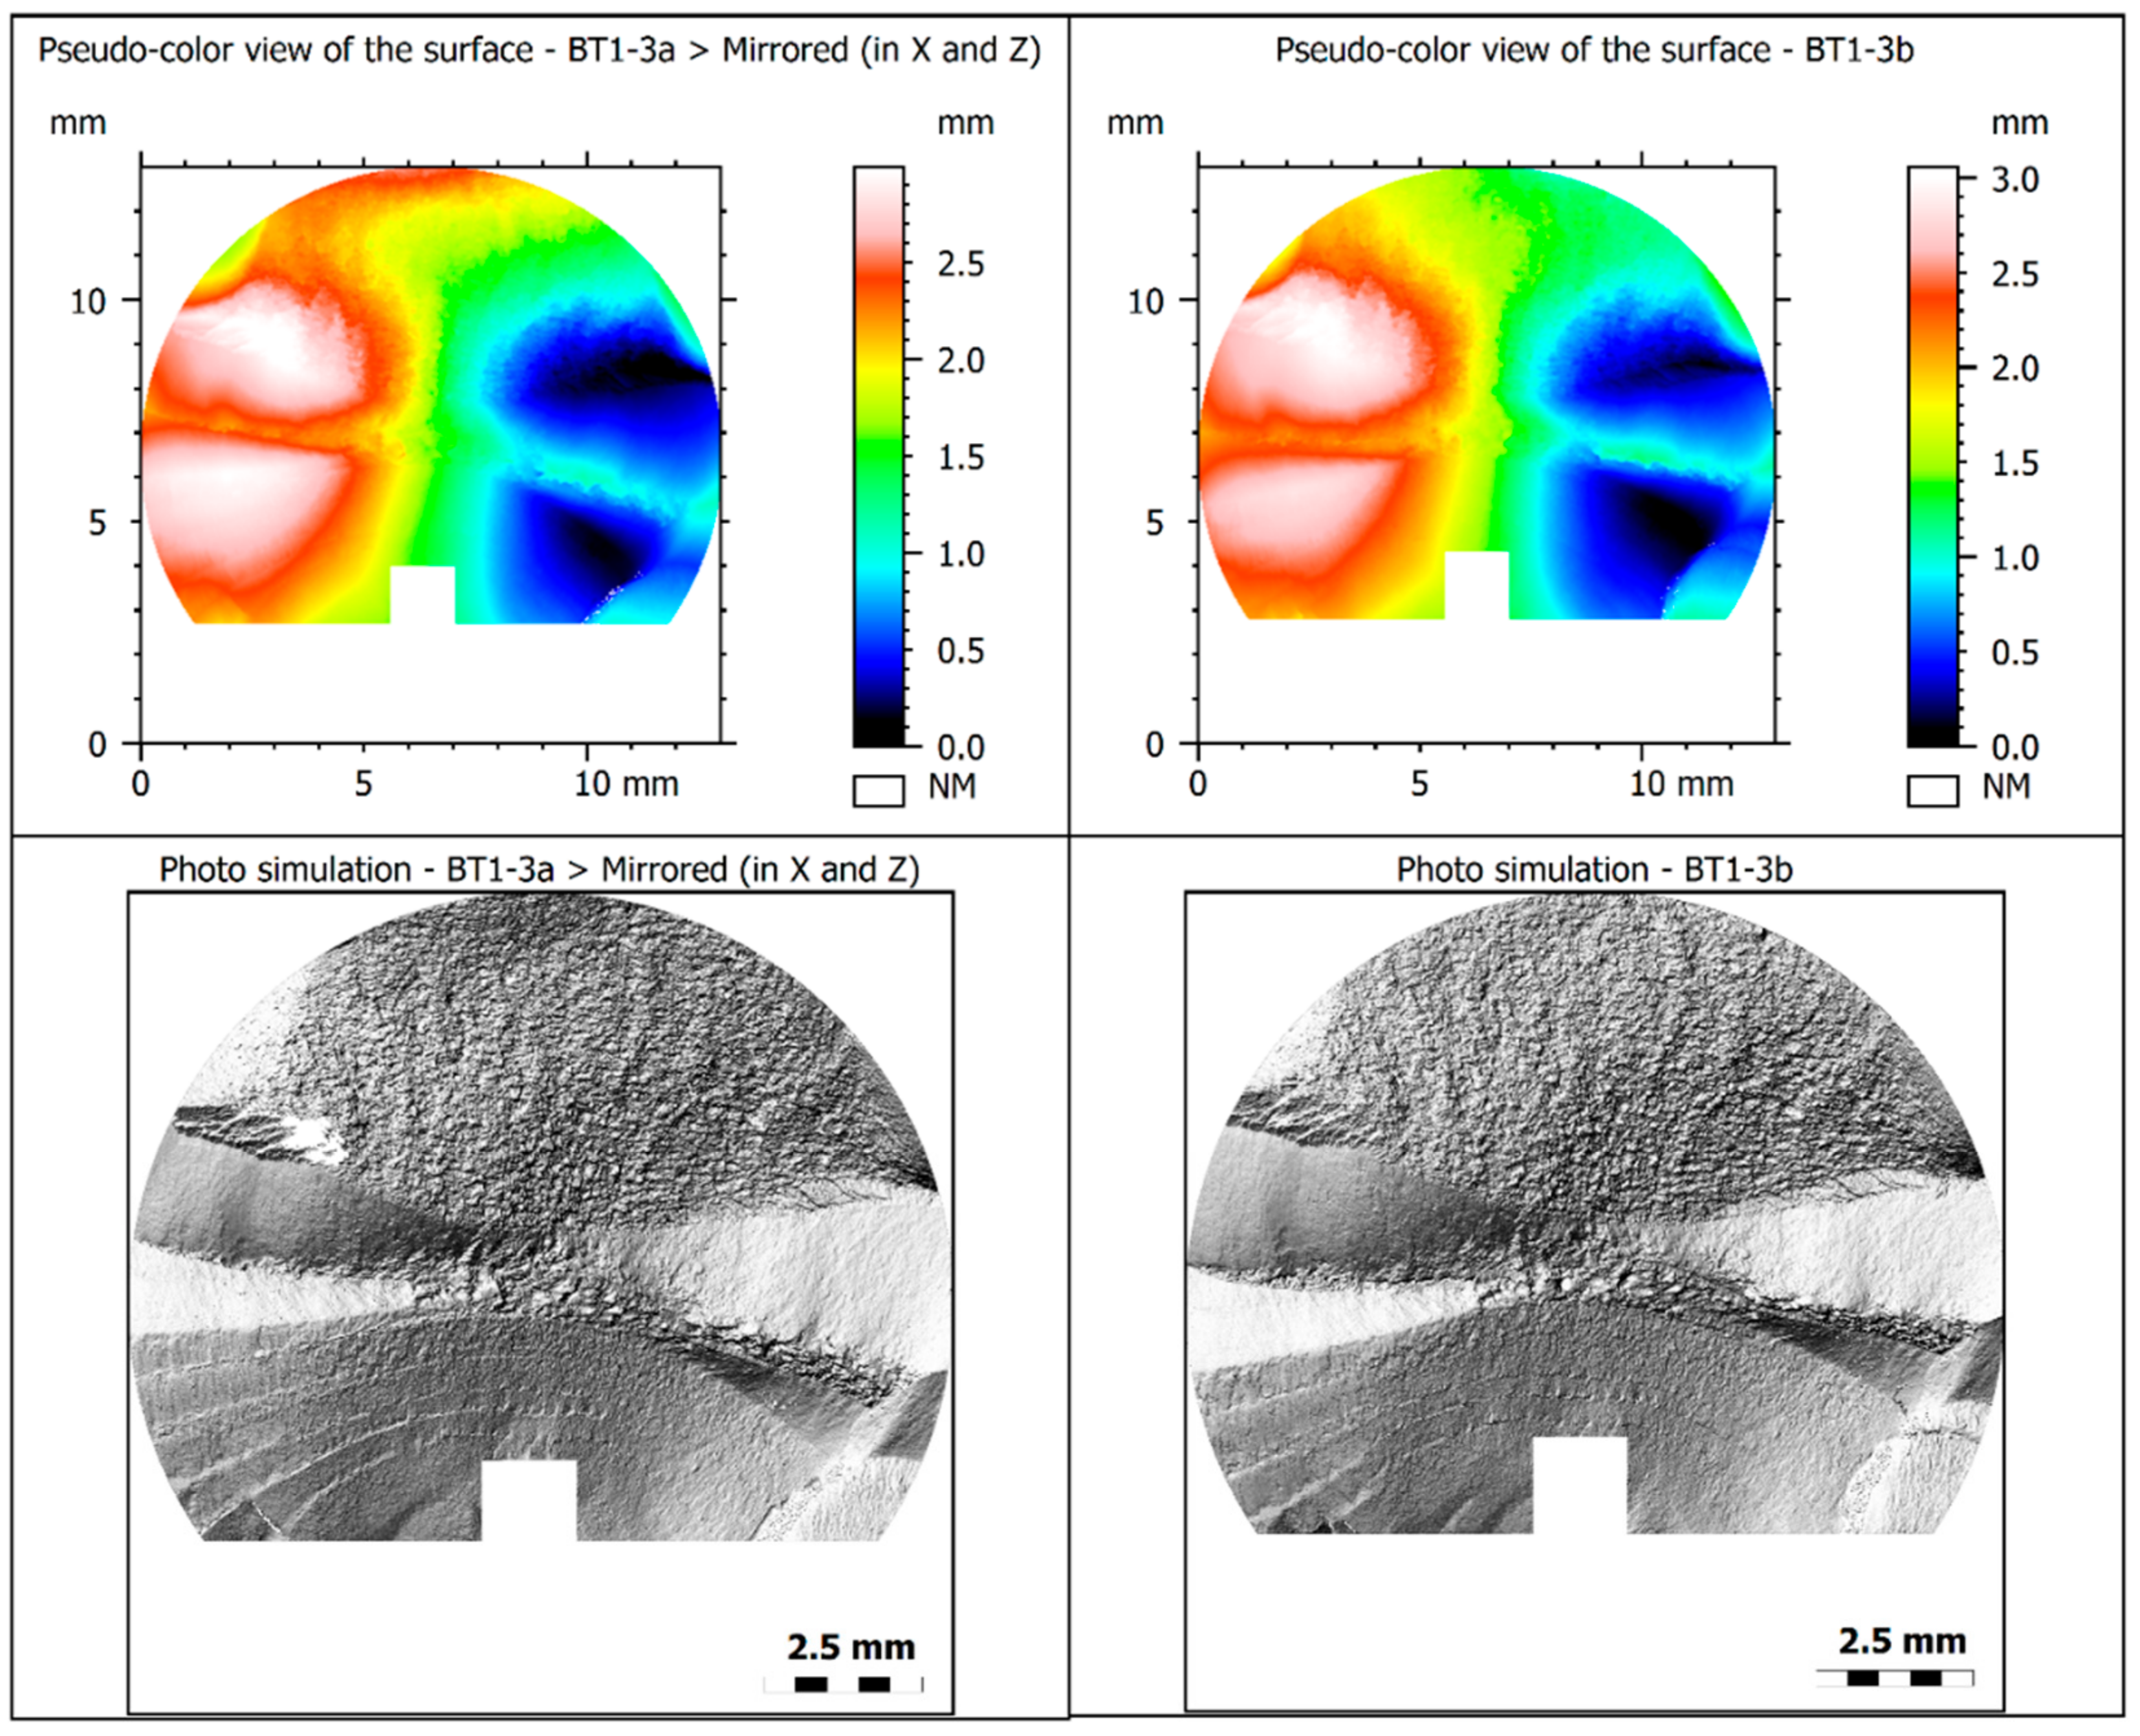
3. Results
4. Discussion
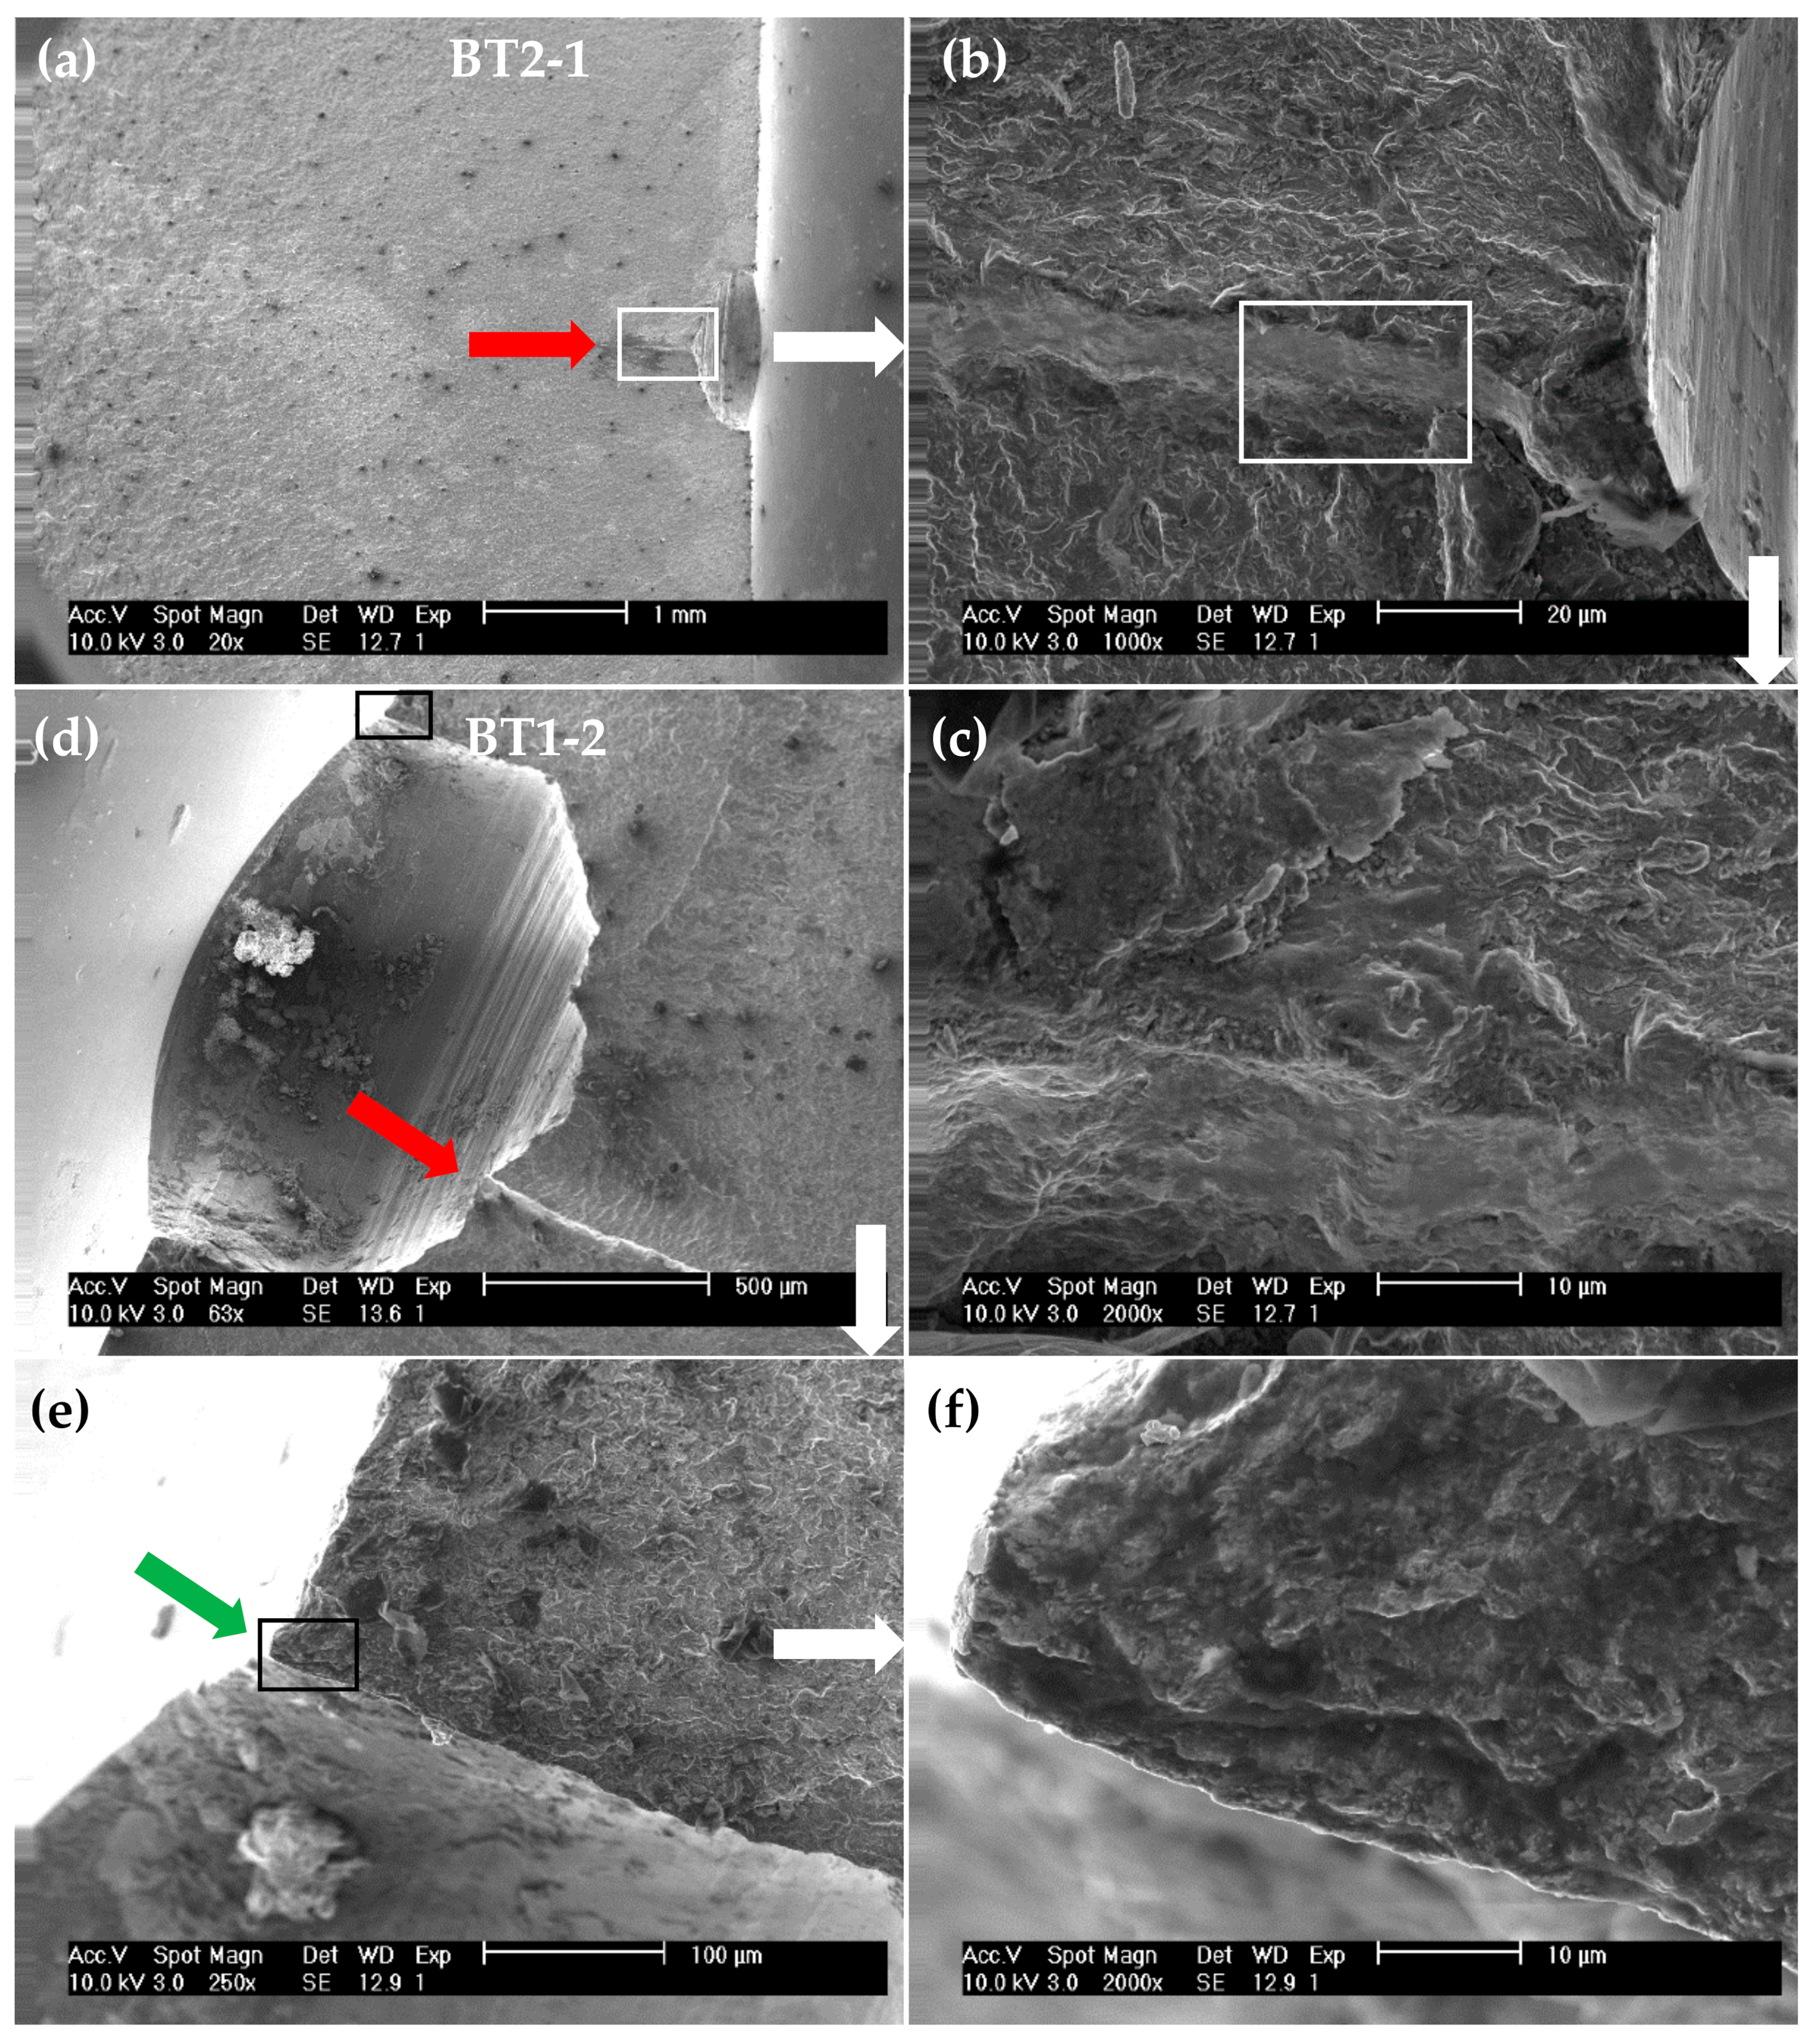
4.1. Cracking Mechanisms
4.2. Fractured Specimen Both Sides Comparison
4.3. Effect of B/T Ratio on the Fracture Surface Parameters
5. Conclusions
- −
- The approach of analyzing the entire surface of the fracture is a valid concept when trying to estimate the causes of the destruction of high-strength steels subjected to bending–torsion loading;
- −
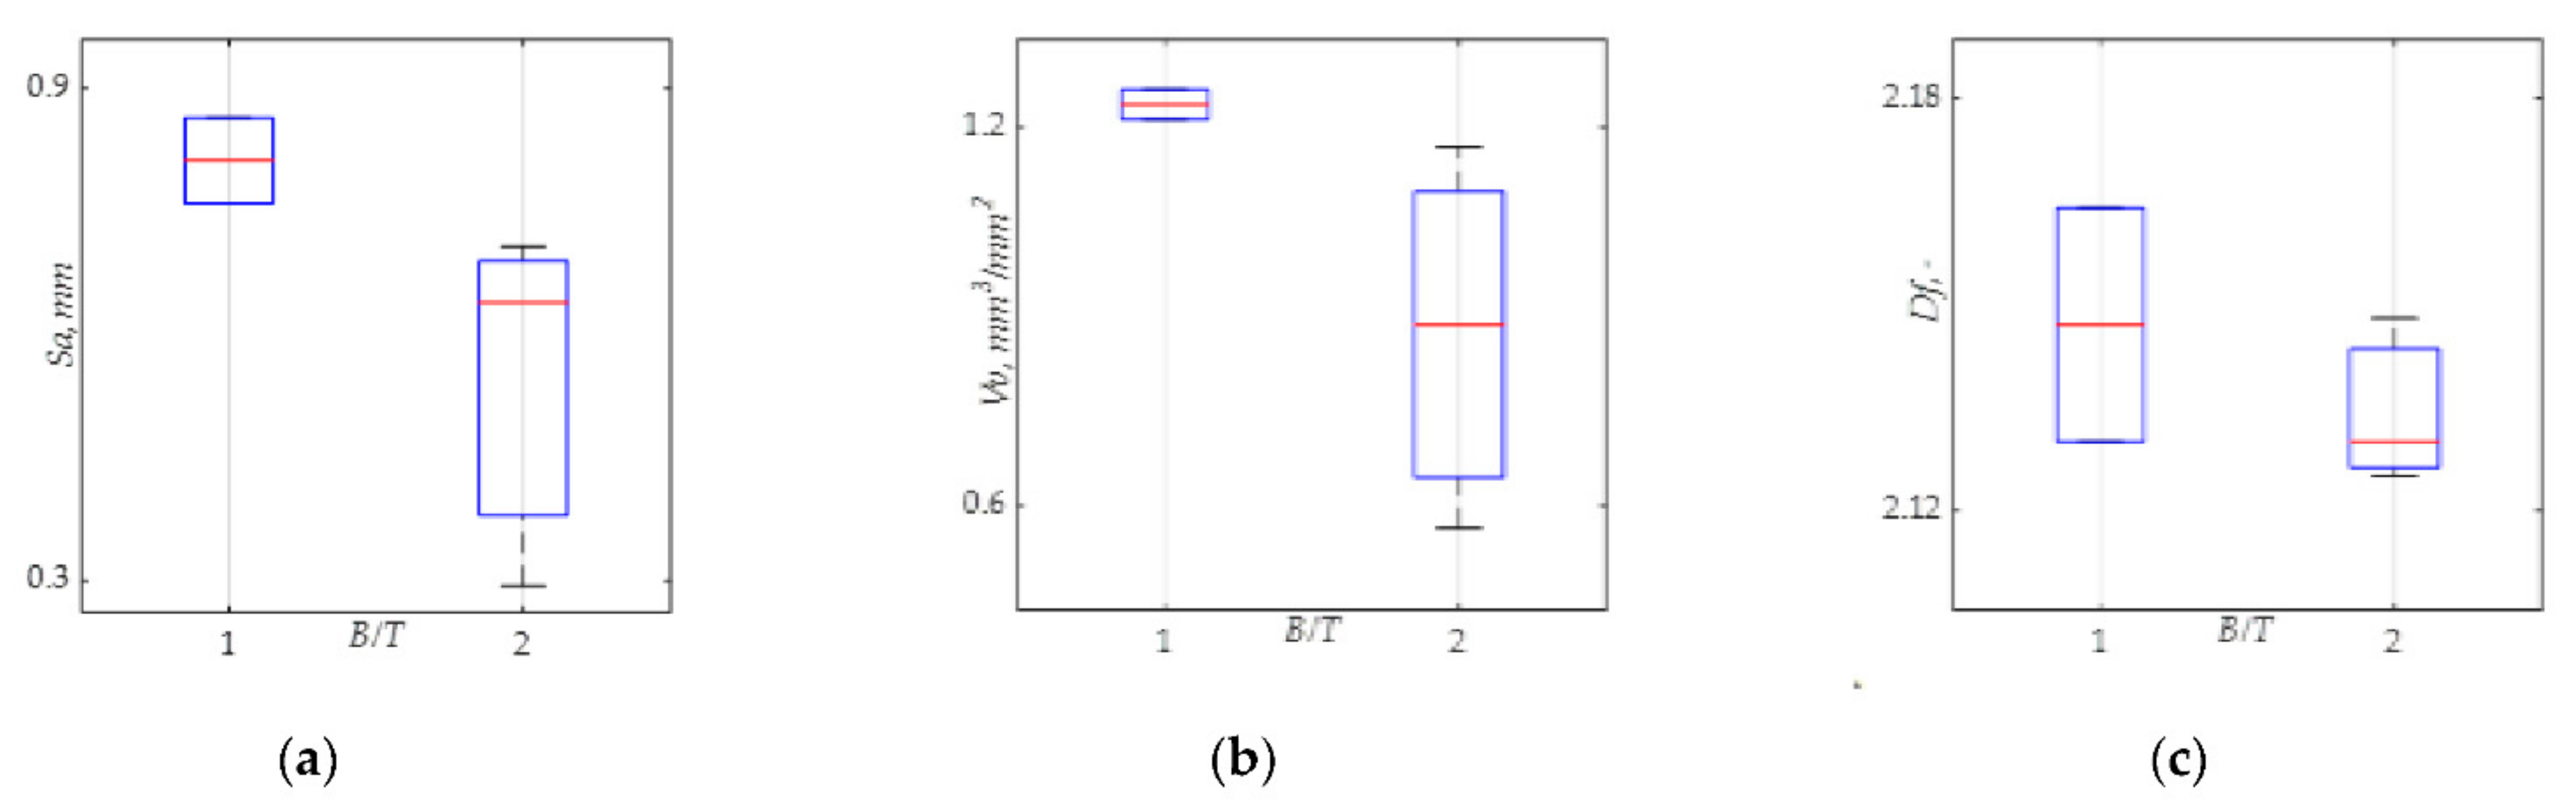
- Height (Sx), functional (Vx) and fractal dimension Df fracture surface texture parameters determined in the entire area of the fracture surface showed dependence on bending moment to torsion moment ratio;
- −
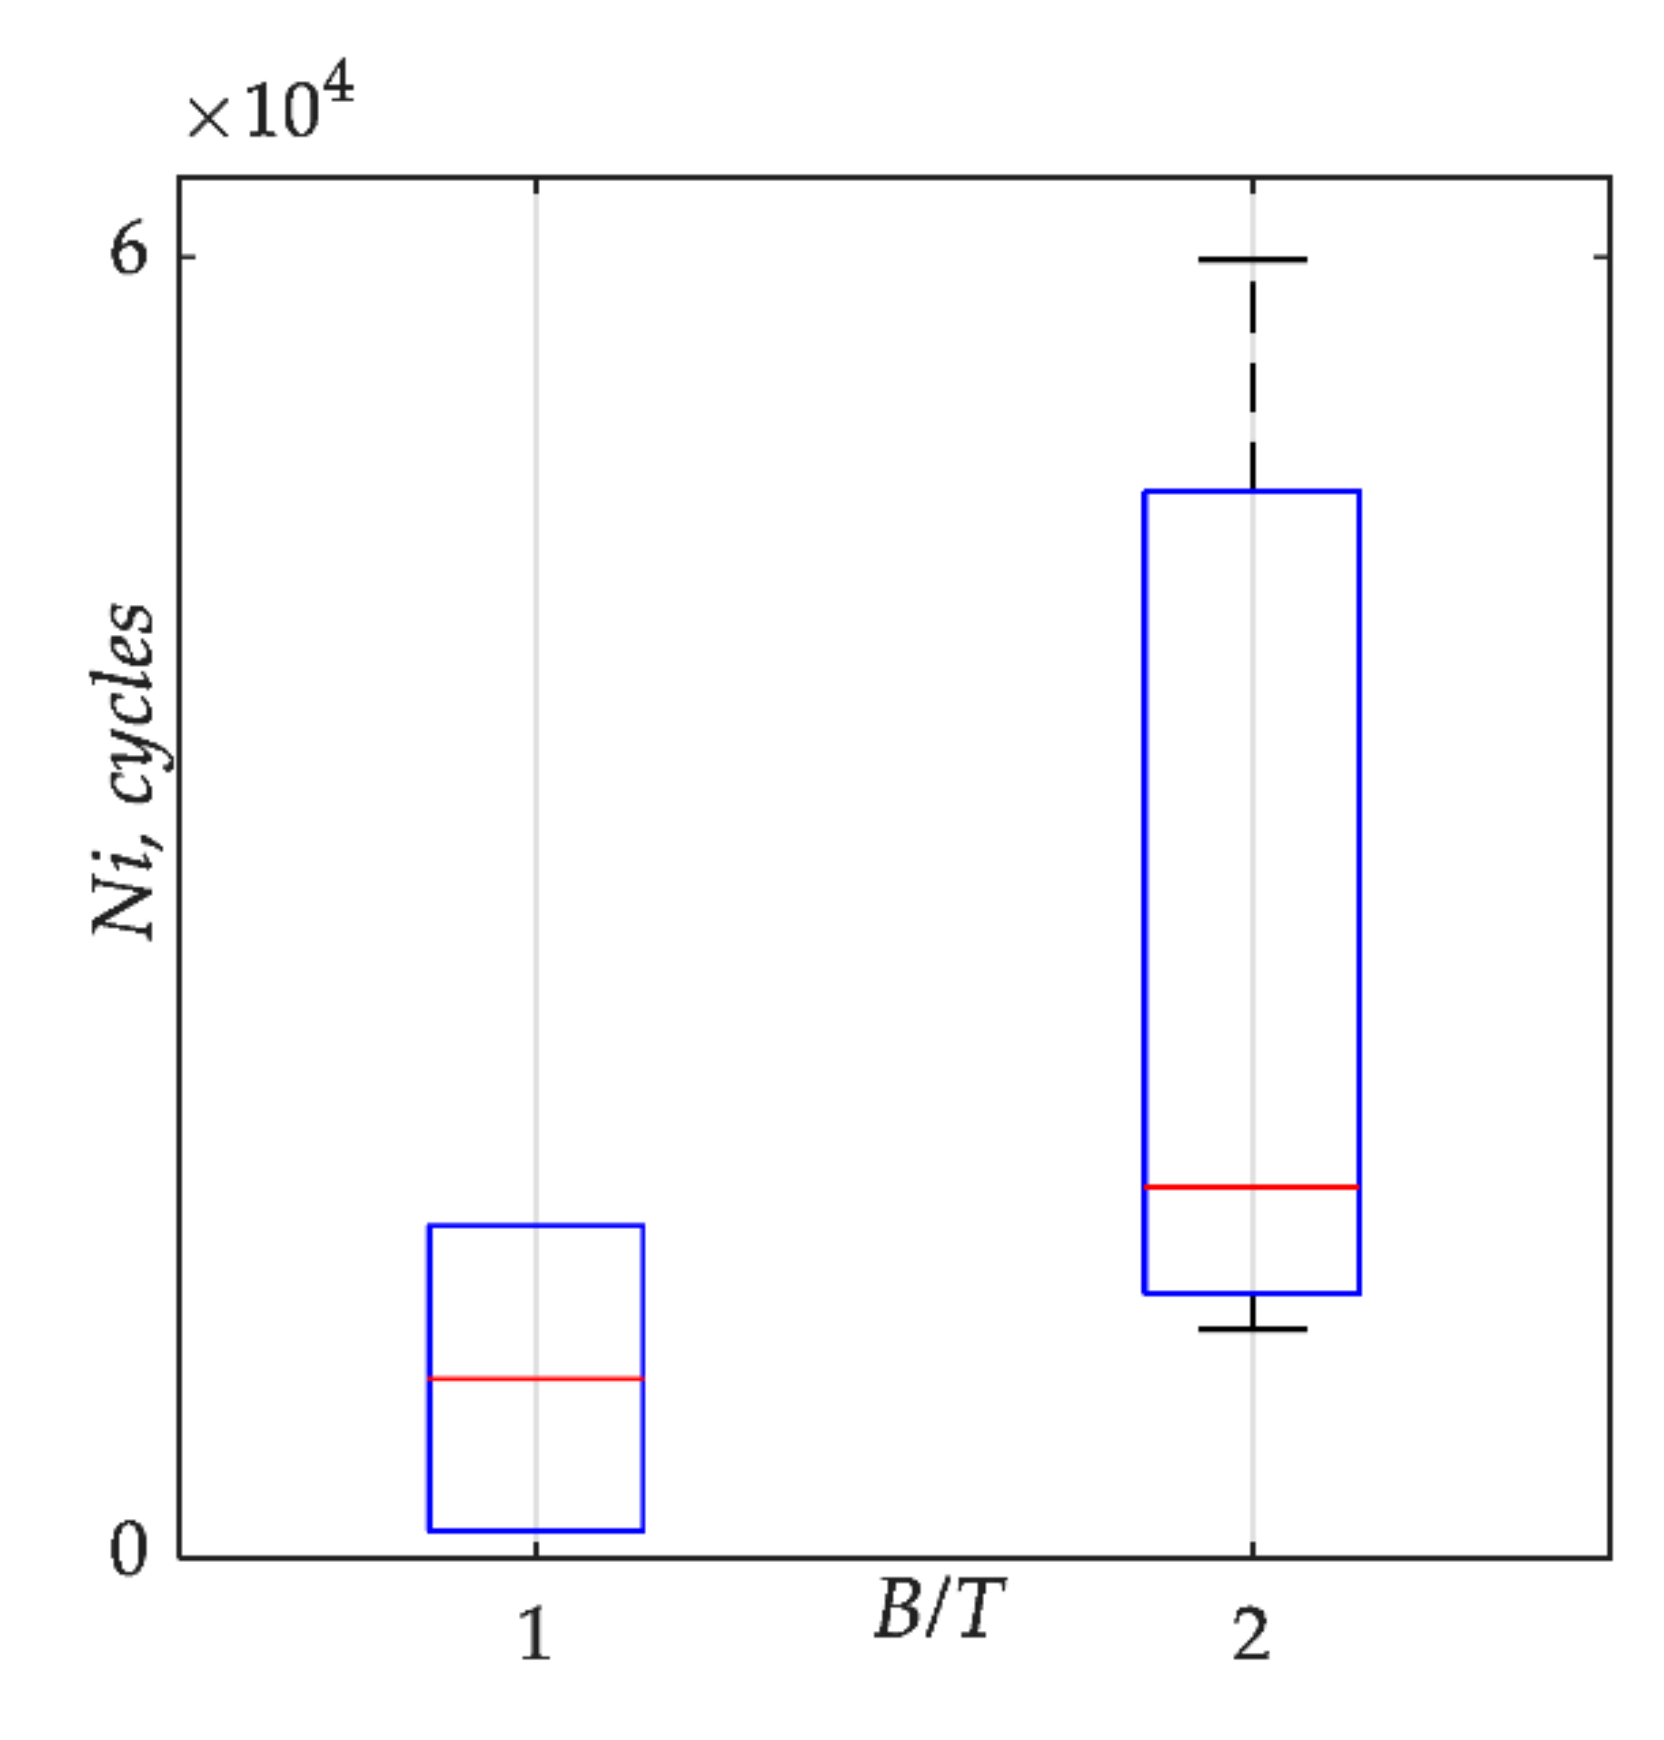
- The bending moment to torsion moment ratio has a strong influence on the crack initiation sites, crack paths in the early stage of growth, and the number of cycles to fatigue crack initiation lives.
- −
- The number of cycles to fatigue crack initiation, which is closed related to the loading scenario and stress level, significantly affects the height (Sx), functional (Vx) and fractal dimension Df fracture surface texture parameters;
- −
- The comparison of the surface topography measurements obtained for the two fracture surfaces of the same specimen demonstrated an independence of these parameters relatively to the specimen side selected in the analysis;
- −
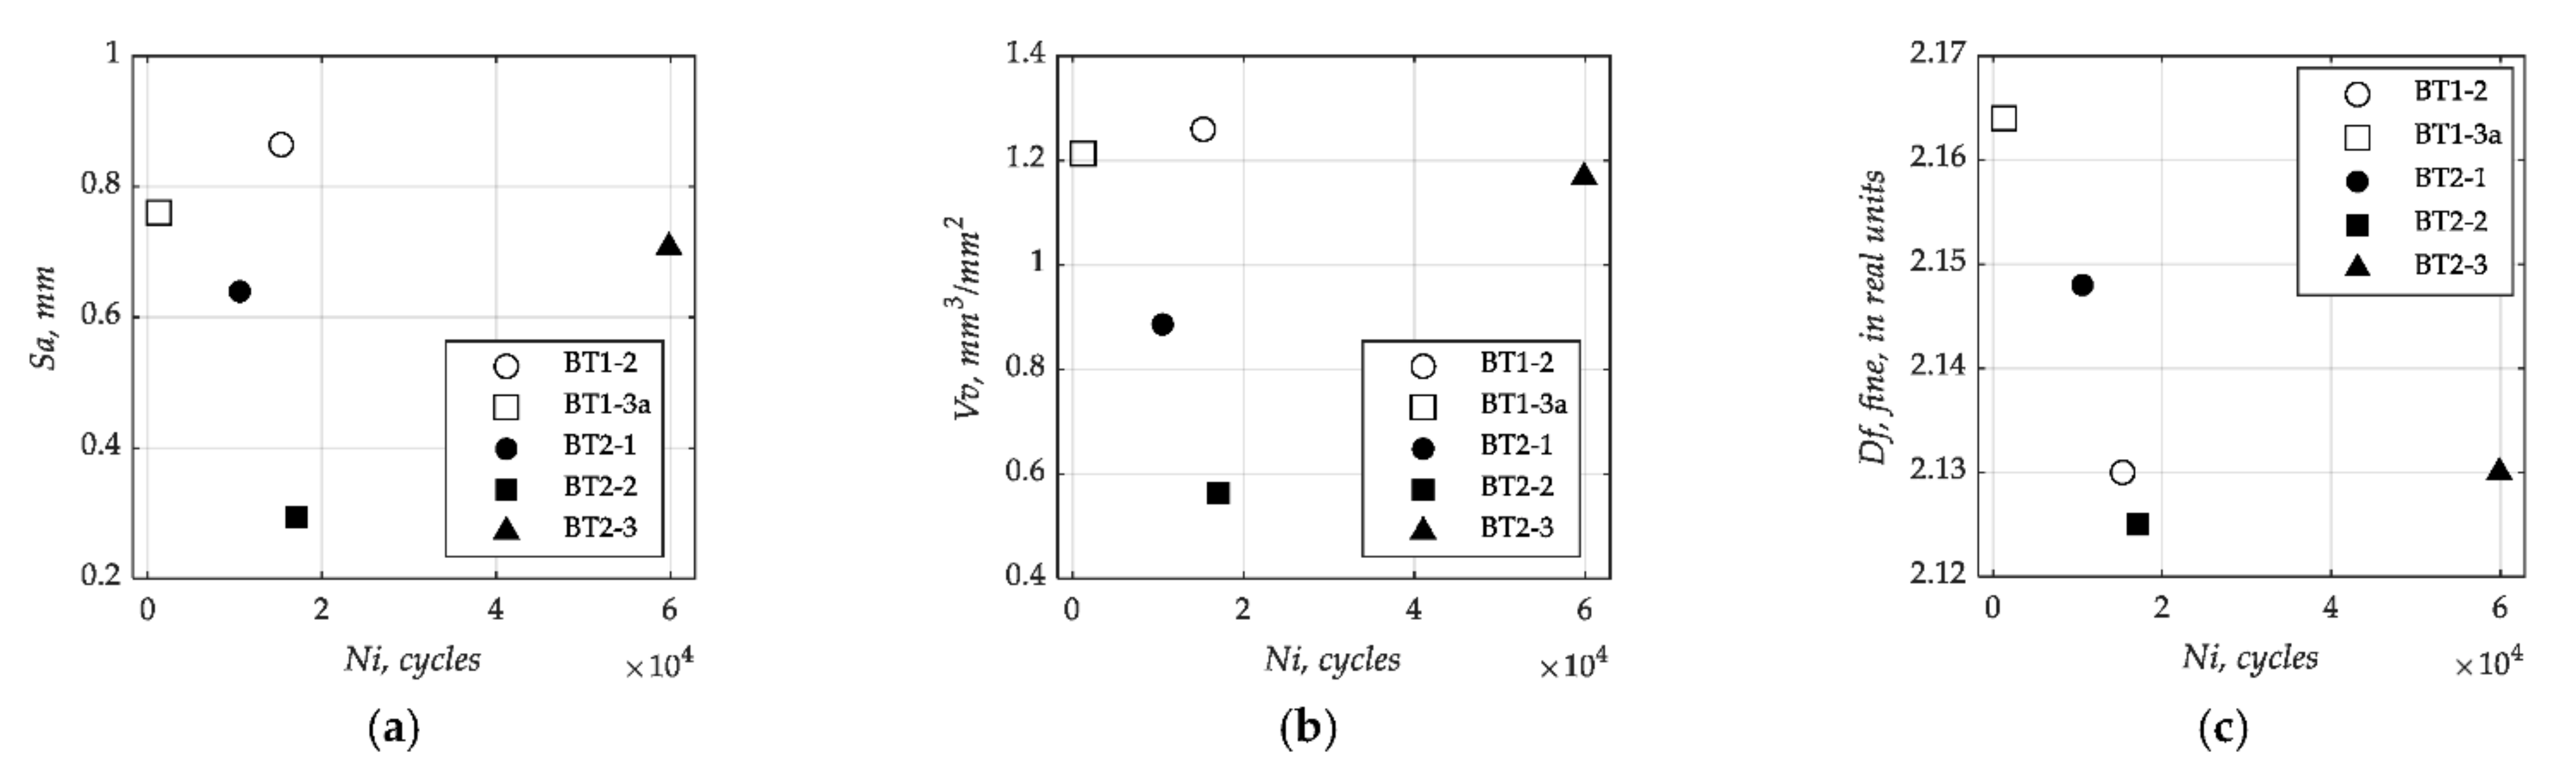
- Resolution used in the EBM has a significant impact on the results of the calculated fractal dimension Df. The most accurate values in this study were those based determined in real units with fine resolution;
- −
- Regardless of the surface texture parameters used, it was found that the smallest average values of Sa, Vv and Df occurred for the higher bending moment to torsion moment ratio.
Author Contributions
Funding
Institutional Review Board Statement
Informed Consent Statement
Data Availability Statement
Conflicts of Interest
Nomenclature
| A | mm2 | area |
| B/T | - | bending moment to torsion moment ratio |
| D | mm | specimen diameter |
| Df | - | fractal dimension |
| E | GPa | Young’s modulus |
| h | mm | hole depth |
| Ni | cycles | number of cycles to crack initiation |
| R | - | stress ratio |
| R2 | - | coefficient of determination |
| Sa | µm | arithmetical mean height |
| Sk | µm | core height |
| Sku | - | kurtosis |
| Ssk | - | skewness |
| Sp | µm | maximum peak height |
| Sq | µm | root mean square height |
| Sv | µm | maximum pit height |
| Sz | µm | maximum height |
| Vmc | µm³/µm² | |
| Vmp | µm³/µm² | |
| Vv | µm³/µm² | |
| Vvc | µm³/µm² | |
| Vvv | µm³/µm² | |
| σYS | MPa | yield strength |
| σUTS | MPa | ultimate tensile strength |
| υ | - | Poisson’s ratio |
| σa | MPa | maximum nominal stress amplitude |
| σm | MPa | nominal normal mean stress |
| τa | MPa | nominal shear stress amplitude |
| τm | MPa | nominal shear mean stress |
Appendix A
Appendix B. Fractal Dimension Df Plots and Parameters for Four Calculation Conditions
References
- Kowal, M.; Szala, M. Diagnosis of the microstructural and mechanical properties of over century-old steel railway bridge components. Eng. Fail. Anal. 2020, 110, 104447. [Google Scholar] [CrossRef]
- Tomczyk, A.; Seweryn, A. Fatigue life of EN AW-2024 alloy accounting for creep pre-deformation at elevated temperature. Int. J. Fatigue 2017, 103, 488–507. [Google Scholar] [CrossRef]
- Branco, R.; Costa, J.D.; Martins Ferreira, J.A.; Capela, C.; Antunes, F.V.; Macek, W. Multiaxial fatigue behaviour of maraging steel produced by selective laser melting. Mater. Des. 2021, 201, 109469. [Google Scholar] [CrossRef]
- Viespoli, L.M.; Johanson, A.; Alvaro, A.; Nyhus, B.; Berto, F. Strain controlled medium cycle fatigue of a notched Pb-Sn-Cd lead alloy. Eng. Fail. Anal. 2019, 104, 96–104. [Google Scholar] [CrossRef]
- Martínez, J.M.G.; Adriano, V.S.R.; Araújo, J.A.; Ferreira, J.L.A.; da Silva, C.R.M. Geometrical size effect in the fatigue life predictions of aluminum wires with micro holes using methods of the critical distance. Eng. Fract. Mech. 2019, 209, 147–161. [Google Scholar] [CrossRef]
- Macek, W.; Macha, E. The control system based on fpga technology for fatigue test stand MZGS-100 PL. Arch. Mech. Eng. 2015, 62, 85–100. [Google Scholar] [CrossRef] [Green Version]
- Jamali, J.; Mahmoodi, M.J.; Hassanzadeh-Aghdam, M.K.; Wood, J.T. A mechanistic criterion for the mixed-mode fracture of unidirectional polymer matrix composites. Compos. Part B Eng. 2019, 176, 107316. [Google Scholar] [CrossRef]
- Rozumek, D.; Marciniak, Z.; Lesiuk, G.; Correia, J.A.; de Jesus, A.M.P. Experimental and numerical investigation of mixed mode I + II and I + III fatigue crack growth in S355J0 steel. Int. J. Fatigue 2018, 113, 160–170. [Google Scholar] [CrossRef]
- Saito, S.; Ogawa, F.; Itoh, T. Investigation of fatigue strength under wide-ranged biaxial stress for two types of stainless steel using a thin-walled hollow cylinder specimen. Int. J. Fatigue 2020, 136, 105611. [Google Scholar] [CrossRef]
- Giannakis, E.; Savaidis, G. Local stress based fatigue assessment of multiaxially stressed automotive antiroll bars. Eng. Fail. Anal. 2021, 126, 105472. [Google Scholar] [CrossRef]
- Macek, W.; Łagoda, T.; Mucha, N. Energy-based fatigue failure characteristics of materials under random bending loading in elastic-plastic range. Fatigue Fract. Eng. Mater. Struct. 2017, 41, 249–259. [Google Scholar] [CrossRef]
- Branco, R.; Costa, J.D.; Borrego, L.P.; Berto, F.; Razavi, S.M.J.; Macek, W. Comparison of different one-parameter damage laws and local stress-strain approaches in multiaxial fatigue life assessment of notched components. Int. J. Fatigue 2021, 151, 106405. [Google Scholar] [CrossRef]
- Zhu, S.P.; Liu, Y.; Liu, Q.; Yu, Z.Y. Strain energy gradient-based LCF life prediction of turbine discs using critical distance concept. Int. J. Fatigue 2018, 113, 33–42. [Google Scholar] [CrossRef]
- Gillner, K.; Becker, S.; Lang, K.-H.; Münstermann, S. A method to numerically predict the loading ratio dependency of long crack propagation rates under cyclic loading. Int. J. Fatigue 2018, 116, 234–244. [Google Scholar] [CrossRef]
- Ulewicz, R.; Nový, F.; Novák, P.; Palček, P. The investigation of the fatigue failure of passenger carriage draw-hook. Eng. Fail. Anal. 2019, 104, 609–616. [Google Scholar] [CrossRef]
- Rozumek, D.; Faszynka, S. Surface cracks growth in aluminum alloy AW-2017A-T4 under combined loadings. Eng. Fract. Mech. 2020, 226, 106896. [Google Scholar] [CrossRef]
- Henry, R.; Blay, T.; Douillard, T.; Descamps-Mandine, A.; Zacharie-Aubrun, I.; Gatt, J.-M.; Langlois, C.; Meille, S. Local fracture toughness measurements in polycrystalline cubic zirconia using micro-cantilever bending tests. Mech. Mater. 2019, 136, 103086. [Google Scholar] [CrossRef]
- Krzyzak, D.; Łagoda, T. Fatigue life estimation of notched elements with use of non-local volumetric method. Int. J. Fatigue 2014, 61, 59–66. [Google Scholar] [CrossRef]
- de Menezes, E.A.W.; Marczak, R.J. Comparative analysis of different approaches for computing axial, torsional and bending stiffnesses of cables and wire ropes. Eng. Struct. 2021, 241, 112487. [Google Scholar] [CrossRef]
- Li, L.; Jiang, C.; Wang, H.; Xie, H.; Li, L. A mechanical analysis informed fractography study on load-specific fatigue behaviors of Pt–Ir coils used in implantable medical leads. J. Mech. Behav. Biomed. Mater. 2021, 116, 104364. [Google Scholar] [CrossRef]
- Mao, W.; Li, Z.; Ogeman, V.; Ringsberg, J.W. A regression and beam theory based approach for fatigue assessment of containership structures including bending and torsion contributions. Mar. Struct. 2015, 41, 244–266. [Google Scholar] [CrossRef]
- Szala, M.; Beer-Lech, K.; Walczak, M. A study on the corrosion of stainless steel floor drains in an indoor swimming pool. Eng. Fail. Anal. 2017, 77, 31–38. [Google Scholar] [CrossRef]
- Mignot, C. Color (and 3D) for scanning electron microscopy. Micros. Today 2018, 26, 12–17. [Google Scholar] [CrossRef] [Green Version]
- Djukic, M.B.; Sijacki Zeravcic, V.; Bakic, G.M.; Sedmak, A.; Rajicic, B. Hydrogen damage of steels: A case study and hydrogen embrittlement model. Eng. Fail. Anal. 2015, 58, 485–498. [Google Scholar] [CrossRef]
- Azevedo, C.R.F.; Maia, R.R.; Ariza, E.A.; Tschiptschin, A.P. Failure analysis of a martensitic stainless steel (CA-15M) roll manufactured by centrifugal casting. Part I: Material and fractographic characterization. Eng. Fail. Anal. 2014, 36, 343–352. [Google Scholar] [CrossRef]
- Rodak, K.; Brzezińska, A.; Molak, R. Compression with oscillatory torsion applied after solution treatment and aging treatment of CuCr0.6 alloy for grain refinement: Microstructure, mechanical and electrical properties. Mater. Sci. Eng. A 2018, 724, 112–120. [Google Scholar] [CrossRef]
- Hebda, E.; Bukowczan, A.; Michałowski, S.; Wroński, S.; Urbaniak, P.; Kaczmarek, M.; Hutnik, E.; Romaniuk, A.; Wolun-Cholewa, M.; Pielichowski, K. Examining the influence of functionalized POSS on the structure and bioactivity of flexible polyurethane foams. Mater. Sci. Eng. C 2020, 108, 110370. [Google Scholar] [CrossRef]
- Fisher, K.; Marquis, E. Comparing Plasma-FIB and Ga-FIB preparation of atom probe tomography samples. Microsc. Microanal. 2016, 22, 692–693. [Google Scholar] [CrossRef] [Green Version]
- Wang, Z.; Wu, W.; Qian, G.; Sun, L.; Li, X.; Correia, J.A.F.O. In-situ SEM investigation on fatigue behaviors of additive manufactured Al-Si10-Mg alloy at elevated temperature. Eng. Fract. Mech. 2019, 214, 149–163. [Google Scholar] [CrossRef]
- Pejkowski, Ł.; Skibicki, D. Stress-strain response and fatigue life of four metallic materials under asynchronous loadings: Experimental observations. Int. J. Fatigue 2019, 128, 105202. [Google Scholar] [CrossRef]
- Gryguc, A.; Behravesh, S.B.; Shaha, S.K.; Jahed, H.; Wells, M.; Williams, B.; Su, X. Low-cycle fatigue characterization and texture induced ratcheting behaviour of forged AZ80 Mg alloys. Int. J. Fatigue 2018, 116, 429–438. [Google Scholar] [CrossRef]
- Macek, W.; Rozumek, D.; Królczyk, G.M. Surface topography analysis based on fatigue fractures obtained with bending of the 2017A-T4 alloy. Meas. J. Int. Meas. Confed. 2020, 152, 107347. [Google Scholar] [CrossRef]
- Kida, K.; Ishida, M.; Mizobe, K.; Yoshida, I.; Tamura, A.; Nakane, K. Fatigue of Low Carbon Alloy Steel (JIS S45C) and a New Method of Fracture Surface Analysis; Trans Tech Publications Ltd.: Bäch, Switzerland, 2017; Volume 893, ISBN 9783035710908. [Google Scholar]
- Lauschmann, H.; Šiška, F. The reference texture: A proposal of a physical explanation. Int. J. Fatigue 2012, 43, 120–127. [Google Scholar] [CrossRef]
- Merson, E.; Danilov, V.; Merson, D.; Vinogradov, A. Confocal laser scanning microscopy: The technique for quantitative fractographic analysis. Eng. Fract. Mech. 2017, 183, 147–158. [Google Scholar] [CrossRef]
- Pomberger, S.; Stoschka, M.; Aigner, R.; Leitner, M.; Ehart, R. Areal fatigue strength assessment of cast aluminium surface layers. Int. J. Fatigue 2020, 133, 105423. [Google Scholar] [CrossRef]
- Slámečka, K.; Pokluda, J.; Kianicová, M.; Major, S.; Dvořák, I. Quantitative fractography of fish-eye crack formation under bending-torsion fatigue. Int. J. Fatigue 2010, 32, 921–928. [Google Scholar] [CrossRef]
- Sampath, D.; Akid, R.; Morana, R. Estimation of crack initiation stress and local fracture toughness of Ni-alloys 945X (UNS N09946) and 718 (UNS N07718) under hydrogen environment via fracture surface topography analysis. Eng. Fract. Mech. 2018, 191, 324–343. [Google Scholar] [CrossRef]
- Goldsmith, N.T.; Wanhill, R.J.H.; Molent, L. Quantitative fractography of fatigue and an illustrative case study. Eng. Fail. Anal. 2019, 96, 426–435. [Google Scholar] [CrossRef]
- Kobayashi, T.; Shockey, D.A. Fracture surface topography analysis (FRASTA)—Development, accomplishments, and future applications. Eng. Fract. Mech. 2010, 77, 2370–2384. [Google Scholar] [CrossRef]
- Macek, W. Correlation between fractal dimension and areal surface parameters for fracture analysis after bending-torsion fatigue. Metals 2021, 11, 1790. [Google Scholar] [CrossRef]
- Macek, W. Fracture areas quantitative investigating of bending-torsion fatigued low-alloy high-strength steel. Metals 2021, 11, 1620. [Google Scholar] [CrossRef]
- Macek, W. Fracture surface formation of notched 2017A-T4 aluminium alloy under bending fatigue. Int. J. Fract. 2021, 13, 1–17. [Google Scholar] [CrossRef]
- Branco, R.; Costa, J.D.; Berto, F.; Kotousov, A.; Antunes, F.V. Fatigue crack initiation behaviour of notched 34CrNiMo6 steel bars under proportional bending-torsion loading. Int. J. Fatigue 2020, 130, 105268. [Google Scholar] [CrossRef]
- Branco, R.; Costa, J.D.; Berto, F.; Antunes, F.V. Effect of loading orientation on fatigue behaviour in severely notched round bars under non-zero mean stress bending-torsion. Theor. Appl. Fract. Mech. 2017, 92, 185–197. [Google Scholar] [CrossRef]
- Macek, W.; Branco, R.; Szala, M.; Marciniak, Z.; Ulewicz, R.; Sczygiol, N.; Kardasz, P. Profile and areal surface parameters for fatigue fracture characterisation. Materials 2020, 13, 3691. [Google Scholar] [CrossRef] [PubMed]
- International Organization for Standardization Geometrical Product Specifications (GPS). Surface Texture: Areal Part 2: Terms, Definitions and Surface Texture Parameters; International Standard ISO: Geneva, Switzerland, 2012. [Google Scholar] [CrossRef] [Green Version]
- Krolczyk, G.M.; Krolczyk, J.B.; Maruda, R.W.; Legutko, S.; Tomaszewski, M. Metrological changes in surface morphology of high-strength steels in manufacturing processes. Meas. J. Int. Meas. Confed. 2016, 88, 176–185. [Google Scholar] [CrossRef]
- Todhunter, L.D.; Leach, R.K.; Lawes, S.D.A.; Blateyron, F. Industrial survey of ISO surface texture parameters. CIRP J. Manuf. Sci. Technol. 2017, 19, 84–92. [Google Scholar] [CrossRef]
- Tanaka, M.; Kato, R.; Fujita, T. Review of fractal analysis of fracture surfaces in various materials using three-dimensional images reconstructed by stereo matching method. Strength Fract. Complex. 2020, 12, 143–162. [Google Scholar] [CrossRef]
- Carpinteri, A.; Spagnoli, A.; Vantadori, S. An approach to size effect in fatigue of metals using fractal theories. Fatigue Fract. Eng. Mater. Struct. 2002, 25, 619–627. [Google Scholar] [CrossRef]
- Macek, W.; Branco, R.; Costa, J.D.; Pereira, C. Strain sequence effect on fatigue life and fracture surface topography of 7075-T651 aluminium alloy. Mech. Mater. 2021, 160, 103972. [Google Scholar] [CrossRef]
- Branco, R.; Prates, P.A.; Costa, J.D.; Borrego, L.P.; Berto, F.; Kotousov, A.; Antunes, F.V. Rapid assessment of multiaxial fatigue lifetime in notched components using an averaged strain energy density approach. Int. J. Fatigue 2019, 124, 89–98. [Google Scholar] [CrossRef]


| C | Si | Mn | Cr | Mo | Ni |
|---|---|---|---|---|---|
| 0.34 | ≤0.40 | 0.65 | 1.50 | 0.22 | 1.5 |
| Mechanical Property | Value |
|---|---|
| Yield strength, σYS (MPa) | 967 |
| Tensile strength, σUTS (MPa) | 1035 |
| Young’s modulus, E (GPa) | 209.8 |
| Poisson’s ratio, ν | 0.296 |
| Specimen | B/T | D (mm) | h (mm) | Ni (Cycles) | ||
|---|---|---|---|---|---|---|
| B/T = 2 (σa/τa = 4, σm/τm = 4) | ||||||
| BT2-1 | 2 | 16 | 0.3 | 224 | 239 | 10,557 |
| BT2-2 | 2 | 14 | 0.6 | 179 | 194 | 17,111 |
| BT2-3 | 2 | 14 | 0.3 | 179 | 194 | 59,878 |
| B/T = 1 (σa/τa = 2, σm/τm = 2) | ||||||
| BT1-2 | 1 | 14 | 0.5 | 179 | 194 | 15,320 |
| BT1-3 | 1 | 14 | 1.4 | 298 | 313 | 1250 |
| Parameter | Value |
|---|---|
| Magnification | 10× |
| Vertical resolution | 57.3 nm |
| Lateral resolution | 3.91 µm |
| Number of images | 19 rows × 13 columns |
| Exposure time | 168.5 µs |
| Contrast | 0.46 |
| Specimen | Sq | Ssk | Sku | Sp | Sv | Sz | Sa |
|---|---|---|---|---|---|---|---|
| B/T = 2 (σa/τa = 4, σm/τm = 4) | |||||||
| BT2-1 | 0.727513 | −0.30411 | 1.738607 | 1.053918 | 1.371258 | 2.425176 | 0.639445 |
| BT2-2 | 0.372512 | 0.191031 | 2.689261 | 0.879802 | 0.859294 | 1.739096 | 0.293833 |
| BT2-3 | 0.819989 | 0.106609 | 1.858366 | 1.563237 | 1.469907 | 3.033144 | 0.707707 |
| B/T = 1 (σa/τa = 2, σm/τm = 2) | |||||||
| BT1-2 | 0.963171 | −0.05294 | 1.552058 | 1.489988 | 1.622898 | 3.112886 | 0.86415 |
| BT1-3a * | 0.853733 | 0.177983 | 1.650938 | 1.624546 | 1.36942 | 2.993966 | 0.760138 |
| BT1-3b * | 0.831473 | 0.006956 | 1.681689 | 1.526147 | 1.533535 | 3.059682 | 0.735659 |
| Specimen | Vm | Vv | Vmp | Vmc | Vvc | Vvv |
|---|---|---|---|---|---|---|
| B/T = 2 (σa/τa = 4, σm/τm = 4) | ||||||
| BT2-1 | 0.025494 | 0.429055 | 0.025494 | 0.31325 | 0.392693 | 0.036362 |
| BT2-2 | 0.010651 | 1.259677 | 0.010651 | 1.084705 | 1.207675 | 0.052001 |
| BT2-3 | 0.014953 | 1.213044 | 0.014953 | 0.888243 | 1.167677 | 0.045367 |
| B/T = 1 (σa/τa = 2, σm/τm = 2) | ||||||
| BT1-2 | 0.015251 | 0.563484 | 0.015251 | 0.314601 | 0.518959 | 0.044525 |
| BT1-3a | 0.019732 | 1.168728 | 0.019732 | 0.848676 | 1.112868 | 0.05586 |
| BT1-3b | 0.013873 | 1.123438 | 0.013873 | 0.906254 | 1.072114 | 0.051325 |
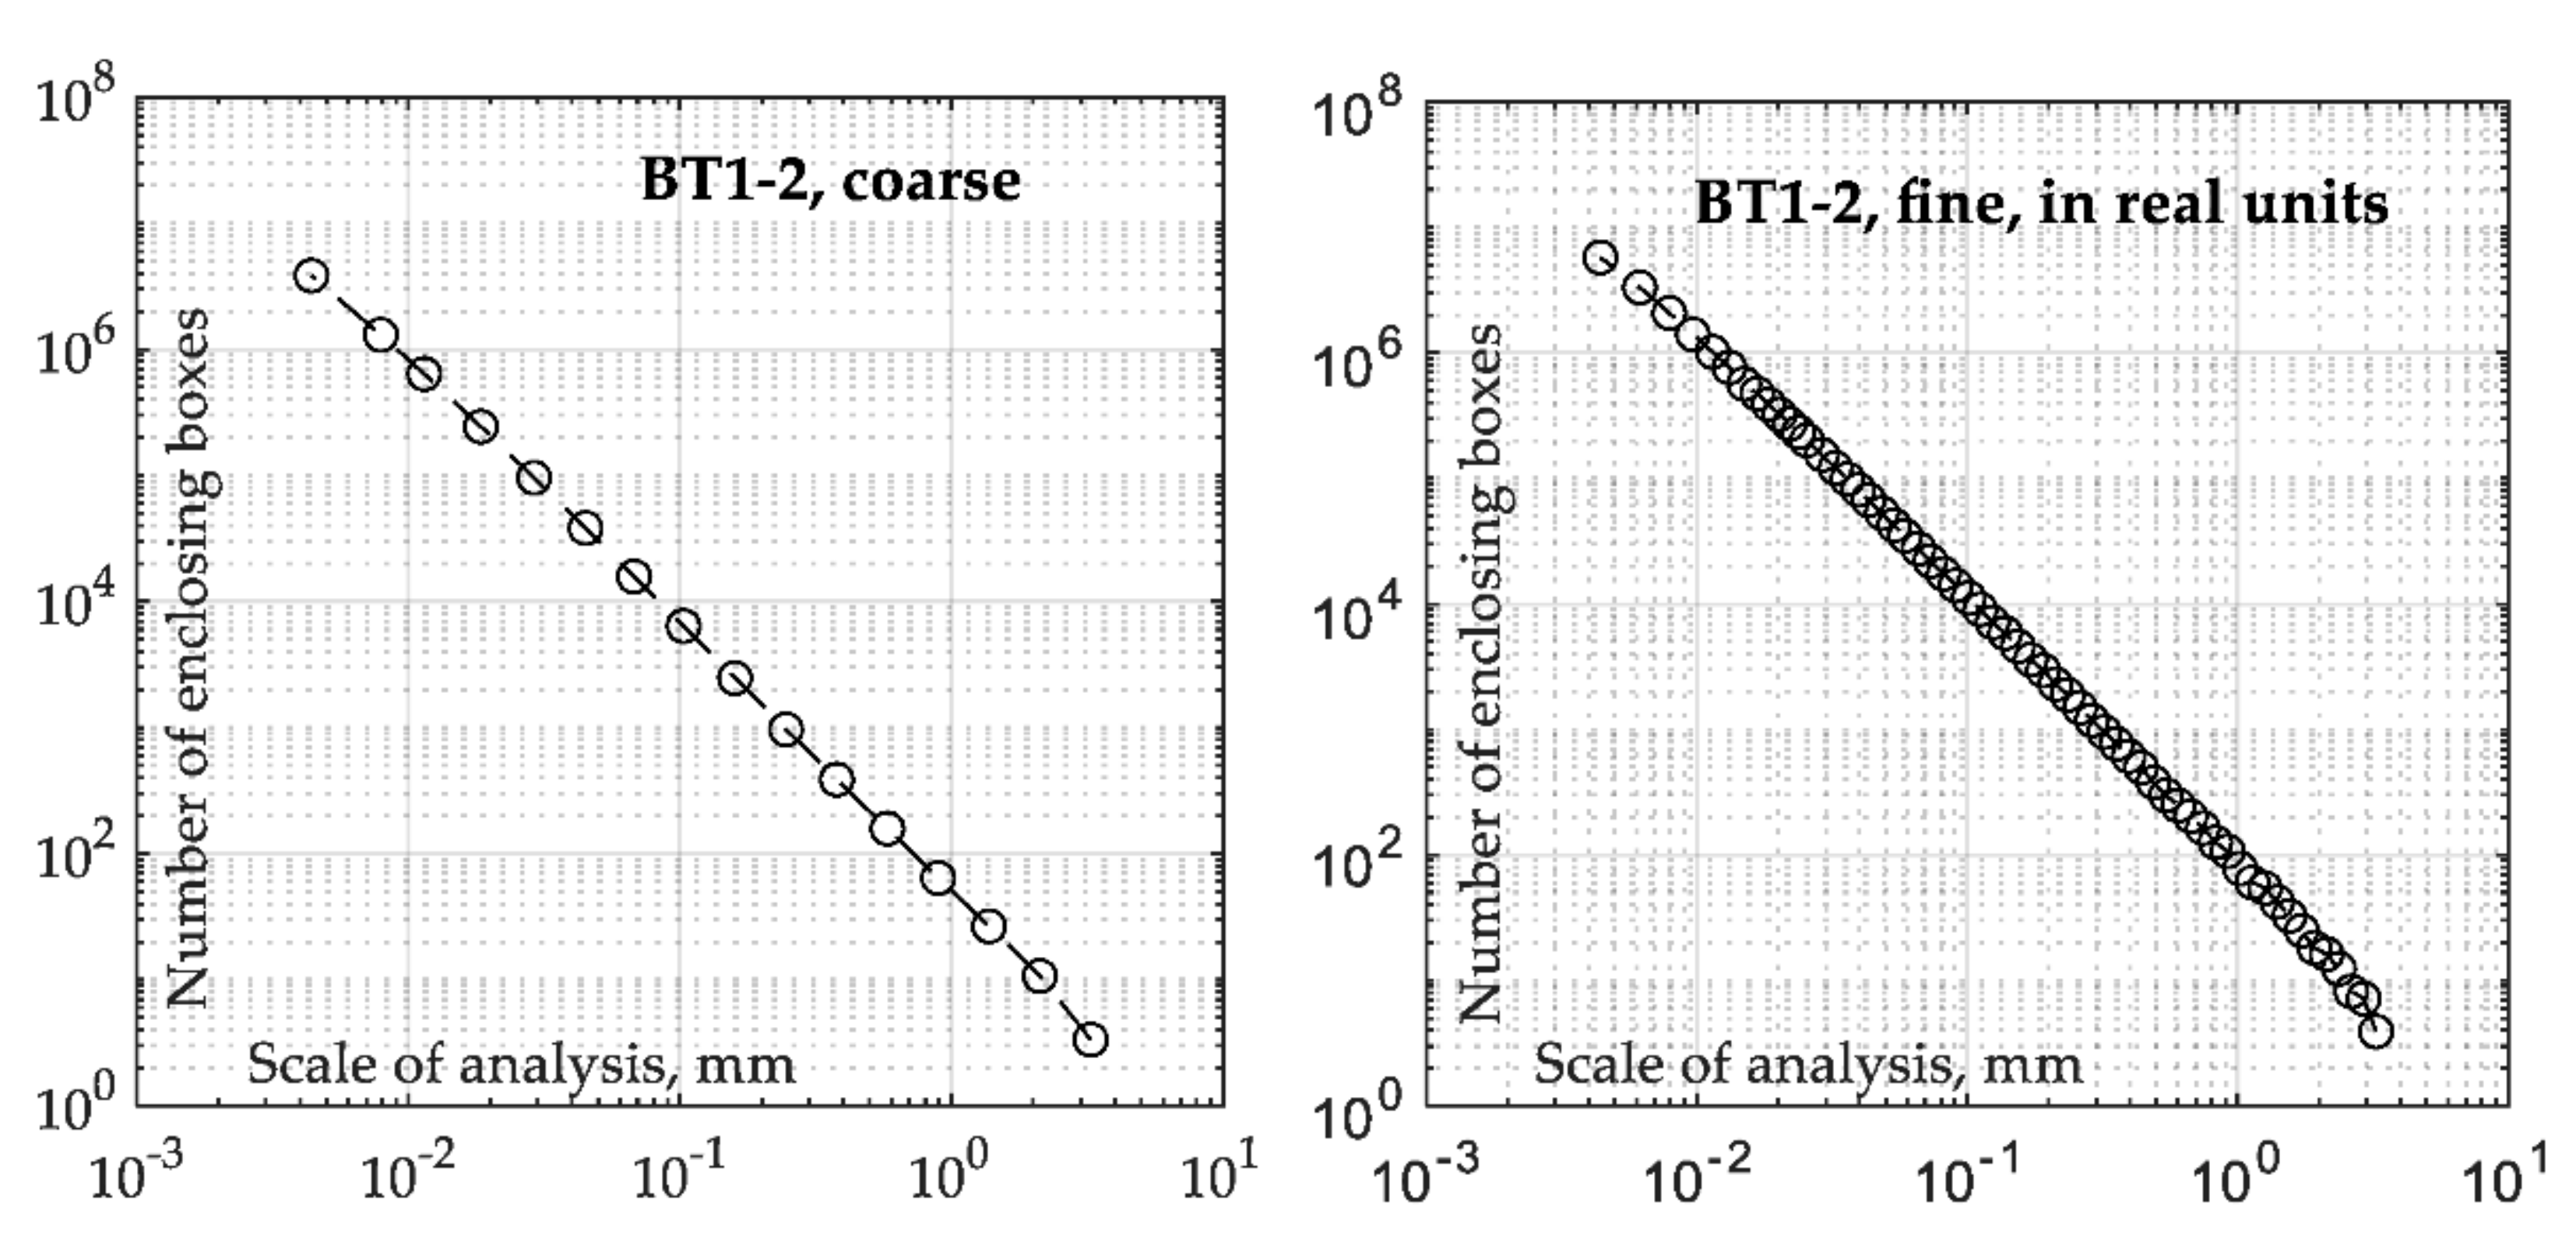
| Specimen | EBM, Coarse Resolution | EBM, Fine Resolution | Ebm in Real Units, Coarse Resolution | Ebm in Real Units, Fine Resolution |
|---|---|---|---|---|
| B/T = 2 (σa/τa = 4, σm/τm = 4) | ||||
| BT2-1 | 2.132 | 2.151 | 2.121 | 2.148 |
| BT2-2 | 2.086 | 2.106 | 2.098 | 2.125 |
| BT2-3 | 2.105 | 2.115 | 2.110 | 2.130 |
| B/T = 1 (σa/τa = 2, σm/τm = 2) | ||||
| BT1-2 | 2.114 | 2.122 | 2.111 | 2.130 |
| BT1-3a | 2.101 | 2.113 | 2.140 | 2.164 |
| BT1-3b | 2.132 | 2.151 | 2.121 | 2.148 |
Publisher’s Note: MDPI stays neutral with regard to jurisdictional claims in published maps and institutional affiliations. |
© 2021 by the authors. Licensee MDPI, Basel, Switzerland. This article is an open access article distributed under the terms and conditions of the Creative Commons Attribution (CC BY) license (https://creativecommons.org/licenses/by/4.0/).
Share and Cite
Macek, W.; Branco, R.; Costa, J.D.; Trembacz, J. Fracture Surface Behavior of 34CrNiMo6 High-Strength Steel Bars with Blind Holes under Bending-Torsion Fatigue. Materials 2022, 15, 80. https://doi.org/10.3390/ma15010080
Macek W, Branco R, Costa JD, Trembacz J. Fracture Surface Behavior of 34CrNiMo6 High-Strength Steel Bars with Blind Holes under Bending-Torsion Fatigue. Materials. 2022; 15(1):80. https://doi.org/10.3390/ma15010080
Chicago/Turabian StyleMacek, Wojciech, Ricardo Branco, José Domingos Costa, and Jarosław Trembacz. 2022. "Fracture Surface Behavior of 34CrNiMo6 High-Strength Steel Bars with Blind Holes under Bending-Torsion Fatigue" Materials 15, no. 1: 80. https://doi.org/10.3390/ma15010080
APA StyleMacek, W., Branco, R., Costa, J. D., & Trembacz, J. (2022). Fracture Surface Behavior of 34CrNiMo6 High-Strength Steel Bars with Blind Holes under Bending-Torsion Fatigue. Materials, 15(1), 80. https://doi.org/10.3390/ma15010080