Article

SFEM Analysis of Beams with Scaled Lengths including Spatially Varying and Cross-Correlated Concrete Properties

Faculty of Civil and Environmental Engineering, Gdansk University of Technology, Narutowicza 11/12, 80-233 Gdansk, Poland
Materials 2022, 15(1), 95; https://doi.org/10.3390/ma15010095
Submission received: 2 November 2021 / Revised: 10 December 2021 / Accepted: 17 December 2021 / Published: 23 December 2021
(This article belongs to the Section Construction and Building Materials)

Abstract

:
This paper presents the results obtained for plain concrete beams under four-point bending with spatially varying material properties. Beams of increasing length but constant depth were analyzed using the stochastic finite element method. Spatial fluctuation of a uniaxial tensile strength, fracture energy and elastic modulus was defined within cross-correlated random fields. The symmetrical Gauss probability distribution function was applied for the material properties. The shape of the probability distribution function was modified by changing the coefficient of variation in order to find its right value. The correctness of the numerical solution was verified against the experimental results of Koide et al. (1998, 2000). The stochastic FEM analysis was performed with an autocorrelation length of 40 mm and material coefficients of variation of 0.12, 0.14, 0.16, 0.20 and 0.24. The comparison between numerical outcomes and experimental results demonstrated that the coefficient of variation of 0.24 gave the best agreement when referring to the experimental mean values. On the other hand, the variation of results was better captured with the coefficient of variation of 0.16. The findings indicate that the Gauss probability distribution function with cov = 0.24 correctly reproduced the statistical size effect, but its tails needed modification in order to project experimental result variation.

Graphical Abstract

1. Introduction

The size effect in quasi-brittle materials has been commonly identified as a nominal strength reduction connected with an increasing specimen size. This statement is particularly valid for geometrically similar structures (i.e., when a specimen is scaled in the directions of the length L and depth D simultaneously). The requirement of geometrical similarity provides the same failure mechanism. There are two main mechanical sources of the size effect in concrete: energetic and statistical ones. The energetic size effect is connected with a strain localization phenomenon that develops before the macro-crack appears. The fracture process zone size (or strain localization zone) is a material property that is dependent mostly on the material characteristic length of a microstructure lc. When the beam depth D increases (i.e., lc/D→0), the nominal strength decreases together with its ductility. The energetic size effect is of a deterministic nature, and it assumes a homogenous (uniform) distribution of the material properties. On the other hand, the statistical size effect is caused by a spatial fluctuation of the material properties. Generally, the number of flaws inside the material increases with an increasing specimen size. Hence, the strength reduction becomes stronger with an increasing specimen size. The weakest link theory introduced by Weibull [1] postulates that a structure is as strong as its weakest component. Thus, the structure fails when its strength is exceeded in the weakest spot, since stress redistribution is not considered. The Weibull theory is valid for large structures, which fail as soon as a macroscopic fracture initiates in one small material element. However, it is not able to account for a spatial correlation of the local material properties and does not include the material characteristic length lc (i.e., it ignores the energetic size effect). As a result, the weakest link theory underestimates the strength of small- and medium-sized specimens.
The combination of the energetic and statistical size effects was introduced by Bazant [2] into the analytical type I size effect law. The coupled energetic-statistical size effect covers the whole size range from small to large specimens. The nominal strength described by the type I SEL applies to geometrically similar structures of positive geometries without initial notches or large-stress free cracks. The last condition is crucial for the statistical part of the size effect, since it enables the FPZ to develop at a random position. When the position of the FPZ is fixed (e.g., by a notch), the statistical size effect on the mean nominal strength is negligible. In that case, the nominal strength can be described by the type II SEL from Bazant and Planas [3], which represents the energetic size effect solely. Reinforced concrete beams failing due to concrete damage follows the type II SEL. It was numerically demonstrated by Syroka-Korol et al. [4] that when referring to RC beams experiencing shear failure, the material randomness only causes spreading of the results.
The coupled energetic-statistical size effect is commonly verified against experimental research with plain concrete beams [5] or dog bone specimens [6]. The isolated statistical size effect can be analyzed with plain concrete beams of varying lengths but a constant depth [7,8]. Numerical analysis of statistical sources of the size effect requires the application of concrete parameter spatial fluctuation, which is mostly performed within autocorrelated random fields. The type of autocorrelation function and autocorrelation length have influence on the parameters’ variation in space. Generally, the square exponential autocorrelation function is adopted [4]. The probability distribution of concrete’s material properties was described by Weibull [9], grafted Weibull–Gauss [10] and Gauss [11] probability distribution functions (pdfs). The shape of the pdf was modified by changing the shape parameter m or the coefficient of variation cov in the Weibull and Gauss functions, respectively.
The comprehensive numerical investigation of a pure statistical size effect in plain concrete beams subjected to four-point bending was performed by, among others, Bazant and Novak [9] and also by Grassl and Bazant [10]. Bazant and Novak [9] performed simulations using a stochastic finite element method and the Weibull pdf to describe the concrete’s parameter variations. The experimental mean bending moments registered by Koide et al. [7,8] were numerically covered with a surprisingly low Weibull modulus of m = 8. Next, Grassl and Bazant [10] analyzed the same beams with the aid of a lattice model. It was concluded that the geometrical randomness in the lattice model was insufficient to reproduce the experimentally observed average strength reduction from Koide et al. [7,8]. The fluctuation of the lattice bars’ strength was modeled with autocorrelated random fields with a square exponential autocorrelation function and the autocorrelation length lcor = 40 mm. The tensile strength ft variability was indirectly defined through ε0 (strain corresponding to ft), and its coefficient of variation was cov = 0.25. This time, the grafted Gaussian–Weibull cumulative distribution function was adopted. (It was demonstrated in [12,13] that the tails below a probability of 0.01 followed Weibull, while the core was Gaussian.) The numerical results obtained for the longest and medium beams exhibited good agreement with the experimental findings. However, the shortest beam overestimated the experimental result variations.
The combined energetic-statistical size effect was investigated within a stochastic discrete meso-scale model by Elias et al. [14]. Simulations of geometrically similar concrete beams subjected to three-point bending of a depth D = 40, 93, 215 and 500 mm were performed. A relative notch length varied between α0 = 0 ÷ 0.3D (the statistical size effect appeared in unnotched beams with α0 = 0 only). A lattice–particle model was used to simulate concrete fractures. The spatially autocorrelated random fields were introduced to define the material properties. As a result, the model considered both the geometrical and material randomness. The grafted Weibull–Gaussian probability distribution function was adopted. As suggested in [10], the material coefficient of variation was cov = 0.25, while the autocorrelation length lcor was 40 and 80 mm. The stochastic results (with both lcor) obtained for the two largest beam sizes (D = 215 and 500 mm) highly underestimated the experimentally observed average nominal strength (experiments performed by Hoover et al. [15]). In other words, the simulated statistical size effect with cov = 0.25 was too strong compared with the laboratory tests. Satisfactory agreement was achieved only for small beams with D = 40 and 93 mm, where the statistical size effect was relatively weak and the energetic size effect dominated.
The finite element method was applied by Syroka-Korol et al. [11] to also investigate the combined energetic-statistical size effect in plain concrete beams under three-point bending. The very broad range of the autocorrelation length lcor = 5, 10, 15, 20, 40, 60, 80, 100, 120, 140 and 150 mm was analyzed in geometrically similar beams of depth D = 80, 160, 320 and 1920 mm. Concrete was modeled within elaso-plasticity with non-local softening. The fluctuation of the local material strength was described by the square exponential autocorrelation function, and the pdf was entirely Gaussian. The results showed a strong effect of the autocorrelation length lcor upon the average nominal strength reduction. It was demonstrated that the nominal strength depends on the FPZ size at the peak load, the average local material strength inside the FPZ and its position with respect to the support. This extensive SFEM study showed that the lowest average nominal strength in all beam sizes was obtained with the autocorrelation length lcor = 0.5hloc (hloc = the height of the FPZ at the peak load), while the strongest reduction of the average nominal strength with increasing beam depth D (i.e., the strongest statistical size effect) was obtained for lcor = 40 mm.
The purpose of the current study is to calibrate the stochastic parameters of the FE model to properly describe the pure statistical size effect. Plain concrete beams of series C tested by Koide et al. [7,8] are the comparative base. The stochastic finite element method is chosen because, in contrast to the lattice model [10] and lattice–particle model [14], it is applicable to both small and very large specimens (compare SFEM analysis of 6-m long RC beams in [4]) and can be further used to analyze the safety of real-sized structures. The fluctuation of the material parameters defined within random fields is described by the square exponential autocorrelation function and the autocorrelation length lcor = 40 mm, as already validated in [11]. The entirely Gaussian pdf is applied, which is a simplification compared with [10,14], where the core is Gaussian but the tails follow the Weibull pdf. The effect of varying the material coefficient of variation cov is carefully studied. The SFEM simulations were performed with simultaneously varying cross-correlated random distributions of the local uniaxial tensile strength, fracture energy and elastic modulus in contrast to [14], where the material parameters are mutually linearly dependent.
The outline of the present paper is as follows. First, after the introduction (Section 1), the numerical SFEM model is presented in Section 2. The numerical results from SFEM simulations are discussed in Section 3. The conclusions are listed in Section 4.

2. Materials and Methods

2.1. Constitutive Elasto-Plastic Model with Non-Local Softening

The concrete behavior under tension was defined with a simple Rankine criterion with isotropic softening, while the yield function f was as follows:
f = m a x { σ 1 , σ 2 , σ 3 } σ t ( κ ) ,
where σi, i = 1, 2, 3 are the principal stresses, σt is the tensile yield stress and κ is the softening parameter equal to the maximum principal plastic strain ε1p [11]. The associated flow rule was assumed. The bilinear function recommended by Hoover and Bazant [15] (Figure 1) was used to describe the post-peak softening under tension. The total fracture energy GF = 80 N/m was calculated after the CEB-FIP code [16], based on the experimentally measured concrete compressive strength fc = 30 MPa and the maximum aggregate diameter da = 20 mm. The ratio between the total and initial fracture energy was taken to be GF/Gf = 1.5 (very close to recommendation in [15]). The uniaxial tensile strength ft was not experimentally measured by Koide et al. [7,8]. Nevertheless, ft = 2.9 MPa was initially adopted (estimated based on fc and the recommendations in Eurocode 2 [17]).
In the calculations, a non-local regularization technique was applied, and a non-local formulation of the softening parameter was introduced [11]:
κ ¯ ( x ) = ( 1 m n l ) κ ( x ) + m n l V ω ( x ξ ) κ ( ξ ) d ξ V ω ( x ξ ) d ξ ,   w i t h   i = 1 ,   2 ,
where V is the body volume, x is the coordinate vector of the analyzed point, ξ is the coordinate vector of the surrounding points and mnl is the non-local parameter. The normal distribution function was used as a weighting function:
ω ( r ) = 1 l c π e ( r l c ) 2
This depended on the characteristic length of the microstructure lc and the distance between material points r. The characteristic length was assumed in this study to be lc = 2 mm, based on the experimental investigations by Skarzynski and Tejchman [18]. The softening non-local parameters near the boundaries were always calculated on the basis of Equations (2) and (3), which satisfied the normalizing condition.
Calculations were performed in the commercial finite element software ABAQUS from Dassault Systèmes Simulia Corp. (Rhode Island, US) with user subroutines which introduced the non-local model, constitutive law and user element definition. To capture the whole load-deflection curves, including the post-peak softening, the arc-length method was used to control the load (the simplified procedure formulated by Jirasek and Bazant [19]).

2.2. Random Fields

The local material properties had the Gauss probability distribution function with a prescribed mean value μ and a standard deviation sdev. The coefficient of variation was defined by the ratio cov = sdev/μ (the tensile strength, elastic modulus and fracture energy had the same coefficient of variation, calculated as covft = σft/μft, covEmod = σEmod/μEmod and covGf = σGf/μGf, respectively). The material fluctuation was represented by spatially autocorrelated random fields with a homogenous squared exponential autocorrelation function:
C ( x 1 , x 2 ) = e x p ( ( x 1 x 2 ) 2 l c o r 2 )
where |x1x2| is the distance between two points in a Cartesian space and lcor is the autocorrelation length, assumed to be lcor = 40 mm. The auto-covariance function had the following spectral decomposition:
C ( x 1 , x 2 ) = i = 1 λ i f i ( x 1 ) f i ( x 2 )
where the eigenvalues λi and eigenfunctions fi(x) are the solution of the Fredholm integral equation of the second kind:
D C ( x 1 , x 2 ) f i ( x 1 ) d x 1 = λ i f i ( x 2 )
The solution to Equation (6) was found with the aid of the wavelet-Galerkin method described by Phoon et al. [20,21], where Haar wavelets are implemented to create an orthogonal base.
The spatially correlated random fields H(x,θ) (here with the zero mean and unit variance) were defined according to the Karhunen–Loëve expansion [22,23] by an infinite linear combination of orthogonal functions and random coefficients:
H ( x , θ ) = i = 1 λ i ξ i ( θ ) f i ( x )
where ξi(θ) is the vector of uncorrelated random variables sampled from N(0,1) distribution, λi is the eigenvalues and fi(x) is the corresponding eigenfunctions. The approximated solution   H ^ ( x , θ ) was obtained by truncating the series in Equation (7) after M terms which satisfied the condition i = 1 M λ i 0.95 t r ( C ) .
The simultaneously varying local uniaxial tensile strength ft, fracture energy Gf and elasticity modulus Emod were simply cross-correlated through a scalar coefficient r as proposed by Vorechovsky [24]. When the cross-correlation coefficient r = 0, the spatial distributions of the material parameters are independent. On the other hand, when r = 1, the material parameters are linearly dependent. In the present SFEM study, a strong cross-correlation (r = 0.9) was assumed between ft, Gf and E (exemplary profiles are given in Figure 2).

2.3. FE Input Data

Three beam sizes of a constant depth D = 100 mm and thickness t = 100 mm but varying span were analyzed, similar to Series C as tested by Koide et al. [7,8]. The beams were subjected to four-point bending, and the distance from the support to the loading point was always a = 200 mm (Figure 3). Hence, the energetic size effect was negligible, and the predominant statistical size effect could be investigated. The beam’s effective span Leff varied from 600 mm through 800 mm and up to 1000 mm, while the corresponding distance between loading points was Lm = 200, 400 and 600 mm (beams denoted as LM200, LM400 and LM600, respectively). Series C, as tested by Koide et al. [7,8], consisted of 121 plain concrete beams, including 46, 40 and 35 identical specimens of sizes LM200, LM400 and LM600, respectively.
A large central part of the beam, where the non-local elasto-plastic material was defined, was covered by a fine FE mesh consisting of right triangles of dimensions 1 mm × 1.25 mm (Figure 4). The remaining part of the beam, which consisted of a coarse mesh, was defined as an elastic material. Analysis was performed under plain stress conditions. The initial calculations started with the following concrete properties: uniaxial tensile strength ft = 2.9 MPa, initial fracture energy Gf = 52 N/m, total fracture energy GF = 80 N/m, elasticity modulus Emod = 30 GPa and Poisson’s ratio ν = 0.17. The nominal strength of a beam expressed as σN = Mmax/(tD2/6) was linearly dependent on Mmax due to the constant cross-section dimensions. Hence, the terms nominal strength and bending moment were used interchangeably when describing the results.

3. Results

3.1. Convergence Study

Initially, 2000 random fields were generated for each beam size and each material parameter. In order to reduce the computational time, the stratified sampling technique [11] was applied, and as a result, 24 random fields were eventually chosen for further FE simulations. Stochastic analysis started with the shortest beam, denoted as LM200 with simultaneously varying ft, Gf and Emod, for which a strong cross-correlation was assumed to be r = 0.9. The material coefficients of variation (identical for ft, Gf and Emod) changed from cov = 0.12 through 0.16 and 0.20 and up to 0.24 (for each cov, the new set of random fields was generated). First, convergence analysis was performed in order to verify whether the specified number of SFEM simulations provided a satisfactory approximation of the desired solution. Figure 5 compares the calculated mean values of the ultimate bending moment obtained for an increasing number of SFEM simulations with different material cov values. Initially, when the number of simulations was under five, the scattering of the mean value μM was very strong, particularly for a higher material cov. After 10 simulations, the fluctuation of μM weakened, and after ca. 20 simulations, the changes were unnoticeable for all material cov values. Referring to the standard deviation of ultimate M (Figure 6), its convergence was slightly slower than that observed for the mean value, although after 20 simulations, the obtained standard deviations showed acceptably low changes. Thus, the chosen number of 24 simulations turned out to give adequate results.
The numerical results of beam LM200 presented in Figure 5 and Figure 6 clearly show that the increasing material cov caused a reduction in the mean ultimate bending moment μM and an increase in its standard deviation. Moreover, the resulting coefficient of variation COVM (st.dev.M/μM) was always lower than the assumed material cov. This behavior can be explained as follows. The beam’s ultimate strength depends on the value of the local ft and Gf inside the localized zone (or the FPZ) at the peak load. When the FPZ dimensions were larger than the autocorrelation length, the average value of the varying parameters ft and Gf inside the FPZ gave lower values than the input material cov. Hence, the resulting ultimate failure force and corresponding bending moment had a lower coefficient of variation COVM.

3.2. Material and Stochastic Parameter Calibration

Figure 7 compares the experimental and numerical frequency diagrams obtained for beam LM200 with various material cov values. The calculated mean ultimate bending moment μM reached 659, 627, 598 and 555 Nm for material cov values of 0.12, 0.16, 0.20 and 0.24, respectively, while the corresponding standard deviation of M was 67, 78, 95 and 113 Nm. It is clear that the calculated mean ultimate bending moment did not coincide with the experimental one. However, the effect of the varying material cov upon the resulting variation of M could be still verified against the experimental outcomes based on the translated frequency distributions (Figure 8) (translated by the calculated mean value μM for each distribution separately). The experimental frequency distribution was subdivided into 24 strata (the same number as in the SFEM calculations), keeping the extreme values unchanged. Next, for each stratum, the average value was estimated. The calculated mean square error between the numerical and experimental translated distributions indicated the material cov = 0.16 gave the best agreement.
It is worth reminding here that Koide et al. [7,8] measured in a laboratory the compressive strength fc only, whereas the uniaxial tensile strength ft (the generic mean value for random fields) in the initial case study was roughly estimated based on fc and the recommendations in Eurocode 2 [17]. Meanwhile, the stochastic results clearly showed that the uniaxial tensile strength ft needed correction. Hence, renewed SFEM analysis of beam LM200 was run with a modified uniaxial tensile strength ft = 3.48 MPa and with the material cov = 0.16. The total fracture energy GF and its ratio to the initial fracture energy GF/Gf remained the same. This time, the obtained mean bending moment reached 704 Nm and was nearly the same as the experimental value of 702 Nm.

3.3. The Statistical Size Effect on the Beam Strength

After calibrating the material and stochastic parameters based on the smallest beam (LM200), the remaining beams (LM400 and LM600) were simulated with the following mean values: ft = 3.48 MPa, GF = 80 N/m (GF/Gf = 1.5) and Emod = 30 GPa, while the coefficient of variation was cov = 0.16 for all the material parameters independent of the beam size. For each beam size, 24 stochastic simulations were performed. The calculated mean ultimate bending moment μM reached 658 Nm (LM400) and 645 Nm (LM600) and was 3 and 6% higher than the corresponding mean experimental value (Figure 9). The calculated standard deviation of M was similar in beams LM400 and LM600 and slightly higher in beam LM200 compared with the experimental values (Figure 9).
Additional calculations were performed for the deterministic FEM models (with a constant and uniformly distributed ft = 3.48 MPa, Gf = 52 N/m, GF = 80N/m and Emod = 30 GPa). Deterministic simulations confirmed the energetic size effect upon the beam’s nominal strength (in this case, the equivalent bending moment) was negligible when the beam depth D was constant. However, the deterministic effect of the varying beam span Leff was evident when comparing the beams’ brittleness. Figure 10 includes the normalized load-deflection diagrams illustrating that the longer beam, the more brittle the post-peak response (a so-called snap back behavior could be observed thanks to the applied arc-length method). When comparing the deterministic and stochastic results, the mean stochastic bending moment was 23, 28 and 29% lower than the corresponding deterministic value. The reduction was mainly caused by a locally weaker tensile strength inside the localized zone area (the width was always wloc = 6 mm, while the height hloc fluctuated around 41 m (Figure 11).
Generally, the agreement between SFEM results with cov = 0.16 and experimental outcomes (Figure 9) was satisfactory but not perfect. The increasing discrepancy between the mean values together with the beam size indicate that the simulated statistical size effect on the beam’s mean nominal strength should have been stronger. For this reason, SFEM analysis of all beams was performed once more with a higher material coefficient of variation cov = 0.24. The uniaxial tensile strength was ft = 4.2 MPa (calibrated again based on the mean bending moment μM from 24 SFEM simulations of the smallest beam, LM200), whereas the other material parameters remained unchanged (GF = 80 N/m, GF/Gf = 1.5 and Emod = 30 GPa). For each beam size, 24 SFEM simulations were executed.
This time, the agreement between the laboratory measured and simulated mean ultimate bending moments for cov = 0.24 was nearly perfect (Figure 12). However, the scattering of results in the case of SFEM analysis with cov = 0.24 was significantly stronger than in the experiments. This may indicate the need to introduce the grafted Gaussian–Weibull probability distribution function for the concrete material properties in order to better reflect both the mean and the standard deviation of the results.
The effect of the simultaneously varying material properties was also examined. Referring to the results discussed above, where strong cross-correlation (r = 0.9) was adopted between ft, Gf and Emod, the assumption of a constant Gf and Emod increased the mean ultimate bending moment by 5% and decreased its standard deviation by 16% on average. On the other hand, when a linear dependence between ft and Gf was applied (it was found that Emod affected only the initial beam stiffness), the resulting mean ultimate bending moment decreased by less than 2%, while its standard deviation was higher by 4% on average. These results demonstrate that the variation of the local uniaxial tensile strength ft was crucial for the statistical size effect.

4. Conclusions

The following conclusions can be drawn from the FEM investigation of plain concrete beams of varying lengths, summarizing both the deterministic and the stochastic approach with simultaneously and spatially varying ft, Gf and Emod values:
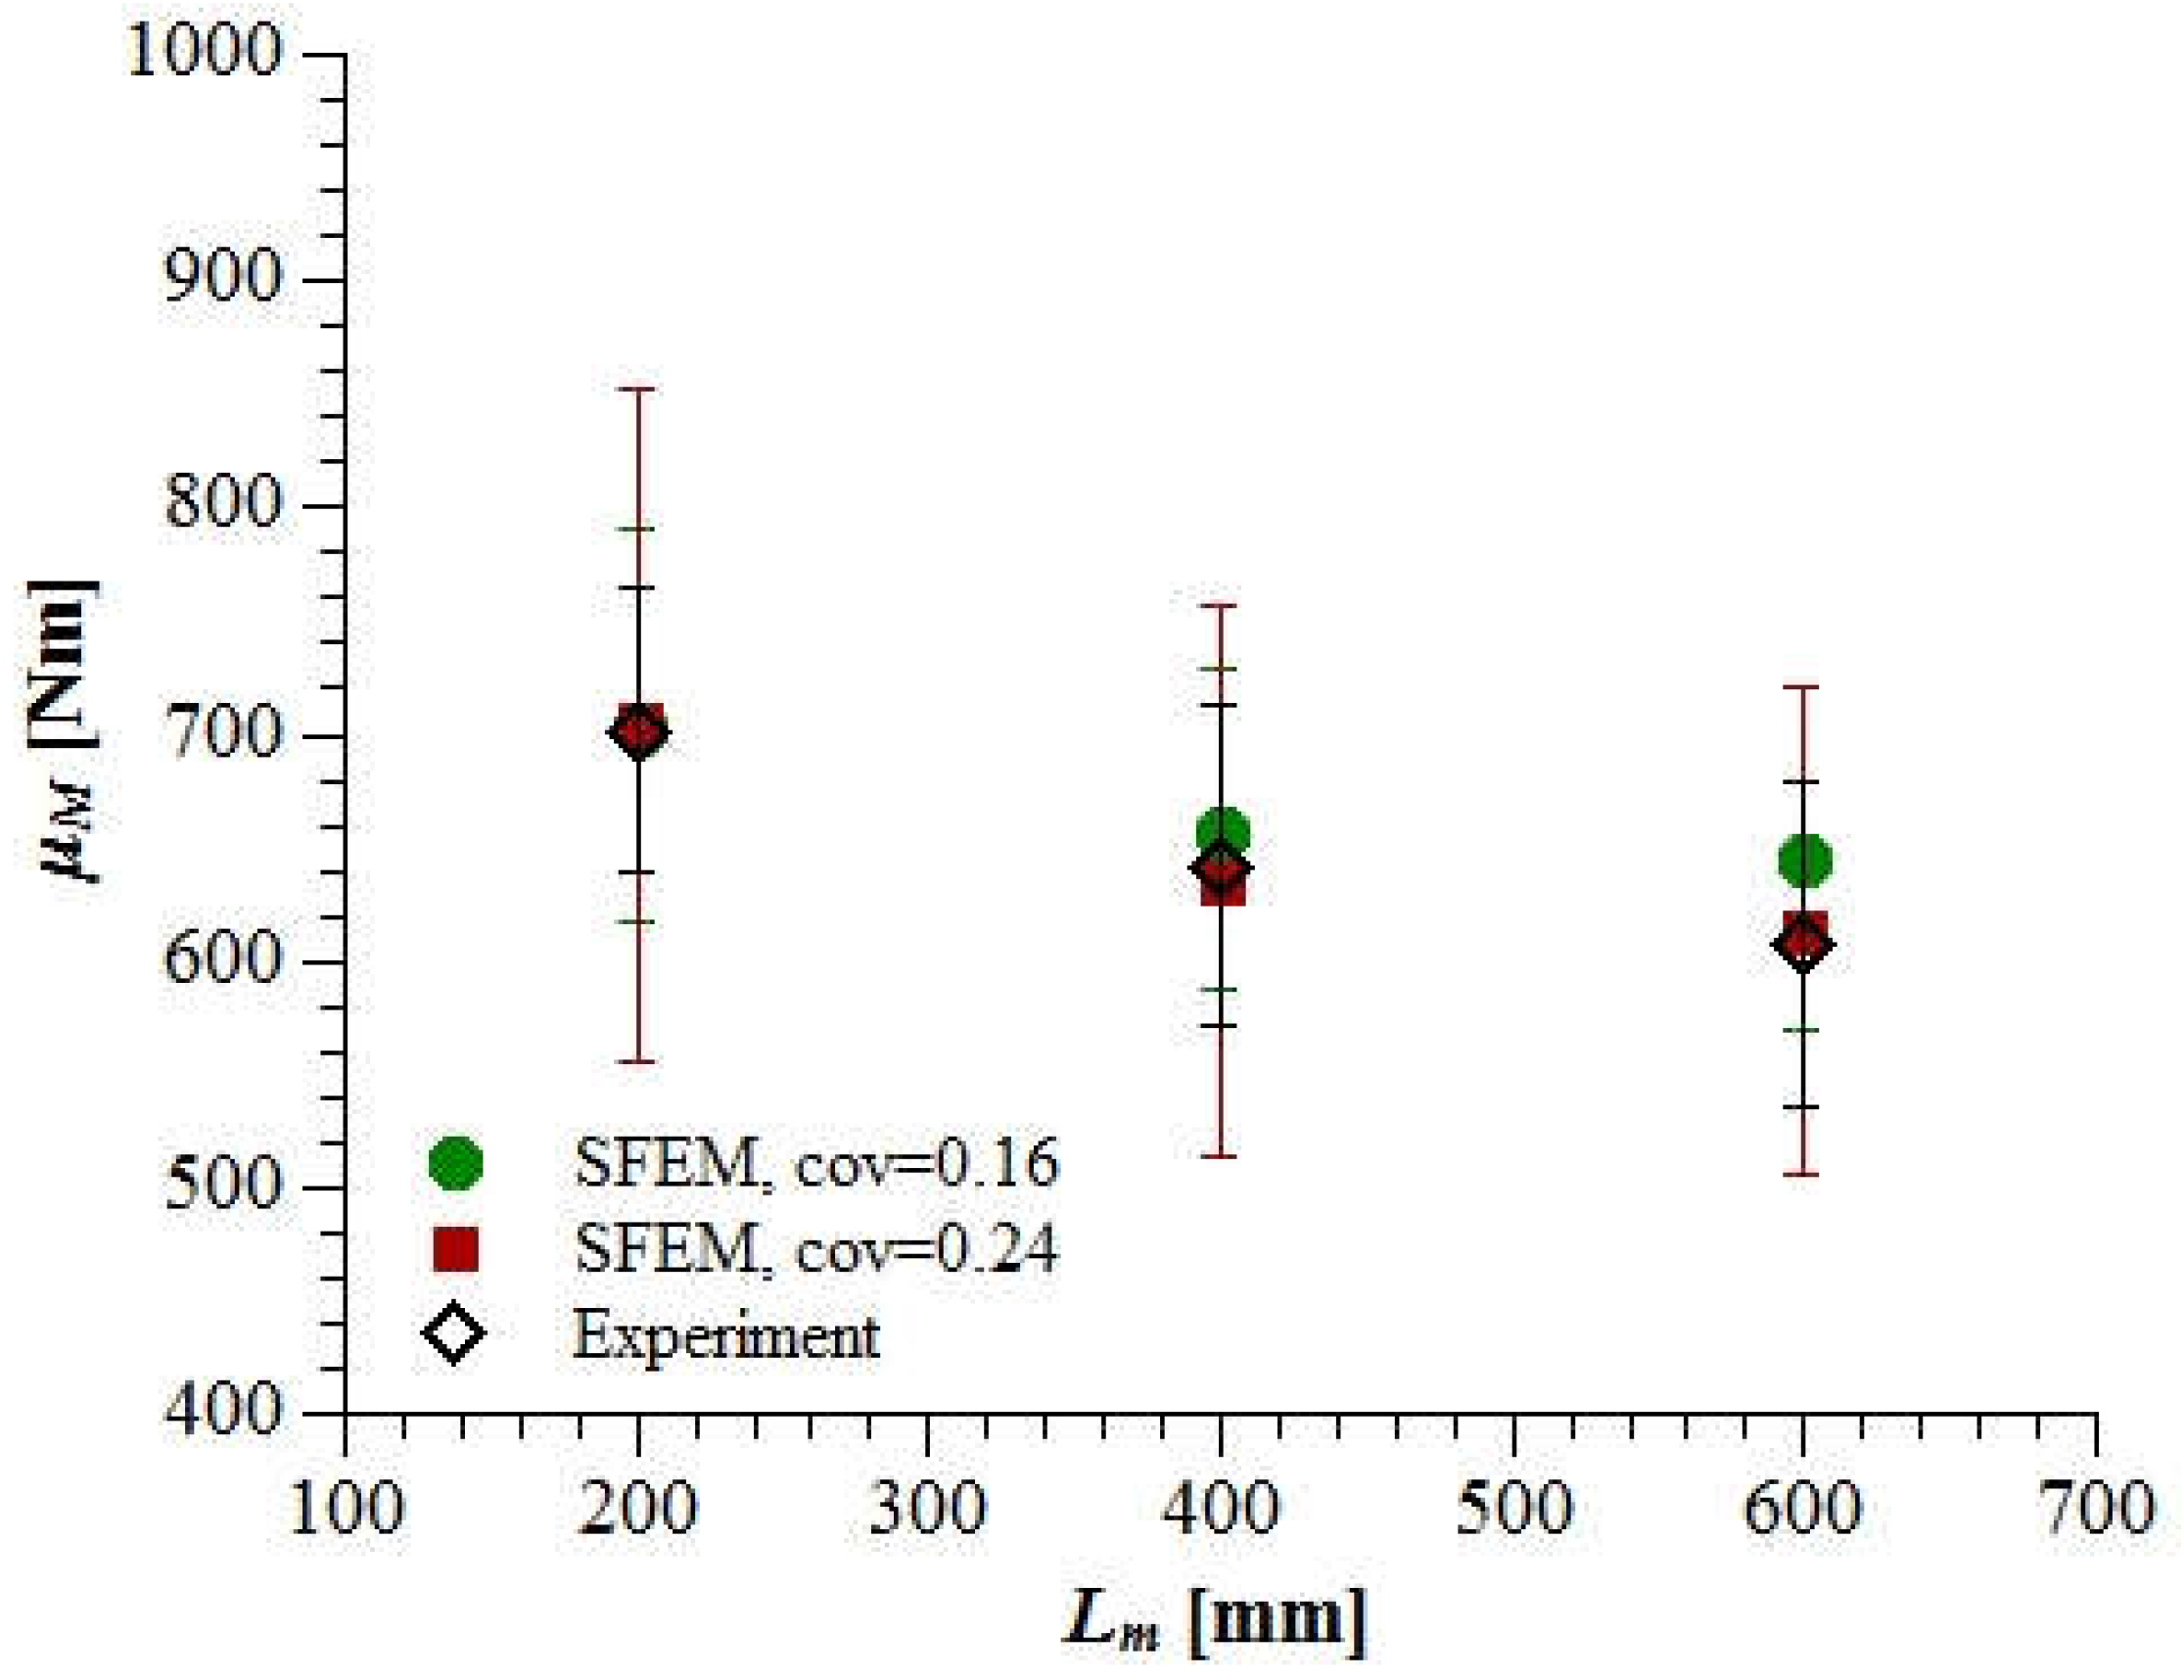
  • The spatial fluctuation of the local material properties was the source of the mean nominal strength reduction with an increasing beam length;
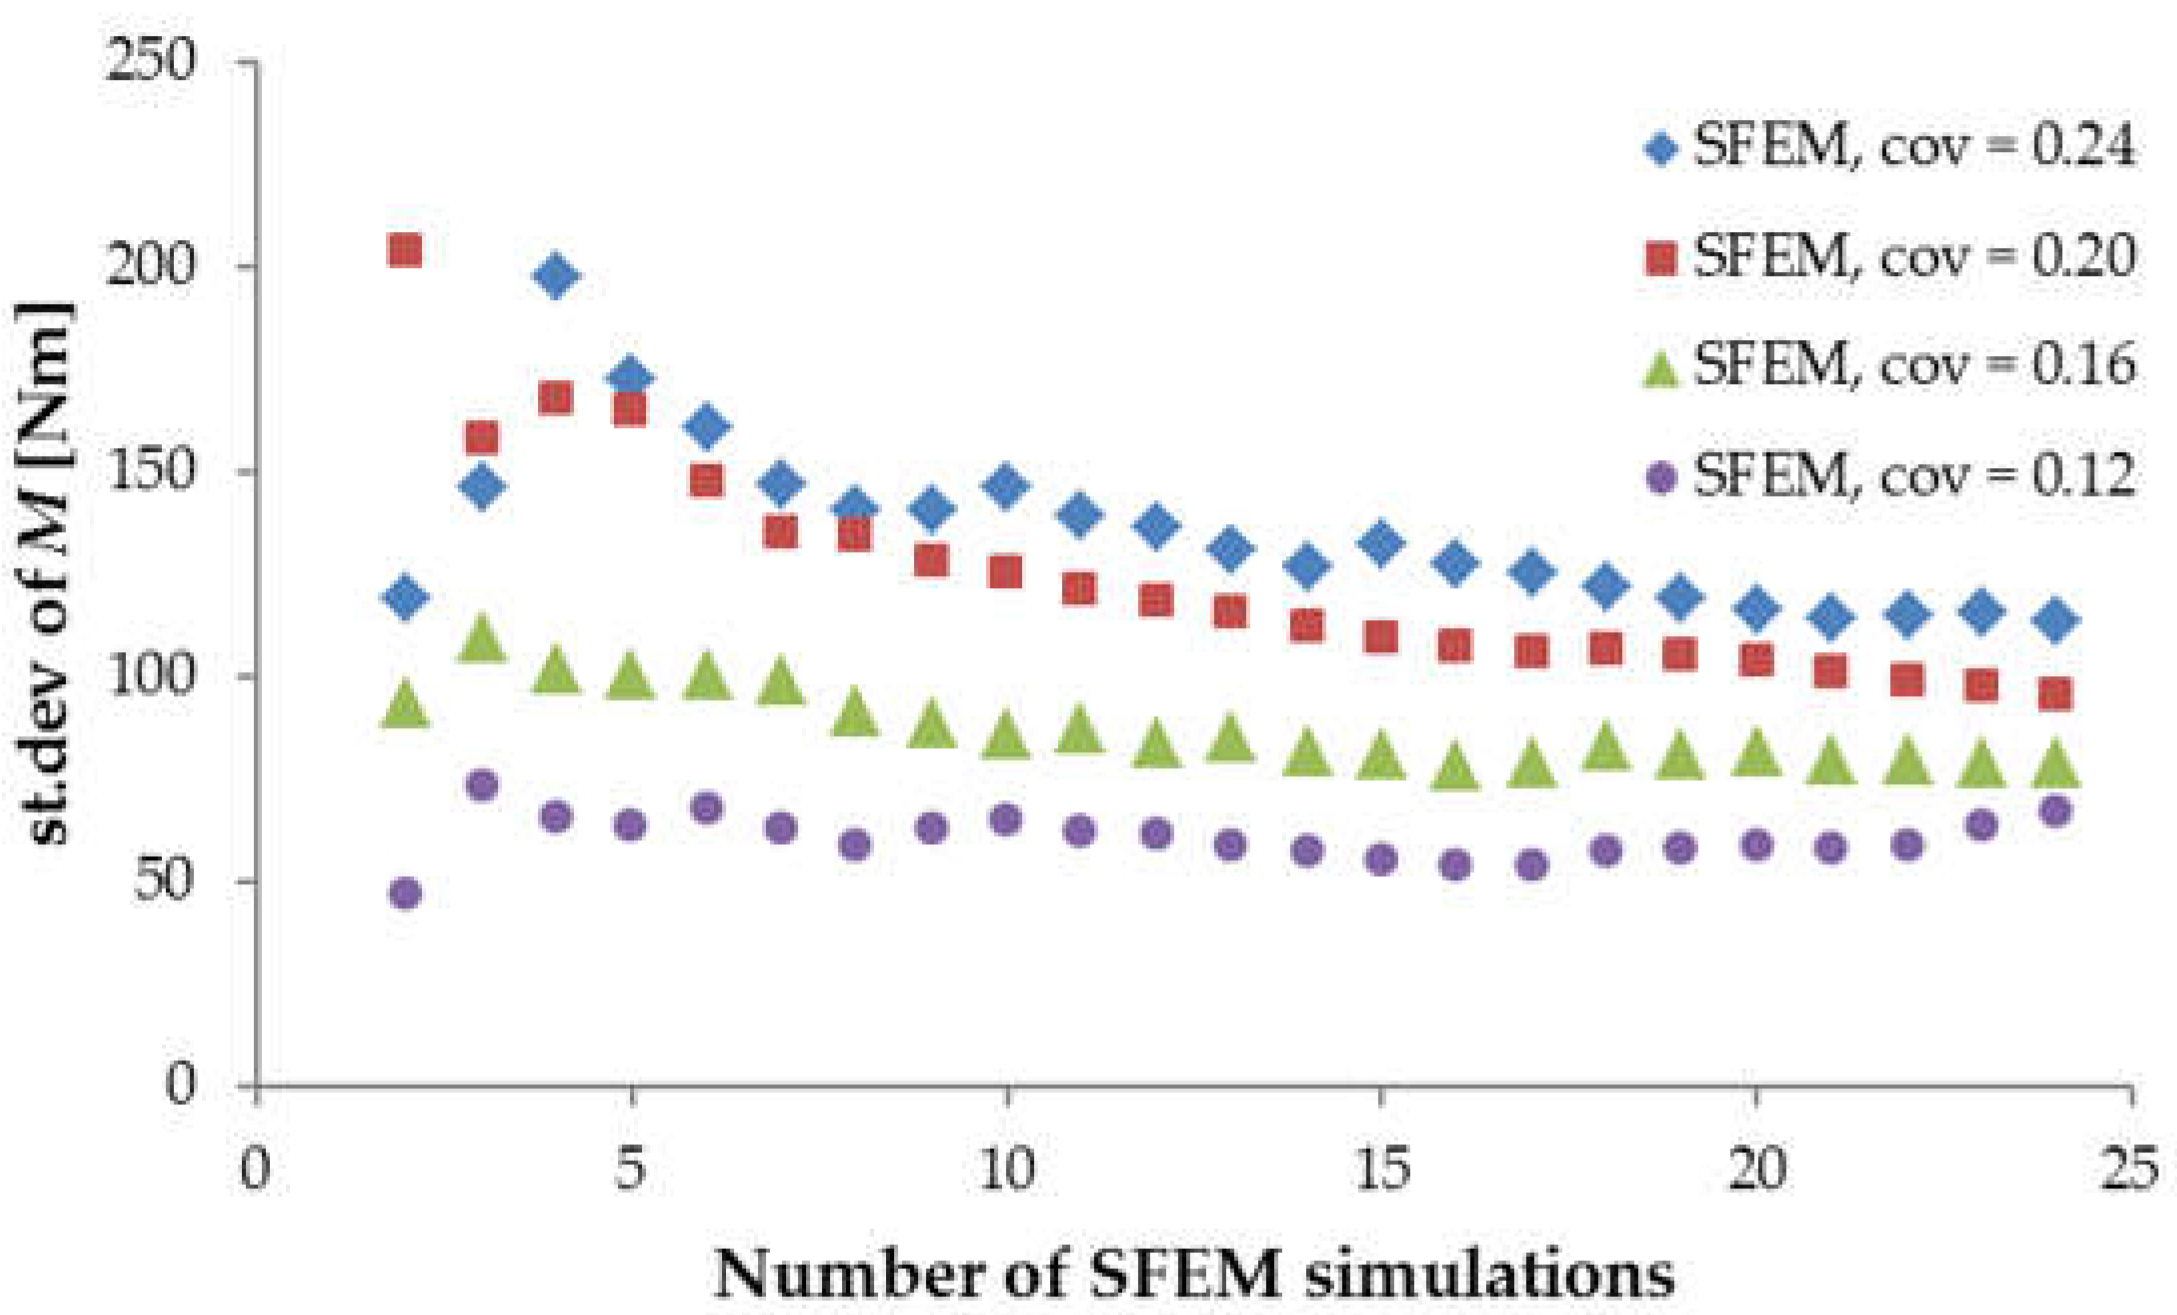
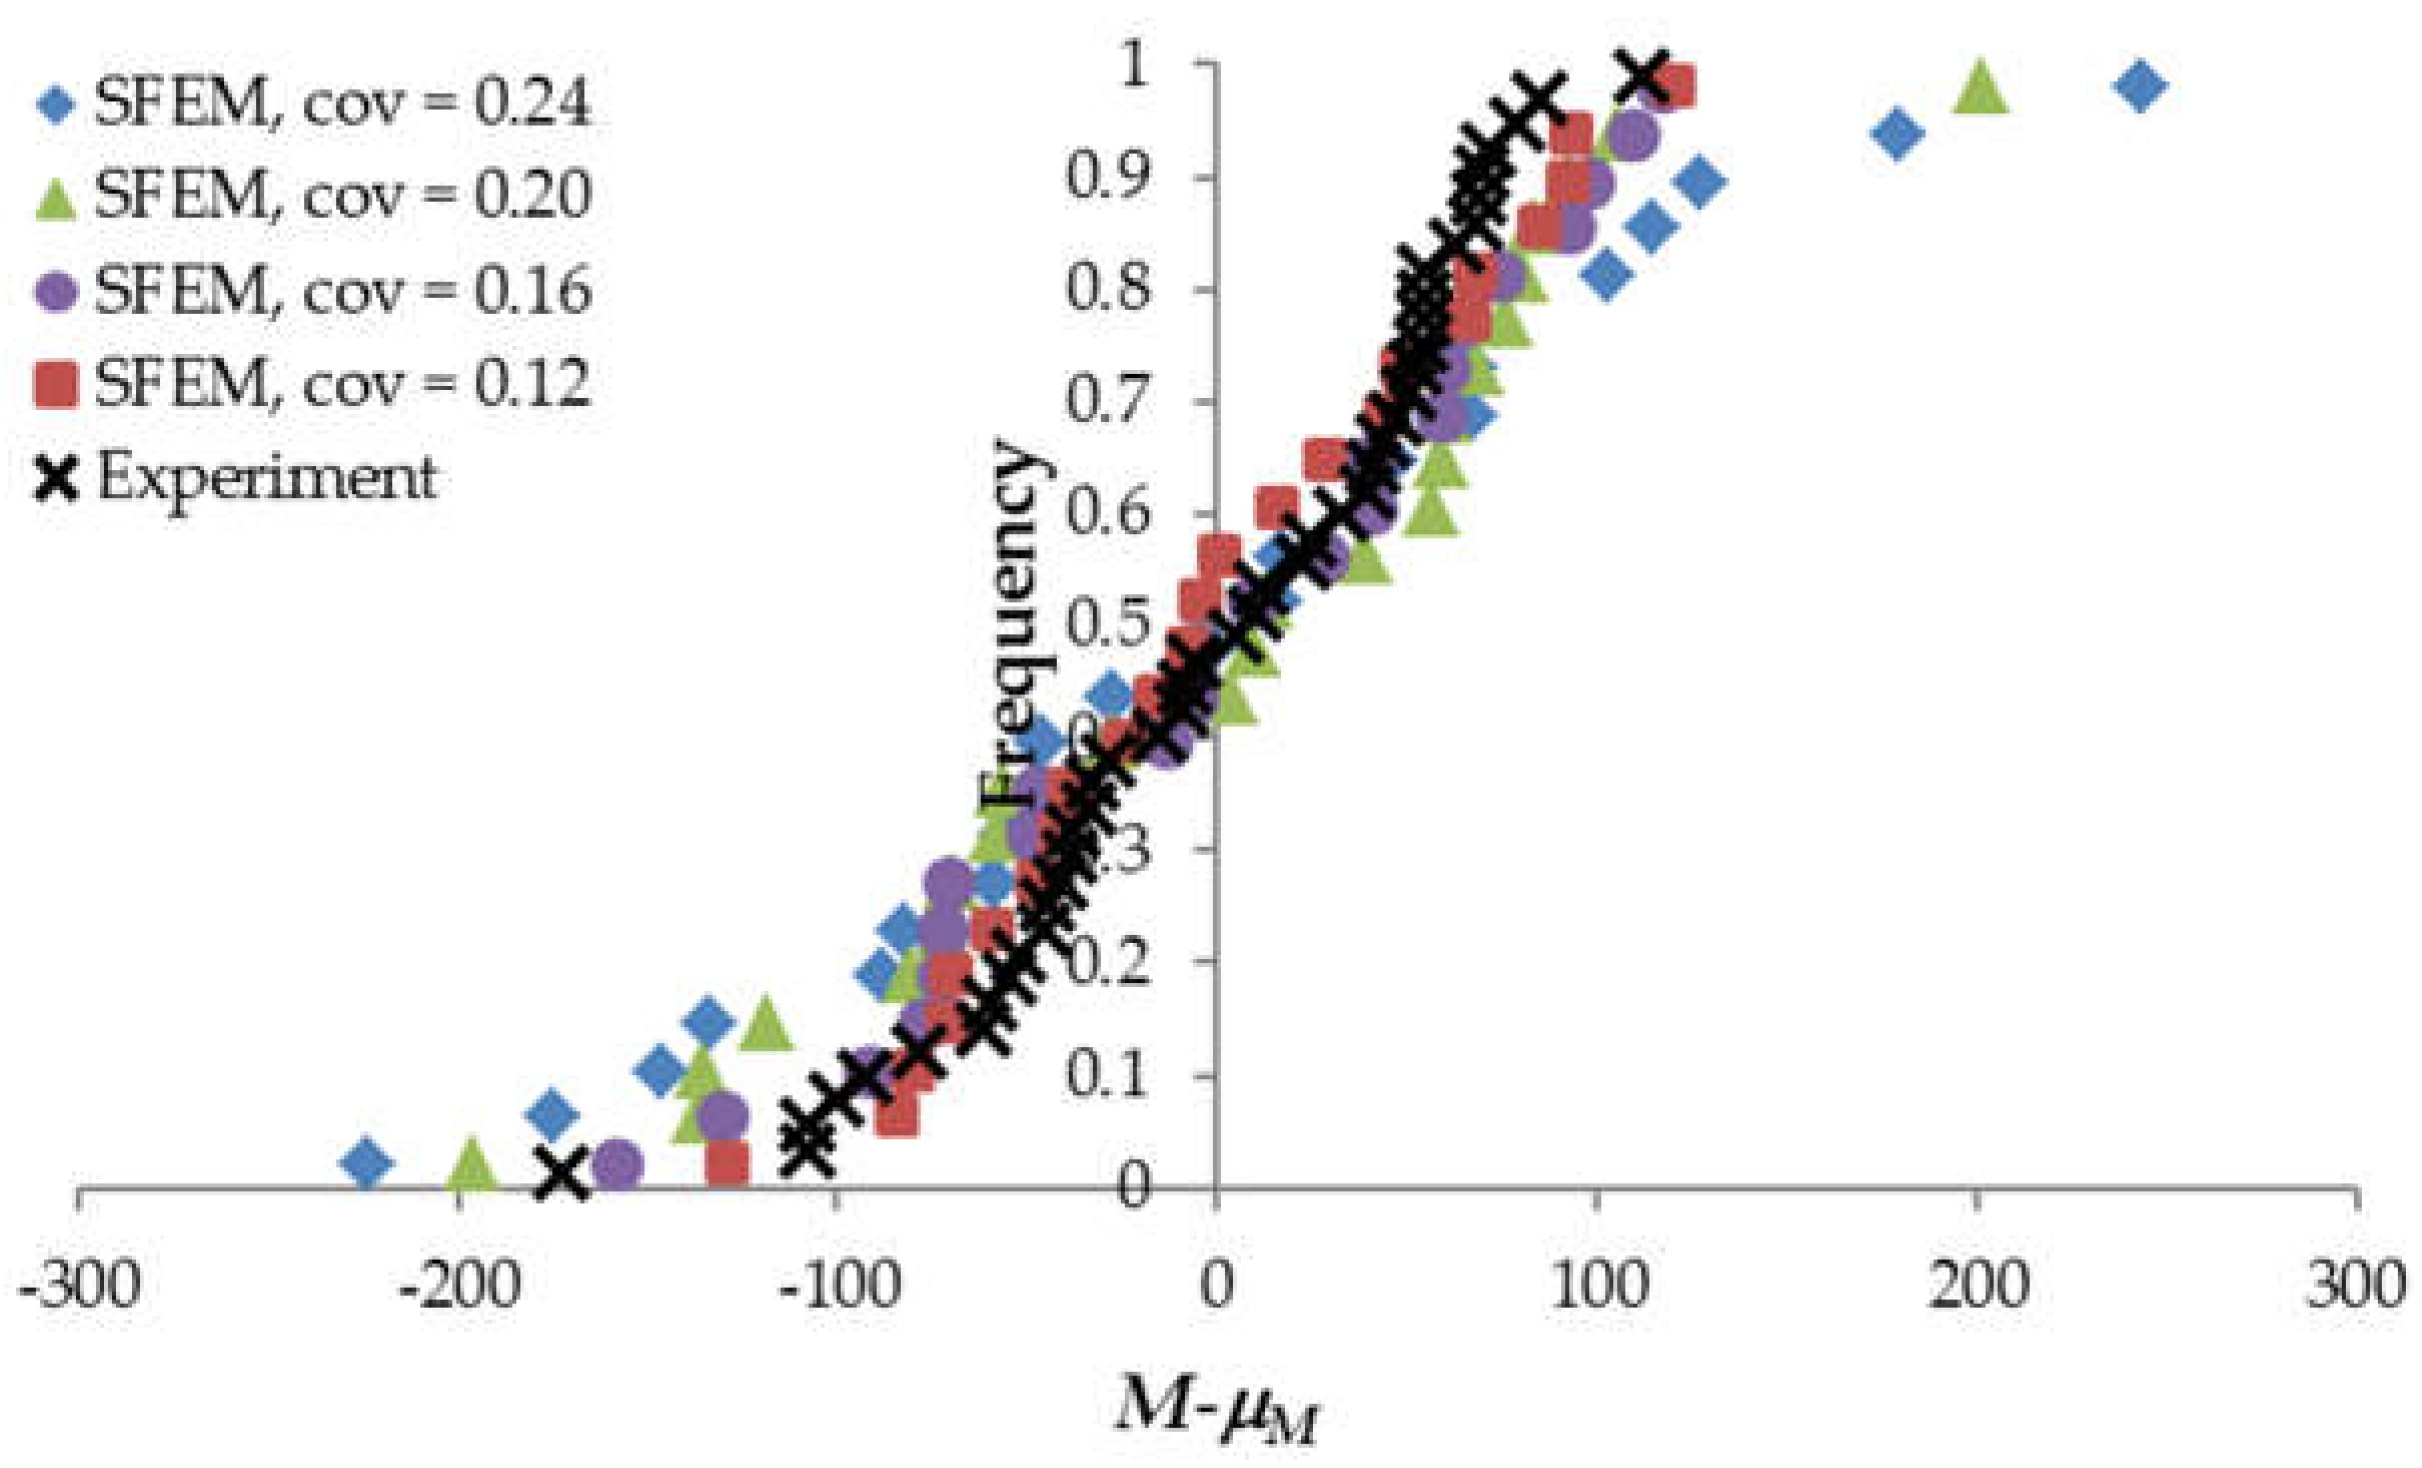
  • The increasing material coefficient of variation cov contributed to the stronger statistical size effect on the mean nominal strength (i.e., the more pronounced reduction of the mean strength with the increasing beam length);
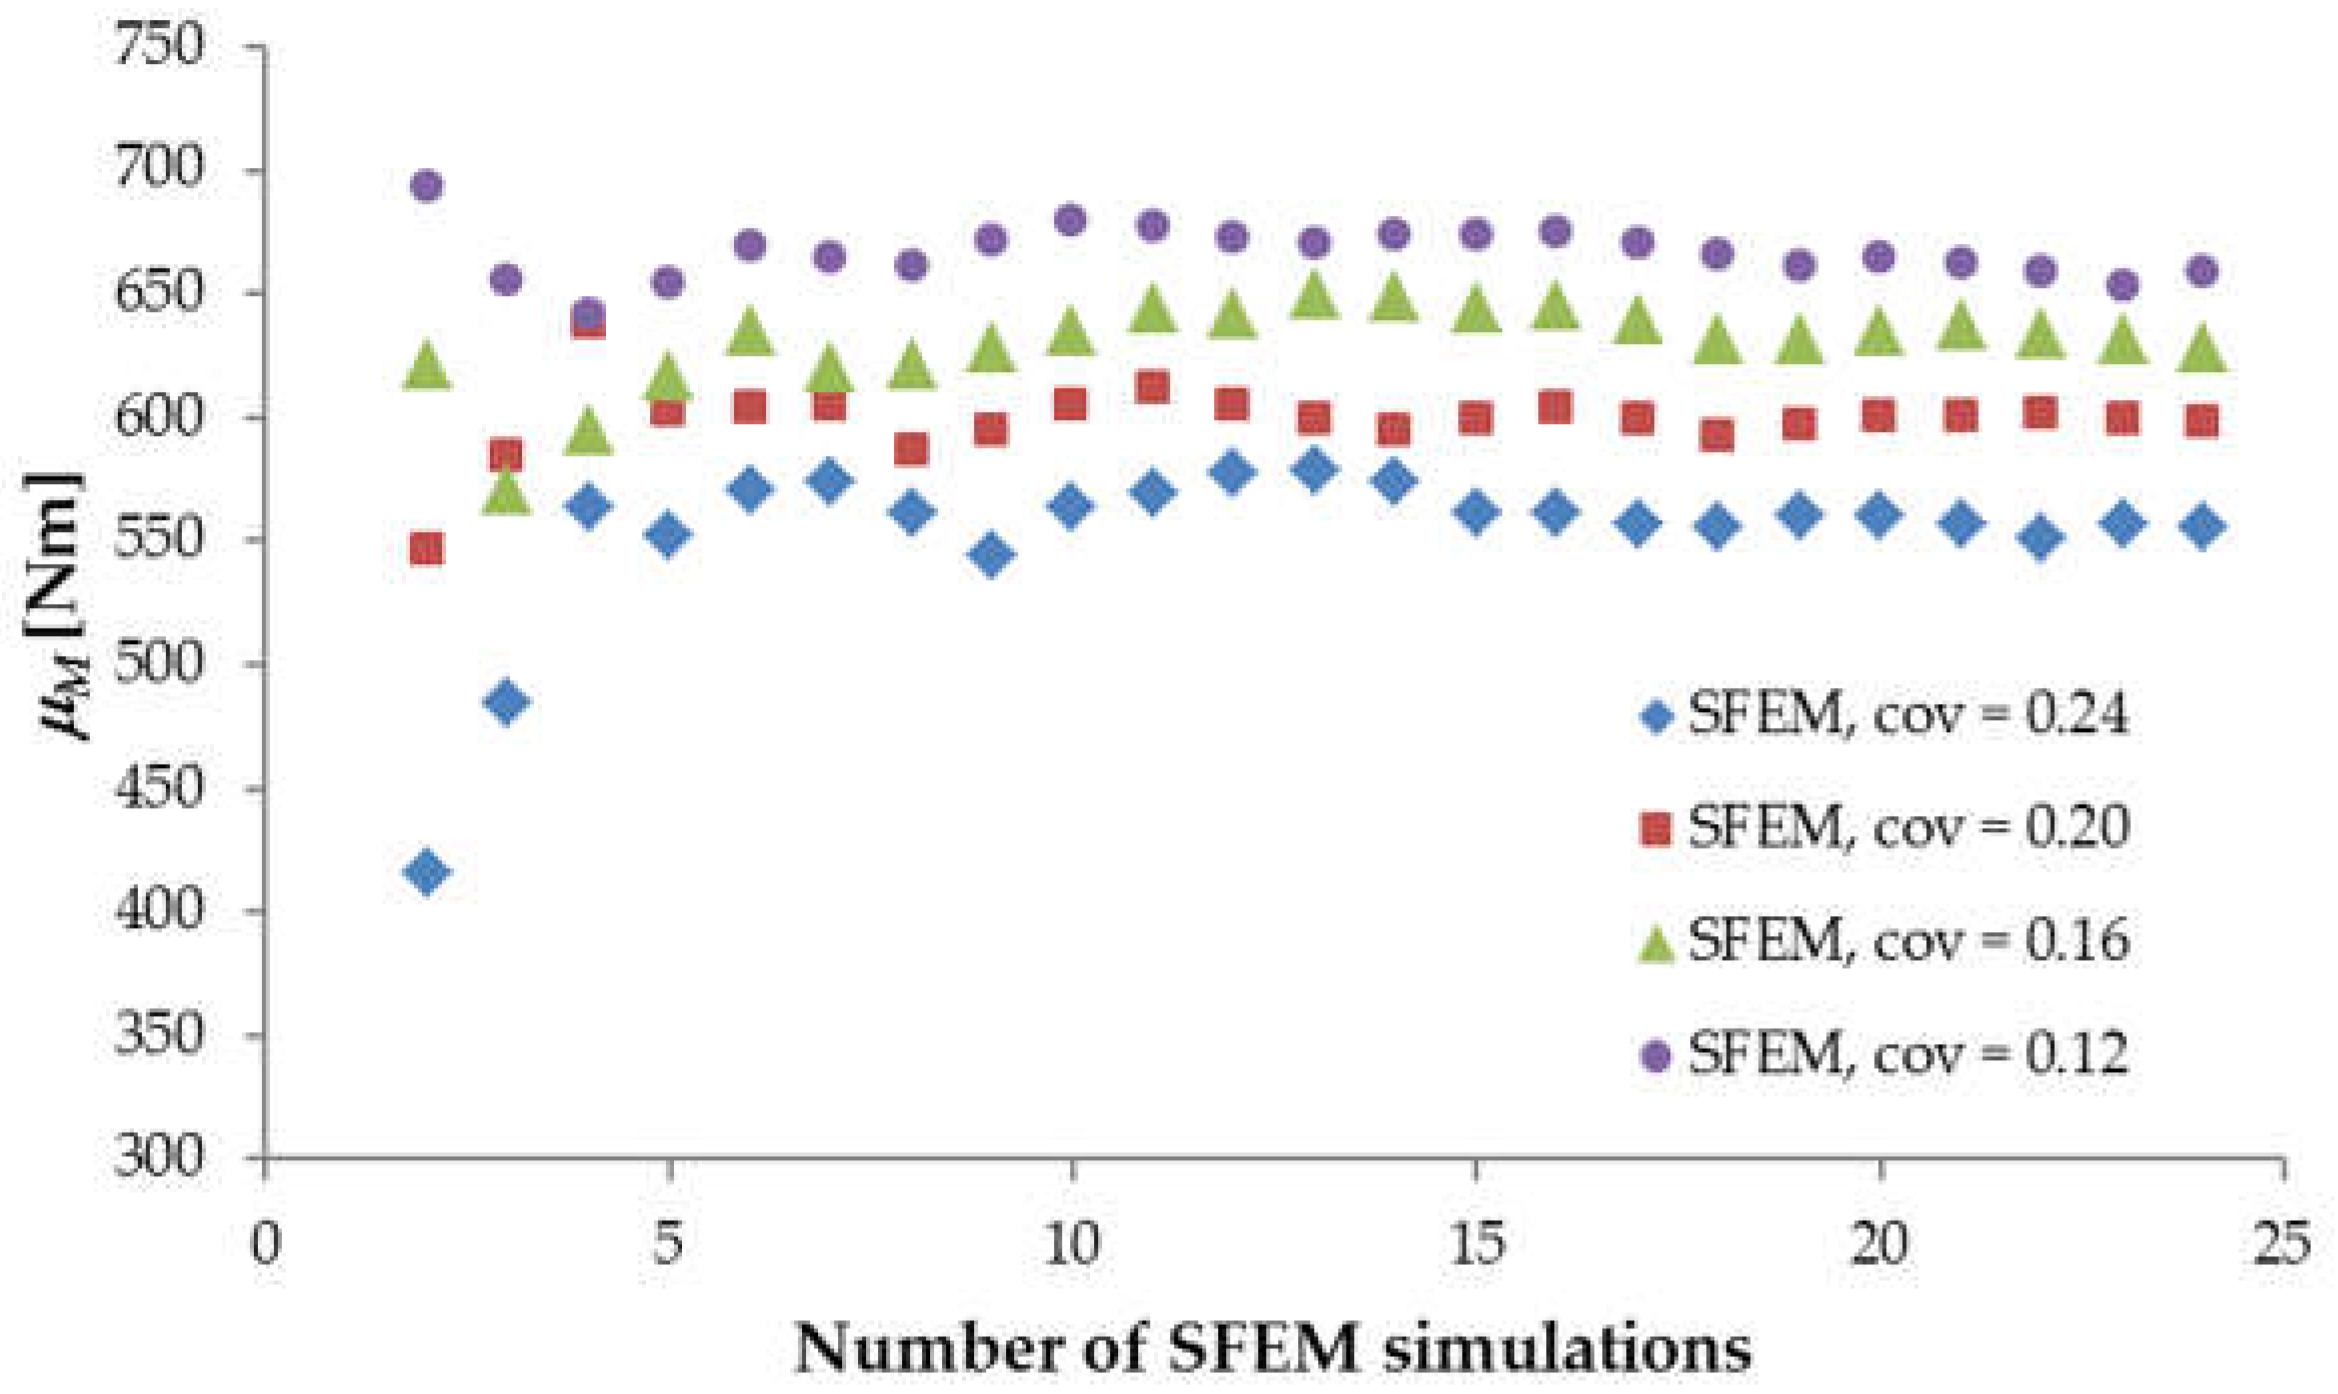
  • The simulated statistical size effect with the material cov = 0.16, calibrated based on the bending moment variation of the shortest beam LM200, was too weak compared with the experimental results;
  • The best approximation of the experimentally registered mean nominal strengths for increasing beam lengths was numerically obtained with the material cov = 0.24, but the calculated results’ variation was larger than that observed by Koide et al. [4,5];
  • Deterministic analysis showed the increase in the beam length (with the constant depth) caused the more brittle post-peak behavior but did not change the nominal strength.
The future plan is to compare the presented results with similar SFEM analysis using the grafted Gaussian–Weibull cumulative probability distribution function.

Funding

This research received no external funding.

Institutional Review Board Statement

Not applicable.

Informed Consent Statement

Not applicable.

Data Availability Statement

Not applicable.

Conflicts of Interest

The authors declare no conflict of interest.

References

  1. Weibull, W. A statistical theory of the strength of materials. J. Appl. Mech. 1951, 18, 293–297. [Google Scholar] [CrossRef]
  2. Bazant, Z.P. Probability distribution of energetic-statistical size effect in quasi-brittle fracture. Probabilistic Eng. Mech. 2004, 19, 307–319. [Google Scholar] [CrossRef] [Green Version]
  3. Bazant, Z.P.; Planas, J. Fracture and Size Effect in Concrete and Other Quasi-Brittle Materials; CRC Press LLC: Boca Raton, FL, USA, 1998; pp. 1–640. [Google Scholar]
  4. Syroka-Korol, E.; Tejchman, J.; Mróz, Z. FE analysis of size effects in reinforced concrete beams without shear reinforcement based on stochastic elasto-plasticity with non-local softening. Finite Elem. Anal. Des. 2014, 88, 25–41. [Google Scholar] [CrossRef]
  5. Hoover, C.G.; Bazant, Z.P.; Vorel, J.; Wendner, R.; Hubler, M.H. Comprehensive concrete fracture tests: Description and results. Eng. Fract. Mech. 2013, 114, 92–103. [Google Scholar] [CrossRef]
  6. Vliet, M.; Mier, J. Experimental investigation of size effect in concrete and sandstone under uniaxial tension. Eng. Fract. Mech. 2000, 65, 165–188. [Google Scholar] [CrossRef]
  7. Koide, H.; Akita, H.; Tomon, M. Size Effect on Flexural Resistance due to Bending Span of Concrete Beams. In Proceedings of the Third International Conference on Fracture Mechanics of Concrete and Concrete Structures (FRAMCOS-3), Gifu, Japan, 12–16 October 1998; Aedificatio Publishers: Freiburg, Germany, 1998; pp. 2121–2130. [Google Scholar]
  8. Koide, H.; Akita, H.; Tomon, M. Probability Model of Flexural Resistance on Different Lengths of Concrete Beams. In Proceedings of the 8th International Conference on Application of Safety and Probability, Sydney, Australia, 12–15 December 2000; Balkema: Rotterdam, The Netherlands; pp. 1053–1057. [Google Scholar]
  9. Bazant, Z.P.; Novak, D. Stochastic Models for Deformation and Failure of Quasibrittle Structures: Recent Advances and New Directions. In Computational Modelling of Concrete Structures (Proc., EURO-C. Conf., St. Johann im Pongau, Austria); Bicanic, N., de Borst, R., Mang, H., Meschke, G., Eds.; Balkema Publishing: Lisse, The Netherlands, 2003; pp. 583–598. [Google Scholar]
  10. Grassl, P.; Bazant, Z.P. Random lattice-particle simulation of statistical size effect in quasi-brittle structures failing at crack initiation. J. Eng. Mech. 2009, 135, 85–92. [Google Scholar] [CrossRef] [Green Version]
  11. Syroka-Korol, E.; Tejchman, J.; Mróz, Z. FE investigations of the effect of fluctuating local tensile strength on coupled energetic–statistical size effect in concrete beams. Eng. Struct. 2015, 103, 239–259. [Google Scholar] [CrossRef]
  12. Le, J.-L.; Bazant, Z.P. Unified nano-mechanics based probabilistic theory of quasibrittle and brittle structures: II. Fatigue crack growth, lifetime and scaling. J. Mech. Phys. Solids 2011, 59, 1322–1337. [Google Scholar]
  13. Le, J.-L.; Bazant, Z.P. Unified nano-mechanics based probabilistic theory of quasibrittle and brittle structures: I. Strength, static crack growth, lifetime and scaling. J. Mech. Phys. Solids 2011, 59, 1291–1321. [Google Scholar] [CrossRef]
  14. Eliás, J.; Vorechovsky, M.; Skocek, J.; Bazant, Z.P. Stochastic discrete meso-scale simulations of concrete fracture: Comparison to experimental data. Eng. Fract. Mech. 2015, 135, 1–16. [Google Scholar] [CrossRef]
  15. Hoover, C.G.; Bazant, Z.P. Cohesive crack, size effect, crack band and work-of-fracture models compared to comprehensieve concrete fracture tests. Int. J. Fract. 2014, 187, 133–143. [Google Scholar] [CrossRef] [Green Version]
  16. Comite Euro-International du Beton. CEB–FIB Model Code 1990 for Concrete Structures; Thomas Telford Publishing: London, UK, 1993. [Google Scholar]
  17. European Committee for Standarization. EN-1992-1-1: 2004 Eurocode 2: Design of Concrete Structures—Part 1-1: General Rules and Rules for Buildings; CEN-CENELEC: Brussels, Belgium, 2008. [Google Scholar]
  18. Skarzynski, L.; Tejchman, J. Experimental investigation of fracture process zone using DIC in plain and reinforced concrete beams under bending. Strain 2013, 49, 521–543. [Google Scholar] [CrossRef]
  19. Jirasek, M.; Bazant, Z.P. Inelastic Analysis of Structures; John Wiley & Sons: Hoboken, NJ, USA, 2001. [Google Scholar]
  20. Phoon, K.K.; Huang, S.P.; Quek, S.T. Simulation of second-order processes using Karhunen–Loeve expansion. Comput. Struct. 2002, 80, 1049–1060. [Google Scholar] [CrossRef]
  21. Phoon, K.K.; Huang, S.P.; Quek, S.T. Implementation of Karhunen–Loeve expansion for simulation using a wavelet-Galerkin scheme. Probabilistic Eng. Mech. 2002, 17, 293–303. [Google Scholar] [CrossRef]
  22. Karhunen, K. Über lineare Methoden in der Wahrscheinlichkeitsrechnung. Ann. Acad. Sci. Fennicae Ser. A I Math. Phys. 1947, 37, 1–79. [Google Scholar]
  23. Loeve, M. Functions Aleatoires du Second Ordre. In Processus Stochastic et Mouvment Brownien; Levy, P., Ed.; Gauthier Villares: Paris, France, 1948. [Google Scholar]
  24. Vorechovsky, M. Simulation of simply cross correlated random fields by series expansion methods. Struct. Saf. 2008, 30, 337–363. [Google Scholar] [CrossRef] [Green Version]
Figure 1. The bilinear softening function under tension expressed in terms of tensile stress σt versus the softening parameter κ (Gf = initial fracture energy, GF = total fracture energy and wloc = the localized zone width).
Materials 15 00095 g001
Figure 2. Exemplary profiles of cross-correlated and spatially auto-correlated random distributions of local material parameters: (a) ft, (b) Gf and (c) Emod.
Materials 15 00095 g002
Figure 3. Geometry of analyzed beams.
Materials 15 00095 g003
Figure 4. FE mesh of analyzed beam LM200.
Materials 15 00095 g004
Figure 5. The calculated mean ultimate bending moment μM against the number of SFEM simulations for beam LM200.
Materials 15 00095 g005
Figure 6. The calculated standard deviation of the ultimate bending moment M against the number of SFEM simulations for beam LM200.
Materials 15 00095 g006
Figure 7. The original frequency diagrams for beam LM200 obtained for different material cov compared with the experimental results of Koide et al. (Copyright Permission, Proceedings of FRAMCOS-3, 1998 and Proceedings of ICASP-8, 2000) [7,8].
Materials 15 00095 g007
Figure 8. The translated frequency diagrams for beam LM200 obtained for different material cov compared with the experimental results of Koide et al. (Copyright Permission, Proceedings of FRAMCOS-3, 1998 and Proceedings of ICASP-8, 2000) [7,8].
Materials 15 00095 g008
Figure 9. The mean ultimate bending moment (±standard deviation) of a beam with increasing span calculated based on SFEM simulations with cov = 0.16 compared with deterministic FEM analysis and the experimental results of Koide et al. (Copyright Permission, Proceedings of FRAMCOS-3, 1998 and Proceedings of ICASP-8, 2000) [7,8].
Materials 15 00095 g009
Figure 10. Normalized load-deflection diagrams from deterministic FEM simulations with various beam spans.
Materials 15 00095 g010
Figure 11. Measured localized zone height at the peak load from deterministic and stochastic FEM simulations with cov = 0.16.
Materials 15 00095 g011
Figure 12. The mean ultimate bending moment (±standard deviation) of a beam with increasing span calculated based on SFEM simulations with cov = 0.16 and cov = 0.24 compared with the experimental results of Koide et al. (Copyright Permission, Proceedings of FRAMCOS-3, 1998 and Proceedings of ICASP-8, 2000) [7,8].
Materials 15 00095 g012
Publisher’s Note: MDPI stays neutral with regard to jurisdictional claims in published maps and institutional affiliations.

