Abstract
Geopolymers, recognized as an ecological alternative to cement concrete, are gaining more and more interest from researchers and the construction industry. Due to the registrable electrical conductivity, this material also attracts the interest of other fields of science and industry as a potential functional material. The article discusses the used geopolymer material, created on the basis of metakaolin and waste Cathode Ray Tubes (CRT) glass, reinforced with ultra-long in-house carbon nanotubes (CNT), in the context of its use as a smart material for Structural Health Monitoring. Long in-house made carbon nanotubes were added to enhance the electrical conductivity of the geopolymer. The impedance spectroscopy method was applied to investigate the conductive properties of this material. The paper shows the microscopic and mechanical characteristics of the materials and presents the results of promising impedance spectroscopy tests.
1. Introduction
The idea of conductive materials’ application to monitor concrete structures, especially in the scope of strain and damage sensing, is not a new issue. In the 1990s, Chen and Chung, while admixing cut carbon fibers to the concrete cover, estimated the degree of cracking and deformation of the concrete structure [1,2,3].
These works were developed by many research groups, e.g., [4,5,6,7], which were looking for more effective ways to use carbon-based conductive materials in Structural Health Monitoring (SHM). With the appearance of carbon nanomaterials, they have led to attempts to use mainly CNT [8,9] and graphene [10,11] to monitor and protect various types of building structures, not just concrete structures [12].
Due to increasing environmental awareness related to significant CO2 emissions, the construction industry began to look for a replacement for cement concrete. Geopolymers and alkali-activated materials (AAM), which do not use cement, require less process water, and replace non-renewable sand and gravel resources with industrial wastes, have become one of the main research directions, allowing the immobilization of environmentally hazardous materials [13,14,15].
Geopolymer seems to be a very promising functional material as it exhibits enhanced electrical properties. This material is gaining more and more interest in various industries, and its advanced applications include monitoring of deformation, temperature, and humidity.
First attempts have also been made to strengthen the electrical properties of geopolymer by adding conductive fillers such as carbon fibers [16], graphene [17], CNT [18], carbon black [19], and graphite [20]. Incorporation of carbon nanotubes into the geopolymer mixture has been so far explored mainly in the direction of improving mechanical properties [21]. An influence on the mechanical performance depends on the type and content of added nanotubes. Da Luz et al. [22] report that the addition of 0.1% of pristine carbon nanotubes into the metakaolin-based geopolymer increases both compressive and flexural strength (by ≈13% and ≈29%, respectively), but the addition of 0.2% decreases strength in comparison to the control sample. By contrast, functionalized CNT increased the strength the most efficiently up to 0.2% weight content (compressive strength increased by ≈47% and flexural by ≈66% in comparison to geopolymer without CNT). Rovnanik et al. [23] examined fly ash-based geopolymer with multi-walled carbon nanotubes (MWCNT). According to tests, compressive strength and modulus of elasticity increased along with the increase of nanomaterial content from 0.00% to 0.15% and then decreased in samples containing 0.20% of nanotubes. Samples containing 0.15% of MWCNT achieved 70% higher compressive strength than samples without nanomaterial. An addition of nanotubes decreased the fracture toughness and fracture energy except for samples containing 0.20% of nanomaterial. Scientists found that the addition of MWCNT reduces the formation of microcracks. By contrast, Azeem et al. [24] report the biggest increase in the strength of fly ash and slag-based geopolymer after the addition of 0.20% of carbon nanotubes. The compressive strength increased by about 20% while flexural strength by about 15% in comparison to the control sample. In the reported test, the compressive strength increased monotonically along with the increase of CNT content while flexural strength generally decreased after the addition of CNT excluding samples containing 0.20% of nanotubes. Azeem et al. [24] claim that a concentration of MWCNT higher than 0.20% would weaken the structure of material leading to a decrease of the strength. A similar result is presented by Maho et al. [25]. Both compressive strength and flexural strength of fly ash-based geopolymer increased after the addition of MWCNT and the biggest increase was noted in samples containing 0.20% of MWCNT. Compressive strength increased by approximately 35% and flexural strength by 26% in comparison to control samples without nanomaterial. The further addition of MWCNT (up to 0.60%) caused a drop in strength. Maho et al. indicate that the high content of MWCNT increases the water demand of a mixture leading to problems in mixing and compacting processes. Abbasi et al. [26] report that the addition of 0.5% of MWCNT leads to the increase of compressive strength of metakaolin-based geopolymer by 32% and flexural strength by 28%. The authors explain that an optimal amount of MWCNT leads to the bridging of the micro-cracks which enhances the strength. Using higher amounts of nanomaterial (1.0% in the described test) is less effective due to the agglomeration of nanotubes. Jittabut et al. [27] report adding much greater amounts of carbon nanotubes into the fly ash-based geopolymer—1, 2, 3, 4, and 5% calculated by mass, as MWCNT to fly ash ratio. Authors noted that the addition of 1% of MWCNT considerably improves the compressive strength of geopolymer both after 7 days (improvement by ≈18–45%) and 28 days (improvement by ≈5–30%) of curing, in dependence on the concentration of activator. The addition of greater amounts of MWCNT caused decrease of strength. The apparent porosity of the material increased monotonically along with the increase of MWCNT content.
The impedance spectroscopy from the early years of its development became an attractive method for the study of construction materials by monitoring their conductivity. In most papers, authors applied the method to cement- or concrete-based materials [28,29]. The spectra of most of the presented materials had a rather simple diffusion involving a Randles-type shape which allowed for visual detection of differences in the material composition and changes during its binding [30]. Since impedance spectroscopy is a non-invading and non-destructive technique, one of the most interesting applications would be intrinsic control of the constructions. A possibility of monitoring the concrete corrosion, i.e., destruction, has been recently demonstrated [31]. However, the rather small number of papers on that topic and lack of a universal approach indicates the high complexity of the problem. The paper presents advancements of using impedance spectroscopy as potential tool in Structural Health Monitoring on the example of a novel and ecological structural material based on geopolymer reinforced with ultra-long, in-house CNT.
2. Materials and Methods
2.1. Synthesis and Characterization of Ultra-Long CNTs (UL-MWCNTs)
UL-MWCNTs CNTs were chosen as reinforcement of geopolymer due to their high potential to increase its electrical conductivity.
UL-MWCNTs were grown via catalytic chemical vapor deposition (CVD) under optimized conditions. A (760 °C) STF1200 Tube Furnace (Across International, Livingstone, NJ, USA) operating with a preheater (250 °C) and an automated syringe pump served as the reactor. Further, 5.5 wt.% of ferrocene (catalyst precursor and a partial carbon source) in toluene (the main carbon source) (injection rate 2.8 mL h–1) was applied as the feedstock. Argon was used as the carrier gas (flow rate 1.8 L min–1). The total time of synthesis was 24 h. Scanning electron microscopy (SEM) (Phenom Pro Desktop SEM) (Thermo Fischer Scientific, Warsaw, Poland) equipped with an EDS detector (15 kV) was used to acquire the micrographs of the geopolymer, MWCNTs, and their nanocomposites.
2.2. Carbon Nanotube-Reinforced Geopolymer
Metakaolin was delivered by the Astra Technologia Betonu (Straszyn, Poland). It was not subjected to any additional treatment before tests. The exact chemical composition of metakaolin is given in Table 1.

Table 1.
Chemical composition (wt.%) of metakaolin 1 and CRT glass 2.
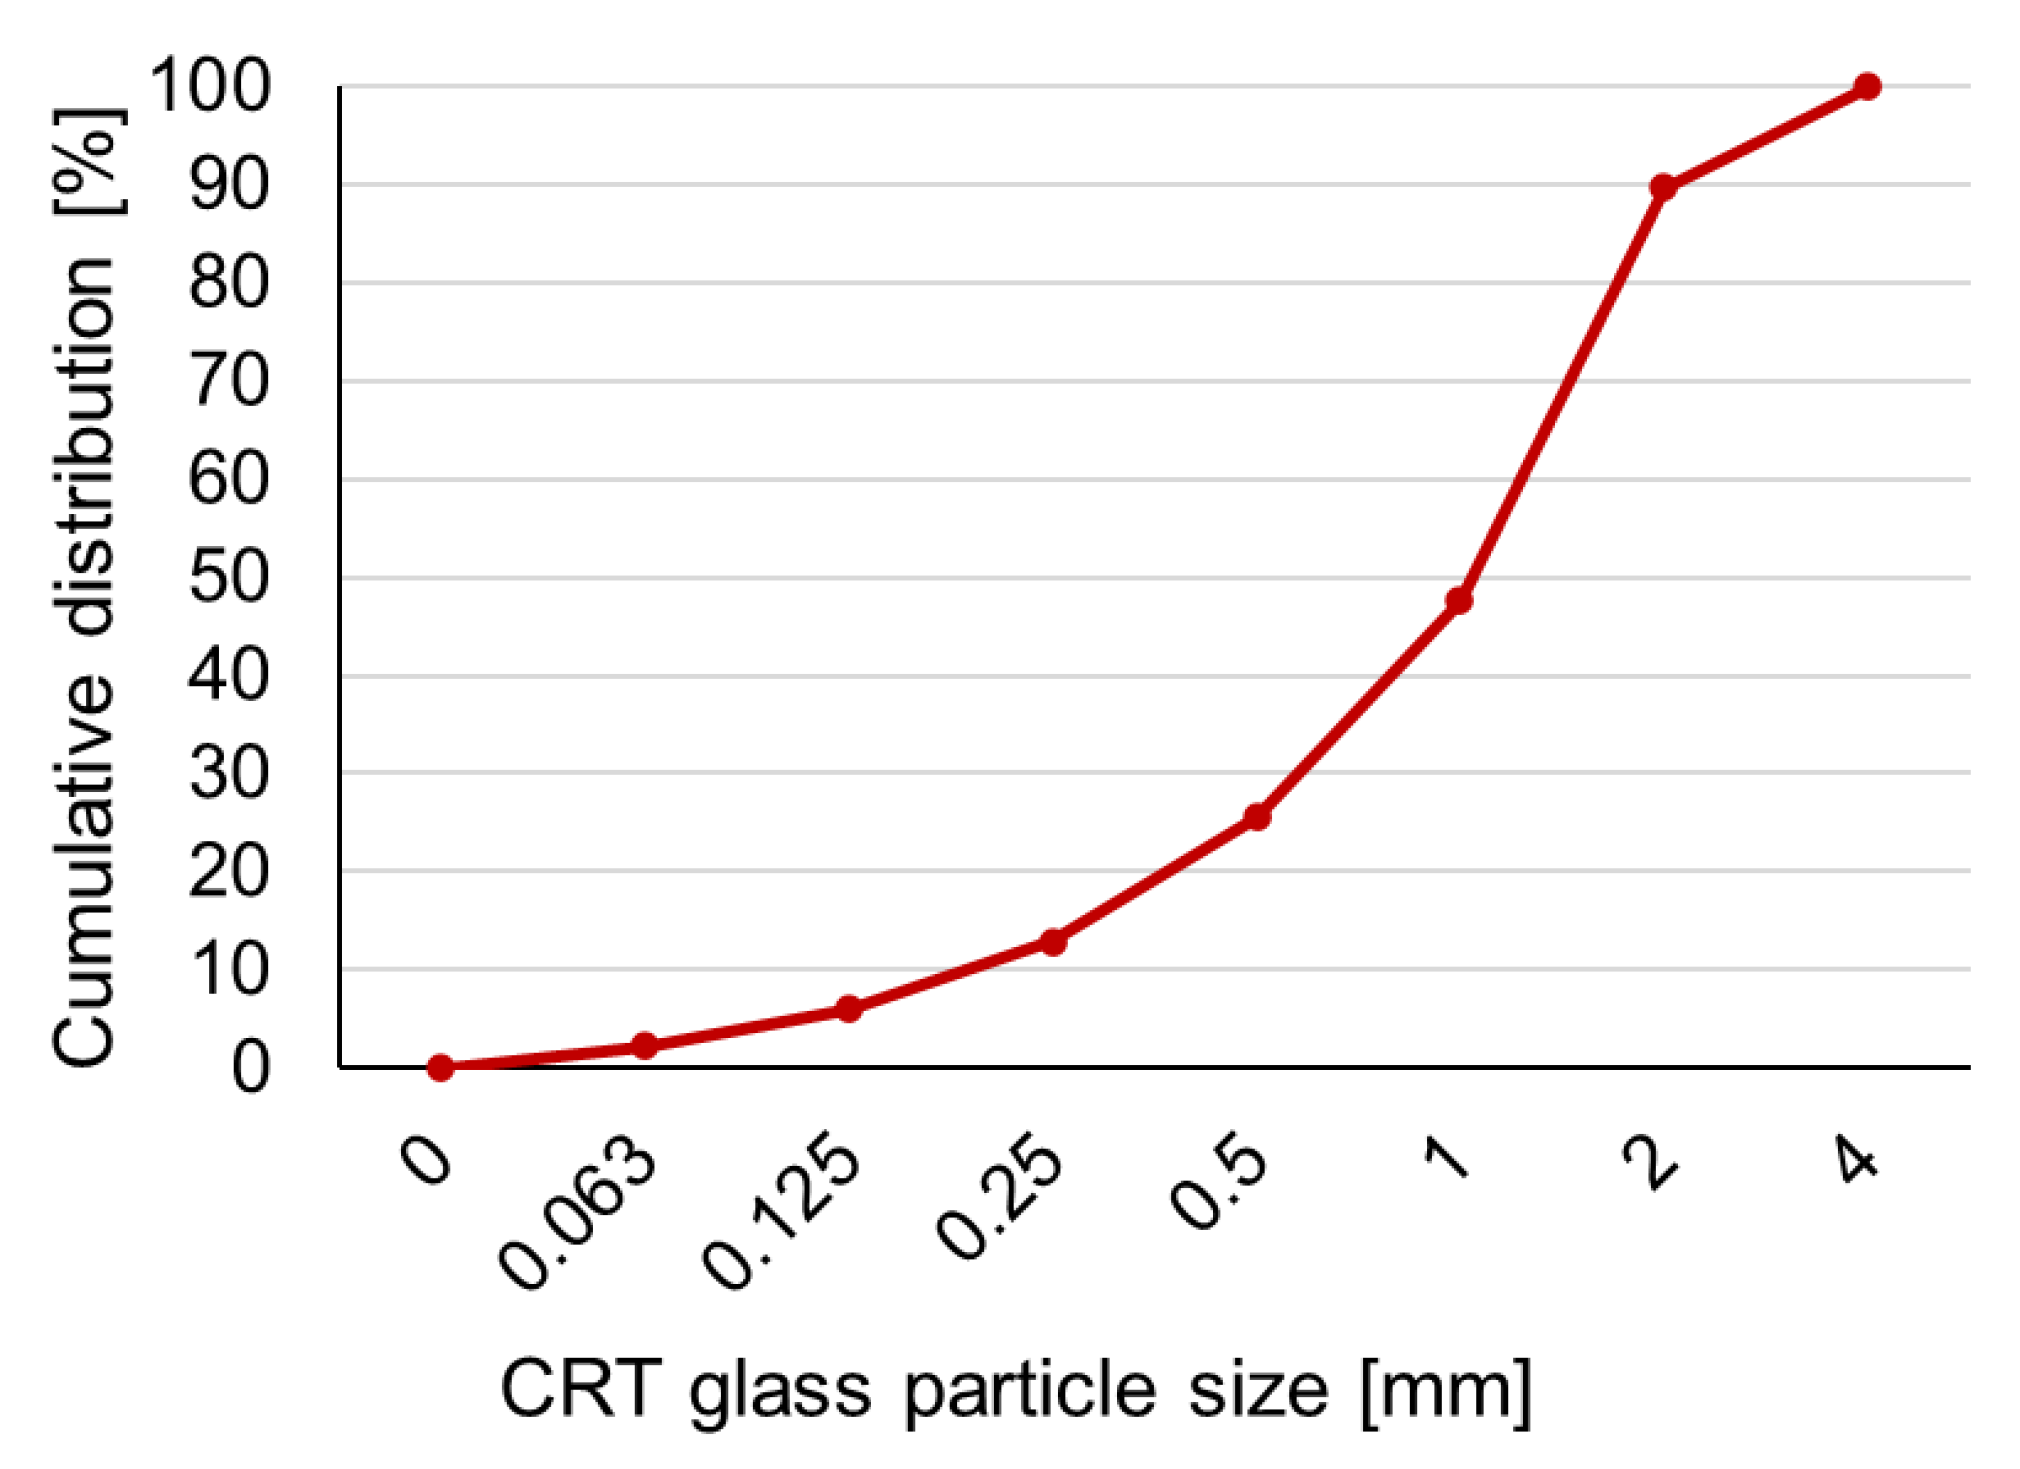
Cathode Ray Tube (CRT) glass was delivered in crushed form by Thornmann Recycling® (Toruń, Poland) and came from discarded monitors and television screens. It was not subjected to any additional treatment before the preparation of samples. The chemical composition of CRT glass (Table 1) was determined by X-ray fluorescence (XRF) analysis by EkotechLAB® (Gdańsk, Poland). The curve describing the distribution of particles size is shown in Figure 1.
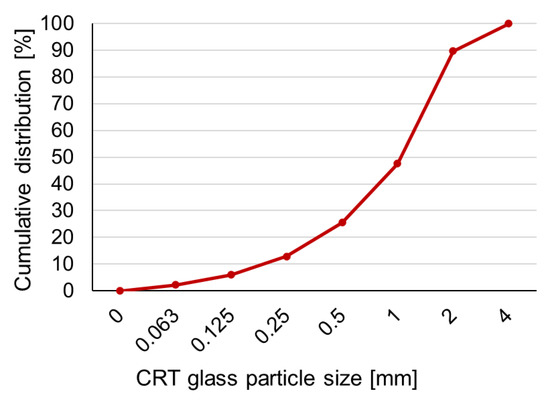
Figure 1.
CRT glass particles size distribution.
The liquid solution of sodium hydroxide was obtained by dissolving sodium hydroxide pellets in demineralized water for at least 24 h before preparation of the mixture. The 10 mol/L sodium hydroxide solution was used for mixture preparation.
The commercial sodium silicate was used as the second activator. The producer provided the following characterization of sodium silicate solution: ratio of SiO2 to Na2O between 2.4 and 2.6. The minimum content of oxides (SiO2 and Na2O) was 39%.
Tests were carried out on samples made of three mixtures. The content of carbon nanotubes (CNT) was the only variable factor. The first, control, group did not contain nanotubes. The second and third groups of samples contained carbon nanotubes in the amount of 0.5 wt.% and 1 wt.% respectively. The exact composition of all mixtures is given in Table 2.
Table 2.
Mixtures composition.
In the first step, both activators (sodium hydroxide and sodium silicate) were mixed for 5 min. CNTs were firstly mixed with metakaolin and CRT glass and then activators were added. The ready mixture was placed in the prismatic forms of dimensions 40 mm × 40 mm × 160 mm, covered tightly, and kept at the ambient temperature ~20°C for 28 days. After 28 days, samples were demolded, weighed, measured, and then subjected to strength tests. Each sample was first subjected to the three-point flexural strength test. The obtained pieces were subjected to a compressive strength test. The whole procedure was performed using the Controls® Model 65-L27C12 Serial no 12020060 (Controls, Milan, Italy) machine according to standard EN 196-1 [32].
2.3. Impedance Spectroscopy Methodology
All electrical measurements were performed using BioLogic SP150 (Seyssinet-Pariset, France) potentiostat equipped with a low-current module under room temperature and humidity of about 36%. The samples were studied in a dry state, and no effect of humidity on the conductivity properties was observed. The impedance spectra were recorded in galvanostatic mode with IDC = 0, and modulation amplitude equal to 1 nA. The frequency range was from 0.1 Hz to 1 MHz with 20 points per decade on logarithmic scale. The measurement cables were connected via two metal handles attached to the sample at the 12.0 cm distance.
3. Results
3.1. Carbon Nanotube-Reinforced Geopolymer—Mechanical Properties
Flexural and compressive strength results are presented in Table 3. In the control group, two samples were subjected to a flexural strength test and four to a compressive strength test. Series with CNT consisted of one prism so that consequently one sample was subjected to the flexural strength test and two to the compressive strength test. Tests were performed for preliminary assessment of CNT content on the mechanical behavior of the geopolymer. The number of samples was too small for a thorough analysis and extended studies will be necessary in the future.
Table 3.
Compressive and flexural strength of geopolymer.
The highest flexural and compressive strength was obtained by control samples without CNT. The addition of CNT caused a slight decrease of both flexural and compressive strength but measured mechanical characteristics of geopolymer with CNT were still high and good enough to consider this material for structural applications. The flexural strength increased, while the compressive strength decreased slightly with the increase of CNT content from 0.5% to 1.0%.
Each sample before the strength test was measured with the caliper and weighed. The density of samples (presented in Table 4) was calculated by dividing the mass of the sample by its volume. The difference between the density of samples without CNT and containing CNT was negligible (2%). According to the results, the addition of CNT does not significantly influence the density of geopolymer.
Table 4.
Density of samples.
3.2. Microstructure
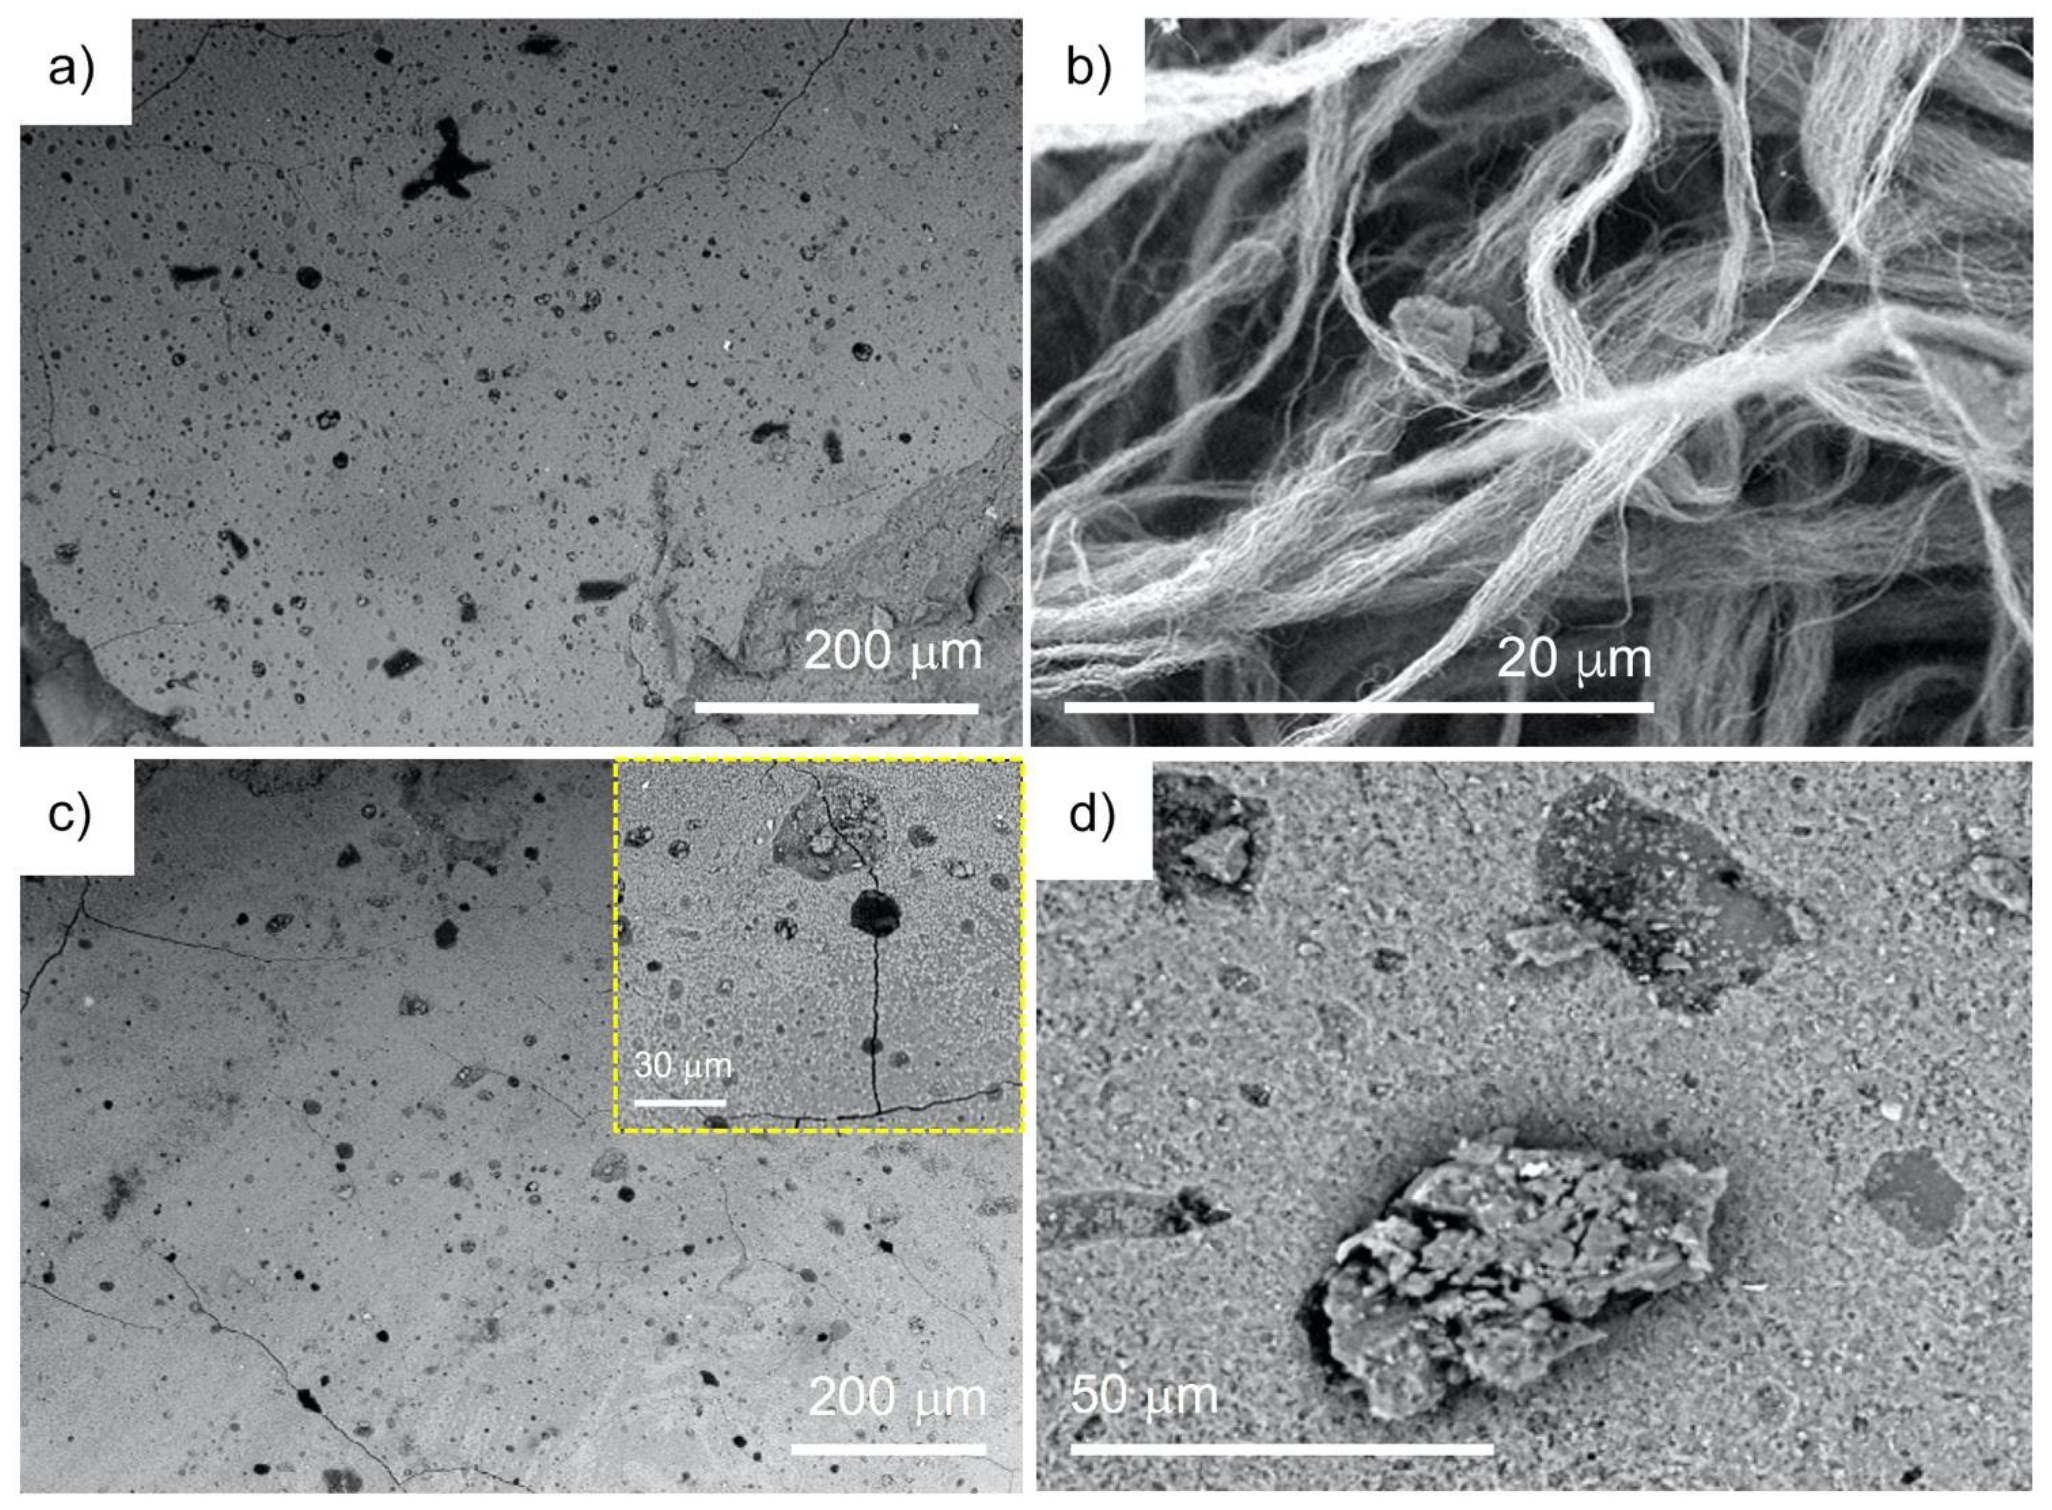
Figure 2 represents SEM images of neat geopolymer surface (a). In turn, Figure 2b shows in-house synthesized MWCNTs. Here, the prolonged time of synthesis enabled to obtain the fibrous-like 0.8 mm-long and ca. 60 nm in outer diameter MWCNTs (aspect ratio ca. 15,000). The in-house MWCNTs were synthesized as vertically aligned, free-standing arrays and in the yield of ca. 30% yield per carbon. Upon introduction of the nanotubes into the geopolymer matrix (c,d), a surface of the so-formed nanocomposites could be characterized by an increased number of cracks and splits. At the same time, an insight into those surfaces clearly revealed a concentration-dependent and statistical distribution of the nanotube agglomerates as black, quasi-oval areas with irregular edges. In a few cases, the presence of the agglomerates was found in the split lines which would suggest a weaker binding and generation of the cracks.
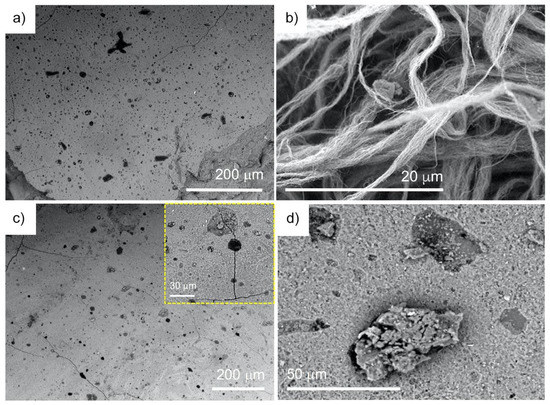
Figure 2.
SEM images of: geopolymer (a), in-house MWCNTs (b), geopolymer nanocomposites containing 0.5 wt.% and 1 wt.% of in-house MWCNTs (c,d); the insets correspond to the indicated magnifications revealing the nanotube agglomerates.
3.3. Impedance Spectroscopy
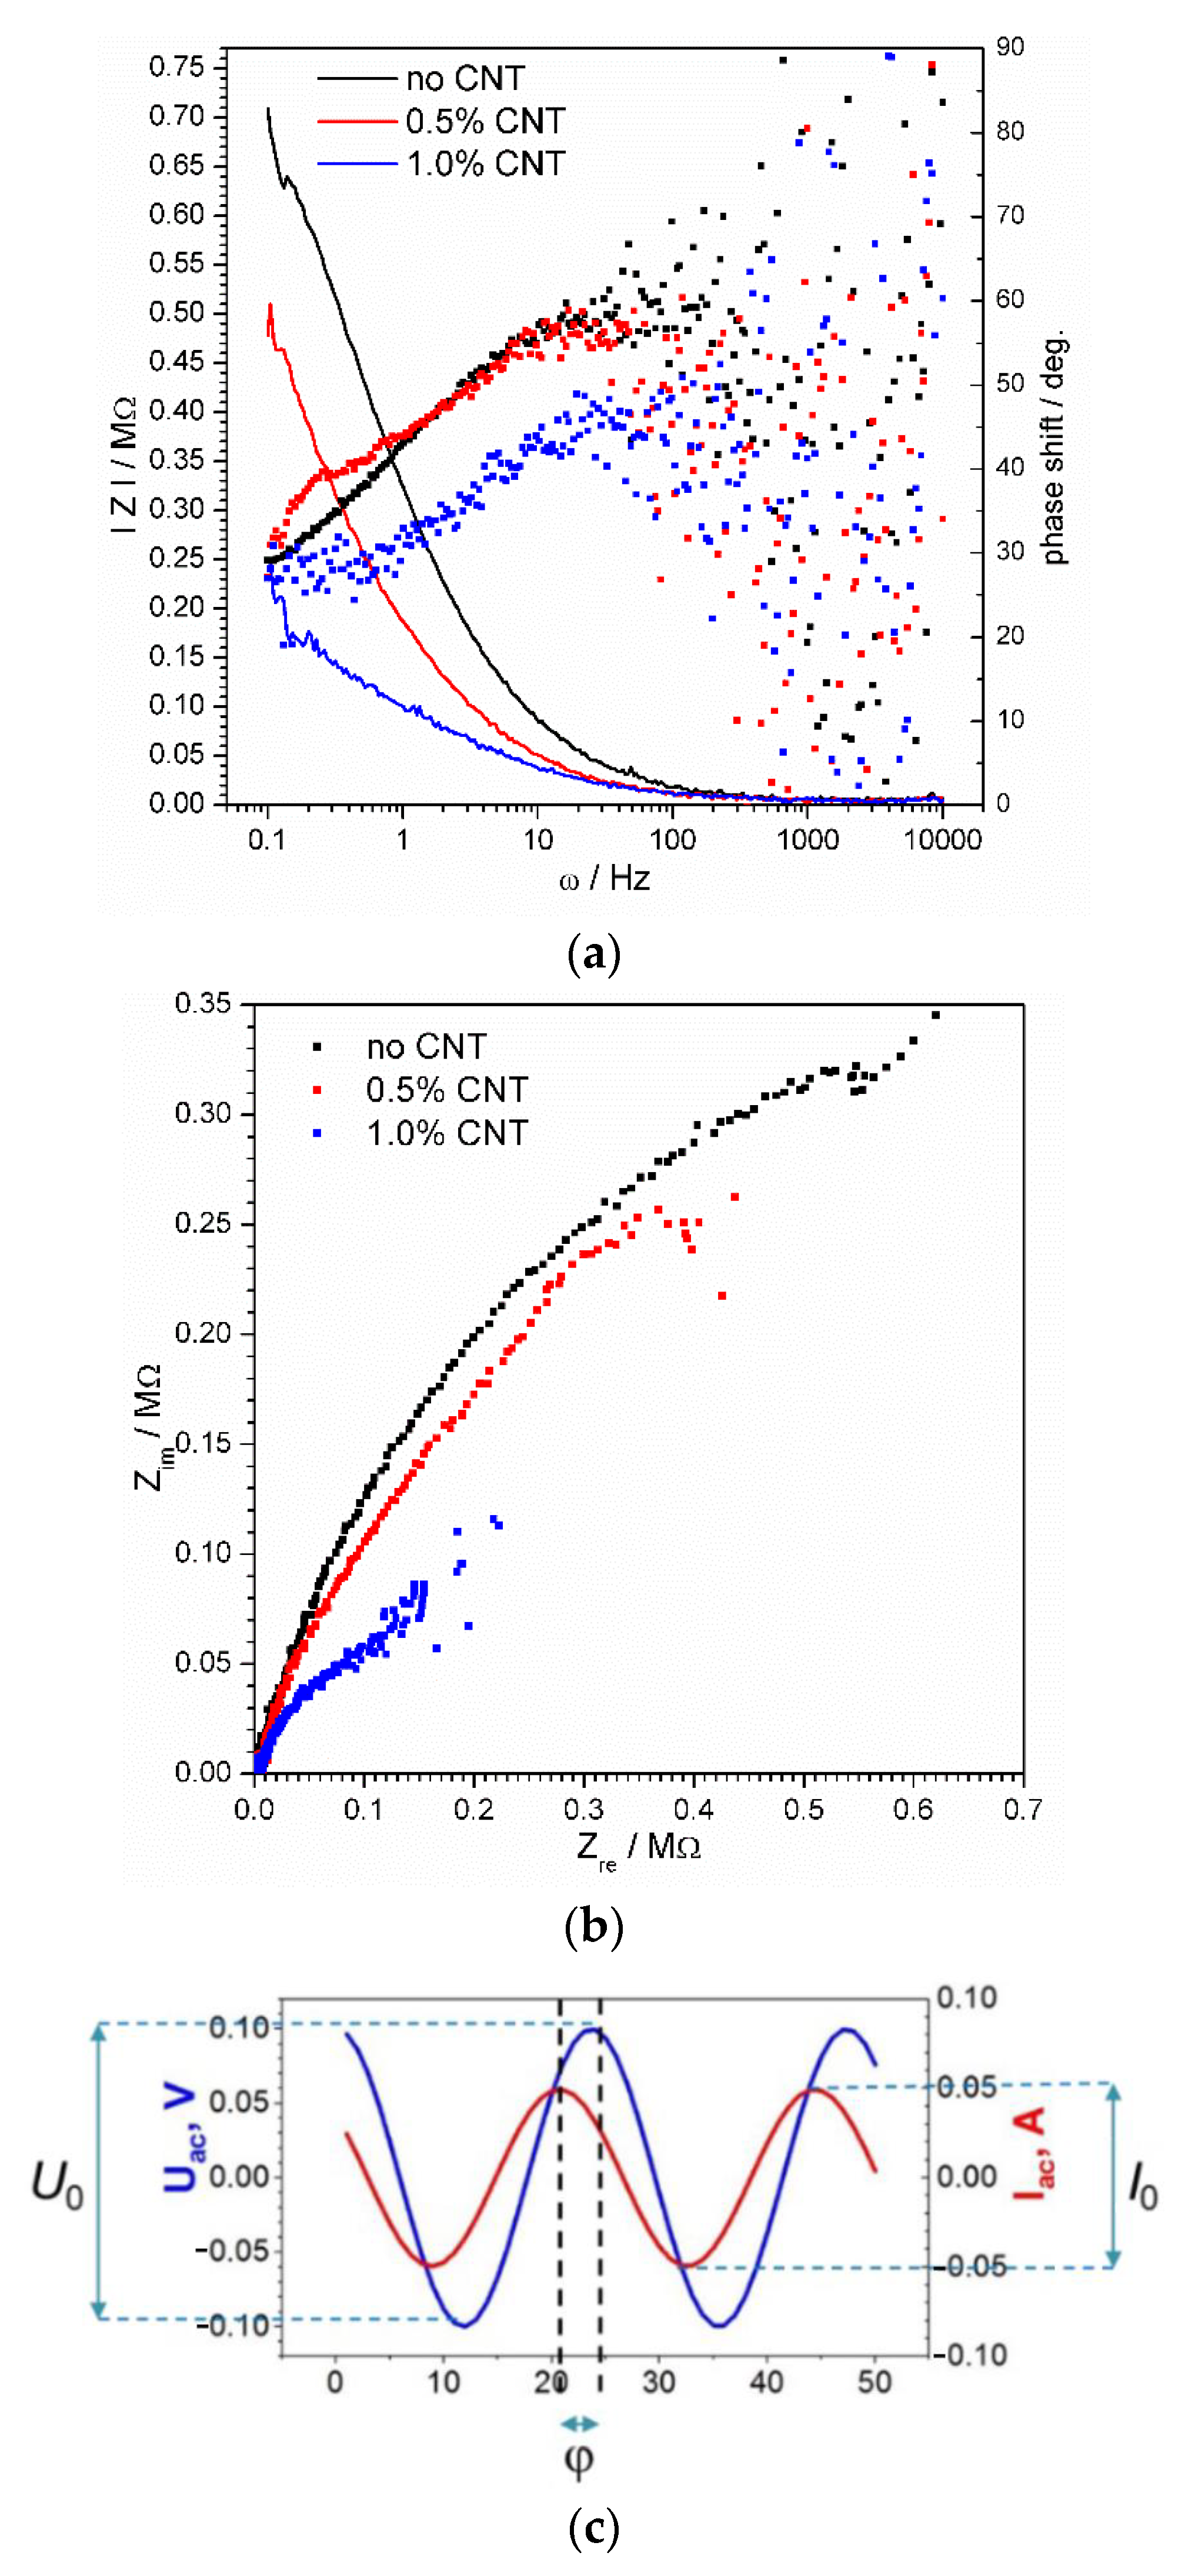
The typical impedance spectra are shown in Figure 3. Figure 3a (Bode plot) shows the values of impedance module and phase shift φ as functions of frequency. The complex plane plot also called the Nyquist plot (Figure 3b) gives a relation between real and imaginary impedance components.
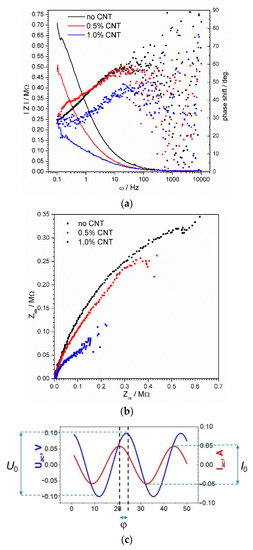
Figure 3.
Bode (a) and Nyquist (b) spectra of geopolymer material modified with carbon nanotubes. Impedance module plot is shown by lines, while phase shift—by dots (a). A schematic illustration of the phase shift and amplitudes of the applied harmonic current signal and registered voltage response as functions of time (c).
The impedance of the material is very high which requires very sensitive equipment capable of registering a low AC signal. In our case, the valuable data were obtained at frequencies lower than 100 Hz (Figure 3a).
The registered conductivity of the modified geopolymer material, though it is very small, is a unique feature. Then, it was important to prove that the conductivity is provided by the material and not by the humidity in its pores or on the surface. For that, we studied two identical samples. The first one was dried in a desiccator for 6 h at 60 °C. The second one was dipped in water for 30 min and then dried with a tissue to remove water from the surface. The resulting impedance spectra were almost identical confirming that the key role in ensuring material conductivity is played by carbon nanotubes.
It is seen that the geopolymer material itself possesses a measurable conductivity even in a fully dry state. This is provided by the residues of moisture in the air-locked pores inside the material. The addition of the nanotubes causes the decrease of impedance by about 30% based on the comparison of the impedance module (Figure 3a). An increase of nanotube concentration up to 1% by mass reduces material impedance by about three times. The Nyquist spectra (Figure 3b) have the same form meaning that the general conductivity mechanism up to 1% nanotube contents remains the same. The phase shift of the AC signal in 1%-CNT samples differs from that of the 0.5% and CNT-free samples (Figure 3a). Its decrease means that the impact of the capacitive processes related to the electrolyte-filled pores becomes smaller with the increase of nanotube concentration. In other words, carbon nanotubes at high concentrations start playing the main role in charge delivery.
4. Discussion
The system of nanotubes randomly distributed in the geopolymer structure could not be presented by a simple equivalent electrical circuit composed of several physical elements. Therefore, our goal was to find a simple, averaged model to be used for the comparison of different samples and their conductive or capacitive properties.
The found solution included the application of an equivalent electrical circuit composed of frequency-dependent parameters. The fact that the parameter values are dependent on frequency may be confusing and non-consistent with the conventional concept of equivalent circuits. To explain this feature, we state that the parameters are estimated experimentally in a very narrow range of frequencies. A similar technique for fragmentary analysis was already proposed by Vladikova et al. [33,34,35] with respect to non-uniform research objects such as mesoporous oxide films.
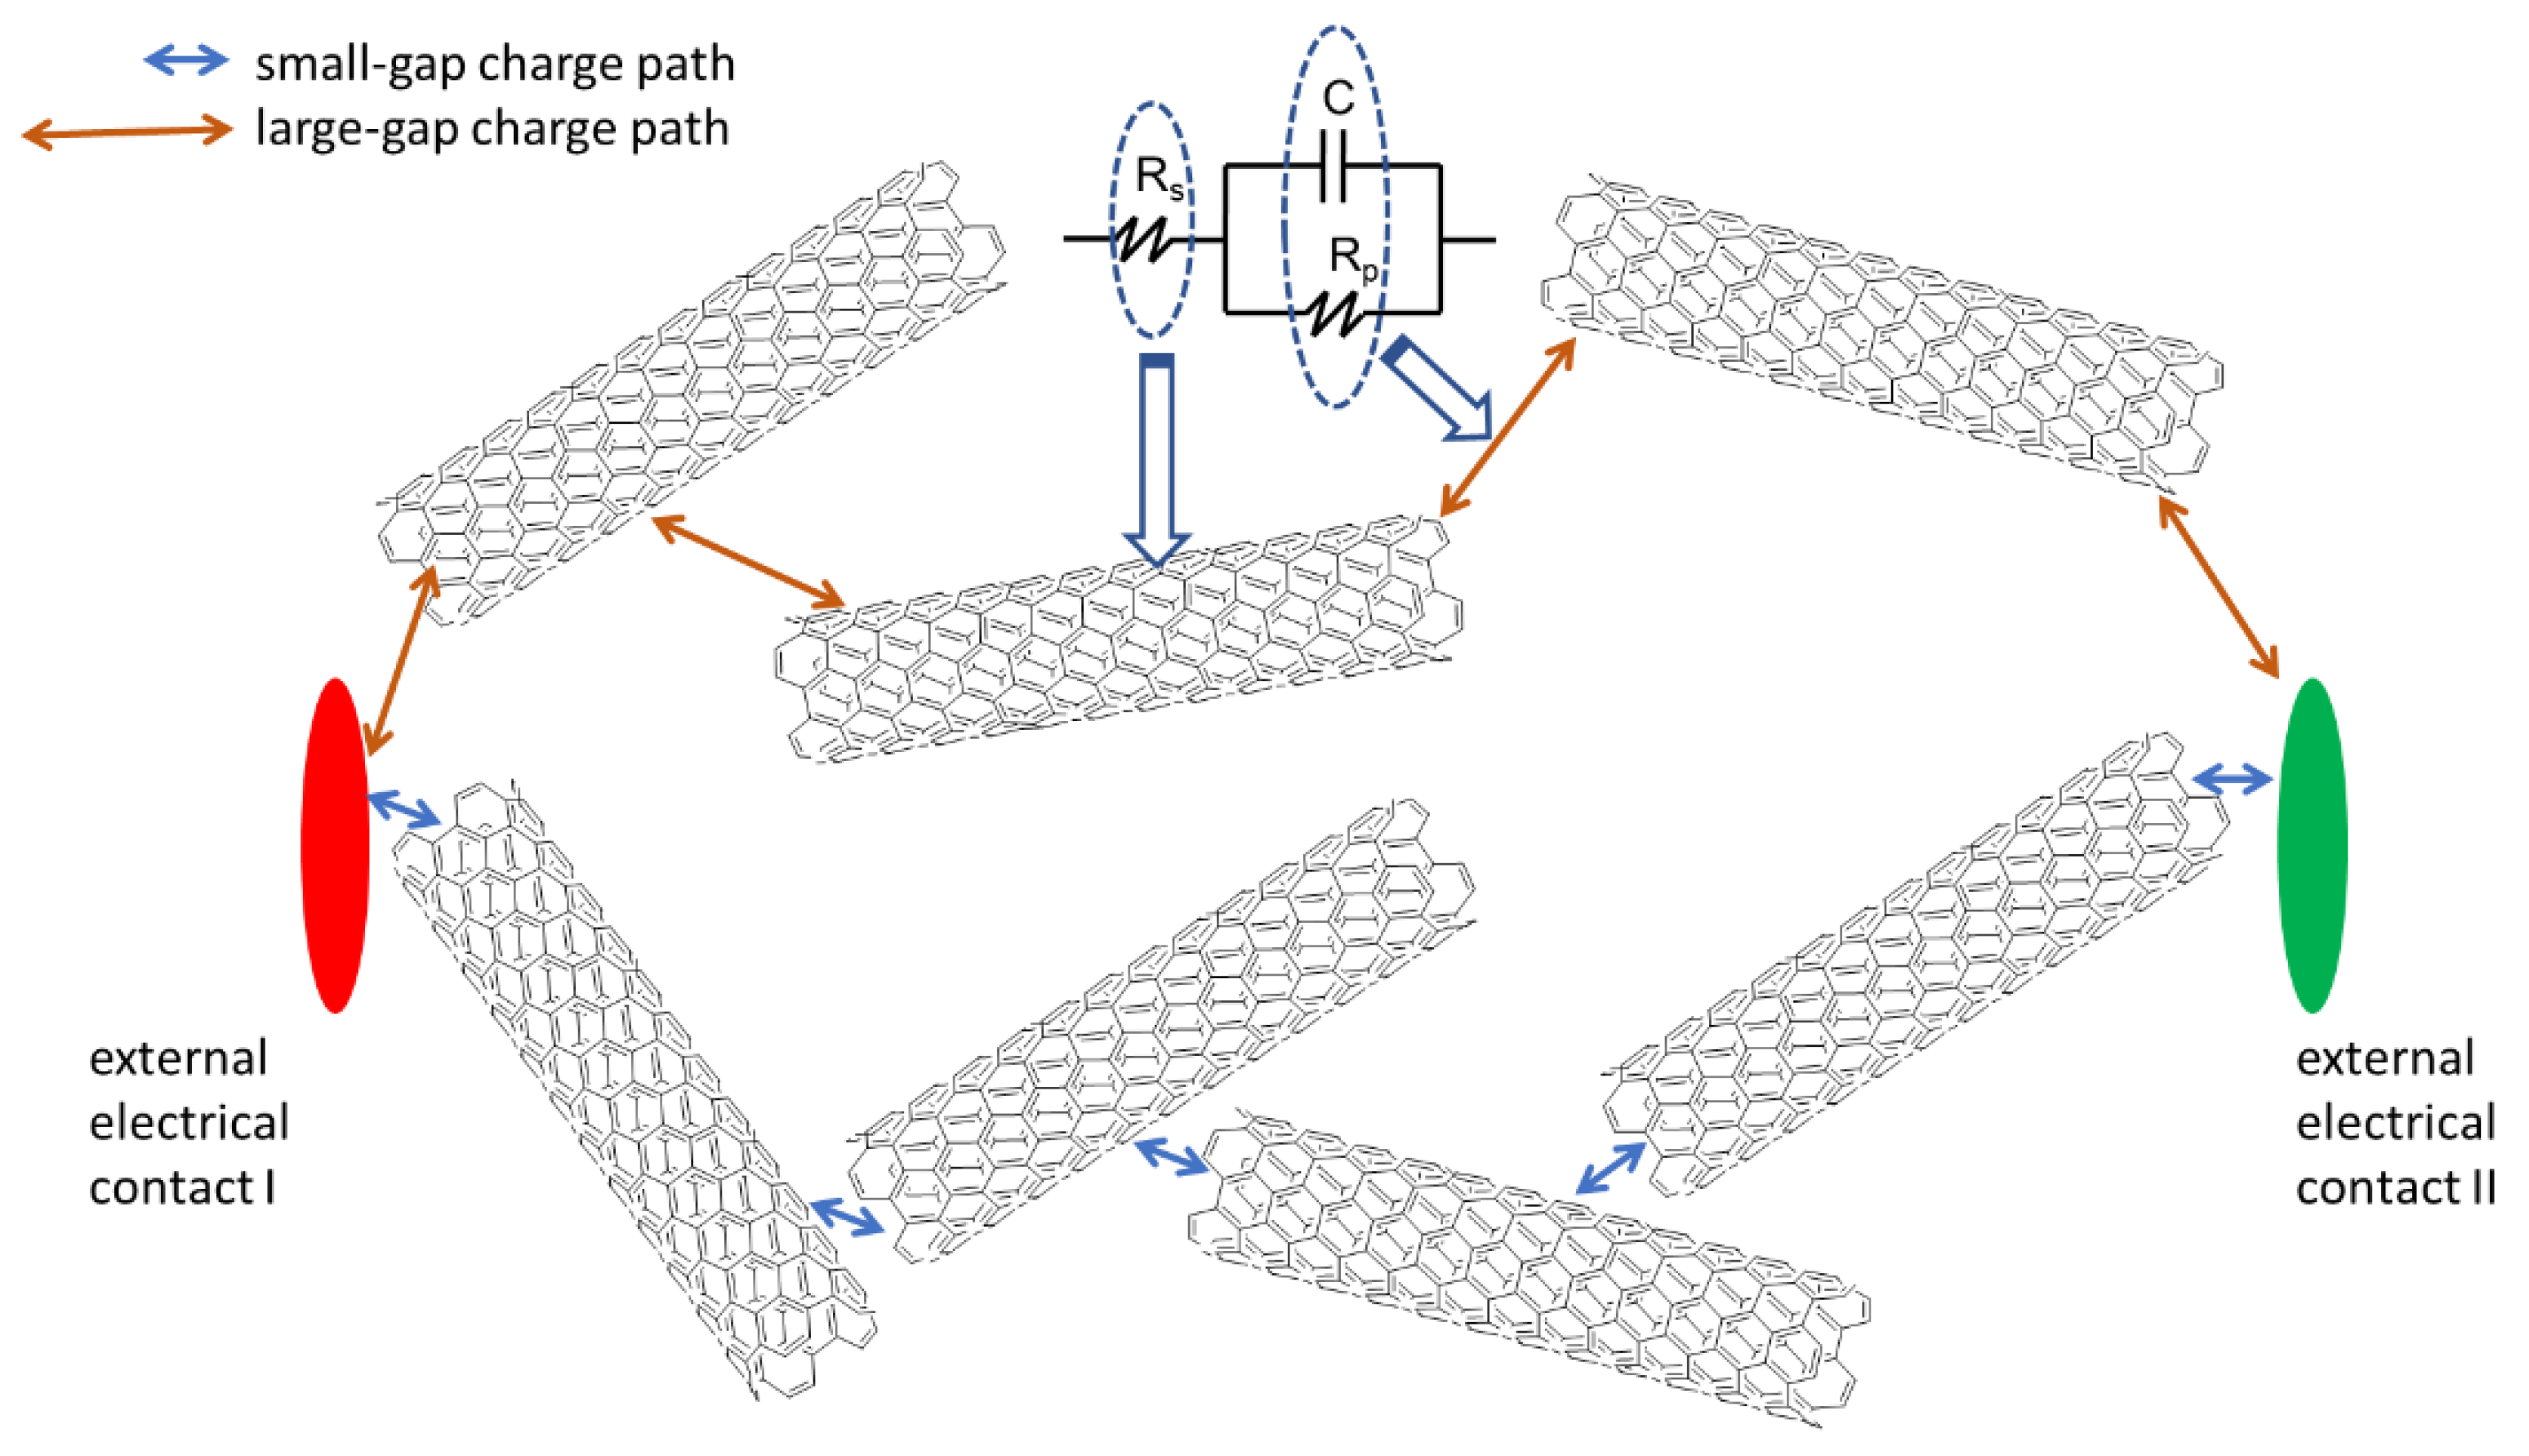
Although the resistance and capacitance of individual physical elements do not depend on frequency, in the case of a complex system, such dependence may be valid and have a physical sense. The branches of an equivalent electrical circuit describe different paths of charge transport. The model resistors (Figure 4) describe the nanotubes. Although carbon is conductive, the nanotubes are very thin and are randomly distributed inside the material which results in total measured impedance of hundreds kOhms. The capacitors in a model describe the electrolyte areas between nanotubes that contain mobile metal ions (Ca2+, Na+, and others). They are enclosed in small pores. That disables them to move along the material but still lets them make a small oscillating movement to redistribute charge density, caused by applied alternating current. Such oscillation of local charge density provides internal capacitive properties of the material.
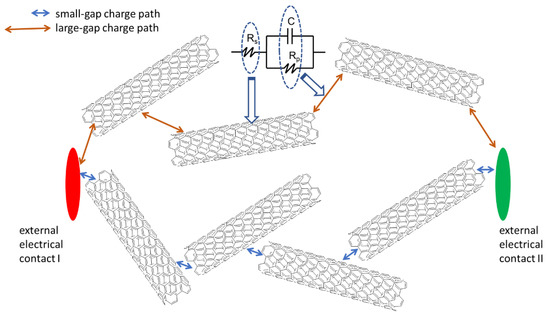
Figure 4.
Illustration of two paths of charge transport that give a different electrical response. The two-side arrows symbolize the oscillation of charge carriers in the medium under external AC voltage exposure.
There are billions of charge paths in the material, yet the averaged equivalent circuit composed of three elements, Rs (series resistance), Rp (parallel resistance), and C (capacitance), stands for the average electrical response.
The nanotubes possess the electronic type of conductivity, while the conductivity of the space between them is provided by ions [36,37]. It is important to note that the whole material is not a conductor, i.e., it is not able to conduct direct electrical current due to the impossibility of charge transfer through the nanotube/geopolymer interface. The only electrical response can be detected at the application of an alternating voltage signal or a pulsed voltage signal, which causes a slight oscillation of ion concentration between the nanotubes.
The frequency of the alternating current signal is related to the time required for an ion to deliver a charge to the next “electrode”, the role of which is played by a carbon nanotube. Thus, the high-frequency signal, which gives a very small time, could proceed only through the small gaps between the conducting elements (Figure 4). A decrease in the signal frequency opens more paths for charge transport. The largest gaps would be enabled only at a considerably low frequency of the probing signal (Figure 4). The values of the physical parameters of the equivalent electrical circuit were calculated for the frequency range from 0.1 Hz to 30 Hz. The higher frequency points were not reliable for precise mathematical analysis due to high experimental data noise (Figure 3).
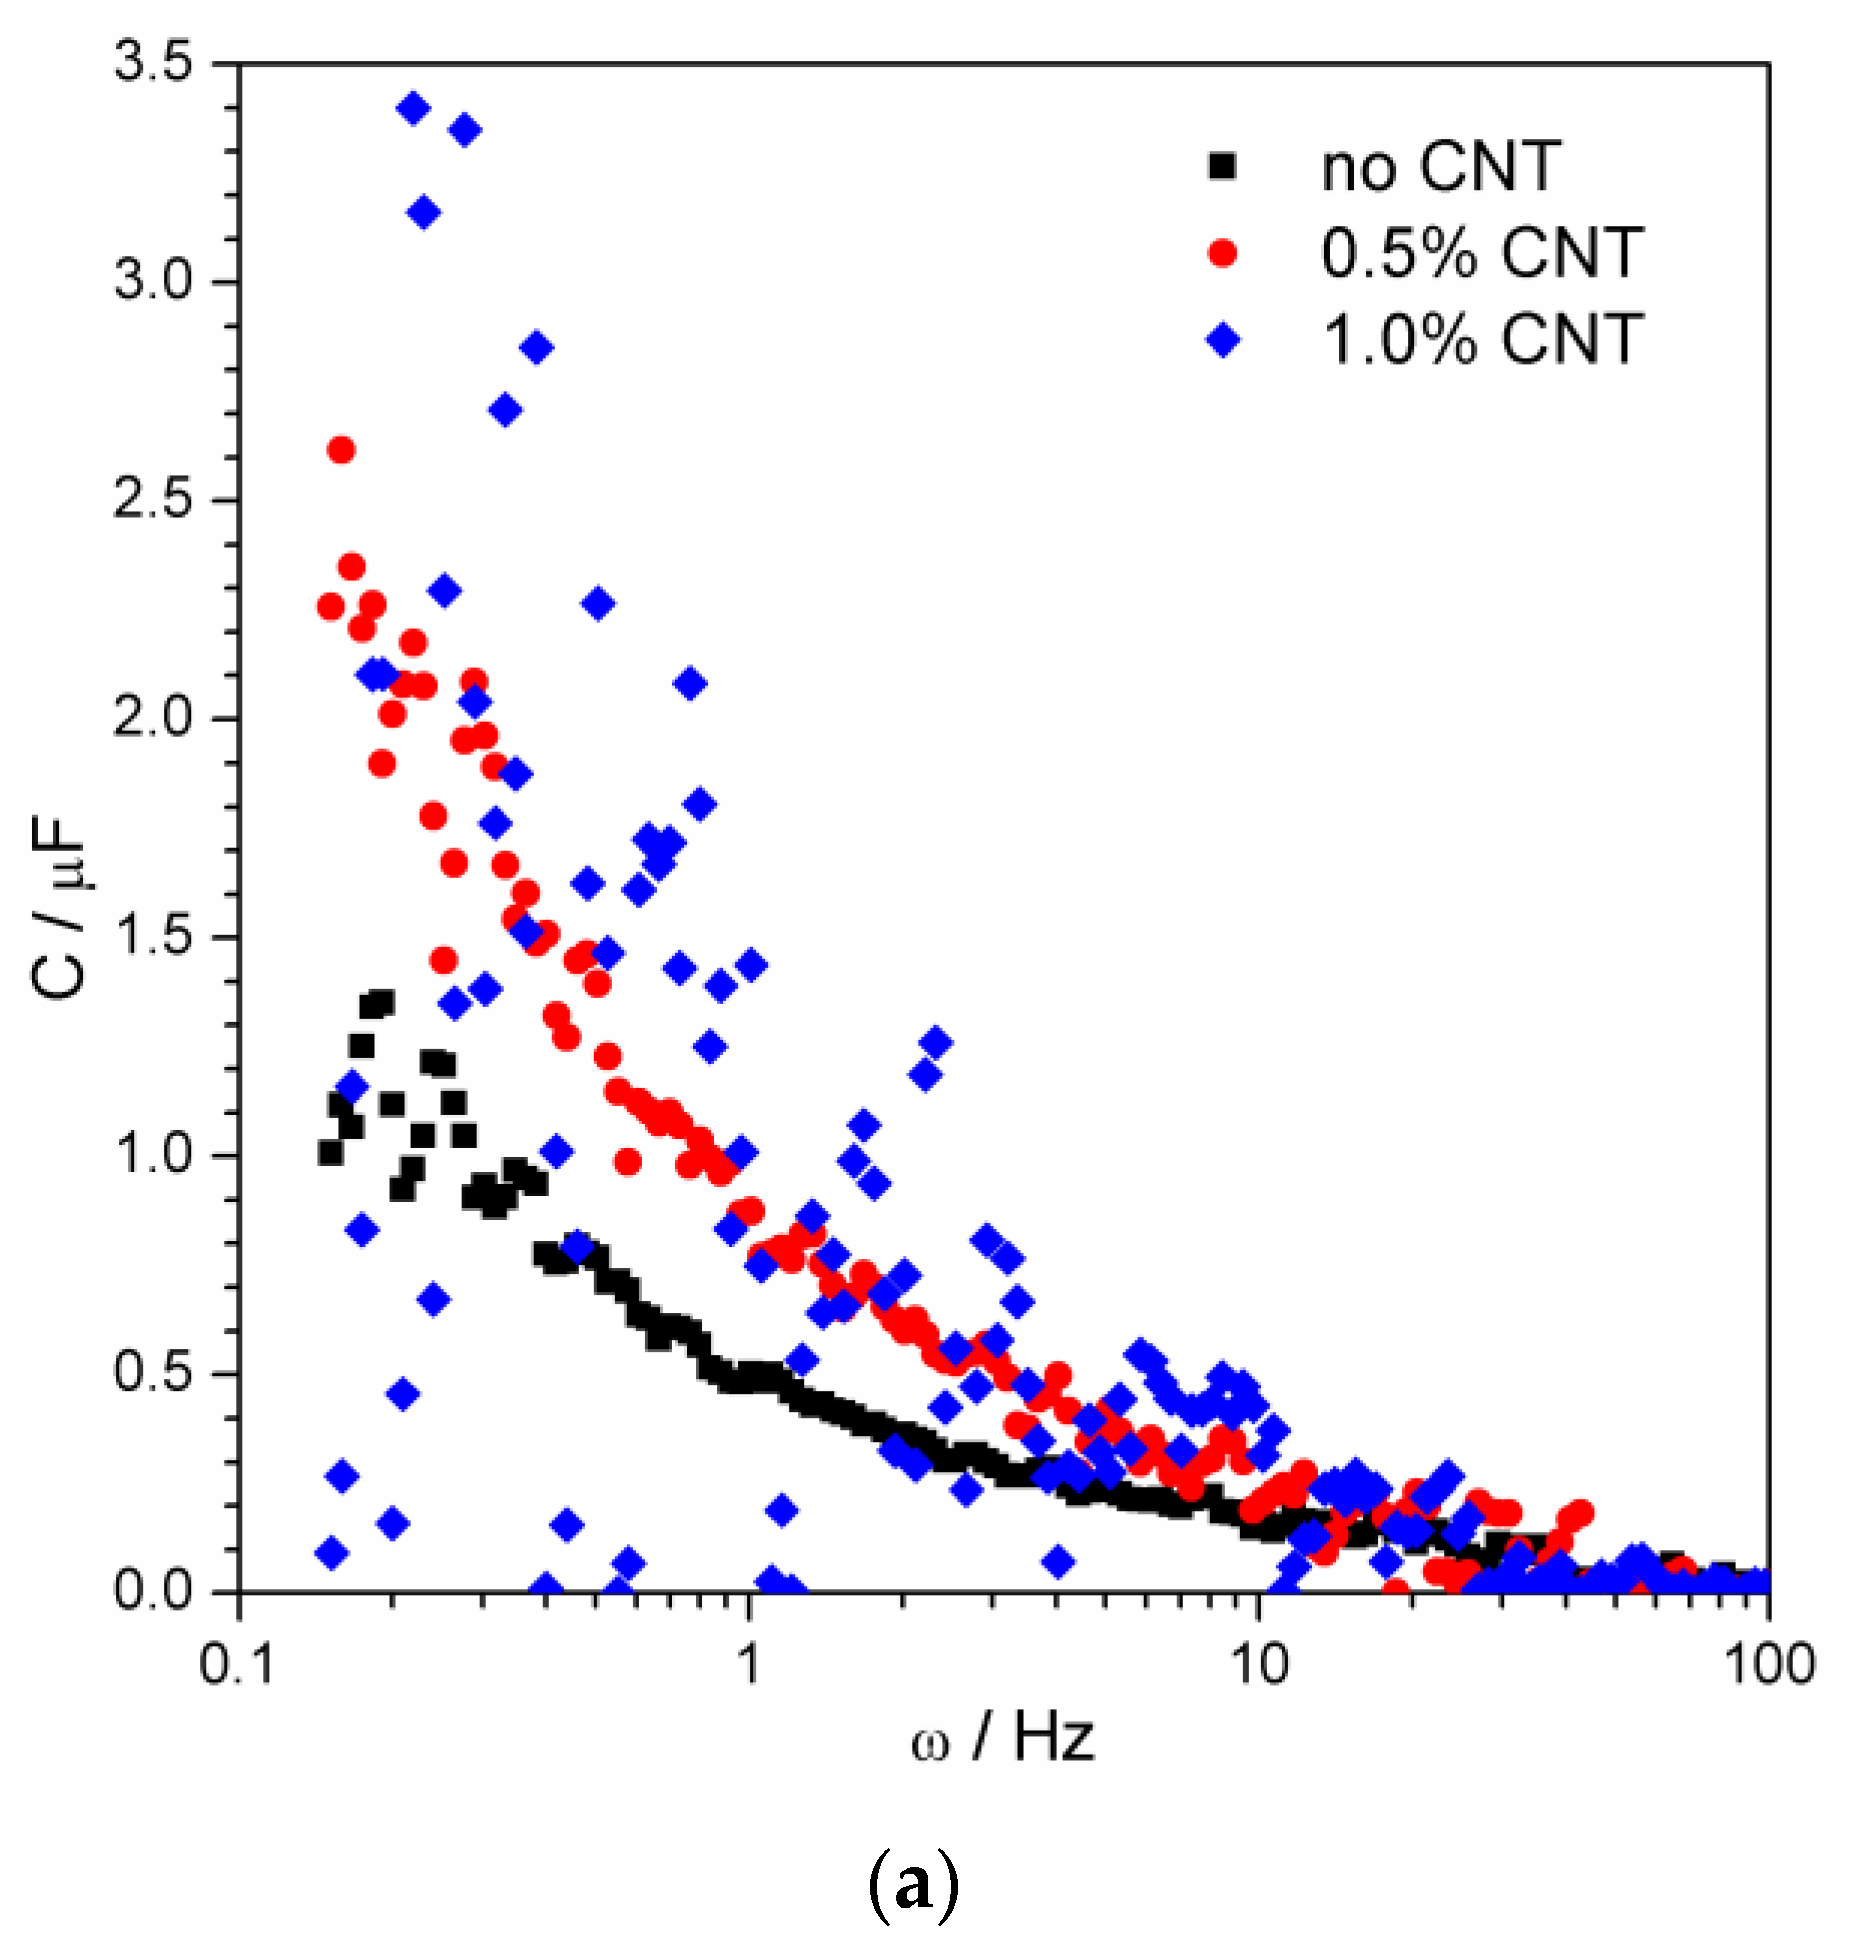
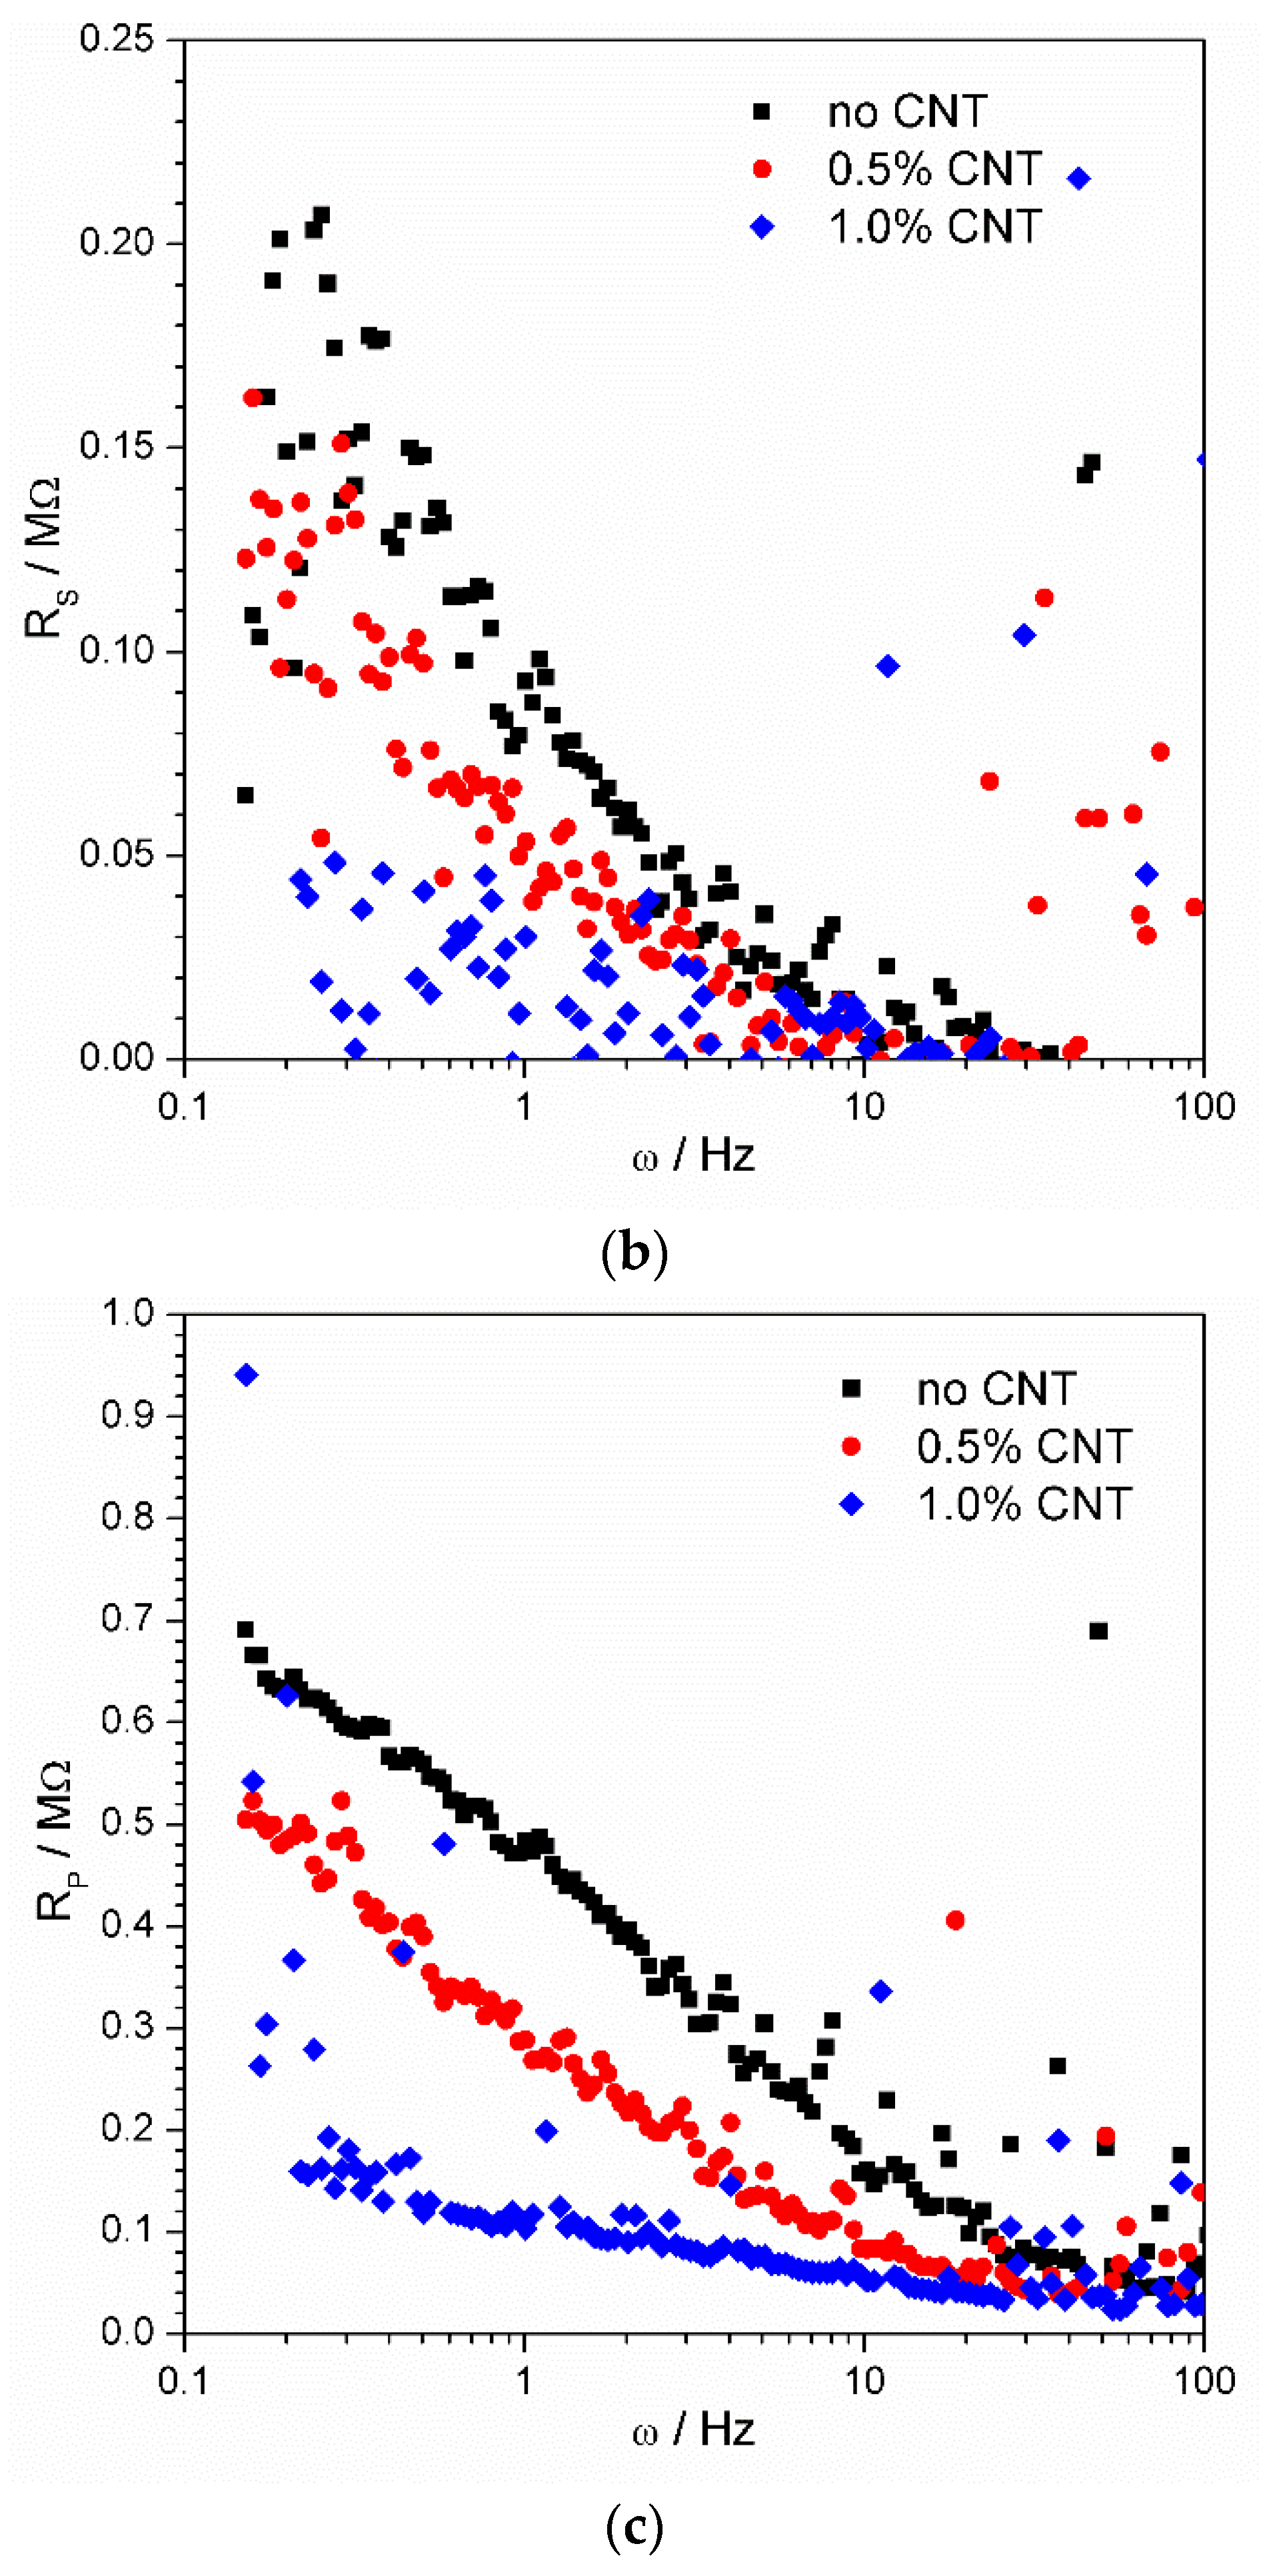
Within the fragmentary analysis method, the fragments of the spectrum are analyzed individually. i.e., first five points (from first to fifth) of the spectrum are taken and the values of Rs, Rp, and C are calculated. Then, the next five-point fragment, from the second through the sixth point, is considered. The results of the analysis of the spectra from Figure 3 are shown in Figure 5.
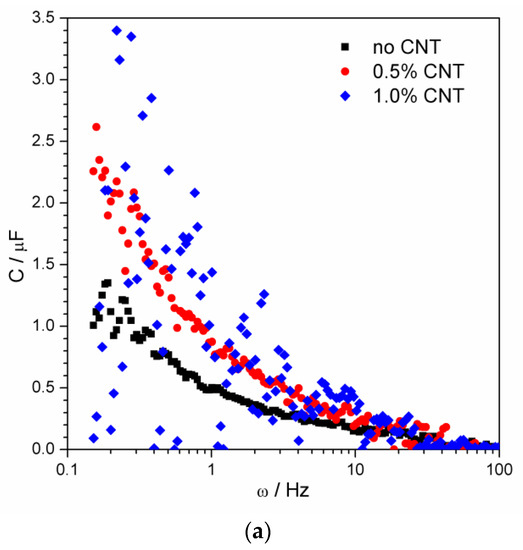
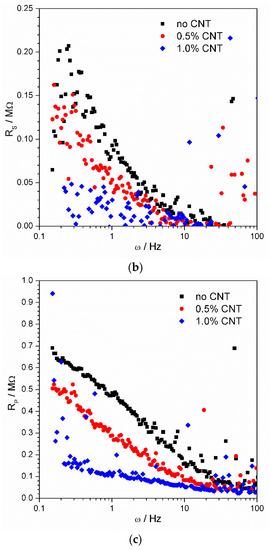
Figure 5.
Calculated values of average capacitance C (a), series resistance RS (b), and parallel resistance RP (c) as a function of probing signal frequency.
The selected number of points, five, was found to be optimal. From the fitting quality point of view, it is about two times more than the number of the calculated parameters (Rs, Rp, and C). On the other hand, it covers a frequency range, narrow enough to refer the data to one frequency in the middle of the fragment.
The CNT-free geopolymer has the lowest capacitance compared to the CNT-containing material (Figure 5a). The scatter of the points does not have any fundamental reason, it is caused by the noise of experimental data (Figure 3). Nevertheless, it still allows observing the common tendency of all the parameters to decrease with the frequency of the applied electrical signal. Both resistances are the smallest in the case of high CNT concentration and the largest for the CNT-free material, as could be expected taking into account the high electronic conductivity of the nanotubes. The gradual decrease of the resistance with frequency is distinctly notable in the case of RP (Figure 5c). The effect has the same reason as the fact that the geopolymer material is only penetrable by the alternating current. The mobile ions are only able to oscillate, but not to overcome long distances in one direction. Therefore, the high-frequency signal stimulates a larger amount of charge carriers to oscillate.
5. Conclusions
The presented research has shown the possibility of creating an innovative, ecological, relatively cheap, functional building material based on potentially hazardous industrial waste. A geopolymer based on metakaolin and CRT glass was reinforced with ultra-long multi-walled carbon nanotubes, which allowed to achieve growth of electrical conductivity over three times with only 1% nanotube mass content. Furthermore, a complex analysis of impedance spectra was accomplished to reveal not only conductive but also the intrinsic electrical capacitive behavior of the studied material. The addition of carbon nanotubes did not visibly affect the mechanical properties of examined material. Both flexural and compressive strength were high enough to consider the geopolymer reinforced with UL-MWCNTs for structural purposes. The presented technique can be regarded as a potential tool for monitoring the building constructions, with a promising application to the carbon nanotube modified geopolymer material.
Author Contributions
Conceptualization, M.G.; methodology, M.G., P.C., N.W. and S.B.; validation, M.G., P.C. and S.B.; formal analysis, P.C. and N.W.; investigation, N.W., P.C., A.W.K., A.K. and R.G.J.; resources, M.G.; data curation, N.W., P.C., A.W.K., A.K. and R.G.J.; writing—original draft preparation, N.W., P.C., S.B., A.W.K., A.K., R.G.J. and M.G.; writing—review and editing, M.G, N.W., P.C. and S.B.; visualization, N.W., P.C., A.W.K., A.K. and R.G.J.; supervision, M.G.; project administration, M.G.; funding acquisition, M.G. All authors have read and agreed to the published version of the manuscript.
Funding
This publication was supported under the Initiative of Excellence—Research University program implemented at the Silesian University of Technology, 2020–2022.
Institutional Review Board Statement
Not applicable.
Informed Consent Statement
Not applicable.
Data Availability Statement
Data available upon request.
Acknowledgments
The authors thank Thornmann Recycling, Toruń, Poland for supplying the waste CRT glass.
Conflicts of Interest
The authors declare no conflict of interest.
References
- Chen, P.-W.; Chung, D.D.L. Carbon Fiber Reinforced Concrete for Smart Structures Capable of Non-Destructive Flaw Detection. Smart Mater. Struct. 1993, 2, 22–30. [Google Scholar] [CrossRef]
- Chen, P.-W.; Chung, D.D.L. Carbon-Fiber-Reinforced Concrete as an Intrinsically Smart Concrete for Damage Assessment during Dynamic Loading. J. Am. Ceram. Soc. 1995, 78, 816–818. [Google Scholar] [CrossRef]
- Chen, P.-W.; Chung, D.D.L. Concrete as a New Strain/Stress Sensor. Compos. Part B Eng. 1996, 27, 11–23. [Google Scholar] [CrossRef]
- Fu, X.; Lu, W.; Chung, D.D.L. Improving the Strain-Sensing Ability of Carbon Fiber-Reinforced Cement by Ozone Treatment of the Fibers 11Communicated by D.M. Roy. Cem. Concr. Res. 1998, 28, 183–187. [Google Scholar] [CrossRef]
- Kim, G.M.; Yang, B.J.; Cho, K.J.; Kim, E.M.; Lee, H.K. Influences of CNT Dispersion and Pore Characteristics on the Electrical Performance of Cementitious Composites. Compos. Struct. 2017, 164, 32–42. [Google Scholar] [CrossRef]
- D’Alessandro, A.; Rallini, M.; Ubertini, F.; Materazzi, A.L.; Kenny, J.M. Investigations on Scalable Fabrication Procedures for Self-Sensing Carbon Nanotube Cement-Matrix Composites for SHM Applications. Cem. Concr. Compos. 2016, 65, 200–213. [Google Scholar] [CrossRef]
- Lim, K.M.; Lee, J.H. Electrical Conductivity and Compressive Strength of Cement Paste with Multiwalled Carbon Nanotubes and Graphene Nanoplatelets. Appl. Sci. 2022, 12, 1160. [Google Scholar] [CrossRef]
- Materazzi, A.L.; Ubertini, F.; D’Alessandro, A. Carbon Nanotube Cement-Based Transducers for Dynamic Sensing of Strain. Cem. Concr. Compos. 2013, 37, 2–11. [Google Scholar] [CrossRef]
- Torabian Isfahani, F.; Li, W.; Redaelli, E. Dispersion of Multi-Walled Carbon Nanotubes and Its Effects on the Properties of Cement Composites. Cem. Concr. Compos. 2016, 74, 154–163. [Google Scholar] [CrossRef]
- Le, J.-L.; Du, H.; Pang, S.D. Use of 2D Graphene Nanoplatelets (GNP) in Cement Composites for Structural Health Evaluation. Compos. Part B Eng. 2014, 67, 555–563. [Google Scholar] [CrossRef]
- Yoo, D.-Y.; You, I.; Lee, S.-J. Electrical Properties of Cement-Based Composites with Carbon Nanotubes, Graphene, and Graphite Nanofibers. Sensors 2017, 17, 1064. [Google Scholar] [CrossRef] [PubMed]
- Ubertini, F.; D’Alessandro, A.; Materazzi, A.L.; Laflamme, S.; Downey, A. Novel Nanocomposite Clay Brick for Strain Sensing in Structural Masonry. In Proceedings of the 2017 IEEE International Conference on Environment and Electrical Engineering and 2017 IEEE Industrial and Commercial Power Systems Europe (EEEIC/I CPS Europe), Milan, Italy, 6 June 2017; pp. 1–4. [Google Scholar]
- Davidovits, J.; Comrie, D.; Paterson, J.; Ritcey, D. Geopolymeric Concretes for Environmental Protection. Concr. Int. 1990, 12, 30–39. [Google Scholar]
- Provis, J.L. Alkali-Activated Materials. Cem. Concr. Res. 2018, 114, 40–48. [Google Scholar] [CrossRef]
- Górski, M.; Wielgus, N.; Loska, K.; Kozioł, M.; Landrat, M.; Ścierski, W.; Pikoń, K. Characteristics of Metakaolin-Based Geopolymer with Cathode Ray Tube Glass. Polymers 2021, 13, 1149. [Google Scholar] [CrossRef]
- Payakaniti, P.; Pinitsoontorn, S.; Thongbai, P.; Amornkitbamrung, V.; Chindaprasirt, P. Electrical Conductivity and Compressive Strength of Carbon Fiber Reinforced Fly Ash Geopolymeric Composites. Constr. Build. Mater. 2017, 135, 164–176. [Google Scholar] [CrossRef]
- Saafi, M.; Piukovics, G.; Ye, J. Hybrid Graphene/Geopolymeric Cement as a Superionic Conductor for Structural Health Monitoring Applications. Smart Mater. Struct. 2016, 25, 105018. [Google Scholar] [CrossRef]
- Bi, S.; Liu, M.; Shen, J.; Hu, X.M.; Zhang, L. Ultrahigh Self-Sensing Performance of Geopolymer Nanocomposites via Unique Interface Engineering. ACS Appl. Mater. Interfaces 2017, 9, 12851–12858. [Google Scholar] [CrossRef]
- Rovnaník, P.; Mizerová, C.; Kusák, I.; Schmid, P. Self-Sensing Properties of Alkali-Activated Slag Composite with Carbon Black during Bending Test. In Binders, Materials and Technologies in Modern Construction V; Trans Tech Publications Ltd.: Kapellweg, Switzerland, 2019; Volume 296, pp. 167–172. [Google Scholar]
- Rovnaník, P.; Kusák, I.; Bayer, P.; Schmid, P.; Fiala, L. Electrical and Self-Sensing Properties of Alkali-Activated Slag Composite with Graphite Filler. Materials 2019, 12, 1616. [Google Scholar] [CrossRef] [Green Version]
- Su, Z.; Hou, W.; Sun, Z. Recent Advances in Carbon Nanotube-Geopolymer Composite. Constr. Build. Mater. 2020, 252, 118940. [Google Scholar] [CrossRef]
- Da Luz, G.; Gleize, P.J.P.; Batiston, E.R.; Pelisser, F. Effect of Pristine and Functionalized Carbon Nanotubes on Microstructural, Rheological, and Mechanical Behaviors of Metakaolin-Based Geopolymer. Cem. Concr. Compos. 2019, 104, 103332. [Google Scholar] [CrossRef]
- Rovnaník, P.; Šimonová, H.; Topolář, L.; Schmid, P.; Keršner, Z. Effect of Carbon Nanotubes on the Mechanical Fracture Properties of Fly Ash Geopolymer. Procedia Eng. 2016, 151, 321–328. [Google Scholar] [CrossRef] [Green Version]
- Azeem, M.; Junaid, M.T.; Saleem, M.A. Correlated Strength Enhancement Mechanisms in Carbon Nanotube Based Geopolymer and OPC Binders. Constr. Build. Mater. 2021, 305, 124748. [Google Scholar] [CrossRef]
- Maho, B.; Sukontasukkul, P.; Sua-Iam, G.; Sappakittipakorn, M.; Intarabut, D.; Suksiripattanapong, C.; Chindaprasirt, P.; Limkatanyu, S. Mechanical Properties and Electrical Resistivity of Multiwall Carbon Nanotubes Incorporated into High Calcium Fly Ash Geopolymer. Case Stud. Constr. Mater. 2021, 15, e00785. [Google Scholar] [CrossRef]
- Abbasi, S.M.; Ahmadi, H.; Khalaj, G.; Ghasemi, B. Microstructure and Mechanical Properties of a Metakaolinite-Based Geopolymer Nanocomposite Reinforced with Carbon Nanotubes. Ceram. Int. 2016, 42, 15171–15176. [Google Scholar] [CrossRef]
- Jittabut, P.; Horpibulsuk, S. Physical and Microstructure Properties of Geopolymer Nanocomposite Reinforced with Carbon Nanotubes. Mater. Today Proc. 2019, 17, 1682–1692. [Google Scholar] [CrossRef]
- Christensen, B.J.; Coverdale, T.; Olson, R.A.; Ford, S.J.; Garboczi, E.J.; Jennings, H.M.; Mason, T.O. Impedance Spectroscopy of Hydrating Cement-Based Materials: Measurement, Interpretation, and Application. J. Am. Ceram. Soc. 1994, 77, 2789–2804. [Google Scholar] [CrossRef]
- Olson, R.A.; Christensen, B.J.; Coverdale, R.T.; Ford, S.J.; Moss, G.M.; Jennings, H.M.; Mason, T.O.; Garboczi, E.J. Interpretation of the Impedance Spectroscopy of Cement Paste via Computer Modelling—Part III Microstructural Analysis of Frozen Cement Paste. J. Mater. Sci. 1995, 30, 5078–5086. [Google Scholar] [CrossRef]
- Seong, K.-P.; Jeon, S.-Y.; Singh, B.; Hwang, J.-H.; Song, S.-J. Comparative Study of an Experimental Portland Cement and ProRoot MTA by Electrochemical Impedance Spectroscopy. Ceram. Int. 2014, 40, 1741–1746. [Google Scholar] [CrossRef]
- Ribeiro, D.V.; Abrantes, J.C.C. Application of Electrochemical Impedance Spectroscopy (EIS) to Monitor the Corrosion of Reinforced Concrete: A New Approach. Constr. Build. Mater. 2016, 111, 98–104. [Google Scholar] [CrossRef]
- EN 196-1; Method of Testing Cement—Part 1: Determination of Strength. European Committee for Standardization: Brussels, Belgium, 2016.
- Vladikova, D. Selectivity Study of the Differential Impedance Analysis—Comparison with the Complex Non-Linear Least-Squares Method. Electrochim. Acta 2002, 47, 2943–2951. [Google Scholar] [CrossRef]
- Vladikova, D.; Stoynov, Z. Secondary Differential Impedance Analysis—A Tool for Recognition of CPE Behavior. J. Electroanal. Chem. 2004, 572, 377–387. [Google Scholar] [CrossRef]
- Vladikova, D.; Stoynov, Z.; Viviani, M. Application of the Differential Impedance Analysis for Investigation of Electroceramics. J. Eur. Ceram. Soc. 2004, 24, 1121–1127. [Google Scholar] [CrossRef]
- Ebbesen, T.W.; Lezec, H.J.; Hiura, H.; Bennett, J.W.; Ghaemi, H.F.; Thio, T. Electrical Conductivity of Individual Carbon Nanotubes. Nature 1996, 382, 54–56. [Google Scholar] [CrossRef]
- Du, F.; Scogna, R.C.; Zhou, W.; Brand, S.; Fischer, J.E.; Winey, K.I. Nanotube Networks in Polymer Nanocomposites: Rheology and Electrical Conductivity. Macromolecules 2004, 37, 9048–9055. [Google Scholar] [CrossRef]
Publisher’s Note: MDPI stays neutral with regard to jurisdictional claims in published maps and institutional affiliations. |
© 2022 by the authors. Licensee MDPI, Basel, Switzerland. This article is an open access article distributed under the terms and conditions of the Creative Commons Attribution (CC BY) license (https://creativecommons.org/licenses/by/4.0/).