3.1. Material Removal Rate, Tool Material Removal Rate, and Tool Wear Ratio
ΜRR, TMRR, and TWR are three performance indexes of major significance which are directly related to the efficiency and economic feasibility of the process. They are strongly affected by the machining parameters (i.e., Ip, Ton, and Vo) and more specifically by the machining power and the per-pulse energy. Nevertheless, the intuitive hypothesis that higher machining power and/or per-pulse energy will automatically lead to a higher MRR is incorrect, mainly because of three underlying mechanisms: the plasma channel growth, the debris concentration in-between the electrode and the workpiece, and the carbon decomposition. More specifically, as the plasma channel expands (e.g., for higher pulse-on times) it consumes a significant amount of energy, while at the same time, the energy density is decreased [
1,
3,
26]. Moreover, the increase of the MRR results in a higher debris concentration in-between the electrode and the workpiece, a concentration that impacts the flushing efficiency. Remaining debris in the gap between the electrode and the workpiece not only consumes energy as it re-melts, but also may destabilize the process and/or cause arcing conditions [
27]. Finally, the carbon from the dielectric is decomposed and bonded on the electrode, forming a “shield layer”, which at the same time acts protectively for the tool electrode, limiting its wear, and is unbeneficial for the MRR [
6]. The brief aforementioned theoretical analysis presupposes and explains any peculiar behavior of the performance indexes.
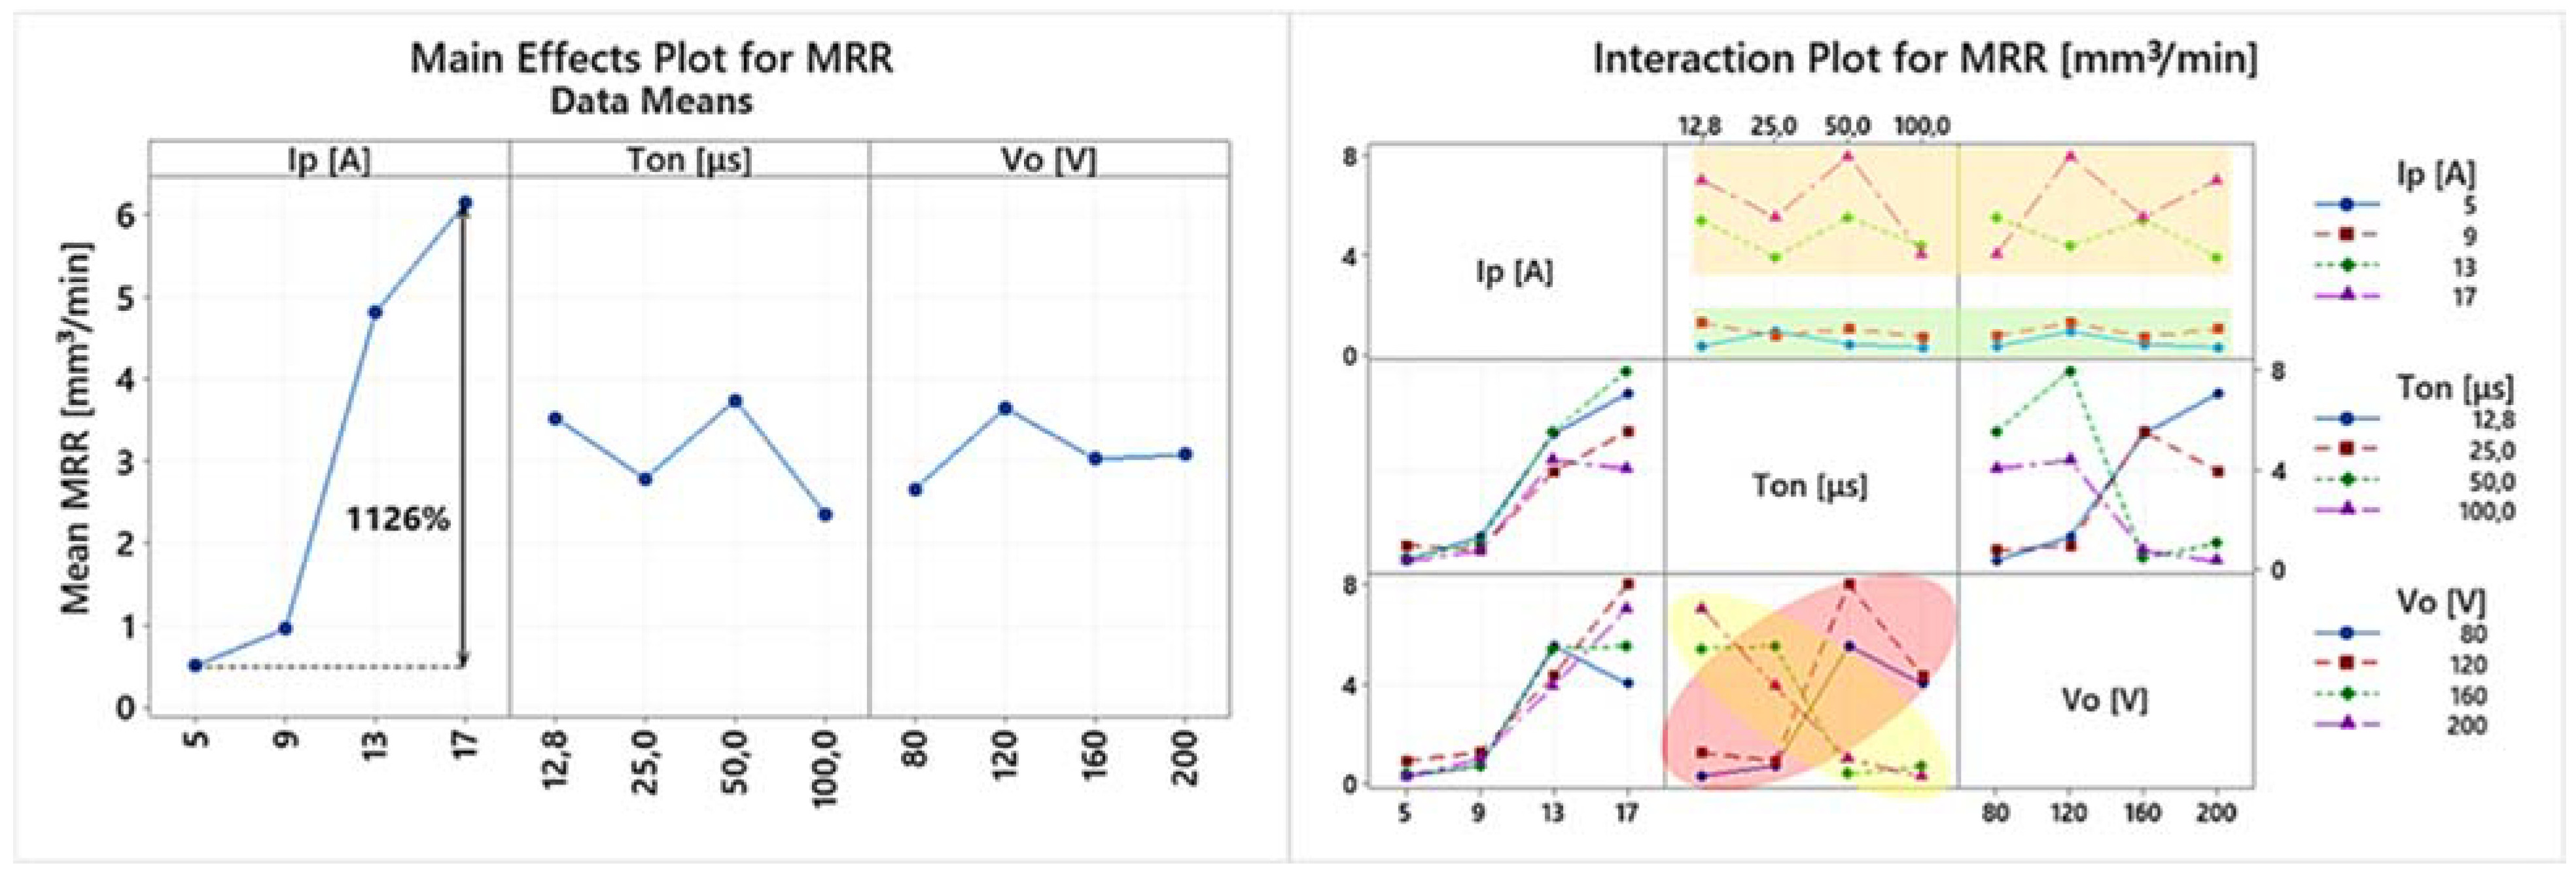
In
Figure 3 the main effects plot and the interaction plot for the MRR are presented. Based on the main effects plot, it can be deduced that the Ip has a clear impact on the MRR, with its increase leading to a higher MRR. Specifically, the mean MRR increased by 1126% as the pulse-on current increased from 5 to 17 A. On the contrary, the Ton and the Vo seem to have a minor and vague effect on the MRR. By perusing the interaction plot, a clearer view of the process can be gained. The Ip has indeed a clear impact on the MRR for almost all the pulse-on currents and open-circuit voltages. They follow the same upward trend up to 13 A, and only for 17 A there is a deviation between different Tons and Vos. At the same time, it is noticed that for low pulse-on currents, i.e., 5 and 9 A (see the green area), there is almost no difference in MRR as the Ton and Vo change, while the high pulse-on currents, i.e., 13 and 17 A (see orange area), are sensitive to changes of the Ton and Vo. This differentiation between low and high values also incurs for the Vo, where the 80 and 120 V have a different behavior in contrast to the 160 and 200 V; see the red and yellow areas, respectively. Hence, it can be reasonably deduced that the combination of the machining parameters is of major importance and not the parameters by themselves, while additionally, the system has a different response regarding low and high machining powers and per-pulse energies.
A direct comparison between different mold steel is difficult and tricky, since each alloy holds some unique properties and behavior. Nevertheless, and in light of some general assessment for machining CALMAX with EDM, a careful and targeted comparison is quoted. The main conditions for a scientifically correct comparison are for the material to have some similarities with the studied material (e.g., content of the main alloying element or the main use), the machining conditions to be similar, and the data to be up to date, avoiding some misleading conclusions based on outdated studies. Keeping that it mind, in the study of Valaki and Rathod [
28] we find that for M238 HH grade, a cold work plastic mold steel, the voltage and pulse-on time indeed have less effect on the MRR compared with the pulse-on time. Moreover, generally, a higher MRR was achieved, a result that can be attributed to the different behavior of the material, as well the utilization of a lower open-circuit voltage. In the aforementioned study, lower open-circuit voltages were used (up to 80 V), and based on the obtained results, and as a rule of thumb, it is deduced that low voltages lead generally to a higher MRR. These conclusions are also supported by the work of Aich and Banejee [
29] regarding the machining of M2 grade with EDM, where higher MRRs were measured although lower open-circuit voltages were used, compared with our study.
In
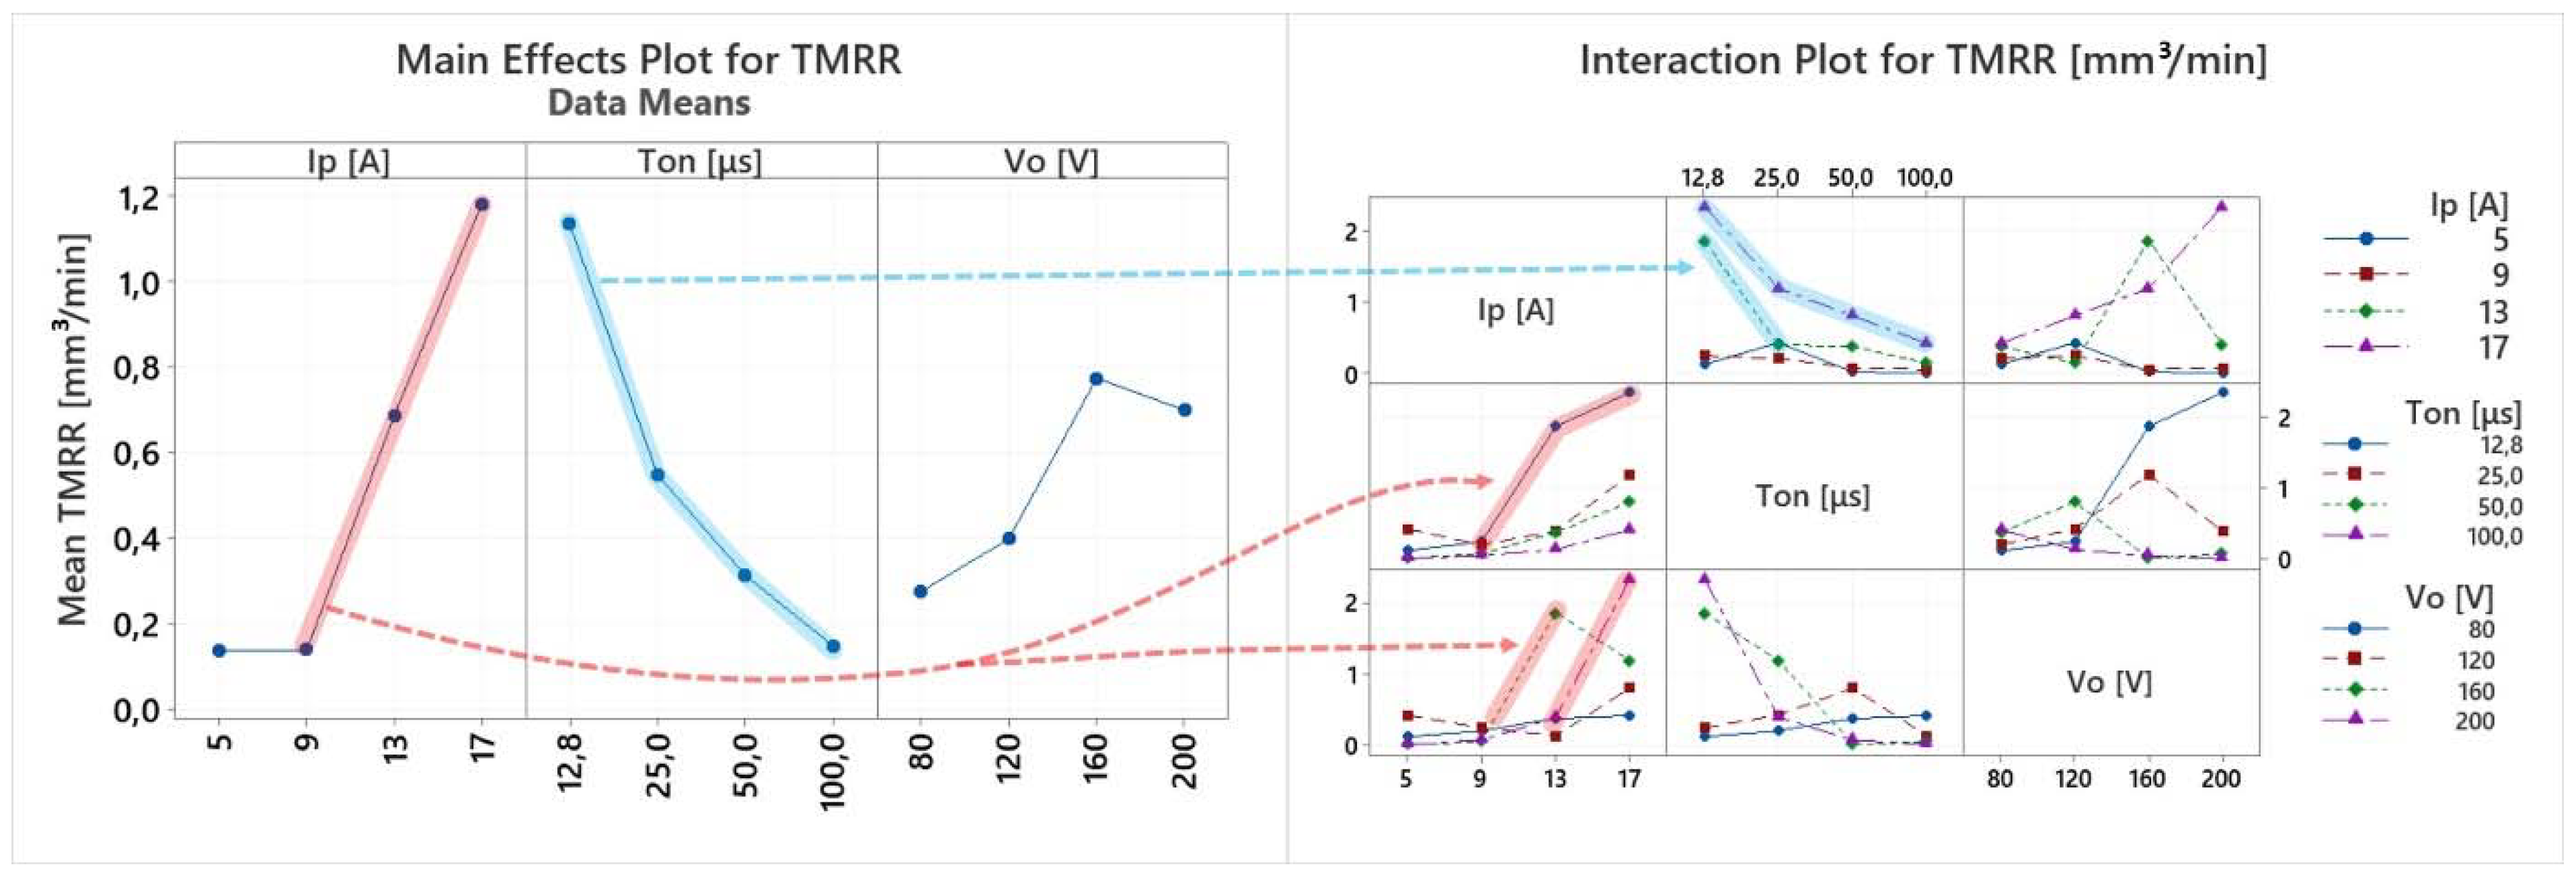
Figure 4 the main effects plot and the interaction plot for the TMRR are presented. For the main effect plot it could be deduced that increase in the pulse-on current results in a higher TMRR, while increase in the Ton leads to a lower TMRR. Nevertheless, this conclusion would be inaccurate, hence, a more in-depth analysis is necessary. More specifically, although the increase of Ip generally results in a slightly higher TMRR, the great increase is mainly attributed only to certain machining conditions, i.e., 12.8 μs pulse-on time and/or 160 and 200 V open-circuit voltage; see the red line. On the contrary, for the rest of the machining conditions, the increase of Ip only minorly impacted the TMRR. Similarly, the decrease of the TMRR for higher pulse-on times is mainly due to the significant decrease for 13 and 17 A—see the blue line—while for 5 and 9 A, the TMRR remained almost constant in respect of the Ton. Considering the aforementioned analysis, any quantitative estimation based on the mean values of the main effects plot for the TMRR was avoided, as it could be misleading, while it is deduced that the TMRR is significantly increased for specific machining combinations, a fact that must always be taken into account during machining planning, since it is related with the process’ efficiency and its economic viability.
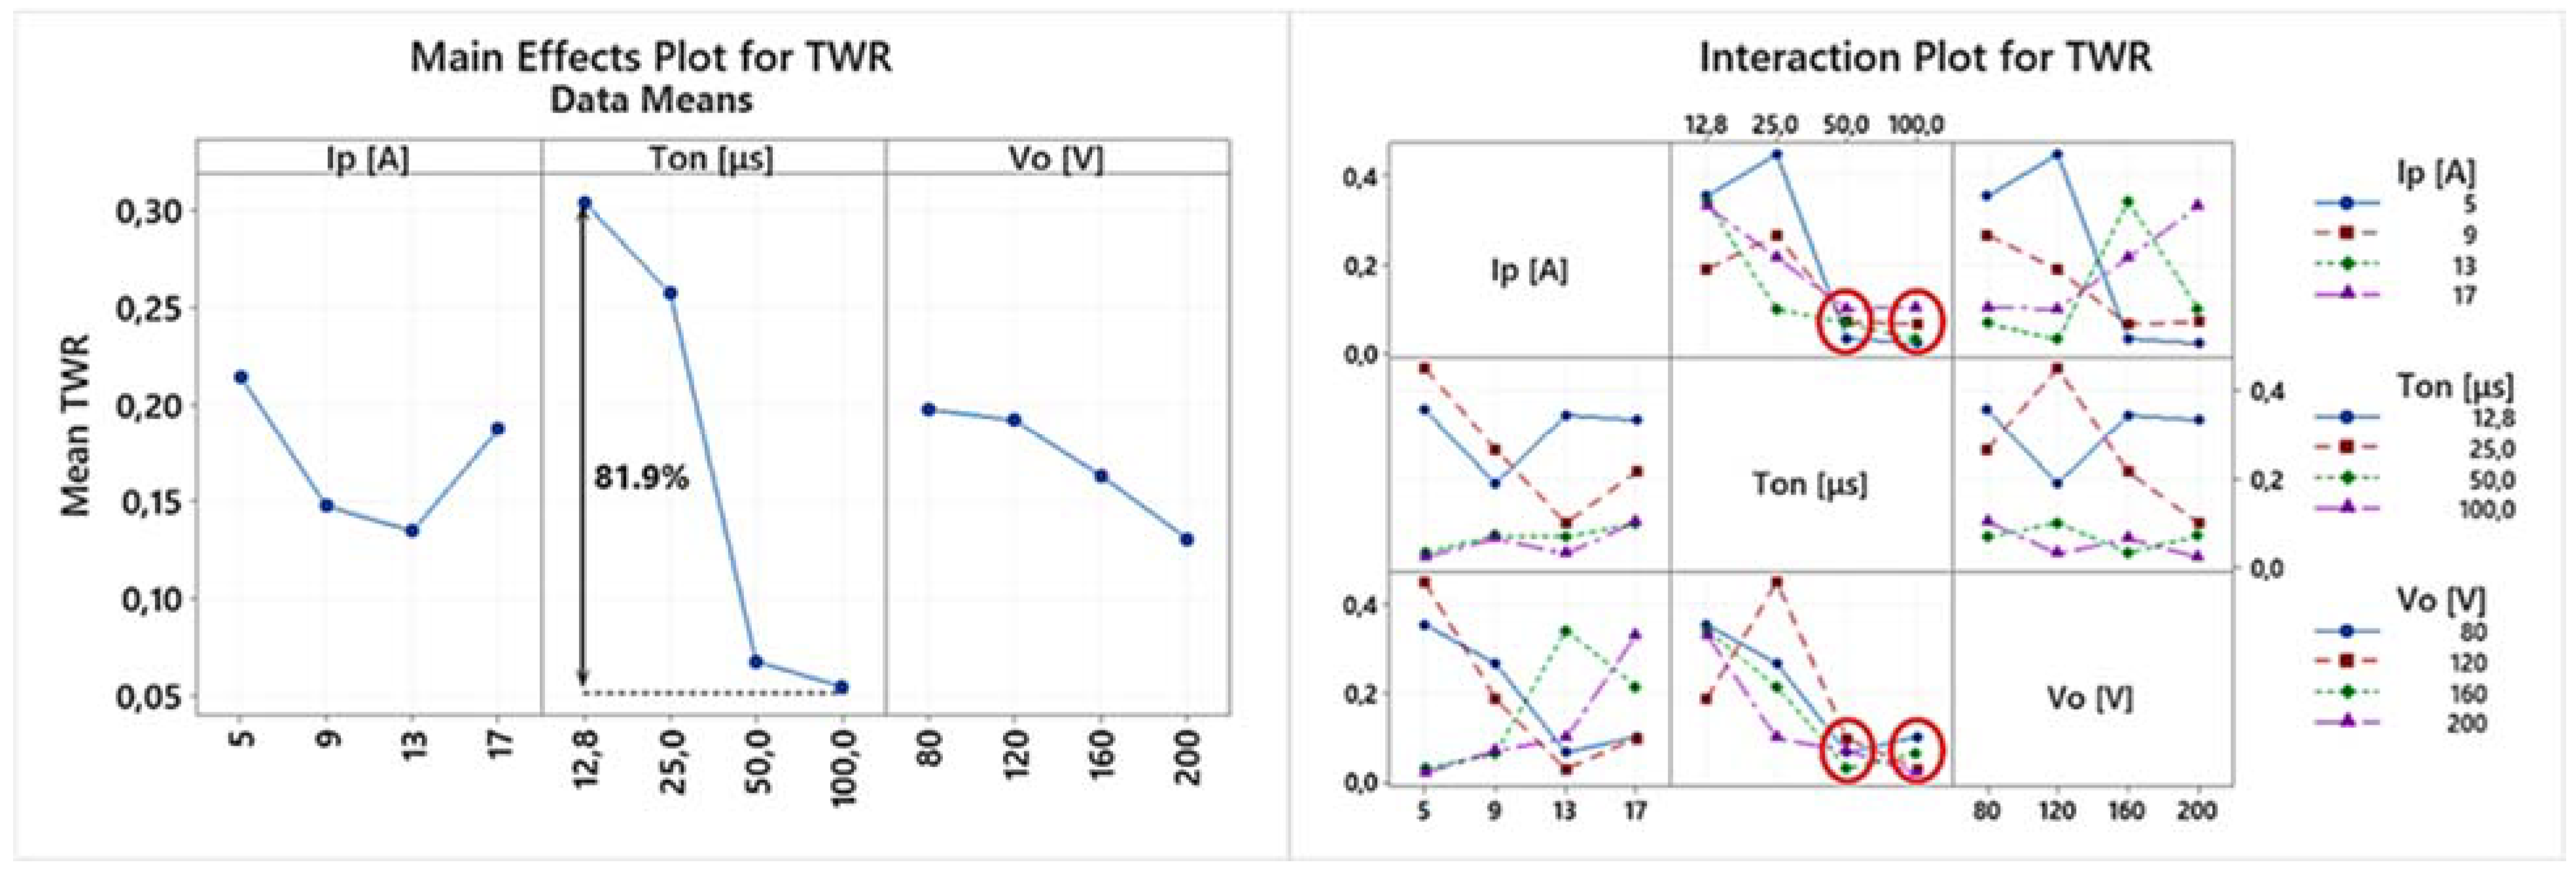
Closing the current sub-section, the main effects plot and the interaction plot for the TWR are presented in
Figure 5. It has to be pointed out that the TWR constitutes the percentage comparison of the electrode and workpiece wear, which emerges as a result of the superposition of the MRR and TMRR; thus, it is expected that the TWR will differ from both of them. Indeed, according to
Figure 6, it can be concluded that the Ip has an ambiguous impact on the TWR, while the Ton seems to affect it in a more predictable way. As the pulse-on time increased from 12.8 to 100 μs, the mean TWR decreased about 81.9%, a fact that is not surprising and is in line with the graphite shielding mechanism that was aforedescribed. At the same time the increase of the Ip results in either an increase or decrease of the TWR depending on the combination of the Ton and Vo. The vague impact of pulse-on current on the TWR is also observed in machining of M238 HH grade with EDM, while the most significant parameter for the TWR is again the pulse-on time [
28].
Finally, two interesting observations have to be made; first, for pulse-on times 50 and 100 μs, almost the same TWR was measured, regardless of the utilized pulse-on current or the open-circuit voltage, and secondly, different machining combinations may result in almost the same MRR but entirely different TWRs, e.g., experiments 9 and 11 that both have an MRR of approximately 5.5 mm3/min but their TWRs are 0.342 and 0.068, respectively. Again, the significance of selecting the optimal process parameters during machining planning is suggested.
3.2. Surface Roughness, Average White Layer Thickness, and Heat Affected Zone
The surface roughness and the surface quality are substantial parameters of the process and machining planning, since the manufactured components have to meet strict quality standards [
30]. Moreover, in cases where a post-process is needed, the surface and subsurface characteristics have to be well known and accurately defined in order for the subsequent treatment to be suitably planned. Hence, the machined surfaces after EDM have to be extensively studied, not only due to academic and scientific interest, but for practical reasons as well.
Conceptually, in EDM, each spark occurring melts or ablates an amount of material, leaving behind a tiny crater. Just as the total material removal is a result of millions of successive sparks, so the SR is the accumulative result of these tiny craters and their superposition. It can be easily deduced that the SR and the SQ are directly related with the machining parameters; nevertheless, the process’ stochastic nature and its chaotic behavior in micro-scale does not allow a strictly deterministic interpretation and approach [
31]. Based on the literature, the craters’ morphological characteristics are impacted by the machining power and the per-pulse energy, namely, the pulse-on current mainly affects the craters’ depth, while the pulse-on time mainly affects their width [
1]. At the same time, only an amount of the molten material is removed by the workpiece surface, while the rest is re-solidified. Moreover, ablated material that has not been efficiently flushed away may cool down rapidly and re-adhere on the surface, forming “debris adheres”. These re-solidified and re-condensed layers of material, well known as white layer, are amorphous and have distinctive properties in comparison to the bulk material. The WL thickness and its morphological characteristics mainly depend on the machining parameters, i.e., Ip, Ton, and Vo, the electrode and workpiece material, and the utilized dielectric fluid. Typical formations of the WL are crater marks, uneven depositions of melted and re-solidified material in the form of islets, scattered debris, inclusions, pockmarks, and cracks. Cracks are developed due to the combined effect of residual and thermal stresses, while the topical high gradients in pressure and temperature favor their initiation and further development [
1,
32].
In
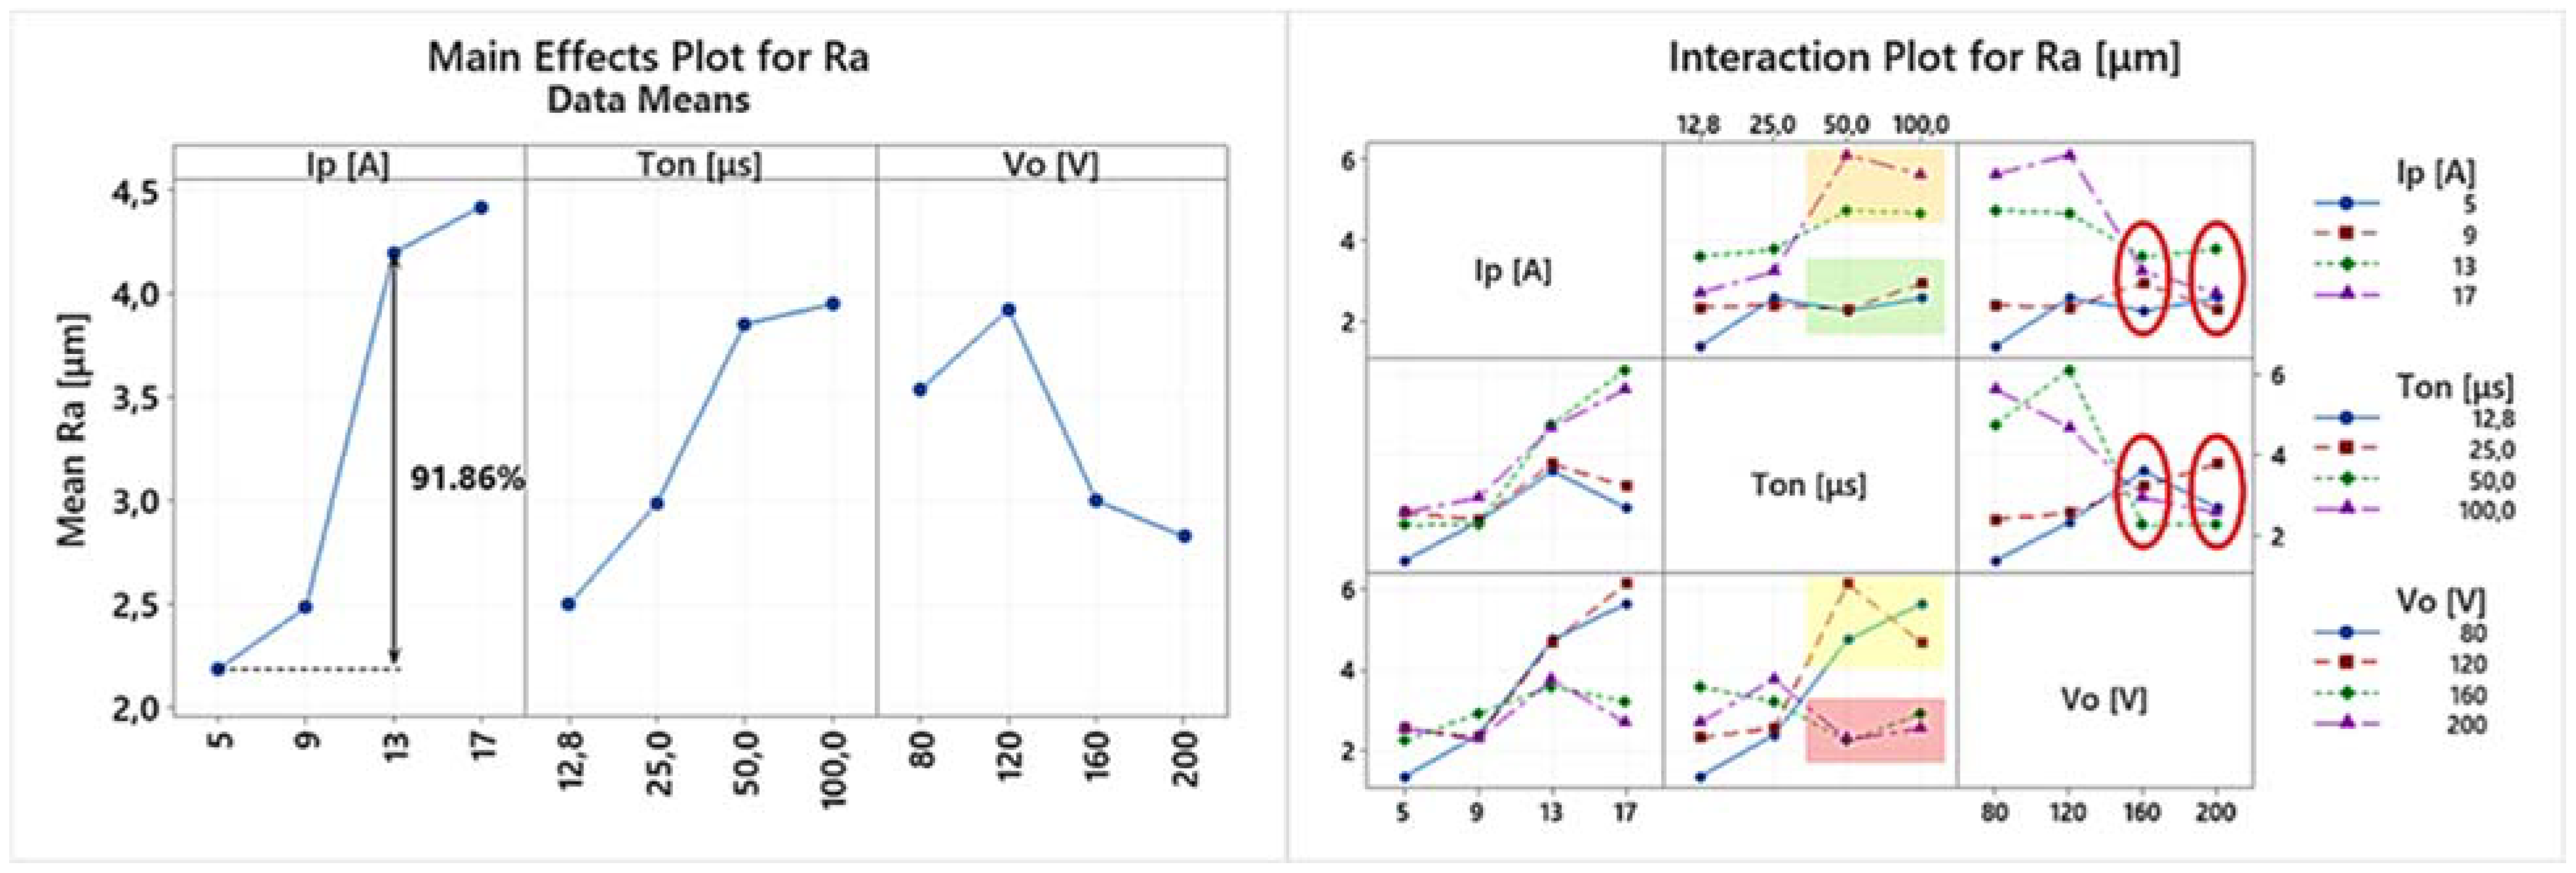
Figure 6, the main effects plot and the interaction plot for Ra are presented. From the main effects plot it can be deduced that higher pulse-on current results in a higher mean Ra. More specifically, the mean Ra increased by 91.86% as the Ip increased from 5 to 13 A. From the apposition of main effects plot and the interaction plot is emerged that, up to 13 A, for all the machining parameters combinations, the Ra values seemed to follow a common trend, while for 17 A, there is a significant deviation between the low and the high values of Ton and Vo. This deviation led to the limitation of the quantitative comparison between 5 and 13 A, instead of 5 and 17 A. This significant differentiation between low and high values can also be observed in the interaction plot of pulse-on time, where the lower values of Ip and V
o (orange and yellow areas, respectively) clearly separate from their corresponding higher values (green and red areas, respectively). Finally, an interesting conclusion that can be deduced from the interaction plot of V
o is that the Ra values for the low open-circuit voltages have a considerable deviation depending on the machining parameters combination, while for the higher Vos (160 and 200 V), the Ra values tend to converge, with Ra becoming less sensitive to the effect of Ip and T
on.
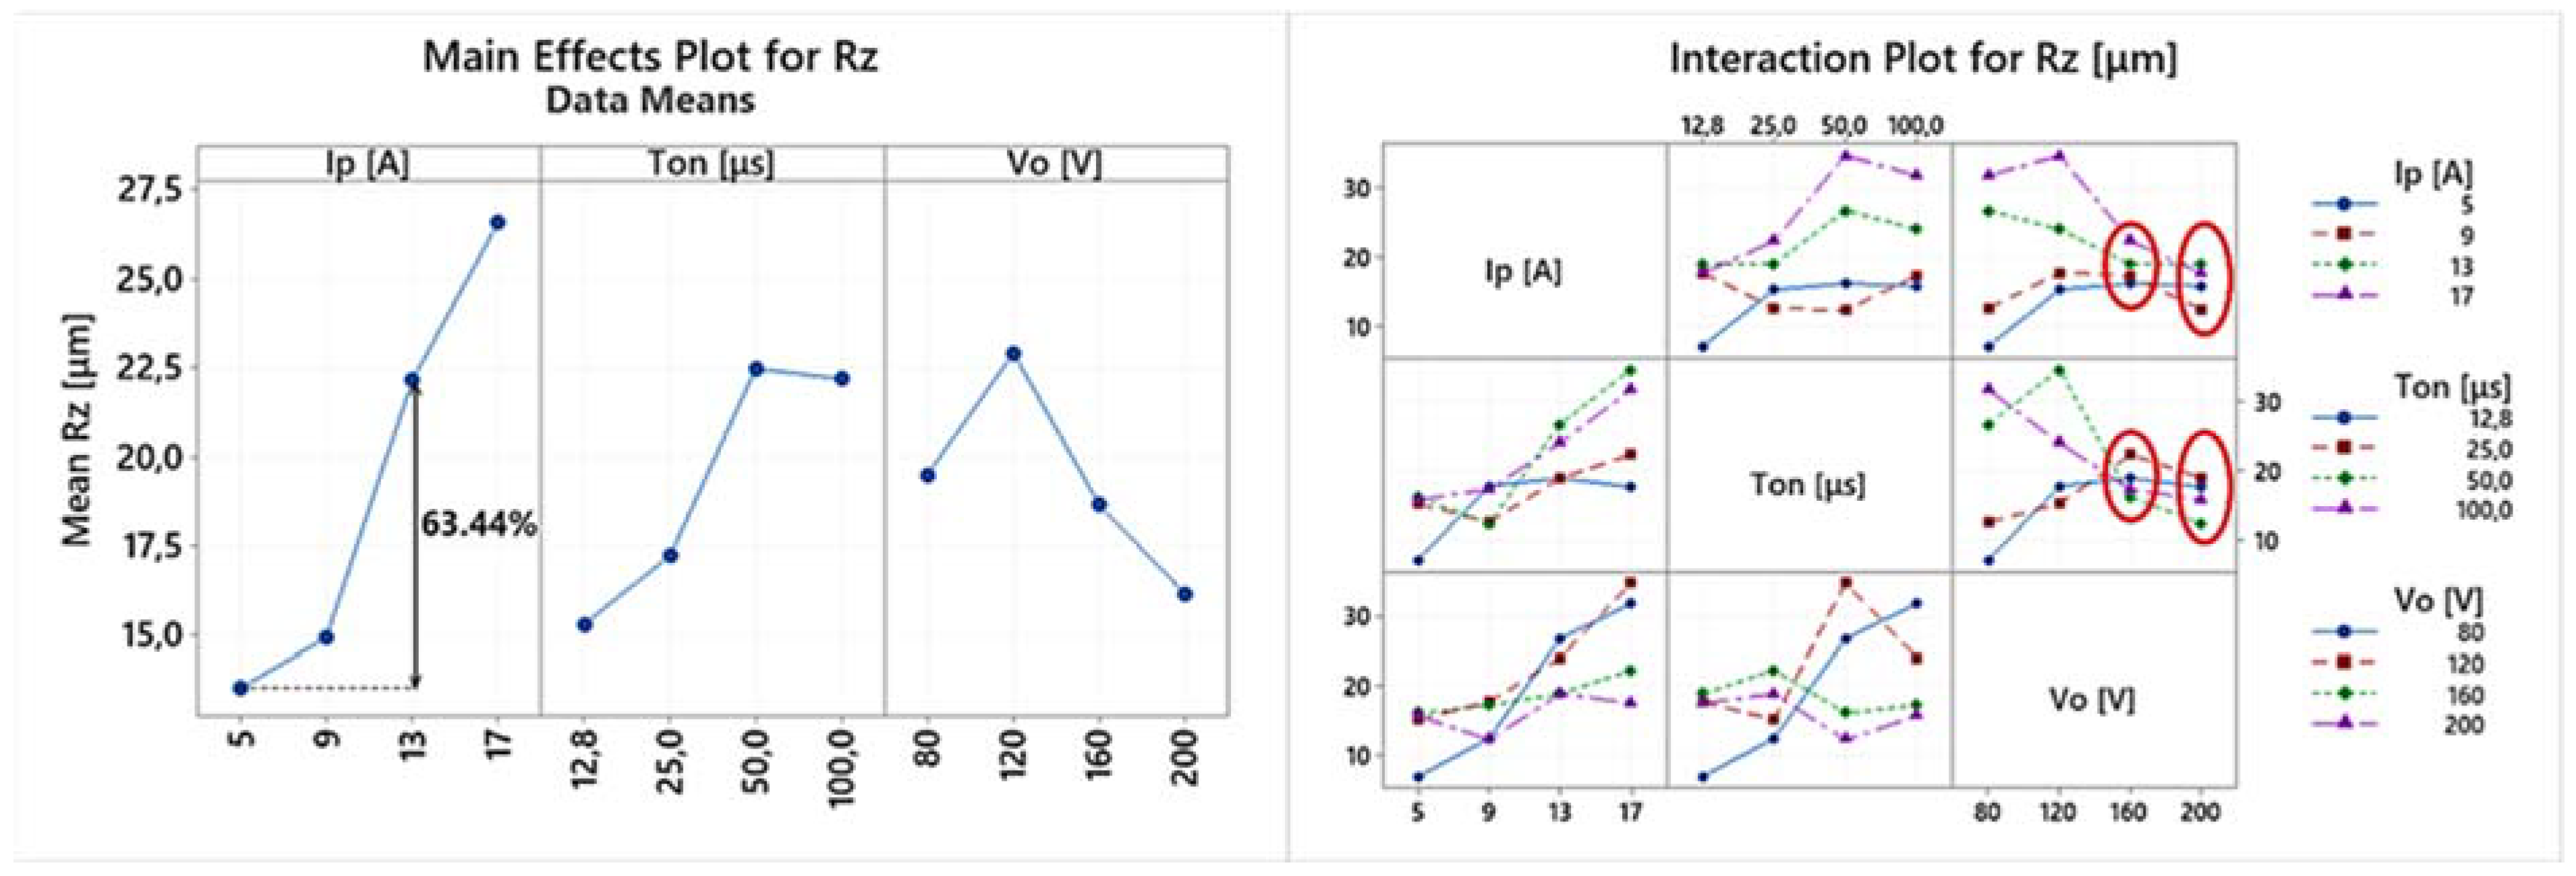
In
Figure 7 the main effects plot and the interaction plot for Rz are presented. It is reasonable that Rz follows similar trends with Ra; nevertheless, Rz, due to its definition, is a more sensitive and mutable index, since a random debris/material deposition may result in its increase. From the main effects plot, it can be concluded that a higher pulse-on current results in a higher mean Rz, namely, there is a 63.44% increase of the mean Rz between 5 and 13 A. Again, for 17 A, a significant deviation in Rz values is observed; thus, 17 A is not included into the previous comparison since the mean Rz value for 17 A cannot be considered as representative. Considerable deviation in Rz values depending on the machining parameters combination is also present for the high values of the pulse-on time, as well as for the lower values of the open-circuit voltage. Like in Ra, only for the high open-circuit voltages, i.e., 160 and 200 V, the Rz is stabilized, converged, and becomes less sensitive to the change of Ip and Ton. As an overall and brief conclusion regarding the Ra and Rz, it can be said that the SR is strongly affected by the combinations of the machining parameters, rendered, by case, more or less sensitive in their change. Hence, during the machining planning, the SR always has to be considered as an important criterion, by aiming not only for the higher MRR and/or lower TWR, but at the same time, for the desired SQ and SR specifications [
30].
Concerning the surface skewness (Rsk), some interesting results emerged. A negative value of Rsk means a surface that is mainly made up of valleys, whereas a surface with a positive skewness mainly contains peaks and asperities. The Rsk values range between −0.52 and 1.07, i.e., mostly close to zero, indicating that the height distribution of the machined surface is, more or less, symmetrical around the mean plane. This is actually an interesting conclusion, since it can be attributed to the craters’ formation mechanism (it will be discussed later in the study) where a crater is formed by the material removal; nevertheless, material is also ejected forming its rims. Hence, the surface not only consists of successive overlapped cavities, but of bulky flanks and ridges as well, which results in this skewness. At the same time, the kurtosis index (Rku), which describes the sharpness of the profile, takes values around 3 (2.59 < Rku < 4.78), suggesting that the machined surfaces are not compulsorily platykurtic (Rku < 3) or leptokurtic (Rku > 3). Thus, as an overall conclusion can be deduced that the sharpness and the skewness depend on the machining parameters combination and the balance between the material removal (i.e., crater formation) and the material’s insufficient flushing with the simultaneous formation of bulky areas and rims [
33].
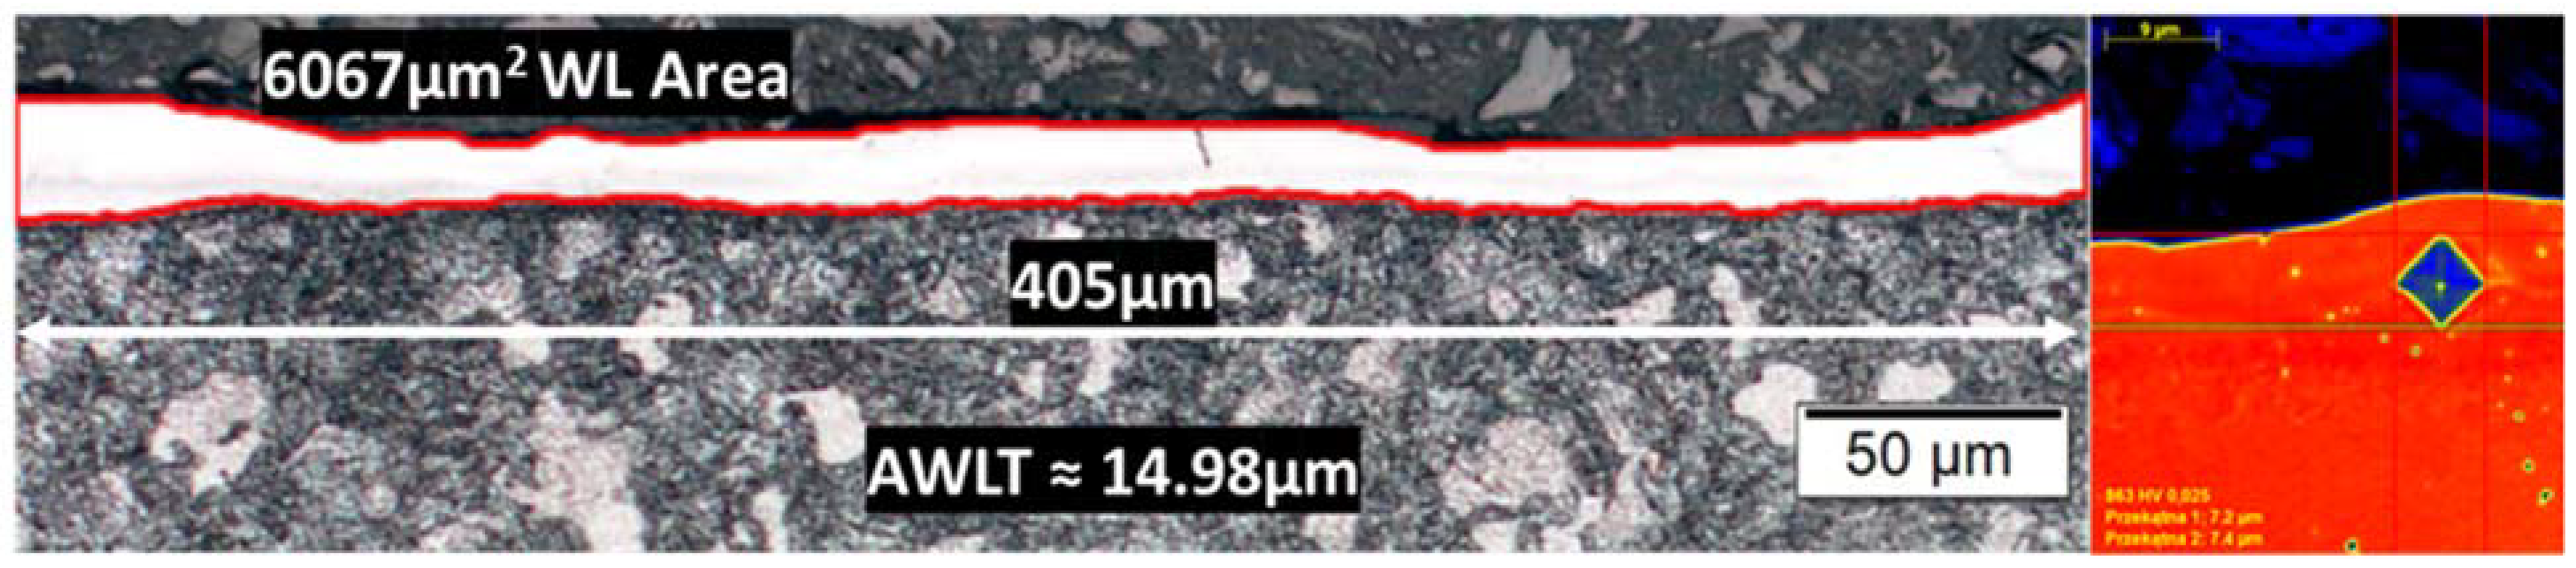
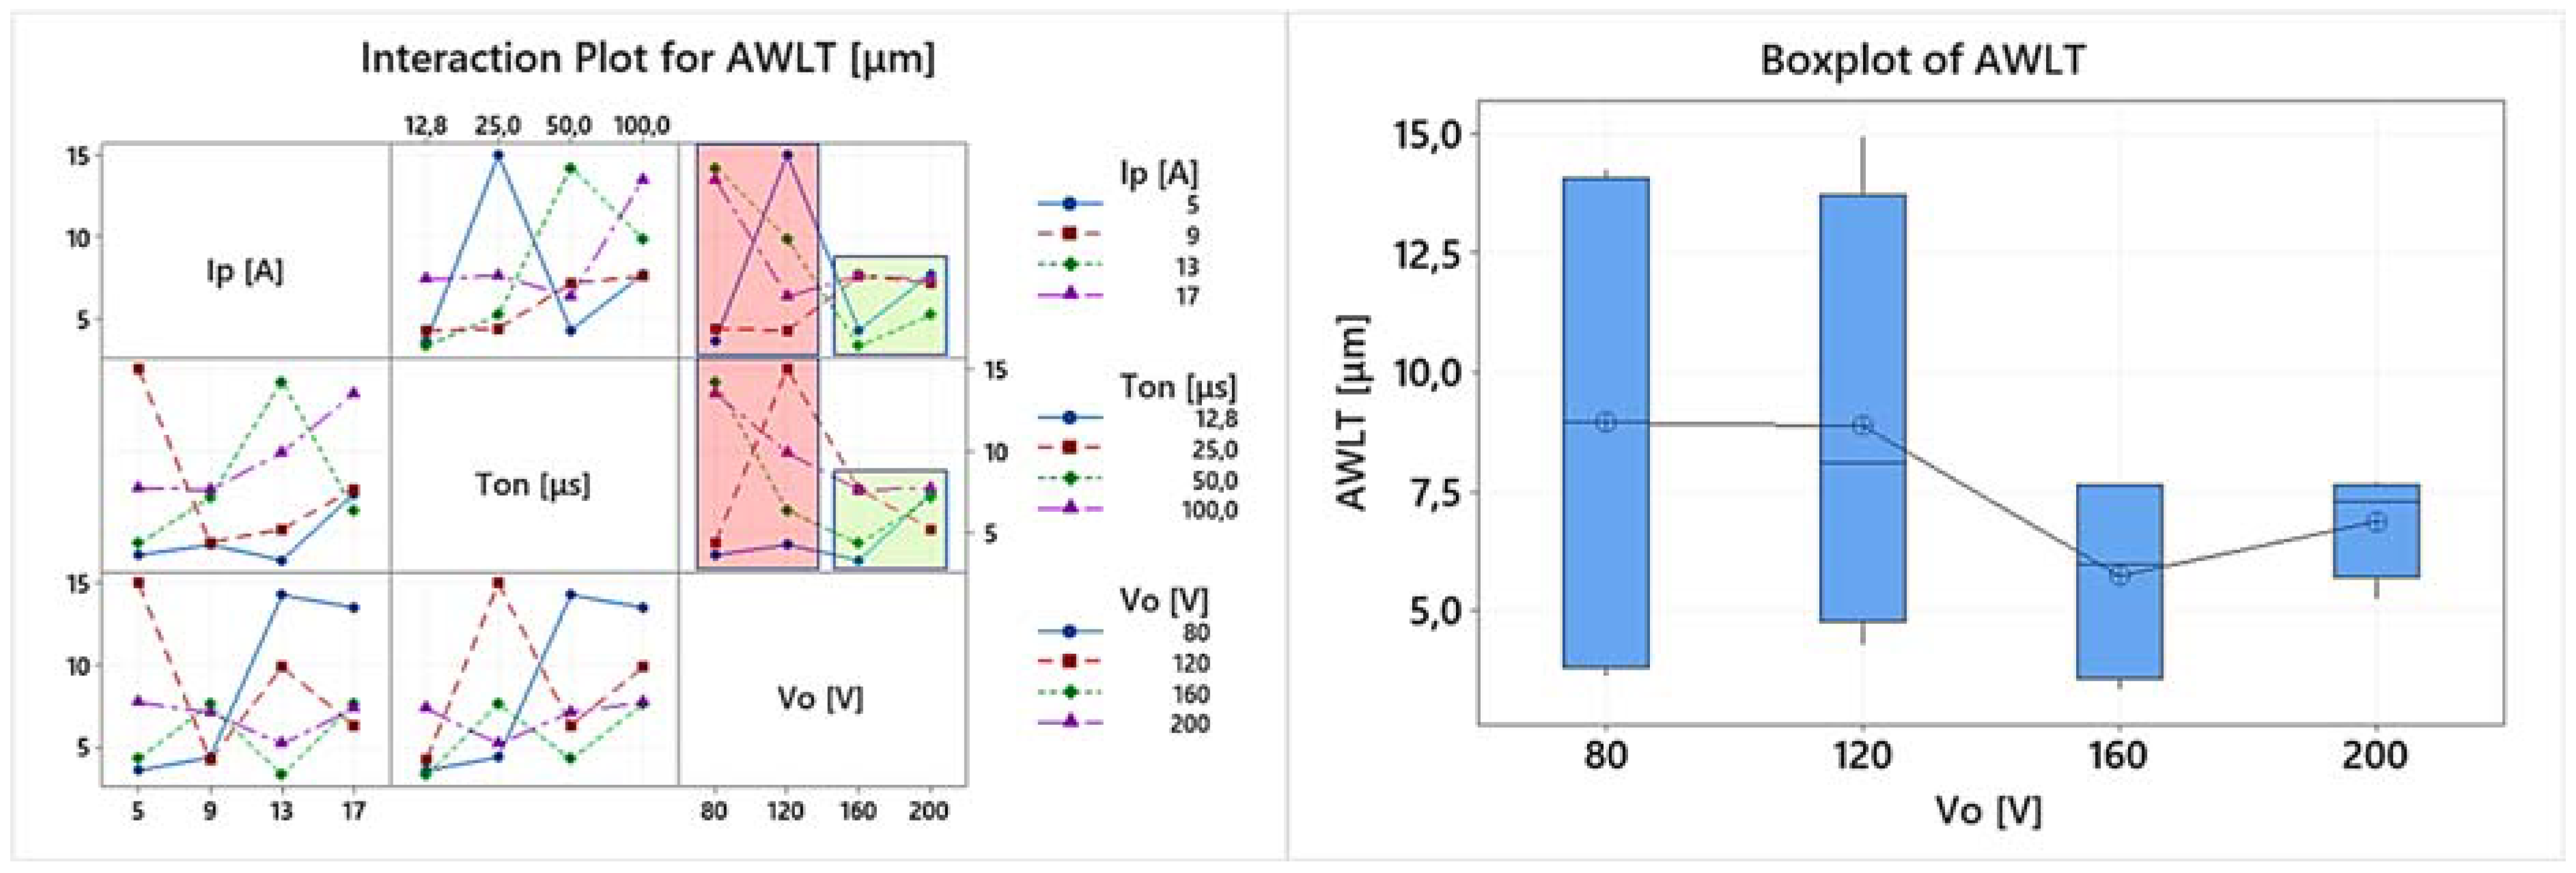
The WL strongly affects the machined SR, while it concurrently impacts the machined surface properties. Hence, the measuring and definition of the AWLT is of extreme interest and importance, as well the determination of the WL’s morphological characteristics. The interaction plot and the boxplot diagram for the AWLT are presented in
Figure 7. The correlation between the AWLT and the Ra and Rz is obvious, since it is easily found that the AWLT takes its lower values for the higher open-circuit voltages, i.e., 160 and 200 V. Moreover, based on the interaction plot and the boxplot diagrams, two different machining areas can be distinguished, one with high deviation of the AWLT depending on the combination of the machining parameters (red area—low open-circuit voltages) and one with low deviation of the AWLT values, where the combination of the machining parameters have minor impact on the AWLT (green area—high open-circuit voltages). Summarizing, for the higher Vos, a lower and less different AWLT were measured, a fact that can be explained by interpreting the physical meaning and effect of the open-circuit voltage. A higher Vo allows for a wider gap between the electrode and the workpiece, since the dielectric fluid electrical constant will break at a greater distance between the working electrode and the workpiece. Thus, a more efficient flushing is taking place, resulting in a higher portion of the molten material being removed from the workpiece surface, leaving behind less material volume to form a thinner WL. Hence, in cases where surfaces free of WL are needed, higher open-circuit voltages should be used, or for lower open-circuit voltages, a mindful selection of the machining parameters combination has to be made, using, for example, a low pulse-on time by bearing in mind that for Ton 12.8 μs a low AWLT has been measured.
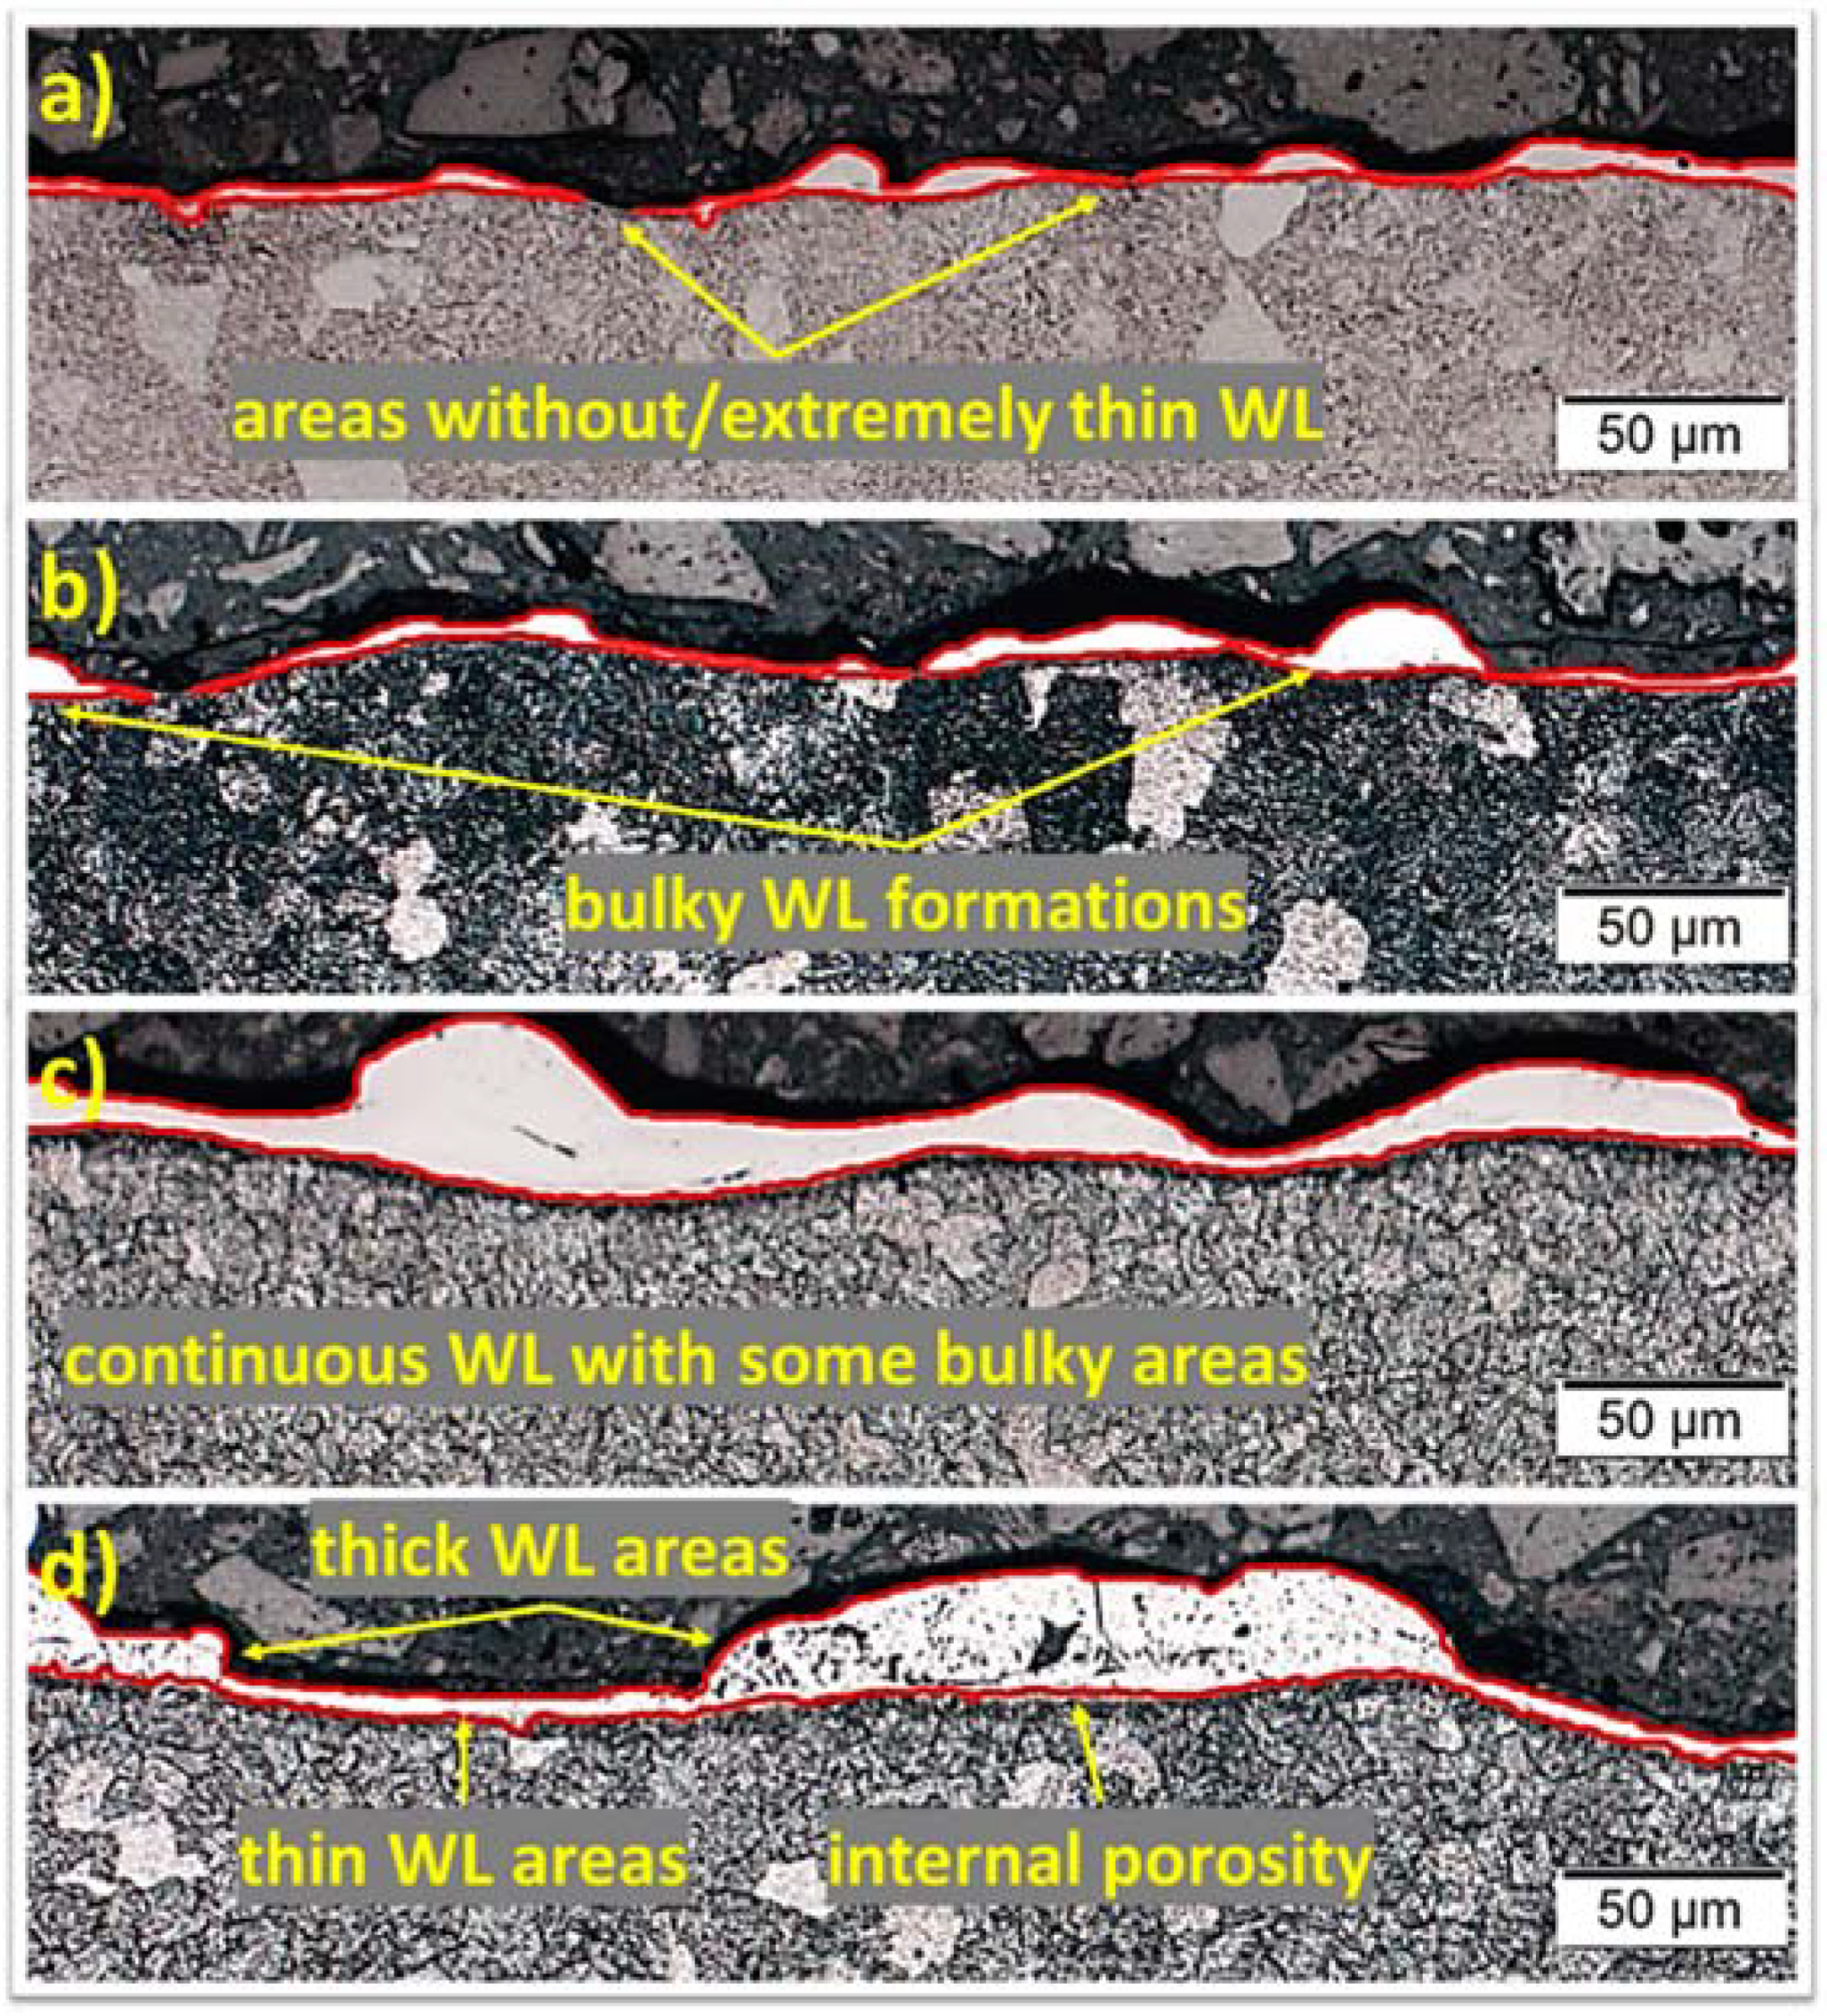
Along with the measuring of the AWLT, a comprehensive study of the machined surface has to include an analysis of the WL morphological characteristics. Thus, in
Figure 9 and
Figure 10 the surfaces’ cross-sections and SEM images of the machined surfaces are depicted, respectively. Since for higher open-circuit voltages, a thin WL is formed and is less sensitive to changes of the machining parameters, it was considered reasonable to focus the investigation and presentation on the lowest Vo, i.e., 80 V, and for different pulse-on current and time combinations. For 5 A and 12.8 μs (
Figure 9a), a very thin and discontinuous WL has been formed, while there are some more bulky spots. For 9 A and 25 μs (
Figure 9b), the WL is still very thin, but now, it is almost continuous, and the bulky spots gradually grow in volume. For higher per-pulse energy, i.e., 13 A and 50 μs (
Figure 9c), a continuous and with higher average thickness WL has been formed. Although some degree of uniformity can still be observed, thinner and bulky areas follow one another. For even higher per-pulse energy, i.e., 17 A and 100 μs (
Figure 9d), the WL has entirely lost its uniformity, and now, it is clearly divided in thin and thick areas. Moreover, in the thicker areas, macro and micro inner porosity, voids, and cracks appear. Obviously, the morphological characteristics of the WL strongly depend on the machining parameters, while the major impact and the close correlation of the WL with the SR is verified.
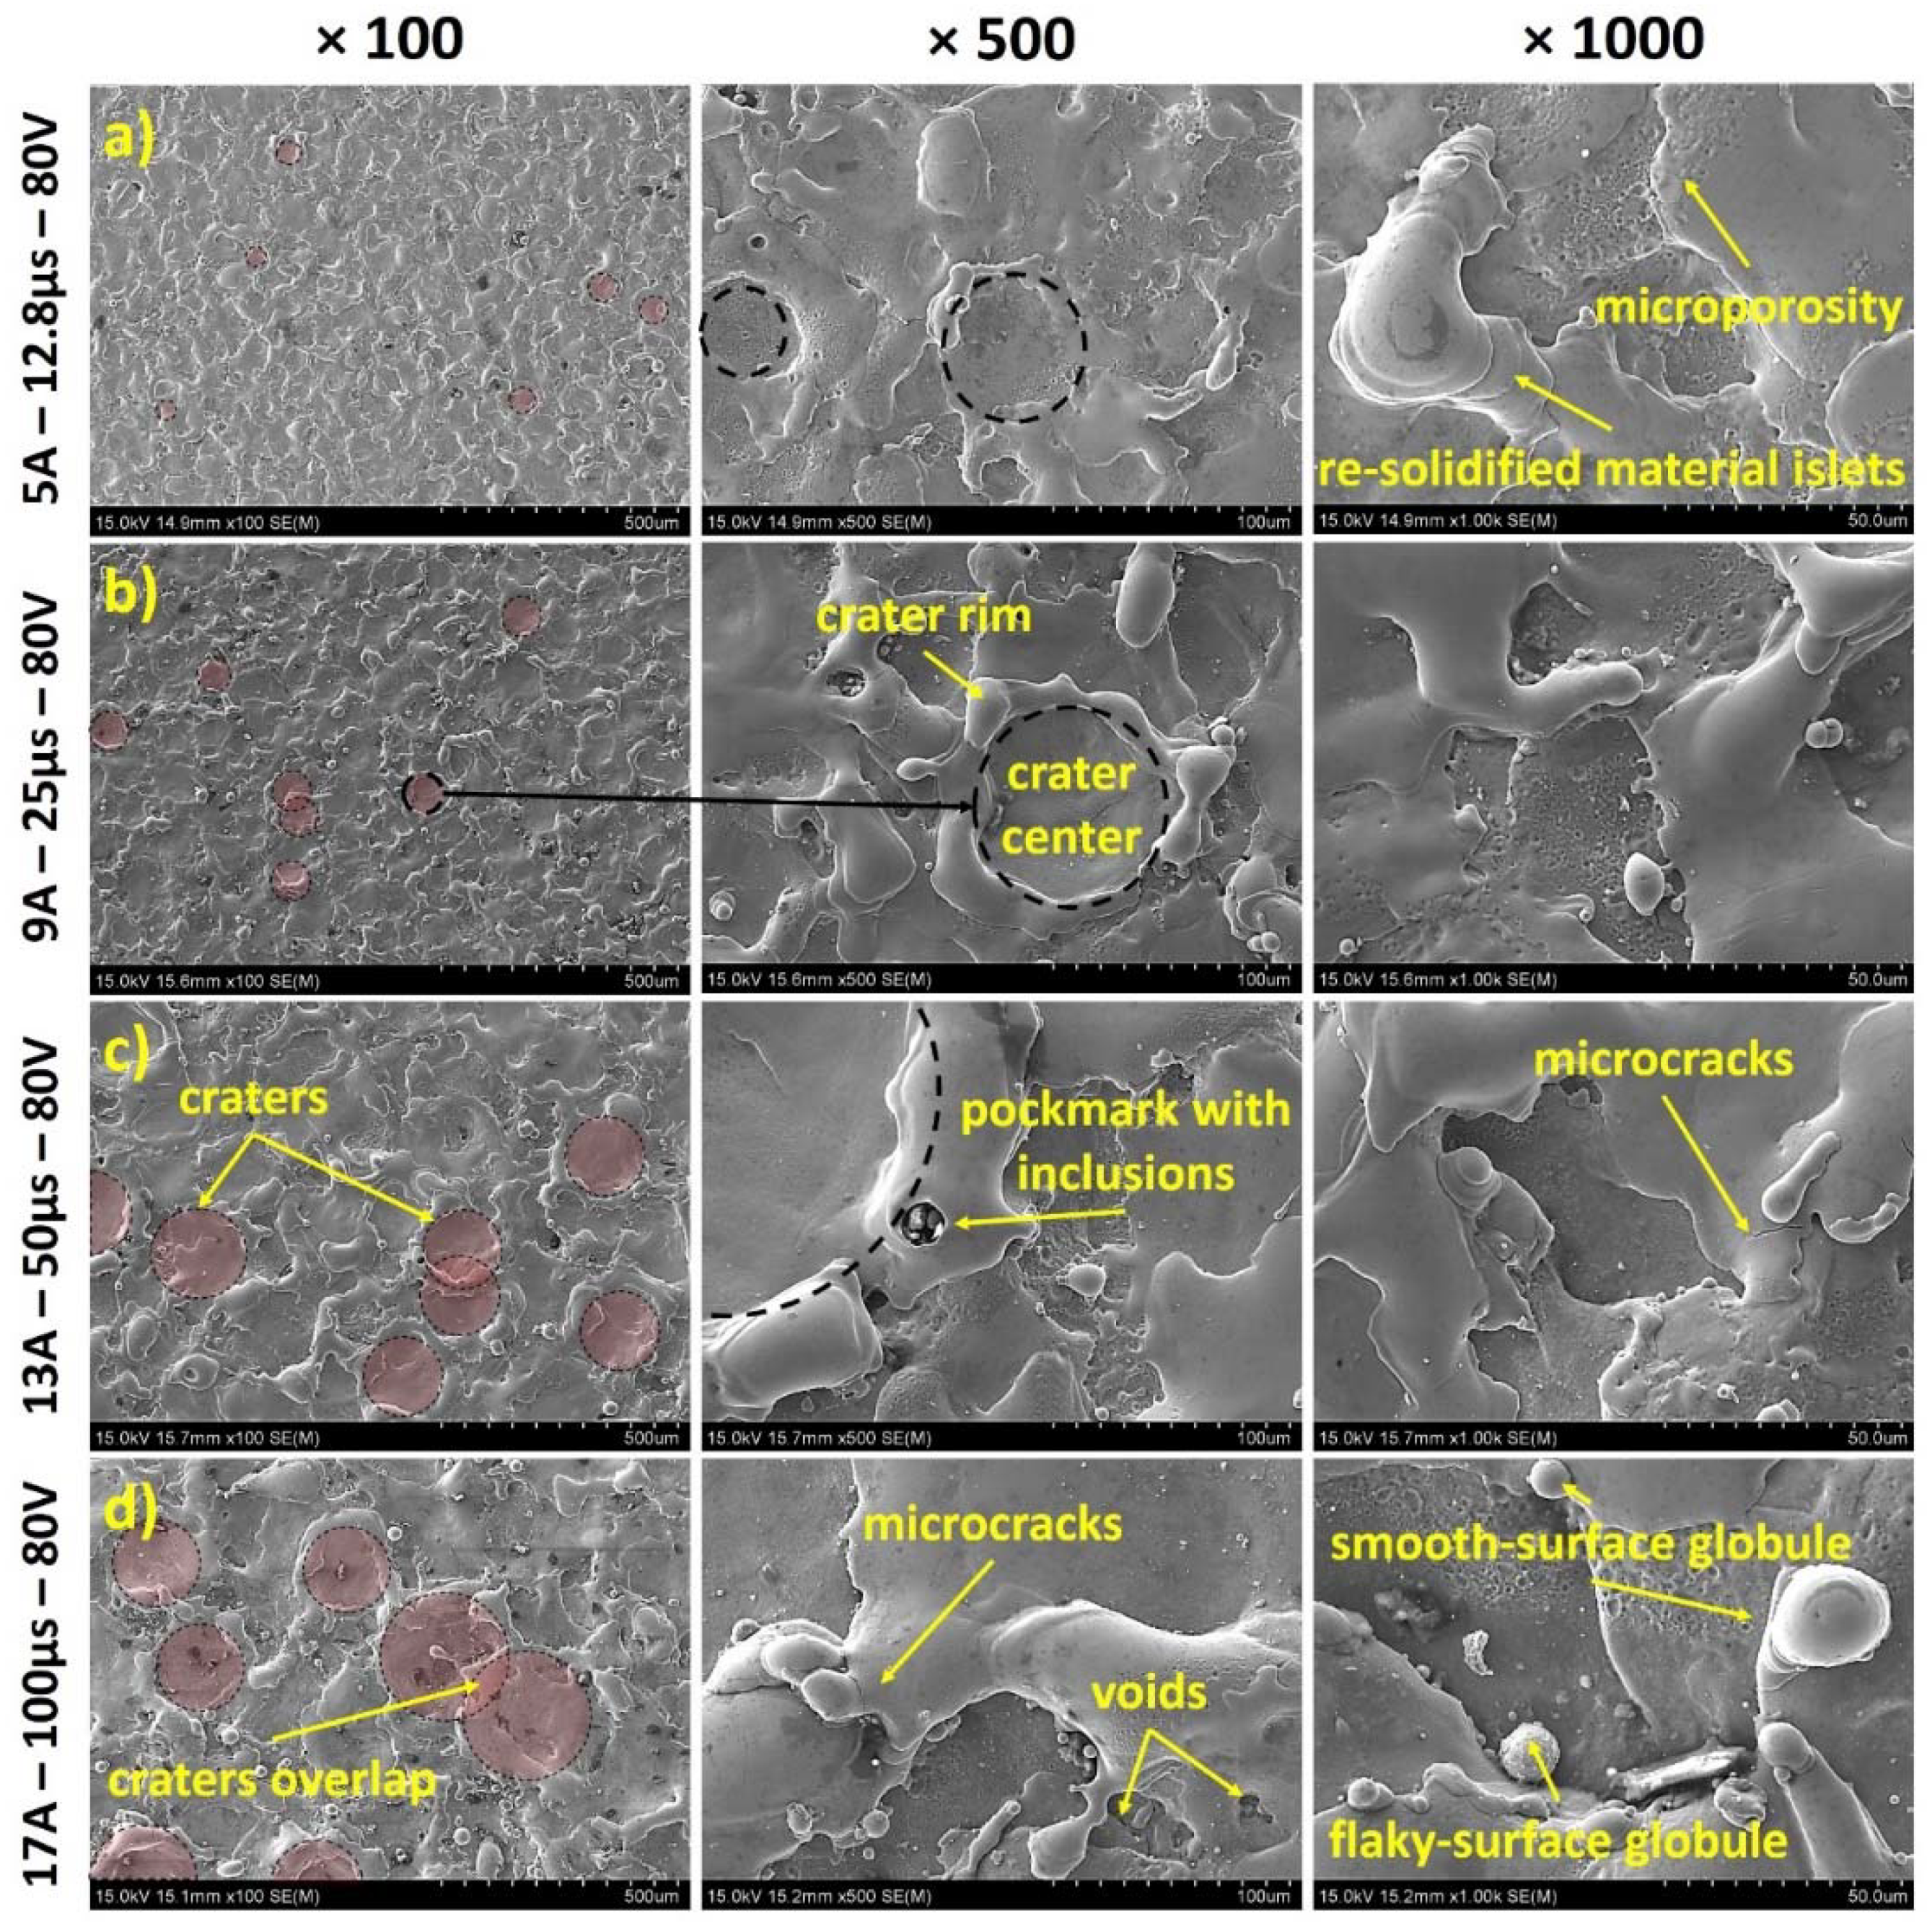
To fully understand the WL formation mechanisms, SEM images of the machined surfaces should be studied in juxtaposition with the respective cross-sections. Thus, in
Figure 10, SEM images of the machined surfaces for the same parameter combinations as those of
Figure 9 are depicted. The surfaces are scattered with craters, which were formed by the sparks and the plasma channels. As the per-pulse energy is increased, craters become larger and, hence, more easily identified, while the final surface morphology is the accumulative result of overlap of the craters. The craters’ formation mechanism is a very interesting topic that has been addressed in the study of Nowicki et al. [
34]. In the craters, two discrete areas can be observed, the crater’s center area and the crater’s rim. The center area is smooth, since the molten material was uniformly ejected due to the high temperature and pressure at the center of the plasma channel [
35]. Part of the molten material that was not efficiently flushed away, forms the crater’s rim, with these elevated crater wall and flanks being the bulky formations that were observed in the surfaces’ cross-sections. For more intense machining parameters, molten material is ejected farther, the crater’s rim becomes voluminous and more irregular, composed by many layers due to the interaction of neighboring craters. Thus, the surface mainly consists of the craters’ smooth central areas and islets of layered re-solidified material, with voids, pockmarks, and inclusions as result of the extremely intense temperature and pressure conditions that take place topically. When the pockmarks become too fine, they appear in the form of microporosity, a characteristic that may affect the surface’s corrosion resistance. On the other hand, the surface is almost free of macrocracks, and only a few microcracks can be observed, a significantly beneficial feature regarding the corrosion resistance. The formation of micro- and macrocracks is a typical characteristic of the EDMed surfaces [
7,
36]; thus, the absence or the very limited formation of such cracks definitely confers a significant property of the current alloy, at least in the current range of machining conditions. Finally, especially for the higher per-pulse energies, globule formations of re-solidified material have been re-attached on the surface. The size and the texture of these globules depend on their formation mechanism. Globules that have been formed due to incomplete evaporation tend to be larger and with smooth surfaces, in contrast with those that emerged from re-condensed vapor material, which are smaller and with flaky surfaces [
37]. Based on the above analysis, the successive thin and thick WL areas of the cross-section can be explained, along with the “formation history” of the surface roughness and texture.
From the conducted micro-hardness measurements, it is deduced that the WL micro-hardness has significantly increased compared to the bulk material. More specifically, the bulk’s material micro-hardness was 200 HV
0.025, while the micro-hardness of the WL ranges from 800 HV
0.025 up to 890 HV
0.025, an increase of over 400%. The deviation of the WL micro-hardness can be attributed to its inherent characteristics, such as inclusions, microporosity, and micro-voids; nevertheless, the increase is notable and undoubted. These results are in line with bibliographic references regarding the micro-hardness of the WL in stainless and work steel [
38,
39]. It is worth mentioning that the increased micro-hardness does not occur due to different chemical compositions but only as the result of the material’s amorphization.
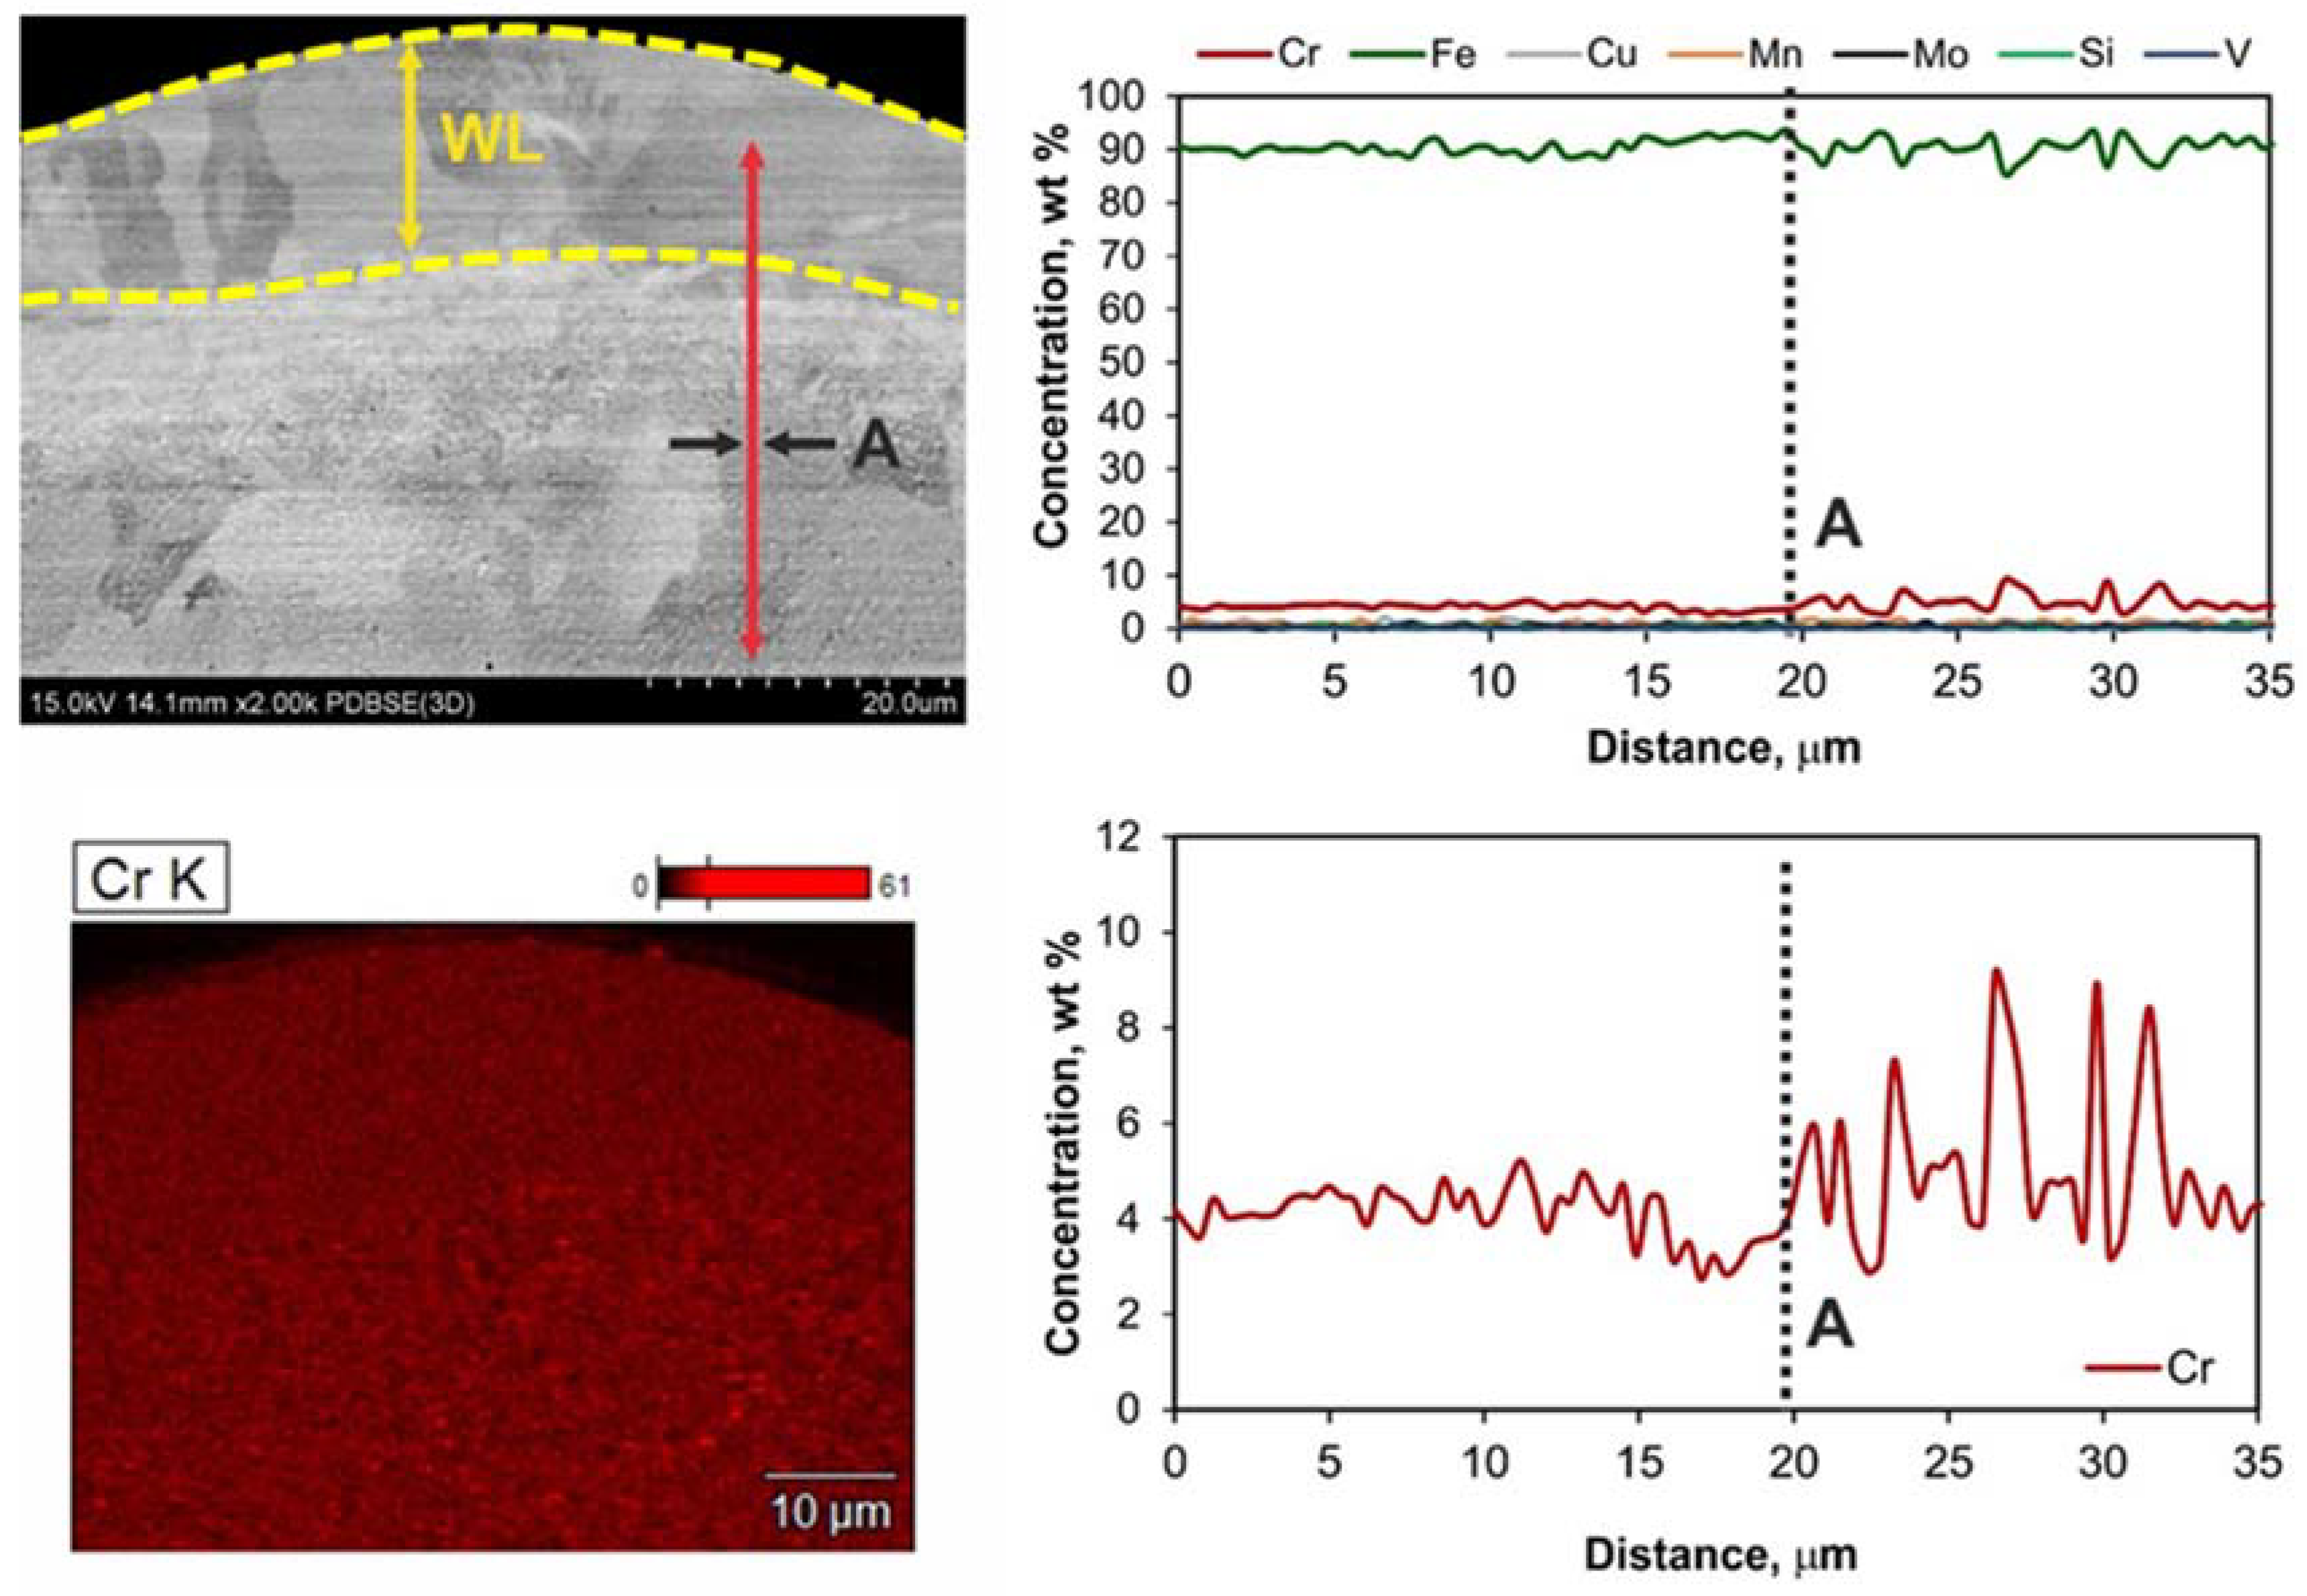
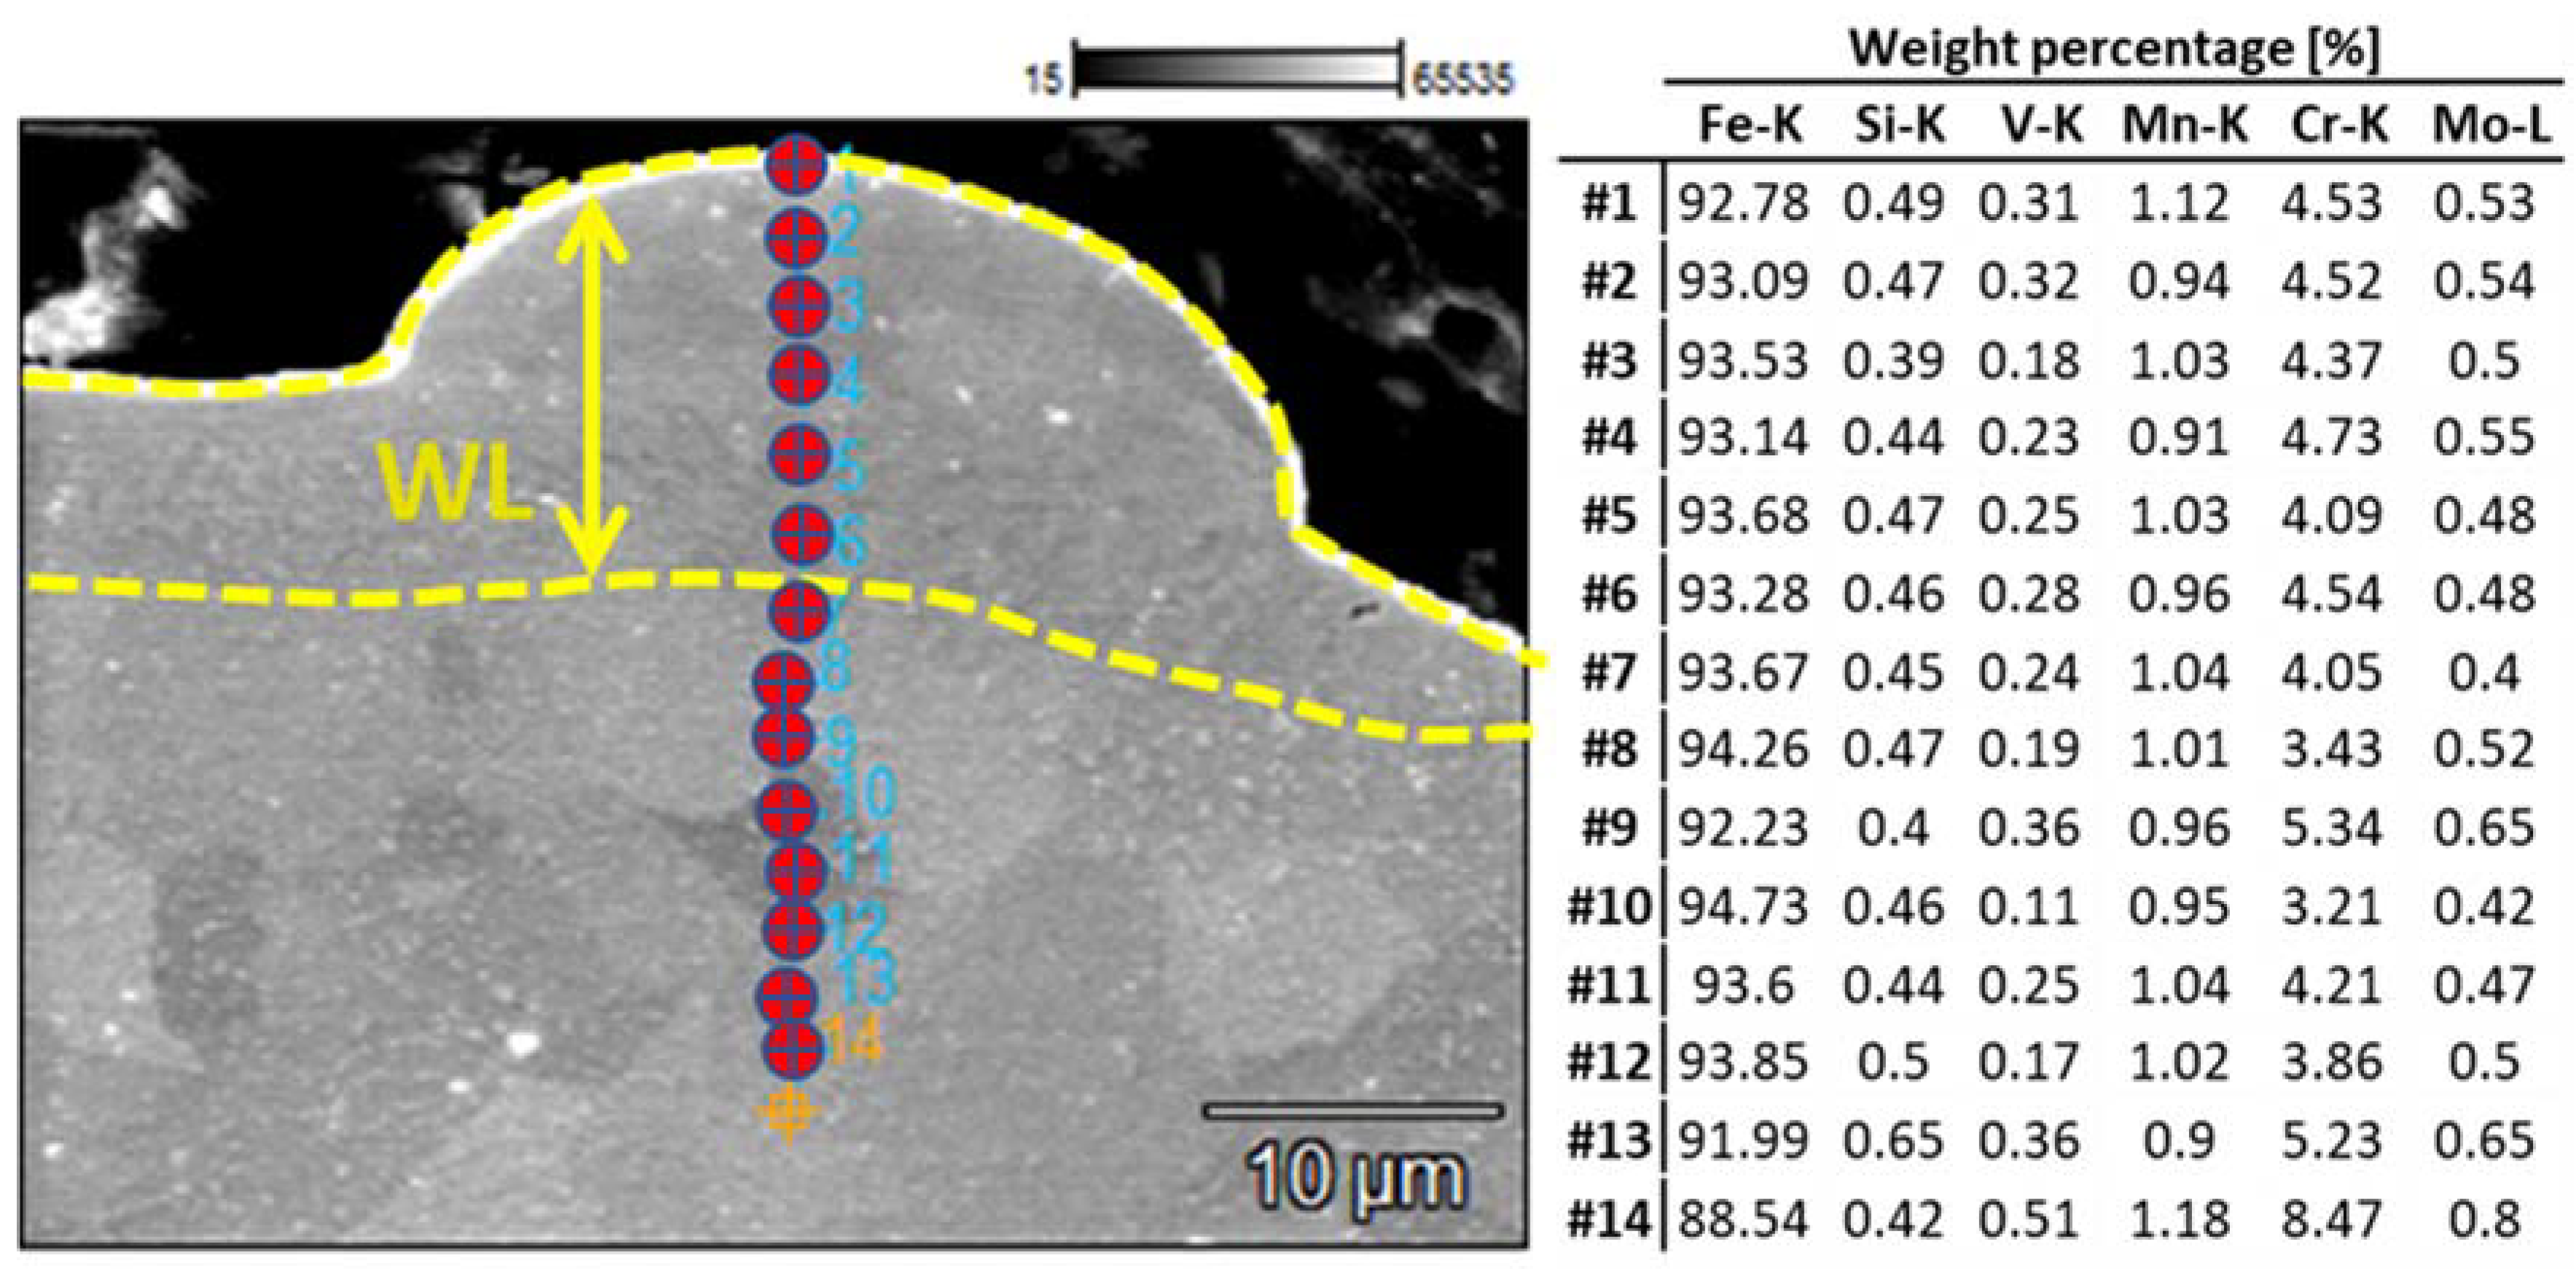
Figure 11 shows the results representative of the chemical composition analysis (Cr concentration map, linear analysis of the concentration of steel elements, and the electrode) for the 17 A, 100 μs, and 80 V. The presented results prove that, as a result of the interaction of the electrode with the steel surface, probably the dissolution of chromium carbides, which dissolve in steel first, took place; therefore, the steel matrix was enriched with chromium. The content of elements included in the tested steel mainly remains unchanged, as it is deduced by the EDX analysis of
Figure 12. This conclusion is in agreement with the study of Ibrahim et al. [
40], where it was deduced that the enhanced hardness value in Fe-based metallic glasses is directly proportional to the amorphous phase content percentage. The increased micro-hardness of the EDMed surfaces has always to be taken into consideration, since it majorly affects the surface’s tribological characteristics, especially if the machined component is part of a mechanism.
3.3. Optimization Based on Grey Relational Analysis
As it has already been mentioned, the optimization of EDM is not straight forward, since, during the machining, competitive physical mechanisms are taking place. Thus, the optimal parameters combination for the highest MRR do not necessarily coincide/agree with that for the lowest TWR or the lowest Ra, and hence, a multi-objective parametric optimization method has to be adopted. In the current approach, GRA has been employed for the estimation of the optimal machining parameters according to two different criteria sets. In the first case, the optimization pertains to the maximum MRR and the lowest TWR, while in the second one, it considers the maximum MRR, the lowest TWR, and the lowest Ra as well. Based on Equations (4) and (5), for the MRR and TWR/Ra, respectively, the grey relational coefficients and the corresponding Grey Relational Grades (GRG) have been calculated (see
Table 5).
Based on the GRG, for both optimization scenarios, the optimal machining parameters combination is 17 A, 50 μs, and 120 V (pulse-on current, pulse-on time, and open-circuit voltage, respectively). At this point, an important remark has to be made; the GRG, when only the MRR and the TWR were considered as optimization indexes, is significantly higher (20%) than the GRG when the Ra was also included as the 3rd objective. Thus, it is clearly deduced that when more optimization objectives are taken into account, it becomes more and more difficult for a general optimal to be accurately defined. At the same time, the optimization process becomes even more vague and uncertain, since alternative combinations with almost the same GRG may arise. For example, the GRG for 5 A, 50 μs, and 160 V is almost equal with the aforementioned optimal GRG: 0.673–0.688, an approximately 2% difference. Hence, in optimization, only the by case absolutely necessary performance indexes should be taken into consideration. When the minimization of the ALWT was included in the RSM analysis, a different machining parameters combination emerged as optimal, i.e., 5 A, 50 μs, and 200 V. Observing the GRC, it is deduced that for this specific combination, the GRCs of the TWR, Ra, and AWLT are significantly high, while the GRC of the MRR is low. Since MRR represents only one of the four optimization indexes, the three other outputs become dominant and a low MRR GRC is overshadowed. A more practical interpretation of the GRA results indicates that when only the MRR and TWR are considered, meaning the major parameters are the productivity and the efficiency of the process, the GRG was dominated by the MRR and was also very high in an unambiguous way. When the Ra was also taken into account along with the MRR and TWR, the GRG decreased and the process moved to a more vague optimization area. Finally, when the AWLT was also included, and now there are two parameters that are related with the SQ (i.e., Ra and AWLT), the GRG increased again and the MRR no longer significantly affected the optimization process.


 ,
, 


